annual report 2009 - 2010
DESCRIPTION
Santa Clara County Assessor's Annual Report 2009 - 2010TRANSCRIPT

To visit us on-line, go to: www.sccassessor.org
Lawrence E. Stone, Assessor$318,443,672,884
2009-2010Annual Report
Office of the County AssessorLawrence E. Stone, Assessor

James Abe Bien Abordo Shalini Agrawal Linda Aguilar Bora Akkaya Gene Almerido Annabelle Alquiza Oscar Amaya Medel AngelRhonda Armstrong Sang Au Tuan Au Anita Badger Fred Baltazar Mai Bang Patty Barber Vanessa Barkin JeffBarlow Denise Barry Cynthia Bartolino Michael Bautista George Beckner David Bethel Neeraj Bhardwaj LannyBlackfield Ray Bramlette Jon Bredeson Gloria Brown Linda Brown Stephen Buckley Victoria Byrd Charmaine CabuagCarol Callahan Carlos Cansino Brenda Cantrell Jackie Cantu Celerina Celeste Jocelyn Champlin Debbie ChavezConrad Chen Roland Child Bordon Chin Jae Choe Michelle Chou Theresa Cisneros Dick Cloyd Pauline Coleman DanCollins Craig Cooper Sean Cooper Carmen Cortes Lisa Cortez Craig Davies Ramon De La Cruz Francisco DiazHuong Dinh Deborah Dini Jim DiTomaso Rosita Dones Sally Wiley Duke Tony Duong Sandra Emerson Barry EngJudy Epstein Fe Escalante Rey Eugenio Mary Fasching Richelle Feldan-Cayol Richard Fisher Geemin Fong Gemma Foster JamesFredrickson Marie Fuentes Lorna Gabon Nora Galvez Madan Ganti Joseph Garcia David Ginsborg Frank Giordano Bruce GlendayFlorlinda Gonzales Manuela Gonzalez Teresa GonzalezJared Gregory Ashok Gupta Salvador Gutierrez Jr GinaHale Murray Hartmann Julius Ho Hollis Holladay PamHopkins Christopher Hughes Jenny Huynh Nora Huynh
Tri Huynh David Kang CurtKendall Leslie Kennedy JoeyKimpo Robert K i n d e r l e h r e rDavid King Melissa KongSue-ee Lai Sue L a m b r e c h tPeter Lan Tuan Le Gilbert Lee
Jack Lee Kristen Leglu Bertha Legorreta KathleenLeGrande Richard Leong Matthew Leslie Annie LeungThida Lim-Santos Eileen Lin David Liu Brian LombardFraser Louie Melody Luong Trinh Luu-Nguyen JohnMaag Robert Madrid Manuel Mandapat Tess ManesisTracy Martinez Bessie Mascardo Eric MatsudaCheryl McCloskey Lynn McLain Karen McPhersonRita Medina George Miller Tiffany Ming ChuckMirrasoul Rose Montenegro Greg Monteverde MattMoore Dayle Murphy Susan Murphy Patricia Murrieta-Santillanez Name Julie Nathan Wayne NguyenRobert Norman Josie Olivarez Brian O'Neill Arika OwensEd Palacio Lydia Paquiz Diane Paskert Imelda PeaSylvia Pedraza Jyoti Pendse Stephanie Perez Xuan PhamPhu Phan Janene Pratt Grace Quilty Tony Rao JohnRecchio Marty Reinders Shannon Rice Carol RivasDelia Rivas Lisa Rodriguez Renee Rodriguez RomeoRodriguez Manuela Rosalez Debra Ross Rebecca RossMohit Sabherwal Elizabeth Samaro Antonio Sanchez
Ford Sandberg Maria SarabiaSelu Sataraka J u a nSchiappacasse Laura ScottAlfredo Semene Naren ShahDavid Shank Marian ShankWinston Shiah Tommy Shing
Helen Silva John Sleeman Mary Solseng David SongKimberly Starrett Marian Stewart Larry Stone StevenSuehiro Marianne Suriaga Christine Swensen Kevin Tanner Cristina Thomas Raphael Thomas Tara Thomas Patrick Tisdale JeanetteTonini Cristina Torio Chuong Tran Heather Tran Khanh Tran Natalie Tran Nicole Tran Maria-Theresa Trinidad Joy Tsai PamelaUmeda Peter van der Pas Susan Vasconcelos Jackie Ventimiglia Benjamin Victorino Susie Vigilante Susie Wang David WierzbaClyde Wong Lisa Wong Andy Wu Richard Xavier Lilia Yalong Darleen Yamaki Roger Yamat Guillermo Young Michelle Zaffa EricZamudio Gumersindo Zavala Li Zhao
Table of ContentsMessage from the Assessor . . . . . . . . . . . . . . . . . . . . . . . . . . . . . . . . .1
Factors Causing Change to the Assessment Roll . . . . . . . . . . . . . . . .3
Largest Taxpayers/How Tax Bills are Calculated & Allocated . . . . . . .5
Assessment Roll . . . . . . . . . . . . . . . . . . . . . . . . . . . . . . . . . . . . . . . .6
Supplemental Assessments . . . . . . . . . . . . . . . . . . . . . . . . . . . . . . . . .8
Assessment Information by City . . . . . . . . . . . . . . . . . . . . . . . . . . . .9
Summary of Bay Area Counties Roll Comparison . . . . . . . . . . . . . .12
Exemptions . . . . . . . . . . . . . . . . . . . . . . . . . . . . . . . . . . . . . . . . . . .13
Temporary Declines in Value (Proposition 8) . . . . . . . . . . . . . . . . .14
Proposition 13 . . . . . . . . . . . . . . . . . . . . . . . . . . . . . . . . . . . . . . . .16
Department Overview . . . . . . . . . . . . . . . . . . . . . . . . . . . . . . . . . . .18
Assessment Information by Property Type . . . . . . . . . . . . . . . . . . . .20
Change in Ownership/New Construction by City/Property Type . .22
Major New Construction/Changes in Ownership . . . . . . . . . . . . . .23
Assessed Value by City/School District/Property Type . . . . . . . . . . .24
Assessment Appeals . . . . . . . . . . . . . . . . . . . . . . . . . . . . . . . . . . . . .28
Performance Counts . . . . . . . . . . . . . . . . . . . . . . . . . . . . . . . . . . . .30
Frequently Asked Questions/Directions to Office . . . . . . . . . . . . . . 32
Explanation of Terms . . . . . . . . . . . . . . . . . . . . . . . . . . . . . . . . . . . .33
Above are all the permanent employees that contributed to the closing of the 2009-2010 Assessment Roll. The pictured employeesare, clockwise, Julie Nathan, John Sleeman, Teresa Gonzales, Andy Wu, and Kevin Tanner.

www.sccassessor.org 1
Current Year Roll Growth*(Exclusive of Public Utility Valuations. Values in Billions.)
2009-2010 Valuation Changes
Assessment Roll Value Change: 2009-2010 2008-2009 Dollar Change % Change
Local roll before exemptions $318.44 $316.51 1.93 0.61%Less: Nonreimbursable exemptions (14.59) (13.20) 1.39 10.50%NET LOCAL ROLL VALUE $303.86 $303.31 0.54 0.18%Note: Minor discrepancies may occur due to rounding calculations. Percentages based on non-rounded values.
Message from the AssessorLawrence E. Stone
he plummeting residential real estate market and the severe creditcrisis has presented a serious challenge to Silicon Valley’s economyand property values. Santa Clara County’s 2009 assessment rollprovides a clear, historical record of the consequences of thisdramatic decline in property values. The total net assessed value ofall real and business property grew by a meager $542 million, anincrease of only 0.18 percent over the prior year.This is the smallestincrease since Proposition 13 became law in 1978. To put this inperspective, in 2007 the assessment roll grew by nearly $20 billion,and in 2001, the apex of the dot-com boom, the assessment rollgrew $27 billion. Nevertheless, the Santa Clara County real estateperformed significantly better than more than half the counties inCalifornia. Of the 15 most populous counties, 12 reported“negative” assessment roll growth.
Those cities in Santa Clara County that previously experienced thegreatest gains fueled by the five-year housing boom, endured thesteepest declines. Local communities composed of “high-end”housing and/or a solid commercial/industrial property base, wereimpacted only marginally.
The Assessor’s 2009 Annual Report provides one view of the realestate economy of the nation’s thirteenth most populous county. Itcontains narratives, detailed statistics and summary charts andtables of the 2009 assessment roll for Santa Clara County as of theJanuary 1, 2009, lien (valuation) date. The report is a populardocument for finance officials, corporate, government andcommunity leaders.
The annual assessment roll, delivered by the July 1 deadline to theCounty Finance Agency Director, is a valuable resource forbudgeting and financial planning by local governmental agencies.Information in the annual report includes all locally assessedproperty, both secured and unsecured. The statistical data alsodistinguishes between business personal property and real property.It summarizes current property assessments including exemptions,that are reimbursed by the State. Declines in value (Proposition 8)are reported for the first time not only by city and unincorporatedarea, but also by property type. Detailed value information is alsoprovided by property type, city and school district.
General information regardingassessment appeal trends andAssessor’s performance indicatorsand outcomes are also included.Assessments of public utilities are theresponsibility of the California State Board of Equalization (BOE),and therefore, not included in the Annual Report.
Role of the County Assessor’s OfficeThe Assessor’s Office is responsible for annually determining theassessed value of all real and business personal property in SantaClara County. Each year, my professional staff renders accurateassessments of all secured and unsecured property. The assessmentroll,which includes 520,073 assessable roll units of real andbusinessproperty, is the basis uponwhich property taxes are levied. Propertytaxes, in turn, provide an essential source of revenue to support basicpublic services provided by schools and local governments. Thesepublic institutions form the foundation of our region’s qualityof life.
Factors in Assessment GrowthAssessment roll growth is a result of severalmajor components. Realproperty is assessed at fairmarket valuewhen a change in ownershipor new construction occurs. The newly established value is referredto as the “base year value.” The change in assessed value ofindividual properties reflects the difference between the priorassessed value and the newmarket value resulting from the changein ownership or new construction. Reappraisal as a result of newconstruction, includes only the market value added by the newconstruction. Proposition 13 limits the increase in assessed value tonomore than 2 percent annually, or the California CPI, whicheveris lower. The indexed value of the property is referred to as the“factored base year value.” Consequently, in the aggregate, theassessed values are significantly lower than the total market value ofproperty in Santa Clara County.
Assessment GrowthThe total assessed value of all assessable property, net of non-reimbursable institutional exemptions (e.g., qualifying church andwelfare organizations), was $303.9 billion.The negligible growth inassessed values is especially remarkable considering that Proposition
T
2 www.sccassessor.org
13provides an automatic, twopercent increase in the assessed valuefor all real property that did not change ownership or completenew construction during the prior calendar year.
For the first time in more than a decade both the commercial andresidential sectors experienced declines, but not at the same rate.Comparing 2009 to 2008, both the number of residentialproperties and the average value of assessment reductions perproperty more than doubled to 90,214 homes. The averagereduction in assessed value was $170,000 per residential property.Over the same period, the number of commercial and industrialproperties receiving assessment relief increased from538 to 622, anaverage of $3.6 million per property. This trend is especiallypronounced in the condominium sector and less expensiveresidential property. More than one in three condominiums forexample, are assessed below their purchase price.The only variationfrom this trend is high-end, residential properties, which havegenerally retained their value.
Typically in down markets, purchase/sale transactions decline.Homeowners who are not forced to sell, usually remove theirproperty from the market until the market recovers. Not only areproperty owners currently selling at distressed prices, foreclosures inSilicon Valley increased four-fold to 6,200. Many of theseproperties were purchased by first time homeowners. Thecombination of rapidly declining property values and increaseddistressed sales, has severely impacted property tax revenues whichsupport government agencies including public schools.
In normal years, substantial growth in the assessment roll is derivedfromnew construction, or changes in ownership at purchase pricesmuch higher than existing assessments. This year, homeforeclosures or distressed sales have created a situation where thenew purchase price is often lower than the previously establishedassessment, resulting in negative rather than positive increases tothe assessment roll. In 2009, the number of changes in ownershipincreased 5.6 percent, yet the average value added to the assessmentroll decreased by 57 percent. In total, assessment roll growthattributed to changes in ownership declined by 55 percent.Overall, the number of foreclosure and distress sale transactions,resulting in a lower assessed value, increased by 300 percent overthe prior year.
While the commercial and industrial market was not nearly asvolatile, it is likely that the full impact of “Great Recession” will bereflected next year. A significant increase of major retailbankruptcies including Circuit City, Mervyns, etc., will have asustained impact on property assessments. Many Silicon Valleytenants of major office commercial and retail space were hit hardby the global financial “meltdown” causing significant pressure onrents and absorption of leased space.
The other major contributor to assessment roll growth is theunsecured assessment roll comprised primarily of businessproperty, includingmachinery, equipment computers and fixtures.This sector, so vital to Silicon Valley, recorded growth of 3.17percent, or $22.22 billion. While this was one-third of the levelrecorded last year, the fact that it increased at all is encouraging.The assessed value of business personal property is calculated fromproperty statements filed annually by nearly 51,000 businesses in
Santa Clara County. Businesses are required to disclose the cost oftheir assets which determines the assessment.
Geographic DisparitiesWhile theCounty’s rate of assessment roll growthwas virtually flat,there were significant geographic differences ranging from highs of6.22 percent inMountainView and 4.75 percent in Sunnyvale, tolows of -9.48 percent in Gilroy and -4.73 percent in theunincorporated portions of the County. The communities withthe most newly constructed, entry-level housing suffered thegreatest decline, just as they previously experienced the sharpestincreases prior to the recession. In contrast, older more establishedcommunities like Palo Alto, Los Altos, Cupertino, Saratoga andLosGatos reported proportionately fewer properties in decline. Ofthe 34 school districts, seven recorded negative roll “growth”primarily inMorgan Hill, Gilroy and East San Jose.
In contrast, the County’s redevelopment agencies (RDA)composed primarily of commercial and office properties,performed substantially better, recording a 4.29 percent in assessedvalues. New office construction and the sale of major commercialproperty portfolios, accounted for much of the increase. Eight oftheninemunicipal redevelopment agencies (Campbell,Cupertino,Los Gatos, Milpitas, Mountain View, San Jose, Santa Clara andSunnyvale), recorded impressive growth. Only Morgan Hill’sRDA declined.
Assessment roll growth is also important to “basic aid” schooldistricts.Abasic aid school district is a district inwhich thepropertytax revenue generated locally exceeds the state’s formula for schoolfunding. Consequently, basic aid school districts have more fundsat their disposal because of direct access to local property taxrevenue. However, the revenue these school districts receive canfluctuate according to changes in the assessed value of propertylocated within the tax rate area of each school district.
The 14 basic aid school districts in Santa Clara County and theirrespective roll growth are: Campbell Union Elementary (0.07%);Campbell Union High School District (0.48%); Fremont UnionHigh School District (3.76%); Lakeside Joint Elementary SchoolDistrict (0.40%); Loma Prieta Joint Union Elementary (3.13%);Los Altos Elementary (4.04%); Los Gatos Elementary SchoolDistrict (3.17%); Los Gatos-Saratoga High School District(2.49%); Montebello School District (11.15%); Mountain ViewWhisman School District (8.31%); Mountain View-Los AltosHigh School District (6.18%); Palo Alto Unified School District(3.68%); Santa Clara Unified School District (-0.06%); SaratogaElementary School District (1.81%); and Sunnyvale ElementarySchoolDistrict (4.88%). FourteenofCalifornia’s over 100basic aidschool districts are located in Santa Clara County.
Challenges and AccomplishmentsThe assessment roll closed on July 1, was the most difficult in my15 years as County Assessor. During the past three years, my officestaff declined by 49 positions. In total, my office has two percentfewer employees today than in 1995 when I took office, yet thevalue of the assessment roll has increased 163 percent.
This year, we faced two major challenges affecting ourperformance. First, due to staff reductions, the assessment year

www.sccassessor.org 3
began with a backlog of 4,271 un-worked property assessments,composed primarily of property transfers and new construction.Each year that we carry backlogs, it becomes increasingly difficultto complete current assessment activities, thus contributing to aneven greater backlog the following year. Fortunately, ActingCounty Executive Gary Graves, and the Board of Supervisorsrecognized the effect that our staffing crisis was having on propertyassessments and taxes, and added two unclassified senior appraisersto the professional staff. We were able to completely eliminate theprior year’s backlog, and generate $11.5 million in revenue ofwhich $2 million to Santa Clara County. The second majorchallenge was the dramatic decline in property values, and theunexpected increase in the number of changes in ownership.
In addition, the Assessor’s 30-year-old legacy information system isshowing signs of collapse. The manufacturer has terminatedsupport for the system, and the senior information system staffmembers most familiar with the legacy system have retired.Increasingly, system failures are interrupting productivity.Unfortunately, there are no “turn key” California compliantproperty tax systems. Efforts by other major counties to acquire amodern, functional system have failed. I have been engaged innegotiations with a vendor to design and build a multi-milliondollar, comprehensive replacement of our antiquated legacysystem.
Despite the budget challenges and the demanding economicenvironment, I ammore optimistic than ever about our long-termability to provide the highest quality service and level ofproductivity. Perhaps oneof the best indicators of our performancecan be found in the results of the comprehensive audit and samplesurvey completed by the BOE. Performed every five years, theaudit independently appraises and audits individual assessments toverify the accuracy of the assessment roll. This comprehensiveaudit was conducted over a six-month period by a team of theBOE’s most experienced assessment professionals. The report’sexecutive summary states in part: “Overall, the majority of theassessor's programs for the assessment of real property are efficientand productive….Thewelfare exemption program iswell run, andthe assessor handles many other programs effectively, includingbudget and staffing, assessment roll changes, and assessmentappeals…the assessor has effective programs for the audit of
business personal property.” The audit and survey concluded thatthe Santa Clara County Assessor’s Office not only met the 95percent compliance ratio, but achieved a ratio of 99.81 percent.Productivity, accountability and performance will continue to bethe hallmark of my office. The following are a few of our majoraccomplishments over the past year:• Completed the annual assessment roll by the deadlinemandated by state law.
• Returned $11,595 of the Assessor’s budget to the countygeneral fund.
• Met the department’s salary reduction target of $598,560.• Completed 98.0 percent of real property assessments.• Completed 99.99 percent of business personal propertyassessments.
• Completed 100 percent of eligible exemptions.• Audited 99.8 percent of the 1,023 businesses mandated by theCalifornia Revenue andTaxation Code.
• Processed 100 percent of recorded deeds.• Assisted more than 67,000 taxpayers who contacted the office,and over 18,000 taxpayers visiting our public service counter.
• Processed 75,315 title documents.• Reduced the assessed values of 90,836 properties as mandatedby law (Proposition 8).
• Successfully defended assessed values at the assessment appealsboard, retaining 97 percent of the value at risk, a two percentincrease over the 2007-08.
• Completed 99.9 percent of all properties identified for reducedassessment review.
• Electronically imaged 219,000 documents consistent with ourcommitment to a paperless work environment.
• Enhanced the integration of customer web interactions withmore transactions performed on-line or processed electronicallyeliminating paper processing and keying errors.
• Processed 25,435 requests for temporary reductions in value, a183 percent increase over the prior year. 61,020 taxpayersdownloaded the simple PowerPoint tutorial explaining thequalification basis for a reduction in assessed value.
• Increased field inspections by the exemption staff resulting inthe discovery of properties, not eligible for a property taxexemption.Total assessed value discovered was $164 million.
• Expanded the effort to identify and notify homeowners eligibleto receive a homeowners’ exemption, but failed to apply for the
Dollar % ofChange Change
Temporary declines in value+ -$12.31 89.9%Exemptions -1.39 10.1%Subtotal, declines in values -$13.69 100.0%
Dollar % ofChange Change
Change in ownership** $5.45 38.3%CPI inflation factor (2%) 4.91 34.5%New construction** 2.65 18.6%Business Personal Property 0.65 4.5%Corrections/Board/Other 0.58 4.1%Subtotal, increases in value $14.23 100.0%
Factors Causing Change to the 2009-2010 Assessment Roll(in billions)
Grand Total of Changes to Assessment Roll $0.54** Net of 2% annual increase+ Reflects those properties that did not establish a new base year value.Note: A limited portion of new construction is reflected in the change in ownership figures.

4 www.sccassessor.org
benefit. 613 additional homeowners now receive the $7,000homeowner exemption benefit.
• Intensified cross training throughout the organization to assistoperations during periods of heavy workload.
• Increased by 18.2 percent to over 12,000, the number of smallbusinesses that electronically file their business propertystatements on-line.
• Processed 100percent of all property statements using paperlessprocessing, reducing both filing and retrieval time.
• Provided a summary of extended values to companies whotimely file their business property statements.This data enableseach company to project their property tax liability.
• Created an electronic process for handling 7,172 leasedequipment assessments (copiers, computers and various otheritems of business property).
• Reduced by 53.2 percent the number of new businesses thatfailed to timely file business property statements.
• Continued our on-going commitment to a first class workenvironment by upgrading desktop computers, software,laptops, servers, and printers.
• Successfully completed the first phase of new processmanagement software, thebackboneof thenewcomprehensivecomputer system currently under development.
• Completed 3,658 hours of professional training, includingfacilitating 2,657 hours of State Board of Equalization (SBE)training classes.
• Increased discovery of unrecorded changes of ownership bylegal entities and identified corporate changes in ownershipincluding mergers and acquisitions that had escapedreassessment.
• Implemented new procedures and technology for updatingmailing addresses utilizing the Postal Service’s National Changeof Address program, resulting in a 50 percent decrease in thenumber of assessment notification cards returned asundeliverable.
• Acquired modern servers, storage, and network equipment toimprove efficiency, achieving an 81 percent energy savings.
• Upgraded security and anti-virus protection on all systems.• Progressed in converting critical assessment data operating onthe antiquated mainframe to a modern relationship database.
• Completed a highly specialized, advanced training course forauditors on the topic of calculating the “economic life” ofequipment.
• Oneof three counties selectedby theBoardofEqualization andthe California Assessors’ Association to participate in the studyof the “economic life” of equipment and fixtures used in thesemiconductor industry.
• Continued to provide leadership together with the CaliforniaAssessors’ Association on critical State legislation and Board ofEqualization rules and regulations.
• Sponsored legislation to require online filing of propertystatements for large businesses and led effort to oppose changesto Proposition 13 that would result in a “split roll.”
• Personally addressed over 50 business and civic groupsinforming them of how the property tax system works.
• Updated the fees for copies and other routine services.• Created and implemented the Continuity of Operations Planin the event of a disaster.
• Launched the Assessor’s Office Disaster Service Workerprogram and training for all staff. State law requires all county
employees to serve as disaster service workers in the event of amajor disaster.
• Maintained the Assessor’s Green Business Certification.• Sponsored the 12th annual off-site, team building exercise forthe entire staff.
• The on-line property “look-up” feature on the Assessor’s website (www.sccassessor.org) remains popular. The tool allowsproperty owners to access property assessment data any time ofthe day or night from a convenient location. In addition, otheron-line tools have attracted significant internet traffic. In 2008,the Assessor’s website and property look up tool received astunning 3.9 million hits, a 79 percent increase over the prioryear, and remains the County’s third most-visited web site.
Trends and Future GoalsThe Assessor’s Office continues to focus on developing andimplementing creative and innovative solutions to improveefficiency and productivity while reducing costs. Some of themajor challenges/opportunities ahead include:• Implementation of virtual desktops which will not only reduceenergy use by at least 50 percent, but will also require fewertechnicians to maintain as well as provide greater reliability,security and more frequent updating of user applications.
• Continue efforts to complete a multi-million dollarreplacement of the 25-year-old legacy computer system with amodern, “state of the art” system that will efficiently meet bothimmediate and long-term needs.
• Budget entirely by service levels.• Achieve measurable, annual increases in office productivity.• Identify and implement additional on-line assessment services.• Manage increasing workload with decreasing staff.
California’s seemingly endless budget crisis creates serious financialchallenges for local government. Despite these challenges, theAssessor’s Office will continue to focus on the quality, rather thanthe quantity of work. Rushing the valuation process not onlyjeopardizes the accuracy of property assessments, it ultimatelyresults in a greater expenditure of time and resources in processingcorrections. As County Assessor, I remain committed to the fullimplementation of a performance budgeting and managementsystem that ties mission and goals directly to the budget; identifies,acknowledges and rewards superior performances; and focusesresources on continuous improvement initiatives based on quality,service, innovation and accountability.
The Assessor’s Office employs a group of people that I believe areamong the most talented and dedicated anywhere in government.It is our primary objective to treat all property owners and taxpayerswith the highest degree of courtesy and professionalism. For nearly15 years, it has been my honor to serve the taxpayers, propertyowners and public agencies in Santa Clara County. It is myprivilege to continue rendering fair and accurate valuations andproviding the highest level of public service.
Lawrence E. StoneAssessor
www.sccassessor.org 5
After the County Assessor determines theassessed value of all assessable property inSanta Clara County, the County FinanceAgency calculates and issues tax bills for eachproperty. Under Proposition 13, the maxi-mum property tax rate is one percent of theproperty’s net taxable value. In addition, thebill will include an amount necessary to makethe annual payment on general obligationbonds or other bonded indebtedness imposedby public agencies and approved by the voters.
The property tax revenue collected by theCounty Tax Collector supports schools includ-ing local elementary, high school and commu-nity college districts and local government
agencies including cities, redevelopment agen-cies, the County, and special districts. Thebasic one percent tax rate is divided among thepublic taxing agencies in Santa Clara County.
The accurate, consistent and fair valuation ofproperty by the Assessor’s Office every yearcreates the foundation that supports the deliv-ery of essential public services provided bylocal governments. The County Assessor’sOffice does not calculate taxes, collect taxes orallocate tax revenues. For information regard-ing the collection and allocation of propertytaxes, please contact the Tax Collector at(408) 808-7900 or the Controller at(408) 299-5200.
How Tax Bills Are Calculated
Santa Clara County Property Tax Revenue Allocation 2008-2009*
The County Assessor’s Officedoes not calculate taxes, collect taxes
or allocate tax revenues.
K-12Public
Schools48%
County
16%
Cities12%
Redevelopment
Agencies10%
Community
Colleges8%
Special
Districts6%
*Data provided by the Santa Clara County Controller’s Office

6 www.sccassessor.org
2009/2010 2008/2009 Difference ChangeLand $139,573,779,000 $139,348,057,034 $225,721,966 0.16%Improvements (Real Property) $147,649,589,317 $146,593,536,189 $1,056,053,128 0.72Improvements (Business Div) $1,531,685,096 $1,244,681,984 $287,003,112 23.06Subtotal $288,755,053,413 $287,186,275,207 $1,568,778,206 0.55%
Personal Property $4,498,066,729 $4,662,647,598 ($164,580,869) -3.53%Mobilehomes $605,878,441 $612,757,510 ($6,879,069) -1.12Subtotal $5,103,945,170 $5,275,405,108 ($171,459,938) -3.25%
TOTAL Gross Secured $293,858,998,583 $292,461,680,315 $1,397,318,268 0.48%Less: Other Exemptions (sec) ($12,227,248,771) ($10,689,440,963) ($1,537,807,808) 14.39
NET SECURED $281,631,749,812 $281,772,239,352 ($140,489,540) -0.05%
TOTAL Gross Unsecured $24,584,674,301 $24,054,233,943 $530,440,358 2.21%Less: Other Exemptions ($2,360,202,792) ($2,512,242,367) $152,039,575 -6.05
(unsec)NET UNSECURED $22,224,471,509 $21,541,991,576 $682,479,933 3.17%TOTAL Local Roll $303,856,221,321 $303,314,230,928 $541,990,393 0.18%
Homeowners' Exemption $2,007,996,606 $2,005,180,794 $2,815,812 0.14%
Assessment Roll Summary2009-2010 Assessment Roll Compared to 2008-2009 (Exclusive of Public Utility Valuations)
The assessment roll is divided into the securedroll (property subject to a lien) and the unse-cured roll (property on which property taxes arenot a lien against the real estate where the prop-erty is situated, including improvements locatedon leased land).
Exemption values include homeowner exemp-tions (reimbursed by the state) and other exemp-tions for non-profit organizations, includingchurches, charitable institutions, colleges, hospi-tals and private schools (not State reimbursed).
Improvements (the value of buildings or struc-tures situated on land) reflect values assessed byboth the Real Property and Business Divisions.
Since the passage of Proposition 13 in 1978,Santa Clara County’s annual roll growth hasranged from more than 17 percent to 0.18 per-
cent. The local economy has a significant impacton property transfer transactions and buildingpermit activity.
This year, changes in property ownershipaccounted for 38 percent of the total increase inassessed value, the lowest on record and a sub-stantial reduction over last year’s assessment roll.Of the 27,692 Changes in Ownership, 45 per-cent resulted in a lower assessed value than theprior year. Last year it was only 11 percent.Under Proposition 13, once a base value is estab-lished as a result of a change in ownership or newconstruction, the assessed value of a property canincrease by no more than 2 percent annually orthe California Consumer Price Index (CPI),whichever is lower. Since the implementation ofProposition 13 in 1978, the CPI has been lessthan 2 percent five times: in 1983, 1995, 1996,1999 and 2004.
The Assessment Roll

www.sccassessor.org 7
Ten-Year Assessment Roll Summary$300,000,000,000$280,000,000,000$260,000,000,000$240,000,000,000$220,000,000,000$200,000,000,000$180,000,000,000$160,000,000,000$140,000,000,000
Percentage Change Including Inflation Factor
Ten-Year Assessment Roll SummarySanta Clara County History Summary
16.00%14.00%12.00%10.00%8.00%6.00%4.00%2.00%0.00%
PercentRollChange
InflationFactor
2000 2001 2002 2003 2004 2005 2006 2007 2008 2009
2000 2001 2002 2003 2004 2005 2006 2007 2008 2009
(Exclusive of public utility valuation, and nonreimbursable exemptions)
Year Net Local Roll Change in Value Percent Change Inflation Factor*2009-10 $303,856,221,321 $541,990,393 0.18% 2.00%2008-09 $303,314,230,928 $19,801,311,453 6.98% 2.00%2007-08 $283,512,919,475 $21,597,627,615 8.25% 2.00%2006-07 $261,915,291,860 $21,773,313,717 9.07% 2.00%2005-06 $240,141,978,143 $17,765,933,316 7.99% 2.00%2004-05 $222,376,044,827 $4,856,902,557 2.23% 1.87%2003-04 $217,519,142,270 $6,670,743,127 3.16% 2.00%2002-03 $210,848,399,143 $11,022,579,515 5.52% 2.00%2001-02 $199,825,819,628 $26,908,458,506 15.56% 2.00%2000-01 $172,917,361,122 $15,347,394,561 9.74% 2.00%* Proposition 13 limits the inflation factor for property values to 2% per year or the California Consumer Price Index, whichever is lower.

8 www.sccassessor.org
Supplemental assessments are admittedly complicat-ed and confusing! Created by Senate Bill 813 in1983, supplemental assessments closed what wereperceived as loopholes and inequities in Proposition13. It also created substantial amount of new rev-enue for state and local govern-ment.
Supplemental assessments aredesigned to identify changes inassessed value, either increases ordecreases, that occur during thefiscal year. They are in addition(supplemental) to the traditionalannual assessment and propertytax bill.
Prior to the creation of supplemental assessments,changes in assessed value due to a change in owner-ship or completion of new construction would notresult in higher taxes until the tax year (July 1 to June30), following the lien date when the new values wereplaced on the assessment roll. In some instances,taxes on the new assessments would not be collectedfor up to 21 months. This resulted inserious differences in tax treatmentfor transactions that may have onlybeen separated by one day. For exam-ple, two houses closed escrow, onethe day before the annual lien dateand the other the day after; the valueincrease for each change in owner-ship was $500,000. The buyer whopurchased the day before the liendate would pay taxes on the entirepurchase price with the first install-ment of taxes no later thanDecember 10 that year. The buyerwho purchased the day after the liendate would not see the increase in taxes until the taxbill due in December of the following year. If bothproperties are owned for the same period of time, thebuyer who bought a single day before the lien datewould pay about $5,000 more in taxes than the otherproperty owner due to differences in the initial trans-action.
With the implementation of supplemental assess-ments, the increase in value is taxed from the first ofthe month following the date of completion of newconstruction or the change in ownership. That date isreferred to as the event date.
An event date between January 1 and May 31 resultsin two supplemental tax bills. The first supplementalbill is for the remainder of the fiscal year from the
first of the month following the event date. The sec-ond supplemental bill is for the subsequent fiscalyear, beginning July 1 after the event date. If theevent date is between June 1 and December 31, therewill be only one Supplemental Assessment in effect
for the remainder of that fiscalyear.
The amount of the supplementalassessment is the increase ordecrease in value as of the eventdate compared to the value thatwas previously assessed.Supplemental taxes are proratedbased on the number of monthsremaining in the fiscal year, ending
June 30. If the new assessment is lower than the priorassessed value a refund, rather than additional taxes,results.
Owners who have acquired property or completednew construction should be prepared for thefollowing financial responsibilities:
Supplemental event datesbetween June 1 & December 311. The portion of the annual taxbill for that fiscal year basedupon the assessed value prior tothe event.
2. The supplemental tax bill forthe difference in value betweenthe new and prior assessed val-ues; taxes are prorated forremainder of the fiscal year.
3. The annual tax bill for theupcoming fiscal year, reflectingthe new assessed value.
Supplemental event dates between January 1and May 311. The portion of the annual tax bill for that fiscal
year based upon the assessed value prior to theevent.
2. The first supplemental tax bill for the differencein value between the new and prior assessed val-ues; taxes are prorated for remainder of the fiscalyear.
3. The annual tax bill for the full fiscal year(July 1 – June 30) following the date of the eventbased upon the assessed value prior to the event.
4. The second supplemental tax bill for the differ-ence in value between the new value and theassessed value shown on the tax bill referencedimmediately above.
Supplemental Assessments
In September the Assessor’sOffice plans to launch a newon-line tool to help taxpayersestimate their supplementaltaxes. For more informationgo to the Assessor’s website:
sccassessor.org
In 2008, the Assessor’sOffice processed 24,068
supplemental assessmentsdue to new construction
and changes in ownershipwith a total net increase
in assessed value of$11.4 billion prorated into
supplemental taxbills by the Tax Collector.

www.sccassessor.org 9
Assessment Information by City
Total* Total* Percent Value PerRoll 2009 Roll 2008 Growth** Capita+
Campbell $6.47 $6.43 0.58% 160.09Cupertino 13.54 13.17 2.82% 242.55Gilroy 6.12 6.77 -9.48% 118.91Los Altos 9.45 9.06 4.27% 332.12Los Altos Hills 4.89 4.76 2.88% 550.36Los Gatos 8.32 8.17 1.85% 272.70Milpitas 12.02 12.03 -0.02% 169.79Monte Sereno 1.49 1.45 2.73% 411.68Morgan Hill 6.56 6.76 -2.97% 164.68Mountain View 16.23 15.28 6.22% 217.05Palo Alto 21.93 21.13 3.78% 340.13San Jose 122.52 124.83 -1.85% 121.68Santa Clara 24.67 24.48 0.80% 210.43Saratoga 10.07 9.93 1.34% 317.80Sunnyvale 25.90 24.73 4.75% 186.56Unincorporated 13.66 14.34 -4.73% 145.57TOTAL $303.86 $303.31 0.18% 163.57
(Values in billions, per capita in thousands)
Assessment Roll Growth by City
* Net of nonreimbursable exemptions** Percentages based on non-rounded values+ California Department of Finance, County population est., May 2009
Increases or decreases inroll growth vary depend-ing upon the type of hous-ing and commercialproperties. In communi-ties with a significantnumber of recently con-structed, entry-levelhomes, especially condo-miniums, growth wasmeager, non existent ornegative compared to com-munities comprised pri-marily of well established,mid to high-end residen-tial properties. MountainView had the largest per-centage increase inassessed value at 6.22 per-cent. In sharp contrast,Gilroy saw a decline inassessed value of 9.48 per-cent.
2009-2010 Percent Growth by City10%
5%
0%
-5%
-10%
Cupertino
MorganHill
SantaClara
MountainView
Sunnyvale
Los Altos
PaloAlto
Los Altos Hills
MonteSereno
Los Gatos
Saratoga
Campbell
Milpitas
San Jose
Unincorporated
Gilroy

2009-2010 Net Assessment Roll by City(value in billions)
Secured Secured Unsecured Unsecured Total PercentCITY RDA* CITY RDA* Roll** of Roll+
Campbell $5.48 $0.71 $0.20 $0.08 $6.47 2.13%Cupertino 12.77 0.20 0.54 0.02 13.54 4.46%Gilroy 5.86 - 0.27 - 6.12 2.02%Los Altos 9.34 - 0.11 - 9.45 3.11%Los Altos Hills 4.89 - 0.00 - 4.89 1.61%Los Gatos 6.94 1.13 0.18 0.06 8.32 2.74%Milpitas 6.26 4.33 0.59 0.85 12.02 3.96%Monte Sereno 1.49 - 0.00 - 1.49 0.49%Morgan Hill 4.36 1.91 0.15 0.14 6.56 2.16%Mountain View 12.36 1.96 0.72 1.19 16.23 5.34%Palo Alto 20.24 - 1.69 - 21.93 7.22%San Jose 98.01 15.86 4.54 4.12 122.52 40.32%Santa Clara 18.92 1.91 2.68 1.17 24.67 8.12%Saratoga 10.01 - 0.05 - 10.07 3.31%Sunnyvale 22.41 0.89 2.54 0.07 25.90 8.52%Unincorporated 13.39 0.00 0.27 - 13.66 4.50%TOTAL $252.73 $28.90 $14.53 $7.69 $303.86 100.00%
Secured Roll: Property for which taxes become a lien on real property to secure payment of taxes.Unsecured Roll: Property for which taxes are not a lien on Real Property to secure payment of taxes.*RDA: Redevelopment Agency **Net of Nonreimbursable Exemptions +Percentages based on non-rounded values-Indicates a value of 0 or less than $10 million
10 www.sccassessor.org
2009-2010 Net Assessment Roll by City
$25
$20
$15
$10
$5
$0
(value in billions)
Real Property(RP) Business Personal Property
San Jose
Sunnyvale
PaloAlto
Unincorporated
Campbell
MorganHill
MountainView
Gilroy
Los Gatos
Los Altos
MonteSereno
Los Altos Hills
Cupertino
SantaClara
Saratoga
Milpitas
$111 Billion (RP)

www.sccassessor.org 11
2009-2010 Real Property Distribution by City(value in billions)
Land Improvement Total Exemptions* Net ParcelValue Value Value Total Count
Campbell $3.16 $3.09 $6.26 $0.09 $6.17 11,441Cupertino 6.78 5.99 12.77 0.09 12.68 16,344Gilroy 2.50 3.45 5.95 0.17 5.78 12,730Los Altos 5.85 3.56 9.41 0.08 9.33 10,921Los Altos Hills 2.90 2.01 4.91 0.03 4.89 3,115Los Gatos 4.39 3.87 8.26 0.21 8.05 10,499Milpitas 4.67 5.93 10.60 0.23 10.37 16,929Monte Sereno 0.87 0.63 1.49 0.00 1.49 1,252Morgan Hill 2.62 3.76 6.39 0.17 6.22 11,049Mountain View 7.18 7.35 14.53 0.35 14.18 18,418Palo Alto 11.01 10.70 21.71 1.72 19.99 20,125San Jose 53.57 61.72 115.29 3.56 111.74 231,750Santa Clara 9.41 11.66 21.08 1.32 19.76 28,202Saratoga 6.03 4.14 10.17 0.16 10.01 11,044Sunnyvale 11.12 11.25 22.37 0.26 22.11 31,000Unincorporated 7.51 8.53 16.04 2.86 13.18 28,931TOTAL $139.57 $147.65 $287.22 $11.29 $275.93 463,750
Note: Does not include mobilehomes; does not include possessory interest assessments, which are billed as unsecuredassessments. Totals based on non-rounded values.- Indicates a value of 0 or less than $10 million *Nonreimbursable Exemptions
2009-2010 Business Personal Property Distribution by City(value in billions)
Gross Gross Net Percent ValueSecured* Unsecured** Exemptions+ Total of Value Growth
Campbell $0.03 $0.32 $0.04 $0.30 1.07% -5.23%Cupertino 0.31 0.58 0.02 0.87 3.11% 11.21%Gilroy 0.09 0.28 0.02 0.35 1.25% -3.56%Los Altos 0.04 0.12 0.03 0.12 0.45% 10.36%Los Altos Hills 0.01 0.01 0.01 0.00 0.01% -1.15%Los Gatos 0.05 0.25 0.03 0.27 0.97% 9.54%Milpitas 0.22 1.45 0.02 1.65 5.91% 2.44%Monte Sereno 0.00 0.00 0.00 0.00 0.00% 15.35%Morgan Hill 0.05 0.29 0.01 0.34 1.20% 2.34%Mountain View 0.18 1.97 0.10 2.05 7.34% 18.43%Palo Alto 0.34 2.77 1.17 1.95 6.97% -1.16%San Jose 2.37 8.94 0.52 10.79 38.63% 0.33%Santa Clara 1.44 3.95 0.48 4.91 17.60% 0.82%Saratoga 0.01 0.06 0.02 0.06 0.20% 32.61%Sunnyvale 1.20 2.63 0.04 3.79 13.57% 2.15%Unincorporated 0.29 0.97 0.78 0.48 1.73% 1.69%Grand Total $6.64 $24.58 $3.30 $27.92 100.00% 2.24%* Secured Roll: Property for which taxes become a lien on real property to secure payment of taxes.**Unsecured Roll: Property for which taxes are not a lien on Real Property to secure payment of taxes.Net of nonreimbursable exemptions; includes mobilehomes and possessory interest assessments
+ Nonreimbursable Exemptions
12 www.sccassessor.org
Bay Area Counties2009-2010 Gross Secured, Unsecured and Total Assessment RollCounty Unsecured Roll Secured Roll Total Gross Roll Percent increase
over prior yearAlameda $12,706,863,079 $189,868,127,299 $202,574,990,378 -2.24%Contra Costa $5,464,759,133 $144,284,195,822 $149,748,954,955 -6.80%Marin $1,495,427,503 $56,587,201,655 $58,082,629,158 1.98%Monterey $2,254,021,960 $49,367,745,278 $51,621,767,238 -3.21%Napa $1,515,090,490 $26,358,403,696 $27,873,494,186 0.75%San Benito $264,930,002 $5,903,394,723 $6,168,324,725 -8.93%San Francisco $10,709,982,420 $144,773,014,963 $155,482,997,383 6.81%San Mateo $9,981,213,406 $137,509,882,094 $147,491,095,500 0.84%Santa Clara $24,584,674,301 $293,858,998,583 $318,443,672,884 0.61%
Santa Cruz $907,879,690 $33,356,087,929 $34,263,967,619 -3.04%Solano $2,393,310,544 $41,084,002,798 $43,477,313,342 -8.62%Sonoma $2,626,531,061 $67,456,166,511 $70,082,697,572 -1.01%
Most Populous 15 California Counties (ranked by population)2009-2010 Gross Secured, Unsecured and Total Assessment RollCounty Unsecured Roll Secured Roll Total Gross Roll Percent increase
over 2008-20091 Los Angeles $53,193,852,719 $1,054,862,012,960 $1,108,055,865,679 -0.09%2 San Diego $15,886,616,399 $384,039,558,820 $399,926,175,219 -2.31%3 Orange $21,516,171,163 $419,606,535,701 $441,122,706,864 -0.79%4 Riverside $8,329,719,870 $209,109,850,448 $217,439,570,318 -10.51%5 San Bernardino $10,553,728,078 $160,051,284,105 $170,605,012,183 -6.20%6 Santa Clara $24,584,674,301 $293,858,998,583 $318,443,672,884 0.61%7 Alameda $12,706,863,079 $189,868,127,299 $202,574,990,378 -2.24%8 Sacramento $5,920,223,154 $125,707,294,831 $131,627,517,985 -6.40%9 Contra Costa $5,464,759,133 $144,284,195,822 $149,748,954,955 -6.80%10 Fresno $3,522,217,658 $57,396,800,478 $60,919,018,136 -2.74%11 Ventura $4,686,568,740 $102,094,607,449 $106,781,176,189 -2.07%12 San Francisco $10,709,982,420 $144,773,014,963 $155,482,997,383 6.81%13 Kern $3,663,863,211 $73,785,921,821 $77,449,785,032 -6.21%14 San Mateo $9,981,213,406 $137,509,882,094 $147,491,095,500 0.84%15 San Joaquin $3,757,050,879 $54,321,281,717 $58,078,332,596 -9.90%
Although Santa Clara County is the sixth most populous, and has the fourth highestassessment roll, it consistently ranks second in California in the assessed value ofunsecured business personal property.
www.sccassessor.org 13
ExemptionsThe Homeowners’ Exemption is the exemption with which most homeowners are familiar. Overthe last year the number of properties receiving this exemption increased by 0.17 percent.
In addition to the homeown-ers’ exemption, there areother exemptions availableto taxpayers. They includeexemptions to charitablenon-profit organizations,religious institutions and pri-vate non-profit colleges.During the last year, thevalue of exempt properties(non homeowner exempt)increased 10.5 percent.Despite negligible growth inthe market rate housing sec-tor, the assessed value ofaffordable housing grew by25.45 percent.
Completion of new con-struction at Kaiser Hospitalcontributed to the nearly17 percent increase in theassessed value attributed tohospitals receiving anexemption.
(value in billions)
Qualifying Exemptions
Percent PercentExemption Roll Total Value Exempt
Units Value Increase Value+Non-Profit Colleges 328 $6.43 7.94% 38.74%Qualifying LowIncome Housing 324 3.30 25.45% 19.89%CharitableNon-Profit Org. 1,180 2.02 -2.23% 12.18%Homeowners'Exemption* 286,565 2.01 0.06% 12.10%Hospitals 35 1.22 16.93% 7.37%Religious Org. 692 0.76 5.23% 4.56%Private Schools 141 0.47 20.19% 2.83%Cemeteries 34 0.14 1.71% 0.85%Museums / Libraries 17 0.13 0.71% 0.77%Disabled Veterans 658 0.07 4.30% 0.40%Misc. 27 0.05 -14.21% 0.29%Historical Aircraft 21 - -22.79% 0.01%TOTAL 290,022 $16.60 9.13% 100.00%
Exemptions notreimbursed bythe State 3,457 $14.59 10.51%These categories include only those non profit organizations that haveapplied and qualified in accordance with the Revenue and Taxation Code.
* The state reimburses the County for the Homeowners’ Exemption.+ Percentages based on non-rounded values- Indicates a value of 0 or less than $10 million
Kaiser Foundation Hospitals Inc. qualified for a
$1.03 billion exemption...and Stanford received
an exemption of $5.58 billion in assessed value...
the second largest exemption in California...
14 www.sccassessor.org
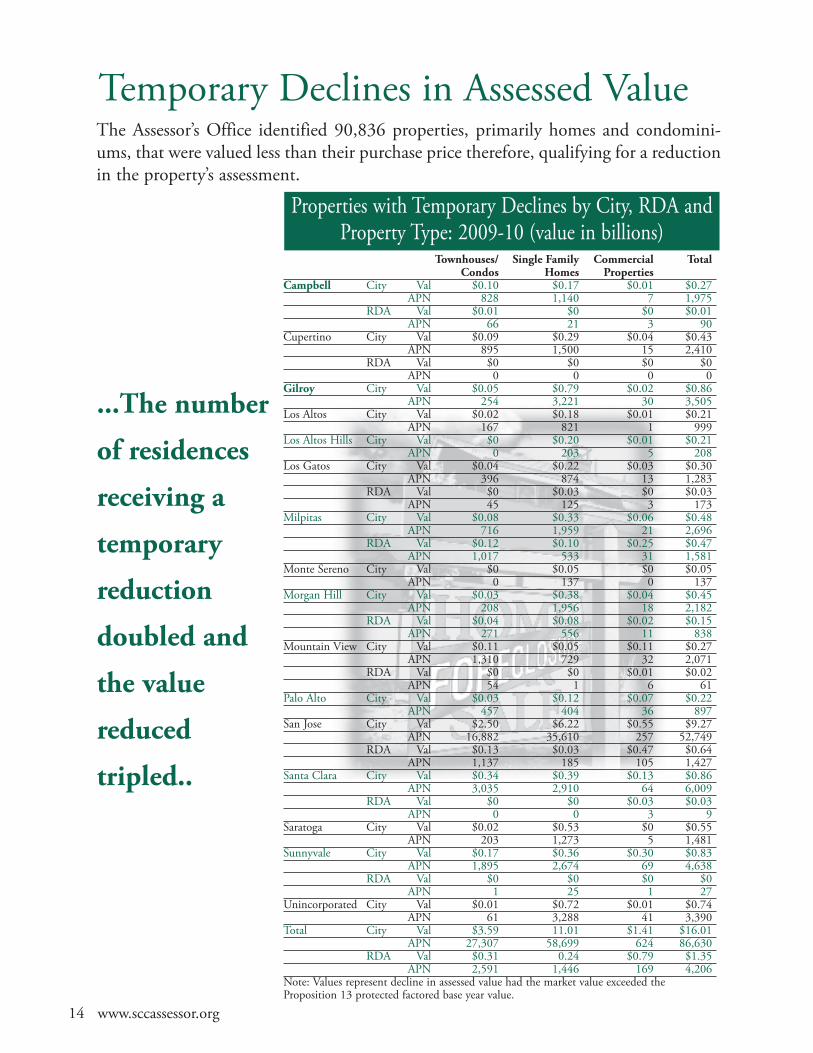
Properties with Temporary Declines by City, RDA andProperty Type: 2009-10 (value in billions)
Townhouses/ Single Family Commercial TotalCondos Homes Properties
Campbell City Val $0.10 $0.17 $0.01 $0.27APN 828 1,140 7 1,975
RDA Val $0.01 $0 $0 $0.01APN 66 21 3 90
Cupertino City Val $0.09 $0.29 $0.04 $0.43APN 895 1,500 15 2,410
RDA Val $0 $0 $0 $0APN 0 0 0 0
Gilroy City Val $0.05 $0.79 $0.02 $0.86APN 254 3,221 30 3,505
Los Altos City Val $0.02 $0.18 $0.01 $0.21APN 167 821 1 999
Los Altos Hills City Val $0 $0.20 $0.01 $0.21APN 0 203 5 208
Los Gatos City Val $0.04 $0.22 $0.03 $0.30APN 396 874 13 1,283
RDA Val $0 $0.03 $0 $0.03APN 45 125 3 173
Milpitas City Val $0.08 $0.33 $0.06 $0.48APN 716 1,959 21 2,696
RDA Val $0.12 $0.10 $0.25 $0.47APN 1,017 533 31 1,581
Monte Sereno City Val $0 $0.05 $0 $0.05APN 0 137 0 137
Morgan Hill City Val $0.03 $0.38 $0.04 $0.45APN 208 1,956 18 2,182
RDA Val $0.04 $0.08 $0.02 $0.15APN 271 556 11 838
Mountain View City Val $0.11 $0.05 $0.11 $0.27APN 1,310 729 32 2,071
RDA Val $0 $0 $0.01 $0.02APN 54 1 6 61
Palo Alto City Val $0.03 $0.12 $0.07 $0.22APN 457 404 36 897
San Jose City Val $2.50 $6.22 $0.55 $9.27APN 16,882 35,610 257 52,749
RDA Val $0.13 $0.03 $0.47 $0.64APN 1,137 185 105 1,427
Santa Clara City Val $0.34 $0.39 $0.13 $0.86APN 3,035 2,910 64 6,009
RDA Val $0 $0 $0.03 $0.03APN 0 0 3 9
Saratoga City Val $0.02 $0.53 $0 $0.55APN 203 1,273 5 1,481
Sunnyvale City Val $0.17 $0.36 $0.30 $0.83APN 1,895 2,674 69 4,638
RDA Val $0 $0 $0 $0APN 1 25 1 27
Unincorporated City Val $0.01 $0.72 $0.01 $0.74APN 61 3,288 41 3,390
Total City Val $3.59 11.01 $1.41 $16.01APN 27,307 58,699 624 86,630
RDA Val $0.31 0.24 $0.79 $1.35APN 2,591 1,446 169 4,206
Note: Values represent decline in assessed value had the market value exceeded theProposition 13 protected factored base year value.
Temporary Declines in Assessed ValueThe Assessor’s Office identified 90,836 properties, primarily homes and condomini-ums, that were valued less than their purchase price therefore, qualifying for a reductionin the property’s assessment.
...The number
of residences
receiving a
temporary
reduction
doubled and
the value
reduced
tripled..

The assessed values of 90,836 properties werereduced by the Assessor’s Officeas of the lien date, January 1, 2009, to reflectchanges in market conditions. The reductionstotaled $17.4 billion.
The total number ofproperties more thandoubled over the pre-vious year. As ofJanuary 1, 2009,approximately 20percent of all singlefamily homes andone-third of all con-dominiums areassessed below theirpurchase price. Todate, the aggregatereduction exceeds$17 billion, by far the largest decrease incounty history. The average reduction per res-idential property increased from $78,000 lastyear to $170,000.
The temporary reductions in assessed value aremandated per a state proposition passed byCalifornia voters in November 1978. It pro-vides that property owners are entitled to thelower of the fair market value of their property
as of January 1, 2009,or the assessed value asdetermined at the timeof purchase or con-struction, andincreased by no morethan 2 percent annual-ly.
The overwhelmingmajority of reductionsare for properties thatwere purchased ornewly constructed inrecent years. Properties
where the market value exceeds the assessedvalue as of January 1, 2009, are not eligible foran adjustment.
...More than one-third of all prop-erties receiving a reduction werelocated in the East Side UnionHigh School District; one in ninewere in San Jose Unified SchoolDistrict...Over one-fifth of allproperties receiving a reductionwere in five zip codes: 95123,95035, 95020, 95125, 95037...
www.sccassessor.org 15
2003-2009 Number of properties temporarily reduced to reflect changes in market value
Parcels
Billions
90,000
80,000
70,000
60,000
50,000
40,000
30,000
20,000
10,000
0
$18.00
$15.00
$12.00
$9.00
$6.00
$3.00
$02003-04 2004-05 2005-06 2006-07 2007-08 2008-09
Parcels Reduced AV
17,758
6,5034,442
24,743
2009-10
90,836
Assessed Values Proactively ReducedAssessor responds to dramatic decline in market value
33,36541,866
16 www.sccassessor.org
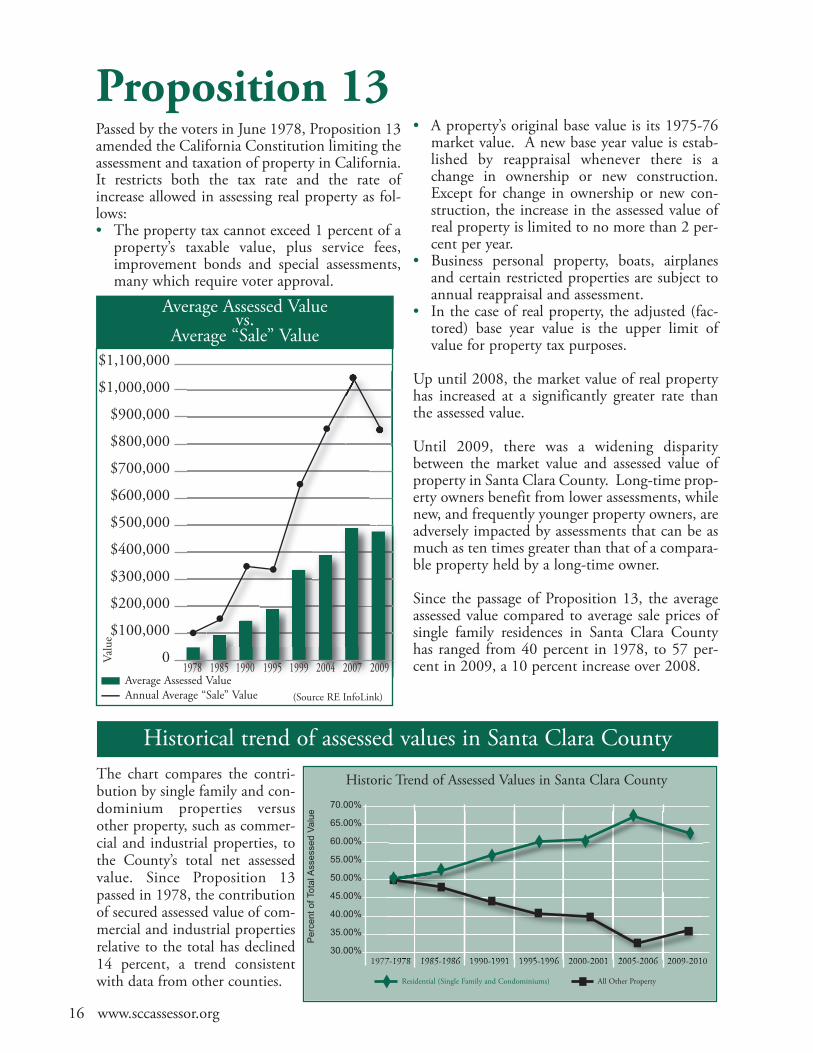
Average Assessed Valuevs.
Average “Sale” Value
Proposition 13Passed by the voters in June 1978, Proposition 13amended the California Constitution limiting theassessment and taxation of property in California.It restricts both the tax rate and the rate ofincrease allowed in assessing real property as fol-lows:• The property tax cannot exceed 1 percent of aproperty’s taxable value, plus service fees,improvement bonds and special assessments,many which require voter approval.
• A property’s original base value is its 1975-76market value. A new base year value is estab-lished by reappraisal whenever there is achange in ownership or new construction.Except for change in ownership or new con-struction, the increase in the assessed value ofreal property is limited to no more than 2 per-cent per year.
• Business personal property, boats, airplanesand certain restricted properties are subject toannual reappraisal and assessment.
• In the case of real property, the adjusted (fac-tored) base year value is the upper limit ofvalue for property tax purposes.
Up until 2008, the market value of real propertyhas increased at a significantly greater rate thanthe assessed value.
Until 2009, there was a widening disparitybetween the market value and assessed value ofproperty in Santa Clara County. Long-time prop-erty owners benefit from lower assessments, whilenew, and frequently younger property owners, areadversely impacted by assessments that can be asmuch as ten times greater than that of a compara-ble property held by a long-time owner.
Since the passage of Proposition 13, the averageassessed value compared to average sale prices ofsingle family residences in Santa Clara Countyhas ranged from 40 percent in 1978, to 57 per-cent in 2009, a 10 percent increase over 2008.
Historical trend of assessed values in Santa Clara CountyThe chart compares the contri-bution by single family and con-dominium properties versusother property, such as commer-cial and industrial properties, tothe County’s total net assessedvalue. Since Proposition 13passed in 1978, the contributionof secured assessed value of com-mercial and industrial propertiesrelative to the total has declined14 percent, a trend consistentwith data from other counties.
Historic Trend of Assessed Values in Santa Clara County
PercentofTotalAssessedValue
70.00%
65.00%
60.00%
55.00%
50.00%
45.00%
40.00%
35.00%
30.00%1977-1978 1985-1986 1990-1991 1995-1996 2000-2001 2005-2006 2009-2010
Residential (Single Family and Condominiums) All Other Property
Average Assessed ValueAnnual Average “Sale” Value (Source RE InfoLink)
1978 1985 1990 1995 1999 2004 2007 2009
$1,100,000
$1,000,000
$900,000
$800,000
$700,000
$600,000
$500,000
$400,000
$300,000
$200,000
$100,000
0Value

www.sccassessor.org 17
Do I benefit from Proposition 13? It is a frequent question. The answer is, every property owner bene-fits from Proposition 13. However, property owners that have owned their property longer benefit morethan recent buyers. For example, 20 percent of today’s property owners have not had their propertyreassessed to market value since 1978. The total of those properties with a base year value establishedbefore 1979 equals 7 percent of the total assessed value of all the land and improvements in Santa ClaraCounty. By contrast, property owners who acquired a property during the last four years account for21 percent of all properties, yet their combined assessed values account for one-third of the total assess-ment roll.
The charts below provide a snap shot as of January 1, 2009, of properties assessed as of 1975 (all prop-erty owned prior to March 1, 1975) and for each subsequent year of acquisition for the current roll. Italso shows the 2009 assessed value, based upon market value as of March 1, 1975, or as of the date ofacquisition, plus the inflation rate not to exceed 2 percent per year. For example, of the 463,750 prop-erties in the County, 22,082 were reassessed at market value in 2009 and account for $18.9 billion inassessed value out of a total County assessment roll of $287.2 billion.
Base Year Parcels Assessed Value Base Year Parcels Assessed ValueLien Date (Land & Imp.) Lien Date (Land & Imp.)
1975 71,929 $15,550,204,231 1993 8,644 $4,582,444,1311976 5,194 $821,233,108 1994 8,918 $5,066,524,3691977 6,841 $1,163,529,298 1995 9,697 $5,382,803,3631978 6,558 $1,529,907,560 1996 9,643 $6,263,564,2251979 5,698 $1,314,883,614 1997 10,700 $6,623,910,8381980 6,095 $1,512,638,657 1998 13,737 $8,604,348,2701981 4,002 $1,379,307,205 1999 15,033 $12,143,261,0521982 3,276 $1,260,592,863 2000 16,822 $12,738,162,8251983 3,112 $1,282,899,479 2001 14,704 $13,593,251,3191984 5,468 $2,125,593,101 2002 11,619 $10,998,141,1671985 6,455 $3,155,724,043 2003 16,935 $13,642,921,6371986 7,216 $2,610,046,302 2004 21,146 $16,181,032,7141987 8,753 $3,645,784,424 2005 27,634 $20,865,108,2051988 8,575 $3,424,933,637 2006 28,645 $23,389,246,9061989 10,071 $4,499,151,391 2007 24,567 $24,733,504,1241990 7,515 $4,012,889,894 2008 22,870 $27,088,332,4651991 6,048 $3,323,041,015 2009 22,082 $18,924,225,3171992 7,548 $3,790,225,568 TOTAL 463,750 $287,223,368,317
Who benefits?
Distribution of Assessment Roll by Base Year and Property TypeBase Year Single Family/Condominium Commercial, Industrial, OtherLien Date Parcel Parcel % Assessed Value AV % Parcel Parcel % Assessed Value AV %Prior to 1979 77,668 19% $8,310,012,920 5% 12,854 24% $10,754,861,277 10%1979-1988 50,549 12% $13,215,136,249 7% 8,101 15% $8,497,267,076 8%1989-1998 83,011 20% $35,680,595,619 19% 9,510 17% $16,468,307,445 16%1999-2004 86,964 21% $55,295,336,098 30% 9,295 17% $24,001,434,616 23%2005-2009 111,148 27% $71,671,509,653 39% 14,650 27% $43,328,907,364 42%Total 409,340 100% $184,172,590,539 100% 54,410 100% $103,050,777,778 100%

Organizational Overview of tAsseAssistant
Assessment Standards, Services, and Exemptions
Division DescriptionResponsible for locating and identifying ownership and reappraisability of all taxable real proper-ty as well as approving and enrolling all legal property tax exemptions. In addition, professionalstaff members monitor assessment appeal information; process legal appeals; maintain and updateassessment maps; manage the public service center, document imaging center and oversee qualitycontrol.
Staff CompositionA majority of the sixty-three staff members of the Assessment, Standards, Services and ExemptionDivision possess expert knowledge in exemption law, cartography and/or the legal complexities ofproperty transfers. In addition, two staff members are certified by the State Board of Equalization(SBE), one as an appraiser and another as an advanced appraiser.
Major Accomplishments 2009/2010 2008/2009Ownership Title Documents Processed 75,315 77,673Organizational Exemption Claims 3,457 3,414Parcel Number Changes (split & combinations) 2,961 6,109
Real PropertyDivision DescriptionResponsible for valuing and enrolling all taxable real property (land and improvements). TheDivision provides assessment-related information to the public, and cooperates with otheragencies regarding assessment and property tax-related matters.
Staff CompositionSixty-seven of the 87 staff positions are professional appraisers certified by the State Board ofEqualization (SBE) Fifty-four of those appraisers hold advanced certificates issued by the SBE.
Major Accomplishments 2009/2010 2008/2009Real Property Parcels (secured; taxable) 463,750 461,877Permits Processed (reassessable and non reassessable events) 29,526 28,246Temporary Decline in Value Parcels (Proposition 8) 90,836 41,866Parcels with New Construction (reassessable events) 8,017 7,723Change in Ownership Assessed (reassessable events) 27,692 26,242
18 www.sccassessor.org
40%Asian
47%Male53%
Female
Staff Composition
44%Caucasian
1% AfricanAmerican
15%Hispanic

www.sccassessor.org 19
Office Mission The mission of the Santa Clara County Assessor’s Office is to producean annual assessment roll including all assessable property in accordance with legal mandatesin a timely, accurate, and efficient manner; and provide current assessment-related informa-tion to the public and to governmental agencies in a timely and responsive way.
Business Division (Business Personal Property)
Division DescriptionResponsible for locating, valuing and enrolling all taxable business personal property includingproperty (owned and leased) such as computers, supplies, machinery, equipment and fixturesas well as mobilehomes, airplanes and boats. Last year, the Division completed 1,023 businessaudits. The Division is responsible for administration of assessment appeals involving businesspersonal property. Once every four years all businesses with personal property are subject toaudit. Ninety-six percent of all personal property is owned by 20 percent of the business entities.
Staff CompositionForty-two of the sixty-four staff members are certified as auditor-appraisers including thirty-eightstaff members who have advanced certification awarded by the SBE. The staff is comprised ofaccountants and experts skilled in assessing and auditing high-tech businesses.
Major Accomplishments 2009/2010 2008/2009Business Assessments on Secured Roll* 2,800 2,771Mobilehome Parcels Assessed* 10,181 9,983Business Personal Property (BPP) Appraisals Enrolled* 68,921 71,979Total Business Personal Property Assessment Activities 93,949 104,227
* Note: Subset of total activities
Administration DivisionDivision DescriptionResponsible for providing administrative and fiscalsupport services to the Assessor’s Office; including budget,personnel, payroll, purchasing, facilities management andinternal/external communications.
SSttaaffff CCoommppoossiittiioonn A staff of ten includes the Assessor, Assistant Assessor andthe Deputy to the Assessor. Three are certified appraisersand one is an advanced appraiser certified by the SBE.
Assessor’s 2009/2010* 2008/2009*Budget $27,735,065 $26,165,831Employees in the Assessor’s Office 242 237
Staff Funded by State 0 10Performance Grant (PTAP) * assessment year
Information Systems Division
Division DescriptionResponsible for supplying systems support to all otherdivisions in the pursuit ofpreparing and delivering the secured, unsecured andsupplemental assessment rolls.
Staff Composition The eighteen member staff hasa broad knowledge ofadvanced computer systems.
Organizational Overview of the County Assessor’s OfficeAssessorAssistant Assessor

20 www.sccassessor.org
100%90%80%70%60%50%40%30%20%10%0%
Single Family/Condo Residential
Percent of Real Property by Value Percent of Real Property by Parcel
2009-2010 Real Property Types by Value and Parcel Count
66.7%
Multi-Family Residential
Non-Residential
7.8%4.4%
25.5%
7.4%
2009-2010 Real Property Distribution of Value by Property Type
Property Type Value* Value Value % Parcel Parcel(in Billions) Growth Percentage Count Percentage+
Single Family Detatched $157.06 -1.75% 56.92% 329,712 71.10%Condominiums 26.89 -4.07% 9.75% 79,642 17.17%Office 17.44 6.81% 6.32% 5,083 1.10%Apartments 5+ Units 14.97 4.96% 5.43% 4,854 1.05%Other Industrial Non-Manufacturing 10.44 4.77% 3.78% 3,825 0.82%
R&D Industrial 10.60 7.58% 3.84% 698 0.15%Specialty Retail and Hotels 9.58 2.79% 3.47% 5,841 1.26%Single Family 2-4 units 6.50 1.59% 2.36% 15,182 3.27%Other Urban 5.90 2.56% 2.14% 8,381 1.81%Major Shopping Centers 5.86 9.65% 2.13% 864 0.19%Electronic & Machinery Mfg. 4.24 -5.16% 1.54% 361 0.08%Other Industrial Manufacturing 3.29 0.77% 1.19% 2,048 0.44%
Agricultural 1.96 6.37% 0.71% 5,837 1.26%Public & Quasi-Public 1.10 -10.63% 0.40% 1,228 0.26%Residential Misc. 0.05 -3.70% 0.02% 194 0.04%TOTAL $275.93 -0.03% 100.00% 463,750 100.00%+ Percentages based on non-rounded values* Net of Nonreimbursable Exemptions; Does not include Mobilehomes; Does not include Possessory Interest assess-ments which are billed as unsecured assessments.
Although nearly nine out of ten parcels of real propertyin Santa Clara County aresingle family residences, thoseparcels represent two-thirdsof the total assessed value ofall real property. Non-residen-tial real property, includingcommercial, industrial, retailand agricultural properties,account for 32 percent of theassessed values while consti-tuting only 12 percent of allparcels.
88.3%
www.sccassessor.org 21
2009-2010 Business Personal Property Distribution of Value by Type
(value in billions)
Net Percent of Value EntityProperty Type Secured* Unsecured** Exemptions Total Value+ Growth+ CountProfessional Services $0.90 $7.72 $0.76 $7.86 28.13% 2.44% 15,896Electronic Manufacturers 1.68 3.16 0.00 4.84 17.32% -3.58% 1,017Computer Manufacturers 0.88 2.59 0.00 3.47 12.44% 3.16% 13Other Manufacturing 0.53 2.73 0.00 3.26 11.69% 3.37% 3,422Retail 0.11 2.12 0.01 2.23 7.98% 4.01% 6,820Semiconductor Manufacturing 0.98 0.59 0.00 1.57 5.62% -12.87% 19Other 0.85 3.54 2.51 1.88 6.73% 51.89% 1,807Aircraft 0.00 1.11 0.00 1.11 3.97% -3.85% 887Leased Equipment 0.00 0.81 0.00 0.81 2.90% -4.97% 496Mobilehomes 0.61 0.00 0.00 0.60 2.17% -0.99% 9,954Financial Institutions 0.01 0.14 0.00 0.15 0.52% -9.74% 96Apartments 0.09 0.01 0.01 0.09 0.30% 6.99% 998Boats 0.00 0.06 0.00 0.06 0.21% 0.00% 3,802TOTAL $6.64 $24.58 $3.30 $27.92 100.00% 2.24% 45,227
* Secured Roll: Property for which taxes become a lien on real property to secure payment of taxes. ** Unsecured Roll: Property for which taxes are not a lien on real property to secure payment of taxes.Net of nonreimbursable exemptions, includes possessory interest assessments valued by Real Property Division. + Percentages based on non-rounded values.0 or - Indicates a value of 0 or less than $10 million. As a result, totals of displayed numbers may be off by up to $10 million.
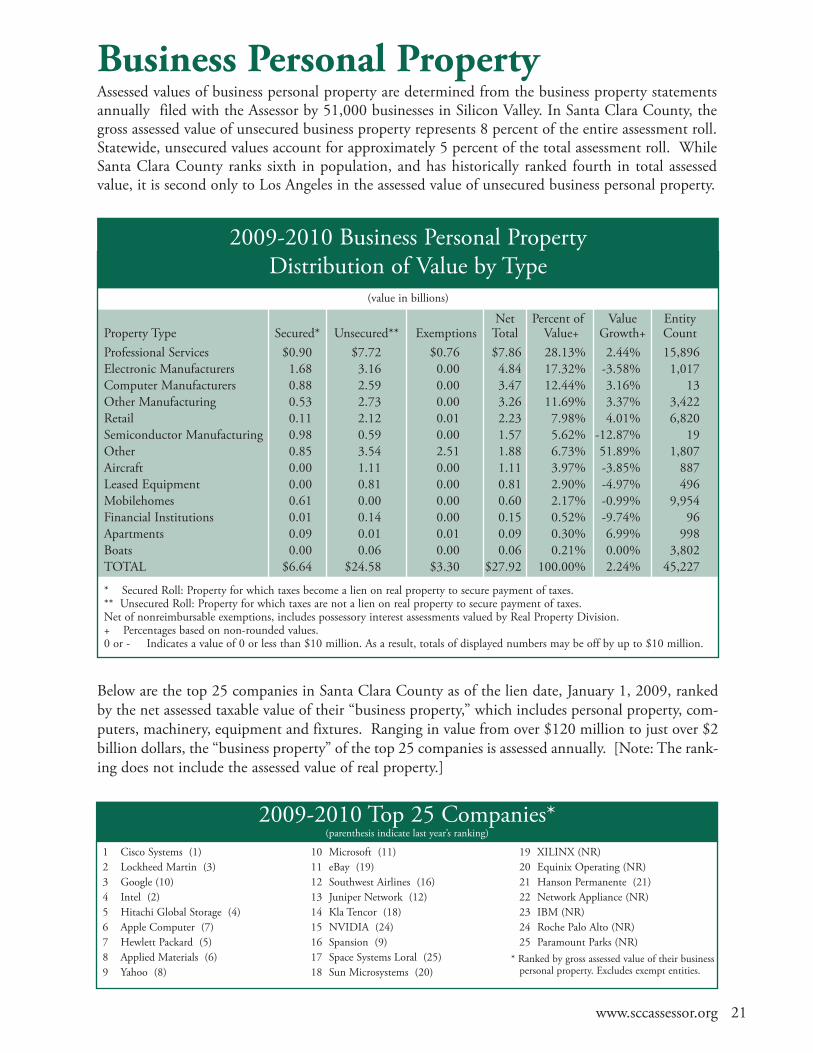
Business Personal PropertyAssessed values of business personal property are determined from the business property statementsannually filed with the Assessor by 51,000 businesses in Silicon Valley. In Santa Clara County, thegross assessed value of unsecured business property represents 8 percent of the entire assessment roll.Statewide, unsecured values account for approximately 5 percent of the total assessment roll. WhileSanta Clara County ranks sixth in population, and has historically ranked fourth in total assessedvalue, it is second only to Los Angeles in the assessed value of unsecured business personal property.
Below are the top 25 companies in Santa Clara County as of the lien date, January 1, 2009, rankedby the net assessed taxable value of their “business property,” which includes personal property, com-puters, machinery, equipment and fixtures. Ranging in value from over $120 million to just over $2billion dollars, the “business property” of the top 25 companies is assessed annually. [Note: The rank-ing does not include the assessed value of real property.]
1 Cisco Systems (1)2 Lockheed Martin (3)3 Google (10)4 Intel (2)5 Hitachi Global Storage (4)6 Apple Computer (7)7 Hewlett Packard (5)8 Applied Materials (6)9 Yahoo (8)
10 Microsoft (11)11 eBay (19)12 Southwest Airlines (16)13 Juniper Network (12)14 Kla Tencor (18)15 NVIDIA (24)16 Spansion (9)17 Space Systems Loral (25)18 Sun Microsystems (20)
19 XILINX (NR)20 Equinix Operating (NR)21 Hanson Permanente (21)22 Network Appliance (NR)23 IBM (NR)24 Roche Palo Alto (NR)25 Paramount Parks (NR)
2009-2010 Top 25 Companies* (parenthesis indicate last year’s ranking)
* Ranked by gross assessed value of their business personal property. Excludes exempt entities.

22 www.sccassessor.org
Assessor Parcels and "Added" Assessed Value Resulting From All Changes in Ownership(CIO) and New Construction (NC) by City and Major Property Type: 2009-10
Agricultural Industrial Multifamily Office Retail Townhouses/ Single Family Total& misc. & Mfg Housing Condos Homes
Campbell CIO $4,429,171 $15,108,985 $31,464,239 $31,205,235 $10,816,076 $12,223,442 $46,510,319 $151,757,46713 19 38 8 20 129 262 489
NC $743,088 $198,860 $94,860 $2,032,877 $7,894,160 $6,951,220 $13,121,972 $31,037,037 44 33 37 53 71 127 518 883
Cupertino CIO $40,659,851 $13,218,728 $37,619,927 $44,060,304 $1,107,538 $41,404,575 $175,761,805 $353,832,728 33 7 21 21 7 205 355 649
NC $2,008,691 $0 $9,121,055 $38,151,064 $22,617,603 $6,326,972 $44,463,365 $122,688,750 80 37 138 62 107 144 860 1,428
Gilroy CIO $19,195,711 $2,587,485 ($1,935,872) $735,594 $13,947,333 ($6,282,991) ($64,213,071) ($35,965,811)64 14 31 3 17 97 1070 1,296
NC ($10,301,777) $3,858,646 ($320,072) $2,826,700 $19,878,895 $1,629,559 $28,538,054 $46,110,005 88 37 33 27 169 90 503 947
Los Altos CIO $4,550,477 $0 $3,721,508 $19,355,864 $4,060,344 $23,484,347 $255,279,689 $310,452,229 9 0 6 10 3 55 317 400
NC $3,004,996 $0 $0 $1,307,000 ($212,282) $13,328,216 $44,740,946 $62,168,876 25 1 11 32 35 119 1,146 1,369
Los Altos Hills CIO $9,709,455 $0 $0 $0 $0 $0 $98,068,950 $107,778,405 14 0 0 0 0 0 80 94
NC $1,287,800 $0 $0 $0 $0 $0 $20,866,031 $22,153,831 19 0 0 0 0 0 409 428
Los Gatos CIO $23,282,184 $0 $7,725,438 $12,652,272 $7,854,539 $19,690,535 $144,653,409 $215,858,377 24 0 19 8 17 112 291 478
NC $4,577,888 $68,000 ($413,763) $6,583,088 $31,961 $84,775 $37,281,933 $48,213,882 59 14 31 35 45 53 787 1024
Milpitas CIO $2,301,472 $44,671,437 $4,925,820 $3,425,933 $22,527,322 $69,549,364 $45,376,412 $192,777,760 12 37 11 44 25 476 601 1,206
NC $3,469,476 $59,761,508 $21,559,505 $482,052 $5,600 ($1,740,654) $7,279,511 $90,816,998 90 158 131 29 60 475 435 1,378
Monte Sereno CIO $1,496,267 $0 $0 $0 $0 $0 $34,792,733 $36,289,000 1 0 0 0 0 0 49 50
NC $738,259 $0 $0 $0 $0 $0 $8,290,398 $9,028,657 13 0 0 0 0 0 219 232
Morgan Hill CIO $5,806,519 $7,600,413 $4,174,788 $4,055,825 $2,324,411 $1,826,211 $39,424,159 $65,212,326 35 21 29 13 15 106 533 752
NC $13,750,409 $1,086,700 $0 $0 $62,070,236 $32,232 $13,167,910 $90,107,487 69 26 14 17 99 128 492 845
Mountain View CIO $44,501,576 $158,291,584 $71,512,861 $39,648,245 $8,712,473 $63,647,106 $152,459,381 $538,773,226 23 26 68 23 16 369 370 895
NC $8,569,792 $8,667,482 $63,601 $861,412 $4,121,803 $12,582,246 $18,344,646 $53,210,982 132 196 250 131 85 253 654 1,701
Palo Alto CIO $37,502,509 $2,448,405 $25,713,815 $45,683,791 $23,889,586 $74,952,854 $400,325,867 $610,516,827 72 8 28 23 14 261 501 907
NC $21,019,152 $13,698,725 $3,870,657 $35,065,076 $2,339,507 $67,883 $95,006,536 $171,067,536 137 56 64 120 107 106 1,121 1,711
San Jose CIO $132,791,851 $242,192,137 $305,645,869 $68,920,735 $228,321,086 $196,980,032 $377,591,961 $1,552,443,671 295 256 572 134 147 4,392 9,815 15,611
NC $145,559,754 $67,737,427 $75,135,752 $177,981,607 $275,398,909 $327,982,329 $161,213,255 $1,231,009,033 362 457 428 451 538 2,316 4,267 8,819
Santa Clara CIO $25,173,530 $79,646,829 $55,244,499 $62,557,910 $3,790,803 $23,517,174 $136,186,484 $386,117,229 12 49 85 21 12 394 766 1,339
NC $220,000 $19,420,280 $15,066,101 $4,225,561 $613,434 $2,863,355 $23,753,982 $66,162,713 65 304 268 139 79 296 804 1,955
Saratoga CIO $6,443,391 $0 $0 $1,625,514 $13,153,739 $9,380,380 $225,701,350 $256,304,374 18 0 0 2 3 52 305 380
NC $4,216,044 $0 $0 $140,020 $180,000 $3,850 $55,049,811 $59,589,725 29 0 4 7 9 15 708 772
Sunnyvale CIO $18,275,813 $83,242,143 $82,806,378 $24,402,537 $10,597,582 $83,672,760 $215,085,687 $518,082,900 16 33 68 30 26 474 826 1,473
NC $81,124,532 $140,586,050 $121,991 $88,477,164 $58,597,965 $28,150,349 $21,902,346 $418,960,397 48 710 422 215 188 582 1,207 3,372
Unincorporated CIO $38,180,783 $5,272,598 $585,492 $1,560,228 $3,392,311 $2,084,514 $134,022,842 $185,098,768 491 12 18 2 9 16 1,125 1,673
NC $24,148,654 $1,115,000 $91,766 $0 $829 $124,000 $101,613,231 $127,093,480 593 10 18 1 21 21 1,998 2,662
Total CIO $414,300,560 $654,280,744 $629,204,762 $359,889,987 $354,495,143 $616,130,303 $2,417,027,977 $5,445,329,476 1,132 482 994 342 331 7,138 17,266 27,692
NC $304,136,758 $316,198,678 $124,391,453 $358,133,621 $453,538,620 $398,386,332 $694,633,927 $2,649,419,389 1,853 2,039 1,849 1,319 1,613 4,725 16,128 29,526
Note: New construction with negative assessed value may be the result of a natural disaster or other circumstances that may trigger demolition and/or site prepara-tion. Not all CIO or NC result in a change in assessed value.
www.sccassessor.org 23
(assessed value in millions)
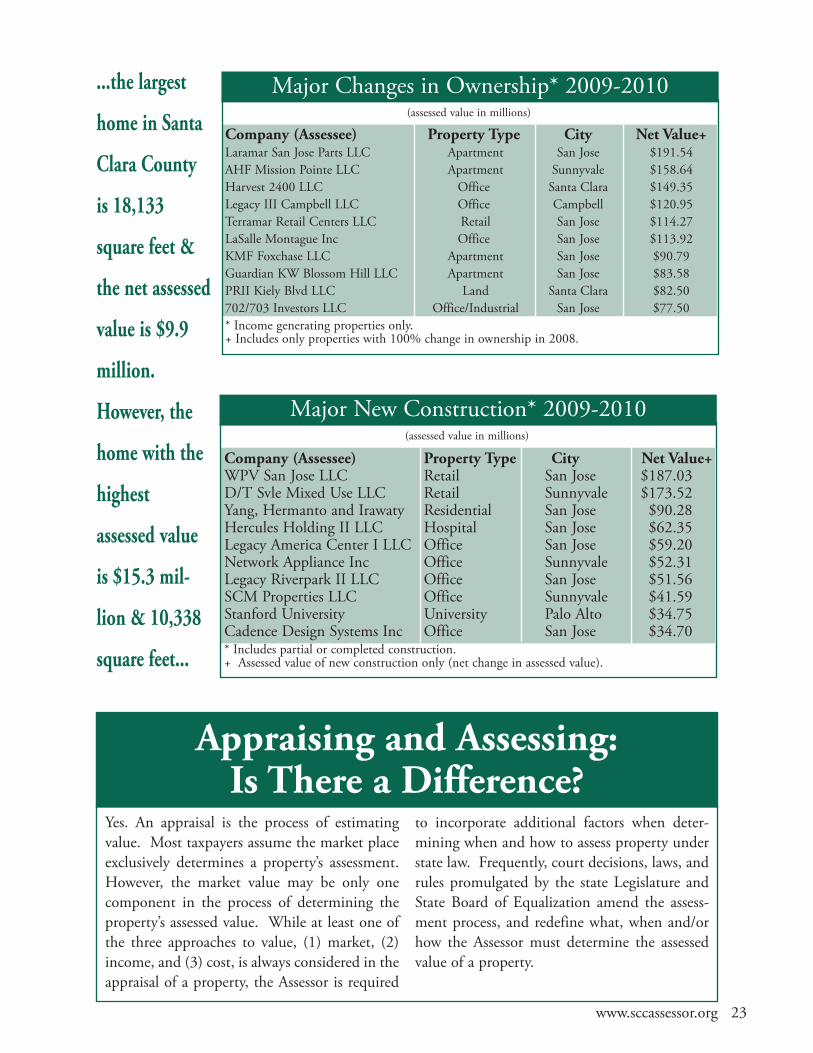
Major Changes in Ownership* 2009-2010
Company (Assessee) Property Type City Net Value+Laramar San Jose Parts LLC Apartment San Jose $191.54AHF Mission Pointe LLC Apartment Sunnyvale $158.64Harvest 2400 LLC Office Santa Clara $149.35Legacy III Campbell LLC Office Campbell $120.95Terramar Retail Centers LLC Retail San Jose $114.27LaSalle Montague Inc Office San Jose $113.92KMF Foxchase LLC Apartment San Jose $90.79Guardian KW Blossom Hill LLC Apartment San Jose $83.58PRII Kiely Blvd LLC Land Santa Clara $82.50702/703 Investors LLC Office/Industrial San Jose $77.50* Income generating properties only. + Includes only properties with 100% change in ownership in 2008.
(assessed value in millions)
Major New Construction* 2009-2010
Company (Assessee) Property Type City Net Value+WPV San Jose LLC Retail San Jose $187.03D/T Svle Mixed Use LLC Retail Sunnyvale $173.52Yang, Hermanto and Irawaty Residential San Jose $90.28Hercules Holding II LLC Hospital San Jose $62.35Legacy America Center I LLC Office San Jose $59.20Network Appliance Inc Office Sunnyvale $52.31Legacy Riverpark II LLC Office San Jose $51.56SCM Properties LLC Office Sunnyvale $41.59Stanford University University Palo Alto $34.75Cadence Design Systems Inc Office San Jose $34.70* Includes partial or completed construction. + Assessed value of new construction only (net change in assessed value).
...the largest
home in Santa
Clara County
is 18,133
square feet &
the net assessed
value is $9.9
million.
However, the
home with the
highest
assessed value
is $15.3 mil-
lion & 10,338
square feet...
Appraising and Assessing: Is There a Difference?
Yes. An appraisal is the process of estimatingvalue. Most taxpayers assume the market placeexclusively determines a property’s assessment.However, the market value may be only onecomponent in the process of determining theproperty’s assessed value. While at least one ofthe three approaches to value, (1) market, (2)income, and (3) cost, is always considered in theappraisal of a property, the Assessor is required
to incorporate additional factors when deter-mining when and how to assess property understate law. Frequently, court decisions, laws, andrules promulgated by the state Legislature andState Board of Equalization amend the assess-ment process, and redefine what, when and/orhow the Assessor must determine the assessedvalue of a property.
24 www.sccassessor.org
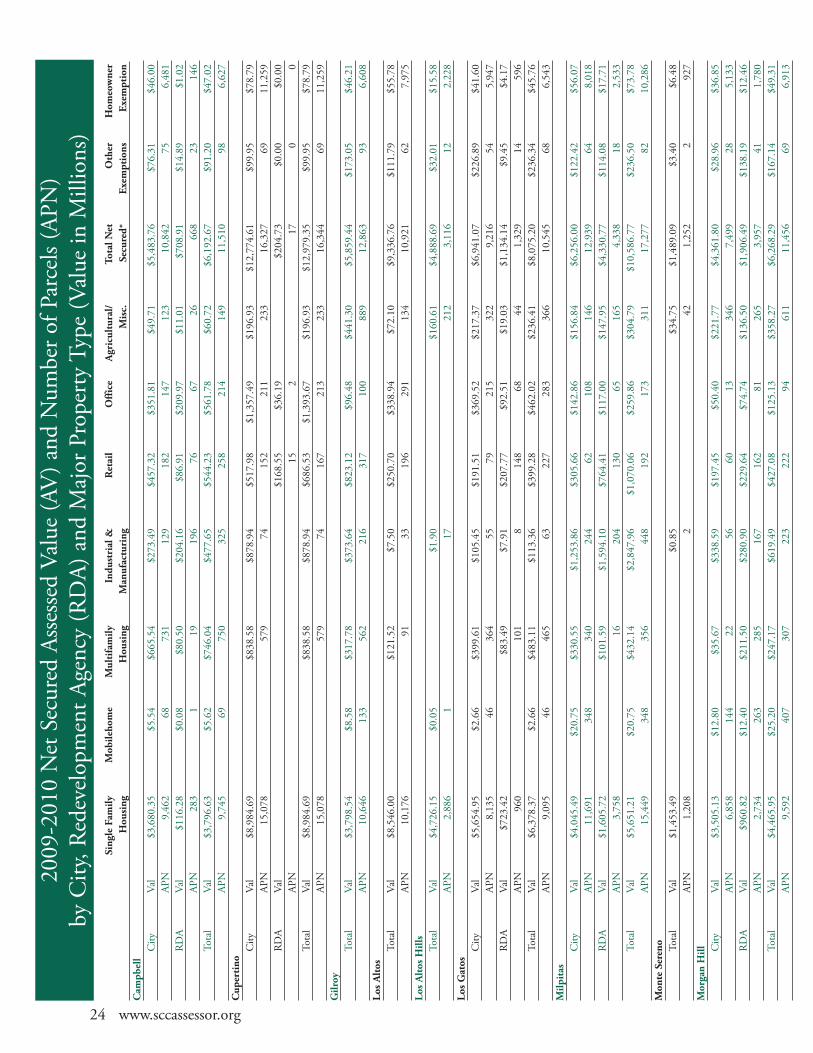
2009-2010 Net Secured Assessed Value (AV) and Number of Parcels (APN)
by City, Redevelopment Agency (RDA) and Major Property Type (Value in Millions)
Sing
le F
amily
M
obile
hom
eM
ulti
fam
ilyIn
dust
rial
&R
etai
lO
ffic
eA
gric
ultu
ral/
Tota
l Net
Oth
erH
omeo
wne
rH
ousi
ngH
ousi
ngM
anuf
actu
ring
Mis
c.Se
cure
d*Ex
empt
ions
Exem
ptio
nC
ampb
ellCity
Val
$3,680.35
$5.54
$665.54
$273.49
$457.32
$351.81
$49.71
$5,483.76
$76.31
$46.00
APN
9,462
68731
129
182
147
123
10,842
756,481
RDA
Val
$116.28
$0.08
$80.50
$204.16
$86.91
$209.97
$11.01
$708.91
$14.89
$1.02
APN
283
119
196
7667
26668
23146
Total
Val
$3,796.63
$5.62
$746.04
$477.65
$544.23
$561.78
$60.72
$6,192.67
$91.20
$47.02
APN
9,745
69750
325
258
214
149
11,510
986,627
Cup
erti
noCity
Val
$8,984.69
$838.58
$878.94
$517.98
$1,357.49
$196.93
$12,774.61
$99.95
$78.79
APN
15,078
579
74152
211
233
16,327
6911,259
RDA
Val
$168.55
$36.19
$204.73
$0.00
$0.00
APN
152
170
0Total
Val
$8,984.69
$838.58
$878.94
$686.53
$1,393.67
$196.93
$12,979.35
$99.95
$78.79
APN
15,078
579
74167
213
233
16,344
6911,259
Gilr
oyTotal
Val
$3,798.54
$8.58
$317.78
$373.64
$823.12
$96.48
$441.30
$5,859.44
$173.05
$46.21
APN
10,646
133
562
216
317
100
889
12,863
936,608
Los
Alt
osTotal
Val
$8,546.00
$121.52
$7.50
$250.70
$338.94
$72.10
$9,336.76
$111.79
$55.78
APN
10,176
9133
196
291
134
10,921
627,975
Los
Alt
os H
ills
Total
Val
$4,726.15
$0.05
$1.90
$160.61
$4,888.69
$32.01
$15.58
APN
2,886
117
212
3,116
122,228
Los
Gat
osCity
Val
$5,654.95
$2.66
$399.61
$105.45
$191.51
$369.52
$217.37
$6,941.07
$226.89
$41.60
APN
8,135
46364
5579
215
322
9,216
545,947
RDA
Val
$723.42
$83.49
$7.91
$207.77
$92.51
$19.03
$1,134.14
$9.45
$4.17
APN
960
101
8148
6844
1,329
14596
Total
Val
$6,378.37
$2.66
$483.11
$113.36
$399.28
$462.02
$236.41
$8,075.20
$236.34
$45.76
APN
9,095
46465
63227
283
366
10,545
686,543
Milp
itas
City
Val
$4,045.49
$20.75
$330.55
$1,253.86
$305.66
$142.86
$156.84
$6,256.00
$122.42
$56.07
APN
11,691
348
340
244
62108
146
12,939
648,018
RDA
Val
$1,605.72
$101.59
$1,594.10
$764.41
$117.00
$147.95
$4,330.77
$114.08
$17.71
APN
3,758
16204
130
65165
4,338
182,533
Total
Val
$5,651.21
$20.75
$432.14
$2,847.96
$1,070.06
$259.86
$304.79
$10,586.77
$236.50
$73.78
APN
15,449
348
356
448
192
173
311
17,277
8210,286
Mon
te S
eren
o Total
Val
$1,453.49
$0.85
$34.75
$1,489.09
$3.40
$6.48
APN
1,208
242
1,252
2927
Mor
gan
Hill City
Val
$3,505.13
$12.80
$35.67
$338.59
$197.45
$50.40
$221.77
$4,361.80
$28.96
$36.85
APN
6,858
144
2256
6013
346
7,499
285,133
RDA
Val
$960.82
$12.40
$211.50
$280.90
$229.64
$74.74
$136.50
$1,906.49
$138.19
$12.46
APN
2,734
263
285
167
162
81265
3,957
411,780
Total
Val
$4,465.95
$25.20
$247.17
$619.49
$427.08
$125.13
$358.27
$6,268.29
$167.14
$49.31
APN
9,592
407
307
223
222
94611
11,456
696,913

www.sccassessor.org 25
Mou
ntai
n V
iew
City
Val
$7,045.44
$28.19
$1,954.81
$1,436.20
$787.47
$801.09
$306.63
$12,359.84
$365.14
$76.47
APN
15,181
458
1,513
355
385
344
237
18,473
8210,926
RDA
Val
$97.41
$10.56
$29.27
$1,177.64
$91.21
$496.34
$56.86
$1,959.28
$30.68
$1.45
APN
159
179
2067
8164
12582
2208
Total
Val
$7,142.85
$38.74
$1,984.09
$2,613.84
$878.68
$1,297.43
$363.49
$14,319.12
$395.82
$77.92
APN
15,340
637
1,533
422
466
408
249
19,055
8411,134
Palo
Alt
oTotal
Val
$12,904.14
$0.08
$1,042.00
$2,029.95
$1,097.61
$2,400.76
$764.81
$20,239.35
$1,809.12
$90.52
APN
17,515
7865
213
444
477
611
20,132
232
12,943
San
Jose
City
Val
$74,889.09
$288.50
$8,545.32
$4,102.07
$5,510.13
$2,437.42
$2,234.59
$98,007.12
$3,372.06
$982.14
APN
206,291
5,336
10,127
1,763
2,630
1,602
3,321
231,070
1,190
140,154
RDA
Val
$1,487.62
$37.14
$1,420.93
$6,641.42
$1,235.92
$3,806.26
$1,228.52
$15,857.81
$424.20
$14.95
APN
3,647
769
106
1,090
381
426
366
6,785
562,136
Total
Val
$76,376.71
$325.64
$9,966.25
$10,743.49
$6,746.05
$6,243.68
$3,463.11
$113,864.93
$3,796.26
$997.09
APN
209,938
6,105
10,233
2,853
3,011
2,028
3,687
237,855
1,246
142,290
Sant
a C
laraCity
Val
$8,400.90
$0.14
$2,456.60
$5,172.61
$1,063.78
$1,414.22
$409.94
$18,918.19
$1,678.16
$118.17
APN
24,200
11,987
962
452
232
238
28,072
190
16,889
RDA
Val
$19.19
$241.40
$216.60
$1,399.48
$30.92
$1,907.59
$18.06
$0.00
APN
120
2275
13131
50
Total
Val
$8,400.90
$0.14
$2,475.79
$5,414.01
$1,280.38
$2,813.70
$440.86
$20,825.78
$1,696.22
$118.17
APN
24,200
11,988
982
474
307
251
28,203
195
16,889
Sara
toga
Total
Val
$9,607.54
$0.05
$8.74
$22.99
$119.30
$115.16
$139.27
$10,013.05
$169.96
$56.50
APN
10,491
122
4570
88328
11,045
508,077
Sunn
yval
eCity
Val
$10,978.31
$176.49
$2,771.49
$5,645.65
$988.97
$1,570.86
$274.58
$22,406.34
$253.09
$148.16
APN
26,971
2,389
2,062
676
353
307
203
32,961
118
21,174
RDA
Val
$137.66
$41.91
$237.24
$407.34
$68.84
$892.99
$19.03
$0.97
APN
252
3487
505
428
5138
Total
Val
$11,115.97
$176.49
$2,813.40
$5,645.65
$1,226.21
$1,978.20
$343.42
$23,299.34
$272.12
$149.13
APN
27,223
2,389
2,096
676
440
357
208
33,389
123
21,312
Uni
ncor
pora
ted
City
Val
$10,608.93
$0.94
$139.35
$178.08
$95.34
$26.46
$2,344.81
$13,393.91
$2,936.34
$99.95
APN
20,772
37383
340
221
507,163
28,966
238
14,288
RDA
Val
$1,895
$1,895
$0.00
$0.00
APN
22
00
Total
Val
$10,608.93
$0.94
$139.35
$178.08
$95.34
$26.46
$2,344.82
$13,393.91
$2,936.34
$99.95
APN
20,772
37383
340
221
507,165
28,968
238
14,288
Sant
a C
lara
Cou
nty
Gra
nd T
otal
City
Val
$178,829.14
$544.76
$19,627.56
$21,821.77
$12,406.33
$11,473.45
$8,026.01
$252,729.03
$11,458.68
$1,955.27
APN
397,561
8,969
19,648
5,180
5,603
4,185
14,548
455,694
2,559
279,027
RDA
Val
$5,128.93
$60.17
$1,988.39
$10,147.52
$3,238.24
$6,639.83
$1,699.64
$28,902.72
$768.57
$52.72
APN
11,793
1,212
582
1,752
1,102
898
898
18,237
164
7,537
TOTAL
Val
$183,958.08
$604.93
$21,615.95
$31,969.29
$15,644.57
$18,113.28
$9,725.65
$281,631.75
$12,227.25
$2,007.99
APN
409,354
10,181
20,230
6,932
6,705
5,083
15,446
473,931
2,723
286,564
*Includes other exemptions, excludes homeowner exemption.
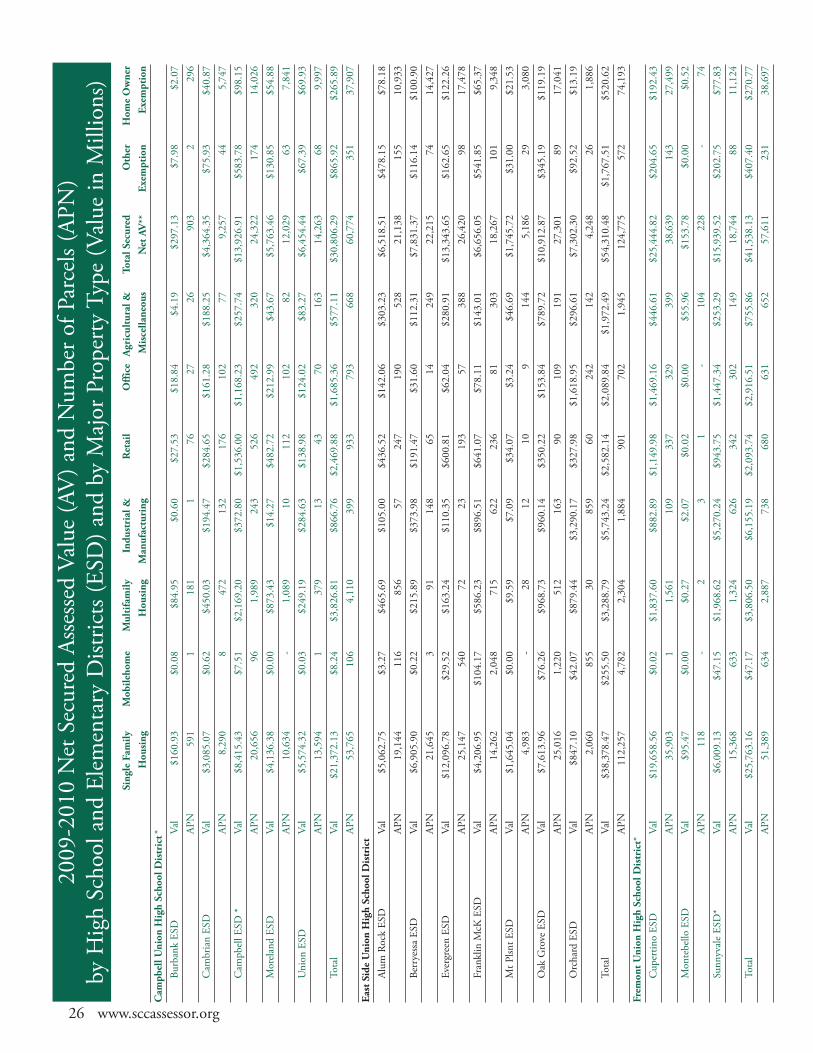
26 www.sccassessor.org
2009-2010 Net Secured Assessed Value (AV) and Number of Parcels (APN)
by High School and Elementary Districts (ESD) and by Major Property Type (Value in Millions)
Sing
le F
amily
M
obile
hom
eM
ulti
fam
ily
Indu
stri
al &
R
etai
lO
ffic
eA
gric
ultu
ral &
To
tal S
ecur
ed
Oth
erH
ome
Ow
ner
Hou
sing
Hou
sing
Man
ufac
turi
ngM
isce
llane
ous
Net
AV
**Ex
empt
ion
Exem
ptio
nC
ampb
ell U
nion
Hig
h Sc
hool
Dis
tric
t*Burbank ESD
Val
$160.93
$0.08
$84.95
$0.60
$27.53
$18.84
$4.19
$297.13
$7.98
$2.07
APN
591
1181
176
2726
903
2296
Cambrian ESD
Val
$3,085.07
$0.62
$450.03
$194.47
$284.65
$161.28
$188.25
$4,364.35
$75.93
$40.87
APN
8,290
8472
132
176
102
779,257
445,747
Campbell ESD *
Val
$8,415.43
$7.51
$2,169.20
$372.80
$1,536.00
$1,168.23
$257.74
$13,926.91
$583.78
$98.15
APN
20,656
961,989
243
526
492
320
24,322
174
14,026
Moreland ESD
Val
$4,136.38
$0.00
$873.43
$14.27
$482.72
$212.99
$43.67
$5,763.46
$130.85
$54.88
APN
10,634
-1,089
10112
102
8212,029
637,841
Union ESD
Val
$5,574.32
$0.03
$249.19
$284.63
$138.98
$124.02
$83.27
$6,454.44
$67.39
$69.93
APN
13,594
1379
1343
70163
14,263
689,997
Total
Val
$21,372.13
$8.24
$3,826.81
$866.76
$2,469.88
$1,685.36
$577.11
$30,806.29
$865.92
$265.89
APN
53,765
106
4,110
399
933
793
668
60,774
351
37,907
East
Sid
e U
nion
Hig
h Sc
hool
Dis
tric
tAlum Rock ESD
Val
$5,062.75
$3.27
$465.69
$105.00
$436.52
$142.06
$303.23
$6,518.51
$478.15
$78.18
APN
19,144
116
856
57247
190
528
21,138
155
10,933
Berryessa ESD
Val
$6,905.90
$0.22
$215.89
$373.98
$191.47
$31.60
$112.31
$7,831.37
$116.14
$100.90
APN
21,645
391
148
6514
249
22,215
7414,427
Evergreen ESD
Val
$12,096.78
$29.52
$163.24
$110.35
$600.81
$62.04
$280.91
$13,343.65
$162.65
$122.26
APN
25,147
540
7223
193
57388
26,420
9817,478
Franklin McK ESD
Val
$4,206.95
$104.17
$586.23
$896.51
$641.07
$78.11
$143.01
$6,656.05
$541.85
$65.37
APN
14,262
2,048
715
622
236
81303
18,267
101
9,348
Mt Plsnt ESD
Val
$1,645.04
$0.00
$9.59
$7.09
$34.07
$3.24
$46.69
$1,745.72
$31.00
$21.53
APN
4,983
-28
1210
9144
5,186
293,080
Oak Grove ESD
Val
$7,613.96
$76.26
$968.73
$960.14
$350.22
$153.84
$789.72
$10,912.87
$345.19
$119.19
APN
25,016
1,220
512
163
90109
191
27,301
8917,041
Orchard ESD
Val
$847.10
$42.07
$879.44
$3,290.17
$327.98
$1,618.95
$296.61
$7,302.30
$92.52
$13.19
APN
2,060
855
30859
60242
142
4,248
261,886
Total
Val
$38,378.47
$255.50
$3,288.79
$5,743.24
$2,582.14
$2,089.84
$1,972.49
$54,310.48
$1,767.51
$520.62
APN
112,257
4,782
2,304
1,884
901
702
1,945
124,775
572
74,193
Frem
ont U
nion
Hig
h Sc
hool
Dis
tric
t*Cupertino ESD
Val
$19,658.56
$0.02
$1,837.60
$882.89
$1,149.98
$1,469.16
$446.61
$25,444.82
$204.65
$192.43
APN
35,903
11,561
109
337
329
399
38,639
143
27,499
Montebello ESD
Val
$95.47
$0.00
$0.27
$2.07
$0.02
$0.00
$55.96
$153.78
$0.00
$0.52
APN
118
-2
31
-104
228
-74
Sunnyvale ESD*
Val
$6,009.13
$47.15
$1,968.62
$5,270.24
$943.75
$1,447.34
$253.29
$15,939.52
$202.75
$77.83
APN
15,368
633
1,324
626
342
302
149
18,744
8811,124
Total
Val
$25,763.16
$47.17
$3,806.50
$6,155.19
$2,093.74
$2,916.51
$755.86
$41,538.13
$407.40
$270.77
APN
51,389
634
2,887
738
680
631
652
57,611
231
38,697

www.sccassessor.org 27
*Basic Aid School Districts** includes other exemptions, excludes homeowner exemption
Gilr
oy U
nifie
d Sc
hool
Dis
tric
tTotal
Val
$4,621.91
$8.86
$320.86
$398.86
$824.42
$96.85
$1,087.47
$7,359.22
$175.51
$54.70
APN
12,138
146
586
240
322
101
2,657
16,190
101
7,820
Los
Gat
os-S
arat
oga
Join
t Uni
on H
igh
Scho
ol D
istr
ict*
Lakeside ESD*
Val
$87.23
$0.00
$0.41
$0.81
$0.00
$0.00
$17.70
$106.15
$1.28
$0.84
APN
171
-1
14-
-119
305
2120
Loma Prieta ESD*
Val
$163.20
$0.00
$2.45
$5.35
$0.00
$0.00
$24.81
$195.81
$0.88
$1.61
APN
325
-3
33-
-232
593
4230
Los Gatos ESD*
Val
$6,736.25
$2.66
$275.35
$93.08
$354.26
$313.93
$274.22
$8,049.76
$204.00
$42.88
APN
8,549
47255
144
221
183
958
10,357
566,133
Saratoga ESD*
Val
$7,444.75
$0.05
$7.98
$11.25
$64.93
$34.90
$212.06
$7,775.93
$159.79
$36.07
APN
6,767
116
3656
29465
7,370
305,157
Total
Val
$14,431.43
$2.71
$286.20
$110.50
$419.19
$348.83
$528.79
$16,127.65
$365.95
$81.40
APN
15,812
48275
227
277
212
1,774
18,625
9211,640
Milp
itas
Uni
fied
Scho
ol D
istr
ict
Total
Val
$5,687.83
$20.72
$378.82
$2,738.75
$1,067.62
$257.95
$379.71
$10,531.40
$223.17
$74.23
APN
15,510
348
355
432
189
172
617
17,623
8110,615
Mor
gan
Hill
Uni
fied
Scho
ol D
istr
ict
Total
Val
$6,987.30
$25.56
$259.60
$826.65
$461.93
$131.79
$1,335.23
$10,028.05
$181.04
$76.18
APN
15,213
423
335
287
264
100
2,928
19,550
9710,752
Mt V
iew
-Los
Alt
os U
nion
Hig
h Sc
hool
Dis
tric
t*Los Altos ESD *
Val
$12,582.10
$0.05
$268.92
$11.28
$379.16
$514.04
$258.70
$14,014.24
$149.79
$72.58
APN
13,577
1142
59248
323
378
14,728
8410,381
Mountain View ESD *
Val
$5,881.13
$38.74
$1,785.26
$2,585.55
$736.40
$1,608.06
$327.11
$12,962.24
$406.21
$65.14
APN
12,848
637
1,431
461
413
390
195
16,375
769,305
Total
Val
$18,463.23
$38.79
$2,054.18
$2,596.82
$1,115.56
$2,122.10
$585.80
$26,976.48
$556.00
$137.72
APN
26,425
638
1,573
520
661
713
573
31,103
160
19,686
Palo
Alt
o U
nifie
d Sc
hool
Dis
tric
t*Total
Val
$15,128.56
$0.08
$1,042.06
$1,954.68
$1,090.28
$2,382.76
$907.98
$22,506.41
$4,650.54
$100.73
APN
19,325
7884
168
438
470
765
22,057
361
14,403
Patt
erso
n Jo
int H
igh
Scho
ol D
istr
ict
Total
Val
$0.41
$0.00
$0.00
$0.00
$0.00
$0.00
$18.93
$19.34
$0.00
$0.11
APN
1-
--
--
428
429
116
Nor
th (
San
Ben
ito)
Cou
nty
Join
t Uni
on S
choo
l Dis
tric
tTotal
Val
$0.00
$0.07
$0.00
$0.00
$0.27
$0.00
$29.81
$30.15
$0.00
$0.05
APN
-1
--
2-
217
220
07
San
Jose
Uni
fied
Hig
h Sc
hool
Dis
tric
tTotal
Val
$23,192.28
$26.64
$3,215.82
$1,160.84
$2,147.68
$2,629.29
$858.06
$33,230.61
$1,183.29
$279.12
APN
59,640
447
4,788
801
1,549
873
1,729
69,827
461
39,895
Sant
a C
lara
Uni
fied
Hig
h Sc
hool
Dis
tric
t*Total
Val
$9,931.36
$170.59
$3,136.32
$9,417.01
$1,371.87
$3,451.99
$688.41
$28,167.54
$1,850.91
$146.47
APN
27,879
2,601
2,133
1,236
489
316
493
35,147
215
20,933
Sant
a C
lara
Cou
nty
Hig
h Sc
hool
Dis
tric
ts G
rand
Total
Val
$183,958.08
$604.93
$21,615.95
$31,969.29
$15,644.57
$18,113.28
$9,725.65
$281,631.75
$12,227.25
$2,007.99
APN
409,354
10,181
20,230
6,932
6,705
5,083
15,446
473,931
2,723
286,564
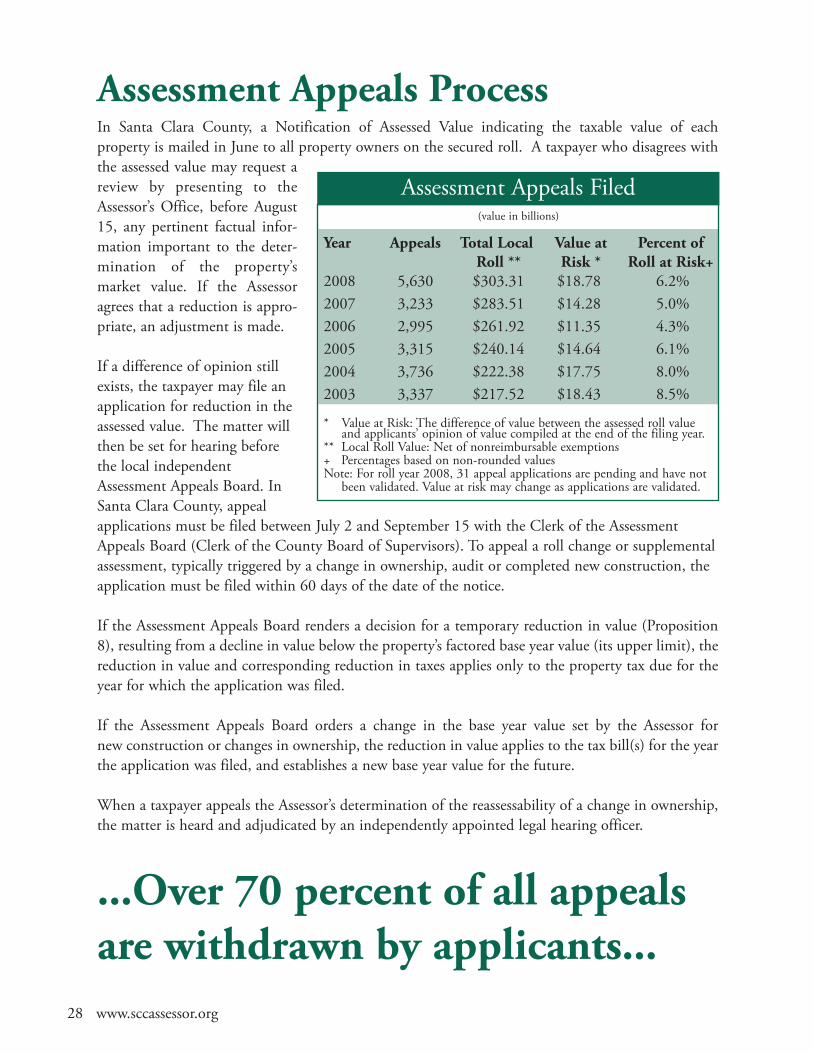
28 www.sccassessor.org
Assessment Appeals ProcessIn Santa Clara County, a Notification of Assessed Value indicating the taxable value of each property is mailed in June to all property owners on the secured roll. A taxpayer who disagrees withthe assessed value may request areview by presenting to theAssessor’s Office, before August15, any pertinent factual infor-mation important to the deter-mination of the property’smarket value. If the Assessoragrees that a reduction is appro-priate, an adjustment is made.
If a difference of opinion stillexists, the taxpayer may file anapplication for reduction in theassessed value. The matter willthen be set for hearing beforethe local independentAssessment Appeals Board. InSanta Clara County, appealapplications must be filed between July 2 and September 15 with the Clerk of the AssessmentAppeals Board (Clerk of the County Board of Supervisors). To appeal a roll change or supplementalassessment, typically triggered by a change in ownership, audit or completed new construction, theapplication must be filed within 60 days of the date of the notice.
If the Assessment Appeals Board renders a decision for a temporary reduction in value (Proposition8), resulting from a decline in value below the property’s factored base year value (its upper limit), thereduction in value and corresponding reduction in taxes applies only to the property tax due for theyear for which the application was filed.
If the Assessment Appeals Board orders a change in the base year value set by the Assessor for new construction or changes in ownership, the reduction in value applies to the tax bill(s) for the yearthe application was filed, and establishes a new base year value for the future.
When a taxpayer appeals the Assessor’s determination of the reassessability of a change in ownership,the matter is heard and adjudicated by an independently appointed legal hearing officer.
...Over 70 percent of all appealsare withdrawn by applicants...
(value in billions)
Assessment Appeals Filed
Year Appeals Total Local Value at Percent ofRoll ** Risk * Roll at Risk+
2008 5,630 $303.31 $18.78 6.2%2007 3,233 $283.51 $14.28 5.0%2006 2,995 $261.92 $11.35 4.3%2005 3,315 $240.14 $14.64 6.1%2004 3,736 $222.38 $17.75 8.0%2003 3,337 $217.52 $18.43 8.5%
* Value at Risk: The difference of value between the assessed roll valueand applicants’ opinion of value compiled at the end of the filing year.
** Local Roll Value: Net of nonreimbursable exemptions+ Percentages based on non-rounded valuesNote: For roll year 2008, 31 appeal applications are pending and have notbeen validated. Value at risk may change as applications are validated.

Assessment Appeals Filed By HomeownersIncreased 170 Percent; Appeals By BusinessProperty Owners Increased 19 PercentIn response to the 2008 financial crisis the number of appeals filed by homeowners (3,199) increased170 percent over the prior year. Appeals filed by business property owners (2,431) also increased, butby only 19 percent reflecting the econo-my’s dramatic slowdown.
The total number of appeals hasincreased 74 percent, and 57 percent ofall appeals are filed by homeowners.Commercial and industrial propertyowners or businesses with personal prop-erty account for 96 percent of the valuein dispute.
Between July 1, 2008, and June 30,2009, 3,379 appeals were resolved. TheAssessment Appeals Board provided anadjustment—an increase or decrease inassessed value—to 912 applicants.Additionally, 97 percent of the Assessor’soriginally enrolled assessed values, dis-puted by appellants, were retained by theAssessment Appeals Board.
www.sccassessor.org 29
Appeals Comparison6,0005,2504,5003,7503,0002,2501,500750
2003 2004 2005 2006 2007 2008Total Appeals (sum of below)
Appeals by owners ofresidential properties
Appeals by all othertaxpayers
3,3373,736 3,315
2,9953,233
Q. Can I transfer my current assessed value to mynew home to avoid paying higher property taxes?
A. Yes, under Proposition 60, if you are age 55or older and qualify. When a senior citizen sellsan existing residence and purchases or constructs a replacement residence valued thesame or less than the residence sold, the Assessorcan transfer the assessment (factored base yearvalue) of the original residence, to the replace-ment residence anywhere in Santa ClaraCounty. Additionally, Santa Clara and six other counties currently participate in Prop90, and will accept base year transfers from any other county throughout California.Propositions 60/90 require timely filing, are subject to approval by the Assessor, and can be granted only once. To receive moreinformation or an application, go towww.sccassessor.org.
Q. I plan to transfer my home to my child; canhe/she retain my same assessment?
A. Yes, upon qualification. The voters ofCalifornia modified the Constitution(Propositions 58 and 193) to allow parents andin some cases grandparents who want to keeptheir home “in the family” to transfer theirassessed value to their children or even grand-children in certain circumstances. Tax relief isprovided when real property transfers occurbetween parents and their children (Proposition58) or from grandparents to grandchildren(Proposition 193) if the parents are no longerliving. Interested taxpayers should contact the Assessor to receive more information and an application. All claims must be filed timely and are subject to final approval by theAssessor. Visit the Assessor’s website for moreinformation.
Frequently Asked Questions
5,630
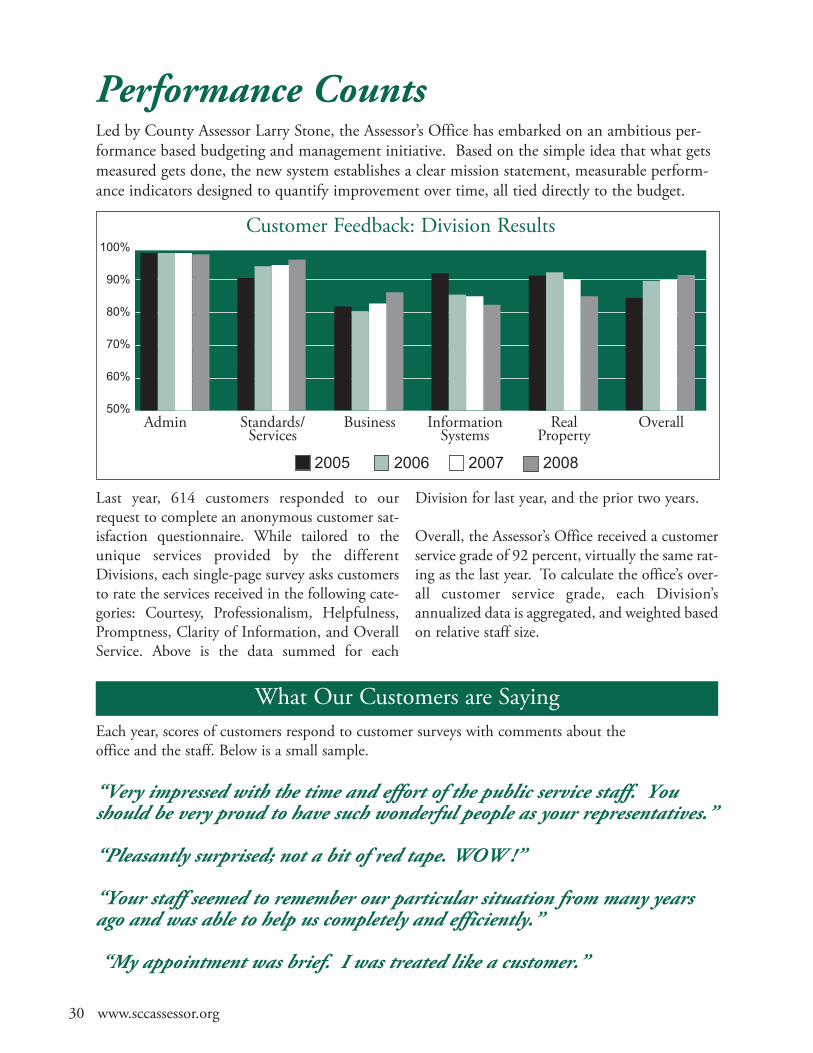
30 www.sccassessor.org
Performance CountsLed by County Assessor Larry Stone, the Assessor’s Office has embarked on an ambitious per-formance based budgeting and management initiative. Based on the simple idea that what getsmeasured gets done, the new system establishes a clear mission statement, measurable perform-ance indicators designed to quantify improvement over time, all tied directly to the budget.
Last year, 614 customers responded to ourrequest to complete an anonymous customer sat-isfaction questionnaire. While tailored to theunique services provided by the differentDivisions, each single-page survey asks customersto rate the services received in the following cate-gories: Courtesy, Professionalism, Helpfulness,Promptness, Clarity of Information, and OverallService. Above is the data summed for each
Division for last year, and the prior two years.
Overall, the Assessor’s Office received a customerservice grade of 92 percent, virtually the same rat-ing as the last year. To calculate the office’s over-all customer service grade, each Division’sannualized data is aggregated, and weighted basedon relative staff size.
What Our Customers are SayingEach year, scores of customers respond to customer surveys with comments about the office and the staff. Below is a small sample.
“Very impressed with the time and effort of the public service staff. Youshould be very proud to have such wonderful people as your representatives.”
“Pleasantly surprised; not a bit of red tape. WOW !”
“Your staff seemed to remember our particular situation from many yearsago and was able to help us completely and efficiently.”
“My appointment was brief. I was treated like a customer.”
Customer Feedback: Division Results100%
90%
80%
70%
60%
50%
2005 2006 2007 2008
Admin Standards/Services
InformationSystems
RealProperty
Business Overall

www.sccassessor.org 31
2008-2009 Performance Measures
More of What Our Customers are Saying
The following are the Assessor’s comprehensive performance measures. By reporting high-level quan-titative and qualitative data that tracks levels of customer satisfaction, timeliness of product delivery,accuracy of assessments and overall financial efficiency, these measures allow the Assessor to identifyand record service levels from year to year, which are designed to achieve specific continuous improve-ment objectives. The data is compiled from the results of similar, more detailed measures in eachDivision of the Assessor’s Office. The performance measures in each Division were developed in col-laboration with both line staff and managers.
1. 95.7% of assessments were completed by July1, 2008.
Why is this important? The assessment roll is thebasis by which property taxes are levied. Thecompleteness of the assessment roll assures publicagencies dependent upon property tax revenuethat the roll accurately reflects current marketactivity.
2. 172 is the average number of days to deliver supplemental assessments to the Tax Collector.
Why is this important? Supplemental assessmentsoccur upon a “change in ownership” or “new con-struction” of real property. This performancemeasure insures timely notification to those prop-erty owners who acquire or complete new con-struction of their property.
3. 99.6% of assigned and mandatory auditswere completed by June 30, 2008.
Why is this important? State statute requires anaudit of a significant number of businesses at leastonce every four years. This performance meas-ure determines the timeliness of conducting thesemandatory audits.
4. 414 is the average number of days to close anassessment appeal.
Why is this important? By statute, assessmentappeals must be resolved within two years of fil-ing, unless a waiver is executed by the taxpayer.This performance measure insures a timely equal-ization of assessments for property owners.
5. Department’s customer satisfaction rating from surveys is 92.0%.
Why is this important? This outcome measurerates the satisfaction level of both our internaland external customers who rely on the Assessorfor timely service and accurate information.
6. The Cost Efficiency Index is 77.Why is this important? The Cost Efficiency Indexdetermines the cost efficiency of producing aproduct and/or work item compared to prior base year cost. As the measure does notaccount for inflation, a new, more accurate meas-ure is being developed.
7. Total expenditures were 99% of the budget in FY 2008.
Why is this important? The budget/cost ratiocompares the department’s actual bottom lineexpenditures at the end of the fiscal year to thebudget to insure that costs do not exceed antici-pated resources.
“The person I spoke with on the telephone was courteous, pleasant and helpful. I had the proper forms in my mail the next day. I can't ask for better than that.”
“The appraiser quickly grasped the problem and resolved the issue.”
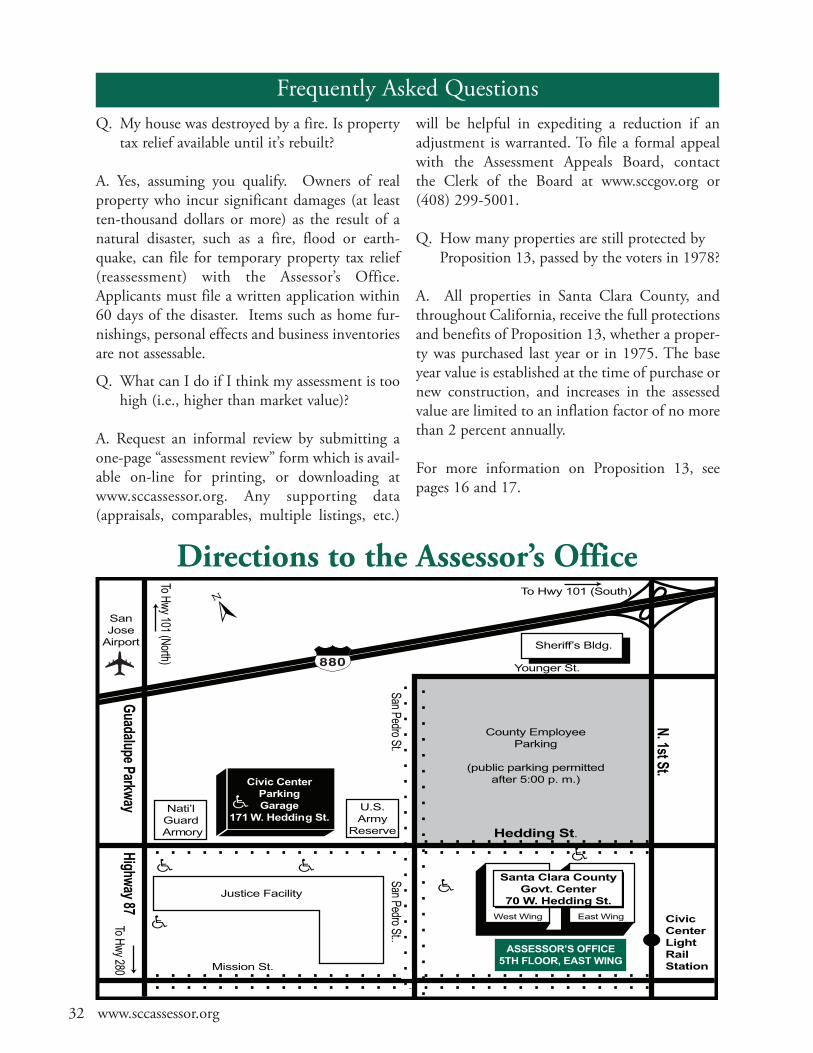
32 www.sccassessor.org
Frequently Asked QuestionsQ. My house was destroyed by a fire. Is property
tax relief available until it’s rebuilt?
A. Yes, assuming you qualify. Owners of realproperty who incur significant damages (at leastten-thousand dollars or more) as the result of anatural disaster, such as a fire, flood or earth-quake, can file for temporary property tax relief(reassessment) with the Assessor’s Office.Applicants must file a written application within60 days of the disaster. Items such as home fur-nishings, personal effects and business inventoriesare not assessable.
Q. What can I do if I think my assessment is toohigh (i.e., higher than market value)?
A. Request an informal review by submitting aone-page “assessment review” form which is avail-able on-line for printing, or downloading atwww.sccassessor.org. Any supporting data(appraisals, comparables, multiple listings, etc.)
will be helpful in expediting a reduction if anadjustment is warranted. To file a formal appealwith the Assessment Appeals Board, contact the Clerk of the Board at www.sccgov.org or (408) 299-5001.
Q. How many properties are still protected by Proposition 13, passed by the voters in 1978?
A. All properties in Santa Clara County, andthroughout California, receive the full protectionsand benefits of Proposition 13, whether a proper-ty was purchased last year or in 1975. The baseyear value is established at the time of purchase ornew construction, and increases in the assessedvalue are limited to an inflation factor of no morethan 2 percent annually.
For more information on Proposition 13, seepages 16 and 17.
To Hwy 101 (South)
To Hwy 101 (North)
Younger St.
Sheriff’s Bldg.
County EmployeeParking
(public parking permittedafter 5:00 p. m.)
Hedding St.
N. 1st St.
San Pedro St.San Pedro St..
To Hwy 280 Mission St.
West Wing East Wing CivicCenterLightRailStation
ASSESSOR’S OFFICE5TH FLOOR, EAST WING
Guadalupe Parkw
ay Highway 87
Nati’lGuard
Armory
U.S.Army
Reserve
Civic CenterParkingGarage
171 W. Hedding St.
Justice Facility
Santa Clara CountyGovt. Center
70 W. Hedding St.
SanJose
Airport
[880
Directions to the Assessor’s Office

www.sccassessor.org 33
Explanation of Terms*Ad Valorem Property Tax
Assessed Value
Assessee
Assessment Appeal
Assessment Appeals Board
Assessment Roll
Assessment Roll Year
Base Year (Value)
Basic Aid
Business Personal Property
Change in Ownership
CPI
Escaped Assessments
Exclusions from Reappraisal
Exemption
Taxes imposed on the basis of the property’s value.
The taxable value of a property against which the tax rate is applied.
The person to whom the property is being assessed.
The assessee may file an appeal for reduction of the assessed value on the current local rollduring the regular filing period for that year, between July 2 and September 15 with theClerk of the Board. For supplemental or escape assessments, appeals must be filed within 60days of the mailing of the date of the notice.
A three-member panel appointed by the Board of Supervisors, operating under state law, toreview and adjust assessments upon request of a taxpayer or his or her agent. (See “assess-ment appeal”)
The official list of all property within the county assessed by the Assessor.
The year following the annual lien date and the regular assessment of property beginning onJuly 1.
The 1975-76 regular roll value serves as the original base value. Thereafter, changes to theassessment on real property value, or a portion thereof, caused by new construction orchanges in ownership create the base year value used in establishing the full cash value ofsuch real property.
“Basic aid” school districts rely principally on locally derived property tax revenues to fundschool operations, rather than on Statewide reallocation formulas based on average dailyattendance and other factors. School districts become “basic aid” when the projected level ofrevenues provided by local property taxes exceeds the state formula.
Business personal property is assessable, and includes computers, supplies, office furnitureand equipment, tooling, machinery and equipment. Most business inventory is exempt. (Seepersonal property)
When a transfer of ownership in Real Property occurs, the Assessor determines if a reap-praisal is required under state law. If required, the reappraised value becomes the new basevalue of the property transferred, and a supplemental assessment is enrolled.
Consumer Price Index as determined annually by the California Bureau of Labor Statistics.
When property that should have been assessed in a prior year is belatedly discovered andassessed, it is referred to as an “escape assessment” because it is an assessment that leviedoutside the normal assessment period for the lien date(s) in question.
Some changes in ownership may be excluded from reappraisal if a timely claim is filed withthe Assessor’s Office that meets the qualifications. Examples include the transfer of real prop-erty between parents and children or senior citizens over age 55 who replace their principalresidence.
Allowance of a deduction from the taxable assessed value of the property as prescribed bylaw.
*Explanation of terms are provided to simplify assessment terminology, but do not replace legal definitions.

34 www.sccassessor.org
Exemptions: Homeowners
Exemptions: Other
Factored Base Year Value
Fiscal Year
Fixture
Full Cash Value (FCV)
Improvements
Lien
Lien Date
Mobilehomes
New Base Year (Value)
New Construction
Parcel
Personal Property
Possessory Interest (PI)
People who own and occupy a dwelling on the lien date as their principal place of resi-dence are eligible to receive an exemption of up to $7,000 of the dwelling’s taxable value.The tax dollars reduced by the homeowner’s exemption (HOX) are reimbursed to theCounty by the State of California.
Charitable, hospital, religious or scientific organizations, colleges, cemeteries, museums,and disabled Veterans (for 100%, service-connected disabled Veterans) are eligible forexemption.
A property’s base value is adjusted each year by the change in the California ConsumerPrice Index (CPI), not to exceed 2 percent. The factored base value is the upper limit oftaxable value each year.
The period beginning July 1 and ending June 30.
An improvement to real property whose purpose directly applies to or augments theprocess or function of a trade, industry or profession.
The amount of cash or its equivalent value which property would bring if exposed forsale in the open market and as further defined in Revenue and Taxation Code 110.1.
Buildings or structures generally attached to the land. Improvements may also includecertain business fixtures.
The amount owed and created by the assessment of the property, or the amount leviedagainst property by a taxing agency or revenue district.
The time when taxes for any fiscal year become a lien on property; and the time as ofwhich property is valued for tax purposes. The lien date for California property is 12:01a.m. on January 1 (effective January 1, 1997) preceding the fiscal year for which the taxesare collected. The lien date for years prior to 1997 was March 1.
On July 1, 1980, the Department of Motor Vehicles transferred all mobilehome licens-ing and registration to the California Department of Housing and CommunityDevelopment (HCD). The law requires that mobilehomes be classified as personal prop-erty and enrolled on the secured roll.
The full cash value of property on the date it changes ownership or when new construc-tion is completed.
The construction of new buildings, additions to existing buildings, or alterations whichconvert the property to another use or extends the economic life of the improvement, isreassessed, establishing a new base year value for only that portion of the property.
Real property assessment unit. Land that is segregated into units by boundary lines forassessment purposes.
Any property except real estate, including airplanes, boats, and business property such ascomputers, supplies, furniture, machinery and equipment. Most business inventory,household furnishings, personal effects, and pets are exempt from taxation.
The possession or the right to possession of real estate whose fee title is held by a taxexempt public agency. Examples of a PI include the exclusive right to use public prop-erty at an airport such as a car rental company’s service counter or a concession stand atthe county fair. In both cases, the vendors are subject to property taxes. Regardless ofthe type of document evidencing the right to possession, a taxable PI exists whenever aprivate party has the exclusive right to a beneficial use of tax exempt publicly ownedreal property.
www.sccassessor.org 35
Proposition 13
Proposition 8
Real Property
Roll
Roll Unit
Roll Year
SBE
Secured Roll
Special Assessments
State Board of Equalization
Supplemental Assessment
Supplemental Roll
Tax Rates
Tax Roll
TRA
Transfer
Unsecured Roll
Passed by California voters in June, 1978, Proposition 13 is a Constitutional amendmentthat limits the taxation of property and creates a procedure for establishing the currenttaxable value of locally assessed real property, referencing a base year full cash value.
Passed by California voters in November 1978, Proposition 8 requires the temporaryreduction in the assessed value when there is a decline in market value below the proper-ty’s factored base year value.
Land and improvements to the land, which permits the possession of, claim to, ownershipof, or right to possess.
A listing of all assessed property within the county. It identifies property, the owner, andthe assessed value of the property.
A parcel of property or a business personal property account that is assessed for annualvaluation.
See “Assessment Roll Year.”
See “State Board of Equalization.”
Property on which the property taxes are a lien against the real estate.
Direct charges or flat fees against property which are included in the total tax bill but arenot based upon the Assessor’s valuation of the property. Examples are a sewer charge or aschool parcel tax.
The Board consists of four members elected by California voters by district, and the StateController whose duties in the field of taxation are imposed by the State Constitution andthe Legislature. The Board regulates county assessment practices and administers a varietyof state and local business tax programs.
When property is assessed due to a change in ownership or completed new construction,a supplemental assessment is issued. This is separate and in addition to the annual regu-lar assessment roll. It is based on the net difference between the previous assessed valuesand the new value for the remainder of the assessment year(s).
The roll, prepared or amended, contains properties in which a change in ownership orcompleted new construction occurred.
The maximum ad valorem (on the value) basic property tax rate is 1 percent of the nettaxable value of the property. The total tax rate may be higher for various propertiesbecause of voter-approved general obligation bonds that are secured by property taxes forthe annual payment of principle and interest.
The official list of property subject to property tax, together with the amount of assessedvalue and the amount of taxes due, as applied and extended by the Auditor/Controller.
The tax rate area (TRA) is a specific geographic area all of which is within the jurisdictionof the same combination of local agencies for the current fiscal year. For the 2008-09 FYthere are 807 TRAs in Santa Clara County, each one identified by a unique number.
Change in the ownership of, or change in the manner which, property is held. Dependingon the specific situation, a transfer may trigger a reassessment of the property.
Property on which the property taxes are not a lien against the real estate (real property)where they are situated, including personal property or improvements located on leasedland.

36 www.sccassessor.org
January 1 Lien Date for next assessment roll year. This is the time when taxes for the next fiscal year become a lien on the property.
February 15 Deadline to file all exemption claims.
April 1 Due date for filing statements for business personal property, aircraft and boats.Business property owners must file a property statement each year detailing thecost of all supplies, machinery, equipment, leasehold improvements, fixtures andland owned at each location within Santa Clara County.
April 10 Last day to pay second installment of secured property taxes without penalty. This tax payment is based on property values determined for the January lien date 15 months earlier.
End of June Annual mailing of assessment notices to all Santa Clara County property ownerson the secured roll stating the taxable value of the property. Owners who disagreewith the Assessor’s valuation are encouraged to contact us, via the website, priorto August 15 to request a review. Please provide any pertinent factual informationconcerning the market value of the property with the request. If the Assessoragrees that a reduction is appropriate, a new assessed value will be enrolled.
May 7 Last day to file a business personal property statement without incurring a 10 percent penalty.
July 1 Close of assessment roll and the start of the new assessment roll year. The assessment roll is the official list of all assessable property within the County.
July 2 First day to file assessment appeal application with the Clerk of the Board ofSupervisors.
August 31 Last day to pay unsecured property taxes without penalty.
September 15 Last day to file an assessment appeal application for reduced assessment on the regular roll with the Clerk of the Board of Supervisors.
December 10 Last day to pay first installment of secured property taxes without penalty.
January 1 Lien date for next assessment roll year.
Property Assessment Calendar

Responsibility of the Assessor’s OfficeThe Assessor has the responsibility to locate all taxableproperty in the County, identify ownership, establish avalue for all property subject to local property taxation, listthe value of all property on the assessment roll, and applyall legal exemptions. The Santa Clara County Assessor doesnot compute property tax bills, collect property taxes,establish property tax laws, establish rules by which proper-ty is assessed, or set property tax rates.
Santa Clara County contains more than 460,000 separatereal property parcels. There were just under 3,000 changesin parcel numbers, and there were over 75,000 changes inproperty ownership as reflected by deeds and maps filed inthe County Recorder’s Office. The Assessor’s professionalstaff maintains a comprehensive set of 214 Assessor’s parcelmap books. The office appraised more than 8,000 parcelswith new construction activities, and processed more than93,000 business personal property assessments.
The assessments allow the County of Santa Clara and 204 local government taxing authorities to set tax rates (as limited by Proposition 13 and other laws), collect and allocate property tax revenue which supports essential public services provided by the County, localschools, cities, and special districts.
For information regarding general County financialinformation including taxes by tax rate areas and methods of property tax revenue allocation contact:Santa Clara County Finance Agency (408) 299-5200
For information about Santa Clara County Assessments:Public Information and Ownership (408) 299-5500Real Property (land and improvements) (408) 299-5300Personal Property, including Business, Mobilehomes, Boats and Airplanes (408) 299-5400Property Tax Exemptions (408) 299-6460Change in Ownership Issues (408) 299-5540Mapping (408) 299-5550Administration (408) 299-5570Administration Fax (408) 297-9526Assessor Web site www.sccassessor.orgCounty Web site www.sccgov.org
For information about a tax bill, payments, delinquency,or the phone number of the appropriate agency to con-tact about a special assessment, contact:Santa Clara County Tax Collector (408) 808-7900
For information about filing assessment appeals, call:Santa Clara County Assessment Appeals Board Clerk(Clerk of the Board of Supervisors) (408) 299-5001
For information about Recording documents, call:Santa Clara County Clerk/Recorder (408) 299-2481
California State Board of EqualizationThe State Board of Equalization is responsible for assuring that county property tax assessment practicesare equal and uniform throughout the state. For moreinformation, contact the State Board at:
450 N StreetPO Box 942879Sacramento, CA 94279-0001
For general tax information call (800) 400-7115 orwww.boe.ca.gov
AcknowledgmentsEditor: David K. Ginsborg, Deputy to the AssessorAssistance provided by Gabe Rodriguez and the staff of theSanta Clara County Assessor’s OfficeLayout Production: KurigraphicsPrinted by GSA Printing ServicesPhotographs provided by Bordon Chin, San Jose Airport andConvention & Visitors Bureau
¿No habla ingles? La Oficina del Tasador tiene empleados que hablan español. Llámenos al (408) 299-5500
Disclaimer: This document presents a distribution of the 2009-2010 Santa Clara County property tax local assessment roll by City/RedevelopmentAgency and major property types. It does not include state-assessed property (unitary roll). It is not the source document for deriving the property tax revenues to be received by any public entity. For example, the Controller’s AB8 calculations do not include aircraft assessed valuation, which isincorporated into this report. Numbers reported in tables and charts reflect up to 0.01 units. Items less than 0.01 units have been reported as a dash.Minor discrepancies may occur due to rounding calculations and/or clarification in definition of terms.Published August, 2009.
www.sccassessor.org 37
Office of the C
ounty Assessor
Lawrence E. Stone, Assessor
County of Santa C
lara Governm
ent Center
70 West H
edding Street, 5th Floor, East Wing
San Jose, California 95110-1771
Website: w
ww.sccassessor.org
Santa Clara C
ountyB
oard of SupervisorsDon G
age, District I
George Shirakaw
a, District II
Dave C
ortese, District III
Ken Yeager, D
istrict IVLiz K
niss, District V
County Executive
Jeffrey V. Smith
Mission Statem
entThe m
ission of the Santa Clara C
ounty Assessor’s O
ffice is to produce an annual assessm
ent roll including all assessable property in accordance w
ith legal mandates
in a timely, accurate, and efficient m
anner; and provide current assessm
ent-related inform
ation to the public and to governm
ental agencies in a timely
and responsive way.
Please e-mail us at assessor@
asr.sccgov.org if your address has changedPrinted on recycled paper w
ith soy based inks2199
PRSRT
STD
U.S. PostagePAID
Permit # 1406
San Jose, CA
Questions?
We have answ
ers. Go to
ww
w.sccassessor.orgfor m
ore information