annual report 2006 challenging tasks. clear goals. · 7 two strong pillars, one group. 8...
TRANSCRIPT
Annual Report 2006Challenging tasks. Clear goals.
B
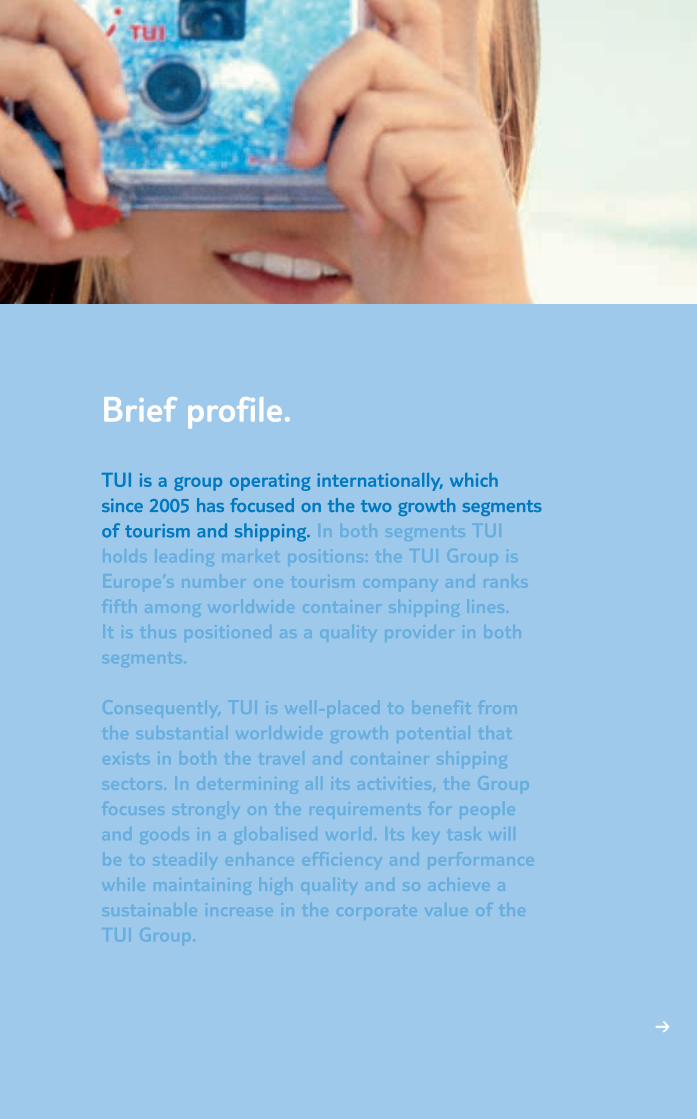
Brief profile.
TUI is a group operating internationally, which since 2005 has focused on the two growth segmentsof tourism and shipping. In both segments TUIholds leading market positions: the TUI Group isEurope’s number one tourism company and ranksfifth among worldwide container shipping lines.It is thus positioned as a quality provider in bothsegments.
Consequently, TUI is well-placed to benefit fromthe substantial worldwide growth potential thatexists in both the travel and container shippingsectors. In determining all its activities, the Groupfocuses strongly on the requirements for peopleand goods in a globalised world. Its key task willbe to steadily enhance efficiency and performancewhile maintaining high quality and so achieve asustainable increase in the corporate value of theTUI Group.
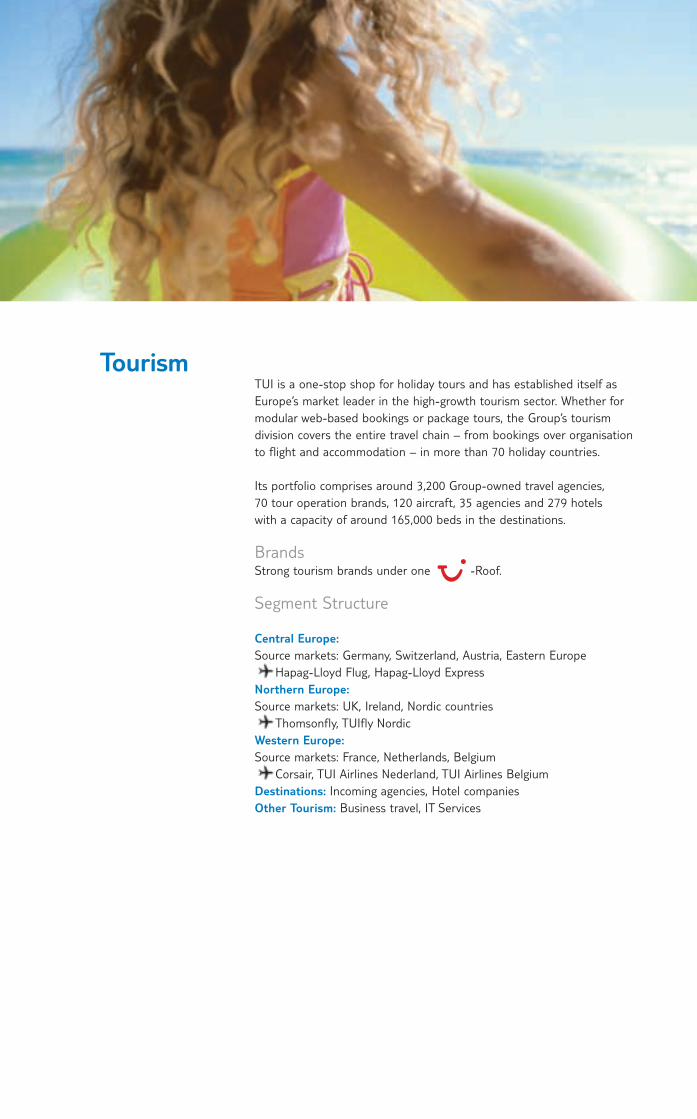
TourismTUI is a one-stop shop for holiday tours and has established itself asEurope’s market leader in the high-growth tourism sector. Whether formodular web-based bookings or package tours, the Group’s tourism division covers the entire travel chain – from bookings over organisation to flight and accommodation – in more than 70 holiday countries.
Its portfolio comprises around 3,200 Group-owned travel agencies, 70 tour operation brands, 120 aircraft, 35 agencies and 279 hotels with a capacity of around 165,000 beds in the destinations.
BrandsStrong tourism brands under one -Roof.
Segment Structure
Central Europe:Source markets: Germany, Switzerland, Austria, Eastern Europe
Hapag-Lloyd Flug, Hapag-Lloyd ExpressNorthern Europe:Source markets: UK, Ireland, Nordic countries
Thomsonfly, TUIfly NordicWestern Europe:Source markets: France, Netherlands, Belgium
Corsair, TUI Airlines Nederland, TUI Airlines BelgiumDestinations: Incoming agencies, Hotel companiesOther Tourism: Business travel, IT Services
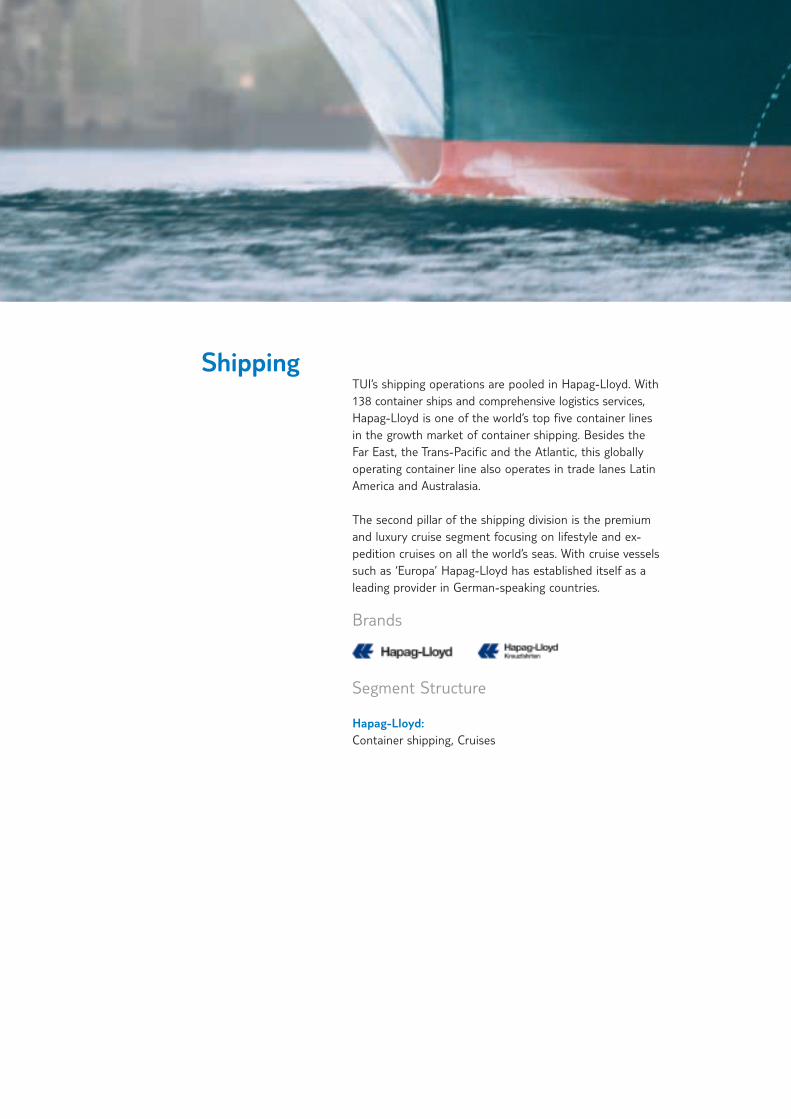
ShippingTUI’s shipping operations are pooled in Hapag-Lloyd. With 138 container ships and comprehensive logistics services,Hapag-Lloyd is one of the world’s top five container lines in the growth market of container shipping. Besides the Far East, the Trans-Pacific and the Atlantic, this globallyoperating container line also operates in trade lanes Latin America and Australasia.
The second pillar of the shipping division is the premium and luxury cruise segment focusing on lifestyle and ex-pedition cruises on all the world’s seas. With cruise vessels such as ‘Europa’ Hapag-Lloyd has established itself as a leading provider in German-speaking countries.
Brands
Segment Structure
Hapag-Lloyd:Container shipping, Cruises
1
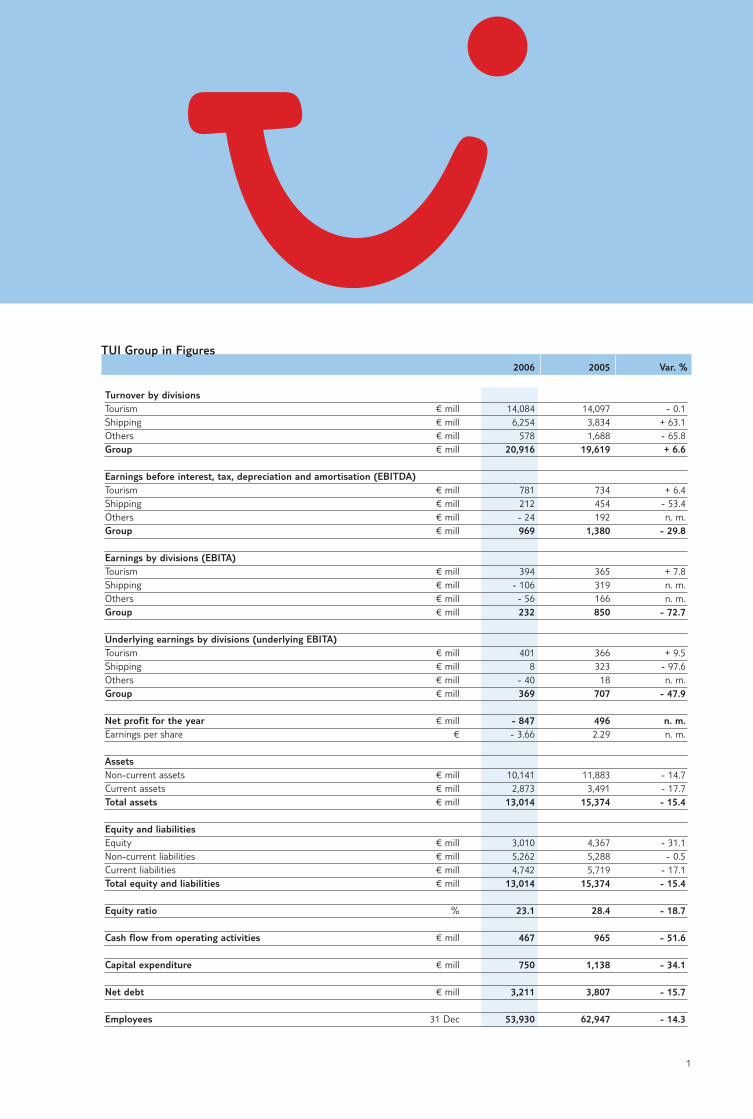
TUI Group in Figures2006 2005 Var. %
Turnover by divisionsTourism € mill 14,084 14,097 - 0.1Shipping € mill 6,254 3,834 + 63.1Others € mill 578 1,688 - 65.8Group € mill 20,916 19,619 + 6.6
Earnings before interest, tax, depreciation and amortisation (EBITDA)Tourism € mill 781 734 + 6.4Shipping € mill 212 454 - 53.4Others € mill - 24 192 n. m.Group € mill 969 1,380 - 29.8
Earnings by divisions (EBITA)Tourism € mill 394 365 + 7.8Shipping € mill - 106 319 n. m.Others € mill - 56 166 n. m.Group € mill 232 850 - 72.7
Underlying earnings by divisions (underlying EBITA)Tourism € mill 401 366 + 9.5Shipping € mill 8 323 - 97.6Others € mill - 40 18 n. m.Group € mill 369 707 - 47.9
Net profit for the year € mill - 847 496 n. m.Earnings per share € - 3.66 2.29 n. m.
AssetsNon-current assets € mill 10,141 11,883 - 14.7Current assets € mill 2,873 3,491 - 17.7Total assets € mill 13,014 15,374 - 15.4
Equity and liabilitiesEquity € mill 3,010 4,367 - 31.1Non-current liabilities € mill 5,262 5,288 - 0.5Current liabilities € mill 4,742 5,719 - 17.1Total equity and liabilities € mill 13,014 15,374 - 15.4
Equity ratio % 23.1 28.4 - 18.7
Cash flow from operating activities € mill 467 965 - 51.6
Capital expenditure € mill 750 1,138 - 34.1
Net debt € mill 3,211 3,807 - 15.7
Employees 31 Dec 53,930 62,947 - 14.3
2
4 To our Shareholders
4 Letter to our Shareholders7 Two strong pillars, one Group.8 Challenging tasks. Clear goals.
22 Management Report
24 Business and Operating Environment34 Group Turnover and Earnings40 Tourism54 Shipping61 Discontinuing Operations 62 Earnings 67 Net Assets72 Financial Position82 Report on Subsequent Events83 Risk Report 90 Remuneration Report 95 Research and Development97 Human Resources99 Environmental Protection
101 Report on Expected Developments
3
106 Corporate Governance
108 Corporate Governance Report112 Report of the Supervisory Board 118 Supervisory Board121 Executive Board123 TUI Share127 TUI Group in Figures128 Sustainable Development
134 Financial Statements
136 Consolidated Profit and Loss Statement137 Consolidated Balance Sheet138 Statement of Recognised Income and
Expenses138 Cash Flow Statement
139 Notes
139 Notes on the Principles and Methods158 Segment Reporting167 Notes on the Consolidated Profit
and Loss Statement180 Notes on the Consolidated Balance Sheet216 Major Shareholdings217 Notes on the Cash Flow Statement219 Other Notes
5
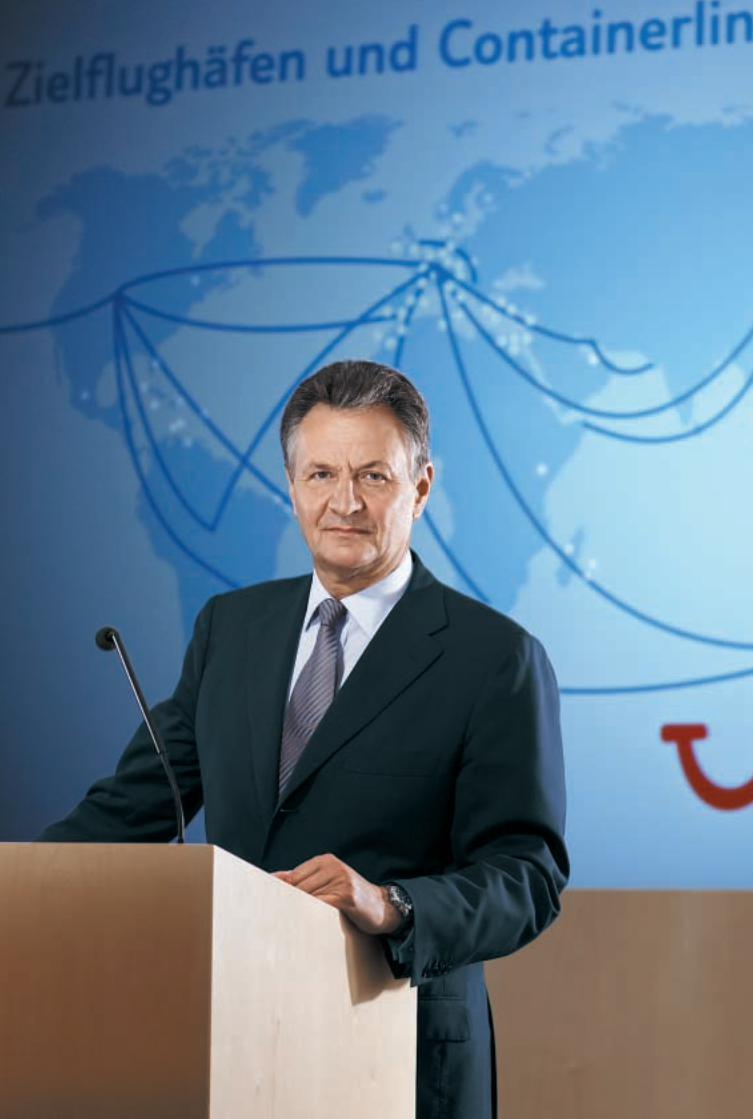
Letter to our Shareholders
Dr. Michael Frenzel,
Chairman of the Executive Board
Dear Shareholders,
in the 2006 financial year, the tourism division was able to increase itsoperating earnings in spite of difficult conditions in some markets. How-ever, cost increases and changes in market structures prevented us frommeeting our targets for the tourism division, so that some goodwill itemswere revalued. In container shipping, earnings were impacted by capacitygrowth and cost increases, accompanied by high one-off costs for theintegration of CP Ships. This resulted in a negative group result for the2006 financial year. The overall result is totally unsatisfactory and doesnot permit payment of a dividend.
Nevertheless TUI has set out on the right path. The accumulation ofnegative factors in the 2006 financial year was a unique phenomenon,and we expect to see significant growth in earnings and resume dividendpayments again in 2007.
In the tourism division, we continue to be Europe’s number one, both inturnover and customer volume terms but also in terms of absolute earn-ings generated. We hold this leadership position because we are earlymovers, quickly responding to market trends and adopting a pro-activeapproach with our own innovative products. Accordingly, as in the threeprevious years, our earnings growth from tourism operations again out-performed turnover growth in 2006.
We expect this trend to continue in the future. A major step in this direc-tion has been taken with the launch of TUIfly.com. In combining the ope-rations of our previous two German airlines, we are pooling our forces,enlarging our product portfolio and optimising our structures. Moreover,we will expand TUIfly.com into a European distribution platform whichmay be used to book other travel modules, as well as a comprehensiverange of flight connections. This will enhance our presence and relevancefor customers in two tourism segments characterised by particularlydynamic growth: low-cost flight operations and modular tours.
Our cruise business is also characterised by strong growth. TUI success-fully participates in this trend with clearly positioned products for theGerman and British markets. In order to achieve a further expansion ofour product portfolio, we are buying into the German activities of worldmarket leader Carnival Cruise Corporation, the ‘Aida’. We will develop anindependent TUI product to attract new customers in the high-volumepremium market.
6
Besides selective activities in the new growth segments, we are also expanding ourcore business. Organised tours offered by tour operators form the core of our tourismbusiness. Product innovation and product quality secure our competitive edge.Strict control and reduction of production costs ensure the profitability and viabilityof our products. This is another area in which we took decisions in 2006 and wheresome of these have already been implemented. Overall, our costs will be reducedby € 250 million by 2008.
Two key factors strongly characterised the business trend in shipping in 2006: costincreases and declining freight rates in the market, and high one-off costs for theintegration of the operations of CP Ships into Hapag-Lloyd’s organisation. Earningscame under substantial pressure due to the combination of these two factors.
However, the integration process marked an enormous achievement. What is more,it was already completed in 2006, i.e. earlier than originally planned. Our materialexpectations were also surpassed. Full synergies of € 220 million will be achieved asof 2008: € 40 million more than planned. The one-off integration costs of around € 114 million in 2006 will not recur in 2007. Our position as one of the world’s fivebiggest container lines, together with having the leading productivity per employeein the industry, form the healthy basis for a fast and sustainable improvement ofour earnings position in the shipping division.
The Group also achieved structural improvements in 2006, which will have a positiveeffect in subsequent years. Net debt was reduced by around € 600 million year-on-year.
Overall, the TUI Group forged ahead to boost its earnings power. We will consistentlyfollow this path in 2007. We expect to generate substantial earnings growth thanksto the implementation of our decisions and the absence of one-off costs. This willbe required in order to achieve an appropriate return on capital employed. And anappropriate return is imperative for our Group’s long-term success, our top-priority.
In order to further enhance our return on invested capital, we will increase our earningsand reduce our invested capital. To this end, we have identified assets of aroundone billion euros which will be released. We will reduce our invested capital by thisamount and thus not only boost our profitability but also further reduce our debt.
In 2006, our employees were highly committed and produced an excellent perfor-mance in a difficult environment. We would like to extend a vote of thanks to ouremployees for their dedication. We are convinced, that we will achieve our futureobjectives given our strongly motivated workforce.
TUI plays a prominent role in two global growth markets – tourism and shipping.With marketable products, optimised cost structures and employees who are service-oriented and highly committed, we are well positioned to face the challenges of thefuture. We have set out on the right path with our programmes and initiatives toenhance our profitability. Given this constellation, we are a good choice offeringpositive prospects to our customers and shareholders alike.
Yours sincerely,
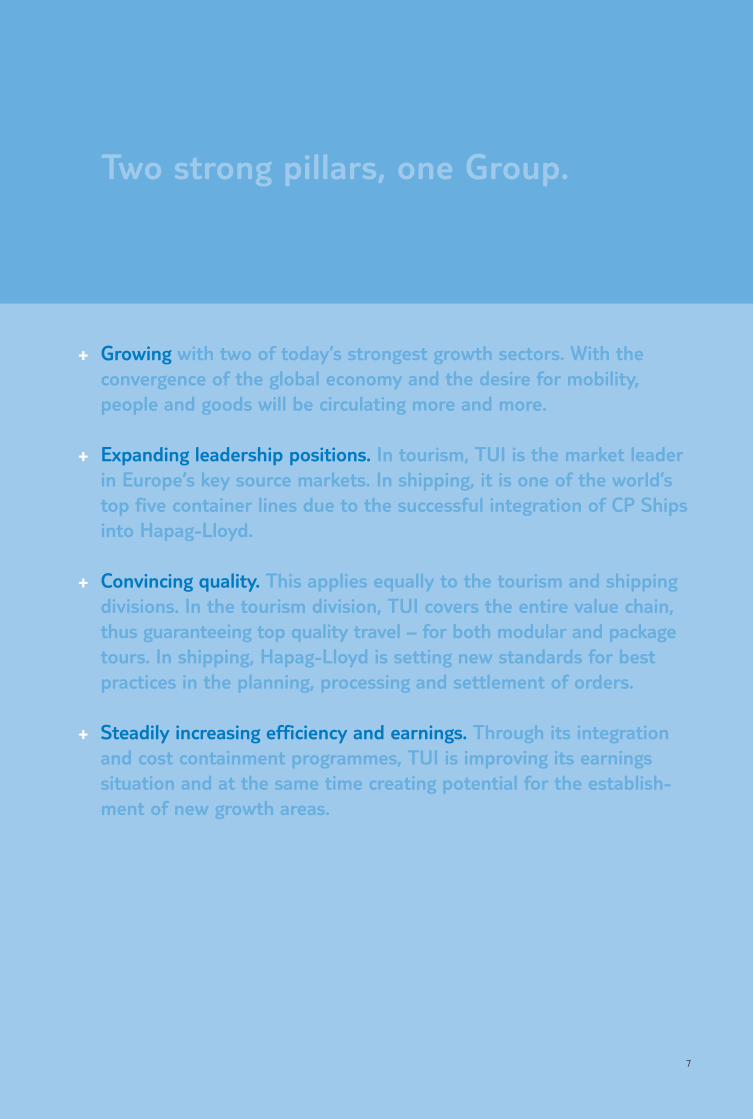
+ Growing with two of today’s strongest growth sectors. With the convergence of the global economy and the desire for mobility, people and goods will be circulating more and more.
+ Expanding leadership positions. In tourism, TUI is the market leaderin Europe’s key source markets. In shipping, it is one of the world’stop five container lines due to the successful integration of CP Shipsinto Hapag-Lloyd.
+ Convincing quality. This applies equally to the tourism and shippingdivisions. In the tourism division, TUI covers the entire value chain,thus guaranteeing top quality travel – for both modular and packagetours. In shipping, Hapag-Lloyd is setting new standards for bestpractices in the planning, processing and settlement of orders.
+ Steadily increasing efficiency and earnings. Through its integrationand cost containment programmes, TUI is improving its earningssituation and at the same time creating potential for the establish-ment of new growth areas.
7
Two strong pillars, one Group.
8
Challenging tasks.
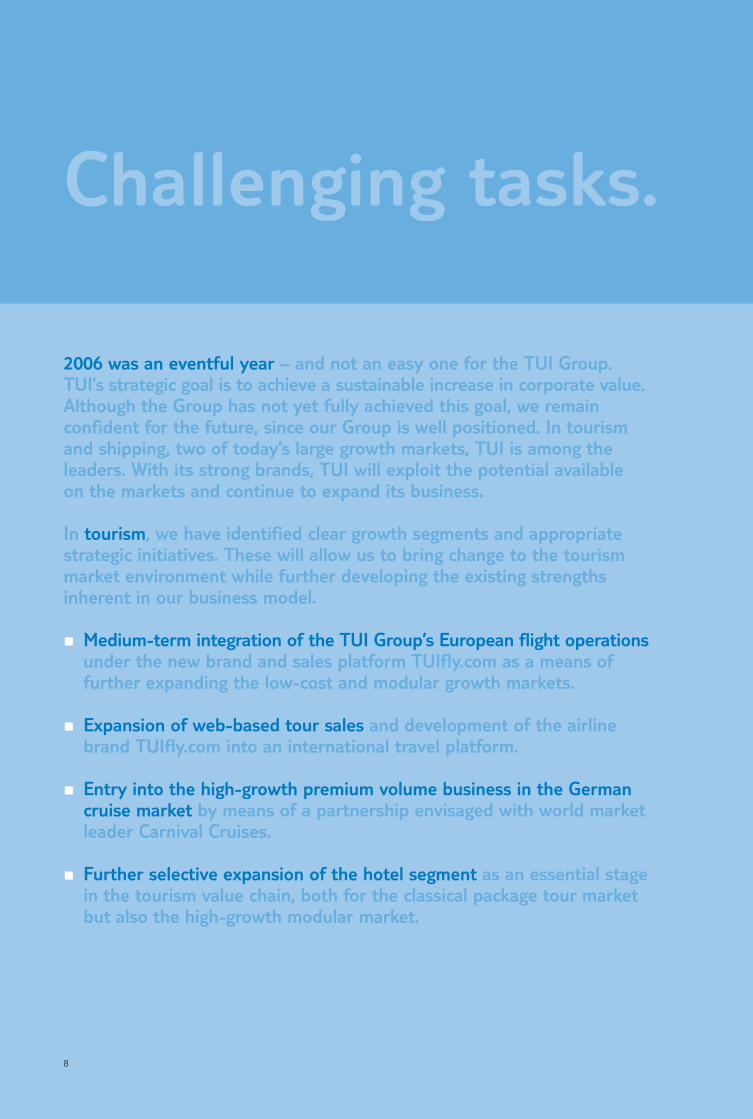
2006 was an eventful year – and not an easy one for the TUI Group.TUI’s strategic goal is to achieve a sustainable increase in corporate value.Although the Group has not yet fully achieved this goal, we remain confident for the future, since our Group is well positioned. In tourismand shipping, two of today’s large growth markets, TUI is among the leaders. With its strong brands, TUI will exploit the potential available on the markets and continue to expand its business.
In tourism, we have identified clear growth segments and appropriatestrategic initiatives. These will allow us to bring change to the tourismmarket environment while further developing the existing strengths inherent in our business model.
1Medium-term integration of the TUI Group’s European flight operationsunder the new brand and sales platform TUIfly.com as a means offurther expanding the low-cost and modular growth markets.
1Expansion of web-based tour sales and development of the airlinebrand TUIfly.com into an international travel platform.
1Entry into the high-growth premium volume business in the Germancruise market by means of a partnership envisaged with world marketleader Carnival Cruises.
1Further selective expansion of the hotel segment as an essential stagein the tourism value chain, both for the classical package tour marketbut also the high-growth modular market.
9
Clear goals.
With the strong growth in modular travel products, the distribution, costand margin structures of the sector are changing. What is necessary, therefore, is to achieve expansion of the tourism growth segments whilesimultaneously optimising cost structures. A comprehensive cost-cuttingprogramme will achieve a sustainable cost reduction of 250 million eurosby 2008.
In shipping, the integration of CP Ships’ operative business has beencompleted – earlier than expected and with stronger synergy effects thanoriginally assumed. Today we operate a fleet that meets all customerrequirements on all routes worldwide. Following this readjustment, weare now well-placed with our strong, healthy and quality-centred marketposition.
A further key measure for the long-term enhancement of the TUI Group’sprofitability is the optimisation of assets employed. To this end, a newprogramme has been launched which is designed to bring about furtherreductions in net debt. The divestment of marginal operations and anoptimisation of fixed assets will have the overall effect of reducing debtby around one billion euros by 2008. In parallel, the Group is also consider-ing further opportunities for reducing capital tie-up in flight operations.
The programmes and measures introduced relate not only to the Group’soperating divisions of tourism and shipping but also to Group head-quarters, TUI AG. Under the cost containment programme, expenditure byheadquarters is to be cut by one third. To further improve the efficiencyof Group management, TUI AG and TUI Deutschland GmbH will be broughttogether into a single organisation. As a result, the new TUI AG will com-bine the classic holding functions, the central functions of the tourismdivision and the operative business in source market Germany.
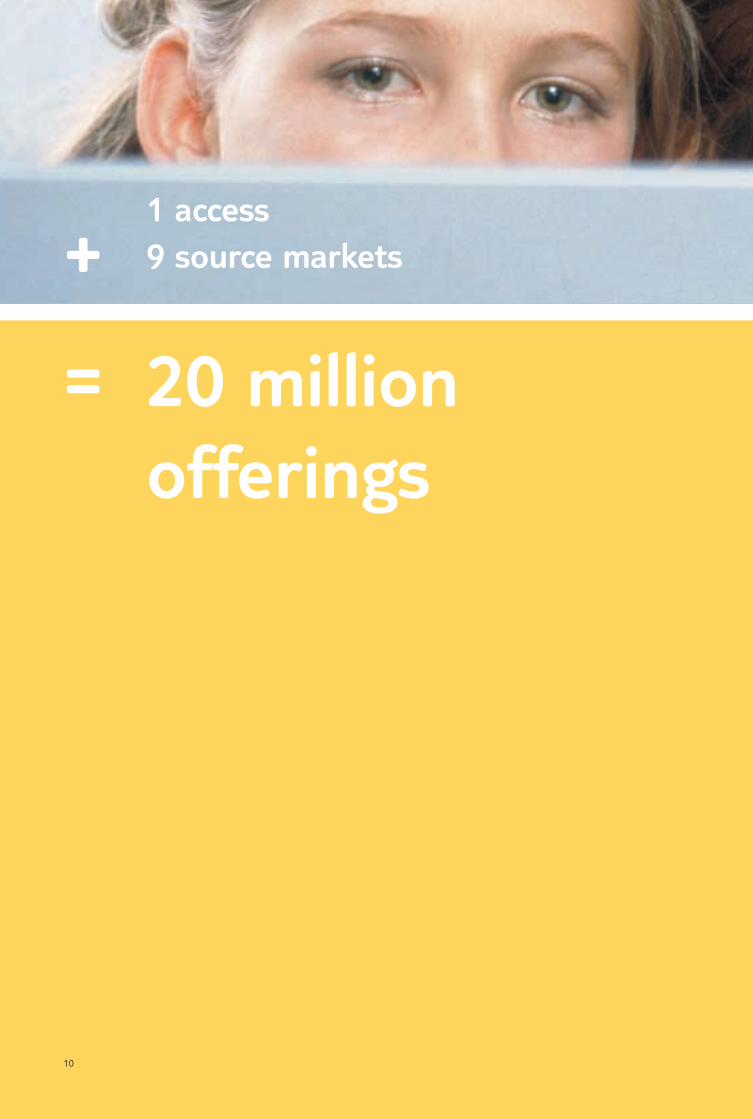
1 access
+ 9 source markets
= 20 millionofferings
10
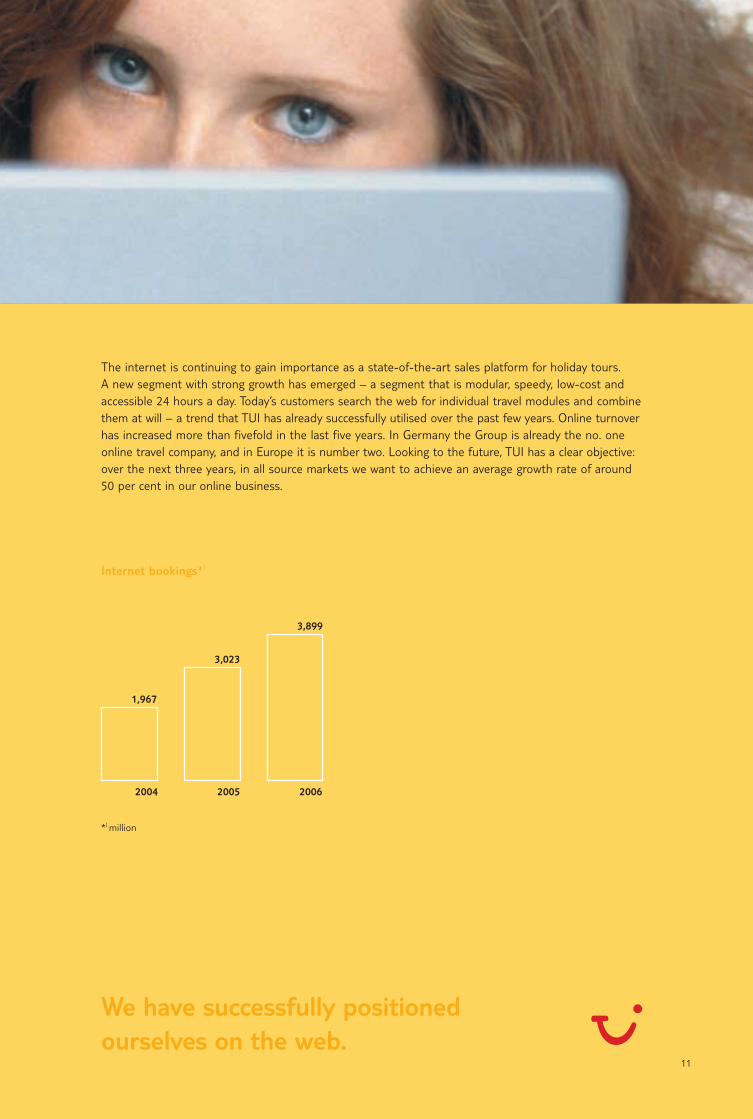
The internet is continuing to gain importance as a state-of-the-art sales platform for holiday tours.A new segment with strong growth has emerged – a segment that is modular, speedy, low-cost andaccessible 24 hours a day. Today’s customers search the web for individual travel modules and combinethem at will – a trend that TUI has already successfully utilised over the past few years. Online turnoverhas increased more than fivefold in the last five years. In Germany the Group is already the no. oneonline travel company, and in Europe it is number two. Looking to the future, TUI has a clear objective:over the next three years, in all source markets we want to achieve an average growth rate of around50 per cent in our online business.
Internet bookings*)
2004 2005 2006
1,967
3,899
3,023
We have successfully positionedourselves on the web.
11
*) million
12
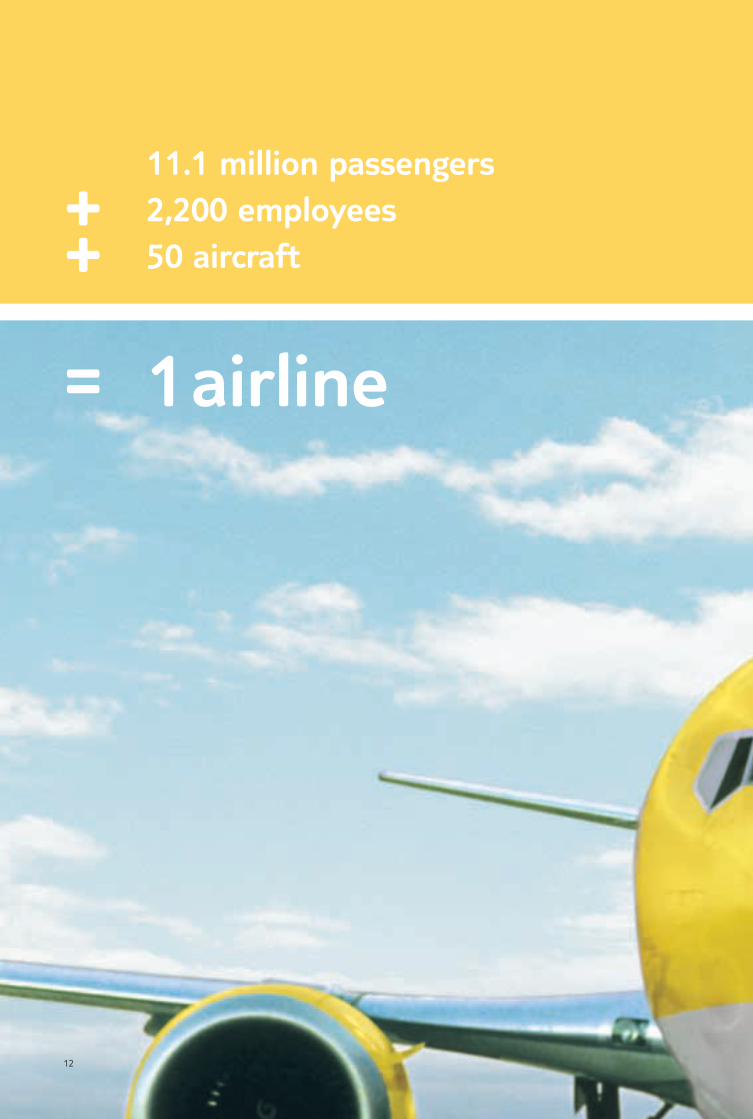
11.1 million passengers
+ 2,200 employees
+ 50 aircraft
= 1airline
13
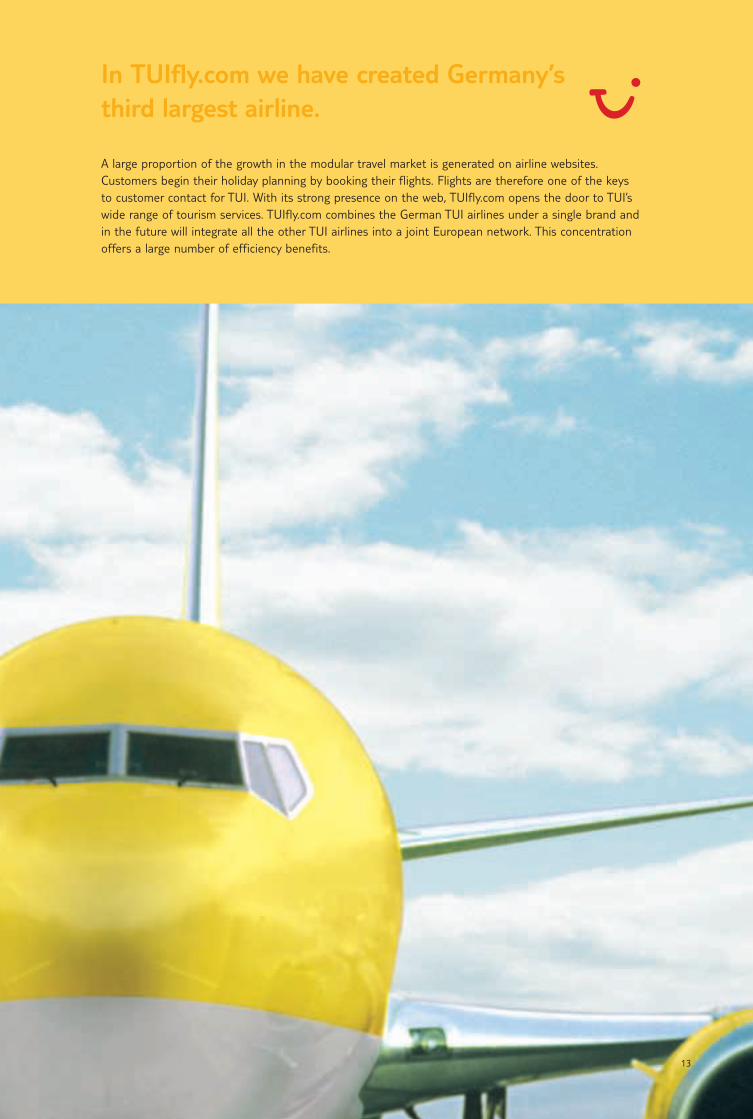
In TUIfly.com we have created Germany’s third largest airline.
A large proportion of the growth in the modular travel market is generated on airline websites. Customers begin their holiday planning by booking their flights. Flights are therefore one of the keysto customer contact for TUI. With its strong presence on the web, TUIfly.com opens the door to TUI’swide range of tourism services. TUIfly.com combines the German TUI airlines under a single brand andin the future will integrate all the other TUI airlines into a joint European network. This concentrationoffers a large number of efficiency benefits.
14
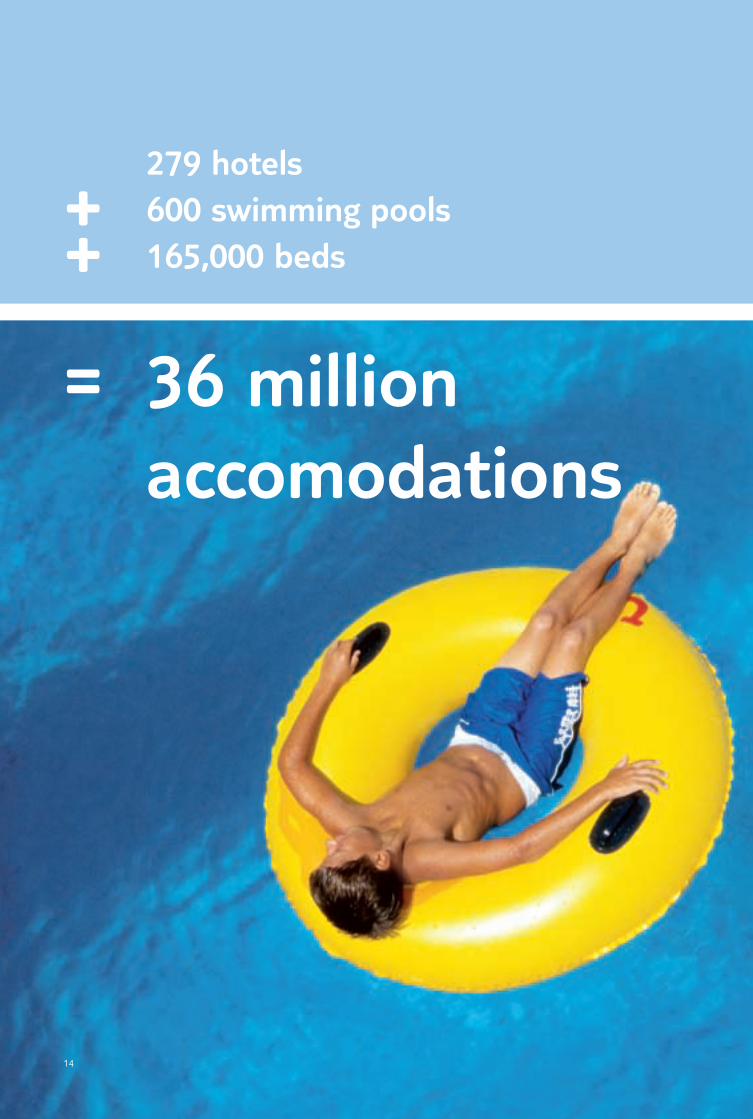
279 hotels
+ 600 swimming pools
+ 165,000 beds
= 36 million accomodations
15
TUI offers high-quality holidays in over 70 countries of the world.
Classic package tours will continue to be a mainstay of TUI’s business. Tours with all-inclusive servicesfrom flight, hotel and transfer to tour reps and car rental at destination continue to be an attractiveoption for those wishing to ‘play it safe’ for the most precious days of the year. In this regard, TUIoffers a broad range of high-quality holiday tours in a total of over 70 countries of the world. Goodhotels play a crucial part in ensuring customer satisfaction and loyalty. TUI’s market position will befurther reinforced with the expansion of the hotel segment by 2008.
16
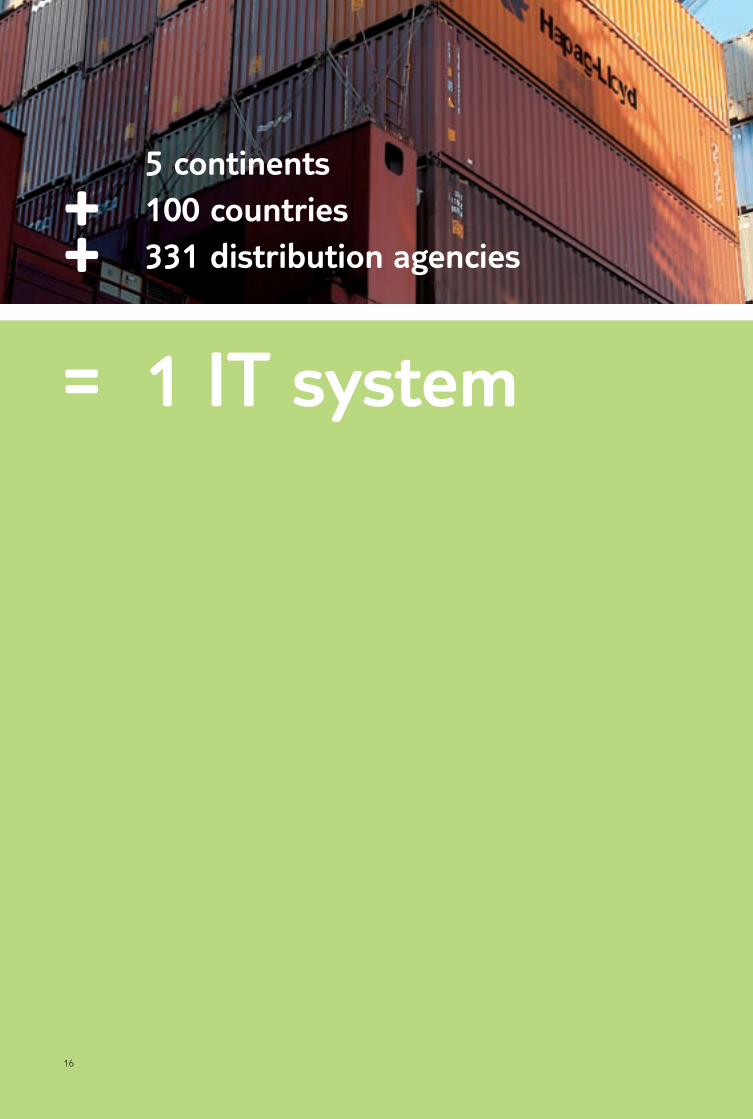
5 continents
+ 100 countries
+ 331 distribution agencies
= 1 IT system
17
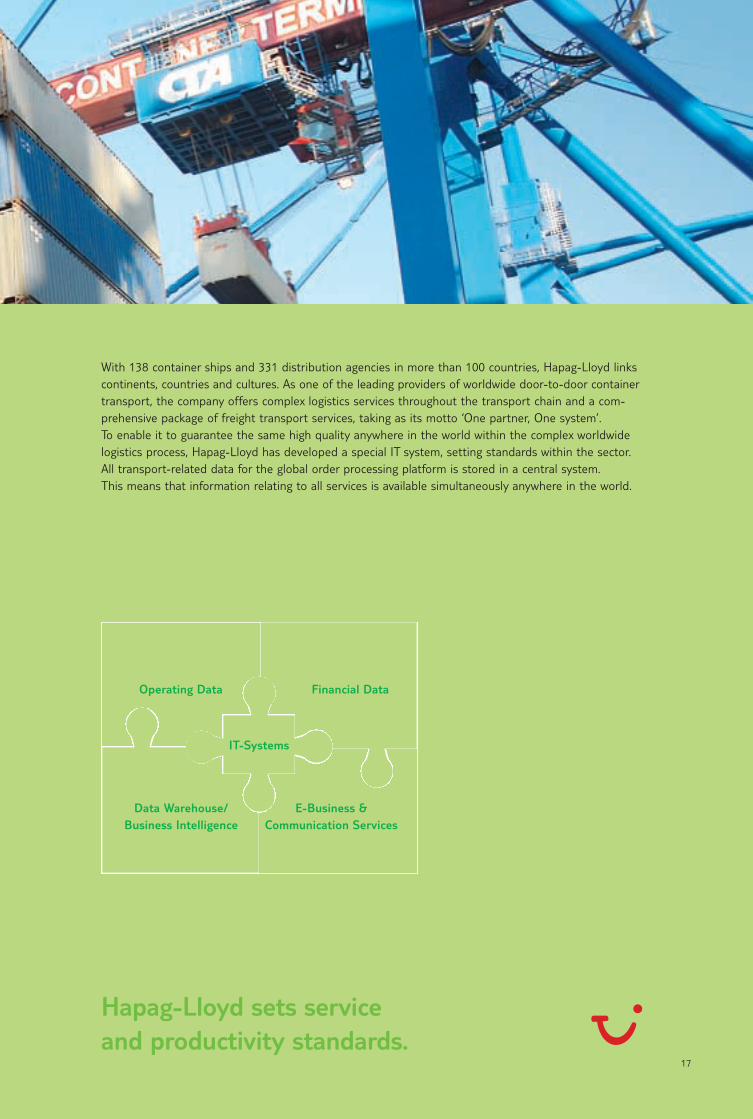
With 138 container ships and 331 distribution agencies in more than 100 countries, Hapag-Lloyd linkscontinents, countries and cultures. As one of the leading providers of worldwide door-to-door containertransport, the company offers complex logistics services throughout the transport chain and a com-prehensive package of freight transport services, taking as its motto ‘One partner, One system’.To enable it to guarantee the same high quality anywhere in the world within the complex worldwidelogistics process, Hapag-Lloyd has developed a special IT system, setting standards within the sector.All transport-related data for the global order processing platform is stored in a central system.This means that information relating to all services is available simultaneously anywhere in the world.
Hapag-Lloyd sets service and productivity standards.
E-Business &Communication Services
Operating Data
IT-Systems
Financial Data
Data Warehouse/ Business Intelligence
18
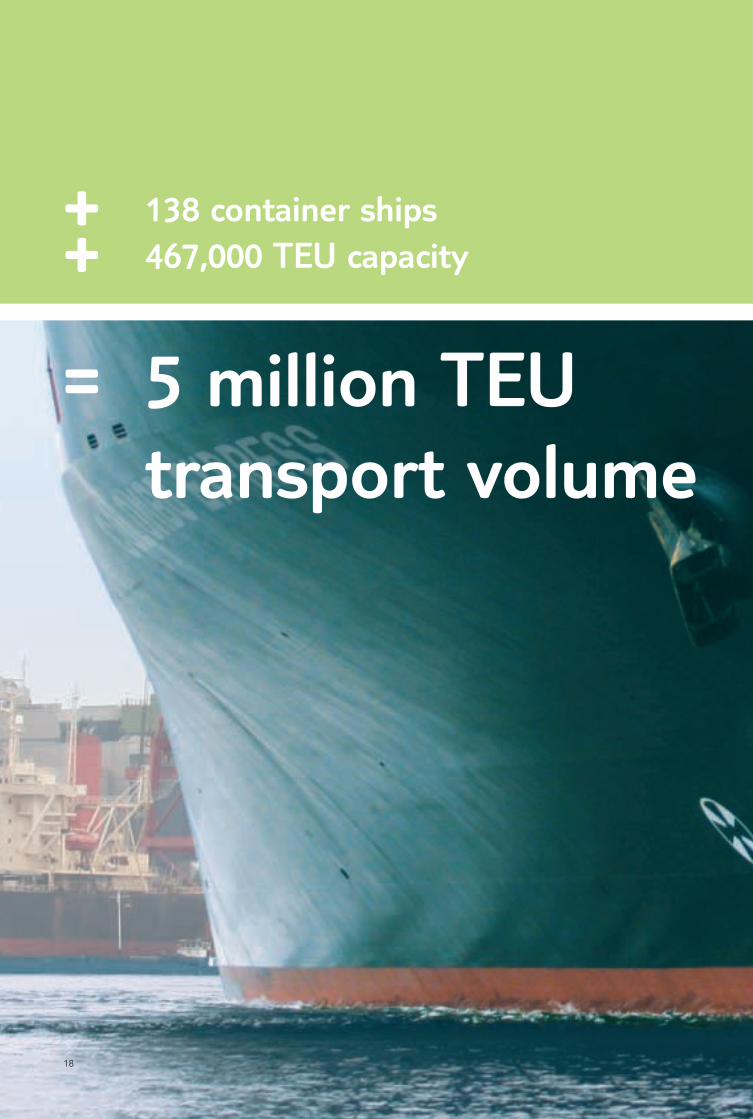
+ 138 container ships
+ 467,000 TEU capacity
= 5 million TEU transport volume
19
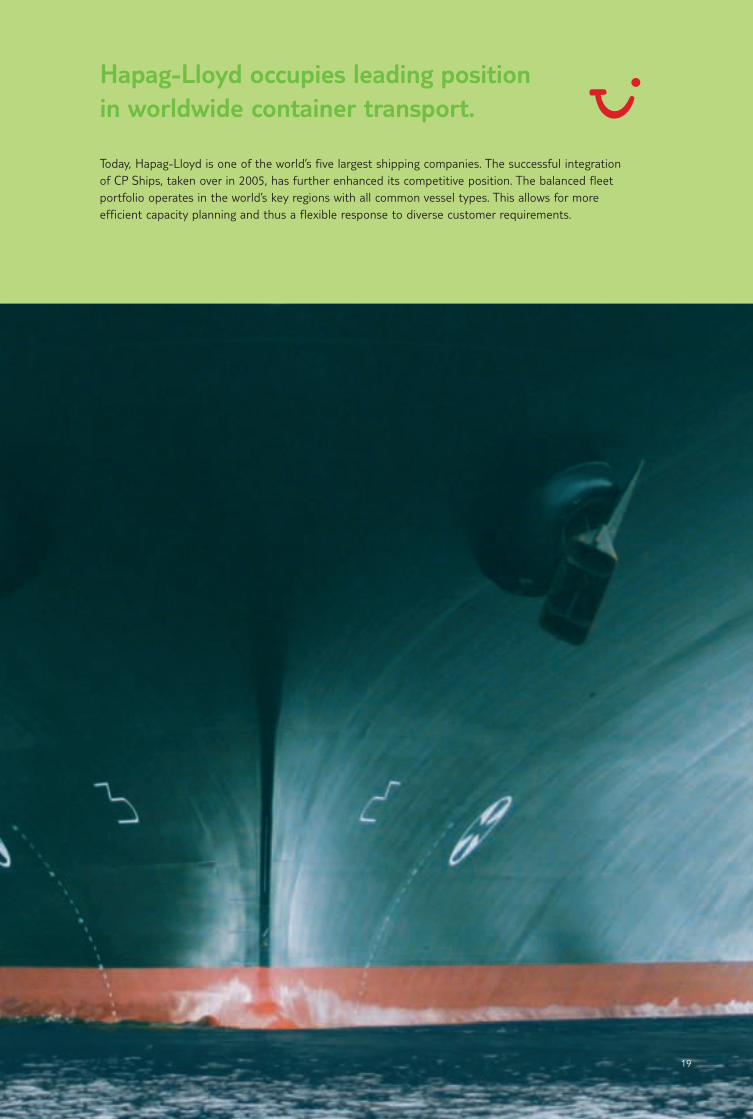
Hapag-Lloyd occupies leading positionin worldwide container transport.
Today, Hapag-Lloyd is one of the world’s five largest shipping companies. The successful integration of CP Ships, taken over in 2005, has further enhanced its competitive position. The balanced fleetportfolio operates in the world’s key regions with all common vessel types. This allows for more efficient capacity planning and thus a flexible response to diverse customer requirements.

20
2 x quality
+ 2 x strong brand
+ 2 x size
= Security & prospects
21
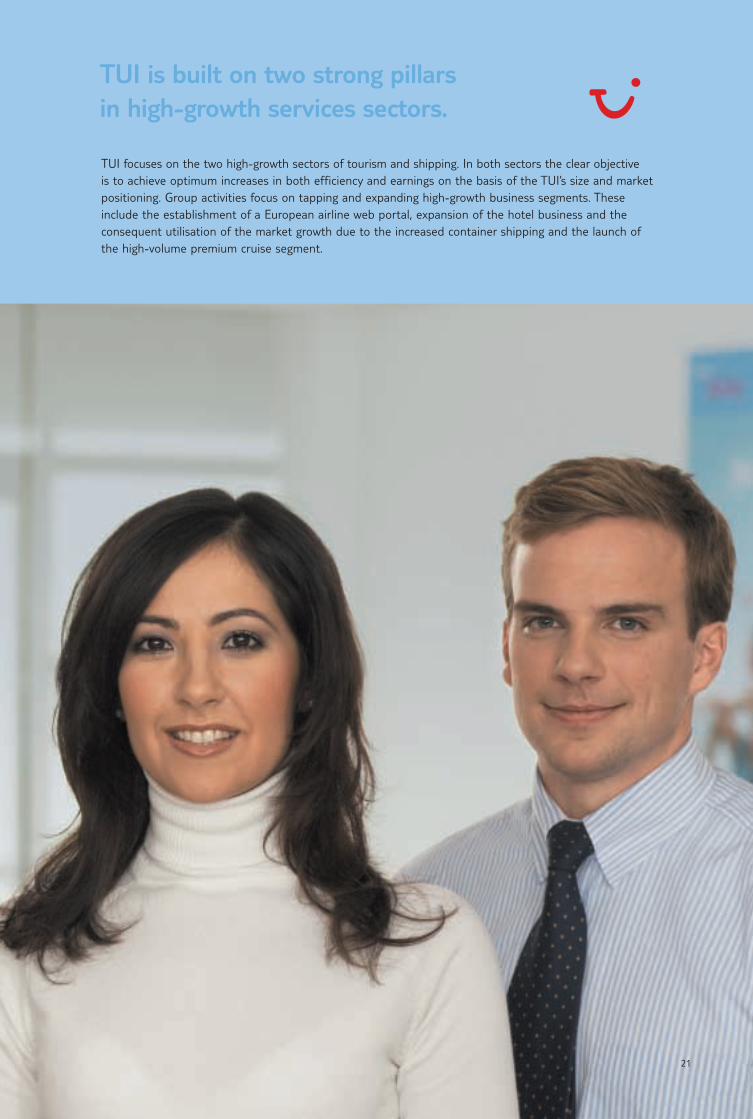
TUI is built on two strong pillarsin high-growth services sectors.
TUI focuses on the two high-growth sectors of tourism and shipping. In both sectors the clear objectiveis to achieve optimum increases in both efficiency and earnings on the basis of the TUI’s size and marketpositioning. Group activities focus on tapping and expanding high-growth business segments. These include the establishment of a European airline web portal, expansion of the hotel business and the consequent utilisation of the market growth due to the increased container shipping and the launch ofthe high-volume premium cruise segment.
With its strong positioning, TUI will be able to meet the demands of the futureand continue to expand its strong market positions. By means of a comprehensiveset of measures, TUI will create further profitable growth and will improve itscost structure. TUI will achieve total cost savings of € 250 million by 2008.
22
Management Report
23
Man
agem
ent
Rep
ort
22 Management Report
24 Business and Operating Environment34 Group Turnover and Earnings40 Tourism54 Shipping61 Discontinuing Operations 62 Earnings 67 Net Assets72 Financial Position82 Report on Subsequent Events83 Risk Report 90 Remuneration Report 95 Research and Development97 Human Resources99 Environmental Protection
101 Report on Expected Developments
2006 – A challenging year. Uneven trends incore businesses. Group earnings impactedby one-off effects. Considerable reductionin net debt.
2006 – at a glance
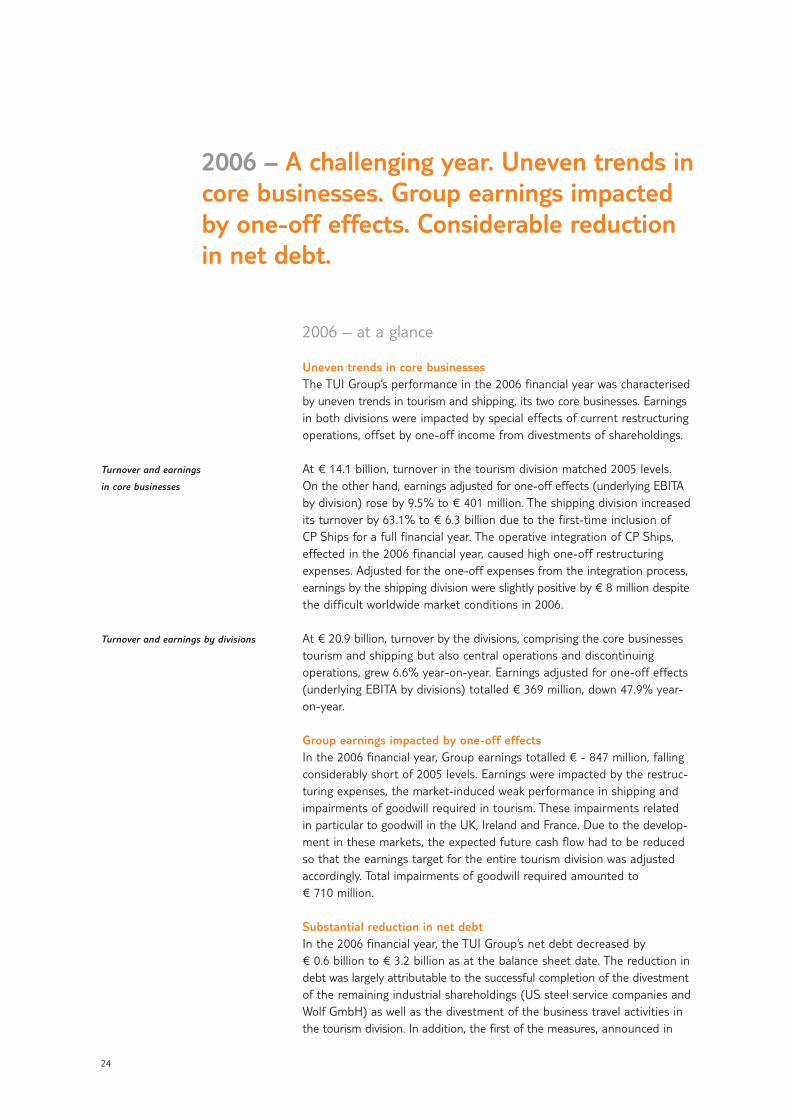
Uneven trends in core businessesThe TUI Group’s performance in the 2006 financial year was characterisedby uneven trends in tourism and shipping, its two core businesses. Earningsin both divisions were impacted by special effects of current restructuringoperations, offset by one-off income from divestments of shareholdings.
At € 14.1 billion, turnover in the tourism division matched 2005 levels.On the other hand, earnings adjusted for one-off effects (underlying EBITAby division) rose by 9.5% to € 401 million. The shipping division increasedits turnover by 63.1% to € 6.3 billion due to the first-time inclusion ofCP Ships for a full financial year. The operative integration of CP Ships,effected in the 2006 financial year, caused high one-off restructuringexpenses. Adjusted for the one-off expenses from the integration process,earnings by the shipping division were slightly positive by € 8 million despitethe difficult worldwide market conditions in 2006.
At € 20.9 billion, turnover by the divisions, comprising the core businessestourism and shipping but also central operations and discontinuing operations, grew 6.6% year-on-year. Earnings adjusted for one-off effects(underlying EBITA by divisions) totalled € 369 million, down 47.9% year-on-year.
Group earnings impacted by one-off effectsIn the 2006 financial year, Group earnings totalled € - 847 million, fallingconsiderably short of 2005 levels. Earnings were impacted by the restruc-turing expenses, the market-induced weak performance in shipping andimpairments of goodwill required in tourism. These impairments relatedin particular to goodwill in the UK, Ireland and France. Due to the develop-ment in these markets, the expected future cash flow had to be reducedso that the earnings target for the entire tourism division was adjustedaccordingly. Total impairments of goodwill required amounted to € 710 million.
Substantial reduction in net debtIn the 2006 financial year, the TUI Group’s net debt decreased by€ 0.6 billion to € 3.2 billion as at the balance sheet date. The reduction indebt was largely attributable to the successful completion of the divestmentof the remaining industrial shareholdings (US steel service companies andWolf GmbH) as well as the divestment of the business travel activities inthe tourism division. In addition, the first of the measures, announced in
24
Turnover and earnings
in core businesses
Turnover and earnings by divisions
December 2006, to bring net debt further down could be realised: Seven con-tainer ships and a container pool previously owned by CP Ships were sold.
Successful integration of CP ShipsThe operative integration of the container shipping company CP Ships,acquired in October 2005, in Hapag-Lloyd was fully completed – significantlyfaster than expected – in the 2006 financial year. The centrepiece ofintegration activities was the expansion of Hapag Lloyd’s organisationalstructure and information technology to include the new sites. As early as atthe end of the third quarter of 2006, all former CP Ships services had beenintegrated into Hapag-Lloyd’s structure and are now operated under thebrand name Hapag-Lloyd.
Completion of Group realignment With the divestment of the US steel service companies of Preussag NorthAmerica, Inc. (PNA) to financial investor Platinum Equity in May 2006 andthe divestment of the majority shareholding in Wolf GmbH, a heating andair ventilation company, to Centrotec Sustainable AG in October 2006,the TUI Group sold its last remaining industrial shareholdings.
Group structure and business operations Today, the TUI Group comprises two core businesses, tourism and shipping.This is the result of a realignment process effected over the last years, inwhich the Group’s portfolio of shareholdings was transformed from anindustrial conglomerate to a pure services company.
The core businesses, tourism and shipping, will account for around 70%and 30%, respectively, of Group turnover. In accordance with the IFRSdefinition, the two businesses form the continuing operations. Due to thedivestment of the US steel service operations in May 2006, the TUI Groupno longer held any discontinuing operations according to the IFRS defini-tion as at the balance sheet date.
TourismThe tourism division comprises the five sectors Central Europe, NorthernEurope, Western Europe, Destinations and Other tourism. The first three ofthese sectors cover regional source markets, one of the sectors representsthe activities in the destinations and the last one of the sectors at thebalance sheet date the remaining tourism business.
The Central Europe sector comprises the distribution and tour operatorbusiness in Germany, Switzerland, Austria and the Eastern Europeanmarkets. As at the balance sheet date, the sector also comprised the air-lines Hapag-Lloyd Flug and Hapag-Lloyd Express, which were pooled underthe TUIfly.com brand in January 2007 in the framework of the Group’s newairline strategy. Apart from the airlines, the main operative Group com-panies in this sector are TUI Deutschland GmbH, TUI Suisse AG and inAustria Gulet Touristik GmbH & Co. KG.
The Northern Europe sector comprises the distribution and tour operatorbusiness in the UK, Ireland and the Nordic countries as well as airlinesThomsonfly (charter and scheduled flights) and TUIfly Nordic. The main
Man
agem
ent
Rep
ort
Management Report Business and Operating Environment Group Turnover and Earnings Tourism Shipping Discontinuing Operations Earnings
Net Assets Financial Position Report on Subsequent Events Risk Report Remuneration Report Research and Development
Human Resources Environmental Protection Report on Expected Developments
Central Europe
Northern Europe
25
Group companies operating in the distribution and tour operator industryare TUI UK Ltd. and Budget Travel Ltd. in Ireland. In the Nordic countries,TUI Nordic Holding AB covers the distribution and tour operator activities.
The Western Europe sector comprises the distribution and tour operatorbusiness in France, the Netherlands and Belgium as well as the airlinesCorsair, TUI Airlines Nederland and TUI Airlines Belgium. The main com-panies operating in the distribution and tour operator business, eitherdirectly or via shareholdings, are Groupe Nouvelles Frontières S.A.S., TUI Nederland N.V. and TUI Belgium N.V.
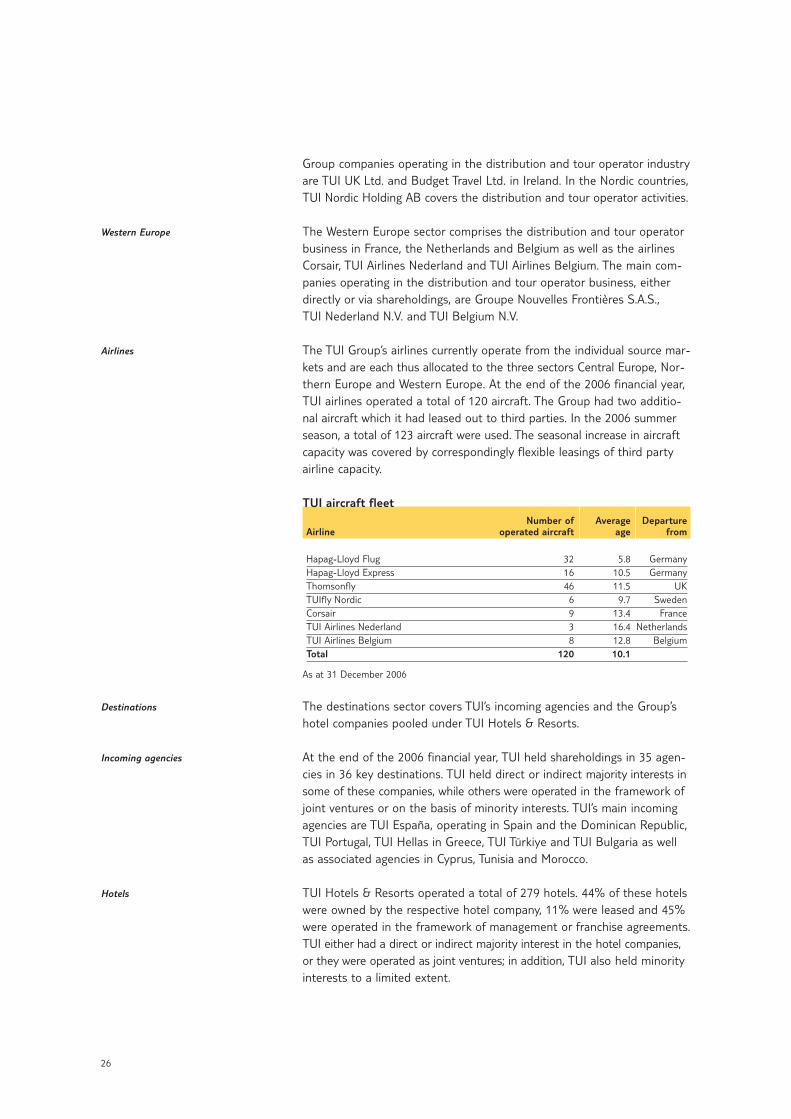
The TUI Group’s airlines currently operate from the individual source mar-kets and are each thus allocated to the three sectors Central Europe, Nor-thern Europe and Western Europe. At the end of the 2006 financial year,TUI airlines operated a total of 120 aircraft. The Group had two additio-nal aircraft which it had leased out to third parties. In the 2006 summerseason, a total of 123 aircraft were used. The seasonal increase in aircraftcapacity was covered by correspondingly flexible leasings of third partyairline capacity.
TUI aircraft fleetNumber of Average Departure
Airline operated aircraft age from
Hapag-Lloyd Flug 32 5.8 GermanyHapag-Lloyd Express 16 10.5 GermanyThomsonfly 46 11.5 UKTUIfly Nordic 6 9.7 SwedenCorsair 9 13.4 FranceTUI Airlines Nederland 3 16.4 NetherlandsTUI Airlines Belgium 8 12.8 BelgiumTotal 120 10.1
As at 31 December 2006
The destinations sector covers TUI’s incoming agencies and the Group’shotel companies pooled under TUI Hotels & Resorts.
At the end of the 2006 financial year, TUI held shareholdings in 35 agen-cies in 36 key destinations. TUI held direct or indirect majority interests insome of these companies, while others were operated in the framework ofjoint ventures or on the basis of minority interests. TUI’s main incomingagencies are TUI España, operating in Spain and the Dominican Republic,TUI Portugal, TUI Hellas in Greece, TUI Türkiye and TUI Bulgaria as wellas associated agencies in Cyprus, Tunisia and Morocco.
TUI Hotels & Resorts operated a total of 279 hotels. 44% of these hotelswere owned by the respective hotel company, 11% were leased and 45%were operated in the framework of management or franchise agreements.TUI either had a direct or indirect majority interest in the hotel companies,or they were operated as joint ventures; in addition, TUI also held minorityinterests to a limited extent.
Western Europe
Airlines
Destinations
Incoming agencies
Hotels
26
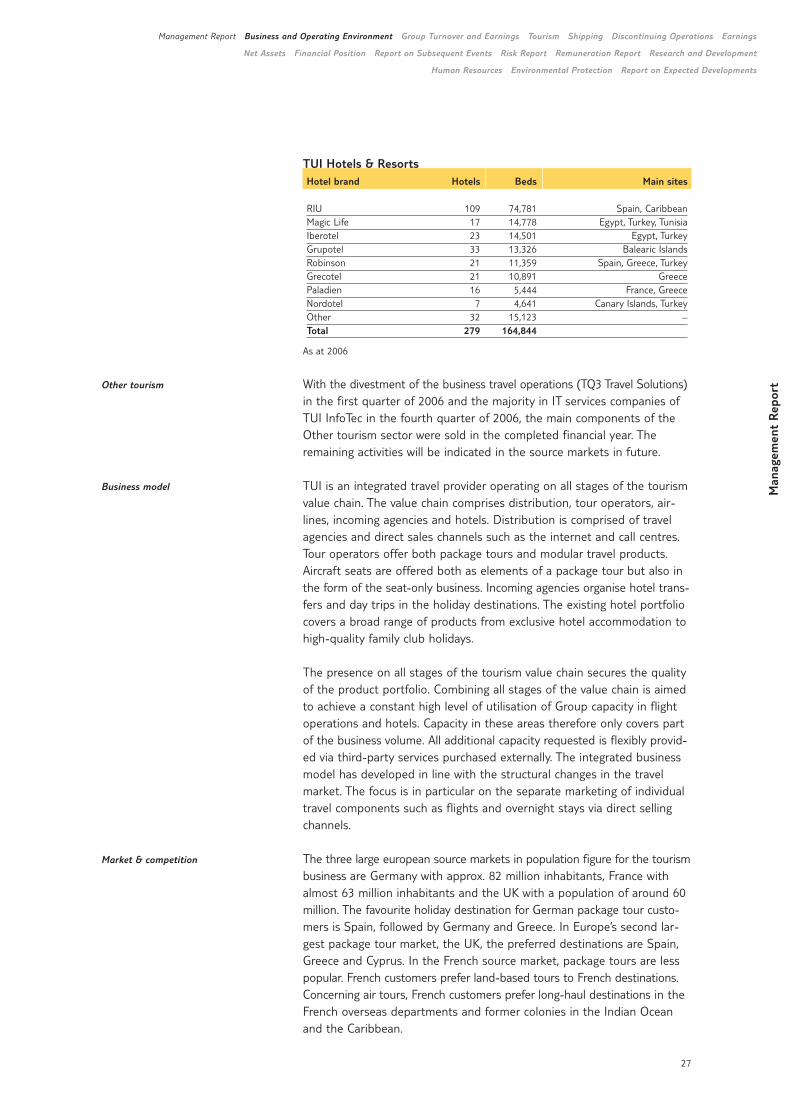
TUI Hotels & ResortsHotel brand Hotels Beds Main sites
RIU 109 74,781 Spain, CaribbeanMagic Life 17 14,778 Egypt, Turkey, TunisiaIberotel 23 14,501 Egypt, TurkeyGrupotel 33 13,326 Balearic IslandsRobinson 21 11,359 Spain, Greece, TurkeyGrecotel 21 10,891 GreecePaladien 16 5,444 France, GreeceNordotel 7 4,641 Canary Islands, TurkeyOther 32 15,123 –Total 279 164,844
As at 2006
With the divestment of the business travel operations (TQ3 Travel Solutions)in the first quarter of 2006 and the majority in IT services companies ofTUI InfoTec in the fourth quarter of 2006, the main components of theOther tourism sector were sold in the completed financial year. Theremaining activities will be indicated in the source markets in future.
TUI is an integrated travel provider operating on all stages of the tourismvalue chain. The value chain comprises distribution, tour operators, air-lines, incoming agencies and hotels. Distribution is comprised of travelagencies and direct sales channels such as the internet and call centres.Tour operators offer both package tours and modular travel products. Aircraft seats are offered both as elements of a package tour but also inthe form of the seat-only business. Incoming agencies organise hotel trans-fers and day trips in the holiday destinations. The existing hotel portfoliocovers a broad range of products from exclusive hotel accommodation tohigh-quality family club holidays.
The presence on all stages of the tourism value chain secures the qualityof the product portfolio. Combining all stages of the value chain is aimedto achieve a constant high level of utilisation of Group capacity in flightoperations and hotels. Capacity in these areas therefore only covers partof the business volume. All additional capacity requested is flexibly provid-ed via third-party services purchased externally. The integrated businessmodel has developed in line with the structural changes in the travelmarket. The focus is in particular on the separate marketing of individualtravel components such as flights and overnight stays via direct sellingchannels.
The three large european source markets in population figure for the tourismbusiness are Germany with approx. 82 million inhabitants, France withalmost 63 million inhabitants and the UK with a population of around 60million. The favourite holiday destination for German package tour custo-mers is Spain, followed by Germany and Greece. In Europe’s second lar-gest package tour market, the UK, the preferred destinations are Spain,Greece and Cyprus. In the French source market, package tours are lesspopular. French customers prefer land-based tours to French destinations.Concerning air tours, French customers prefer long-haul destinations in theFrench overseas departments and former colonies in the Indian Oceanand the Caribbean.
Man
agem
ent
Rep
ort
Management Report Business and Operating Environment Group Turnover and Earnings Tourism Shipping Discontinuing Operations Earnings
Net Assets Financial Position Report on Subsequent Events Risk Report Remuneration Report Research and Development
Human Resources Environmental Protection Report on Expected Developments
Other tourism
Business model
Market & competition
27
At a turnover volume of around € 14 billion in the tourism division in 2006,TUI is Europe’s largest integrated tourism group. In terms of reportedturnover for 2005, the Thomas Cook Group was the second largest companyin Europe, followed by MyTravel in the UK, the German REWE Group, theBritish First Choice and Kuoni in Switzerland. In terms of turnover, TUI is the market leader by turnover in 2005 in Germany, the UK and France.It is among the three leading tour operators in another eight Europeancountries. In addition, TUI occupies key market positions in the emergingEastern European tourism markets.
The current consolidation trends in the tourism market are expected tocause shifts in the competitive position. With the announced merger ofThomas Cook and MyTravel, the new company Thomas Cook Group plc.would expand its market position as Europe’s number two. In the Britishmarket Thomas Cook Group plc. would be then the biggest supplier interms of turnover.
The tourism market is currently undergoing a phase of structural change,strongly characterised by the growing demand for modular travel products.The basis of this trend is the dynamic expansion of the internet as aplatform for information and bookings as well as the sustained growth ofthe low-cost airlines.
The structural market changes create the need for a development ofbusiness models – in particular in the tour operator and airlines sector –in order to fully exploit the current market growth. TUI anticipated thischange at an early point in time and actively helped to shape it. In orderto generate further profitable growth, clear strategic approaches havebeen defined:
1 In the framework of the airline strategy, a first step was to combinethe two German airlines Hapag-Lloyd Flug and Hapag-Lloyd Expressinto the new brand TUIfly.com. A uniform online portal was createdunder this brand name in January 2007. A further strategic goal is theintegration of all European airline activities of the TUI Group into thenew brand and distribution platform TUIfly.com. This strategy formsthe basis for sustainable participation in the growth segments of low-cost and modular tours.
1 In the framework of the distribution strategy, a further expansion ofweb-based journey distribution has been planned, aiming to achieveaverage growth in the next three years of 50% in the respective sourcemarkets. Alongside this strategy, the new TUIfly.com brand will beexpanded into an international travel platform.
1 In addition, cruise activities will be expanded by means of entry intothe fast-growing German premium volume market segment.
1 The Group’s hotel strategy is aimed at achieving a further selectiveexpansion of the existing portfolio. The planned growth in this stageof the value chain is to be based both on an expansion of the hotelportfolio for the classic package tour market and the fast-growingmodular travel market.
Strategy
28
Besides the expansion of the growth areas, the structural market changesrequire the further development of existing production structures. Inorder to decrease specific production costs, a set of measures was launched to achieve further cost savings of € 250 million by 2008.
ShippingThe shipping division breaks down into the two sectors of container ship-ping and cruises with the respective key operative Group companiesHapag-Lloyd AG and Hapag-Lloyd Kreuzfahrten GmbH.
In 2006, the focus in container shipping was above all on the integrationof the Canadian shipping company CP Ships, acquired in October 2005.The centrepiece of integration activities was the expansion of Hapag-Lloyd’s organisational structure according to the ‘blueprint model’ patternas well as the expansion of Hapag-Lloyd’s IT systems to cover the newsites. By the end of the third quarter of 2006, all operative business ele-ments of CP Ships, in particular the vessel and container fleets and linerservices, were an integral element of Hapag-Lloyd and are now operatedunder the Hapag-Lloyd brand.
In the framework of the integration of CP Ships, the legal structures ofthe shipping division were reorganised. The former lead company Hapag-Lloyd AG with its two subsidiaries Hapag-Lloyd Container Linie GmbHand Hapag-Lloyd Kreuzfahrten GmbH, in turn, was a direct subsidiaryof TUI AG. In the wake of the legal restructuring of the division, HapagLloyd AG was merged with TUI AG in two steps. The business operationsof the former lead company Hapag-Lloyd AG were transferred in thecourse of a business transfer to Hapag-Lloyd Container Linie GmbH. In the framework of this transaction, Hapag-Lloyd Container Linie GmbHwas converted into a stock corporation and has since then been operatingunder the name Hapag-Lloyd AG. As a result, the new Hapag-Lloyd AGand Hapag-Lloyd Kreuzfahrten GmbH are direct subsidiaries of the Groupholding TUI AG.
The operative business in container shipping is broken down into tradelanes, with each trade lane comprising a number of individual routes. Withthe integration of CP Ships, the Hapag-Lloyd reporting structure wasexpanded from four to five trade lanes. The new geographical structurecomprises the trade lanes Far East, Trans-Pacific, Atlantic, Latin Americaand Australasia.
As at the end of the 2006 financial year, Hapag-Lloyd operated a total of138 vessels including CP Ships’ fleet, fully integrated in 2006. Of the totalfleet, 56 vessels were owned by the company, 40 were subject to long-termcharter or leasing contracts and 42 vessels were subject to short-termcharter agreements. The average age of the fleet was 8.2 years. In thecourse of the extension of shipping capacity seven vessels were deliveredin the completed financial year; one with a capacity of 8,750 standardcontainers (TEU), six with 4,250 TEU. By 2008, another five vessels with a capacity of 8,750 TEU and two with a capacity of 4,250 TEU are to bedelivered. Besides the vessels, the division held containers with a totalcapacity of around 1,015,000 TEU, most of which were owned.
Man
agem
ent
Rep
ort
Management Report Business and Operating Environment Group Turnover and Earnings Tourism Shipping Discontinuing Operations Earnings
Net Assets Financial Position Report on Subsequent Events Risk Report Remuneration Report Research and Development
Human Resources Environmental Protection Report on Expected Developments
Container shipping
Trade lanes
Capacities
29
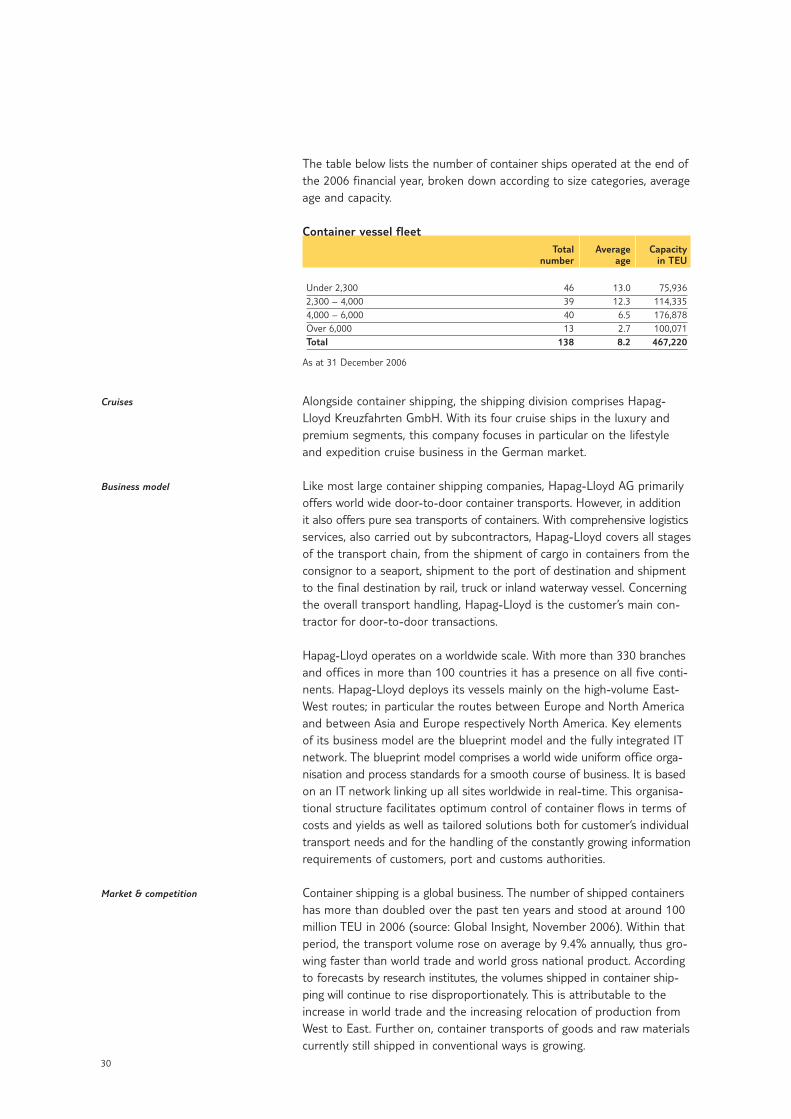
The table below lists the number of container ships operated at the end ofthe 2006 financial year, broken down according to size categories, averageage and capacity.
Container vessel fleetTotal Average Capacity
number age in TEU
Under 2,300 46 13.0 75,9362,300 – 4,000 39 12.3 114,3354,000 – 6,000 40 6.5 176,878Over 6,000 13 2.7 100,071Total 138 8.2 467,220
As at 31 December 2006
Alongside container shipping, the shipping division comprises Hapag-Lloyd Kreuzfahrten GmbH. With its four cruise ships in the luxury andpremium segments, this company focuses in particular on the lifestyleand expedition cruise business in the German market.
Like most large container shipping companies, Hapag-Lloyd AG primarilyoffers world wide door-to-door container transports. However, in additionit also offers pure sea transports of containers. With comprehensive logisticsservices, also carried out by subcontractors, Hapag-Lloyd covers all stagesof the transport chain, from the shipment of cargo in containers from theconsignor to a seaport, shipment to the port of destination and shipmentto the final destination by rail, truck or inland waterway vessel. Concerningthe overall transport handling, Hapag-Lloyd is the customer’s main con-tractor for door-to-door transactions.
Hapag-Lloyd operates on a worldwide scale. With more than 330 branchesand offices in more than 100 countries it has a presence on all five conti-nents. Hapag-Lloyd deploys its vessels mainly on the high-volume East-West routes; in particular the routes between Europe and North Americaand between Asia and Europe respectively North America. Key elementsof its business model are the blueprint model and the fully integrated ITnetwork. The blueprint model comprises a world wide uniform office orga-nisation and process standards for a smooth course of business. It is basedon an IT network linking up all sites worldwide in real-time. This organisa-tional structure facilitates optimum control of container flows in terms ofcosts and yields as well as tailored solutions both for customer’s individualtransport needs and for the handling of the constantly growing informationrequirements of customers, port and customs authorities.
Container shipping is a global business. The number of shipped containershas more than doubled over the past ten years and stood at around 100million TEU in 2006 (source: Global Insight, November 2006). Within thatperiod, the transport volume rose on average by 9.4% annually, thus gro-wing faster than world trade and world gross national product. Accordingto forecasts by research institutes, the volumes shipped in container ship-ping will continue to rise disproportionately. This is attributable to theincrease in world trade and the increasing relocation of production fromWest to East. Further on, container transports of goods and raw materialscurrently still shipped in conventional ways is growing.
Cruises
Business model
Market & competition
30
Worldwide container shipping is broken down into several large trade lanes,each of which comprises a number of routes. Each route links up diffe-rent ports and can have different frequencies. In 2006, inner-Asian trans-port was the highest-volume trade lane with 22 million TEU, followed byTrans-Pacific with 20 million TEU, Europe/Far East with 18 million TEU andAtlantic with 7 million TEU as well as Latin America with 3 million TEU.
Some of the Top 20 companies in container shipping are members of oneof the international alliances. Within these consortia all transport capacityis jointly used and departure times are coordinated. This allows the mem-bers to offer their customers a larger number of routes with higher fre-quencies as those they would be able to offer on their own. Hapag-Lloydis a founding member of Grand Alliance, one of the world’s largest con-tainer shipping consortia.
In terms of shipping capacity, the Danish shipping company Maersk is the largest container shipping company. Following the takeover of P&ONedlloyd, Maersk has a capacity of around 1.7 million TEU and is almosttwice as large as the number two, the Swiss Mediterranean Shipping Co.(MSC). The players ranking next are the French CMA/CGM and the Taiwa-nese Evergreen Line. With CP Ships, acquired in 2005, TUI’s shipping divi-sion has a capacity of 467 thousand TEU and thus ranks fifth.
For the shipping division, TUI pursues a growth strategy aimed at achievingminimum growth of 9% annually and thus matching the expected averagevolume growth of the industry. TUI’s fundamental growth orientation issupported by the following strategies:
1 Selective capacity growth of 8% to 15% depending on the geographicalmarkets
1 Efficient investment management to channel capital into large categoriesof ships
1 Consistent use of the synergies leveraged by the integration of CPShips, completed in the 2006 financial year
1 Flexible capacity management by means of a balanced fleet financingmix of ownership/long-term charter and short-term charter
TUI AGTUI AG is the Group’s parent company, headquartered in Hanover. It holdsinterests – usually 100% stakes – in the key Group companies operatingthe Group’s operative business in the individual countries, either directlyor indirectly. These companies, in turn, hold shares, too. At the balancesheet date, TUI AG’s group of consolidated companies comprised 387direct or indirect subsidiaries, including 39 German companies and 348companies headquartered abroad. In addition, 22 associated companiesand 32 joint ventures were included in TUI AG’s consolidated financialstatements measured at equity.
TUI AG is a stock corporation under German law, whose basic principle is dual management by two boards, the Executive and the SupervisoryBoard. The Executive and Supervisory Board cooperate closely on a basisof trust in controlling and monitoring the Company. The Executive Boardis responsible for the overall management of the Company.
Man
agem
ent
Rep
ort
Management Report Business and Operating Environment Group Turnover and Earnings Tourism Shipping Discontinuing Operations Earnings
Net Assets Financial Position Report on Subsequent Events Risk Report Remuneration Report Research and Development
Human Resources Environmental Protection Report on Expected Developments
Strategy
Group parent company
Organisation and management
31
Appointments and dismissals of Executive Board members are effected in accordance with sections 84 f. of the German Stock Corporation Act in combination with section 31 of the German Co-Determination Act.Amendments to the Articles of Association are effected in accordancewith the rules of sections 179 ff. of the German Stock Corporation Act in combination with section 24 of TUI’s Articles of Association.
As at the balance sheet date, the Executive Board of TUI AG comprisedsix members: the Chairman and five other Board members in charge of Finance, Human Resources/Legal, Controlling, Tourism and Shipping.An Executive Committee was set up in order to manage the Group’s ope-rative business. At the balance sheet date, it comprised the members ofTUI AG’s Executive Board and a total of five divisional directors in chargeof Central Europe, Northern Europe, Western Europe and Hotels & Res-orts in the tourism division as well as shipping.
Economic frameworkIn 2006, the world economy continued to grow overall. The InternationalMonetary Fund (IMF) forecasts an increase in world gross domestic pro-duct of 5.1% (IMF, September 2006). Growth thus roughly matched 2005levels and was slightly up on the medium-term average. In the course ofthe year, world economic growth decelerated. This was due to a slow-down in economic momentum in the US and to a lesser extent also inJapan. This was not full offset by expansion in the eurozone, which acce-lerated in the course of the year. In the wake of global economic growth,world trade picked up significantly, as in 2005. For 2006, the IMF expectsworld trade to grow by 8.9% and thus outperform the world economy.
Development in the regionsIn the course of the year, the individual economic regions showed consider-able differences in economic trends. Economic growth in the US sloweddown noticeable in the course of 2006. It was curbed by weaker demand byprivate households and very high residential property portfolios, whichcooled the real estate market. For the overall year, economic growth matched2005 levels. Japan’s economy continued to grow at the same rate as in2005, with economic activity slowing down substantially in the second halfof the year due to a restrictive public investment policy. In Asia, Chinaand India again recorded high growth rates. The remaining emerging eco-nomies of South East Asia recorded robust economic growth but did notreproduce the high growth levels achieved in 2005 in each individual case.Latin America reported a slight year-on-year increase in growth ratesthanks to strong domestic demand.
In the eurozone, the economy recorded a substantial upturn. The recoveryof economic growth was primarily based on the upswing in Germany,France and Italy. Economic momentum was driven by an increase indomestic demand in combination with a substantial expansion of capitalinvestment. Private consumption picked up slightly.
Development of the divisionsIn the tourism division, the development of worldwide markets fell onlyslightly short of the forecast made at the beginning of the year. The World
Executive Board and
Executive Committee
General development
Americas and Asia
Eurozone
Tourism
32
Tourism Organization (UNWTO) expected growth to continue at a rate of4 to 5% in 2006, following a decline in 2003. At 4.5%, growth in 2006 fellonly slightly short of the forecast of 4.6% for 2006, based on internationaltourism arrivals (UNWTO World Tourism Barometer, January 2007). How-ever, this growth was above all supported by the strong economic develop-ment in certain countries. Several Asian countries, such as South Korea,China and India, but also Brazil and Poland reported double-digit growthrates in departures. Growth in the two large European markets Germanyand UK, in contrast, was significantly below average. Bookings in thesecountries declined due to the good weather and above all the Soccer WorldCup as well as the fear of terrorist attacks. Bookings in Belgium, theNetherlands and Italy, in contrast, picked up considerably in recentmonths compared with booking levels at the beginning of the year.
In 2006, worldwide, a total of 100 million standard containers (TEU) wereshipped on overseas routes, an increase of 8.8% year-on-year (GlobalInsight, November 2006). The global containerised transport volume thusgrew virtually in line with the forecast expansion of world trade. Theincrease in demand for container transport was based on the solidgrowth of the world economy and the increase in the interdependence ofeconomic areas in the framework of globalisation. Besides the pronoun-ced global division of labour, the situation is characterised by the conti-nual relocation of production processes from the industrialised countriesto the Asian emerging markets. As a result, the highest growth rates wereagain achieved on the routes from Asia to Europe and in the Pacific region.However, the positive volume trend in container shipping went hand inhand with adverse framework parameters in the 2006 financial year: highaverage bunker costs throughout the year, strongly increased terminaland canal costs, declining freight rates in important trade lanes and anincrease in structural imbalances of cargo flows. The number of no-loadcontainers having to be transferred from regions with container overhangsto regions with container deficits rose increasingly.
The economic trend in the 2006 financial year largely met the expectationsof the Executive Board and thus matched the macroeconomic frameworkassumed as the basis for the budget. Both core businesses were impactedby the high average aircraft fuel and bunker costs in 2006. In tourism,several exogenous events such as the avian flu, the caricature controversyat the beginning of the year and the conflict in the Middle East temporarilyaffected customers’ booking behaviour in the markets. For the shippingdivision a declining business situation due to increasing shipping capacitybeside positive volume growth for the entire year was expected. Strongcost increases and declining freight rates – triggered by hard competition– overall in the branch resulted in considerably stronger adverse effectson Group earnings than expected.
Man
agem
ent
Rep
ort
Management Report Business and Operating Environment Group Turnover and Earnings Tourism Shipping Discontinuing Operations Earnings
Net Assets Financial Position Report on Subsequent Events Risk Report Remuneration Report Research and Development
Human Resources Environmental Protection Report on Expected Developments
Shipping
Assessment of economic framework
33
Group Turnover and Earnings Earningsgrowth in tourism. Market-induced year-on-year decline in shipping.
2006 was a challenging year for the TUI Group. Both core businesses – tourism and shipping – were impacted by one-off effects concerning on-going restructuring programmes according to IAS 37 and other one-offitems. Against this gains on disposals were generated from divestments of shareholdings. In order to ensure a transparent presentation of thedevelopment of earnings by divisions, the comments presented belowcomprise a reconciliation to underlying earnings (underlying EBITA bydivisions).
Due to the short period between the completion of the acquisition ofCP Ships in October 2005 and the preparation of the consolidated financialstatements for 2005, a preliminary revaluation of the acquired assets andliabilities (purchase price allocation) was effected as at 31 December 2005.The final purchase price allocation in October 2006 had minor effects onthe Group’s profit and loss statement. In order to enhance the comparabilityof figures, the figures for the 2005 financial year were restated. A corres-ponding explanation and reconciliation is provided in the section on‘Accounting principles’ in the notes on the consolidated financial state-ments.
Turnover and earnings by divisionsIn the completed financial year, tourism and shipping, the Group’s corebusinesses, recorded uneven business trends. Both divisions were characterised by restructuring expenses and the impact from other one-offitems while tourism also reported gains on disposals from the divestmentof shareholdings. Adjusted for these effects, tourism increased its earningslevel year-on-year. The overall positive trend was curbed by the poor per-formance of the French market and the increasingly difficult competitiveconditions in the British and Irish markets. The development of earningsof the shipping division was characterised by the development of freightrates in the cyclical container shipping. Earnings were determined by thehigh average bunker costs and the intensification of competition, whichwent hand in hand with a decline in freight rates. Moreover, high inte-gration costs associated with the integration of CP Ships, acquired in October 2005, were incurred in the completed financial year. Adjusted forthese effects, shipping achieved a slightly positive result and confirmedits high productivity level in comparison with its competitors. Overall, ear-nings by tourism did not match the expectations of the Executive Boardwhile the market-induced earnings level posted by the shipping divisionfell considerably short of expectations.
34
Assessment of the earnings situation
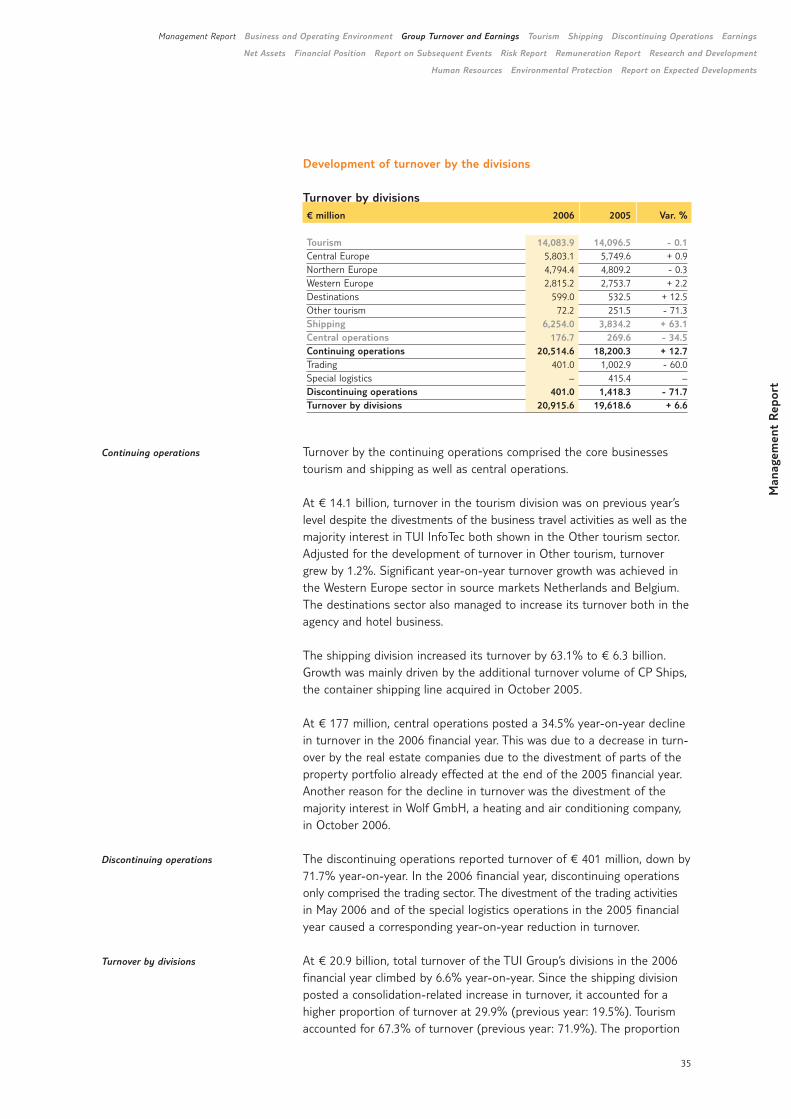
Development of turnover by the divisions
Turnover by divisions€ million 2006 2005 Var. %
Tourism 14,083.9 14,096.5 - 0.1Central Europe 5,803.1 5,749.6 + 0.9Northern Europe 4,794.4 4,809.2 - 0.3Western Europe 2,815.2 2,753.7 + 2.2Destinations 599.0 532.5 + 12.5Other tourism 72.2 251.5 - 71.3Shipping 6,254.0 3,834.2 + 63.1Central operations 176.7 269.6 - 34.5Continuing operations 20,514.6 18,200.3 + 12.7Trading 401.0 1,002.9 - 60.0Special logistics – 415.4 –Discontinuing operations 401.0 1,418.3 - 71.7Turnover by divisions 20,915.6 19,618.6 + 6.6
Turnover by the continuing operations comprised the core businessestourism and shipping as well as central operations.
At € 14.1 billion, turnover in the tourism division was on previous year’slevel despite the divestments of the business travel activities as well as themajority interest in TUI InfoTec both shown in the Other tourism sector.Adjusted for the development of turnover in Other tourism, turnovergrew by 1.2%. Significant year-on-year turnover growth was achieved inthe Western Europe sector in source markets Netherlands and Belgium.The destinations sector also managed to increase its turnover both in theagency and hotel business.
The shipping division increased its turnover by 63.1% to € 6.3 billion.Growth was mainly driven by the additional turnover volume of CP Ships,the container shipping line acquired in October 2005.
At € 177 million, central operations posted a 34.5% year-on-year declinein turnover in the 2006 financial year. This was due to a decrease in turn-over by the real estate companies due to the divestment of parts of theproperty portfolio already effected at the end of the 2005 financial year.Another reason for the decline in turnover was the divestment of themajority interest in Wolf GmbH, a heating and air conditioning company,in October 2006.
The discontinuing operations reported turnover of € 401 million, down by71.7% year-on-year. In the 2006 financial year, discontinuing operationsonly comprised the trading sector. The divestment of the trading activitiesin May 2006 and of the special logistics operations in the 2005 financialyear caused a corresponding year-on-year reduction in turnover.
At € 20.9 billion, total turnover of the TUI Group’s divisions in the 2006financial year climbed by 6.6% year-on-year. Since the shipping divisionposted a consolidation-related increase in turnover, it accounted for ahigher proportion of turnover at 29.9% (previous year: 19.5%). Tourismaccounted for 67.3% of turnover (previous year: 71.9%). The proportion
Man
agem
ent
Rep
ort
Management Report Business and Operating Environment Group Turnover and Earnings Tourism Shipping Discontinuing Operations Earnings
Net Assets Financial Position Report on Subsequent Events Risk Report Remuneration Report Research and Development
Human Resources Environmental Protection Report on Expected Developments
Continuing operations
Discontinuing operations
Turnover by divisions
35
of turnover of central operations and discontinuing operations declinedto 2.8% (previous year: 8.6%) due to the divestments.
Development of earnings by the divisions
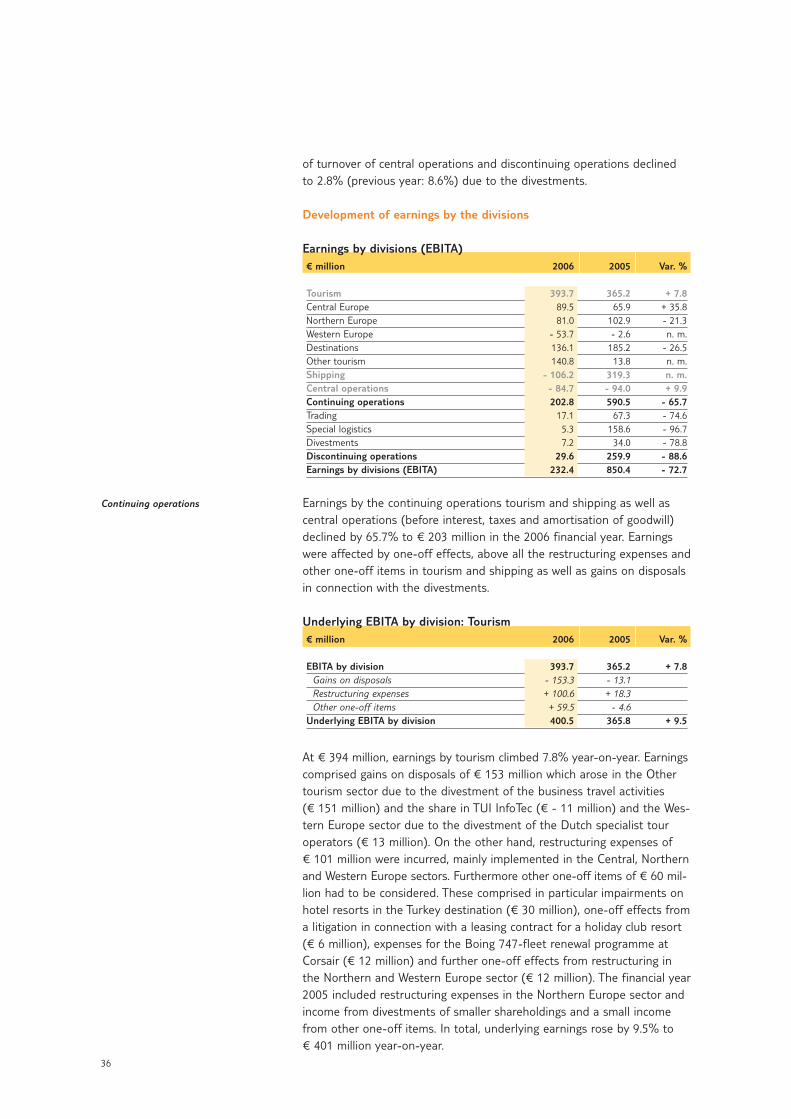
Earnings by divisions (EBITA)€ million 2006 2005 Var. %
Tourism 393.7 365.2 + 7.8Central Europe 89.5 65.9 + 35.8Northern Europe 81.0 102.9 - 21.3Western Europe - 53.7 - 2.6 n. m.Destinations 136.1 185.2 - 26.5Other tourism 140.8 13.8 n. m.Shipping - 106.2 319.3 n. m.Central operations - 84.7 - 94.0 + 9.9Continuing operations 202.8 590.5 - 65.7Trading 17.1 67.3 - 74.6Special logistics 5.3 158.6 - 96.7Divestments 7.2 34.0 - 78.8Discontinuing operations 29.6 259.9 - 88.6Earnings by divisions (EBITA) 232.4 850.4 - 72.7
Earnings by the continuing operations tourism and shipping as well ascentral operations (before interest, taxes and amortisation of goodwill)declined by 65.7% to € 203 million in the 2006 financial year. Earningswere affected by one-off effects, above all the restructuring expenses andother one-off items in tourism and shipping as well as gains on disposalsin connection with the divestments.
Underlying EBITA by division: Tourism € million 2006 2005 Var. %
EBITA by division 393.7 365.2 + 7.8Gains on disposals - 153.3 - 13.1Restructuring expenses + 100.6 + 18.3Other one-off items + 59.5 - 4.6
Underlying EBITA by division 400.5 365.8 + 9.5
At € 394 million, earnings by tourism climbed 7.8% year-on-year. Earningscomprised gains on disposals of € 153 million which arose in the Othertourism sector due to the divestment of the business travel activities (€ 151 million) and the share in TUI InfoTec (€ - 11 million) and the Wes-tern Europe sector due to the divestment of the Dutch specialist touroperators (€ 13 million). On the other hand, restructuring expenses of€ 101 million were incurred, mainly implemented in the Central, Northernand Western Europe sectors. Furthermore other one-off items of € 60 mil-lion had to be considered. These comprised in particular impairments onhotel resorts in the Turkey destination (€ 30 million), one-off effects froma litigation in connection with a leasing contract for a holiday club resort(€ 6 million), expenses for the Boing 747-fleet renewal programme atCorsair (€ 12 million) and further one-off effects from restructuring inthe Northern and Western Europe sector (€ 12 million). The financial year2005 included restructuring expenses in the Northern Europe sector andincome from divestments of smaller shareholdings and a small incomefrom other one-off items. In total, underlying earnings rose by 9.5% to € 401 million year-on-year.
Continuing operations
36
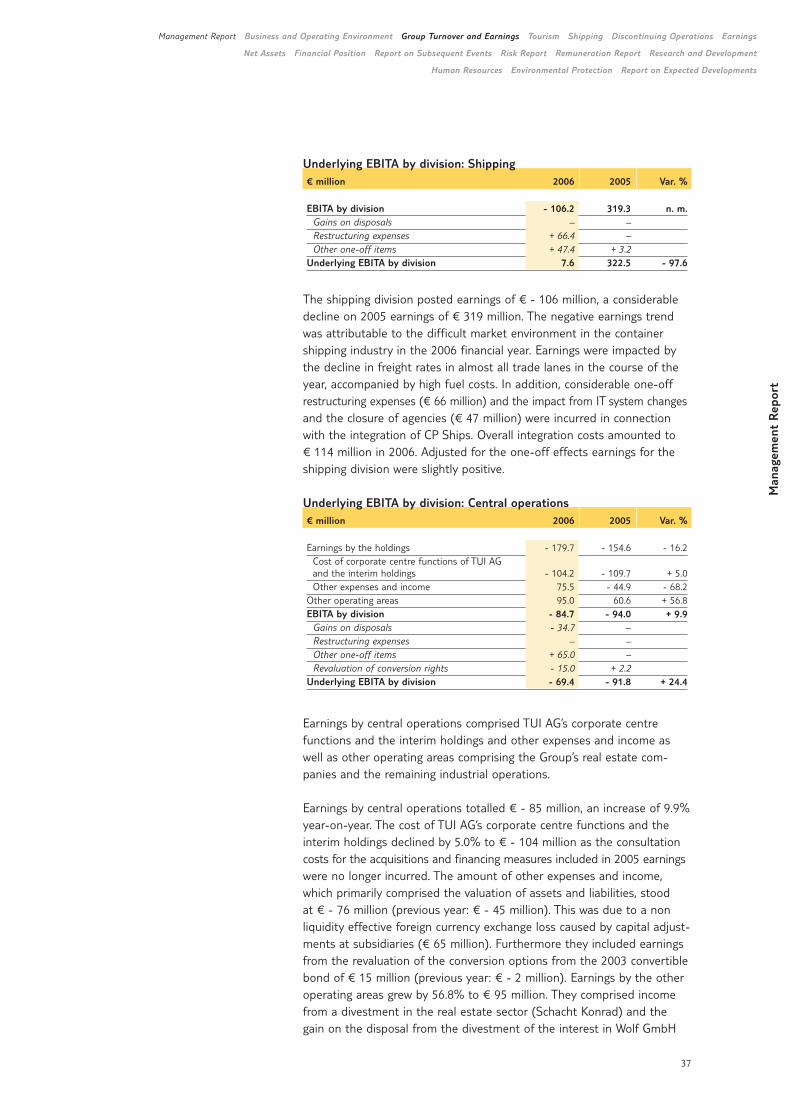
Underlying EBITA by division: Shipping € million 2006 2005 Var. %
EBITA by division - 106.2 319.3 n. m.Gains on disposals – –Restructuring expenses + 66.4 –Other one-off items + 47.4 + 3.2
Underlying EBITA by division 7.6 322.5 - 97.6
The shipping division posted earnings of € - 106 million, a considerabledecline on 2005 earnings of € 319 million. The negative earnings trendwas attributable to the difficult market environment in the containershipping industry in the 2006 financial year. Earnings were impacted bythe decline in freight rates in almost all trade lanes in the course of theyear, accompanied by high fuel costs. In addition, considerable one-offrestructuring expenses (€ 66 million) and the impact from IT system changesand the closure of agencies (€ 47 million) were incurred in connectionwith the integration of CP Ships. Overall integration costs amounted to € 114 million in 2006. Adjusted for the one-off effects earnings for theshipping division were slightly positive.
Underlying EBITA by division: Central operations€ million 2006 2005 Var. %
Earnings by the holdings - 179.7 - 154.6 - 16.2Cost of corporate centre functions of TUI AGand the interim holdings - 104.2 - 109.7 + 5.0Other expenses and income 75.5 - 44.9 - 68.2
Other operating areas 95.0 60.6 + 56.8EBITA by division - 84.7 - 94.0 + 9.9
Gains on disposals - 34.7 –Restructuring expenses – –Other one-off items + 65.0 –Revaluation of conversion rights - 15.0 + 2.2
Underlying EBITA by division - 69.4 - 91.8 + 24.4
Earnings by central operations comprised TUI AG’s corporate centre functions and the interim holdings and other expenses and income aswell as other operating areas comprising the Group’s real estate com-panies and the remaining industrial operations.
Earnings by central operations totalled € - 85 million, an increase of 9.9%year-on-year. The cost of TUI AG’s corporate centre functions and theinterim holdings declined by 5.0% to € - 104 million as the consultationcosts for the acquisitions and financing measures included in 2005 earningswere no longer incurred. The amount of other expenses and income,which primarily comprised the valuation of assets and liabilities, stood at € - 76 million (previous year: € - 45 million). This was due to a nonliquidity effective foreign currency exchange loss caused by capital adjust-ments at subsidiaries (€ 65 million). Furthermore they included earningsfrom the revaluation of the conversion options from the 2003 convertiblebond of € 15 million (previous year: € - 2 million). Earnings by the otheroperating areas grew by 56.8% to € 95 million. They comprised incomefrom a divestment in the real estate sector (Schacht Konrad) and thegain on the disposal from the divestment of the interest in Wolf GmbH
Man
agem
ent
Rep
ort
Management Report Business and Operating Environment Group Turnover and Earnings Tourism Shipping Discontinuing Operations Earnings
Net Assets Financial Position Report on Subsequent Events Risk Report Remuneration Report Research and Development
Human Resources Environmental Protection Report on Expected Developments
37
in the fourth quarter of 2006 (€ 35 million), the Group’s last remainingindustrial activity. Adjusted for the net result of disposals, foreign currencyexchange loss due to capital adjustments and earning effects from therevaluation of the conversion options included in earnings, earnings bycentral operations increased by 24.4% to € - 69 million.
Earnings by discontinuing operations declined to € 30 million (previousyear: € 260 million). This earnings trend was due to the divestment of thesteel trading activities in May 2006 and the divestments of the speciallogistics operations in the 2005 financial year. Earnings comprised the netresult of disposals from the divestment of steel trading operations as wellas subsequent income from divestments already effected in the previousyears. These effects almost balanced each other out.
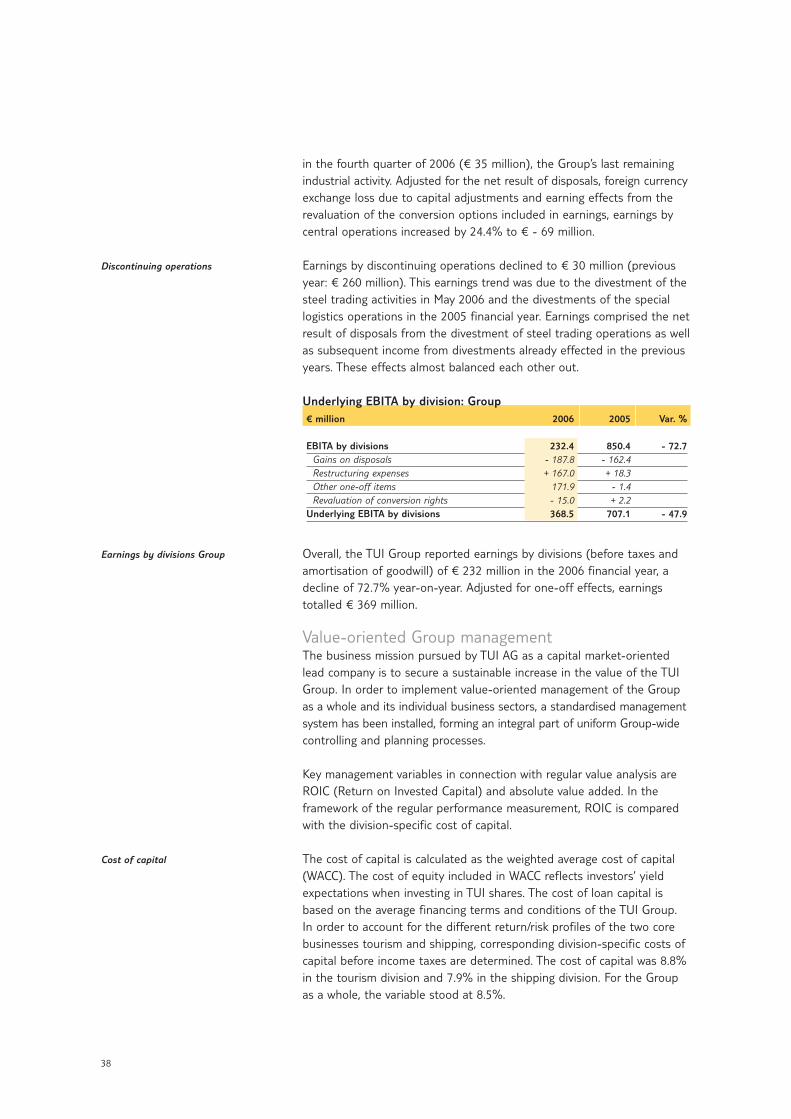
Underlying EBITA by division: Group € million 2006 2005 Var. %
EBITA by divisions 232.4 850.4 - 72.7Gains on disposals - 187.8 - 162.4Restructuring expenses + 167.0 + 18.3Other one-off items 171.9 - 1.4Revaluation of conversion rights - 15.0 + 2.2
Underlying EBITA by divisions 368.5 707.1 - 47.9
Overall, the TUI Group reported earnings by divisions (before taxes andamortisation of goodwill) of € 232 million in the 2006 financial year, adecline of 72.7% year-on-year. Adjusted for one-off effects, earningstotalled € 369 million.
Value-oriented Group managementThe business mission pursued by TUI AG as a capital market-orientedlead company is to secure a sustainable increase in the value of the TUIGroup. In order to implement value-oriented management of the Groupas a whole and its individual business sectors, a standardised managementsystem has been installed, forming an integral part of uniform Group-widecontrolling and planning processes.
Key management variables in connection with regular value analysis areROIC (Return on Invested Capital) and absolute value added. In the framework of the regular performance measurement, ROIC is comparedwith the division-specific cost of capital.
The cost of capital is calculated as the weighted average cost of capital(WACC). The cost of equity included in WACC reflects investors’ yieldexpectations when investing in TUI shares. The cost of loan capital isbased on the average financing terms and conditions of the TUI Group. In order to account for the different return/risk profiles of the two corebusinesses tourism and shipping, corresponding division-specific costs ofcapital before income taxes are determined. The cost of capital was 8.8%in the tourism division and 7.9% in the shipping division. For the Groupas a whole, the variable stood at 8.5%.
Discontinuing operations
Earnings by divisions Group
Cost of capital
38
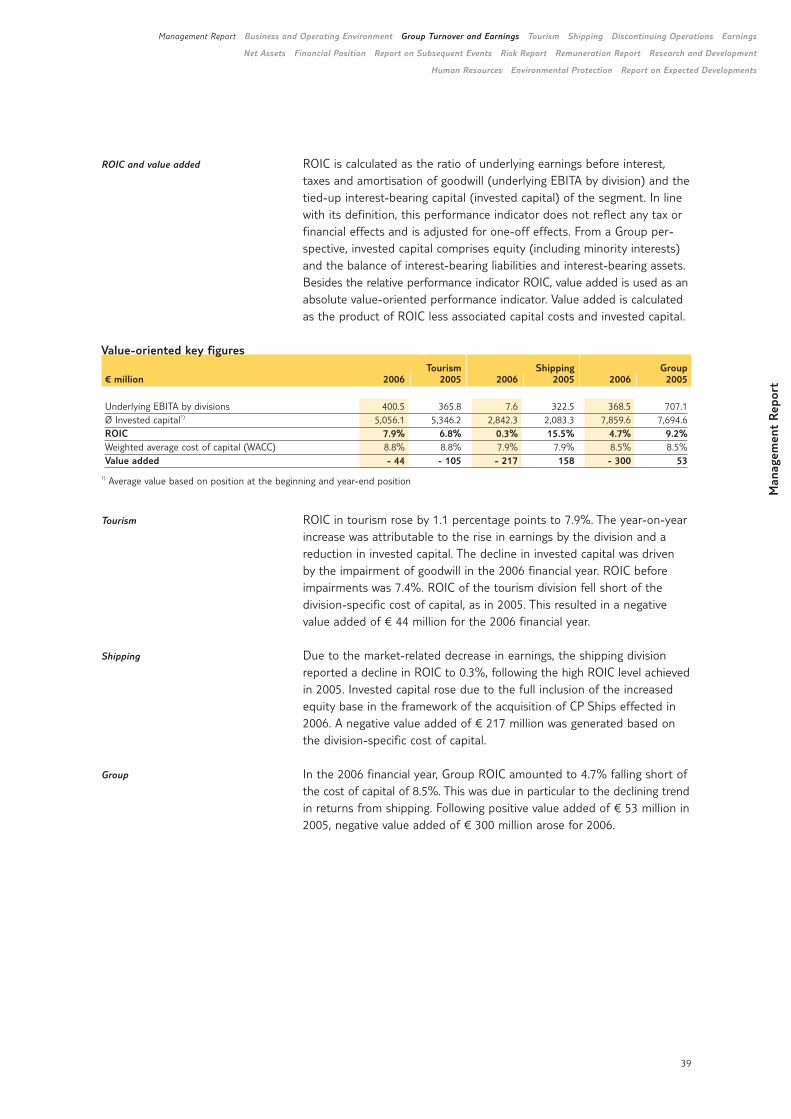
ROIC is calculated as the ratio of underlying earnings before interest,taxes and amortisation of goodwill (underlying EBITA by division) and thetied-up interest-bearing capital (invested capital) of the segment. In linewith its definition, this performance indicator does not reflect any tax orfinancial effects and is adjusted for one-off effects. From a Group per-spective, invested capital comprises equity (including minority interests)and the balance of interest-bearing liabilities and interest-bearing assets.Besides the relative performance indicator ROIC, value added is used as anabsolute value-oriented performance indicator. Value added is calculatedas the product of ROIC less associated capital costs and invested capital.
ROIC in tourism rose by 1.1 percentage points to 7.9%. The year-on-yearincrease was attributable to the rise in earnings by the division and areduction in invested capital. The decline in invested capital was driven by the impairment of goodwill in the 2006 financial year. ROIC beforeimpairments was 7.4%. ROIC of the tourism division fell short of the division-specific cost of capital, as in 2005. This resulted in a negativevalue added of € 44 million for the 2006 financial year.
Due to the market-related decrease in earnings, the shipping divisionreported a decline in ROIC to 0.3%, following the high ROIC level achievedin 2005. Invested capital rose due to the full inclusion of the increasedequity base in the framework of the acquisition of CP Ships effected in2006. A negative value added of € 217 million was generated based onthe division-specific cost of capital.
In the 2006 financial year, Group ROIC amounted to 4.7% falling short ofthe cost of capital of 8.5%. This was due in particular to the declining trendin returns from shipping. Following positive value added of € 53 million in2005, negative value added of € 300 million arose for 2006.
Man
agem
ent
Rep
ort
Management Report Business and Operating Environment Group Turnover and Earnings Tourism Shipping Discontinuing Operations Earnings
Net Assets Financial Position Report on Subsequent Events Risk Report Remuneration Report Research and Development
Human Resources Environmental Protection Report on Expected Developments
ROIC and value added
Tourism
Shipping
Group
39
Value-oriented key figuresTourism Shipping Group
€ million 2006 2005 2006 2005 2006 2005
Underlying EBITA by divisions 400.5 365.8 7.6 322.5 368.5 707.1Ø Invested capital1) 5,056.1 5,346.2 2,842.3 2,083.3 7,859.6 7,694.6ROIC 7.9% 6.8% 0.3% 15.5% 4.7% 9.2%Weighted average cost of capital (WACC) 8.8% 8.8% 7.9% 7.9% 8.5% 8.5%Value added - 44 - 105 - 217 158 - 300 53
1) Average value based on position at the beginning and year-end position
Tourism
TUI has a clear objective: growth. Since the growth in tourism is largely generated via the web, TUI’s internet and airline strategies will need to be dovetailed closely and effectively. Combined with the cost-cutting programmesalready adopted, this will ensure that we continue to launch attractive travel offerings on the market.
40
Tourism Increased earnings. Difficult market environment in the UK and France.
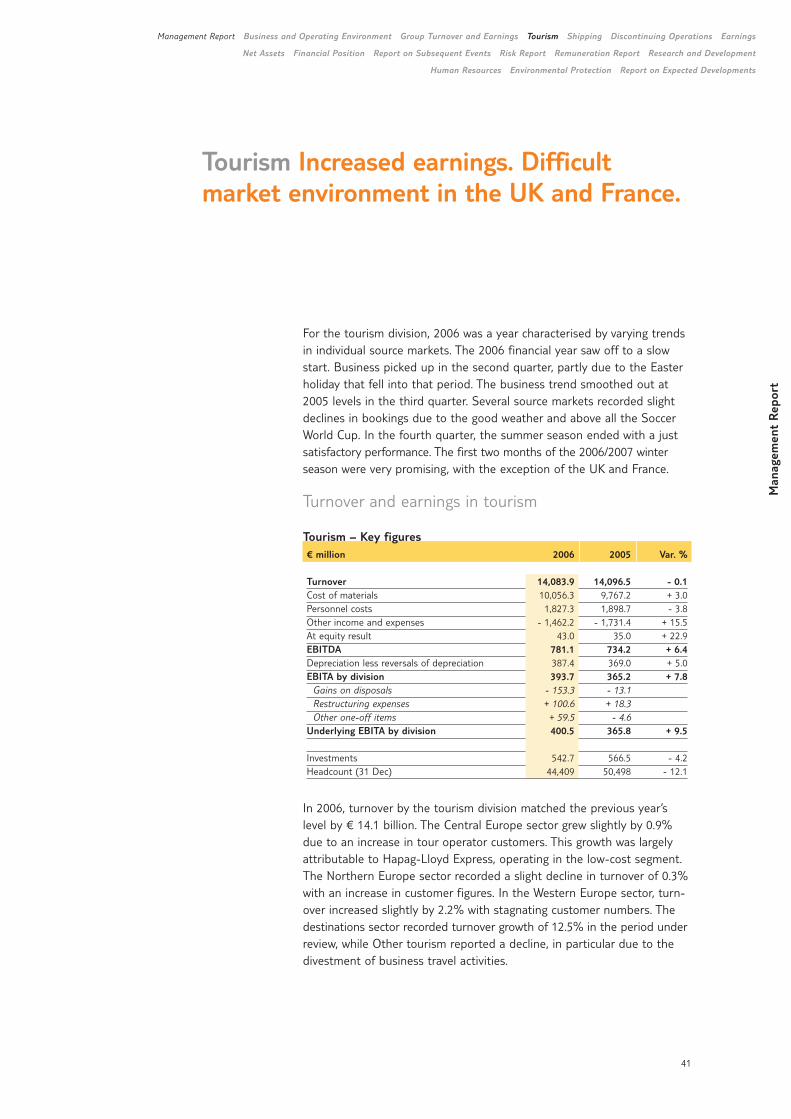
For the tourism division, 2006 was a year characterised by varying trendsin individual source markets. The 2006 financial year saw off to a slowstart. Business picked up in the second quarter, partly due to the Easterholiday that fell into that period. The business trend smoothed out at2005 levels in the third quarter. Several source markets recorded slightdeclines in bookings due to the good weather and above all the SoccerWorld Cup. In the fourth quarter, the summer season ended with a justsatisfactory performance. The first two months of the 2006/2007 winterseason were very promising, with the exception of the UK and France.
Turnover and earnings in tourism
Tourism – Key figures€ million 2006 2005 Var. %
Turnover 14,083.9 14,096.5 - 0.1Cost of materials 10,056.3 9,767.2 + 3.0Personnel costs 1,827.3 1,898.7 - 3.8Other income and expenses - 1,462.2 - 1,731.4 + 15.5At equity result 43.0 35.0 + 22.9EBITDA 781.1 734.2 + 6.4Depreciation less reversals of depreciation 387.4 369.0 + 5.0EBITA by division 393.7 365.2 + 7.8
Gains on disposals - 153.3 - 13.1Restructuring expenses + 100.6 + 18.3Other one-off items + 59.5 - 4.6
Underlying EBITA by division 400.5 365.8 + 9.5
Investments 542.7 566.5 - 4.2Headcount (31 Dec) 44,409 50,498 - 12.1
In 2006, turnover by the tourism division matched the previous year’slevel by € 14.1 billion. The Central Europe sector grew slightly by 0.9%due to an increase in tour operator customers. This growth was largelyattributable to Hapag-Lloyd Express, operating in the low-cost segment.The Northern Europe sector recorded a slight decline in turnover of 0.3%with an increase in customer figures. In the Western Europe sector, turn-over increased slightly by 2.2% with stagnating customer numbers. Thedestinations sector recorded turnover growth of 12.5% in the period underreview, while Other tourism reported a decline, in particular due to thedivestment of business travel activities.
41
Man
agem
ent
Rep
ort
Management Report Business and Operating Environment Group Turnover and Earnings Tourism Shipping Discontinuing Operations Earnings
Net Assets Financial Position Report on Subsequent Events Risk Report Remuneration Report Research and Development
Human Resources Environmental Protection Report on Expected Developments
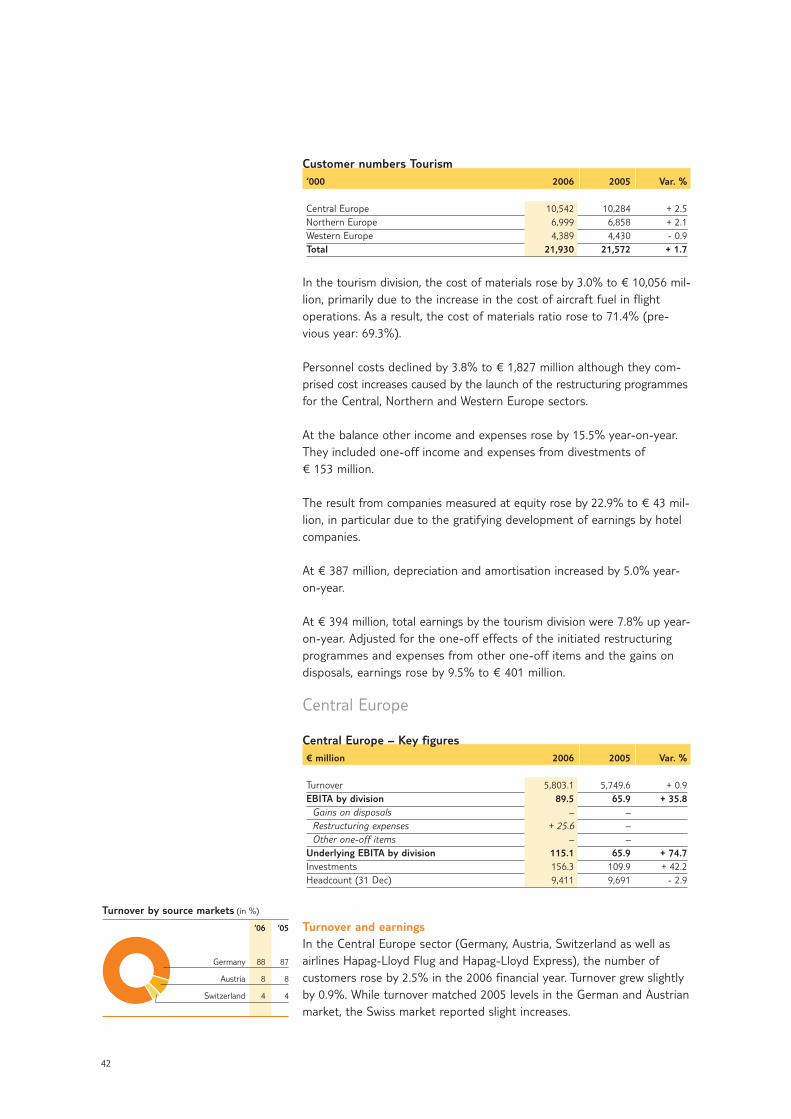
Customer numbers Tourism‘000 2006 2005 Var. %
Central Europe 10,542 10,284 + 2.5Northern Europe 6,999 6,858 + 2.1Western Europe 4,389 4,430 - 0.9Total 21,930 21,572 + 1.7
In the tourism division, the cost of materials rose by 3.0% to € 10,056 mil-lion, primarily due to the increase in the cost of aircraft fuel in flight operations. As a result, the cost of materials ratio rose to 71.4% (pre-vious year: 69.3%).
Personnel costs declined by 3.8% to € 1,827 million although they com-prised cost increases caused by the launch of the restructuring programmesfor the Central, Northern and Western Europe sectors.
At the balance other income and expenses rose by 15.5% year-on-year.They included one-off income and expenses from divestments of€ 153 million.
The result from companies measured at equity rose by 22.9% to € 43 mil-lion, in particular due to the gratifying development of earnings by hotelcompanies.
At € 387 million, depreciation and amortisation increased by 5.0% year-on-year.
At € 394 million, total earnings by the tourism division were 7.8% up year-on-year. Adjusted for the one-off effects of the initiated restructuringprogrammes and expenses from other one-off items and the gains ondisposals, earnings rose by 9.5% to € 401 million.
Central Europe
Central Europe – Key figures€ million 2006 2005 Var. %
Turnover 5,803.1 5,749.6 + 0.9EBITA by division 89.5 65.9 + 35.8
Gains on disposals – –Restructuring expenses + 25.6 –Other one-off items – –
Underlying EBITA by division 115.1 65.9 + 74.7Investments 156.3 109.9 + 42.2Headcount (31 Dec) 9,411 9,691 - 2.9
Turnover and earnings In the Central Europe sector (Germany, Austria, Switzerland as well asairlines Hapag-Lloyd Flug and Hapag-Lloyd Express), the number ofcustomers rose by 2.5% in the 2006 financial year. Turnover grew slightlyby 0.9%. While turnover matched 2005 levels in the German and Austrianmarket, the Swiss market reported slight increases.
42
Turnover by source markets (in %)
‘06 ‘05
Germany 88 87
Austria 8 8
Switzerland 4 4
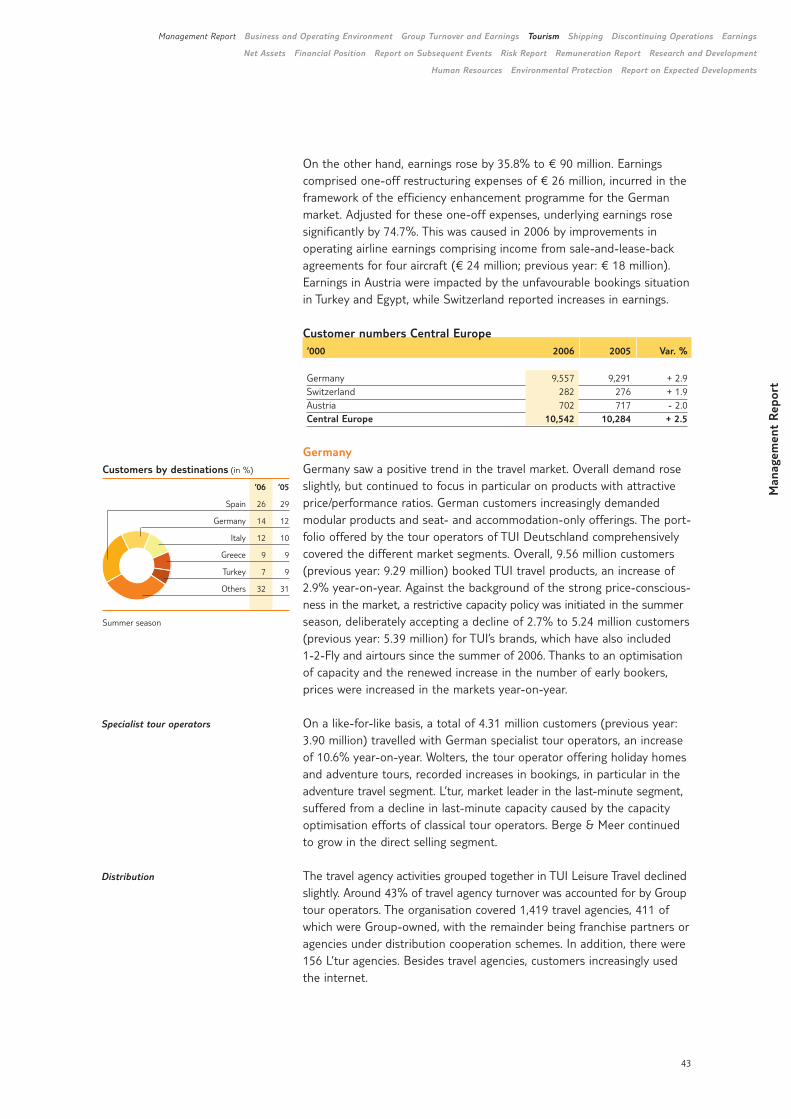
On the other hand, earnings rose by 35.8% to € 90 million. Earningscomprised one-off restructuring expenses of € 26 million, incurred in theframework of the efficiency enhancement programme for the Germanmarket. Adjusted for these one-off expenses, underlying earnings rosesignificantly by 74.7%. This was caused in 2006 by improvements in operating airline earnings comprising income from sale-and-lease-backagreements for four aircraft (€ 24 million; previous year: € 18 million).Earnings in Austria were impacted by the unfavourable bookings situationin Turkey and Egypt, while Switzerland reported increases in earnings.
Customer numbers Central Europe ‘000 2006 2005 Var. %
Germany 9,557 9,291 + 2.9Switzerland 282 276 + 1.9Austria 702 717 - 2.0Central Europe 10,542 10,284 + 2.5
GermanyGermany saw a positive trend in the travel market. Overall demand roseslightly, but continued to focus in particular on products with attractiveprice/performance ratios. German customers increasingly demandedmodular products and seat- and accommodation-only offerings. The port-folio offered by the tour operators of TUI Deutschland comprehensivelycovered the different market segments. Overall, 9.56 million customers(previous year: 9.29 million) booked TUI travel products, an increase of2.9% year-on-year. Against the background of the strong price-conscious-ness in the market, a restrictive capacity policy was initiated in the summerseason, deliberately accepting a decline of 2.7% to 5.24 million customers(previous year: 5.39 million) for TUI’s brands, which have also included 1-2-Fly and airtours since the summer of 2006. Thanks to an optimisationof capacity and the renewed increase in the number of early bookers, prices were increased in the markets year-on-year.
On a like-for-like basis, a total of 4.31 million customers (previous year:3.90 million) travelled with German specialist tour operators, an increaseof 10.6% year-on-year. Wolters, the tour operator offering holiday homesand adventure tours, recorded increases in bookings, in particular in theadventure travel segment. L’tur, market leader in the last-minute segment,suffered from a decline in last-minute capacity caused by the capacityoptimisation efforts of classical tour operators. Berge & Meer continuedto grow in the direct selling segment.
The travel agency activities grouped together in TUI Leisure Travel declinedslightly. Around 43% of travel agency turnover was accounted for by Grouptour operators. The organisation covered 1,419 travel agencies, 411 ofwhich were Group-owned, with the remainder being franchise partners oragencies under distribution cooperation schemes. In addition, there were156 L’tur agencies. Besides travel agencies, customers increasingly usedthe internet.
Man
agem
ent
Rep
ort
Management Report Business and Operating Environment Group Turnover and Earnings Tourism Shipping Discontinuing Operations Earnings
Net Assets Financial Position Report on Subsequent Events Risk Report Remuneration Report Research and Development
Human Resources Environmental Protection Report on Expected Developments
Specialist tour operators
Distribution
43
Customers by destinations (in %)
‘06 ‘05
Spain 26 29
Germany 14 12
Italy 12 10
Greece 9 9
Turkey 7 9
Others 32 31
Summer season
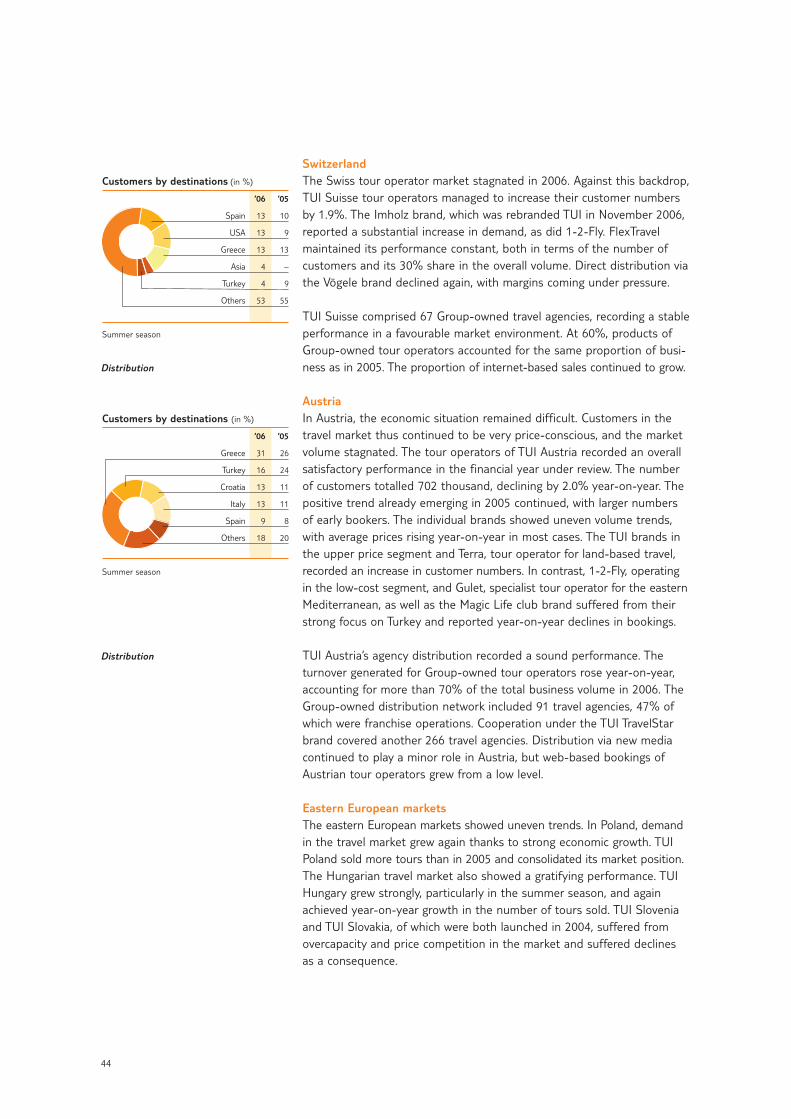
SwitzerlandThe Swiss tour operator market stagnated in 2006. Against this backdrop,TUI Suisse tour operators managed to increase their customer numbersby 1.9%. The Imholz brand, which was rebranded TUI in November 2006,reported a substantial increase in demand, as did 1-2-Fly. FlexTravelmaintained its performance constant, both in terms of the number ofcustomers and its 30% share in the overall volume. Direct distribution viathe Vögele brand declined again, with margins coming under pressure.
TUI Suisse comprised 67 Group-owned travel agencies, recording a stableperformance in a favourable market environment. At 60%, products ofGroup-owned tour operators accounted for the same proportion of busi-ness as in 2005. The proportion of internet-based sales continued to grow.
AustriaIn Austria, the economic situation remained difficult. Customers in thetravel market thus continued to be very price-conscious, and the marketvolume stagnated. The tour operators of TUI Austria recorded an overallsatisfactory performance in the financial year under review. The numberof customers totalled 702 thousand, declining by 2.0% year-on-year. Thepositive trend already emerging in 2005 continued, with larger numbersof early bookers. The individual brands showed uneven volume trends,with average prices rising year-on-year in most cases. The TUI brands inthe upper price segment and Terra, tour operator for land-based travel,recorded an increase in customer numbers. In contrast, 1-2-Fly, operatingin the low-cost segment, and Gulet, specialist tour operator for the easternMediterranean, as well as the Magic Life club brand suffered from theirstrong focus on Turkey and reported year-on-year declines in bookings.
TUI Austria’s agency distribution recorded a sound performance. The turnover generated for Group-owned tour operators rose year-on-year,accounting for more than 70% of the total business volume in 2006. TheGroup-owned distribution network included 91 travel agencies, 47% ofwhich were franchise operations. Cooperation under the TUI TravelStarbrand covered another 266 travel agencies. Distribution via new mediacontinued to play a minor role in Austria, but web-based bookings ofAustrian tour operators grew from a low level.
Eastern European marketsThe eastern European markets showed uneven trends. In Poland, demandin the travel market grew again thanks to strong economic growth. TUIPoland sold more tours than in 2005 and consolidated its market position.The Hungarian travel market also showed a gratifying performance. TUIHungary grew strongly, particularly in the summer season, and againachieved year-on-year growth in the number of tours sold. TUI Sloveniaand TUI Slovakia, of which were both launched in 2004, suffered fromovercapacity and price competition in the market and suffered declinesas a consequence.
Distribution
Distribution
44
Customers by destinations (in %)
‘06 ‘05
Greece 31 26
Turkey 16 24
Croatia 13 11
Italy 13 11
Spain 9 8
Others 18 20
Summer season
Customers by destinations (in %)
‘06 ‘05
Spain 13 10
USA 13 9
Greece 13 13
Asia 4 –
Turkey 4 9
Others 53 55
Summer season
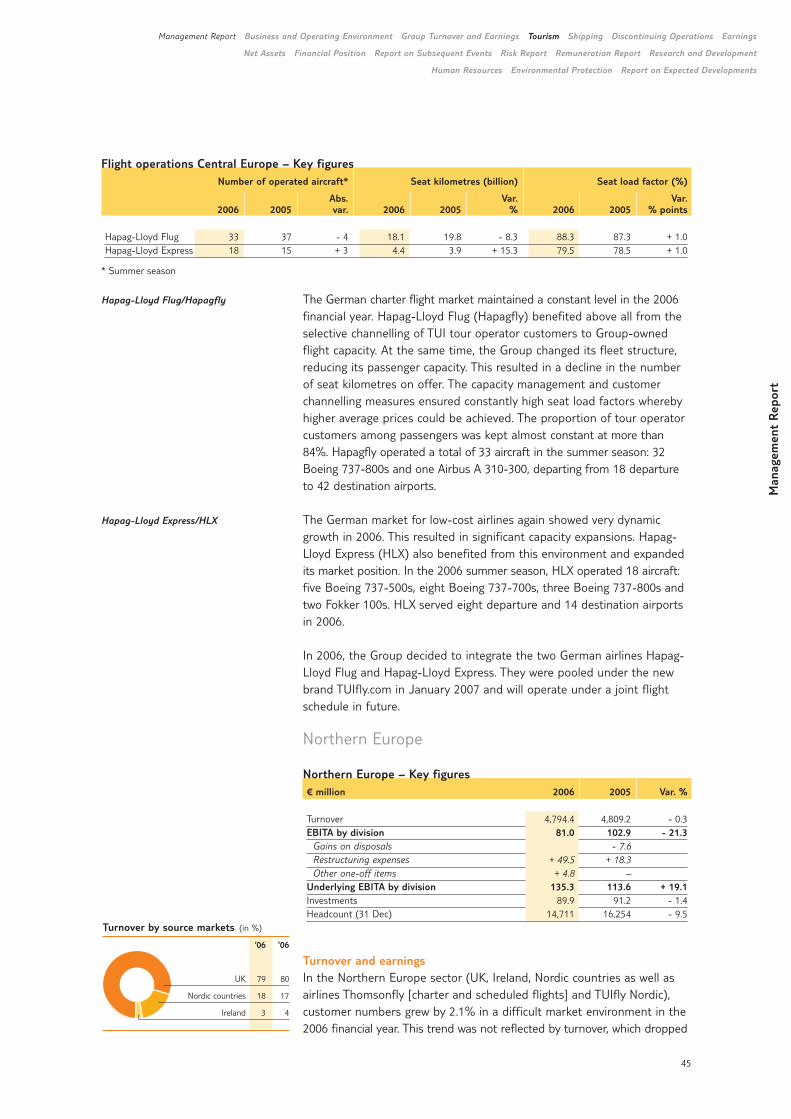
The German charter flight market maintained a constant level in the 2006financial year. Hapag-Lloyd Flug (Hapagfly) benefited above all from theselective channelling of TUI tour operator customers to Group-ownedflight capacity. At the same time, the Group changed its fleet structure,reducing its passenger capacity. This resulted in a decline in the numberof seat kilometres on offer. The capacity management and customerchannelling measures ensured constantly high seat load factors wherebyhigher average prices could be achieved. The proportion of tour operatorcustomers among passengers was kept almost constant at more than84%. Hapagfly operated a total of 33 aircraft in the summer season: 32Boeing 737-800s and one Airbus A 310-300, departing from 18 departureto 42 destination airports.
The German market for low-cost airlines again showed very dynamicgrowth in 2006. This resulted in significant capacity expansions. Hapag-Lloyd Express (HLX) also benefited from this environment and expandedits market position. In the 2006 summer season, HLX operated 18 aircraft:five Boeing 737-500s, eight Boeing 737-700s, three Boeing 737-800s andtwo Fokker 100s. HLX served eight departure and 14 destination airportsin 2006.
In 2006, the Group decided to integrate the two German airlines Hapag-Lloyd Flug and Hapag-Lloyd Express. They were pooled under the newbrand TUIfly.com in January 2007 and will operate under a joint flightschedule in future.
Northern Europe
Northern Europe – Key figures€ million 2006 2005 Var. %
Turnover 4,794.4 4,809.2 - 0.3EBITA by division 81.0 102.9 - 21.3
Gains on disposals - 7.6Restructuring expenses + 49.5 + 18.3Other one-off items + 4.8 –
Underlying EBITA by division 135.3 113.6 + 19.1Investments 89.9 91.2 - 1.4Headcount (31 Dec) 14,711 16,254 - 9.5
Turnover and earnings In the Northern Europe sector (UK, Ireland, Nordic countries as well asairlines Thomsonfly [charter and scheduled flights] and TUIfly Nordic),customer numbers grew by 2.1% in a difficult market environment in the2006 financial year. This trend was not reflected by turnover, which dropped
Man
agem
ent
Rep
ort
Management Report Business and Operating Environment Group Turnover and Earnings Tourism Shipping Discontinuing Operations Earnings
Net Assets Financial Position Report on Subsequent Events Risk Report Remuneration Report Research and Development
Human Resources Environmental Protection Report on Expected Developments
Hapag-Lloyd Flug/Hapagfly
Hapag-Lloyd Express/HLX
45
Flight operations Central Europe – Key figures Number of operated aircraft* Seat kilometres (billion) Seat load factor (%)
Abs. Var. Var. 2006 2005 var. 2006 2005 % 2006 2005 % points
Hapag-Lloyd Flug 33 37 - 4 18.1 19.8 - 8.3 88.3 87.3 + 1.0Hapag-Lloyd Express 18 15 + 3 4.4 3.9 + 15.3 79.5 78.5 + 1.0
* Summer season
Turnover by source markets (in %)
‘06 ‘06
UK 79 80
Nordic countries 18 17
Ireland 3 4
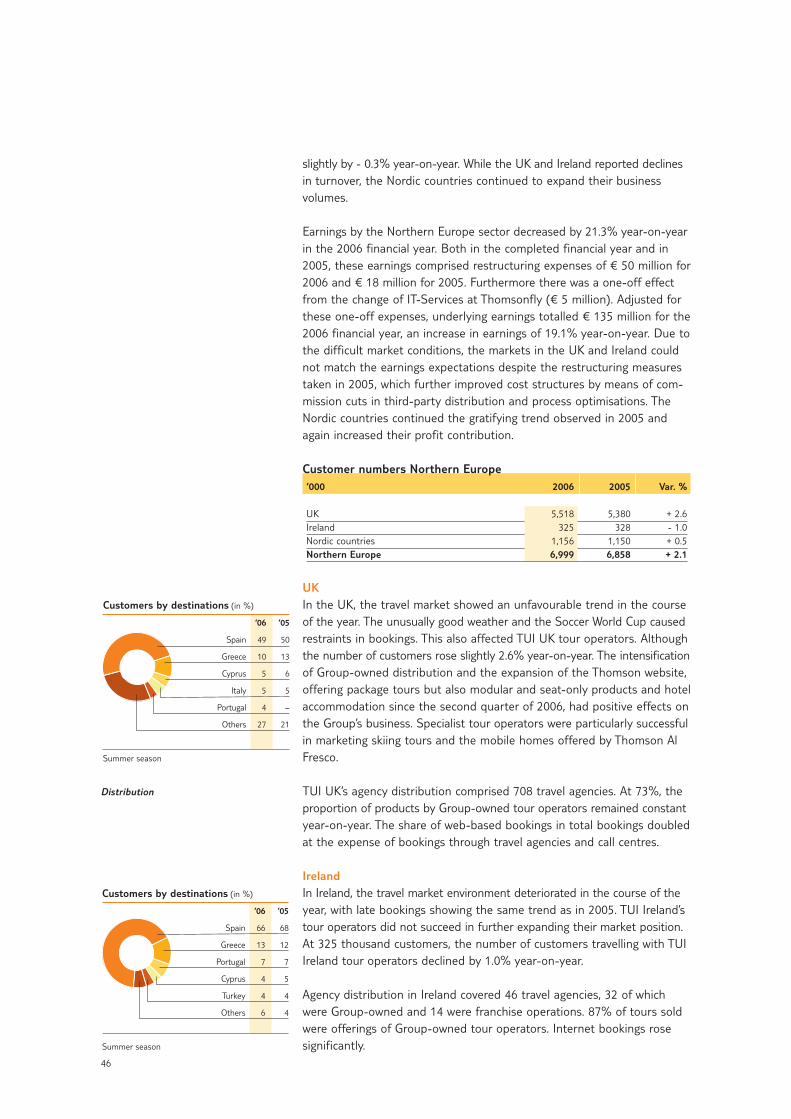
slightly by - 0.3% year-on-year. While the UK and Ireland reported declinesin turnover, the Nordic countries continued to expand their businessvolumes.
Earnings by the Northern Europe sector decreased by 21.3% year-on-yearin the 2006 financial year. Both in the completed financial year and in2005, these earnings comprised restructuring expenses of € 50 million for2006 and € 18 million for 2005. Furthermore there was a one-off effectfrom the change of IT-Services at Thomsonfly (€ 5 million). Adjusted forthese one-off expenses, underlying earnings totalled € 135 million for the2006 financial year, an increase in earnings of 19.1% year-on-year. Due tothe difficult market conditions, the markets in the UK and Ireland couldnot match the earnings expectations despite the restructuring measurestaken in 2005, which further improved cost structures by means of com-mission cuts in third-party distribution and process optimisations. TheNordic countries continued the gratifying trend observed in 2005 andagain increased their profit contribution.
Customer numbers Northern Europe ‘000 2006 2005 Var. %
UK 5,518 5,380 + 2.6Ireland 325 328 - 1.0Nordic countries 1,156 1,150 + 0.5Northern Europe 6,999 6,858 + 2.1
UKIn the UK, the travel market showed an unfavourable trend in the courseof the year. The unusually good weather and the Soccer World Cup causedrestraints in bookings. This also affected TUI UK tour operators. Althoughthe number of customers rose slightly 2.6% year-on-year. The intensificationof Group-owned distribution and the expansion of the Thomson website,offering package tours but also modular and seat-only products and hotelaccommodation since the second quarter of 2006, had positive effects onthe Group’s business. Specialist tour operators were particularly successfulin marketing skiing tours and the mobile homes offered by Thomson AlFresco.
TUI UK’s agency distribution comprised 708 travel agencies. At 73%, theproportion of products by Group-owned tour operators remained constantyear-on-year. The share of web-based bookings in total bookings doubledat the expense of bookings through travel agencies and call centres.
IrelandIn Ireland, the travel market environment deteriorated in the course of theyear, with late bookings showing the same trend as in 2005. TUI Ireland’stour operators did not succeed in further expanding their market position.At 325 thousand customers, the number of customers travelling with TUIIreland tour operators declined by 1.0% year-on-year.
Agency distribution in Ireland covered 46 travel agencies, 32 of whichwere Group-owned and 14 were franchise operations. 87% of tours soldwere offerings of Group-owned tour operators. Internet bookings rosesignificantly.
Distribution
46
Customers by destinations (in %)
‘06 ‘05
Spain 49 50
Greece 10 13
Cyprus 5 6
Italy 5 5
Portugal 4 –
Others 27 21
Summer season
Customers by destinations (in %)
‘06 ‘05
Spain 66 68
Greece 13 12
Portugal 7 7
Cyprus 4 5
Turkey 4 4
Others 6 4
Summer season
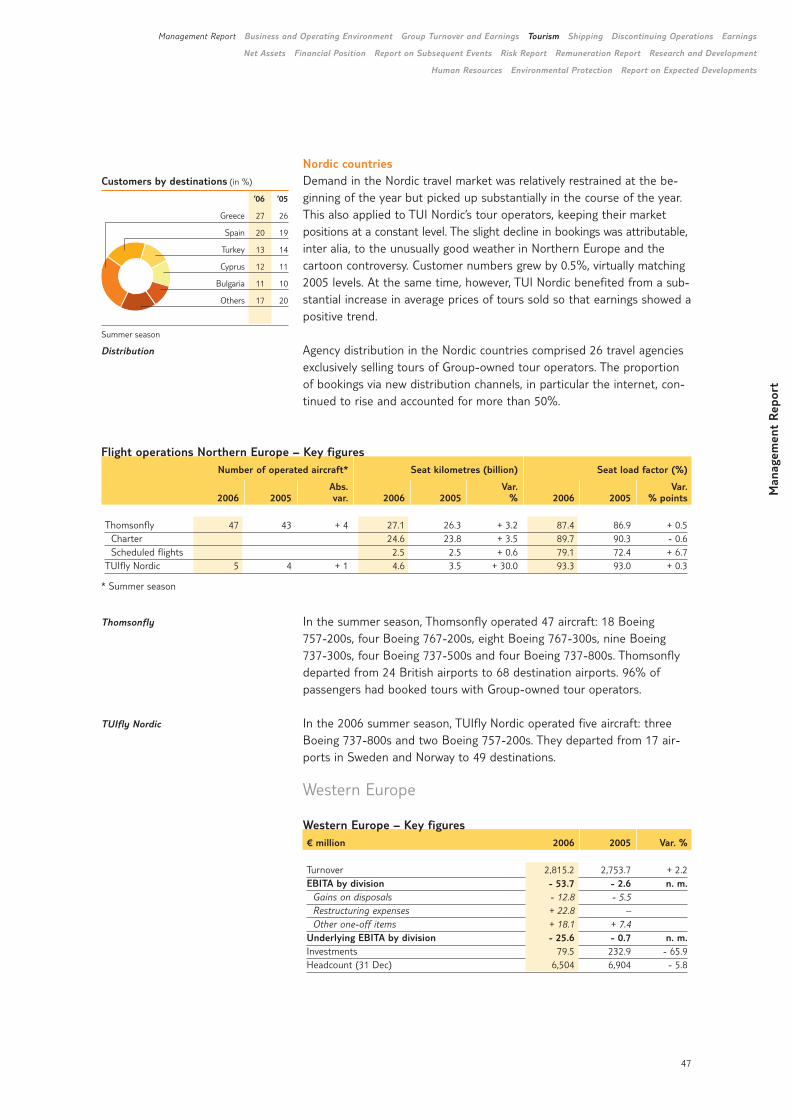
Nordic countriesDemand in the Nordic travel market was relatively restrained at the be-ginning of the year but picked up substantially in the course of the year.This also applied to TUI Nordic’s tour operators, keeping their marketpositions at a constant level. The slight decline in bookings was attributable,inter alia, to the unusually good weather in Northern Europe and the cartoon controversy. Customer numbers grew by 0.5%, virtually matching2005 levels. At the same time, however, TUI Nordic benefited from a sub-stantial increase in average prices of tours sold so that earnings showed apositive trend.
Agency distribution in the Nordic countries comprised 26 travel agenciesexclusively selling tours of Group-owned tour operators. The proportionof bookings via new distribution channels, in particular the internet, con-tinued to rise and accounted for more than 50%.
In the summer season, Thomsonfly operated 47 aircraft: 18 Boeing 757-200s, four Boeing 767-200s, eight Boeing 767-300s, nine Boeing737-300s, four Boeing 737-500s and four Boeing 737-800s. Thomsonflydeparted from 24 British airports to 68 destination airports. 96% ofpassengers had booked tours with Group-owned tour operators.
In the 2006 summer season, TUIfly Nordic operated five aircraft: threeBoeing 737-800s and two Boeing 757-200s. They departed from 17 air-ports in Sweden and Norway to 49 destinations.
Western Europe
Western Europe – Key figures€ million 2006 2005 Var. %
Turnover 2,815.2 2,753.7 + 2.2EBITA by division - 53.7 - 2.6 n. m.
Gains on disposals - 12.8 - 5.5Restructuring expenses + 22.8 –Other one-off items + 18.1 + 7.4
Underlying EBITA by division - 25.6 - 0.7 n. m.Investments 79.5 232.9 - 65.9Headcount (31 Dec) 6,504 6,904 - 5.8
Man
agem
ent
Rep
ort
Management Report Business and Operating Environment Group Turnover and Earnings Tourism Shipping Discontinuing Operations Earnings
Net Assets Financial Position Report on Subsequent Events Risk Report Remuneration Report Research and Development
Human Resources Environmental Protection Report on Expected Developments
Distribution
Thomsonfly
TUIfly Nordic
47
Flight operations Northern Europe – Key figures Number of operated aircraft* Seat kilometres (billion) Seat load factor (%)
Abs. Var. Var. 2006 2005 var. 2006 2005 % 2006 2005 % points
Thomsonfly 47 43 + 4 27.1 26.3 + 3.2 87.4 86.9 + 0.5Charter 24.6 23.8 + 3.5 89.7 90.3 - 0.6Scheduled flights 2.5 2.5 + 0.6 79.1 72.4 + 6.7
TUIfly Nordic 5 4 + 1 4.6 3.5 + 30.0 93.3 93.0 + 0.3
* Summer season
Customers by destinations (in %)
‘06 ‘05
Greece 27 26
Spain 20 19
Turkey 13 14
Cyprus 12 11
Bulgaria 11 10
Others 17 20
Summer season
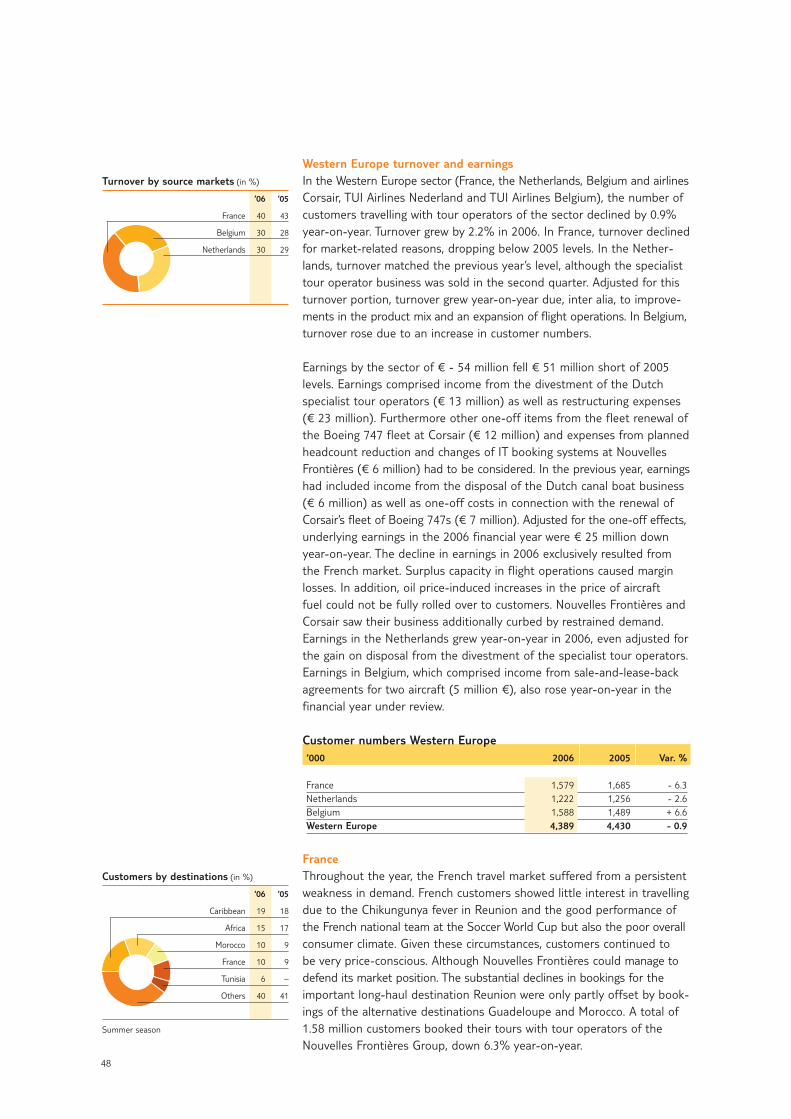
Western Europe turnover and earnings In the Western Europe sector (France, the Netherlands, Belgium and airlinesCorsair, TUI Airlines Nederland and TUI Airlines Belgium), the number ofcustomers travelling with tour operators of the sector declined by 0.9%year-on-year. Turnover grew by 2.2% in 2006. In France, turnover declinedfor market-related reasons, dropping below 2005 levels. In the Nether-lands, turnover matched the previous year’s level, although the specialisttour operator business was sold in the second quarter. Adjusted for thisturnover portion, turnover grew year-on-year due, inter alia, to improve-ments in the product mix and an expansion of flight operations. In Belgium,turnover rose due to an increase in customer numbers.
Earnings by the sector of € - 54 million fell € 51 million short of 2005levels. Earnings comprised income from the divestment of the Dutch specialist tour operators (€ 13 million) as well as restructuring expenses(€ 23 million). Furthermore other one-off items from the fleet renewal ofthe Boeing 747 fleet at Corsair (€ 12 million) and expenses from plannedheadcount reduction and changes of IT booking systems at NouvellesFrontières (€ 6 million) had to be considered. In the previous year, earningshad included income from the disposal of the Dutch canal boat business(€ 6 million) as well as one-off costs in connection with the renewal ofCorsair’s fleet of Boeing 747s (€ 7 million). Adjusted for the one-off effects,underlying earnings in the 2006 financial year were € 25 million downyear-on-year. The decline in earnings in 2006 exclusively resulted fromthe French market. Surplus capacity in flight operations caused marginlosses. In addition, oil price-induced increases in the price of aircraft fuel could not be fully rolled over to customers. Nouvelles Frontières andCorsair saw their business additionally curbed by restrained demand. Earnings in the Netherlands grew year-on-year in 2006, even adjusted forthe gain on disposal from the divestment of the specialist tour operators.Earnings in Belgium, which comprised income from sale-and-lease-backagreements for two aircraft (5 million €), also rose year-on-year in thefinancial year under review.
Customer numbers Western Europe‘000 2006 2005 Var. %
France 1,579 1,685 - 6.3Netherlands 1,222 1,256 - 2.6Belgium 1,588 1,489 + 6.6Western Europe 4,389 4,430 - 0.9
FranceThroughout the year, the French travel market suffered from a persistentweakness in demand. French customers showed little interest in travellingdue to the Chikungunya fever in Reunion and the good performance ofthe French national team at the Soccer World Cup but also the poor overallconsumer climate. Given these circumstances, customers continued to be very price-conscious. Although Nouvelles Frontières could manage todefend its market position. The substantial declines in bookings for theimportant long-haul destination Reunion were only partly offset by book-ings of the alternative destinations Guadeloupe and Morocco. A total of1.58 million customers booked their tours with tour operators of theNouvelles Frontières Group, down 6.3% year-on-year.
48
Customers by destinations (in %)
‘06 ‘05
Caribbean 19 18
Africa 15 17
Morocco 10 9
France 10 9
Tunisia 6 –
Others 40 41
Summer season
Turnover by source markets (in %)
‘06 ‘05
France 40 43
Belgium 30 28
Netherlands 30 29
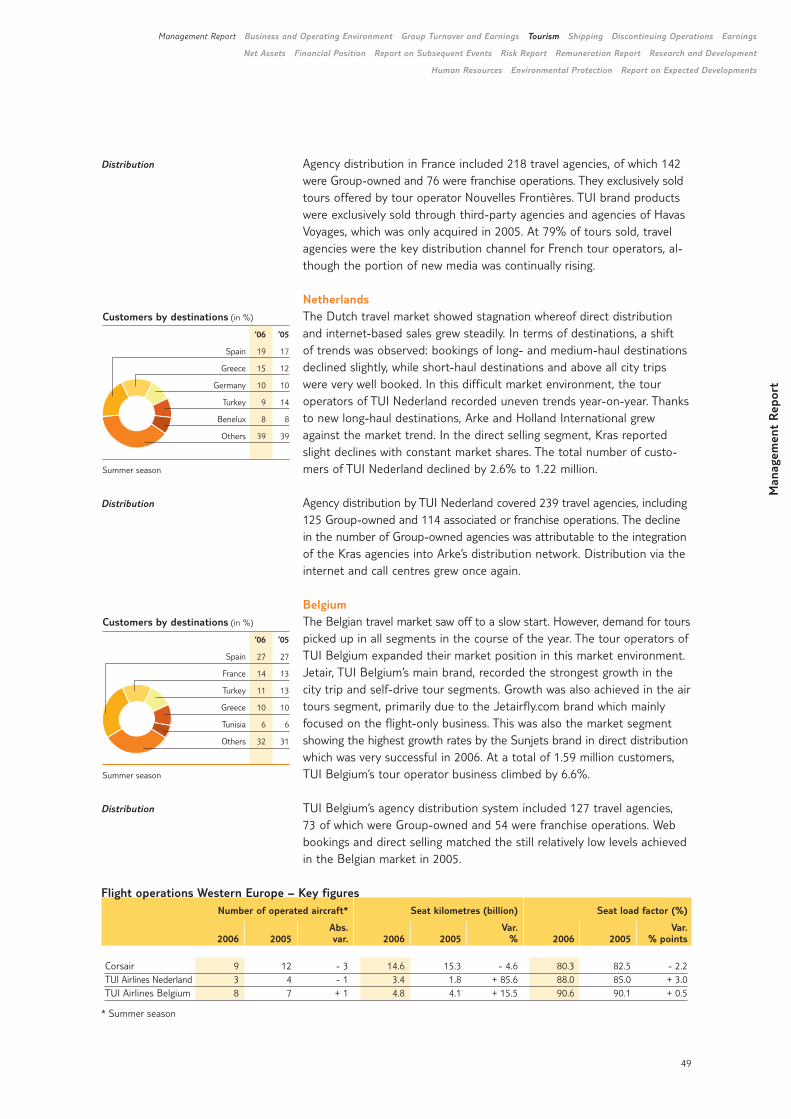
Agency distribution in France included 218 travel agencies, of which 142were Group-owned and 76 were franchise operations. They exclusively soldtours offered by tour operator Nouvelles Frontières. TUI brand productswere exclusively sold through third-party agencies and agencies of HavasVoyages, which was only acquired in 2005. At 79% of tours sold, travelagencies were the key distribution channel for French tour operators, al-though the portion of new media was continually rising.
NetherlandsThe Dutch travel market showed stagnation whereof direct distributionand internet-based sales grew steadily. In terms of destinations, a shift of trends was observed: bookings of long- and medium-haul destinationsdeclined slightly, while short-haul destinations and above all city tripswere very well booked. In this difficult market environment, the touroperators of TUI Nederland recorded uneven trends year-on-year. Thanksto new long-haul destinations, Arke and Holland International grewagainst the market trend. In the direct selling segment, Kras reportedslight declines with constant market shares. The total number of custo-mers of TUI Nederland declined by 2.6% to 1.22 million.
Agency distribution by TUI Nederland covered 239 travel agencies, including125 Group-owned and 114 associated or franchise operations. The declinein the number of Group-owned agencies was attributable to the integrationof the Kras agencies into Arke’s distribution network. Distribution via theinternet and call centres grew once again.
BelgiumThe Belgian travel market saw off to a slow start. However, demand for tourspicked up in all segments in the course of the year. The tour operators ofTUI Belgium expanded their market position in this market environment.Jetair, TUI Belgium’s main brand, recorded the strongest growth in thecity trip and self-drive tour segments. Growth was also achieved in the airtours segment, primarily due to the Jetairfly.com brand which mainlyfocused on the flight-only business. This was also the market segmentshowing the highest growth rates by the Sunjets brand in direct distributionwhich was very successful in 2006. At a total of 1.59 million customers,TUI Belgium’s tour operator business climbed by 6.6%.
TUI Belgium’s agency distribution system included 127 travel agencies, 73 of which were Group-owned and 54 were franchise operations. Webbookings and direct selling matched the still relatively low levels achievedin the Belgian market in 2005.
Man
agem
ent
Rep
ort
Management Report Business and Operating Environment Group Turnover and Earnings Tourism Shipping Discontinuing Operations Earnings
Net Assets Financial Position Report on Subsequent Events Risk Report Remuneration Report Research and Development
Human Resources Environmental Protection Report on Expected Developments
Distribution
Distribution
Distribution
49
Customers by destinations (in %)
‘06 ‘05
Spain 19 17
Greece 15 12
Germany 10 10
Turkey 9 14
Benelux 8 8
Others 39 39
Summer season
Customers by destinations (in %)
‘06 ‘05
Spain 27 27
France 14 13
Turkey 11 13
Greece 10 10
Tunisia 6 6
Others 32 31
Summer season
Flight operations Western Europe – Key figures Number of operated aircraft* Seat kilometres (billion) Seat load factor (%)
Abs. Var. Var. 2006 2005 var. 2006 2005 % 2006 2005 % points
Corsair 9 12 - 3 14.6 15.3 - 4.6 80.3 82.5 - 2.2TUI Airlines Nederland 3 4 - 1 3.4 1.8 + 85.6 88.0 85.0 + 3.0TUI Airlines Belgium 8 7 + 1 4.8 4.1 + 15.5 90.6 90.1 + 0.5
* Summer season
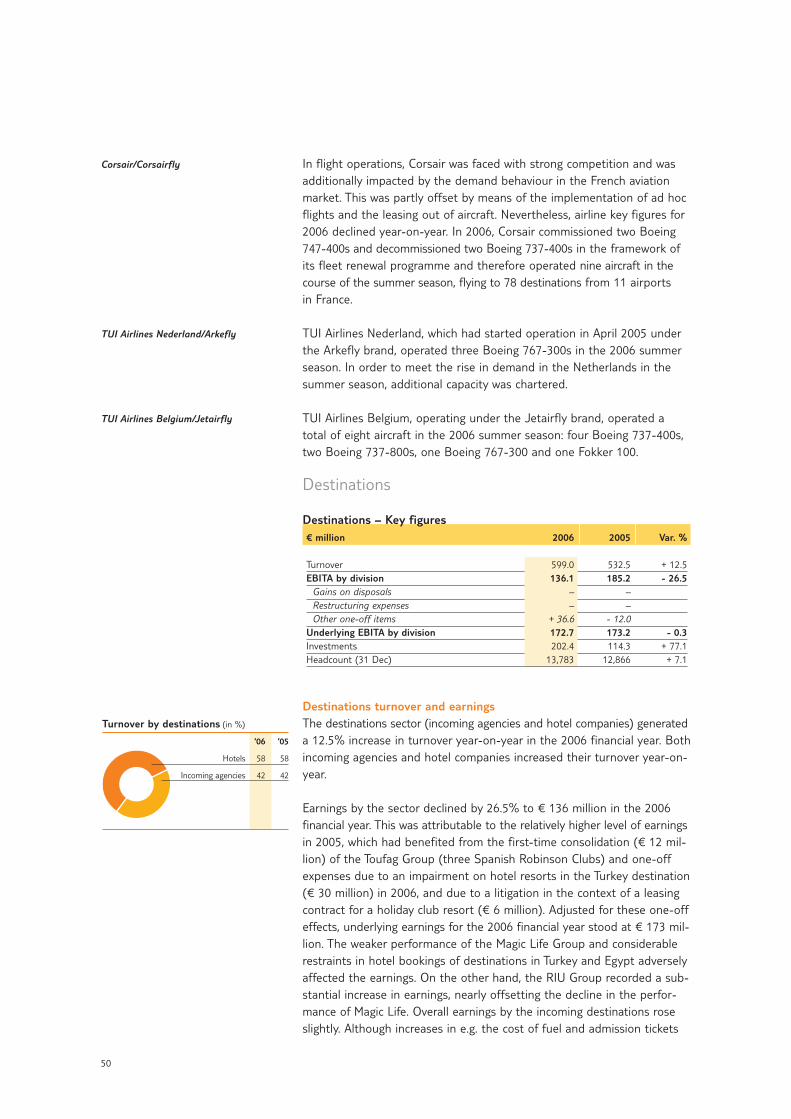
In flight operations, Corsair was faced with strong competition and wasadditionally impacted by the demand behaviour in the French aviationmarket. This was partly offset by means of the implementation of ad hocflights and the leasing out of aircraft. Nevertheless, airline key figures for2006 declined year-on-year. In 2006, Corsair commissioned two Boeing747-400s and decommissioned two Boeing 737-400s in the framework ofits fleet renewal programme and therefore operated nine aircraft in thecourse of the summer season, flying to 78 destinations from 11 airports in France.
TUI Airlines Nederland, which had started operation in April 2005 underthe Arkefly brand, operated three Boeing 767-300s in the 2006 summerseason. In order to meet the rise in demand in the Netherlands in thesummer season, additional capacity was chartered.
TUI Airlines Belgium, operating under the Jetairfly brand, operated atotal of eight aircraft in the 2006 summer season: four Boeing 737-400s,two Boeing 737-800s, one Boeing 767-300 and one Fokker 100.
Destinations
Destinations – Key figures € million 2006 2005 Var. %
Turnover 599.0 532.5 + 12.5EBITA by division 136.1 185.2 - 26.5
Gains on disposals – –Restructuring expenses – –Other one-off items + 36.6 - 12.0
Underlying EBITA by division 172.7 173.2 - 0.3Investments 202.4 114.3 + 77.1Headcount (31 Dec) 13,783 12,866 + 7.1
Destinations turnover and earnings The destinations sector (incoming agencies and hotel companies) generateda 12.5% increase in turnover year-on-year in the 2006 financial year. Bothincoming agencies and hotel companies increased their turnover year-on-year.
Earnings by the sector declined by 26.5% to € 136 million in the 2006financial year. This was attributable to the relatively higher level of earningsin 2005, which had benefited from the first-time consolidation (€ 12 mil-lion) of the Toufag Group (three Spanish Robinson Clubs) and one-offexpenses due to an impairment on hotel resorts in the Turkey destination(€ 30 million) in 2006, and due to a litigation in the context of a leasingcontract for a holiday club resort (€ 6 million). Adjusted for these one-offeffects, underlying earnings for the 2006 financial year stood at € 173 mil-lion. The weaker performance of the Magic Life Group and considerablerestraints in hotel bookings of destinations in Turkey and Egypt adverselyaffected the earnings. On the other hand, the RIU Group recorded a sub-stantial increase in earnings, nearly offsetting the decline in the perfor-mance of Magic Life. Overall earnings by the incoming destinations roseslightly. Although increases in e.g. the cost of fuel and admission tickets
Corsair/Corsairfly
TUI Airlines Nederland/Arkefly
TUI Airlines Belgium/Jetairfly
50
Turnover by destinations (in %)
‘06 ‘05
Hotels 58 58
Incoming agencies 42 42
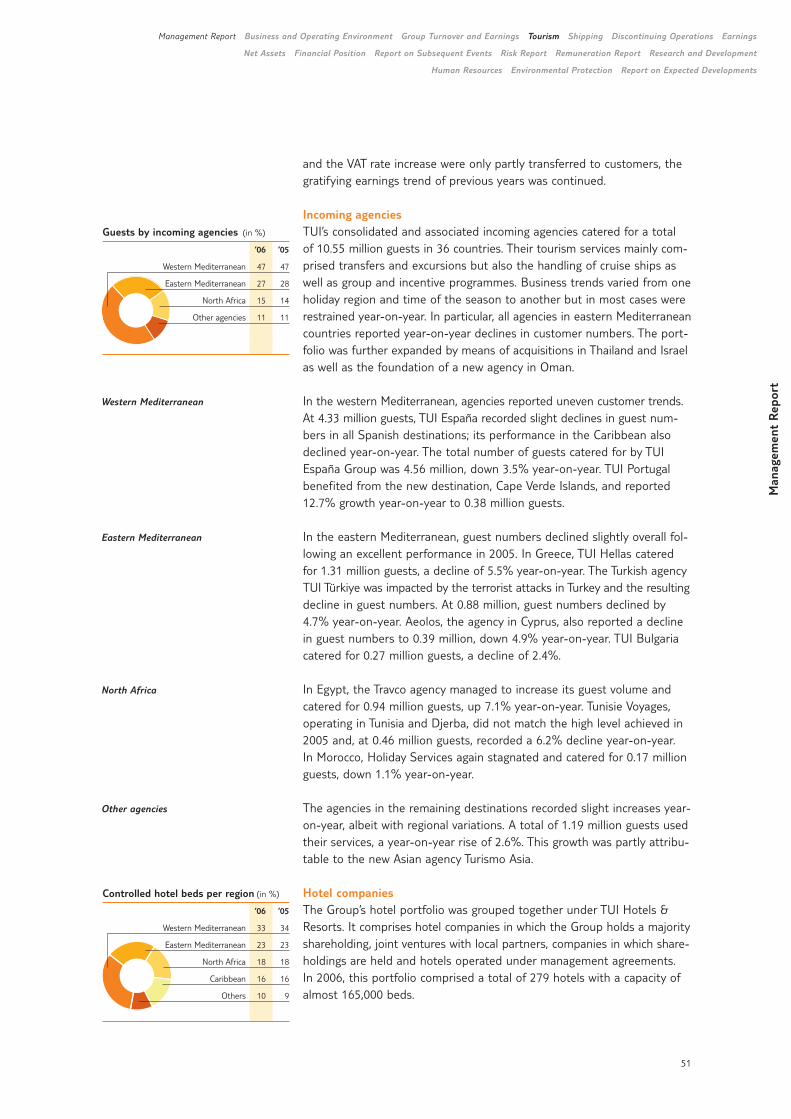
and the VAT rate increase were only partly transferred to customers, thegratifying earnings trend of previous years was continued.
Incoming agenciesTUI’s consolidated and associated incoming agencies catered for a total of 10.55 million guests in 36 countries. Their tourism services mainly com-prised transfers and excursions but also the handling of cruise ships aswell as group and incentive programmes. Business trends varied from oneholiday region and time of the season to another but in most cases wererestrained year-on-year. In particular, all agencies in eastern Mediterraneancountries reported year-on-year declines in customer numbers. The port-folio was further expanded by means of acquisitions in Thailand and Israelas well as the foundation of a new agency in Oman.
In the western Mediterranean, agencies reported uneven customer trends.At 4.33 million guests, TUI España recorded slight declines in guest num-bers in all Spanish destinations; its performance in the Caribbean alsodeclined year-on-year. The total number of guests catered for by TUIEspaña Group was 4.56 million, down 3.5% year-on-year. TUI Portugalbenefited from the new destination, Cape Verde Islands, and reported12.7% growth year-on-year to 0.38 million guests.
In the eastern Mediterranean, guest numbers declined slightly overall fol-lowing an excellent performance in 2005. In Greece, TUI Hellas cateredfor 1.31 million guests, a decline of 5.5% year-on-year. The Turkish agencyTUI Türkiye was impacted by the terrorist attacks in Turkey and the resultingdecline in guest numbers. At 0.88 million, guest numbers declined by4.7% year-on-year. Aeolos, the agency in Cyprus, also reported a declinein guest numbers to 0.39 million, down 4.9% year-on-year. TUI Bulgariacatered for 0.27 million guests, a decline of 2.4%.
In Egypt, the Travco agency managed to increase its guest volume andcatered for 0.94 million guests, up 7.1% year-on-year. Tunisie Voyages,operating in Tunisia and Djerba, did not match the high level achieved in2005 and, at 0.46 million guests, recorded a 6.2% decline year-on-year. In Morocco, Holiday Services again stagnated and catered for 0.17 millionguests, down 1.1% year-on-year.
The agencies in the remaining destinations recorded slight increases year-on-year, albeit with regional variations. A total of 1.19 million guests usedtheir services, a year-on-year rise of 2.6%. This growth was partly attribu-table to the new Asian agency Turismo Asia.
Hotel companiesThe Group’s hotel portfolio was grouped together under TUI Hotels &Resorts. It comprises hotel companies in which the Group holds a majorityshareholding, joint ventures with local partners, companies in which share-holdings are held and hotels operated under management agreements. In 2006, this portfolio comprised a total of 279 hotels with a capacity ofalmost 165,000 beds.
Man
agem
ent
Rep
ort
Management Report Business and Operating Environment Group Turnover and Earnings Tourism Shipping Discontinuing Operations Earnings
Net Assets Financial Position Report on Subsequent Events Risk Report Remuneration Report Research and Development
Human Resources Environmental Protection Report on Expected Developments
Western Mediterranean
Eastern Mediterranean
North Africa
Other agencies
51
Controlled hotel beds per region (in %)
‘06 ‘05
Western Mediterranean 33 34
Eastern Mediterranean 23 23
North Africa 18 18
Caribbean 16 16
Others 10 9
Guests by incoming agencies (in %)
‘06 ‘05
Western Mediterranean 47 47
Eastern Mediterranean 27 28
North Africa 15 14
Other agencies 11 11
TUI Hotels & Resorts recorded a total of 35.7 million overnight stays,4.6% up year-on-year. At approx. 80%, bed occupancy matched 2005levels, with individual hotel groups performing differently.
Robinson, market leader in the premium segment for club holidays, oper-ated 21 club complexes in nine countries. Overall occupancy was slightlyup year-on-year with constant capacity. Declines were reported by individualclubs in Turkey and Austria, while clubs in Kos and Italy reported verygood booking levels. The remaining clubs recorded occupancy rates thatexceeded the previous year’s good levels.
Magic Life, the all-inclusive club brand, operated 17 clubs, all of which werelocated in the eastern Mediterranean. They defended their positions inTurkey and Egypt in a difficult environment and achieved good occupancyrates on the Greek islands. Given a considerable reduction in capacity,occupancy rates matched 2005 levels.
In 2006, Dorfhotel operated two complexes in Austria and one in Germany.Its occupancy rate rose slightly year-on-year while capacity was reducedto some extent.
In 2006, RIU, the second largest hotel chain in Spain, continued its success-ful business performance of 2005. Its hotel portfolio comprised 109 hotels,including 29 hotels in long-haul destinations Mexico, the Caribbean and theUS. Demand for hotels in the Bahamas and Cape Verde Islands developedparticularly well. Occupancy rates also rose in the hotels in Spain, whiledemand for Madeira was also very good. Overall, RIU hotels recorded aslight rise in capacity and an increase in occupancy rates year-on-year.
Grupotel, another Spanish hotel company, had 33 hotels. Twenty-two ofthese hotels were located on Majorca, seven on Menorca and four on Ibiza. With a slight reduction in capacity, Grupotel recorded a soundincrease in its occupancy rate year-on-year.
Grecotel, the leading hotel company in Greece, operated a portfolio of21 hotels. Seven of these hotels were located in mainland Greece and 14in Greek islands. Except Korfu occupancy was slightly down year-on-year,with a considerable increase in capacity.
Iberotel operated 23 hotels. Seventeen of these hotels were located inEgypt, four in Turkey, one in Dubai and one in Sicily respectively. Whilehotel capacity was considerably increased, occupancy rates fell slightlyyear-on-year overall. The occupancy rates of Iberotels in Turkey wereadversely affected by the terrorist attacks in 2005.
The Nordotel, Atlantica, Gran Resort and Sol y Mar hotel chains, whosefacilities were mainly marketed in the UK and Scandinavia, operated atotal of 34 hotels in the Mediterranean and two hotels in Austria. Hotelson Cyprus and mainland Spain showed good and steady levels of demand,while hotels on the Spanish islands recorded slight decreases from a highlevel.
Robinson
Magic Life
Dorfhotel
RIU
Grupotel
Grecotel
Iberotel
Other hotel companies
52
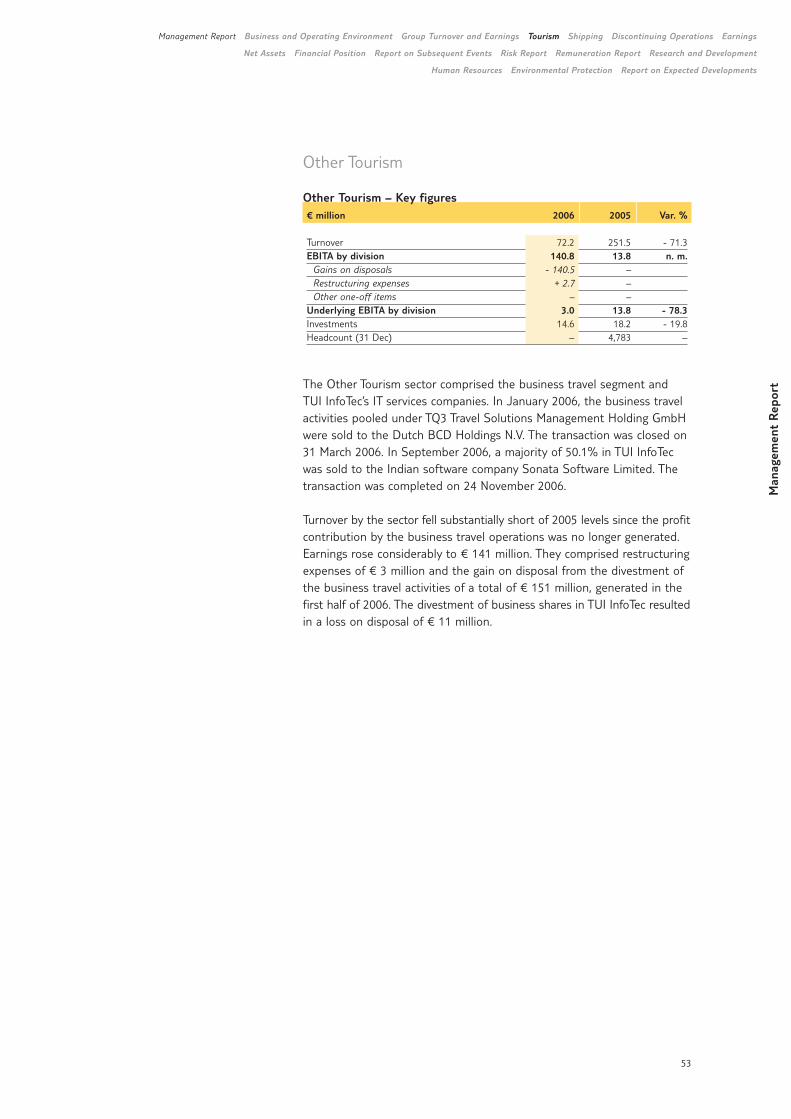
Other Tourism
Other Tourism – Key figures€ million 2006 2005 Var. %
Turnover 72.2 251.5 - 71.3EBITA by division 140.8 13.8 n. m.
Gains on disposals - 140.5 –Restructuring expenses + 2.7 –Other one-off items – –
Underlying EBITA by division 3.0 13.8 - 78.3Investments 14.6 18.2 - 19.8Headcount (31 Dec) – 4,783 –
The Other Tourism sector comprised the business travel segment and TUI InfoTec’s IT services companies. In January 2006, the business travelactivities pooled under TQ3 Travel Solutions Management Holding GmbHwere sold to the Dutch BCD Holdings N.V. The transaction was closed on31 March 2006. In September 2006, a majority of 50.1% in TUI InfoTecwas sold to the Indian software company Sonata Software Limited. Thetransaction was completed on 24 November 2006.
Turnover by the sector fell substantially short of 2005 levels since the profitcontribution by the business travel operations was no longer generated.Earnings rose considerably to € 141 million. They comprised restructuringexpenses of € 3 million and the gain on disposal from the divestment ofthe business travel activities of a total of € 151 million, generated in thefirst half of 2006. The divestment of business shares in TUI InfoTec resultedin a loss on disposal of € 11 million.
Man
agem
ent
Rep
ort
Management Report Business and Operating Environment Group Turnover and Earnings Tourism Shipping Discontinuing Operations Earnings
Net Assets Financial Position Report on Subsequent Events Risk Report Remuneration Report Research and Development
Human Resources Environmental Protection Report on Expected Developments
53
Shipping
Last year, TUI successfully completed the operative integration of CP Ships, acquired at the end of 2005,into the Hapag-Lloyd organisation. During the integrationprocess, synergy effects were already achieved which farexceeded expectations. With the continuation of thistrend and the non-recurrence of integration costs, a significant improvement in earnings is expected in thenext few years.
54
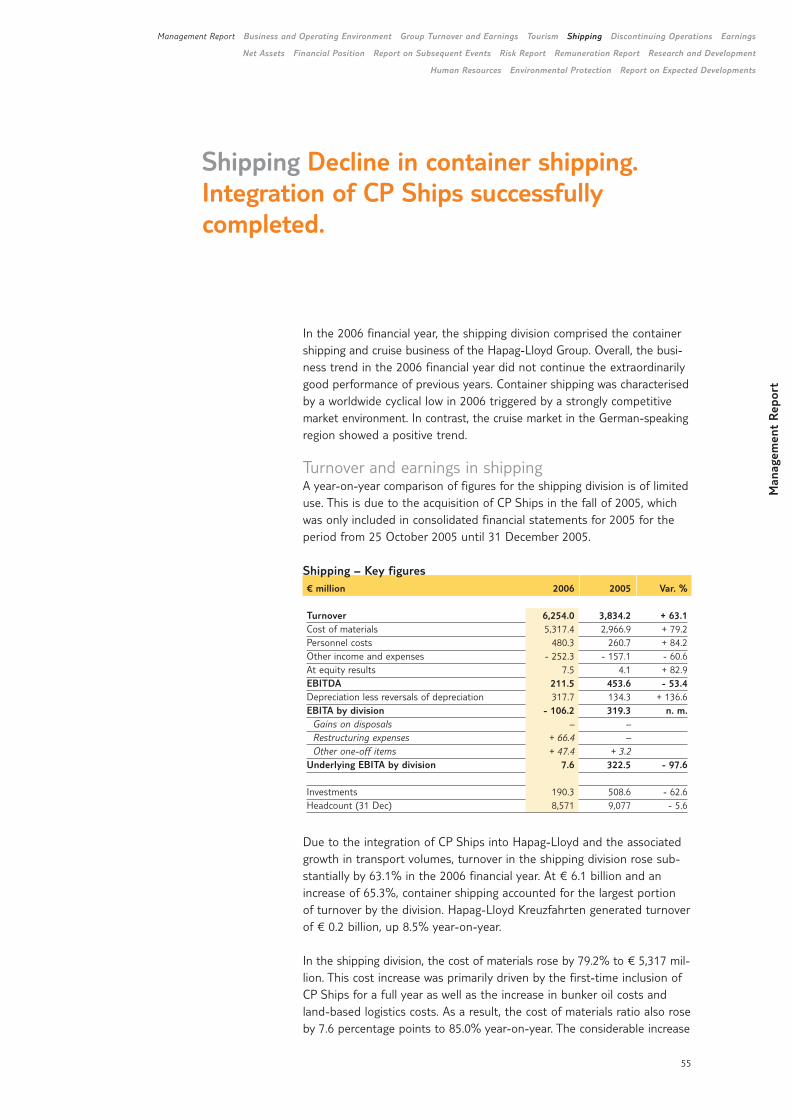
Shipping Decline in container shipping. Integration of CP Ships successfully completed.
In the 2006 financial year, the shipping division comprised the containershipping and cruise business of the Hapag-Lloyd Group. Overall, the busi-ness trend in the 2006 financial year did not continue the extraordinarilygood performance of previous years. Container shipping was characterisedby a worldwide cyclical low in 2006 triggered by a strongly competitivemarket environment. In contrast, the cruise market in the German-speakingregion showed a positive trend.
Turnover and earnings in shipping A year-on-year comparison of figures for the shipping division is of limiteduse. This is due to the acquisition of CP Ships in the fall of 2005, whichwas only included in consolidated financial statements for 2005 for theperiod from 25 October 2005 until 31 December 2005.
Shipping – Key figures€ million 2006 2005 Var. %
Turnover 6,254.0 3,834.2 + 63.1Cost of materials 5,317.4 2,966.9 + 79.2Personnel costs 480.3 260.7 + 84.2Other income and expenses - 252.3 - 157.1 - 60.6At equity results 7.5 4.1 + 82.9EBITDA 211.5 453.6 - 53.4Depreciation less reversals of depreciation 317.7 134.3 + 136.6EBITA by division - 106.2 319.3 n. m.
Gains on disposals – –Restructuring expenses + 66.4 –Other one-off items + 47.4 + 3.2
Underlying EBITA by division 7.6 322.5 - 97.6
Investments 190.3 508.6 - 62.6Headcount (31 Dec) 8,571 9,077 - 5.6
Due to the integration of CP Ships into Hapag-Lloyd and the associatedgrowth in transport volumes, turnover in the shipping division rose sub-stantially by 63.1% in the 2006 financial year. At € 6.1 billion and anincrease of 65.3%, container shipping accounted for the largest portion of turnover by the division. Hapag-Lloyd Kreuzfahrten generated turnoverof € 0.2 billion, up 8.5% year-on-year.
In the shipping division, the cost of materials rose by 79.2% to € 5,317 mil-lion. This cost increase was primarily driven by the first-time inclusion ofCP Ships for a full year as well as the increase in bunker oil costs andland-based logistics costs. As a result, the cost of materials ratio also roseby 7.6 percentage points to 85.0% year-on-year. The considerable increase
55
Man
agem
ent
Rep
ort
Management Report Business and Operating Environment Group Turnover and Earnings Tourism Shipping Discontinuing Operations Earnings
Net Assets Financial Position Report on Subsequent Events Risk Report Remuneration Report Research and Development
Human Resources Environmental Protection Report on Expected Developments
in personnel costs of 84.2% to € 480 million reflected a cost increaseattributable to changes in consolidation as well as restructuring expensesfor the CP Ships integration process.
The balance of other income and expenses fell by 60.6% to € - 252 mil-lion. On the other hand, the result from companies measured at equityrose by 82.9% to € 8 million.
Depreciation and amortisation rose by 136.6% to € 318 million due tothe expansion of the Group-owned ship and container fleet caused bythe acquisition of CP Ships.
Earnings by the shipping division totalled to € - 106 million (previous year:€ 319 million), a considerable decline year-on-year. Container shippingcontributed € - 114 million to these earnings, with Hapag-Lloyd Kreuz-fahrten accounting for € 8 million. Adjusted for the expenses for the integration of CP Ships slighty positive earnings of € 8 million could beachieved.
Container shipping
Container shipping – Key figures (incl. CP Ships)€ million 2006 2005 Var. %
Turnover 6,093.7 3,686.5 + 65.3EBITA by division - 114.1 315.1 n. m.
Gains on disposals – –Restructuring expenses + 66.4 –Other one-off items + 47.4 + 3.2
Underlying EBITA by division - 0.3 318.3 n. m.
Integration processThe integration of CP Ships, the container shipping company acquired inOctober 2005, into Hapag-Lloyd proceeded faster than originally planned.One year after the acquisition, the operative business of CP Ships wasfully integrated into Hapag-Lloyd. The centrepiece was the expansion ofHapag-Lloyd’s organisational structure and information technology tocover CP Ships’ business. The operative integration of CP Ships’ serviceswas implemented in two stages. The first stage related to all Trans-Atlanticservices, accounting for around half the entire cargo volume of CP Ships.The second stage covered all other services. At the end of the third quar-ter, all former CP Ships’ services were fully integrated into Hapag-Lloydand have since been operated under the Hapag-Lloyd brand name. Inaddition, all ships and containers of CP Ships were integrated into Hapag-Lloyd’s fleet. The optimisation of the services network, which was sub-stantially expanded due to the acquisition of CP Ships, was also complet-ed according to schedule in the third quarter.
New reporting structureSince the third quarter of 2006, freight rates and transport volumes havebeen jointly reported for Hapag-Lloyd and CP Ships, broken down accord-ing to the geographical structure of the trade lanes. To that end, CP Ships’key figures for 2006 were calculated accordingly and the relevant key
56
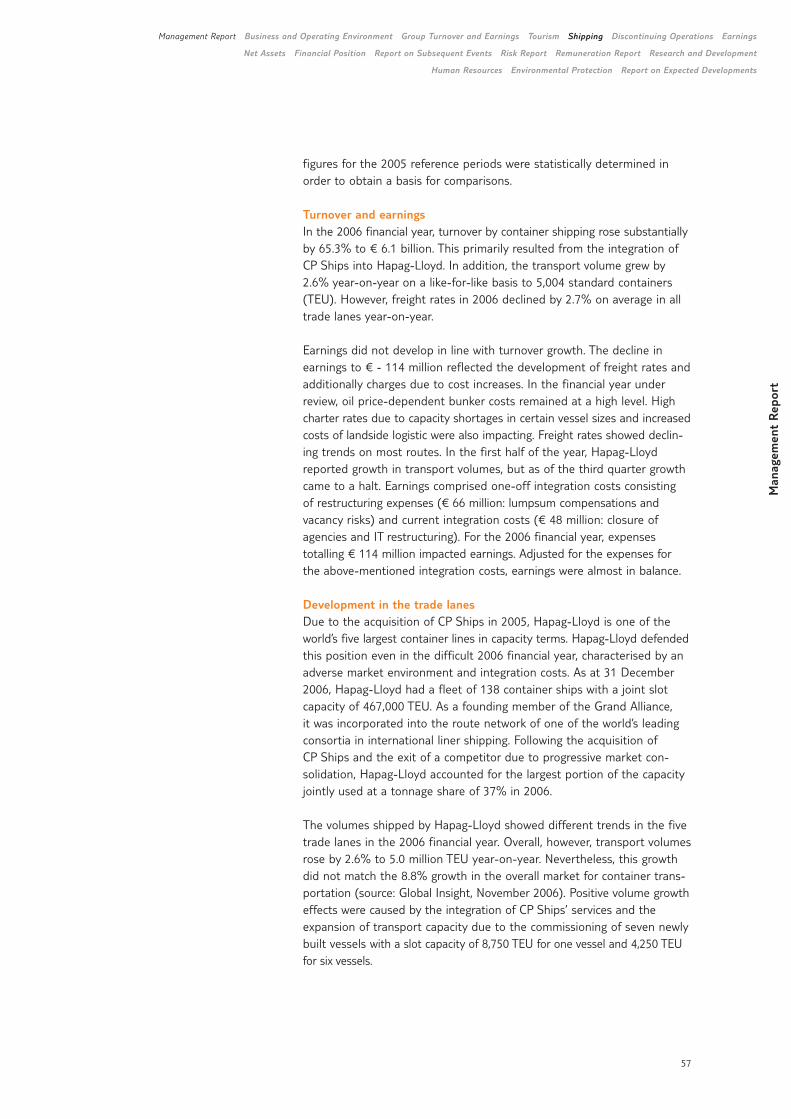
figures for the 2005 reference periods were statistically determined inorder to obtain a basis for comparisons.
Turnover and earningsIn the 2006 financial year, turnover by container shipping rose substantiallyby 65.3% to € 6.1 billion. This primarily resulted from the integration ofCP Ships into Hapag-Lloyd. In addition, the transport volume grew by2.6% year-on-year on a like-for-like basis to 5,004 standard containers(TEU). However, freight rates in 2006 declined by 2.7% on average in alltrade lanes year-on-year.
Earnings did not develop in line with turnover growth. The decline inearnings to € - 114 million reflected the development of freight rates andadditionally charges due to cost increases. In the financial year underreview, oil price-dependent bunker costs remained at a high level. Highcharter rates due to capacity shortages in certain vessel sizes and increasedcosts of landside logistic were also impacting. Freight rates showed declin-ing trends on most routes. In the first half of the year, Hapag-Lloydreported growth in transport volumes, but as of the third quarter growthcame to a halt. Earnings comprised one-off integration costs consisting of restructuring expenses (€ 66 million: lumpsum compensations andvacancy risks) and current integration costs (€ 48 million: closure ofagencies and IT restructuring). For the 2006 financial year, expenses totalling € 114 million impacted earnings. Adjusted for the expenses forthe above-mentioned integration costs, earnings were almost in balance.
Development in the trade lanesDue to the acquisition of CP Ships in 2005, Hapag-Lloyd is one of theworld’s five largest container lines in capacity terms. Hapag-Lloyd defendedthis position even in the difficult 2006 financial year, characterised by anadverse market environment and integration costs. As at 31 December2006, Hapag-Lloyd had a fleet of 138 container ships with a joint slotcapacity of 467,000 TEU. As a founding member of the Grand Alliance, it was incorporated into the route network of one of the world’s leadingconsortia in international liner shipping. Following the acquisition ofCP Ships and the exit of a competitor due to progressive market con-solidation, Hapag-Lloyd accounted for the largest portion of the capacityjointly used at a tonnage share of 37% in 2006.
The volumes shipped by Hapag-Lloyd showed different trends in the fivetrade lanes in the 2006 financial year. Overall, however, transport volumesrose by 2.6% to 5.0 million TEU year-on-year. Nevertheless, this growthdid not match the 8.8% growth in the overall market for container trans-portation (source: Global Insight, November 2006). Positive volume growtheffects were caused by the integration of CP Ships’ services and theexpansion of transport capacity due to the commissioning of seven newlybuilt vessels with a slot capacity of 8,750 TEU for one vessel and 4,250 TEUfor six vessels.
Man
agem
ent
Rep
ort
Management Report Business and Operating Environment Group Turnover and Earnings Tourism Shipping Discontinuing Operations Earnings
Net Assets Financial Position Report on Subsequent Events Risk Report Remuneration Report Research and Development
Human Resources Environmental Protection Report on Expected Developments
57
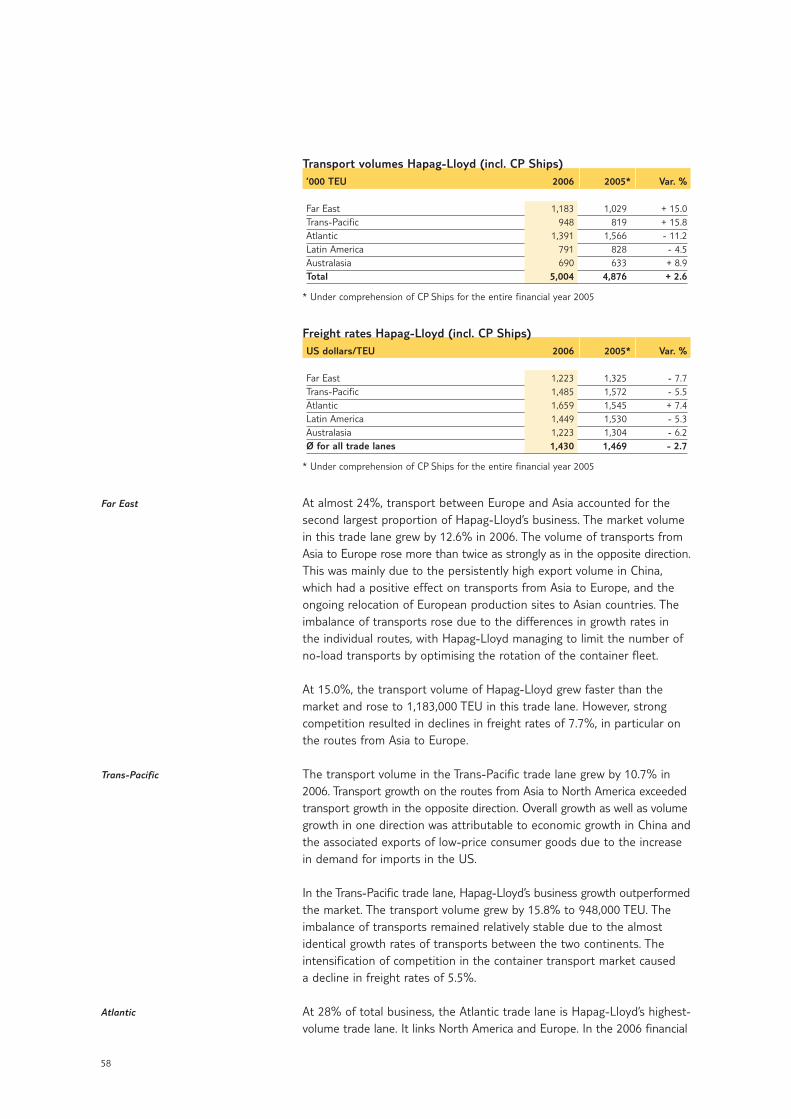
Transport volumes Hapag-Lloyd (incl. CP Ships)’000 TEU 2006 2005* Var. %
Far East 1,183 1,029 + 15.0Trans-Pacific 948 819 + 15.8Atlantic 1,391 1,566 - 11.2Latin America 791 828 - 4.5Australasia 690 633 + 8.9Total 5,004 4,876 + 2.6
* Under comprehension of CP Ships for the entire financial year 2005
Freight rates Hapag-Lloyd (incl. CP Ships)US dollars/TEU 2006 2005* Var. %
Far East 1,223 1,325 - 7.7Trans-Pacific 1,485 1,572 - 5.5Atlantic 1,659 1,545 + 7.4Latin America 1,449 1,530 - 5.3Australasia 1,223 1,304 - 6.2Ø for all trade lanes 1,430 1,469 - 2.7
* Under comprehension of CP Ships for the entire financial year 2005
At almost 24%, transport between Europe and Asia accounted for thesecond largest proportion of Hapag-Lloyd’s business. The market volumein this trade lane grew by 12.6% in 2006. The volume of transports fromAsia to Europe rose more than twice as strongly as in the opposite direction.This was mainly due to the persistently high export volume in China,which had a positive effect on transports from Asia to Europe, and theongoing relocation of European production sites to Asian countries. Theimbalance of transports rose due to the differences in growth rates in the individual routes, with Hapag-Lloyd managing to limit the number ofno-load transports by optimising the rotation of the container fleet.
At 15.0%, the transport volume of Hapag-Lloyd grew faster than themarket and rose to 1,183,000 TEU in this trade lane. However, strongcompetition resulted in declines in freight rates of 7.7%, in particular onthe routes from Asia to Europe.
The transport volume in the Trans-Pacific trade lane grew by 10.7% in2006. Transport growth on the routes from Asia to North America exceededtransport growth in the opposite direction. Overall growth as well as volumegrowth in one direction was attributable to economic growth in China andthe associated exports of low-price consumer goods due to the increasein demand for imports in the US.
In the Trans-Pacific trade lane, Hapag-Lloyd’s business growth outperformedthe market. The transport volume grew by 15.8% to 948,000 TEU. Theimbalance of transports remained relatively stable due to the almostidentical growth rates of transports between the two continents. Theintensification of competition in the container transport market caused a decline in freight rates of 5.5%.
At 28% of total business, the Atlantic trade lane is Hapag-Lloyd’s highest-volume trade lane. It links North America and Europe. In the 2006 financial
Far East
Trans-Pacific
Atlantic
58
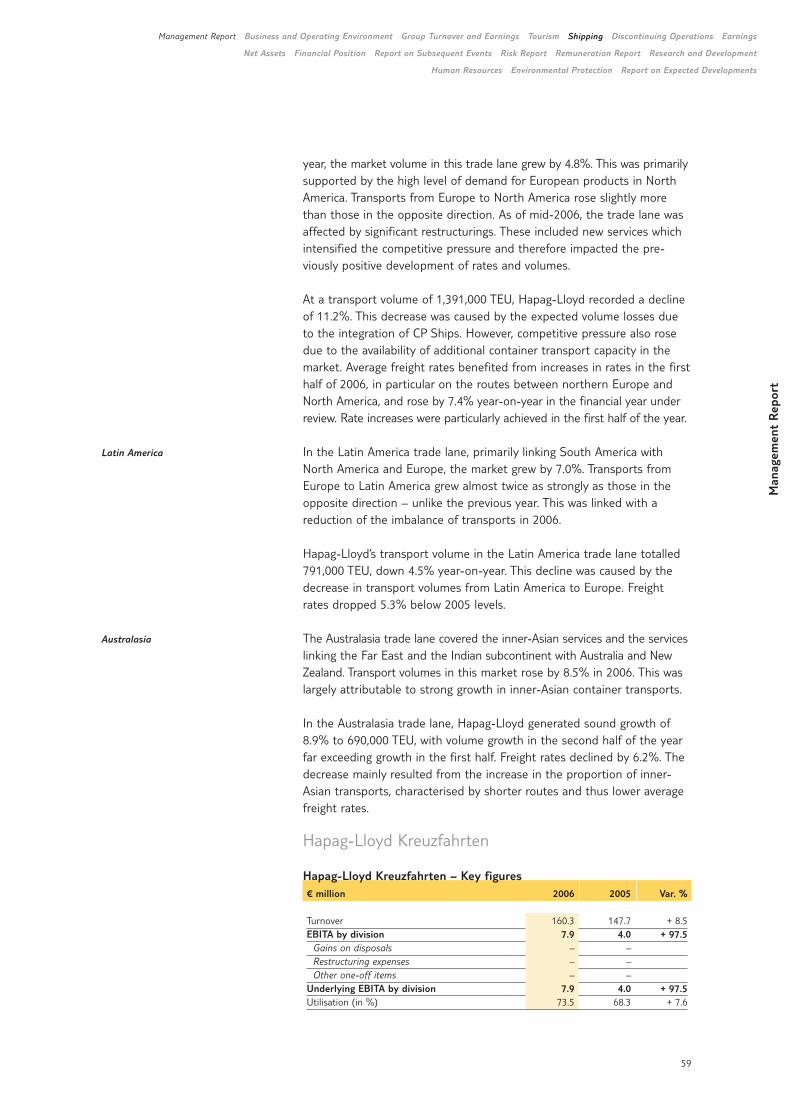
year, the market volume in this trade lane grew by 4.8%. This was primarilysupported by the high level of demand for European products in NorthAmerica. Transports from Europe to North America rose slightly morethan those in the opposite direction. As of mid-2006, the trade lane wasaffected by significant restructurings. These included new services whichintensified the competitive pressure and therefore impacted the pre-viously positive development of rates and volumes.
At a transport volume of 1,391,000 TEU, Hapag-Lloyd recorded a declineof 11.2%. This decrease was caused by the expected volume losses dueto the integration of CP Ships. However, competitive pressure also rosedue to the availability of additional container transport capacity in themarket. Average freight rates benefited from increases in rates in the firsthalf of 2006, in particular on the routes between northern Europe andNorth America, and rose by 7.4% year-on-year in the financial year underreview. Rate increases were particularly achieved in the first half of the year.
In the Latin America trade lane, primarily linking South America withNorth America and Europe, the market grew by 7.0%. Transports fromEurope to Latin America grew almost twice as strongly as those in theopposite direction – unlike the previous year. This was linked with areduction of the imbalance of transports in 2006.
Hapag-Lloyd’s transport volume in the Latin America trade lane totalled791,000 TEU, down 4.5% year-on-year. This decline was caused by thedecrease in transport volumes from Latin America to Europe. Freightrates dropped 5.3% below 2005 levels.
The Australasia trade lane covered the inner-Asian services and the serviceslinking the Far East and the Indian subcontinent with Australia and NewZealand. Transport volumes in this market rose by 8.5% in 2006. This waslargely attributable to strong growth in inner-Asian container transports.
In the Australasia trade lane, Hapag-Lloyd generated sound growth of8.9% to 690,000 TEU, with volume growth in the second half of the yearfar exceeding growth in the first half. Freight rates declined by 6.2%. Thedecrease mainly resulted from the increase in the proportion of inner-Asian transports, characterised by shorter routes and thus lower averagefreight rates.
Hapag-Lloyd Kreuzfahrten
Hapag-Lloyd Kreuzfahrten – Key figures€ million 2006 2005 Var. %
Turnover 160.3 147.7 + 8.5EBITA by division 7.9 4.0 + 97.5
Gains on disposals – –Restructuring expenses – –Other one-off items – –
Underlying EBITA by division 7.9 4.0 + 97.5Utilisation (in %) 73.5 68.3 + 7.6
Man
agem
ent
Rep
ort
Management Report Business and Operating Environment Group Turnover and Earnings Tourism Shipping Discontinuing Operations Earnings
Net Assets Financial Position Report on Subsequent Events Risk Report Remuneration Report Research and Development
Human Resources Environmental Protection Report on Expected Developments
Latin America
Australasia
59
Turnover and earningsIn the 2006 financial year, Hapag-Lloyd Kreuzfahrten again recorded apositive trend, winning new customer groups and thus increasing thenumber of customers. The average length of cruises also rose. Due to thepremium portfolio, average turnover per day also continued to rise year-on-year. At € 160 million, total turnover was 8.5% up year-on-year.
Hapag-Lloyd Kreuzfahrten increased its earnings by 97.5% year-on-yearto € 8 million. Earnings were impacted by the increase in fuel costs andan unscheduled dock period of ‘Bremen’.
Business trend The positive trend of the German cruise market continued in 2006, pri-marily in the volume segment of the 3- and 4-star categories. In 2006, no new vessels in the luxury segment were launched in the Geman market.
Hapag-Lloyd Kreuzfahrten has established itself in the German market inthe premium and luxury segments in particular as a provider of lifestyleand expedition tours. In the 2006 financial year, its fleet consisted of fourcruise ships, two of which were owned and two chartered. The flagshipwas the 5-star-plus vessel ‘Europa’. It was awarded this category by theBerlitz Cruise Guide for the seventh time in succession and is mainlyoperated on world tours. The ‘Columbus’, a four-star vessel, also cruisesthe world’s seven seas and, moreover, is the only ocean-going cruise linercapable of cruising the Great Lakes in North America. The ‘Hanseatic’ isused for cruises to the Arctic and Antarctic. It is the world’s only 5-starexpedition vessel with the highest Arctic class. The ‘Bremen’, a four-starvessel also awarded the highest Arctic class, travels to similar destinations.
In the 2006 financial year, utilisation of three of the vessels rose year-on-year. Since the ‘Bremen’ had an unscheduled time in a dock its utilisationfell slightly short of 2005 levels. Utilisation of all ships was 73.5%, 5.2percentage points up year-on-year.
60
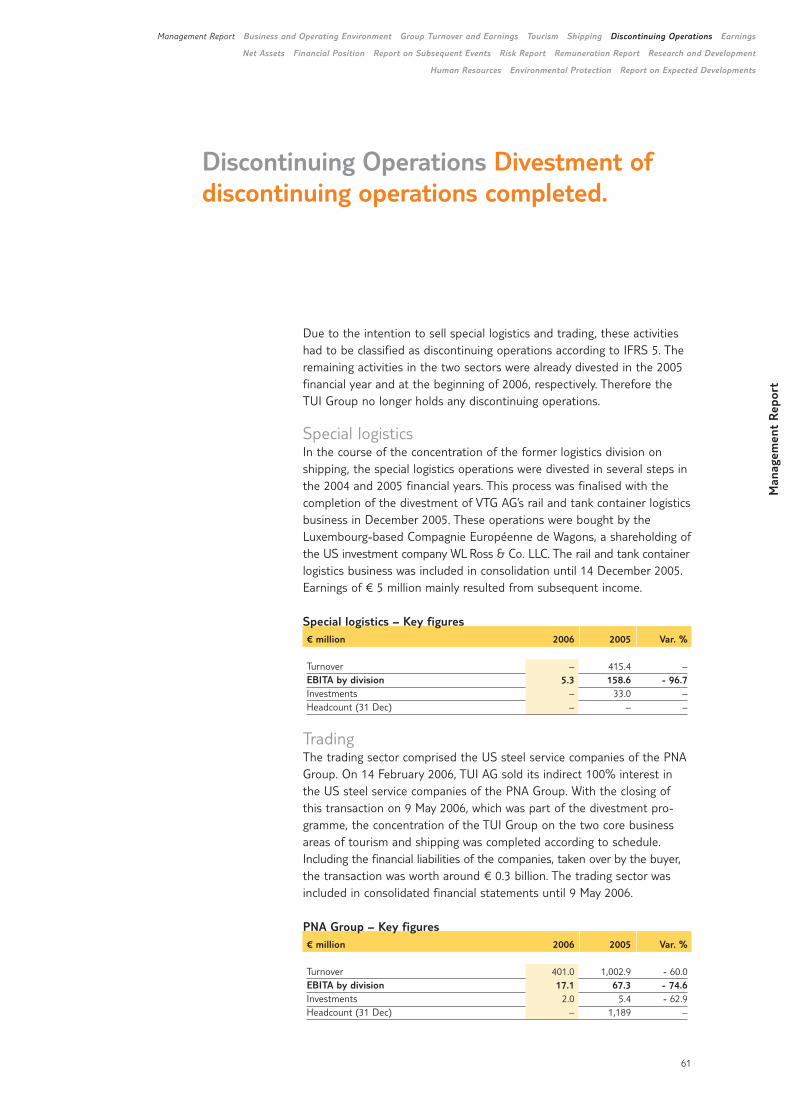
61
Man
agem
ent
Rep
ort
Management Report Business and Operating Environment Group Turnover and Earnings Tourism Shipping Discontinuing Operations Earnings
Net Assets Financial Position Report on Subsequent Events Risk Report Remuneration Report Research and Development
Human Resources Environmental Protection Report on Expected Developments
Discontinuing Operations Divestment ofdiscontinuing operations completed.
Due to the intention to sell special logistics and trading, these activitieshad to be classified as discontinuing operations according to IFRS 5. Theremaining activities in the two sectors were already divested in the 2005financial year and at the beginning of 2006, respectively. Therefore theTUI Group no longer holds any discontinuing operations.
Special logisticsIn the course of the concentration of the former logistics division onshipping, the special logistics operations were divested in several steps inthe 2004 and 2005 financial years. This process was finalised with thecompletion of the divestment of VTG AG’s rail and tank container logisticsbusiness in December 2005. These operations were bought by theLuxembourg-based Compagnie Européenne de Wagons, a shareholding ofthe US investment company WL Ross & Co. LLC. The rail and tank containerlogistics business was included in consolidation until 14 December 2005.Earnings of € 5 million mainly resulted from subsequent income.
Special logistics – Key figures€ million 2006 2005 Var. %
Turnover – 415.4 –EBITA by division 5.3 158.6 - 96.7Investments – 33.0 –Headcount (31 Dec) – – –
TradingThe trading sector comprised the US steel service companies of the PNAGroup. On 14 February 2006, TUI AG sold its indirect 100% interest inthe US steel service companies of the PNA Group. With the closing ofthis transaction on 9 May 2006, which was part of the divestment pro-gramme, the concentration of the TUI Group on the two core businessareas of tourism and shipping was completed according to schedule.Including the financial liabilities of the companies, taken over by the buyer,the transaction was worth around € 0.3 billion. The trading sector wasincluded in consolidated financial statements until 9 May 2006.
PNA Group – Key figures€ million 2006 2005 Var. %
Turnover 401.0 1,002.9 - 60.0EBITA by division 17.1 67.3 - 74.6Investments 2.0 5.4 - 62.9Headcount (31 Dec) – 1,189 –
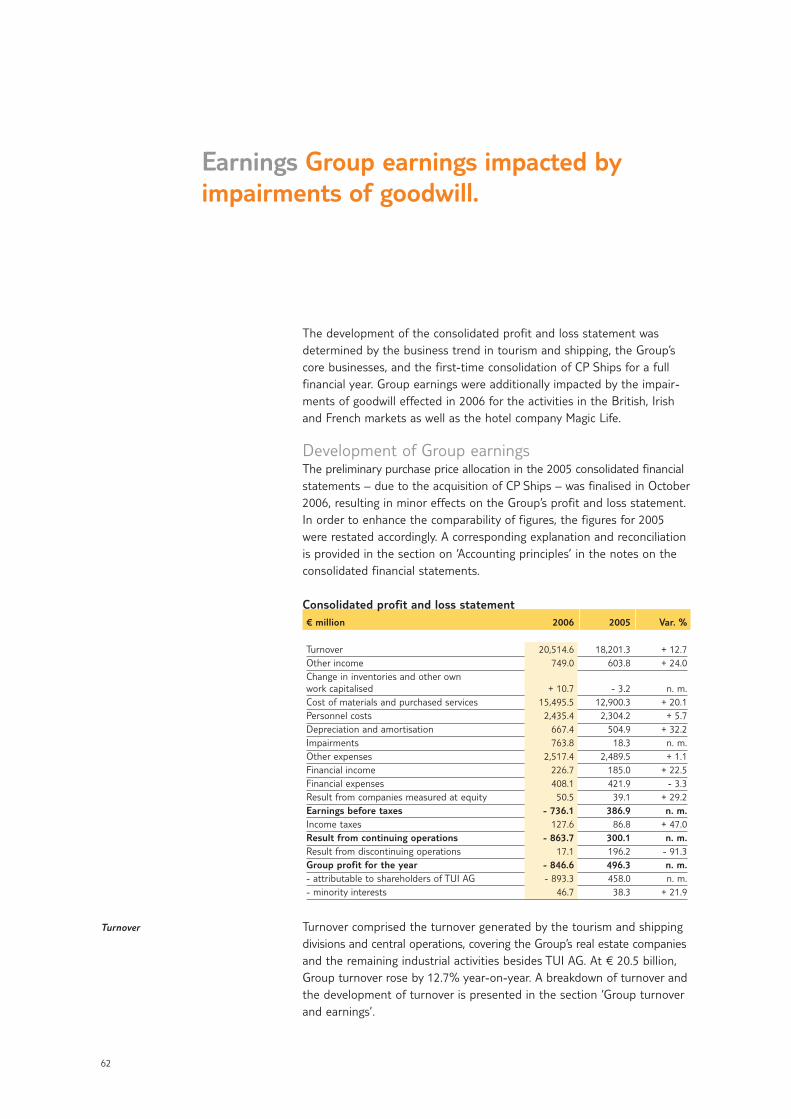
62
Earnings Group earnings impacted byimpairments of goodwill.
The development of the consolidated profit and loss statement wasdetermined by the business trend in tourism and shipping, the Group’score businesses, and the first-time consolidation of CP Ships for a fullfinancial year. Group earnings were additionally impacted by the impair-ments of goodwill effected in 2006 for the activities in the British, Irishand French markets as well as the hotel company Magic Life.
Development of Group earningsThe preliminary purchase price allocation in the 2005 consolidated financialstatements – due to the acquisition of CP Ships – was finalised in October2006, resulting in minor effects on the Group’s profit and loss statement.In order to enhance the comparability of figures, the figures for 2005were restated accordingly. A corresponding explanation and reconciliationis provided in the section on ‘Accounting principles’ in the notes on theconsolidated financial statements.
Consolidated profit and loss statement€ million 2006 2005 Var. %
Turnover 20,514.6 18,201.3 + 12.7Other income 749.0 603.8 + 24.0Change in inventories and other own work capitalised + 10.7 - 3.2 n. m.Cost of materials and purchased services 15,495.5 12,900.3 + 20.1Personnel costs 2,435.4 2,304.2 + 5.7Depreciation and amortisation 667.4 504.9 + 32.2Impairments 763.8 18.3 n. m.Other expenses 2,517.4 2,489.5 + 1.1Financial income 226.7 185.0 + 22.5Financial expenses 408.1 421.9 - 3.3Result from companies measured at equity 50.5 39.1 + 29.2Earnings before taxes - 736.1 386.9 n. m.Income taxes 127.6 86.8 + 47.0Result from continuing operations - 863.7 300.1 n. m.Result from discontinuing operations 17.1 196.2 - 91.3Group profit for the year - 846.6 496.3 n. m.- attributable to shareholders of TUI AG - 893.3 458.0 n. m.- minority interests 46.7 38.3 + 21.9
Turnover comprised the turnover generated by the tourism and shippingdivisions and central operations, covering the Group’s real estate companiesand the remaining industrial activities besides TUI AG. At € 20.5 billion,Group turnover rose by 12.7% year-on-year. A breakdown of turnover andthe development of turnover is presented in the section ‘Group turnoverand earnings’.
Turnover
Man
agem
ent
Rep
ort
Management Report Business and Operating Environment Group Turnover and Earnings Tourism Shipping Discontinuing Operations Earnings
Net Assets Financial Position Report on Subsequent Events Risk Report Remuneration Report Research and Development
Human Resources Environmental Protection Report on Expected Developments
63
Other income primarily comprised gains on the disposal of fixed and currentassets, income from supplementary transactions, foreign exchange gains,income from cost reimbursements and income from rental and leasingcontracts as well as license agreements.
At € 749 million, Other income increased by 24.0% year-on-year. It includedthe gains on disposals from the divestment of the business travel activi-ties effected in the 2006 financial year (€ 151 million), TUI Nederland’sspecialist tour operators (€ 12 million) and the divestment of the majorityinterest in Wolf GmbH (€ 35 million). Additional income was generatedfrom sale-and-lease-back contracts for a total of six aircraft, the sale ofan administrative building in the Netherlands and income in the realestate segment from the sales contract for ‘Schacht Konrad’ concludedback in the 1980s.
The change in inventories and other own work capitalised of € 11 millionmainly resulted from a relatively constant inventory in work in progressand finished products accompanied by a concurrent positive developmentof other own work capitalised.
The cost of materials and purchased services encompassed the cost ofraw materials including fuel and supplies, purchased goods and services.In tourism, these costs mainly related to the cost of third-party servicessuch as rental and lease expenses for hotels and the cost of flight andother transport services. In the shipping division, the cost of purchasedservices primarily related to the cost of third-party container transport,port and terminal costs as well as charter, rental and operating leaseexpenses for ships and containers.
The cost of materials and purchased services rose considerably by 20.1%to € 15,496 million. This increase resulted from the first-time inclusion ofCP Ships business volume in the consolidated financial statements for afull financial year. In tourism and shipping, another major reason for thecost increase was the high average energy costs for aircraft fuel and bun-ker oil, causing a corresponding cost increase. As a result, the cost ofmaterials ratio stood at 75.5%, an increase of 4.6 percentage points.
Personnel costs include expenses for wages and salaries, social securitycontributions as well as pension costs and benefits. They rose by 5.7% to € 2,435 million year-on-year. Besides the effect from the full-yearinclusion of CP Ships, both the tourism and the shipping division recordedan adverse effect due to expenses for personnel adjustment measures inthe framework of the restructuring programmes.
Depreciation and amortisation included the depreciation of property, plantand equipment and the amortisation of other intangible assets as well aswrite-downs of investment property. At € 667 million, it rose 32.2% onthe previous year. This was essentially due to the expansion in shipping.
Impairments comprised impairments of goodwill and of other intangibleassets, property, plant and equipment and investment property. In the2006 financial year, impairments totalled € 764 million.
Other income
Change in inventories and
other own work capitalised
Cost of materials and purchased
services
Personnel costs
Depreciation and amortisation
Impairments
64
At € 710 million, the largest proportion related to impairments of good-will in the tourism division. More specifically, impairments of € 480 millionwere required for the Northern Europe sector in the British and Irishmarkets, € 210 million in the Western Europe sector for the French marketand € 20 million in the destinations sector for the investment in Magic Life.
In addition, impairments of € 54 million were required for intangibleassets and property, plant and equipment. In particular, they related toMagic Life and Iberotel hotel complexes in Turkey by € 30 million.
The main items subsumed under Other expenses were: commissions fortourism services, selling and advertising expenses, rental and leaseexpenses, administrative expenses including contributions, charges andfees, expenses for financial and monetary transactions and other taxes.
Other expenses increased by 1.1% to € 2,517 million. Expenses includedan amount of € 11 million for a loss from the sale of the majority interestin TUI InfoTec and a foreign currency exchange loss due to capital adjust-ments at subsidiaries of € 65 million.
Financial income of € 227 million and financial expenses of € 408 millionarose in the 2006 financial year. The net financial result was € - 181 million.The financial result included the interest result, net income from invest-ments and marketable securities and the result from the change in themarket value of derivative financial instruments.
At € - 226 million, the interest result dropped by 11.1% year-on-year.The decline in the interest result was attributable to the first-time inclusion of the bonds issued in 2005 – for financing the acquisition ofCP Ships – for a full financial year and the increase in the average baseinterest level. Overall the financial result increased year-on-year due to apositive development in value of the non-hedged derivative instruments.
The result from companies measured at equity comprised the pro-ratednet profit for the year of the associated companies and joint ventures aswell as any impairment of goodwill of these companies, if required. At € 51 million, it rose by 29.2% on the previous year due to an increase in theearnings of the companies in the destinations sector measured at equity.
Income taxes included taxes on profits from ordinary business activities ofthe continuing operations. They totalled € 128 million, comprising effectiveincome taxes of € 114 million and deferred income taxes of € 14 million.The disproportionate increase in the tax rate resulted from the changedrelationship between the profit contributions by tourism and shipping, theGroup’s core businesses. Due to the tonnage tax unrelated to earningscharged in the shipping division, the reduction in the tax burden of pre-vious years turned into an additional burden due to the negative earningsposted by shipping in 2006.
The result from discontinuing operations as defined by IFRS 5 amountedto € 17 million and comprised income tax expenses of € 12 million. Ittotalled € 29 million before income tax. Earnings comprised an amountof € 6 million from the trading sector sold in the second quarter as well
Other expenses
Financial income and
financial expenses
Result from companies
measured at equity
Taxes on income
Result from discontinuing operations
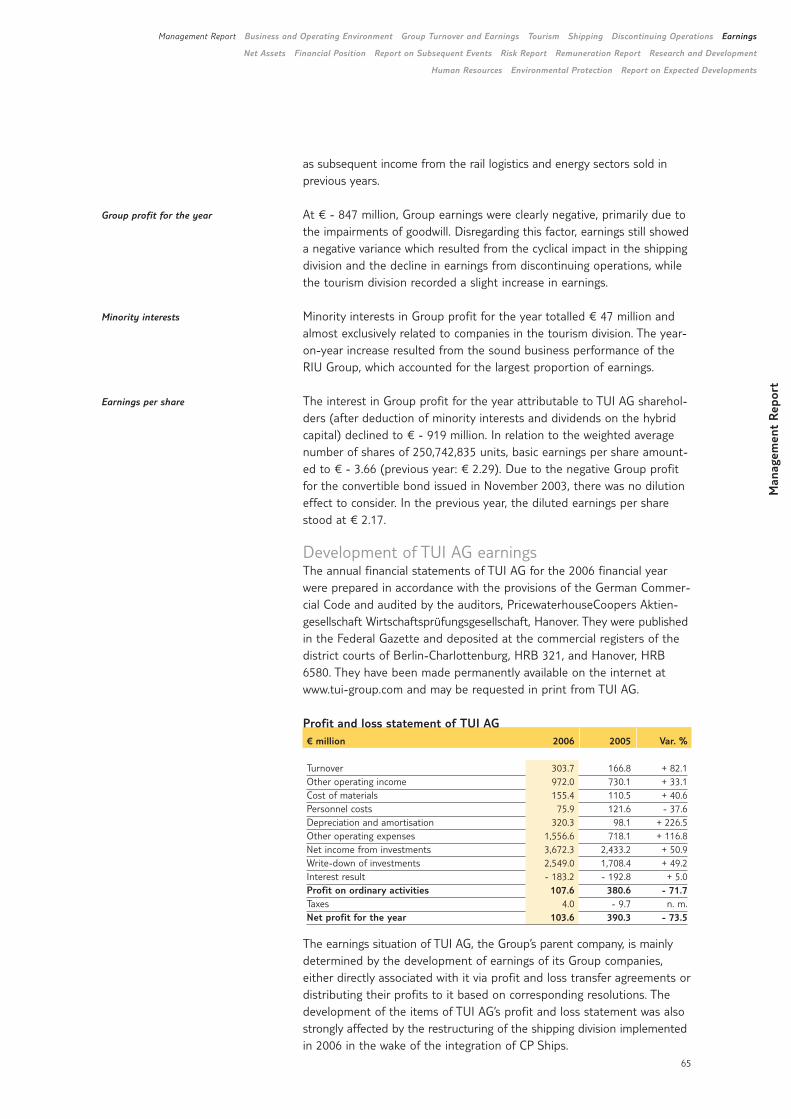
Man
agem
ent
Rep
ort
Management Report Business and Operating Environment Group Turnover and Earnings Tourism Shipping Discontinuing Operations Earnings
Net Assets Financial Position Report on Subsequent Events Risk Report Remuneration Report Research and Development
Human Resources Environmental Protection Report on Expected Developments
65
as subsequent income from the rail logistics and energy sectors sold inprevious years.
At € - 847 million, Group earnings were clearly negative, primarily due tothe impairments of goodwill. Disregarding this factor, earnings still showeda negative variance which resulted from the cyclical impact in the shippingdivision and the decline in earnings from discontinuing operations, whilethe tourism division recorded a slight increase in earnings.
Minority interests in Group profit for the year totalled € 47 million andalmost exclusively related to companies in the tourism division. The year-on-year increase resulted from the sound business performance of theRIU Group, which accounted for the largest proportion of earnings.
The interest in Group profit for the year attributable to TUI AG sharehol-ders (after deduction of minority interests and dividends on the hybridcapital) declined to € - 919 million. In relation to the weighted averagenumber of shares of 250,742,835 units, basic earnings per share amount-ed to € - 3.66 (previous year: € 2.29). Due to the negative Group profitfor the convertible bond issued in November 2003, there was no dilutioneffect to consider. In the previous year, the diluted earnings per sharestood at € 2.17.
Development of TUI AG earningsThe annual financial statements of TUI AG for the 2006 financial yearwere prepared in accordance with the provisions of the German Commer-cial Code and audited by the auditors, PricewaterhouseCoopers Aktien-gesellschaft Wirtschaftsprüfungsgesellschaft, Hanover. They were publishedin the Federal Gazette and deposited at the commercial registers of thedistrict courts of Berlin-Charlottenburg, HRB 321, and Hanover, HRB6580. They have been made permanently available on the internet atwww.tui-group.com and may be requested in print from TUI AG.
Profit and loss statement of TUI AG€ million 2006 2005 Var. %
Turnover 303.7 166.8 + 82.1Other operating income 972.0 730.1 + 33.1Cost of materials 155.4 110.5 + 40.6Personnel costs 75.9 121.6 - 37.6Depreciation and amortisation 320.3 98.1 + 226.5Other operating expenses 1,556.6 718.1 + 116.8Net income from investments 3,672.3 2,433.2 + 50.9Write-down of investments 2,549.0 1,708.4 + 49.2Interest result - 183.2 - 192.8 + 5.0Profit on ordinary activities 107.6 380.6 - 71.7Taxes 4.0 - 9.7 n. m.Net profit for the year 103.6 390.3 - 73.5
The earnings situation of TUI AG, the Group’s parent company, is mainlydetermined by the development of earnings of its Group companies, either directly associated with it via profit and loss transfer agreements ordistributing their profits to it based on corresponding resolutions. Thedevelopment of the items of TUI AG’s profit and loss statement was alsostrongly affected by the restructuring of the shipping division implementedin 2006 in the wake of the integration of CP Ships.
Group profit for the year
Minority interests
Earnings per share
66
Turnover and other operating income
Expenses
Investments
Write-down of financial investments
Interest result
Profit for the year
In the 2006 financial year, TUI AG’s turnover rose by 82.1% to € 304 million.This turnover almost exclusively related to income from leasing aircraft,container ships and containers to Group companies. Other operatingincome rose by 33.1% to € 972 million. It mainly included book profitsfrom the disposal of financial assets and property, plant and equipment,foreign exchange gains from currency transactions and earnings from thereversal of provisions and value adjustments.
As far as expenses are concerned, the cost of materials rose by 40.6% to€ 155 million. This was caused by an increase in expenses for the leasingof aircraft and first-time maintenance costs for the dry dock period ofcontainer ships. In the light of a reduction in pension expenses, personnelcosts declined by 37.6% to € 76 million. Depreciation and amortisationrose significantly. At € 320 million, it was 226.5% up year-on-year. The risein the depreciation level was partly attributable to the internal transfer of theGroup-owned container ship fleet and container pool to TUI AG implement-ed in 2006. Other operating expenses rose by 116.8% to € 1,557 million.They included the cost of financial and monetary transactions, fees, chargesand other administrative costs arising from TUI AG’s corporate centrefunctions as well as expenses from the measurement of financial instrumentsand provisioning for investment risks. The increase was primarily attributableto the earnings to be paid into an interim holding in connection with thechange in the legal structure of the shipping division in 2006.
At € 3,672 million, net income from investments was substantially up onthe previous year’s level. It comprised income from investments as well asprofits and losses from profit and loss transfer agreements with associatedoperative companies of € 115 million. At € 3,426 million, it mostly com-prised income transferred from an interim holding and resulting from arestructuring of investments in shipping. Since TUI AG’s investment incomeprimarily resulted from relations with consolidated Group companies, itonly affected Group earnings to a minor extent.
At € 2,549 million, write-downs of financial investments rose significantlyyear-on-year. They comprised write-downs of shareholdings in affiliatedcompanies in the tourism division which had to be impaired to the lowerfair value in accordance with commercial law provisions. This primarilyaffected investments in the UK, Ireland and France. In addition, write-downs of financial investments largely related to value adjustments in theshipping division, which had arisen in connection with the restructuring ofthe division in the 2006 financial year.
At € - 183 million, the interest result was 5.0% up year-on-year due to an increase in interest income from the internal financing of associatedcompanies.
For the 2006 financial year, TUI AG posted a net profit for the year of€ 104 million. The 73.5% year-on-year decline was mainly attributable tothe decline in income from investments of operative companies, in particulardue to the business trend in shipping. Taking account of an amount of€ 2 million profit carried forward and the donation of revenue reserve of€ 52 million, profit available for distribution amounted to € 54 million,which should be carried forward to new account.
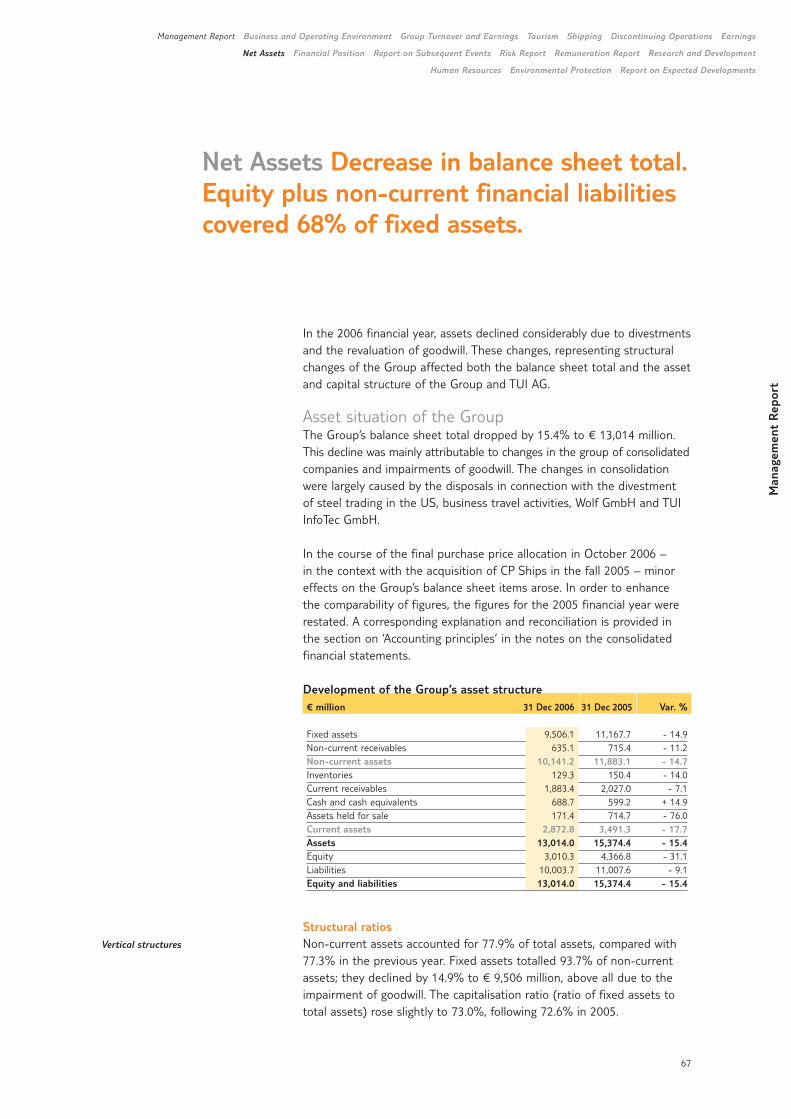
67
Man
agem
ent
Rep
ort
Management Report Business and Operating Environment Group Turnover and Earnings Tourism Shipping Discontinuing Operations Earnings
Net Assets Financial Position Report on Subsequent Events Risk Report Remuneration Report Research and Development
Human Resources Environmental Protection Report on Expected Developments
Net Assets Decrease in balance sheet total.Equity plus non-current financial liabilitiescovered 68% of fixed assets.
In the 2006 financial year, assets declined considerably due to divestmentsand the revaluation of goodwill. These changes, representing structuralchanges of the Group affected both the balance sheet total and the assetand capital structure of the Group and TUI AG.
Asset situation of the GroupThe Group’s balance sheet total dropped by 15.4% to € 13,014 million.This decline was mainly attributable to changes in the group of consolidatedcompanies and impairments of goodwill. The changes in consolidationwere largely caused by the disposals in connection with the divestment of steel trading in the US, business travel activities, Wolf GmbH and TUIInfoTec GmbH.
In the course of the final purchase price allocation in October 2006 – in the context with the acquisition of CP Ships in the fall 2005 – minoreffects on the Group’s balance sheet items arose. In order to enhance the comparability of figures, the figures for the 2005 financial year wererestated. A corresponding explanation and reconciliation is provided inthe section on ‘Accounting principles’ in the notes on the consolidatedfinancial statements.
Development of the Group’s asset structure € million 31 Dec 2006 31 Dec 2005 Var. %
Fixed assets 9,506.1 11,167.7 - 14.9Non-current receivables 635.1 715.4 - 11.2Non-current assets 10,141.2 11,883.1 - 14.7Inventories 129.3 150.4 - 14.0Current receivables 1,883.4 2,027.0 - 7.1Cash and cash equivalents 688.7 599.2 + 14.9Assets held for sale 171.4 714.7 - 76.0Current assets 2,872.8 3,491.3 - 17.7Assets 13,014.0 15,374.4 - 15.4Equity 3,010.3 4,366.8 - 31.1Liabilities 10,003.7 11,007.6 - 9.1Equity and liabilities 13,014.0 15,374.4 - 15.4
Structural ratiosNon-current assets accounted for 77.9% of total assets, compared with77.3% in the previous year. Fixed assets totalled 93.7% of non-currentassets; they declined by 14.9% to € 9,506 million, above all due to theimpairment of goodwill. The capitalisation ratio (ratio of fixed assets tototal assets) rose slightly to 73.0%, following 72.6% in 2005.
Vertical structures
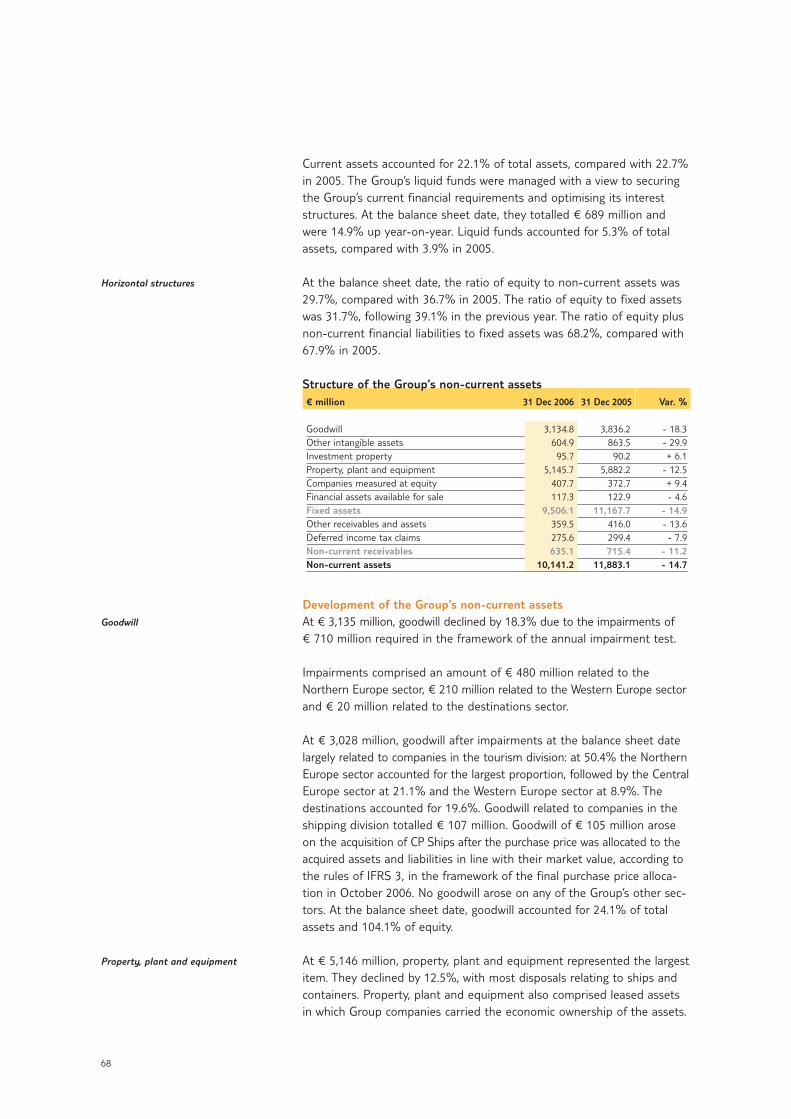
68
Current assets accounted for 22.1% of total assets, compared with 22.7%in 2005. The Group’s liquid funds were managed with a view to securingthe Group’s current financial requirements and optimising its intereststructures. At the balance sheet date, they totalled € 689 million andwere 14.9% up year-on-year. Liquid funds accounted for 5.3% of totalassets, compared with 3.9% in 2005.
At the balance sheet date, the ratio of equity to non-current assets was29.7%, compared with 36.7% in 2005. The ratio of equity to fixed assetswas 31.7%, following 39.1% in the previous year. The ratio of equity plusnon-current financial liabilities to fixed assets was 68.2%, compared with67.9% in 2005.
Structure of the Group’s non-current assets€ million 31 Dec 2006 31 Dec 2005 Var. %
Goodwill 3,134.8 3,836.2 - 18.3Other intangible assets 604.9 863.5 - 29.9Investment property 95.7 90.2 + 6.1Property, plant and equipment 5,145.7 5,882.2 - 12.5Companies measured at equity 407.7 372.7 + 9.4Financial assets available for sale 117.3 122.9 - 4.6Fixed assets 9,506.1 11,167.7 - 14.9Other receivables and assets 359.5 416.0 - 13.6Deferred income tax claims 275.6 299.4 - 7.9Non-current receivables 635.1 715.4 - 11.2Non-current assets 10,141.2 11,883.1 - 14.7
Development of the Group’s non-current assetsAt € 3,135 million, goodwill declined by 18.3% due to the impairments of€ 710 million required in the framework of the annual impairment test.
Impairments comprised an amount of € 480 million related to the Northern Europe sector, € 210 million related to the Western Europe sectorand € 20 million related to the destinations sector.
At € 3,028 million, goodwill after impairments at the balance sheet datelargely related to companies in the tourism division: at 50.4% the NorthernEurope sector accounted for the largest proportion, followed by the CentralEurope sector at 21.1% and the Western Europe sector at 8.9%. The destinations accounted for 19.6%. Goodwill related to companies in theshipping division totalled € 107 million. Goodwill of € 105 million aroseon the acquisition of CP Ships after the purchase price was allocated to theacquired assets and liabilities in line with their market value, according tothe rules of IFRS 3, in the framework of the final purchase price alloca-tion in October 2006. No goodwill arose on any of the Group’s other sec-tors. At the balance sheet date, goodwill accounted for 24.1% of totalassets and 104.1% of equity.
At € 5,146 million, property, plant and equipment represented the largestitem. They declined by 12.5%, with most disposals relating to ships andcontainers. Property, plant and equipment also comprised leased assetsin which Group companies carried the economic ownership of the assets.
Horizontal structures
Goodwill
Property, plant and equipment
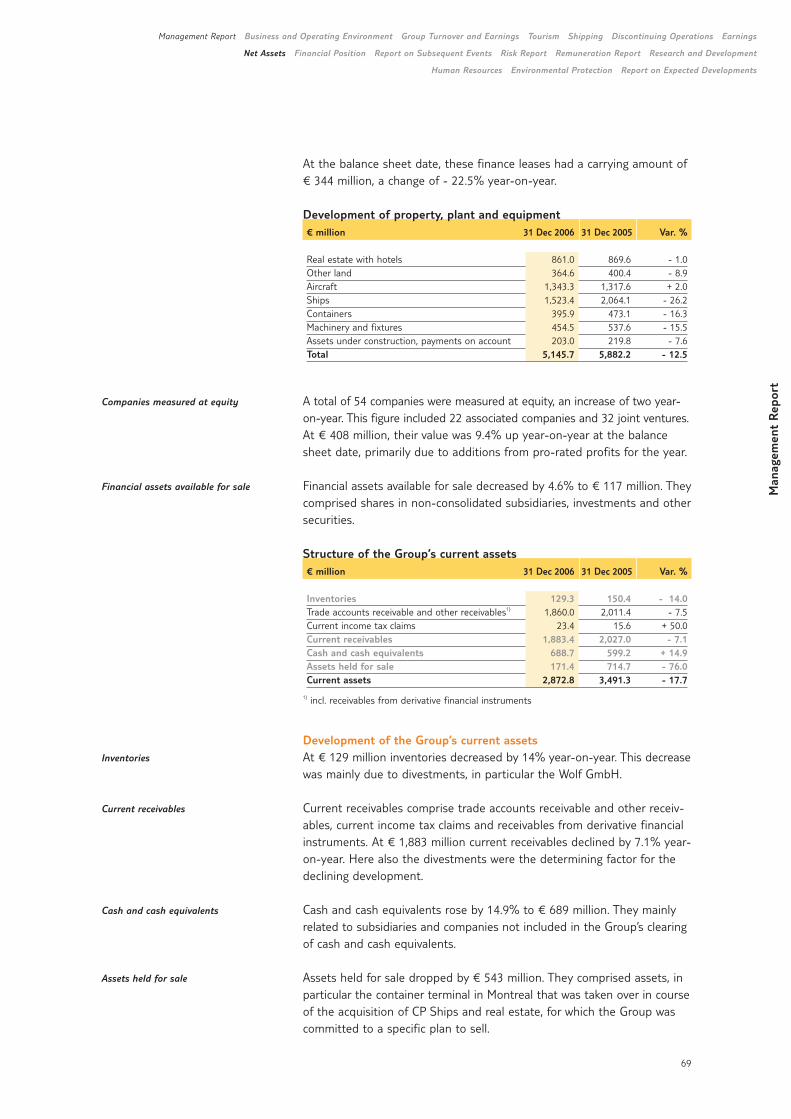
Man
agem
ent
Rep
ort
Management Report Business and Operating Environment Group Turnover and Earnings Tourism Shipping Discontinuing Operations Earnings
Net Assets Financial Position Report on Subsequent Events Risk Report Remuneration Report Research and Development
Human Resources Environmental Protection Report on Expected Developments
69
At the balance sheet date, these finance leases had a carrying amount of€ 344 million, a change of - 22.5% year-on-year.
Development of property, plant and equipment€ million 31 Dec 2006 31 Dec 2005 Var. %
Real estate with hotels 861.0 869.6 - 1.0Other land 364.6 400.4 - 8.9Aircraft 1,343.3 1,317.6 + 2.0Ships 1,523.4 2,064.1 - 26.2Containers 395.9 473.1 - 16.3Machinery and fixtures 454.5 537.6 - 15.5Assets under construction, payments on account 203.0 219.8 - 7.6Total 5,145.7 5,882.2 - 12.5
A total of 54 companies were measured at equity, an increase of two year-on-year. This figure included 22 associated companies and 32 joint ventures.At € 408 million, their value was 9.4% up year-on-year at the balancesheet date, primarily due to additions from pro-rated profits for the year.
Financial assets available for sale decreased by 4.6% to € 117 million. Theycomprised shares in non-consolidated subsidiaries, investments and othersecurities.
Structure of the Group’s current assets€ million 31 Dec 2006 31 Dec 2005 Var. %
Inventories 129.3 150.4 - 14.0Trade accounts receivable and other receivables1) 1,860.0 2,011.4 - 7.5Current income tax claims 23.4 15.6 + 50.0Current receivables 1,883.4 2,027.0 - 7.1Cash and cash equivalents 688.7 599.2 + 14.9Assets held for sale 171.4 714.7 - 76.0Current assets 2,872.8 3,491.3 - 17.7
1) incl. receivables from derivative financial instruments
Development of the Group’s current assetsAt € 129 million inventories decreased by 14% year-on-year. This decreasewas mainly due to divestments, in particular the Wolf GmbH.
Current receivables comprise trade accounts receivable and other receiv-ables, current income tax claims and receivables from derivative financialinstruments. At € 1,883 million current receivables declined by 7.1% year-on-year. Here also the divestments were the determining factor for thedeclining development.
Cash and cash equivalents rose by 14.9% to € 689 million. They mainlyrelated to subsidiaries and companies not included in the Group’s clearingof cash and cash equivalents.
Assets held for sale dropped by € 543 million. They comprised assets, inparticular the container terminal in Montreal that was taken over in courseof the acquisition of CP Ships and real estate, for which the Group wascommitted to a specific plan to sell.
Companies measured at equity
Financial assets available for sale
Inventories
Current receivables
Cash and cash equivalents
Assets held for sale
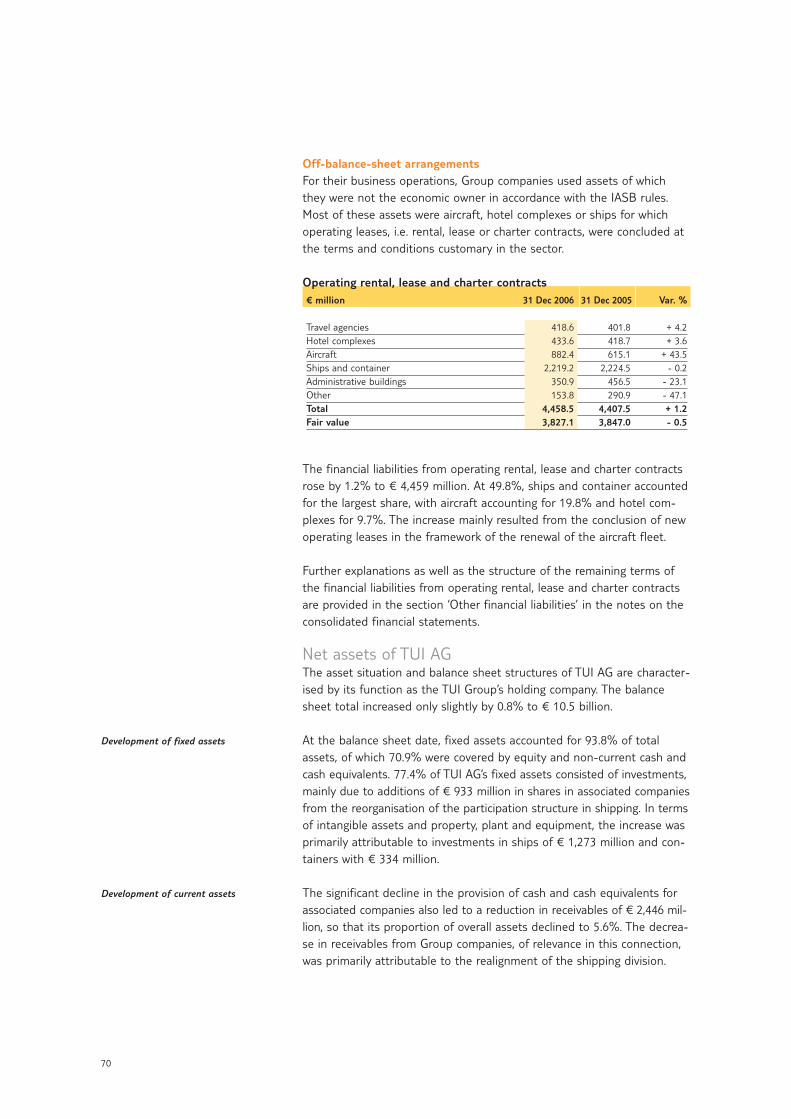
70
Off-balance-sheet arrangementsFor their business operations, Group companies used assets of whichthey were not the economic owner in accordance with the IASB rules.Most of these assets were aircraft, hotel complexes or ships for whichoperating leases, i.e. rental, lease or charter contracts, were concluded atthe terms and conditions customary in the sector.
Operating rental, lease and charter contracts € million 31 Dec 2006 31 Dec 2005 Var. %
Travel agencies 418.6 401.8 + 4.2Hotel complexes 433.6 418.7 + 3.6Aircraft 882.4 615.1 + 43.5Ships and container 2,219.2 2,224.5 - 0.2Administrative buildings 350.9 456.5 - 23.1Other 153.8 290.9 - 47.1Total 4,458.5 4,407.5 + 1.2Fair value 3,827.1 3,847.0 - 0.5
The financial liabilities from operating rental, lease and charter contractsrose by 1.2% to € 4,459 million. At 49.8%, ships and container accountedfor the largest share, with aircraft accounting for 19.8% and hotel com-plexes for 9.7%. The increase mainly resulted from the conclusion of newoperating leases in the framework of the renewal of the aircraft fleet.
Further explanations as well as the structure of the remaining terms ofthe financial liabilities from operating rental, lease and charter contractsare provided in the section ‘Other financial liabilities’ in the notes on theconsolidated financial statements.
Net assets of TUI AGThe asset situation and balance sheet structures of TUI AG are character-ised by its function as the TUI Group’s holding company. The balancesheet total increased only slightly by 0.8% to € 10.5 billion.
At the balance sheet date, fixed assets accounted for 93.8% of totalassets, of which 70.9% were covered by equity and non-current cash andcash equivalents. 77.4% of TUI AG’s fixed assets consisted of investments,mainly due to additions of € 933 million in shares in associated companiesfrom the reorganisation of the participation structure in shipping. In termsof intangible assets and property, plant and equipment, the increase wasprimarily attributable to investments in ships of € 1,273 million and con-tainers with € 334 million.
The significant decline in the provision of cash and cash equivalents forassociated companies also led to a reduction in receivables of € 2,446 mil-lion, so that its proportion of overall assets declined to 5.6%. The decrea-se in receivables from Group companies, of relevance in this connection,was primarily attributable to the realignment of the shipping division.
Development of fixed assets
Development of current assets
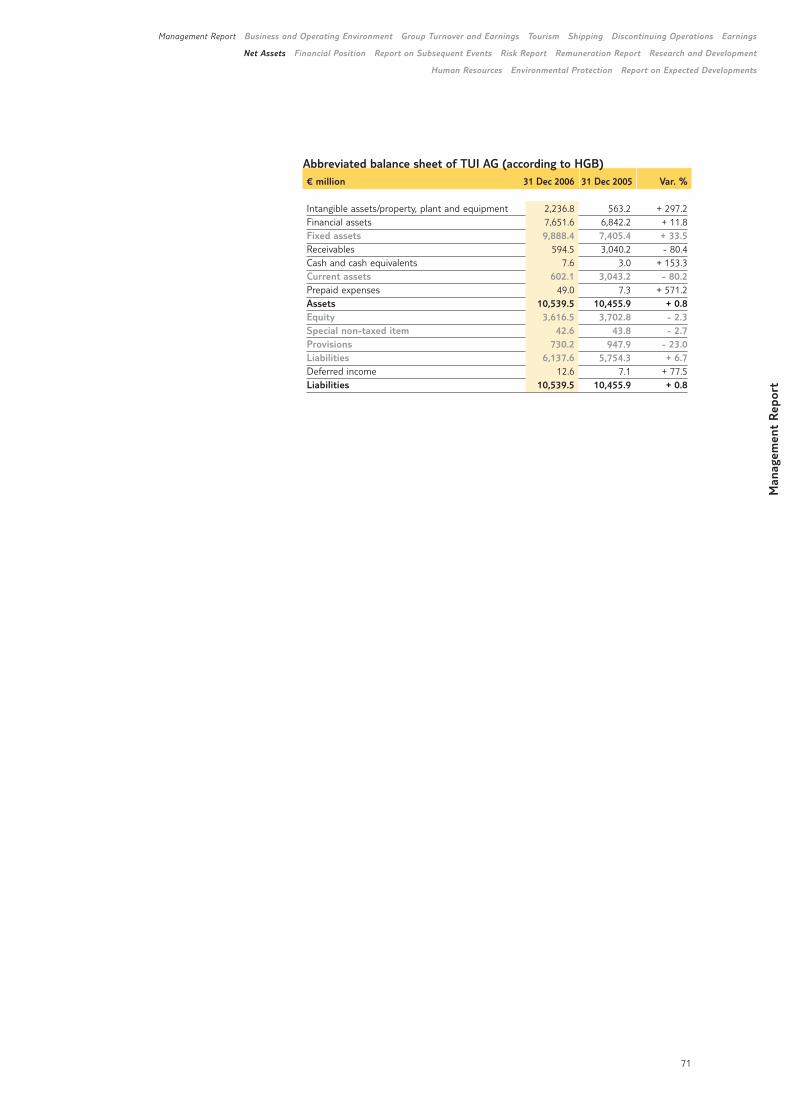
Man
agem
ent
Rep
ort
Management Report Business and Operating Environment Group Turnover and Earnings Tourism Shipping Discontinuing Operations Earnings
Net Assets Financial Position Report on Subsequent Events Risk Report Remuneration Report Research and Development
Human Resources Environmental Protection Report on Expected Developments
71
Abbreviated balance sheet of TUI AG (according to HGB)€ million 31 Dec 2006 31 Dec 2005 Var. %
Intangible assets/property, plant and equipment 2,236.8 563.2 + 297.2Financial assets 7,651.6 6,842.2 + 11.8Fixed assets 9,888.4 7,405.4 + 33.5Receivables 594.5 3,040.2 - 80.4Cash and cash equivalents 7.6 3.0 + 153.3Current assets 602.1 3,043.2 - 80.2Prepaid expenses 49.0 7.3 + 571.2Assets 10,539.5 10,455.9 + 0.8Equity 3,616.5 3,702.8 - 2.3Special non-taxed item 42.6 43.8 - 2.7Provisions 730.2 947.9 - 23.0Liabilities 6,137.6 5,754.3 + 6.7Deferred income 12.6 7.1 + 77.5Liabilities 10,539.5 10,455.9 + 0.8
72
Financial Position Liquidity safeguarded bylong-term financing. Further reduction infinancial debt.
The divestments made in the 2006 financial year – in particular the divest-ment of business travel and trading activities – as well as a further optimi-sation of property, plant and equipment resulted in a reduction in netdebt. Gross financial debt was further reduced through the scheduledredemption of a corporate bond of € 750 million. The issuance of privateplacements worth € 400 million helped to further safeguard liquidity inthe framework of general corporate financing.
The Group’s financial position
Principles and objectives of financial management The TUI Group’s central financial management is in principle run by TUI AG,which acts as the Group’s internal bank. Financial management covers allGroup companies in which TUI AG directly or indirectly holds a share ofmore than 50%. It is defined by guidelines covering all cash flow-orientedaspects of the Group’s business activities and all transactions that may orwill initiate future payment obligations for the Group.
The objectives of TUI’s financial management are securing permanentand sustainable supplies of sufficient liquidity and capital for TUI AG andits subsidiaries and limiting financial risks from foreign currencies, interestrates and commodity prices. All transactions are oriented to the objectiveof achieving the financial indicators required to enhance the current credit rating.
The Group ensures its liquidity in two ways: 1 Intra-Group financial clearing: The cash surpluses of individual Group
companies are used to finance the cash requirements of other Groupcompanies.
1 Syndicated credit facilities and bilateral bank loans: These are used byTUI AG to secure sufficient liquidity reserves. Planning and operationswith the banks are based on a monthly rolling liquidity planning system.
The Group companies operate on a worldwide scale and obtain liquidityand capital in the international money and capital markets. This gives riseto financial risks for the TUI Group, mainly arising from changes inexchange rates, interest rates and commodity prices. The key currenciesin which Group companies settle their business transactions are euros,US dollars and British pounds sterling. Other currencies of relevance areSwiss francs and Swedish krona. The Group has entered into hedges inmore than 20 foreign currencies in order to limit risks from changes in
Principles
Objectives
Liquidity management
Limiting financial risks
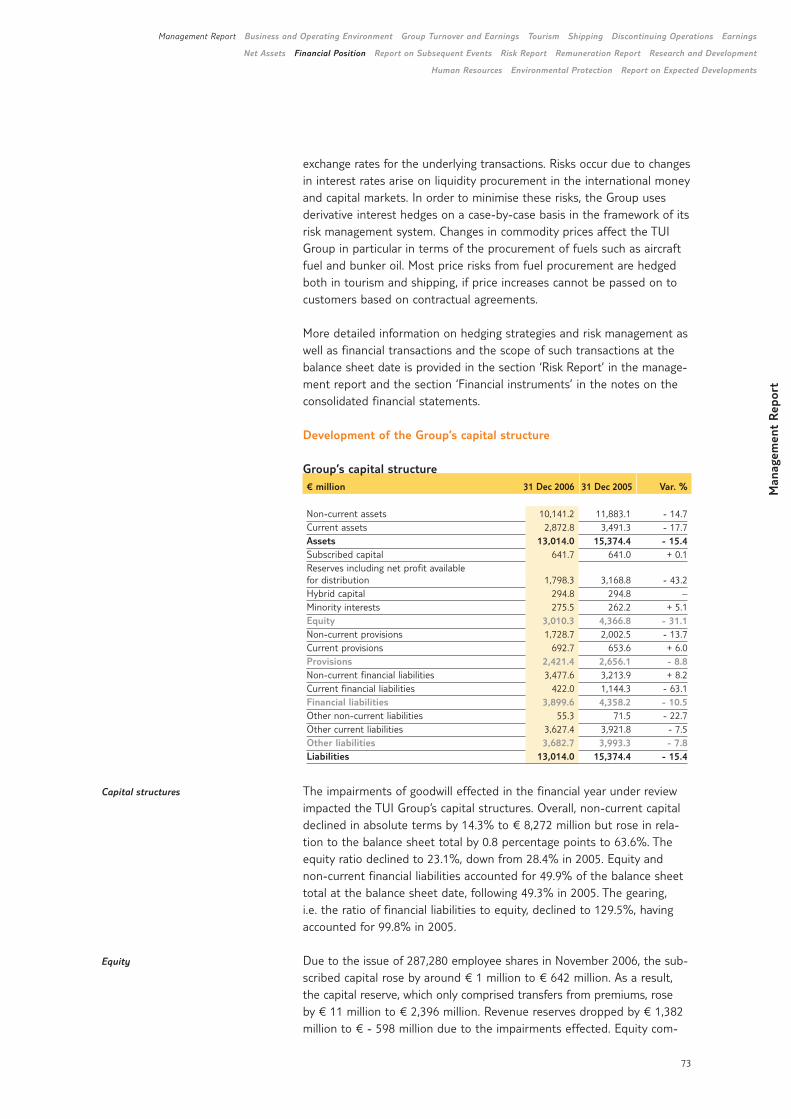
Man
agem
ent
Rep
ort
Management Report Business and Operating Environment Group Turnover and Earnings Tourism Shipping Discontinuing Operations Earnings
Net Assets Financial Position Report on Subsequent Events Risk Report Remuneration Report Research and Development
Human Resources Environmental Protection Report on Expected Developments
73
exchange rates for the underlying transactions. Risks occur due to changesin interest rates arise on liquidity procurement in the international moneyand capital markets. In order to minimise these risks, the Group usesderivative interest hedges on a case-by-case basis in the framework of itsrisk management system. Changes in commodity prices affect the TUIGroup in particular in terms of the procurement of fuels such as aircraftfuel and bunker oil. Most price risks from fuel procurement are hedgedboth in tourism and shipping, if price increases cannot be passed on tocustomers based on contractual agreements.
More detailed information on hedging strategies and risk management aswell as financial transactions and the scope of such transactions at thebalance sheet date is provided in the section ‘Risk Report’ in the manage-ment report and the section ‘Financial instruments’ in the notes on theconsolidated financial statements.
Development of the Group’s capital structure
Group’s capital structure€ million 31 Dec 2006 31 Dec 2005 Var. %
Non-current assets 10,141.2 11,883.1 - 14.7Current assets 2,872.8 3,491.3 - 17.7Assets 13,014.0 15,374.4 - 15.4Subscribed capital 641.7 641.0 + 0.1Reserves including net profit available for distribution 1,798.3 3,168.8 - 43.2Hybrid capital 294.8 294.8 –Minority interests 275.5 262.2 + 5.1Equity 3,010.3 4,366.8 - 31.1Non-current provisions 1,728.7 2,002.5 - 13.7Current provisions 692.7 653.6 + 6.0Provisions 2,421.4 2,656.1 - 8.8Non-current financial liabilities 3,477.6 3,213.9 + 8.2Current financial liabilities 422.0 1,144.3 - 63.1Financial liabilities 3,899.6 4,358.2 - 10.5Other non-current liabilities 55.3 71.5 - 22.7Other current liabilities 3,627.4 3,921.8 - 7.5Other liabilities 3,682.7 3,993.3 - 7.8Liabilities 13,014.0 15,374.4 - 15.4
The impairments of goodwill effected in the financial year under reviewimpacted the TUI Group’s capital structures. Overall, non-current capitaldeclined in absolute terms by 14.3% to € 8,272 million but rose in rela-tion to the balance sheet total by 0.8 percentage points to 63.6%. Theequity ratio declined to 23.1%, down from 28.4% in 2005. Equity andnon-current financial liabilities accounted for 49.9% of the balance sheettotal at the balance sheet date, following 49.3% in 2005. The gearing, i.e. the ratio of financial liabilities to equity, declined to 129.5%, havingaccounted for 99.8% in 2005.
Due to the issue of 287,280 employee shares in November 2006, the sub-scribed capital rose by around € 1 million to € 642 million. As a result,the capital reserve, which only comprised transfers from premiums, rose by € 11 million to € 2,396 million. Revenue reserves dropped by € 1,382million to € - 598 million due to the impairments effected. Equity com-
Capital structures
Equity
74
prised the hybrid bond of € 295 million issued in December 2005. Minority interests accounted for € 276 million or 9.2% of equity.
Provisions mainly comprised provisions for pension obligations, currentand deferred income tax provisions and provisions for typical operating risksclassified as current or non-current, depending on expected occurrence.At the balance sheet date, they accounted for a total of € 2,421 millionand were thus € 235 million or 8.8% down on the previous year. This wasdue to a decrease in provisions for pension obligations caused by thedivestments made in the course of the 2006 financial year.
Financial liabilities declined by a total of € 459 million to € 3,900 million.They were composed of bonds totalling € 2,353 million, liabilities to banksof € 1,042 million, liabilities from finance leases of € 291 million andother financial liabilities of € 213 million. The classification into current vs.non-current financial liabilities was based on maturities. The decrease ofthe financial liabilities shown as current debt down to € 422 million wasdue to the repayment of the corporate bond of € 750 million in October2006. In particular due to the private placements of over € 400 million,the non-current financial liabilities rose to € 3,478 million. More detailedinformation, in particular on the remaining terms, is provided under‘Financial liabilities’ in the notes on the consolidated financial statements.
At € 3,683 million, other liabilities dropped by € 311 million or 7.8% year-on-year. This was mainly attributable to the decrease in current tradeaccounts payable, which had risen significantly in 2005 due to the acqui-sition of CP Ships.
Ratings by Standard & Poor’s and Moody’sIn the 2006 financial year, the rating agencies Standard & Poor’s andMoody’s adjusted their credit ratings of TUI AG. The corporate ratingassigned by Standard & Poor’s was adjusted to ‘BB (negative outlook)’, withMoody’s changing their rating to ‘Ba3 (review for possible downgrade)’.The senior notes of around € 2 billion issued in 2004 and 2005 wereassigned a ‘BB- (negative outlook)’ rating by Standard & Poor’s and a ‘Ba3(review for possible downgrade)’ rating by Moody’s. The hybrid bond issuedin December 2005 was partly treated as equity as it was subordinated toother liabilities and did not have a fixed maturity; it was therefore rated‘B (negative outlook)’ by Standard & Poor’s and ‘B2 (review for possibledowngrade)’ by Moody’s. Due to the difficult market environment in 2006,Moody’s again changed their corporate and bond ratings at the beginningof 2007 to ‘B1 (stable outlook)’ and ‘B3 (stable outlook)’, respectively, forthe hybrid bond.
Key financing measures The 2006 financial year was determined by the planned redemption of acorporate bond, contributing to a further reduction in gross financial debt,and the issue of private placements to take up outside capital as an addi-tional liquidity safeguard in the framework of general corporate financing.
In October 2006, the corporate bond issued in 1999 was fully repaid at itsnominal volume of € 750 million at the end of its maturity of seven years.
Provisions
Financial liabilities
Other liabilities
Redemption of a corporate bond
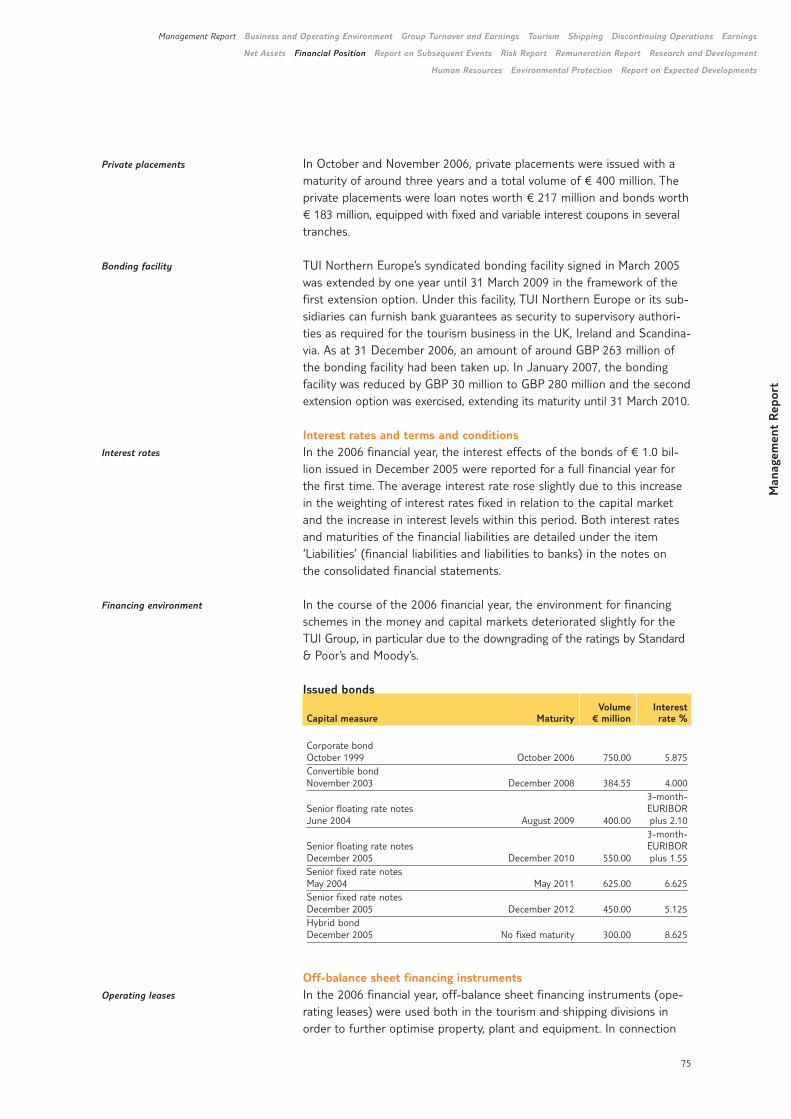
Man
agem
ent
Rep
ort
Management Report Business and Operating Environment Group Turnover and Earnings Tourism Shipping Discontinuing Operations Earnings
Net Assets Financial Position Report on Subsequent Events Risk Report Remuneration Report Research and Development
Human Resources Environmental Protection Report on Expected Developments
75
In October and November 2006, private placements were issued with amaturity of around three years and a total volume of € 400 million. Theprivate placements were loan notes worth € 217 million and bonds worth€ 183 million, equipped with fixed and variable interest coupons in severaltranches.
TUI Northern Europe’s syndicated bonding facility signed in March 2005was extended by one year until 31 March 2009 in the framework of thefirst extension option. Under this facility, TUI Northern Europe or its sub-sidiaries can furnish bank guarantees as security to supervisory authori-ties as required for the tourism business in the UK, Ireland and Scandina-via. As at 31 December 2006, an amount of around GBP 263 million ofthe bonding facility had been taken up. In January 2007, the bondingfacility was reduced by GBP 30 million to GBP 280 million and the secondextension option was exercised, extending its maturity until 31 March 2010.
Interest rates and terms and conditionsIn the 2006 financial year, the interest effects of the bonds of € 1.0 bil-lion issued in December 2005 were reported for a full financial year forthe first time. The average interest rate rose slightly due to this increasein the weighting of interest rates fixed in relation to the capital marketand the increase in interest levels within this period. Both interest ratesand maturities of the financial liabilities are detailed under the item ‘Liabilities’ (financial liabilities and liabilities to banks) in the notes on the consolidated financial statements.
In the course of the 2006 financial year, the environment for financingschemes in the money and capital markets deteriorated slightly for theTUI Group, in particular due to the downgrading of the ratings by Standard& Poor’s and Moody’s.
Issued bonds Volume Interest
Capital measure Maturity € million rate %
Corporate bondOctober 1999 October 2006 750.00 5.875Convertible bond November 2003 December 2008 384.55 4.000
3-month-Senior floating rate notes EURIBOR June 2004 August 2009 400.00 plus 2.10
3-month-Senior floating rate notes EURIBORDecember 2005 December 2010 550.00 plus 1.55Senior fixed rate notes May 2004 May 2011 625.00 6.625Senior fixed rate notes December 2005 December 2012 450.00 5.125Hybrid bond December 2005 No fixed maturity 300.00 8.625
Off-balance sheet financing instruments In the 2006 financial year, off-balance sheet financing instruments (ope-rating leases) were used both in the tourism and shipping divisions inorder to further optimise property, plant and equipment. In connection
Private placements
Bonding facility
Interest rates
Financing environment
Operating leases
76
with the ongoing renewal of the aircraft fleet in tourism in 2006 a total often aircraft were delivered. For eight aircraft, operating lease agreementswere concluded for the first time; including four aircraft in the course ofsale-and-lease-back transactions. Furthermore, for two more aircraft –owned by TUI AG up to now – corresponding sale-and-lease-back agree-ments were concluded. In shipping, an operating lease was concluded tolease a newly commissioned container ship of 8,750 TEU. Six newly com-missioned 4,250 TEU ships were chartered on the basis of long-termcharter contracts. Two container ships previously operated under financeleases were converted to operating leases. In addition, seven smaller con-tainer ships previously operated as part of CP Ships’ fleet, some of whichwere not used for Group operations, were sold and leased back on thebasis of a long-term contract.
The development of the operating rental, leasing and charter contracts is presented in the section ‘Net assets’ in the management report. Moredetailed explanations and information on the structure of the remainingterms of the associated financial liabilities are provided in the section‘Other financial liabilities’ in the notes on the consolidated financial state-ments. There were no contingent liabilities related to special-purposecompanies.
Liquidity analysisIn the 2006 financial year, the TUI Group’s solvency was secured any timeby means of cash inflows from operating activities as well as bilateral andsyndicated credit agreements with banks.
In December 2005, TUI AG concluded an agreement on a syndicated creditline (multicurrency revolving credit facility) totalling € 1.75 billion. It hadan original maturity of three years and two optional extensions for oneyear each. In October 2006, the first extension option was exercised. Inthe course of the new programme to reduce tied-up capital, the firstmeasures (divestment of Montreal Gateway Terminals and of vessels andcontainers) are implemented. Therefore the syndicated credit-line couldbe reduced to € 1.0 billion in January 2007. In addition, the Group hadbilateral credit lines with banks totalling € 0.7 billion. At the balance sheetdate, a total of € 0.1 billion of the credit lines was utilised. In addition,cash and cash equivalents of € 0.7 billion were held at the balance sheetdate. The TUI Group’s cash reserve thus totalled € 2.3 billion.
At the balance sheet date, there were no restrictions on the transfer ofliquid funds within the Group that might have significantly impacted theGroup’s liquidity such as restrictions on capital movements or restrictionsdue to credit agreements concluded.
TUI AG’s listed bonds – the private placements issued in 2006, two bilateralcredit line agreements as well as the syndicated credit line and bondingfacility – comprised change of control clauses. A change of control occursin particular if a third party directly or indirectly acquires more than 50%of the voting shares in TUI AG.
Liquidity reserve
No restrictions on the transfer
of liquid funds
Change of control
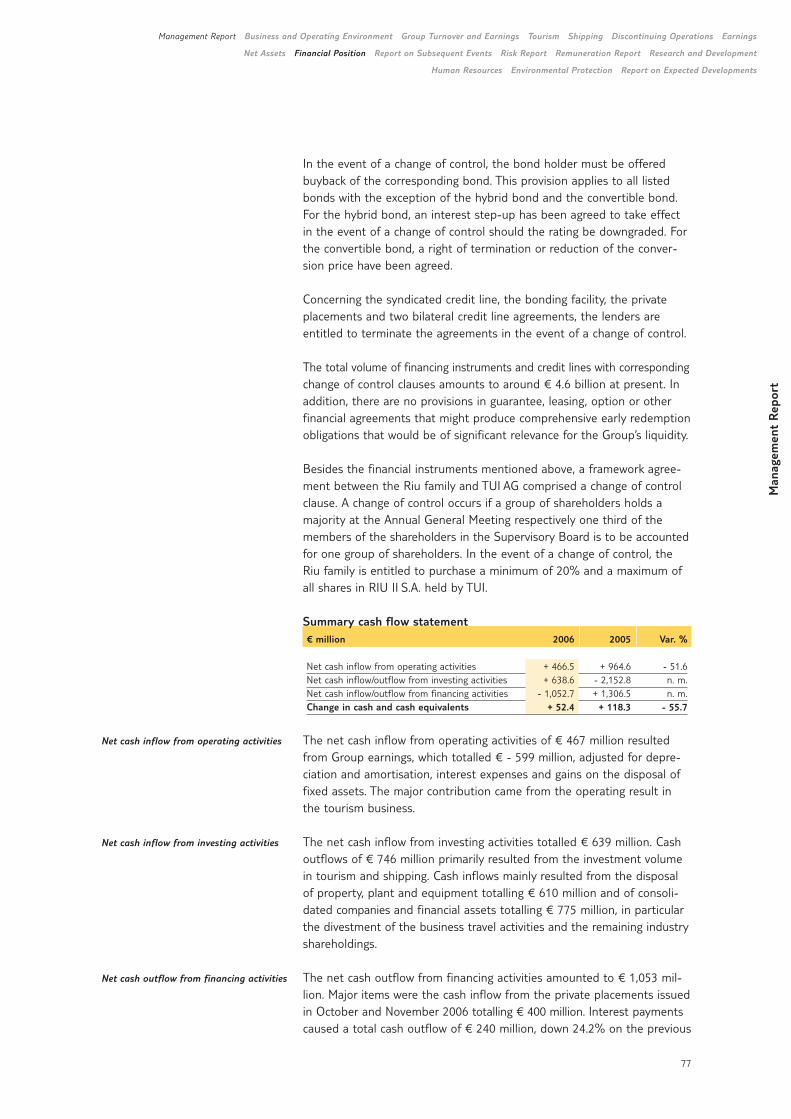
Man
agem
ent
Rep
ort
Management Report Business and Operating Environment Group Turnover and Earnings Tourism Shipping Discontinuing Operations Earnings
Net Assets Financial Position Report on Subsequent Events Risk Report Remuneration Report Research and Development
Human Resources Environmental Protection Report on Expected Developments
77
In the event of a change of control, the bond holder must be offeredbuyback of the corresponding bond. This provision applies to all listedbonds with the exception of the hybrid bond and the convertible bond.For the hybrid bond, an interest step-up has been agreed to take effectin the event of a change of control should the rating be downgraded. Forthe convertible bond, a right of termination or reduction of the conver-sion price have been agreed.
Concerning the syndicated credit line, the bonding facility, the private placements and two bilateral credit line agreements, the lenders are entitled to terminate the agreements in the event of a change of control.
The total volume of financing instruments and credit lines with correspondingchange of control clauses amounts to around € 4.6 billion at present. Inaddition, there are no provisions in guarantee, leasing, option or otherfinancial agreements that might produce comprehensive early redemptionobligations that would be of significant relevance for the Group’s liquidity.
Besides the financial instruments mentioned above, a framework agree-ment between the Riu family and TUI AG comprised a change of controlclause. A change of control occurs if a group of shareholders holds amajority at the Annual General Meeting respectively one third of themembers of the shareholders in the Supervisory Board is to be accountedfor one group of shareholders. In the event of a change of control, theRiu family is entitled to purchase a minimum of 20% and a maximum ofall shares in RIU II S.A. held by TUI.
Summary cash flow statement€ million 2006 2005 Var. %
Net cash inflow from operating activities + 466.5 + 964.6 - 51.6Net cash inflow/outflow from investing activities + 638.6 - 2,152.8 n. m.Net cash inflow/outflow from financing activities - 1,052.7 + 1,306.5 n. m.Change in cash and cash equivalents + 52.4 + 118.3 - 55.7
The net cash inflow from operating activities of € 467 million resultedfrom Group earnings, which totalled € - 599 million, adjusted for depre-ciation and amortisation, interest expenses and gains on the disposal offixed assets. The major contribution came from the operating result inthe tourism business.
The net cash inflow from investing activities totalled € 639 million. Cashoutflows of € 746 million primarily resulted from the investment volumein tourism and shipping. Cash inflows mainly resulted from the disposalof property, plant and equipment totalling € 610 million and of consoli-dated companies and financial assets totalling € 775 million, in particularthe divestment of the business travel activities and the remaining industryshareholdings.
The net cash outflow from financing activities amounted to € 1,053 mil-lion. Major items were the cash inflow from the private placements issuedin October and November 2006 totalling € 400 million. Interest paymentscaused a total cash outflow of € 240 million, down 24.2% on the previous
Net cash inflow from operating activities
Net cash inflow from investing activities
Net cash outflow from financing activities
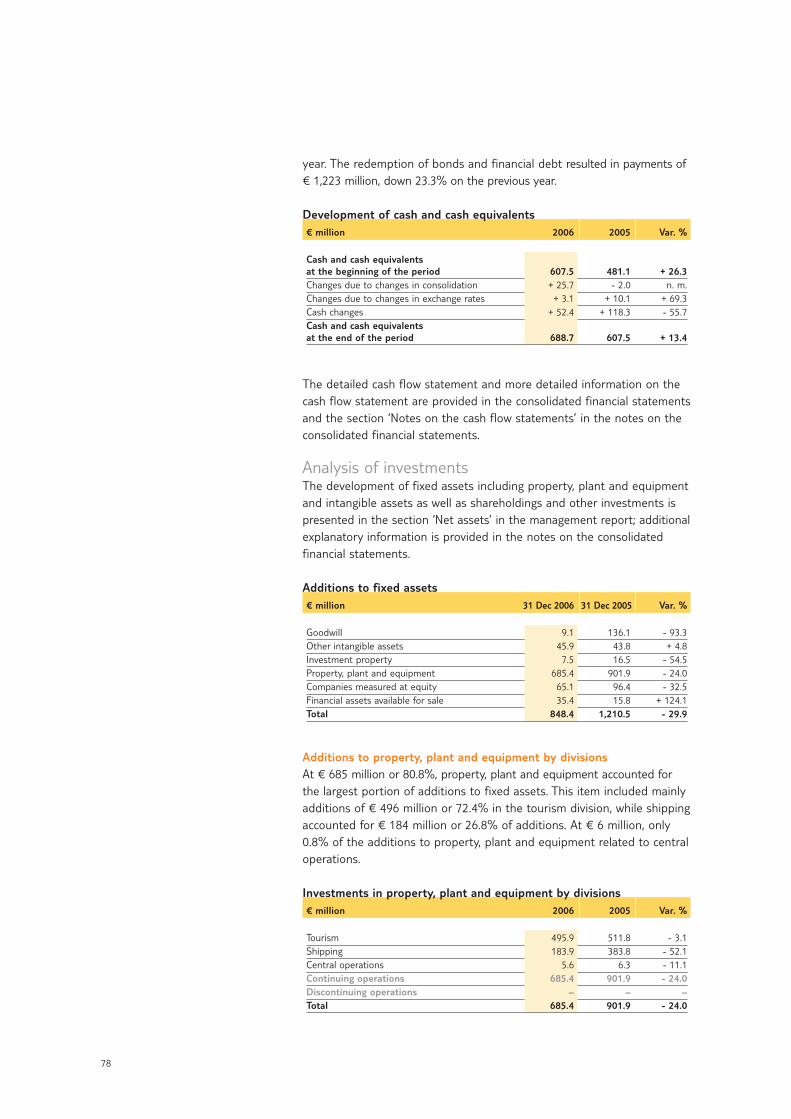
78
year. The redemption of bonds and financial debt resulted in payments of€ 1,223 million, down 23.3% on the previous year.
Development of cash and cash equivalents€ million 2006 2005 Var. %
Cash and cash equivalents at the beginning of the period 607.5 481.1 + 26.3Changes due to changes in consolidation + 25.7 - 2.0 n. m.Changes due to changes in exchange rates + 3.1 + 10.1 + 69.3Cash changes + 52.4 + 118.3 - 55.7Cash and cash equivalents at the end of the period 688.7 607.5 + 13.4
The detailed cash flow statement and more detailed information on thecash flow statement are provided in the consolidated financial statementsand the section ‘Notes on the cash flow statements’ in the notes on theconsolidated financial statements.
Analysis of investmentsThe development of fixed assets including property, plant and equipmentand intangible assets as well as shareholdings and other investments ispresented in the section ‘Net assets’ in the management report; additionalexplanatory information is provided in the notes on the consolidatedfinancial statements.
Additions to fixed assets€ million 31 Dec 2006 31 Dec 2005 Var. %
Goodwill 9.1 136.1 - 93.3Other intangible assets 45.9 43.8 + 4.8Investment property 7.5 16.5 - 54.5Property, plant and equipment 685.4 901.9 - 24.0Companies measured at equity 65.1 96.4 - 32.5Financial assets available for sale 35.4 15.8 + 124.1Total 848.4 1,210.5 - 29.9
Additions to property, plant and equipment by divisionsAt € 685 million or 80.8%, property, plant and equipment accounted forthe largest portion of additions to fixed assets. This item included mainlyadditions of € 496 million or 72.4% in the tourism division, while shippingaccounted for € 184 million or 26.8% of additions. At € 6 million, only0.8% of the additions to property, plant and equipment related to centraloperations.
Investments in property, plant and equipment by divisions€ million 2006 2005 Var. %
Tourism 495.9 511.8 - 3.1Shipping 183.9 383.8 - 52.1Central operations 5.6 6.3 - 11.1Continuing operations 685.4 901.9 - 24.0Discontinuing operations – – –Total 685.4 901.9 - 24.0
Man
agem
ent
Rep
ort
Management Report Business and Operating Environment Group Turnover and Earnings Tourism Shipping Discontinuing Operations Earnings
Net Assets Financial Position Report on Subsequent Events Risk Report Remuneration Report Research and Development
Human Resources Environmental Protection Report on Expected Developments
79
In the tourism division, investments focused on flight operations which,accounting for € 230 million of investments. The largest portion was usedfor the fleet renewal programme. A volume of almost € 184 million wasinvested in the hotel sector.
In the shipping division, investments accounted for almost € 184 million,including an amount of around € 38 million invested in container equipment.Besides investments associated with the integration of CP Ships, additionsrose by a further € 23 million due to the capitalisation of dry dock costs.
Depreciation of property, plant and equipment by divisions € million 2006 2005 Var. %
Tourism 334.2 303.7 + 10.0Shipping 255.3 126.6 + 101.7Central operations 7.5 12.3 - 39.0Continuing operations 597.0 442.6 + 34.9Discontinuing operations – – –Total 597.0 442.6 + 34.9
Depreciation of property, plant and equipment totalled € 597 million,covering 87.1% of additions. This indicator stood at 67.4% in tourism and138.8% in shipping.
Investment obligationsDue to agreements concluded in the 2006 financial year or in previousyears, order commitments for investments totalled € 3,140 million at thebalance sheet date, € 700 million of which were related to scheduled deliveries in the 2007 financial year. More detailed information is providedin the section ‘Other financial obligations’ in the notes on the consolidatedfinancial statements.
In tourism, order commitments for investments mainly related to the air-craft fleet renewal programme. The programme in France was completedwith the addition of two additional Boeing 747-400s. In Germany, therenewal of older Boeing 737s will be started on schedule. In this connection,TUI had concluded a purchasing agreement with Boeing on the purchaseof ten 737-800s in December 2004. Six of these aircraft were delivered inthe first half of 2006, while the remaining four aircraft are to follow in thefirst half of 2007. Besides this purchasing agreement, options for the pur-chase of a further 61 aircraft to be delivered by 2013 were exercised. Inaddition, 25 delivery options for the period 2007 to 2011 were transferredto a third party.
In the shipping division, Hapag-Lloyd had ordered a total of five containerships with a capacity of 8,750 TEU each at the balance sheet date, to bedelivered by 2008, with three ships already to be delivered in the 2007financial year. Two ships were directly ordered, with long-term leases withpurchase options concluded for three ships, including two purchase optionsalready exercised in 2006. In 2003, CP Ships had concluded long-termcharter contracts for nine container ships with a capacity of 4,250 TEUeach in order to extend its fleet. Six of these ships were delivered in the2006 financial year, and two ships will follow by mid-2007.
Tourism
Shipping
Order commitments
Tourism
Shipping
80
Financial position of TUI AGThe financial position of TUI AG was mainly determined by its function asthe TUI Group’s parent company and central financing entity. The changesin equity outlined for the TUI Group, in particular changes in the capitalstock and reserves as well as bonds, were also reflected in TUI AG’sbalance sheet.
Abbreviated balance sheet of TUI AG (according to German Commercial Code)€ million 31 Dec 2006 31 Dec 2005 Var. %
Fixed assets 9,888.4 7,405.4 + 33.5Current assets 602.2 3,043.2 - 80.2Prepaid expenses 49.0 7.3 + 571.2Assets 10,539.5 10,455.9 + 0.8Equity 3,616.5 3,702.8 - 2.3Special item with an equity portion 42.6 43.8 - 2.7Provisions 730.3 947.9 - 23.0Bonds 2,709.5 3,459.6 - 21.7Financial liabilities 641.4 402.9 + 59.2Other liabilities 2,786.6 1,891.8 + 47.3Liabilities 6,137.5 5,754.3 + 6.7Deferred income 12.6 7.1 + 77.5Liabilities 10,539.5 10,455.9 + 0.8
Development of TUI AG’s capital structureAt € 3,617 million, TUI AG’s equity declined slightly by 2.3%. The subscribedcapital of TUI AG consisted of no-par value shares, each representing anidentical share in the capital stock. The proportionate share in the capitalstock per no-par value share was around € 2.56. In July 2005, the previousbearer shares were converted to registered shares. The issue of 287,280employee shares in November 2006 hardly impacted the amount of sub-scribed capital. It rose by € 1 million to € 642 million. Therefore, the sub-scribed capital was represented by 251,019,855 shares at the end of yearunder review, the capital reserves stayed nearly constant at € 2,398 mil-lion, whereas the revenue reserves increased by 11.0% to € 523 million.At € 54 million, net profit available for distribution was € 141 milliondown year-on-year. The equity ratio declined by 1.1 percentage points to34.3%, down from 35.4% in 2005.
The special item with an equity portion remained almost unchanged. Asin 2005, it continued to comprise tax value adjustments on fixed assets.
Provisions declined by 23.0% to € 730 million. They comprised provisionsfor pensions of € 224 million (previous year: € 216 million) and otherprovisions of € 506 million (previous year: € 732 million).
TUI AG’s liabilities totalled € 6,138 million and thus rose by € 383 millionor 6.7% year-on-year. This was attributable to a substantial increase inother liabilities.
The Annual General Meeting of 10 May 2006 authorised the ExecutiveBoard of TUI AG to purchase own shares of up to 10% of the subscribed
Equity
Provisions
Liabilities
Authorisation of the Executive Board
for purchasing and issuing shares
Man
agem
ent
Rep
ort
Management Report Business and Operating Environment Group Turnover and Earnings Tourism Shipping Discontinuing Operations Earnings
Net Assets Financial Position Report on Subsequent Events Risk Report Remuneration Report Research and Development
Human Resources Environmental Protection Report on Expected Developments
81
capital. The authorisation will expire on 9 November 2007 and replacesthe authorisation granted by the Annual General Meeting of 11 May 2005.To date, the possibility of acquiring own shares has not been used.
On the basis of a resolution by the Annual General Meeting of 10 May2006, conditional capital of € 100.0 million was available at the balancesheet date. According to the resolution, bonds with conversion options or warrants as well as profit participation rights and income bonds with atotal par value of up to € 1.0 billion may be issued by 9 May 2011.
In addition, the Group had unused authorised capital of € 317.0 million,including authorised capital of € 7.0 million for the issue of employeeshares. The Executive Board of TUI AG has been authorised to use thiscapital by 17 May 2009. In addition to the authorised capital for the issuance of employee shares, the Annual General Meeting of 10 May 2006resolved to create authorised capital for the issuance of new shares againstcash or non-cash contribution totalling € 310.0 million. The issue of newshares against non-cash contribution was limited to € 128.0 million. TheExecutive Board of TUI AG has been authorised to use this capital by9 May 2011.
82
Report on Subsequent Events
After the completion of the 2006 financial year, there was an event ofspecial relevance to the TUI Group.
TransactionOn 22 February 2007, CP Ships Limited made a disposal agreementabout the essential assets of Montreal Gateway Terminals to MontrealGateway Terminals Limited Partnership, a company specifically foundedby Morgan Stanley Infrastructure Partners for this purpose. MontrealGateway Terminals had been part of the business of CP Ships, acquired in2005. Montreal Gateway Terminals is the second largest container termi-nal in Canada and the third largest terminal on the eastern coast ofNorth America. This divestment was effected in the framework of thereduction in tied-up capital announced by TUI AG.
Montreal Gateway Terminals Limited Partnership acquired the containerterminal business by means of an asset deal. TUI continues to hold a 20%interest in the new Montreal Gateway Terminals Limited Partnership viaCP Ships Limited. The purchase price for the transaction was € 300 million.Hapag-Lloyd remains an important customer with a long-term terminalcontract.
Economic effectsIn the 2006 financial year, Montreal Gateway Terminals contributed € 92 million to Group turnover. This amount was shown under Shippingin the segment report. Earnings before interest, taxes and amortisation ofgoodwill (EBITA) totalled € 15 million.
83
Man
agem
ent
Rep
ort
Management Report Business and Operating Environment Group Turnover and Earnings Tourism Shipping Discontinuing Operations Earnings
Net Assets Financial Position Report on Subsequent Events Risk Report Remuneration Report Research and Development
Human Resources Environmental Protection Report on Expected Developments
Risk Report Proven systems for controland management of risks.
The TUI Group operates on a worldwide scale in its two core businesses,tourism and shipping. Due to the nature of these operations, they areexposed to various risks, depending on the type of business. These risksmay arise from the Group’s own entrepreneurial action or external factors.In order to identify and actively control these risks, the Group has intro-duced Group-wide risk management systems.
Risk policyTUI’s risk policy is aimed at steadily and persistently enhancing the Group’scorporate value, achieving its medium-term financial goals and securingthe Company’s ongoing existence in the long term. It is thus an integralelement of the Group’s corporate policies.
In both core businesses, the TUI Group subsidiaries operate in marketsthat showed above-average growth in recent years and will continue togrow in future. TUI is the European market leader in the tourism businessin terms of turnover, and one of the world’s five largest container shippinglines in terms of capacity. In order to be able to benefit from the marketopportunities and tap the associated potential for success, risks must beborne to an appropriate extent. The aim and object of the risk manage-ment system is to identify any risks early on, assess them and limit themto such an extent that the economic benefit outweighs the risks.
Risk managementIn order to meet its overall responsibility within the Group, TUI AG’s Executive Board has set out guidelines incorporating the essential elementsof the risk management system. They are applicable to all Group companies.The Board has also installed monitoring and controlling systems to regularly measure, assess and control the development of business andthe related risks. Responsibility for the early identification, reporting andhandling of business risks lies with the management of the respectivecompanies, with the control functions resting with the relevant highermanagement level.
The Executive Board and the operational management employ multi-stageintegrated reporting systems for risk management purposes. On the basisof the planning and control system, deviations of actual from projectedbusiness developments are analysed on a monthly basis so that risks jeopardising the Company’s performance are timely recognised.
In addition, special independently organised reporting systems have beenintroduced for the early identification of risks threatening the existence
84
of the Company. Reporting of such risks is based on a separate system,organised on its own alongside operative risk management. The aim ofearly risk identification is to provide reports, both on a regular and case-by-case basis, identify potential risks within the Group companies, assessthese risks on the basis of uniform parameters and summarise them inan overall Group-wide system. The risk management measures to be takenare implemented within the operative entities and mapped and supportedby means of operative systems. Nevertheless, early risk identification(German Act on Control and Transparency, KonTraG) is interrelated withoperative risk management.
The Supervisory Board was involved by means of regular reports and,where required, ad hoc reports provided by the Executive Board in theform of interim reports or reports presented at its meetings.
Risk management is supported by the Group-wide auditing departments,which examine transactions and operational processes both regularly andon a case-by-case basis, checking that they function properly and aresafe and efficient.
The methods and systems used in risk management and the frequency ofcontrols are tailored to the respective types of risks and are continuallychecked, modified and adjusted to changing business environments. Thesystems for early identification of risks threatening the Group’s existencewere audited by our auditors in the course of the audit of the 2006annual financial statements.
The regular risk reporting system did not identify any specific risks threaten-ing the continued existence of individual Group companies or the entireGroup, neither during the 2006 financial year nor at year-end.
Risk transferRisk management also encompasses the transfer of risks to third parties.Damages and liability risks from day-to-day business operations are coveredby insurance policies as far as possible. The Group has concluded, interalia, liability and property insurance policies customary in the industry, aswell as policies for its flight and maritime operations. The extent of theinsurance cover is regularly reviewed and adjusted where necessary.
Risks related to the future development
Economic and industry risks The TUI Group’s activities in the tourism and shipping divisions are exposedto macroeconomic and industry-specific risks. A detailed assessment ofthe overall economic development in the near future is provided under‘Report of expected developments’. Specific risks may arise in both divi-sions from the development of commodity prices, in particular oil products,as well as currency exchange and interest rates. These developments may,inter alia, result in situations in which economic growth in countries ofrelevance to the TUI Group’s business may be weaker than expected. Thismay have an adverse effect on demand for services both in tourism andshipping and entail cost increases in the procurement of purchased mate-rials and services or products necessary for operations.
Man
agem
ent
Rep
ort
Management Report Business and Operating Environment Group Turnover and Earnings Tourism Shipping Discontinuing Operations Earnings
Net Assets Financial Position Report on Subsequent Events Risk Report Remuneration Report Research and Development
Human Resources Environmental Protection Report on Expected Developments
85
Risks from acquisitions and divestments The acquisition of CP Ships was an essential element of TUI’s growthstrategy in container shipping. The integration of CP Ships into Hapag-Lloyd AG is expected to create significant synergy effects intended tocreate a positive impact on the TUI Group’s profitability and cash flow.Although the integration processes were carefully planned and preparedand the potential earnings effects were assessed on a conservative basis,there is nevertheless a risk of the synergy effects proving to be lowerthan expected.
The acquisitions effected in the course of the realignment of the TUI Group have given rise to goodwill. A negative economic trend causinga decline in expected future cash flows gives rise to impairments (forinstance amortisation of goodwill) impacting consolidated earnings.
Risks from information technology Business processes in tourism and shipping are based on comprehensiveinformation technology systems to a large extent. In tourism, for instance,booking systems, yield management and all administrative areas are basedon IT systems. Moreover, the internet is growing in importance, not onlyas a distribution channel but also as basic technology for the automationof business processes between business partners. IT systems are alsoused in the shipping division for the worldwide booking and implementa-tion of transport services as well as capacity and yield management.
In order to guarantee the security and efficiency of business processes, ITsystems are continually reviewed and further developed. This also appliesto existing measures to ensure data safety aimed at controlling systemaccess and limiting default risks. This is exemplified by the implementationof firewalls, virus scanners and the complete mirroring of all application-critical systems, websites and infrastructure components in two physicallyseparate computer centres.
Business risks in tourismIn the tourism division, customers’ consumer and thus booking behaviouris essentially affected by the general economic environment and socialfactors. Political events, natural disasters, epidemics or terrorist attacks mayaffect customers’ decisions and impair the development of business inindividual countries. Market risks increase with fiercer competition andthe emergence of new market participants operating new business models,such as web-based distribution or low-cost airlines which may adverselyimpact sales, including agency distribution, by Group-owned companies.
A substantial business risk in tourism relates to the seasonal planning offlight and hotel capacity. In order to plan ahead, tour operators must fore-cast demand and anticipate trends in holiday types and destinations. TUI’sbusiness model is well suited to countering the ensuing occupancy risks:1 The Group’s own airline and hotel capacity is considerably lower than
the number of holidaymakers handled by its tour operators. This enablesthe Group to keep its product portfolio flexible by procuring third-partyflight capacity and hotel beds and concluding corresponding contractualagreements.
86
1 The Group’s presence in all major European markets allows it to limitthe impact of regional fluctuations in demand on capacity utilisationin the destinations.
1 Additional opportunities are offered by multi-channel distribution anddirect and modular marketing of capacity via new media such as theinternet.
Business risks in shipping The material risks concerning the development of business in containershipping arise from external factors. If world trade and investment cyclesin the shipping sector show an adverse trend, this may result in shippingcapacity overhangs and thus adversely affect marine freight rates. In theindividual trade lanes, cyclical fluctuations in regional economic activity mayinfluence imbalances in transport volumes. This risk typical of the industryis countered by means of an efficient capacity control system. Otheressential factors contributing to limiting the business risks are:1 activity in the East-West routes, i.e. trade lanes with long-term attrac-
tiveness, 1 expansion of operations in the North Atlantic and routes to and from
the Americas by means of the acquisition of CP Ships,1 membership of the Grand Alliance, one of world’s leading liner ship-
ping consortium.
Financial risks The TUI Group operates a central finance management that executes allessential transactions with the financial markets. TUI AG acts as theGroup’s internal bank: it organises intra-Group financial settlement, ensures the Group companies’ liquidity and is in charge of the Group’sfinancial risk management. The trading, settlement and controlling functionsare segregated.
The individual financing categories, rules, competences and workflows aswell as the limits for transactions and risk positions are defined by guide-lines. As a matter of principle, all hedges entered into by the Group mustbe supported by underlying recognised or future business transactions.Compliance with the guidelines and limits is constantly monitored. Recog-nised standard software is used for monitoring, evaluating and reportingon the hedges.
Financial instruments In the TUI Group, financial risks mainly arise from payment transactions inforeign currencies and from the need for fuel (aviation fuel and bunker oil)as well as financing through the money and capital markets. In order tolimit risks arising on changes in exchange rates, market prices and interestrates for the underlying business transactions, TUI uses derivative financialinstruments not traded on exchanges, primarily fixed-price transactions(e.g. forward transactions and swaps) and, to a lesser extent, options.These transactions are concluded at arm’s length with first-rate companiesoperating in the financial sector. Currency translation risks from the con-solidation of Group companies not reporting in euros are not hedged.
Man
agem
ent
Rep
ort
Management Report Business and Operating Environment Group Turnover and Earnings Tourism Shipping Discontinuing Operations Earnings
Net Assets Financial Position Report on Subsequent Events Risk Report Remuneration Report Research and Development
Human Resources Environmental Protection Report on Expected Developments
87
Detailed information about hedging strategies, risk management and thescope of financial transactions at the balance sheet date is provided inthe section on ‘Financial instruments’ in the notes on the consolidatedfinancial statements.
Liquidity managementIn the course of the annual Group planning process, TUI prepares a multi-annual finance budget. In addition, TUI operates a monthly rolling liquidityplan covering a period of one year. The liquidity plan covers all centrallycontrolled financing categories of the Group.
Both money and capital market instruments as well as bilateral bank loansand syndicated credit facilities are used to meet the Group’s financing re-quirements. At the balance sheet date, TUI AG had bilateral credit facilitiesof € 0.7 billion available, of which € 0.1 billion were drawn. In addition, theCompany had a syndicated credit facility of € 1.75 billion. In the frame-work of the new programme to reduce tied-up capital and the completionof the implementation of the first few measures, TUI reduced its syndicatedcredit facility to € 1.0 billion in January 2007. The maturity of this creditfacility is two years for the amount of € 1.0 billion and one further yearfor an amount of € 0.8 billion. In addition, the Group has an extensionoption for one further year. At the balance sheet date, this syndicatedcredit facility was not used. Due to the bilateral credit facilities and syndi-cated credit facility, TUI always has a sufficient liquidity reserve.
In order to meet its long-term financing requirements, TUI had taken upa total of € 2.71 billion in the capital market as at the balance sheet date,comprising a total of six bonds with different structures and maturities.Future repayment or refinancing risks were limited by means of an opti-misation of the maturities and volumes of these bonds.
In order to meet the regulatory requirements (in particular by the CivilAviation Authority) placed on TUI Northern Europe as a provider ofservices in tourism in the UK, Ireland and Scandinavia, TUI NorthernEurope Limited has concluded a syndicated bank facility (bonding facilityin the form of credits by way of bank guarantees) of 0.3 billion GBP. Thebonding facility will mature on 31 March 2009 for a volume of 0.3 billionGBP with the possibility of an extension for one further year upon theexercise of the extension option in February 2007 for a volume reducedto 0.2 billion GBP.
The syndicated credit facility, the syndicated bonding facility and thefinancial liabilities taken up via the capital market comprise a number ofobligations: Concerning e.g. the syndicated credit facility and the syndicatedbonding facility, the obligations comprise the duty to comply with financialcovenants covering (a) compliance with a fixed-charge cover ratio, i.e. therelative charge on the Group from the interest result and the lease andrental expenditure; and (b) compliance with a leverage ratio, e.g. the rela-tive charge on the Group from financial liabilities and off-balance sheetdebt (fair value of financial liabilities from operating lease, rental andcharter agreements). The covenants also restrict TUI’s scope for encumbe-ring or selling assets, acquiring other companies or shareholdings and
88
effecting mergers. The capital market instruments as well as the syndicatedcredit facility and bonding facility comprise additional contractual clausestypical of financing instruments of this type. Non-compliance with theseobligations awards the lender the right to call in the facilities or terminatethe capital market instruments. TUI’s business transactions and theexpected business trend are continually checked for compliance with contractual provisions.
More detailed information on financing and financial debt is providedunder ‘Financial position’ in the management report and ‘Liabilities’ inthe notes on the consolidated financial statements.
Risks from pension obligationsPension funds have been set up to fund pension obligations, in particularin the UK. These funds are managed by independent fund managers whoinvest part of the fund assets in securities. The performance of thesefunds may thus be unfavourably affected by the development on financialmarkets and may have an adverse effect on earnings.
The TUI Group’s fully or partly funded pension obligations totalled € 1.93billion, while the fair value of external pension plan assets amounted to € 1.40 billion. At the balance sheet date, the funded pension obligationsthus exceeded pension plan assets by € 0.53 billion. Combined with thefair value of pension obligations not covered by funds of € 0.54 billion,this results in a net fair value of pension obligations of € 1.07 billion, fullycovered by pension provisions. More detailed information about thedevelopment of pension obligations is provided under the item ‘Provisionsfor pensions and similar obligations’ in the notes on the consolidatedfinancial statements.
Other financial liabilitiesAt the balance sheet date, the TUI Group had other financial liabilities of€ 6.1 billion (previous year: € 4.2 billion). These liabilities mainly relatedto order commitments for investments and tourism services. Around 28%of the total amount had a remaining term of up to one year.
At the balance sheet date, financial liabilities from operating lease, rentaland charter agreements amounted to € 4.5 billion (previous year: € 4.4 billion). At € 2.2 billion, ships and container accounted for the lar-gest proportion of financial liabilities from operating lease, rental andcharter agreements, with € 0.9 billion relating to aircraft, € 0.4 billion tohotels and € 1.0 billion to other buildings and Other. Around 27% of thetotal amount had a maturity of up to one year.
Detailed information on other financial liabilites is provided in the corres-ponding section in the notes on the consolidated financial statements.
Environmental risksThe present companies of the TUI Group as well as companies alreadydivested are or were involved in the utilisation, processing, extraction,storage or transport of materials classified as damaging to the environ-ment or human health. TUI takes preventive measures to counter envi-
Man
agem
ent
Rep
ort
Management Report Business and Operating Environment Group Turnover and Earnings Tourism Shipping Discontinuing Operations Earnings
Net Assets Financial Position Report on Subsequent Events Risk Report Remuneration Report Research and Development
Human Resources Environmental Protection Report on Expected Developments
89
ronmental risks arising from current business transactions and has takenout insurance policies for certain environmental risks. Where environmen-tal risks have not passed to the buyers in divestment transactions, TUIhas formed appropriate provisions in the balance sheet in order to coverpotential claims.
Contingent liabilities and litigationContingent liabilities are potential liabilities not recognised in the balancesheet. At the balance sheet date, they amounted to € 214 million (previousyear: € 306 million) and mainly related to warranties and guarantees tosettle ongoing transactions from former plant engineering and shipbuildingactivities. Due to the reduction in warranties and guarantees, this amountcontinued to decline steadily in the 2007 financial year.
Neither TUI AG nor any of its subsidiaries are involved in pending or fore-seeable court or arbitration proceedings which might have a significantimpact on the Group’s economic position. This also applies to actions claiming warranty, repayment or any other compensation brought forwardin connection with the divestment of subsidiaries implemented over thelast few years. As in previous years, the respective Group companies formed appropriate provisions to cover potential financial charges fromcourt or arbitration proceedings.
Information about contingent liabilities and litigation is also provided inthe corresponding sections in the notes on the consolidated financial statements.
90
Remuneration Report
Upon the suggestion of the Presiding Committee, the Supervisory Boardregularly discusses and reviews the structure of the remuneration systemfor the Executive Board. The remuneration of the Executive Board membersis fixed by the Presiding Committee, which orients its decision to the sizeand global operations of the Company, its economic situation and thelevel and structure of the remuneration of Executive Board members incomparable companies. Other criteria taken into consideration are theresponsibilities held and contribution made by each individual Boardmember.
Remuneration of the Executive Board The remuneration of TUI AG’s Executive Board members comprises bothfixed and variable components. The variable components are a manage-ment bonus and a bonus with a long-term incentive effect (long-termincentive programme). The level of the bonus depends on the Group profitfor the year and on earnings by the divisions in the completed financialyear (in the previous year on the payment of the dividend) and personalassessment factors. The compensation is calculated on the basis of therespective earnings before interest, taxes and amortisation of goodwill(EBITA). In addition, Executive Board members were entitled to a companycar with chauffeur as well as special travel discount rates.
In the framework of the long-term incentive programme, the Board mem-bers were granted a bonus for the 2006 financial year, translated intophantom shares in TUI AG on the basis of an average stock price. The cal-culation for granting phantom shares was based on Group earnings beforetaxes and amortisation of goodwill (EBTA). The translation into phantomshares is based on the average stock price of TUI shares at the 20 tradingdays following the Supervisory Board meeting at which the annual finan-cial statements is approved. Thus, the number of phantom shares grantedin a financial year is not determined until the subsequent year. Following alock-up period of two years, the individual Executive Board members arefree to exercise their right to cash payment from this bonus within pre-viously determined periods of time. By resigning from the Executive Boardthe blocking period is not applicable. The level of the cash payment isbased on TUI AG’s average stock price over a period of 20 trading daysafter the exercise date. There are no absolute or relative return or shareprice targets. A cap is provided for exceptional unforeseen developments.
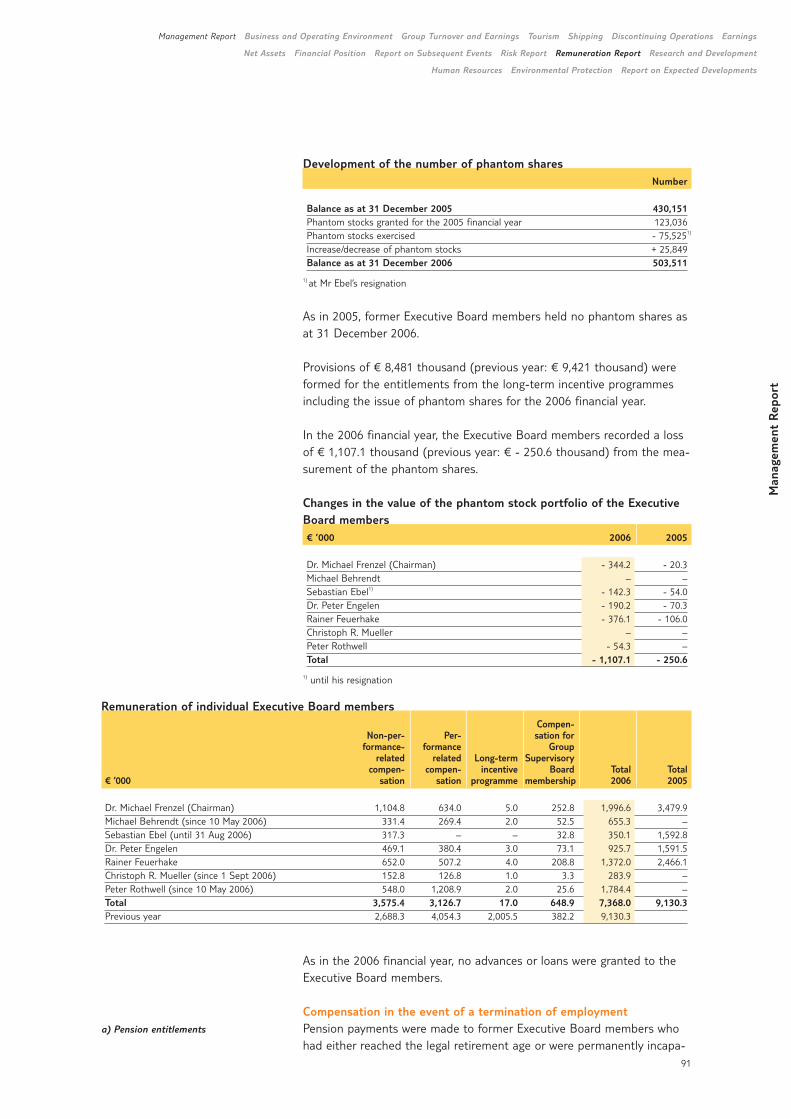
Man
agem
ent
Rep
ort
Management Report Business and Operating Environment Group Turnover and Earnings Tourism Shipping Discontinuing Operations Earnings
Net Assets Financial Position Report on Subsequent Events Risk Report Remuneration Report Research and Development
Human Resources Environmental Protection Report on Expected Developments
91
a) Pension entitlements
Development of the number of phantom shares Number
Balance as at 31 December 2005 430,151Phantom stocks granted for the 2005 financial year 123,036Phantom stocks exercised - 75,5251)
Increase/decrease of phantom stocks + 25,849Balance as at 31 December 2006 503,511
1) at Mr Ebel’s resignation
As in 2005, former Executive Board members held no phantom shares asat 31 December 2006.
Provisions of € 8,481 thousand (previous year: € 9,421 thousand) wereformed for the entitlements from the long-term incentive programmesincluding the issue of phantom shares for the 2006 financial year.
In the 2006 financial year, the Executive Board members recorded a lossof € 1,107.1 thousand (previous year: € - 250.6 thousand) from the mea-surement of the phantom shares.
Changes in the value of the phantom stock portfolio of the ExecutiveBoard members € ’000 2006 2005
Dr. Michael Frenzel (Chairman) - 344.2 - 20.3Michael Behrendt – –Sebastian Ebel1) - 142.3 - 54.0Dr. Peter Engelen - 190.2 - 70.3Rainer Feuerhake - 376.1 - 106.0Christoph R. Mueller – –Peter Rothwell - 54.3 –Total - 1,107.1 - 250.6
1) until his resignation
As in the 2006 financial year, no advances or loans were granted to theExecutive Board members.
Compensation in the event of a termination of employmentPension payments were made to former Executive Board members whohad either reached the legal retirement age or were permanently incapa-
Remuneration of individual Executive Board members Compen-
Non-per- Per- sation forformance- formance Group
related related Long-term Supervisory compen- compen- incentive Board Total Total
€ ‘000 sation sation programme membership 2006 2005
Dr. Michael Frenzel (Chairman) 1,104.8 634.0 5.0 252.8 1,996.6 3,479.9Michael Behrendt (since 10 May 2006) 331.4 269.4 2.0 52.5 655.3 –Sebastian Ebel (until 31 Aug 2006) 317.3 – – 32.8 350.1 1,592.8Dr. Peter Engelen 469.1 380.4 3.0 73.1 925.7 1,591.5Rainer Feuerhake 652.0 507.2 4.0 208.8 1,372.0 2,466.1Christoph R. Mueller (since 1 Sept 2006) 152.8 126.8 1.0 3.3 283.9 –Peter Rothwell (since 10 May 2006) 548.0 1,208.9 2.0 25.6 1,784.4 –Total 3,575.4 3,126.7 17.0 648.9 7,368.0 9,130.3Previous year 2,688.3 4,054.3 2,005.5 382.2 9,130.3

92
b) Transitional compensation
c) Change of control
citated. The pension was calculated on the basis of a pensionable payoriented to the fixed compensation of an Executive Board member. Thepension level was determined as a percentage of pensionable pay. Thispercentage was 50% for the first employment contract period. Depen-ding on the number of employment contract periods or due to individualarrangements, this percentage may rise up to 80%. A special provisionapplies to one foreign Executive Board member, whose pension accountsfor two thirds of pensionable pay. Pension entitlements are vested rightsafter the expiration of the first period of office.
Under certain circumstances, widows of Executive Board members obtaina widow’s pension of 60% of the pension for their lifetime or until re-marriage. Children of Executive Board members obtain an orphan’s pensionof 20% of the pension if they have lost one parent and 25% of the pensionif they have lost both parents at maximum until they reach the age of 27.
Pension entitlements/transfers to pension provisions or fundsTransfers to
Annual pension provisions€ ‘000 pension or funds
Dr. Michael Frenzel (Chairman) 720.0 678.9Michael Behrendt 320.0 671.3Sebastian Ebel1) 200.0 –Dr. Peter Engelen 240.0 178.3Rainer Feuerhake 424.0 346.2Christoph R. Mueller 200.0 83.3Peter Rothwell 444.0 29.6
1) Employment terminated on 31 August 2006.
Executive Board members retiring upon the expiry of their term of officeeither for lack of reappointment or renewal of their term of office orbecause the Company terminates their contract of employment are entitledto transitional compensation until the date at which the pension paymentsfall due. For contracts of employment effective before 1 September 2006,the transitional compensation corresponds to the pension entitlement. Forcontracts effective after 1 September 2006, the transitional compensationaccounts for 50% of the pension entitlement. Any income received by thebeneficiary from self-employment or employment, from pension or transi-tional payments by other companies or insurance benefits is deducted fromthe transitional compensation entitlement. The special provision applicableto a foreign Executive Board member does not include an entitlement totransitional compensation payments.
In the event of a change of control – i.e. if one or several shareholdersacquire the majority of voting rights in TUI AG – every Executive Boardmember is entitled to settlement of the financial claims for the remainingterm of the contract of employment as a Board member if the memberloses his office due to a change of control or exercises the right, specificallyaccorded for this case, to withdraw from office and give notice to quit hiscontract of employment as Board member. The performance-related com-pensation and the allotment of phantom shares for the remaining termof the contract of employment is based on the average remunerationreceived over the last three financial years. The same principle applies to the compensation for Supervisory Board memberships received fromGroup companies to date.
Man
agem
ent
Rep
ort
Management Report Business and Operating Environment Group Turnover and Earnings Tourism Shipping Discontinuing Operations Earnings
Net Assets Financial Position Report on Subsequent Events Risk Report Remuneration Report Research and Development
Human Resources Environmental Protection Report on Expected Developments
93
The employment contracts for Executive Board members do not comprisean explicit compensation provision for the event of a premature termina-tion of the employment relationship. However, a compensation may bepaid under an individual termination agreement.
At the balance sheet date, pension commitments for active Board mem-bers amounted to € 20,663 thousand (previous year: € 18,675 thousand).Pension commitments for former members of the Executive Board ortheir surviving dependants totalled € 47,811 thousand (previous year: € 46,671 thousand) at the balance sheet date.
The pension commitments for German beneficiaries were funded via pledged reinsurance policies. Since the reinsurance policies fully coveredthe commitments for the pension obligations for former and active Boardmembers, they were deducted from pension commitments as an asset.The pension commitment for one former Board member was covered bya fund. Transfers to pension provisions for active Board members totalled€ 1,988 thousand (previous year: € 6,020 thousand) in 2006.
Total compensation for former Executive Board members and their sur-viving dependants amounted to € 5,652 thousand including one-off ter-mination payments of € 2,000 thousand paid to a retired Board member(previous year: € 3,679 thousand) in the 2006 financial year. In addition,provisions of € 3,250 thousand (previous year: € 0 thousand) were formedfor the settlement of non-competition clauses and potential transitionalpayment entitlements.
Remuneration of the Supervisory BoardThe remuneration of the Supervisory Board members comprises a fixedand variable components. These are calculated on the basis of section 18of TUI AG’s articles of association, permanently accessible to the publicon the internet. Accordingly, the members of the Supervisory Boardreceive a fixed compensation of € 40,000, payable upon the end of thefinancial year, besides the reimbursement of their expenses. The Chair-man receives three times this amount, while his Deputy and other mem-bers of the Presiding Committee receive one and a half time this amount.Membership and the chairmanship in committees are separately compen-sated.
In addition, the Supervisory Board members receive a compensationoriented to the Company’s short-term success of € 100 per € 0.01 ofthe earnings per share carried for the completed financial year. Since noearnings per share were generated in the 2006 financial year, no short-term variable compensation was paid for the completed financial year.
In addition, the Supervisory Board members obtain a compensation relatedto the Company’s long-term performance. The long-term variable compo-nent comprises a basic amount of € 20,000 per year. This basic amount ispaid upon completion of the third year following the entitlement andincreases or decreases in line with the percentage change in earnings pershare within this period.
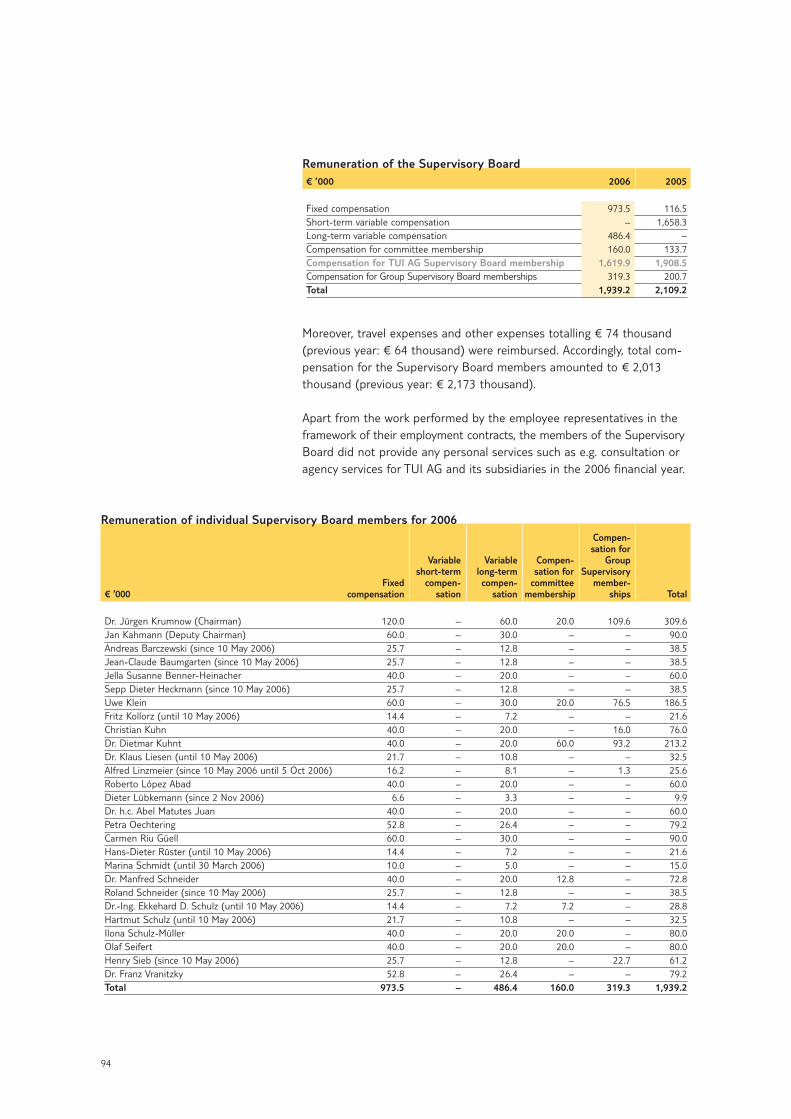
94
Remuneration of individual Supervisory Board members for 2006 Compen-sation for
Variable Variable Compen- Groupshort-term long-term sation for Supervisory
Fixed compen- compen- committee member- € ‘000 compensation sation sation membership ships Total
Dr. Jürgen Krumnow (Chairman) 120.0 – 60.0 20.0 109.6 309.6Jan Kahmann (Deputy Chairman) 60.0 – 30.0 – – 90.0Andreas Barczewski (since 10 May 2006) 25.7 – 12.8 – – 38.5Jean-Claude Baumgarten (since 10 May 2006) 25.7 – 12.8 – – 38.5Jella Susanne Benner-Heinacher 40.0 – 20.0 – – 60.0Sepp Dieter Heckmann (since 10 May 2006) 25.7 – 12.8 – – 38.5Uwe Klein 60.0 – 30.0 20.0 76.5 186.5Fritz Kollorz (until 10 May 2006) 14.4 – 7.2 – – 21.6Christian Kuhn 40.0 – 20.0 – 16.0 76.0Dr. Dietmar Kuhnt 40.0 – 20.0 60.0 93.2 213.2Dr. Klaus Liesen (until 10 May 2006) 21.7 – 10.8 – – 32.5Alfred Linzmeier (since 10 May 2006 until 5 Oct 2006) 16.2 – 8.1 – 1.3 25.6Roberto López Abad 40.0 – 20.0 – – 60.0Dieter Lübkemann (since 2 Nov 2006) 6.6 – 3.3 – – 9.9Dr. h.c. Abel Matutes Juan 40.0 – 20.0 – – 60.0Petra Oechtering 52.8 – 26.4 – – 79.2Carmen Riu Güell 60.0 – 30.0 – – 90.0Hans-Dieter Rüster (until 10 May 2006) 14.4 – 7.2 – – 21.6Marina Schmidt (until 30 March 2006) 10.0 – 5.0 – – 15.0Dr. Manfred Schneider 40.0 – 20.0 12.8 – 72.8Roland Schneider (since 10 May 2006) 25.7 – 12.8 – – 38.5Dr.-Ing. Ekkehard D. Schulz (until 10 May 2006) 14.4 – 7.2 7.2 – 28.8Hartmut Schulz (until 10 May 2006) 21.7 – 10.8 – – 32.5Ilona Schulz-Müller 40.0 – 20.0 20.0 – 80.0Olaf Seifert 40.0 – 20.0 20.0 – 80.0Henry Sieb (since 10 May 2006) 25.7 – 12.8 – 22.7 61.2Dr. Franz Vranitzky 52.8 – 26.4 – – 79.2Total 973.5 – 486.4 160.0 319.3 1,939.2
Remuneration of the Supervisory Board € ’000 2006 2005
Fixed compensation 973.5 116.5Short-term variable compensation – 1,658.3Long-term variable compensation 486.4 –Compensation for committee membership 160.0 133.7Compensation for TUI AG Supervisory Board membership 1,619.9 1,908.5Compensation for Group Supervisory Board memberships 319.3 200.7Total 1,939.2 2,109.2
Moreover, travel expenses and other expenses totalling € 74 thousand(previous year: € 64 thousand) were reimbursed. Accordingly, total com-pensation for the Supervisory Board members amounted to € 2,013thousand (previous year: € 2,173 thousand).
Apart from the work performed by the employee representatives in theframework of their employment contracts, the members of the SupervisoryBoard did not provide any personal services such as e.g. consultation oragency services for TUI AG and its subsidiaries in the 2006 financial year.
95
Man
agem
ent
Rep
ort
Management Report Business and Operating Environment Group Turnover and Earnings Tourism Shipping Discontinuing Operations Earnings
Net Assets Financial Position Report on Subsequent Events Risk Report Remuneration Report Research and Development
Human Resources Environmental Protection Report on Expected Developments
Research and Development Innovation intourism and shipping.
One of the key entrepreneurial tasks of the TUI Group is the continuousdevelopment of the services offered to our customers. Innovative, market-able products and services that set trends and secure the TUI Group’scompetitiveness therefore form the basis for sustained growth.
Innovation-driven activities in tourism and shipping, our two core busi-nesses, related to product and service portfolios, new media and informa-tion management. The associated expenses were primarily incurred inmarketing.
Some of the key factors required in order to be successful in the marketin both core businesses are the forward-looking development of attractiveproducts and services as well as the expansion of strong brands. In addition,the operating processes are constantly optimised and networked by useof modern IT technology both in tourism and shipping in order to en-hance their efficiency.
Innovation in tourism Under the motto „Let your idea win“, TUI AG initiated an innovation campaign across all business sectors in tourism in 2006. Almost 3,500innovation suggestions concerning categories such as „new businessfields” or „processes & efficiency” were submitted for the entire division.The best ideas were selected, and business plans were developed for thesesuggestions. In cooperation with the local managers, TUI AG’s ExecutiveBoard then decided on how to implement the best suggestions.
In Central Europe, the brochure world for the 2007 summer season wasdivided into three segments. Separate brochures were thus offered forTUI Schöne Ferien (classic seaside holidays), TUI Weltentdecker (city breaksand circular trips) and TUI Premium. This measure helped to furtherenhance communication with specific target groups.
In the Northern Europe sector, the successful booking website was furtherdeveloped. Customers are now able to directly watch more than 2,000videos showing destinations and accommodation and download satellitepictures of the destination and the relevant sights on the website.
In the Western Europe sector, the new reservation system Contour waslaunched for the third-party travel agencies in September. This platformnow offers a more cost-efficient and technically more reliable system tooperate a last-minute search engine and offer dynamic packaging functions,i.e. enabling customers to individually combine holiday modules. It is plan-ned – as the next step – to initiate the system also for the own retail.
TUI innovation campaign
Central Europe
Northern Europe
Western Europe
96
In flight operations, TUI Airline Management created a platform formarketing and retail issues in 2006 in order to contribute to the harmoni-sation of distribution systems and platforms and establishment of a jointdistribution strategy and structure for all TUI airlines. In addition, thedefinition of standard processes for cockpit behaviour in individual typesof aircraft was started. This will make it easier in future for the airlines toexchange aircraft and to train cockpit crews.
The agency portal developed in cooperation with the incoming agencieswas further expanded. The offerings placed on the portal such as islandtrips or guided museum tours may be incorporated into the websites ofindividual Group companies as microsites.
A major competitive factor are the TUI Group’s brands, internationallyprotected through protective rights, even in growth markets such as Indiaor China. With the strong growth in web-based distribution, the numberof web-sites registered for TUI has risen accordingly. Overall, the Groupholds several thousand domains. A large number of similar URLs is linkedwith main URLs such as tui.com or thomson.co.uk.
Innovation in shipping As before, development activities within Hapag-Lloyd focused in particu-lar on information technology in 2006. The main focus was on the furtherexpansion of our e-business. Activities centred to a large extent of thefurther development of electronic data interchange (EDI). The EDI systemautomates direct data interchange between a customer’s internal IT sys-tem and Hapag-Lloyd’s system. This offers substantial potential for effi-ciency enhancements on both sides.
In the 2006 financial year, major communication modules were improvedand expanded. A web-based conferencing system – eMeeting – was usedin order to implement project meetings, presentations or training ses-sions via the web in a time- and cost-saving way. In order to facilitatesafe, flexible and fast exchanges of information, both within the Hapag-Lloyd Group and between Hapag-Lloyd and external partners and custo-mers, the intranet was complemented by teamsites. This enables globalteams to share and manage documents, tasks, dates and deadlines.
With the new analysis tool ‘Web Focus’, Hapag-Lloyd offers final users thepossibility of rapidly preparing, analysing and distributing data concerningspecific issues such as Hapag Lloyd customers’ sales and marketing activities for large user groups.
Flight operations
Destinations
Web domains
Electronic data interchange
Communication systems
Customer relationships
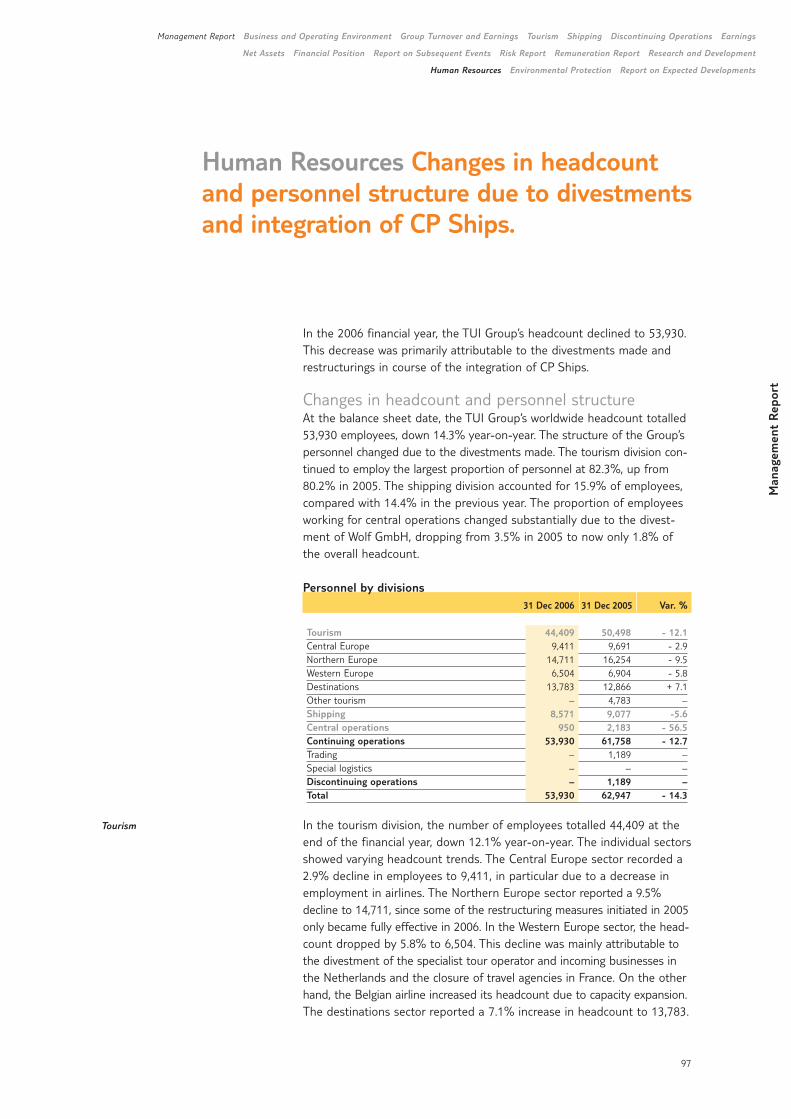
97
Man
agem
ent
Rep
ort
Management Report Business and Operating Environment Group Turnover and Earnings Tourism Shipping Discontinuing Operations Earnings
Net Assets Financial Position Report on Subsequent Events Risk Report Remuneration Report Research and Development
Human Resources Environmental Protection Report on Expected Developments
In the 2006 financial year, the TUI Group’s headcount declined to 53,930.This decrease was primarily attributable to the divestments made andrestructurings in course of the integration of CP Ships.
Changes in headcount and personnel structureAt the balance sheet date, the TUI Group’s worldwide headcount totalled53,930 employees, down 14.3% year-on-year. The structure of the Group’spersonnel changed due to the divestments made. The tourism division con-tinued to employ the largest proportion of personnel at 82.3%, up from80.2% in 2005. The shipping division accounted for 15.9% of employees,compared with 14.4% in the previous year. The proportion of employeesworking for central operations changed substantially due to the divest-ment of Wolf GmbH, dropping from 3.5% in 2005 to now only 1.8% ofthe overall headcount.
Personnel by divisions31 Dec 2006 31 Dec 2005 Var. %
Tourism 44,409 50,498 - 12.1Central Europe 9,411 9,691 - 2.9Northern Europe 14,711 16,254 - 9.5Western Europe 6,504 6,904 - 5.8Destinations 13,783 12,866 + 7.1Other tourism – 4,783 –Shipping 8,571 9,077 -5.6Central operations 950 2,183 - 56.5Continuing operations 53,930 61,758 - 12.7Trading – 1,189 –Special logistics – – –Discontinuing operations – 1,189 –Total 53,930 62,947 - 14.3
In the tourism division, the number of employees totalled 44,409 at theend of the financial year, down 12.1% year-on-year. The individual sectorsshowed varying headcount trends. The Central Europe sector recorded a2.9% decline in employees to 9,411, in particular due to a decrease inemployment in airlines. The Northern Europe sector reported a 9.5%decline to 14,711, since some of the restructuring measures initiated in 2005only became fully effective in 2006. In the Western Europe sector, the head-count dropped by 5.8% to 6,504. This decline was mainly attributable tothe divestment of the specialist tour operator and incoming businesses inthe Netherlands and the closure of travel agencies in France. On the otherhand, the Belgian airline increased its headcount due to capacity expansion.The destinations sector reported a 7.1% increase in headcount to 13,783.
Tourism
Human Resources Changes in headcountand personnel structure due to divestmentsand integration of CP Ships.
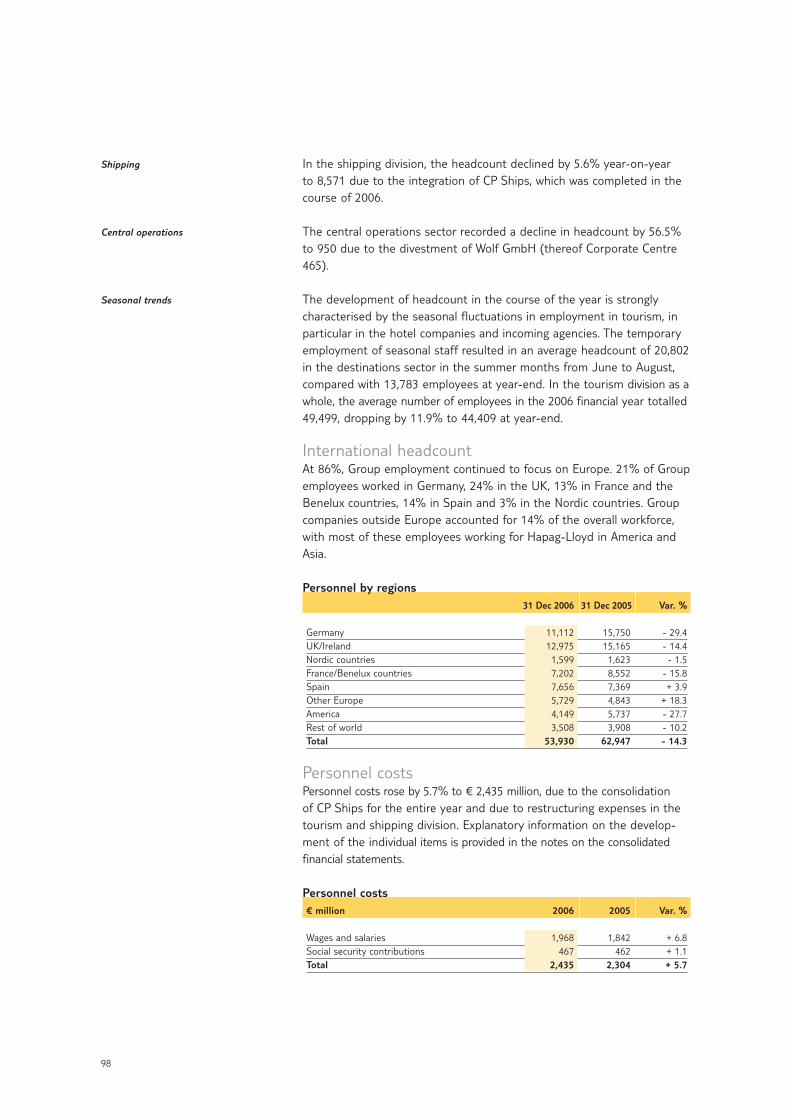
98
Shipping
Central operations
Seasonal trends
In the shipping division, the headcount declined by 5.6% year-on-yearto 8,571 due to the integration of CP Ships, which was completed in thecourse of 2006.
The central operations sector recorded a decline in headcount by 56.5%to 950 due to the divestment of Wolf GmbH (thereof Corporate Centre465).
The development of headcount in the course of the year is stronglycharacterised by the seasonal fluctuations in employment in tourism, inparticular in the hotel companies and incoming agencies. The temporaryemployment of seasonal staff resulted in an average headcount of 20,802in the destinations sector in the summer months from June to August,compared with 13,783 employees at year-end. In the tourism division as awhole, the average number of employees in the 2006 financial year totalled49,499, dropping by 11.9% to 44,409 at year-end.
International headcount At 86%, Group employment continued to focus on Europe. 21% of Groupemployees worked in Germany, 24% in the UK, 13% in France and theBenelux countries, 14% in Spain and 3% in the Nordic countries. Groupcompanies outside Europe accounted for 14% of the overall workforce,with most of these employees working for Hapag-Lloyd in America andAsia.
Personnel by regions31 Dec 2006 31 Dec 2005 Var. %
Germany 11,112 15,750 - 29.4UK/Ireland 12,975 15,165 - 14.4Nordic countries 1,599 1,623 - 1.5France/Benelux countries 7,202 8,552 - 15.8Spain 7,656 7,369 + 3.9Other Europe 5,729 4,843 + 18.3America 4,149 5,737 - 27.7Rest of world 3,508 3,908 - 10.2Total 53,930 62,947 - 14.3
Personnel costsPersonnel costs rose by 5.7% to € 2,435 million, due to the consolidation of CP Ships for the entire year and due to restructuring expenses in thetourism and shipping division. Explanatory information on the develop-ment of the individual items is provided in the notes on the consolidatedfinancial statements.
Personnel costs€ million 2006 2005 Var. %
Wages and salaries 1,968 1,842 + 6.8Social security contributions 467 462 + 1.1Total 2,435 2,304 + 5.7
99
Man
agem
ent
Rep
ort
Management Report Business and Operating Environment Group Turnover and Earnings Tourism Shipping Discontinuing Operations Earnings
Net Assets Financial Position Report on Subsequent Events Risk Report Remuneration Report Research and Development
Human Resources Environmental Protection Report on Expected Developments
Environmental Protection Group environ-mental performance indicators. Continuousimprovement in environmental quality bymeans of certification. Partnership andcooperation.
Nature conservation and an intact environment, climate protection andthe protection of seas and oceans are key prerequisites for sustainableactivities in the tourism and shipping divisions. TUI’s sustainable environ-mental management therefore is integral part of the Group’s managementquality concerning ecological governance, compliance and risk prevention.
Group environmental performance indicators Due to the differentiated consideration of international reporting standardssuch as the G3 Guidelines of the Global Reporting Initiative (GRI) thetransparency of the environmental performance across the entire Groupcould be enhanced in the 2006 financial year. In 2006, environmentalindicators concerning energy efficiency and climate-related emissionswere determined in particular for the Group’s airlines and hotels as well asits shipping division. These indicators facilitated a relevant determinationof its environmental impact. This improved transparency was reflected byTUI AG’s admission to the Dow Jones Sustainability Index (DJSI) World.
The highest part of the energy consumption by the Group primarily rela-tes to the use of fossil fuels in airline and shipping operations. Due tothe integration of CP Ships the energy consumption is not comparableyear-on-year. Total energy consumption amounted to 232,426 Tera Joule(TJ). Fuel consumption by the airlines rose 3.4% due to the expansion ofthe fleet. TUI’s airlines recorded a specific fuel consumption of 3.08 litresof aircraft fuel per 100 passenger kilometres in 2006 and were thus amongthe most efficient airlines. The increase in specific energy consumptionper TEU and nautical mile in the container shipping to 2.41 Mega Jouleper TEU and per nautical mile was caused by the increase in the numberof smaller container ships. A decrease of about 12% to 3,65 mega jouleper passenger and 100 nautical miles could be achieved in case of thecruise ships.
One of the key environmental indicators for the TUI Group is the emissionof carbon dioxide (CO2) caused by the airlines and shipping operations. Inthe 2006 financial year the overall emission of CO2 stood at 15.99 milliontons. At 7.9 kilogram, the emission of CO2 per 100 passenger kilometrewas slightly – about 2% – higher year-on-year for all airlines. The emissionof CO2 of the container ship fleet stood at 174.16 g per TEU and nauticalmile in the 2006 financial year. In the cruise sector a reduction of thespecific emission of about 12% to around 283 g CO2 per passenger and100 nautical miles was achieved.
Environmental monitoring
Energy consumption
Carbon dioxide emissions
100
Continuous quality improvement by means of certificationIn order to achieve a continuous improvement in the quality of productsunder environmental aspects, the environmental management systems ofthe individual Group companies were continually adjusted to the require-ments of international environmental standards. A permanent focus ofsystematic environmental improvements is directed towards the hotelcompanies. In 2006, 23 hotels were newly certified under ISO 14001. Atyear-end, the environmental management systems of a total of elevenRobinson Clubs, two Magic Life Clubs, seven Iberotels, four Nordotels,nine Grupotels, one Dorfhotel and four hotels of the Sol y Mar Groupwere thus certified according to ISO 14001.
Strategic partnership and cooperation schemes In tourism, the companies supported ecological sustainability by meansof their involvement in numerous bodies both in the source markets anddestinations and participation in a multi-stakeholder dialogue. In shipping,the environmental protection activities for marine transports and cruiseswere systematically continued in international partnership schemes.
In the framework of the Sustainability Leadership Forum, initiated byB.A.U.M. (German Environmental Management Association) and the Centrefor Sustainability Management at Lüneburg University, the Group conti-nued its active cooperation with renowned pioneers in sustainable corpo-rate development in 2006. The aim of the Forum is to secure and expandthe leading position of the participating companies in this area.
In 2006, active partnership with EUROPARC Federation, the umbrellaorganisation of Europe’s protected areas, focused on the structural, systematic implementation of the newly formulated Charter Principles.Through its active membership in the EUROPARC European CharterEvaluation Committee, TUI was directly involved in the development ofcooperative nature protection measures. TUI therefore primarily supportedthe specific evaluation and verification processes used by independenttechnical experts in assessing applications for European nature reservesas ‘Charter Parks’.
As before, TUI’s environmental activities focused in particular on activitiesin the framework of TUI’s biodiversity strategy in the 2006 financial year.At the eighth Conference of the Parties (COP 8) of the Convention onPreservation of Biological Diversity in Curitiba/Brazil, TUI presented acomprehensive global case study under the title ‘Wildlife Watching andTourism’ in cooperation with the Secretariat of the Convention on Migra-tory Species (Bonn Convention).
Hapag-Lloyd was involved in the Clean Cargo Group to promote moresustainability in international transportation. In order to support protectionof the oceans, in particular the Arctic and Antarctic seas, Hapag-LloydKreuzfahrten cooperated with several international organisations, e.g. inthe framework of the WWF Arctic Programme.
Hotels newly certified according to ISO 14001: Magic Life: Club Africana Imperial (Tunisia)Iberotel: Gran Sharm, Makadi Beach, Makadi
Oasis, Makadi Saraya, Palace andLamaya (Egypt)
Sol y Mar: Makadi Sun, Makadi Star & Spa, Belvedere and Solaya (Egypt)
Grupotels: Valparaíso Palace, Parc Natural, GranVista, Los Principes, Macarella, Aguait,Picafort Beach, Amapola and GrupotelClub Turquesa Mar (Spain/BalearicIslands)
Nordotel: Cinco Plazas, Jardin del Sol, Orquideaand Révoli (Spain/Canaries)
Complete list:www.tui-umwelt.com
101
Man
agem
ent
Rep
ort
Management Report Business and Operating Environment Group Turnover and Earnings Tourism Shipping Discontinuing Operations Earnings
Net Assets Financial Position Report on Subsequent Events Risk Report Remuneration Report Research and Development
Human Resources Environmental Protection Report on Expected Developments
Economic environment
Macroeconomic situationOverall, the global economic growth observed in 2006 will continue in2007 and 2008. However, economists expect the growth momentum toslow down slightly. The International Monetary Fund (IMF) expects globalgross domestic product to account for 4.9% in 2007, a decline of 0.2 per-centage points on 2006 (IMF, September 2006). High average crude oilprices and potentially increasing inflation trends in the industrialisedcountries as well as an associated increase in interest rate levels willremain some of the key risks for the development of the world economy.Although global economic growth will reduce slightly, the forthcomingperiods are expected to show robust growth compared with the growthtrend of the past few years.
According to the experts’ assessments, a differentiated picture emergesfor the individual economic regions. Economic activity in the industrialisedcountries is expected to slow slightly in 2007. In the US, growth is ex-pected to slow down in 2007, in particular due to the weakening of theresidential property market and the associated burden on the formationof wealth and the propensity to consume shown by private households. A slight recovery trend is expected for 2008. For the eurozone, economicgrowth is expected to continue, although economic momentum will weakenslightly. A temporary slowdown in economic activity is expected for Ger-many, in particular, due to a decline in the propensity to consume in thewake of the restrictive fiscal policy. According to recent studies, however,the downturn is expected to be less marked and gross domestic productis expected to increase in 2007, which means that GDP will fall onlyslightly short of the previous year’s level. This trend is expected to showonly a minor dip in 2008. Strong growth is expected to continue in theAsian countries. Due to a persistently expansive investment policy, Chinais expected to retain high growth rates in the forthcoming periods. How-ever, the other emerging economies in eastern Asia and India are alsoexpected to continue the dynamic trend shown by their economies.
General development
Development of the regions
Report on Expected Developments Actionprogramme in tourism is being implemented.Shipping benefits through synergies.
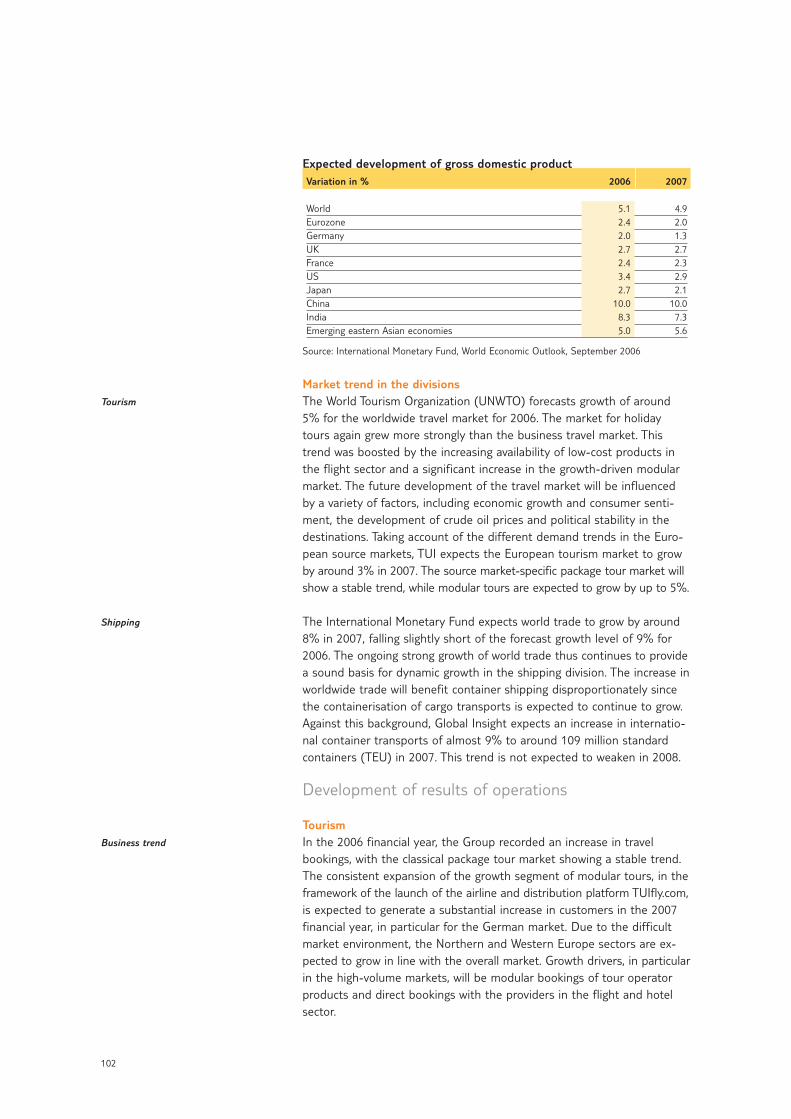
102
Tourism
Shipping
Business trend
Expected development of gross domestic product Variation in % 2006 2007
World 5.1 4.9Eurozone 2.4 2.0Germany 2.0 1.3UK 2.7 2.7France 2.4 2.3US 3.4 2.9Japan 2.7 2.1China 10.0 10.0India 8.3 7.3Emerging eastern Asian economies 5.0 5.6
Source: International Monetary Fund, World Economic Outlook, September 2006
Market trend in the divisionsThe World Tourism Organization (UNWTO) forecasts growth of around5% for the worldwide travel market for 2006. The market for holidaytours again grew more strongly than the business travel market. Thistrend was boosted by the increasing availability of low-cost products inthe flight sector and a significant increase in the growth-driven modularmarket. The future development of the travel market will be influencedby a variety of factors, including economic growth and consumer senti-ment, the development of crude oil prices and political stability in thedestinations. Taking account of the different demand trends in the Euro-pean source markets, TUI expects the European tourism market to growby around 3% in 2007. The source market-specific package tour market willshow a stable trend, while modular tours are expected to grow by up to 5%.
The International Monetary Fund expects world trade to grow by around8% in 2007, falling slightly short of the forecast growth level of 9% for2006. The ongoing strong growth of world trade thus continues to providea sound basis for dynamic growth in the shipping division. The increase inworldwide trade will benefit container shipping disproportionately sincethe containerisation of cargo transports is expected to continue to grow.Against this background, Global Insight expects an increase in internatio-nal container transports of almost 9% to around 109 million standardcontainers (TEU) in 2007. This trend is not expected to weaken in 2008.
Development of results of operations
TourismIn the 2006 financial year, the Group recorded an increase in travel bookings, with the classical package tour market showing a stable trend.The consistent expansion of the growth segment of modular tours, in theframework of the launch of the airline and distribution platform TUIfly.com,is expected to generate a substantial increase in customers in the 2007financial year, in particular for the German market. Due to the difficultmarket environment, the Northern and Western Europe sectors are ex-pected to grow in line with the overall market. Growth drivers, in particularin the high-volume markets, will be modular bookings of tour operatorproducts and direct bookings with the providers in the flight and hotelsector.
Man
agem
ent
Rep
ort
Management Report Business and Operating Environment Group Turnover and Earnings Tourism Shipping Discontinuing Operations Earnings
Net Assets Financial Position Report on Subsequent Events Risk Report Remuneration Report Research and Development
Human Resources Environmental Protection Report on Expected Developments
103
Turnover
Earnings
Earnings target for 2008
Business trend
The ongoing enlargement of the range of innovative products in thepackage tour market and the expansion of the modular tour segment areexpected to generate volume growth, which in turn will create turnovergrowth in the tourism division. Based on turnover of around € 14 billionin the 2006 financial year, turnover growth to up to € 15 billion is targetedfor the 2007 financial year. Here, too, the Central Europe sector is expectedto grow above average, while the Northern Europe sector in particular willgrow less strongly, in line with its volume growth.
The earnings trend (adjusted earnings before interest, taxes and amorti-sation of goodwill, adjusted EBITA) for 2007 differs between the individualsectors of the tourism division. Earnings in the Central Europe sector areexpected to benefit from the strong expansion of the new business seg-ments and thus match the good 2006 level. The Northern Europe sectorwill see, in a changed competitive environment, a stabilization of earningsdue to the restructuring measures launched in the UK and Ireland in theprevious year. In the Nordic countries, the positive earnings trend is ex-pected to continue. The Western Europe sector anticipates a positiveoverall profit contribution. Its earnings will only slightly be impacted bythe difficult market environment in France. In the destinations sector,earnings are expected to rise, primarily due to the profitable growth inthe hotel portfolio.
The strategic initiatives launched in the framework of the structural marketchanges in tourism aim to achieve a sustainable increase in earnings bythe tourism division. The action programme comprises five key initiatives:
1Flight operations: Medium-term pooling of the TUI Group’s Europeanflight operations under the new brand and distribution platform TUIfly.com.
1Distribution: Expansion of web-based sales of tours and developmentof the TUIfly.com airline brand into an international travel platform
1Cruise: Entry into the growth-driven high-volume premium business of the German cruise market
1Hotel companies: Profitable growth through ongoing selective expan-sion of the Group’s hotel portfolio
1Cost structures: Sustainable improvement in cost structures by meansof a reduction in the cost of materials and personnel costs in tourismof € 250 million
Taking account of a margin risk due to the intensification of competitionand the increase in crude oil prices – in particular the development ofaircraft fuel prices – TUI has established an earnings target range of€ 450 to 550 million for 2008.
ShippingAgainst the background of the global economic scenario, TUI expects itscontainer shipping operations to generate growth of 8% to 9% in trans-port volumes for 2007 an 2008, in line with the market trend. Due to theworldwide ship capacity to be commissioned in the near future, supplyand demand are not expected to balance out in all trade lanes in 2007and 2008. Freight rates are therefore also expected to show regional
104
Turnover
Earnings
Earnings target for 2008
Financing
variations. Overall, TUI expects freight rates to stabilise in the second halfof 2007 and pick up increasingly in 2008 in its shipping division.
Against the background of the expected development of transport volumesand the stabilisation of average freight rates, the shipping division willachieve an increase in turnover. Based on turnover in the 2006 financialyear of € 6.3 billion, an increase to just under € 7 billion will be possiblein the 2007 financial year.
Following the difficult year 2006 for worldwide container shipping opera-tions, TUI expects to be able to generate a significantly positive earningscontribution (adjusted earnings before interest, taxes and amortisation of goodwill, adjusted EBITA by divisions) in the shipping division. Thedevelopment of earnings – before special effects from the integration ofCP Ships in 2006 – was primarily driven by the realisation of synergiesfrom the completion of the operating integration process. Most of thesesynergies related to cost synergies, so that a significantly positive profitcontribution is expected even if the weak market conditions of 2006should continue.
By leveraging in 2008 the full synergy potential of € 220 million from theintegration of CP Ships and through achieving the expected volume growthand the recovery of freight rates levels, TUI has an earnings target rangeof € 400 to 500 million for the year 2008.
TUI GroupBased on the expected increase in turnover in tourism and shipping con-solidated turnover will rise from € 20 billion, the turnover generated in2005, to just under € 22 billion.
TUI AGAgainst the background of the forecast development of business andearnings of the TUI Group, TUI AG, the Group’s holding company, is ex-pected to receive sufficient inflows of earnings from its investments andfrom divestments already agreed for 2007 to resume payment of a divi-dend after the dividend in 2007 was not paid for the 2006 financial year.
Development of the financial situation The TUI Group currently has undrawn credit lines of € 1.6 billion. Thesecredit lines mainly serve to hold a liquidity reserve of around € 1 billion.Due to the Group’s current long-term financing structure, barring thepossible repayment of the convertible bond (volume: € 385 million) inDecember 2008, the Group does not have any further liquidity require-ments in the 2007 and 2008 financial years in order to refinance short-term financing instruments. The TUI Group’s net debt totalled € 3.2 billionat the balance sheet date. It will be reduced by a further € 0.3 billion atthe beginning of the 2007 financial year following the agreed divestmentof the Montreal Gateway Terminals. The action programme announced inDecember 2006 to reduce Group debt has thus been partly implementedand already generated € 0.6 billion worth of net debt reduction of a totalof € 1.0 billion. In December 2006, € 0.3 billion had been generated byselling seven container ships and containers from the former portfolio of
Man
agem
ent
Rep
ort
Management Report Business and Operating Environment Group Turnover and Earnings Tourism Shipping Discontinuing Operations Earnings
Net Assets Financial Position Report on Subsequent Events Risk Report Remuneration Report Research and Development
Human Resources Environmental Protection Report on Expected Developments
105
Investments
CP Ships. The implementation of the other initiatives already announcedwill generate a further reduction in debt.
Due to the investment decisions already taken and planned projects, TUIexpects a financial requirement of € 850 million in the 2007 financial year.These funds will almost exclusively be used for investments in property,plant and equipment. The plan requirements can be divided evenly bet-ween tourism and shipping. In the tourism division, the largest portionwill be used for the expansion of the hotel sector, followed by the fleetrenewal programme in flight operations. In shipping, the expansion of thecontainer ship fleet will require most of the cash and cash equivalents.Other projects or acquisitions will only be considered and implemented ifany attractive opportunities were to arise or if this will be required in thelight of the business development. The planned investments will befinanced from the cash flow.
Expected overall developmentOverall, the macroeconomic environment is favourable for the TUI Group’sactivities in the 2007 financial year. This will create opportunities for furthergrowth and potential to increase earnings. The consistent implementationof our action programme in tourism and the realisation of synergies fromthe integration of CP Chips into the shipping divisions with at the sametime a reduction in central costs, will create a considerable improvementin consolidated earnings. The measures to reduce our capital employedalready implemented or planned for the future will further enhance theGroup’s solid financing structure.
Hanover, 5 March 2007
The Executive Board
Frenzel
Behrendt Engelen Feuerhake
Mueller Rothwell
106
TUI is with its corporate strategy and business model, based on the two pillarsof tourism and shipping well positioned. In the future we will continue to valuestrong management and consistent development and implementation of thenecessary business measures. The sustained enhancement of corporate value andefficiency are TUI’s key strategic objectives.
Corporate Governance
Leistung 14 Geschäft und Rahmenbedingungen26 Ertragslage40 Geschäftsverlauf 40 Touristik51 Schifffahrt56 Einzustellende Bereiche57 Vermögenslage62 Finanzlage72 Nachtragsbericht73 Risikobericht79 Forschung und Entwicklung81 Mitarbeiter83 Umweltschutz85 Prognosebericht
Cor
pora
te G
over
nanc
e
106 Corporate Governance
108 Corporate Governance Report112 Report of the Supervisory Board 118 Supervisory Board121 Executive Board123 TUI Share127 TUI Group in Figures128 Sustainable Development
107
108
The actions of TUI AG’s management and control bodies are determinedby the principles of good and responsible corporate governance. The following corporate governance report is provided by the Executive Boardand at the same time on behalf of the Supervisory Board pursuant tosub-section 3.10 of the German Corporate Governance Code.
TUI has consistently based its corporate governance on the recommen-dations and suggestions of the German Corporate Governance Code. The Executive Board and the Supervisory Board discussed corporategovernance issues several times in 2006 and jointly submitted an updateddeclaration of compliance for 2006 on 14 December 2006, pursuant tosection 161 of the German Stock Corporation Act. The declaration wasmade permanently available to the general public on the Company’s website.
Declaration of complianceThe declaration of compliance reads as follows:
‘In accordance with section 161 of the German Stock Corporate Act, theExecutive Board and Supervisory Board of TUI AG hereby declare:
The recommendations of the Government Commission on the GermanCorporate Governance Code in the version of 2 June 2005, as publishedby the Federal Ministry of Justice in the official section of the electronicFederal Gazette on 21 July 2005, have been and are fully complied with.
TUI AG will additionally fully comply with the recommendations in thecurrently valid version of 12 June 2006, as published by the FederalMinistry of Justice on 24 July 2006.
In addition, TUI AG also complies with the suggestions set out in theCode, the only exceptions being the formation of further committees andthe introduction of varying periods of office for the shareholders’ repre-sentatives in the Supervisory Board, for which no plan exists at present.’
We consider maintenance of uniform periods of office to be useful inorder to guarantee the continuity of the work of the Supervisory Board.To date, the formation of further committees has not been necessary.
Cooperation between the Executive Board and Supervisory Board TUI AG is a company under German law, which also forms the basis of theGerman Corporate Governance Code. One of the fundamental principles of
The current and all previous declarations of
compliance have been made permanently
available on the internet at
www.tui-group.com
Corporate Governance Report Recommen-dations of the German Corporate Gover-nance Code fully implemented.
Cor
pora
te G
over
nanc
e
Corporate Governance Corporate Governance Report Report of the Supervisory Board Supervisory Board Executive Board
TUI Share TUI Group in Figures Sustainable Development
109
German stock corporation law is the dual management system involvingtwo bodies, the Executive Board and the Supervisory Board, each ofwhich are endowed with independent competences. TUI AG’s ExecutiveBoard and Supervisory Board cooperate closely and in a spirit of trust tomanage and control the company.
TUI AG’s Executive Board currently comprises six members. They managethe company’s operations and are jointly accountable for the managementof the company. The allocation of duties and responsibilities to the indivi-dual Board members is presented separately in this chapter.
The Supervisory Board advises and supervises the Executive Board in themanagement of the company. It is involved in strategic and planning decisions and all decisions of fundamental importance to the company. In accordance with the terms of reference, decisions taken by the ExecutiveBoard on major transactions such as the annual budget, major acquisitionsor divestments require the approval of the Supervisory Board. The chairmanof the Supervisory Board coordinates the work in the Supervisory Board,chairs its meetings and externally represents the concerns of the body.
The Executive Board provides the Supervisory Board with comprehensiveup-to-date information at regular meetings and in writing about thedevelopment of business and the situation of the Group, including riskmanagement. An extraordinary Supervisory Board meeting may be con-vened if required when events of particular relevance occur. The SupervisoryBoard has adopted terms of reference governing its work. In the run-upto the Supervisory Board meetings, the representatives of shareholdersand employees meet separately, when necessary.
In accordance with the German Co-determination Act and the Articles ofAssociation, TUI AG’s Supervisory Board comprises twenty members, withten representatives elected by the shareholders and ten by the employeesfor an identical period of office. There is no plan at present to introducedifferent periods of office for the shareholders’ representatives. In accor-dance with the new recommendations of the German Corporate Gover-nance Code, the shareholders’ representatives were elected individually inthe last elections to the Supervisory Board at the Annual General Meetingon 10 May 2006. The Supervisory Board does not comprise any formerExecutive Board members. The body comprises a sufficient number ofindependent members not maintaining any personal or business relation-ship with the company or its Executive Board. The Supervisory Board hasbeen elected for a period of five years that will expire at the end of the2011 ordinary Annual General Meeting.
The Supervisory Board has established two committees from among itsmembers: the Presiding Committee and the Audit Committee, which prepare and complement its work. The Presiding and Audit Committeehave six members each, with an equal number of shareholder andemployee representatives. Based on his practical professional experience,the chairman of the Audit Committee has special knowledge and experiencein the application of accounting principles and internal control methods.There is no plan at present to set up any further committees.
110
The Executive and Supervisory Board members are obliged to act in TUI AG’s best interests. In the completed financial year there were noconflicts of interest requiring immediate disclosure to the SupervisoryBoard. None of the Executive Board members of TUI AG sat on morethan five Supervisory Boards on listed non-Group companies.
TUI AG complies with the recommendations of the German CorporateGovernance Code to provide details of the remuneration of each individualmember of the Executive Board and Supervisory Board. The principles ofthe remuneration systems and remuneration amounts are outlined in theremuneration report which is part of the management report.
Shareholders and Annual General MeetingTUI AG shareholders exercise their co-determination and control rights atthe ordinary Annual General Meeting. The AGM takes decisions on allstatutory matters that are binding on all shareholders and the Company.For voting on resolutions, each share confers one vote.
All shareholders registering in due time are entitled to participate in theAGM. Shareholders who are not able to attend the AGM in person areentitled to have their voting rights exercised by a proxy of their ownchoosing or by a representative provided by TUI AG and acting on theirbehalf in accordance with their instructions. Since the 2006 Annual GeneralMeeting, shareholders have also had the opportunity of voting per internetin the run-up to the AGM or authorising the representatives provided bythe Company via the web.
The invitation to the AGM and the reports and documents required forvoting are published in accordance with the provisions of the GermanStock Corporation Act and provided in German and English on TUI AG’swebsite. During the AGM the presentations given by the Chairman of theSupervisory Board and the Executive Board are transmitted live over theinternet.
Risk managementGood corporate governance entails the responsible handling of commercialrisks. The Executive Board of TUI AG and the management of the TUI Group use comprehensive general and company-specific reportingand monitoring systems to identify, assess and manage these risks. Thesesystems are continually developed, adjusted to match changes in overallconditions and reviewed by the auditors. More detailed information aboutrisk management in the TUI Group is presented in the relevant chapter ofthe management report.
TransparencyTUI provides immediate, regular and up-to-date information about theGroup’s economic situation and new developments to capital market participants and the interested public. The annual report and the interimreports are published within the applicable time-frames. The companypublishes press releases and ad hoc releases, if required, on topicalevents and any new developments. In addition, shareholders and interestedparties may subscribe to a newsletter providing up-to-date information
Remuneration Report:
Have a look at the Management Report,
page 90
Cor
pora
te G
over
nanc
e
Corporate Governance Corporate Governance Report Report of the Supervisory Board Supervisory Board Executive Board
TUI Share TUI Group in Figures Sustainable Development
111
about the Group. All information is published simultaneously in Germanand English and is available in print as well as by appropriate electronicmedia such as e-mail or the internet. Moreover, the company website atwww.tui-group.com provides comprehensive information on the TUIGroup and the TUI share.
The scheduled dates for the main regular events and publications – suchas AGM, annual report and interim reports – are set out in a financialcalendar. They are published well in advance and made permanentlyaccessible to the public on TUI AG’s website.
Directors’ dealingsThe Company was not informed of any notifiable purchase or sale trans-actions of TUI AG shares or related financial instruments by any Boardmembers in 2006.
At the end of the 2006 financial year, the number of shares in TUI AGdirectly or indirectly held by members of the Executive Board and Super-visory Board exceeded 1%, the limit fixed for individually notifiable shareownership, for two Supervisory Board members. Executive Board mem-bers held a total of 2,038 shares, Supervisory Board members held18,780,820 shares. Of these shares, Ms Carmen Riu Güell held 12,768,000shares (indirectly), Mr Abel Matutes Juan held 6,006,000 shares (indirectly)and the remaining Supervisory Board members held 6,820 shares.
Accounting and auditingTUI AG prepares its consolidated financial statements in accordance withthe provisions of the International Accounting Standards Board (IASB)and regularly publishes interim reports, also in accordance with the relevantprovisions of the IASB. The annual financial statements of TUI AG areprepared in accordance with the German Commercial Code (HGB).
The consolidated financial statements and the financial statements of TUIAG were audited by PricewaterhouseCoopers Aktiengesellschaft Wirt-schaftsprüfungsgesellschaft, Hanover, the auditor elected by the 2006AGM. The audit was based on German auditing rules, taking account ofthe generally accepted auditing standards issued by the German Auditors’Institute as well as the International Standards on Auditing. It also coveredrisk management and compliance with reporting requirements concerningcorporate governance pursuant to section 161 of the German StockCorporation Act. In addition, a contractual agreement was concluded withthe auditors to the effect that the auditors will immediately inform theSupervisory Board of any reasons for disqualification or partiality occurringduring the audit as well as of all findings or events of importance arisingduring the performance of the audit. In the course of the audit for the2006 financial year there was no reason to provide such information.
112
In the following, the Supervisory Board reports about its activities in the2006 financial year, in particular the plenary discussions, the work doneby the committees, the compliance with the German Corporate Gover-nance Code, the audit of the financial statements of TUI AG and the Groupas well as changes in the membership of the Boards of the Company.
Cooperation between Supervisory Board and Executive Board In the 2006 financial year, the Supervisory Board performed its duties inaccordance with the law and the Articles of Association. It monitored thework of the Executive Board and regularly advised the Board on themanagement of the Company.
In written and verbal reports, the Executive Board provided regular, timelyand comprehensive information to the Supervisory Board, encompassingall relevant information on the development of business and the positionof the Group, including the risk situation and risk management. Devia-tions from the approved plans for the development of business werepresented, explained and discussed. The Executive Board discussed thestrategic orientation of the Group and all key transactions of relevance tothe Company – in particular the further development of the Group – withthe Supervisory Board. The Supervisory Board was involved in all keydecisions affecting the Company.
Transactions requiring the approval of the Supervisory Board and decisionsof fundamental importance were discussed in depth in the committees ofthe Supervisory Board with the Executive Board prior to a decision beingtaken. The Supervisory Board was fully informed about specific and parti-cularly urgent plans and projects arising between the regular meetings and,where necessary, submitted its vote in writing. In addition, the chairmanof the Supervisory Board was regularly informed about current businessdevelopments and key transactions in the Company in between Super-visory Board meetings.
Supervisory Board and committeesThe Supervisory Board has set up two committees to support its work:the Presiding Committee and the Audit Committee. The Presiding Commit-tee prepares the resolutions and issues to be dealt with by the SupervisoryBoard. It also fixes the terms and condition, including the remuneration,of the contracts of employment for Executive Board members. The chair-man of the Supervisory Board has regularly informed the plenary meetingsabout the discussions and resolutions taken by the Presiding Committee.
Report of the Supervisory Board
Cor
pora
te G
over
nanc
e
Corporate Governance Corporate Governance Report Report of the Supervisory Board Supervisory Board Executive Board
TUI Share TUI Group in Figures Sustainable Development
113
The Supervisory Board held five regular meetings and one constituentmeeting in the 2006 financial year. The Presiding Committee also met fivetimes, and the Audit Committee four times.
Prior to regular Supervisory Board meetings the shareholders’ represen-tatives met four times and the employees’ representatives nine times inseparate meetings. Seven Supervisory Board members were newly electedor appointed in 2006 and therefore attended fewer than half of theSupervisory Board meetings in the 2006 financial year. Two furtherSupervisory Board members also participated in fewer than half of themeetings: Dr. Ekkehard D. Schulz, who resigned from the SupervisoryBoard as at the end of the 2006 Annual General Meeting and thereforeonly attended two meetings, and Ms Marina Schmidt, who was no longeremployed by a company forming part of the TUI Group after the divestmentof the TQ3 Group and retired from the Supervisory Board on conclusionof 30 March 2006.
Work of the Presiding CommitteeAt its meeting on 25 January 2006, the Presiding Committee dealt mainlywith issues relating to the Executive Board. At its meeting on 21 March2006, convened to adopt the annual financial statements, deliberationsfocused on the annual and consolidated financial statements for 2005,including the Audit Committee’s report on this issue, the comparison between budgeted figures and actual performance for 2005 and variousamendments to the Articles of Association. On 8 May 2006 and 24 August2006, the meetings again focused on Executive Board matters. On 14 Dec-ember 2006 deliberations focused on issues relating to the ExecutiveBoard and the updated declaration on the German Corporate GovernanceCode.
Work of the Audit CommitteeAt its meeting on 17 March 2006, the Audit Committee focused its delibera-tions on the annual financial statements of TUI AG and the consolidatedfinancial statements for 2005. Other issues covered included the recom-mendation to the Supervisory Board on the election of the auditors forthe 2006 financial year as well as insurance coverage of the companiesand Boards.
At its meeting on 8 May 2006, the Audit Committee mainly dealt with theinterim financial statements to 31 March 2006.
One of the key items discussed at the meeting on 9 August 2006 werethe interim financial statements for the end of the first half of 2006. Inaddition, the Audit Committee discussed the main areas to be audited in the annual audit for the 2006 financial year.
The meeting on 8 November 2006 mainly focused on the interim financialstatements to 30 September 2006. The agenda also covered other issuesincluding the internal control system, in particular Group Internal Auditingactivities in the 2006 financial year and the audit plan for 2007. Auditorrepresentatives attended all four meetings of the Audit Committee andpresented reports on their activities.
114
Deliberations in the Supervisory BoardThe Executive Board’s reports and the discussions at Supervisory Boardmeetings regularly focused on the development of turnover, earnings andemployment of the Group and the individual divisions as well as thefinancial situation and structural development of the Group.
At its meeting on 25 January 2006 the Supervisory Board approved thebudget for 2006 for the Group and took note of the 2007/2008 forecastaccounts. A further item on the agenda was the appointment of MessrsAdolf Adrion (shipping), Christoph R. Mueller (airlines) and Karl J. Pojer(hotels & resorts) as divisional directors by the Supervisory Board. TheSupervisory Board also discussed the divestment of the interest in TQ3Travel Solutions Management Holding GmbH and dealt with shareholdingissues and editorial amendments of TUI AG’s Articles of Association.
The Supervisory Board meeting on 21 March 2006 focused on thereports and deliberations on the annual financial statements as per31 December 2005, a comparison between budgeted and actual figuresfor 2005 and the personnel and social reports for 2005. The discussionson the annual financial statements were also attended by representativesof the auditors who were available to answer questions. Other items onthe agenda for this meeting were the resolution concerning the issue ofemployee shares and the extension of the authorisation to acquire ownshares as well as various amendments to the Articles of Association. TheSupervisory Board also dealt with shareholding issues.
At the meeting on 10 May 2006, Messrs Michael Behrendt (shipping) and Peter Rothwell (tourism) were appointed TUI AG Executive Boardmembers by the Supervisory Board, additionally this meeting served toprepare for the forthcoming ordinary Annual General Meeting. After theAnnual General Meeting on 10 May 2006, the constituent meeting of thenewly elected Supervisory Board was convened. The chairman and thevice-chairman of the Supervisory Board and the members and chairmenof the Presiding Committee and Audit Committee were elected at thatmeeting.
On 30 and 31 August 2006 the Supervisory Board met for its annualstrategy meeting. The presentations and deliberations focused on theinitiatives developed by the Executive Board in order to achieve a sub-stantial and sustainable increase in the profitability of the tourism andshipping divisions. In order to secure the performance targets, a compre-hensive programme for further efficiency enhancements in all sectors ofthe Group was adopted. In this connection, decisions were taken concerningchanges in the composition of the Executive Board and divisional directorsand changes in the allocation of responsibilities of Executive Board mem-bers, outlined in greater detail in the sections ‘Supervisory Board’ and‘Executive Board‘ in this chapter. Furthermore, measures were preparedin order to reduce invested capital and central costs. Following compre-hensive deliberations on the strategic positioning of TUI AG as a two-pillar group, the Supervisory Board and Executive Board agreed that thepublicly discussed option of a spin-off of container shipping would jeo-pardise consolidated assets and would not be in the interest of TUI share-
Cor
pora
te G
over
nanc
e
Corporate Governance Corporate Governance Report Report of the Supervisory Board Supervisory Board Executive Board
TUI Share TUI Group in Figures Sustainable Development
115
holders and employees. The meeting closed with presentations and discussions concerning the financial framework for the Group’s futuredevelopment and the Group’s personnel and social policies.
On 25 September 2006, the Supervisory Board agreed to the divestmentof the interest in Wolf GmbH – effective from 5 October 2006 – in thewritten circular procedure.
The meeting on 14 December 2006 focused on the measures to be takenin order to achieve the strategic goals and thus the budget for 2007 andthe 2008/2009 forecast accounts. In addition, shareholding issues andinvestment projects had to be dealt with. Moreover, the SupervisoryBoard adopted the declaration of compliance with the German CorporateGovernance Code.
Corporate GovernanceAt the meeting of 14 December 2006, the Executive and SupervisoryBoard discussed an update of the declaration of compliance with theGerman Corporate Governance Code and issued the joint declaration ofcompliance pursuant to section 161 of the German Stock CorporationAct. It was made permanently accessible to the public on TUI’s website.Accordingly, TUI AG complies with all recommendations of the GermanCorporate Governance Code in its currently applicable version dated 12 June 2006. In accordance with section 3.10 of the Code and also onbehalf of the Supervisory Board, the Executive Board reports about corporate governance in a separate sector (Corporate Governance Report)of this chapter.
At their meetings, both the Audit Committee and the Supervisory Boarddealt with corporate governance issues within the company several times.Due to the Supervisory Board elections held in the 2006 financial yearand the resulting short duration of the term of office of the new members,the Boards did not have the efficiency of their own actions examined. Thenext efficiency review will be carried out in 2007.
Audit of the annual financial statements of TUI AG and the GroupPricewaterhouseCoopers Aktiengesellschaft Wirtschaftsprüfungsgesellschaft,Hanover, were appointed as the auditors by the Annual General Meetingheld on 10 May 2006 and were commissioned by the Supervisory Board.The audit covered the annual financial statements of TUI AG as at 31 December 2006, submitted by the Executive Board and prepared inaccordance with the provisions of the German Commercial Code (HGB),and the joint management report for TUI AG and the TUI Group and the consdidated financial statements for the 2006 financial year, the provisions of the International Accounting Standards Board (IASB) andcomplemented by the commercial-law provisions additionally requiredpursuant to section 315a sub-section 1. The auditors issued their un-qualified audit certificate for the annual financial statements of TUI AGand the consolidated financial statements.
The financial statements, the management report and the auditors’ reportswere submitted to all members of the Supervisory Board. They were
116
discussed at the Audit Committee meeting of 17 March 2007 and theSupervisory Board meeting on 18 March 2007, at which representativesof the auditors were present and were available to answer questions.
On the basis of its own audit of the annual financial statements of TUI AGand the TUI Group, the joint management report as at 31 December 2006and the results of the audit, the Supervisory Board approved the annualfinancial statements prepared by TUI AG, which were thereby adopted,the consolidated financial statements and the Group management report.The Supervisory Board also examined and approved the proposal for theappropriation of the profits for the 2006 financial year submitted by theExecutive Board.
Supervisory Board and committee membership Ms Marina Schmidt resigned from the Supervisory Board on conclusionof 30 March 2006 since she was no longer a TUI Group employee as ofthat date due to the divestment of the TQ3 Group. The Supervisory Boardthanks her for her cooperation based on trust.
With effect from the end of the Annual General Meeting on 10 May 2006,Messrs Fritz Kollorz, Dr. Klaus Liesen, Hans-Dieter Rüster, Hartmut Schulzand Dr. Ekkehard D. Schulz resigned from the Supervisory Board. TheSupervisory Board thanks the gentlemen for their commitment overmany years and acknowledges their achievements.
The employees’ representatives to the Supervisory Board were electedon 5 April 2006. The shareholders’ representatives were elected to theSupervisory Board at the AGM on 10 May. In these elections, MessrsJean Claude Baumgarten, Andreas Barczewski, Sepp Dieter Heckmann,Alfred Linzmeier, Roland Schneider and Henry Sieb were newly elected to the Supervisory Board. The other members of the Supervisory Boardwere reelected. The current term of office will expire in 2011. The consti-tuent meeting of the new Supervisory Board took place on 10 May 2006.
At its constituent meeting on 10 May 2006, the Supervisory Board electedDr. Jürgen Krumnow chairman and Jan Kahmann vice-chairman of theSupervisory Board. These two gentlemen therefore automatically sit onthe Presiding Committee. In addition, Ms Petra Oechtering and Ms CarmenRiu Güell as well as Messrs Uwe Klein and Dr. Franz Vranitzky were electedto the Presiding Committee. Ms Ilona Schulz-Müller and Messrs Uwe Klein,Dr. Jürgen Krumnow, Dr. Dietmar Kuhnt (chairman), Dr. Manfred Schneiderand Olaf Seifert were elected members of the Audit Committee.
On 5 October 2006, Mr Alfred Linzmeier resigned from the SupervisoryBoard after five months since he was no longer employed by a companyforming part of the TUI Group after the divestment of Wolf GmbH. Byresolution of the district court of Hanover of 2 November 2006, Mr DieterLübkemann was appointed to the Supervisory Board.
Cor
pora
te G
over
nanc
e
Corporate Governance Corporate Governance Report Report of the Supervisory Board Supervisory Board Executive Board
TUI Share TUI Group in Figures Sustainable Development
117
Executive Board and Executive Committee membershipAt its meeting on 25 January 2006, the Supervisory Board appointedMessrs Adolf Adrion (shipping), Christoph R. Mueller (airlines) and Karl J. Pojer (hotels & resorts) divisional directors with immediate effect.
With effect from 10 May 2006, the Supervisory Board appointed MessrsMichael Behrendt (shipping) and Peter Rothwell (tourism) as ordinaryExecutive Board members in addition to the four previous members. Inaddition to his new function as an Executive Board member of TUI AG Mr Michael Behrendt will continue to be the Chairman of Hapag-Lloyd AG.In addition to his new Board function, Peter Rothwell will continue to bein charge of Northern Europe.
With effect from 1 September 2006, the Supervisory Board appointed Mr Christoph R. Mueller a member of the Executive Board of TUI AG, responsible for the controlling department. He will temporarily also be in charge of the management of the two German airlines Hapagfly andHapag-Lloyd Express. Mr Sebastian Ebel, previously responsible for thecontrolling and tourism platforms departments, resigned from TUI AG’sExecutive Board as per 31 August 2006 and left the Group. The Super-visory Board thanks Mr Ebel for his work as Board member of TUI AGand in leading positions within the Group.
With effect from 1 September 2006, the Supervisory Board appointed Mr Brackx the new divisional director for the Western Europe sector. Mr Eric Debry, previously in charge of this sector, resigned from his officeas divisional director of TUI AG as per 31 August 2006 and left theGroup. The Supervisory Board thanks Mr Debry for his work as divisionaldirector of TUI AG and in leading positions within the Group.
The Supervisory BoardHanover, 18 March 2007
Dr. Jürgen KrumnowChairman
118
Supervisory Board
Dr. Jürgen KrumnowChairmanex. Member of the Executive Board of Deutsche Bank AGFrankfurt/Main
Jan KahmannDeputy ChairmanMember of the Federal Executive Boardof ver.di – Vereinte Dienstleistungs-gewerkschaft Berlin
Andreas BarczewskiAircraft captainLangenhagen(since 10 May 2006)
Jean-Claude BaumgartenPresident of the World Travel & Tourism CouncilLondon(since 10 May 2006)
Jella Susanne Benner-HeinacherSolicitorManaging Director of Deutsche Schutzvereinigung für Wertpapierbesitz e.V. Düsseldorf
Sepp Dieter HeckmannChairman of the Executive Boardof Deutsche Messe AGHanover(since 10 May 2006)
Uwe KleinClerkHamburg
Fritz Kollorzex. Member of the Executive Board of theMining, Chemical and Energy Industrial UnionHanover(until 10 May 2006)
Christian KuhnTravel agentHanover
Dr. Dietmar Kuhntex. Chairman of the Executive Board of RWE AGEssen
Dr. Klaus LiesenHonorary Chairman of the Supervisory Board of E.ON Ruhrgas AGEssen(until 10 May 2006)
Alfred LinzmeierSoftware EngineerBruckberg(since 10 May 2006 until 5 October 2006)
Roberto López AbadChief Executive of Caja de Ahorros del MediterráneoAlicante
Dieter LübkemannShipping agentBremen(since 2 November 2006)
Dr. h.c. Abel Matutes JuanChairman of Fiesta Hotels & ResortsIbiza
Petra OechteringTravel agentCologne
Carmen Riu GüellEntrepreneurPlaya de Palma
Hans-Dieter RüsterAircraft engineerLangenhagen(until 10 May 2006)
Marina SchmidtTravel agentHamburg(until 30 March 2006)
Dr. Manfred SchneiderChairman of the Supervisory Board of Bayer AGLeverkusen
Roland SchneiderBusiness EconomistBarsinghausen(since 10 May 2006)
Dr.-Ing. Ekkehard D. SchulzChairman of the Executive Board of ThyssenKrupp AGDüsseldorf(until 10 May 2006)
Hartmut SchulzMovement ControllerLangenhagen(until 10 May 2006)
Ilona Schulz-MüllerRepresentative for equalityin the Federal Executive Board of ver.di – Vereinte Dienstleistungs-gewerkschaftBerlin
Olaf SeifertHead of the Group Controlling Departmentof TUI AGHanover
Henry SiebFederal Group Leader Travel of ver.di – Vereinte DienstleistungsgewerkschaftBerlin(since 10 May 2006)
Dr. Franz VranitzkyChancellor (retrd.) of the Republic of AustriaVienna
as of 28 February 2007
Members of the Supervisory Board
Annex to the Notes
119
Cor
pora
te G
over
nanc
e
Corporate Governance Corporate Governance Report Report of the Supervisory Board Supervisory Board Executive Board
TUI Share TUI Group in Figures Sustainable Development
Members of thePresiding Committee
Dr. Jürgen Krumnowex. Member of the Executive Board of Deutsche Bank AGFrankfurt/Main
Jan KahmannMember of the Federal Executive Boardof ver.di – Vereinte Dienstleistungs-gewerkschaft Berlin
Uwe KleinClerkHamburg
Dr. Klaus LiesenHonorary Chairman of the Supervisory Board of E.ON Ruhrgas AGEssen(until 10 May 2006)
Petra OechteringTravel agentCologne(since 10 May 2006)
Carmen Riu GüellEntrepreneurPlaya de Palma
Hartmut SchulzMovement ControllerLangenhagen(until 10 May 2006)
Dr. Franz VranitzkyChancellor (retrd.) of the Republic of AustriaVienna(since 10 May 2006)
as of 28 February 2007
Members of theAudit Committee
Dr. Dietmar KuhntChairman ex. Chairman of the Executive Board of RWE AGEssen
Dr. Jürgen Krumnowex. Member of the Executive Board of Deutsche Bank AGFrankfurt/Main
Uwe KleinClerkHamburg
Dr. Manfred SchneiderChairman of the Supervisory Board of Bayer AGLeverkusen(since 10 May 2006)
Dr.-Ing. Ekkehard D. SchulzChairman of the Executive Board of ThyssenKrupp AGDüsseldorf(until 10 May 2006)
Ilona Schulz-MüllerRepresentative for equalityin the Federal Executive Board of ver.di – Vereinte Dienstleistungs-gewerkschaft Berlin
Olaf SeifertHead of the Group Controlling Departmentof TUI AGHanover
Committees of the Supervisory Board
Annex to the Notes
120
Supervisory Board
Dr. Jürgen Krumnow(Chairman)a) Deutsche Bahn AG
Hapag-Lloyd AGLenze Holding AG2)
b) Peek & Cloppenburg KG
Jan Kahmann(Deputy Chairman)a) Eurogate Beteiligungs-GmbH2)
Jella Susanne Benner-Heinachera) A.S. Création AG
K+S AG
Andreas Barczewski–
Jean-Claude Baumgarten–
Sepp Dieter Heckmanna) Arena Hannover GmbH
Uwe Kleina) Hapag-Lloyd AG
Fritz Kollorza) DSK Anthrazit Ibbenbüren GmbH2)
RAG AG2)
Vattenfall Europe AGVattenfall Europe Generation Verwaltungs-AG2)
Christian Kuhna) TUI Deutschland GmbH
Dr. Dietmar Kuhnta) Allianz Versicherungs-AG
BDO Deutsche Warentreuhand AGDresdner Bank AGGEA Group AGHapag-Lloyd AGHochtief AG
b) COMSTAR-United TeleSystems
Dr. Klaus Liesena) E.ON AG
Alfred Linzmeiera) Wolf GmbH
Roberto López Abadb) Banco Inversis Net, S.A.2)
CAM AEGON Holding Financiero S.L.1)
CAMGE Financiera, E.F.C. S.A., Unipersonal1)
CAMGE Holdco, S.L.1)
EBN Banca De Negocios, S.A.Gestión Tributaria Territorial, S.A.1)
Lico Corporación, S.A.2)
Lico Leasing S.A. E.F.C.1)
Mediterráneo Vida, S.A. De Seguros YReaseguros, Sociedad Unipersonal1)
Dieter Lübkemanna) Hapag-Lloyd AG
Dr. h.c. Abel Matutes Juanb) Banco Santander Central Hispano (BSCH)
EurizonVita S.p.A.
Petra Oechtering–
Carmen Riu Güellb) RIUSA II, S.A.
Hans-Dieter Rüster–
Marina Schmidt–
Dr. Manfred Schneidera) Bayer AG1)
DaimlerChrysler AGLinde AG1)
Metro AGRWE AG
Roland Schneider–
Dr.-Ing. Ekkehard D. Schulza) AXA Konzern AG
Bayer AGDeutsche Bahn AGMAN AG1)
RAG AG2)
RWE AGThyssenKrupp Automotive AG1)
ThyssenKrupp Elevator AG1)
ThyssenKrupp Services AG1)
Hartmut Schulz–
Ilona Schulz-Müller–
Olaf Seiferta) TUI Espan~a Turismo S.A.
TUI Hellas Travel and Tourism A.E.
Henry Sieba) TUI Deutschland GmbH2)
TUI Leisure Travel GmbH
Dr. Franz Vranitzkyb) Magna International Corp.
Other Board memberships of the Supervisory Board*)
*) Information refers to 31 December 2006or date of resignation from the Supervisory Board of TUI AG in 2006
1) Chairman2) Deputy Chairman
a) Membership in Supervisory Boards required by law
b) Membership in comparable Boardsof domestic and foreign companies
Annex to the Notes
121
Cor
pora
te G
over
nanc
e
Corporate Governance Corporate Governance Report Report of the Supervisory Board Supervisory Board Executive Board
TUI Share TUI Group in Figures Sustainable Development
Executive Board
Dr. Michael FrenzelChairman
Michael BehrendtShipping(since 10 May 2006)
Sebastian EbelControlling(until 31 August 2006)
Dr. Peter EngelenHuman Resources and Legal Affairs
Rainer FeuerhakeFinance
Christoph R. MuellerControlling (since 1 September 2006)
Peter RothwellTourism(since 10 May 2006)
Executive Committee
Executive Board of TUI AG
Executive Board Members
Dr. Michael FrenzelChairman
Michael BehrendtShipping(since 10 May 2006)
Sebastian EbelControlling(until 31 August 2006)
Dr. Peter EngelenHuman Resources and Legal Affairs
Rainer FeuerhakeFinance
Christoph R. MuellerControlling (since 1 September 2006)
Peter RothwellTourism(since 10 May 2006)
Divisional Directors
Dr. Volker BöttcherCentral Europe sector
Peter RothwellNorthern Europe sector
Eric DebryWestern Europe sector(until 31 August 2006)
Bart BrackxWestern Europe sector(since 1 September 2006)
Christoph R. MuellerAirline sector(since 25 January 2006 until 31 August 2006)
Karl J. PojerHotels & Resorts sector(since 25 January 2006)
Michael BehrendtShipping sector(until 10 May 2006)
Adolf AdrionShipping sector(since 25 January 2006)
Annex to the Notes
122
Dr. Michael Frenzel(Chairman)a) AWD Holding AG
AXA Konzern AGContinental AGE.ON Energie AGHapag-Lloyd AG1)
Hapag-Lloyd Fluggesellschaft mbH1)
TUI Deutschland GmbH1)
Volkswagen AGb) Norddeutsche Landesbank
Preussag North America, Inc.1)
TUI China Travel Co. Ltd.
Michael Behrendta) Barmenia Allgemeine Versicherungs-AG
Barmenia Krankenversicherung a.G.2)
Barmenia Lebensversicherung a.G.2)
ESSO Deutschland GmbHExxonMobil Central Europe Holding GmbHHamburgische Staatsoper GmbHMAN AG
b) CP Ships Ltd.1)
Sebastian Ebela) Hapag-Lloyd Fluggesellschaft mbH
TUI Deutschland GmbHTUI Leisure Travel GmbH
b) RIUSA II S.A.TUI Belgium N.V.TUI España Turismo S.A.TUI Nederland N.V.
Dr. Peter Engelena) Hapag-Lloyd Fluggesellschaft mbH
TUI Deutschland GmbHTUI Leisure Travel GmbH
b) TUI China Travel Co. Ltd.
Rainer Feuerhakea) Hapag-Lloyd AG
Hapag-Lloyd Fluggesellschaft mbHTUI Deutschland GmbH
b) Amalgamated Metal Corporation PLCPreussag North America, Inc.
Christoph R. Muellera) Hapag-Lloyd AGb) Jetair N.V.
TUI Belgium N.V.
Peter Rothwella) TUI Deutschland GmbHb) TUI Belgium N.V.
TUI España Turismo S.A.
*) Information refers to 31 December 2006or date of resignation from the ExecutiveBoard of TUI AG in 2006
1) Chairman2) Deputy Chairman
a) Membership in Supervisory Boards required by law
b) Membership in comparable Boardsof domestic and foreign companies
Other board memberships of the Executive Board*)
Annex to the Notes
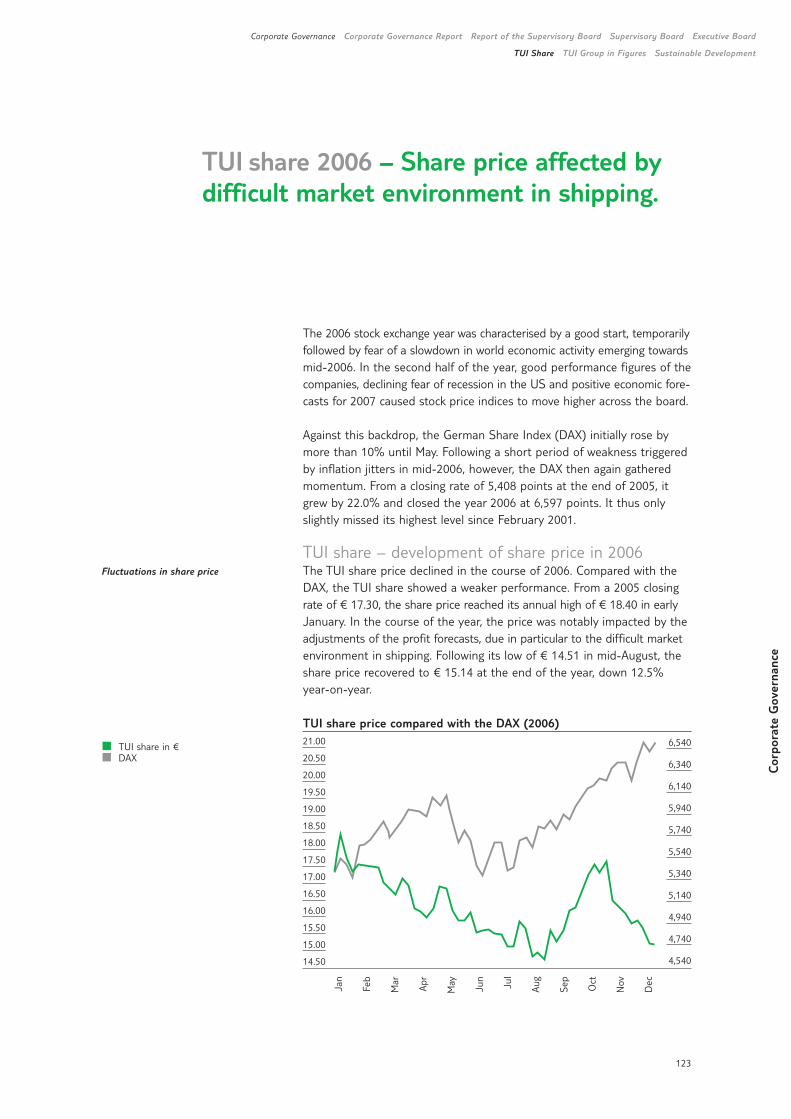
123
Cor
pora
te G
over
nanc
e
Corporate Governance Corporate Governance Report Report of the Supervisory Board Supervisory Board Executive Board
TUI Share TUI Group in Figures Sustainable Development
The 2006 stock exchange year was characterised by a good start, temporarilyfollowed by fear of a slowdown in world economic activity emerging towardsmid-2006. In the second half of the year, good performance figures of thecompanies, declining fear of recession in the US and positive economic fore-casts for 2007 caused stock price indices to move higher across the board.
Against this backdrop, the German Share Index (DAX) initially rose bymore than 10% until May. Following a short period of weakness triggeredby inflation jitters in mid-2006, however, the DAX then again gatheredmomentum. From a closing rate of 5,408 points at the end of 2005, itgrew by 22.0% and closed the year 2006 at 6,597 points. It thus onlyslightly missed its highest level since February 2001.
TUI share – development of share price in 2006The TUI share price declined in the course of 2006. Compared with theDAX, the TUI share showed a weaker performance. From a 2005 closingrate of € 17.30, the share price reached its annual high of € 18.40 in earlyJanuary. In the course of the year, the price was notably impacted by theadjustments of the profit forecasts, due in particular to the difficult marketenvironment in shipping. Following its low of € 14.51 in mid-August, theshare price recovered to € 15.14 at the end of the year, down 12.5%year-on-year.
Fluctuations in share price
TUI share 2006 – Share price affected bydifficult market environment in shipping.
TUI share in €DAX
TUI share price compared with the DAX (2006)21.00
20.50
20.00
19.50
19.00
18.50
18.00
17.50
17.00
16.50
16.00
15.50
15.00
14.50
6,540
6,340
6,140
5,940
5,740
5,540
5,340
5,140
4,940
4,740
4,540
Jan
Feb
Mar
Apr
May
Jun
Jul
Aug
Sep
Oct
Nov
Dec
124
Long-term development of TUI share price€ 2002 2003 2004 2005 2006
Highest share price 33.12 16.02 19.04 20.47 18.40Lowest share price 13.02 7.22 12.05 16.10 14.51Year-end share price 15.05 15.39 16.22 17.30 15.14
Quotations, indices and trading The TUI share is officially traded on all German trading floor systems andin the Xetra electronic trading system. No companies with similar operationsin tourism and shipping are listed in the German stock market. SeveralEuropean competitors in the tourism sector such as MyTravel, First Choice,Club Méditerranée and Kuoni are traded on stock markets in the UK, Franceand Switzerland. In the shipping sector, listed international competitorsinclude AP Møller-Maersk in Denmark, Evergreen Marine in Taiwan, CoscoShipping in China and NYK Lines in Japan.
The TUI share has been included in the DAX 30 – the German StockIndex – since 1990. When the composition of the index was reviewed inDecember 2006, it ranked 25th in terms of turnover in TUI shares and34th in terms of market capitalisation. At that point in time, the TUI sharehad a weighting of 0.50% in the DAX. Since its introduction in January2003, TUI has been a member of the prime standard of Deutsche Börseand therefore meets the high international transparency standards of thissegment over and above legal requirements.
The TUI share is included in several industry indices in the German stockmarket and at European level: these include the European sub-indicesDow Jones Travel & Leisure Titans 30 and Dow Jones Euro Stoxx Travel &Leisure. Its year-end weightings were 1.24% and 7.13%, respectively.Moreover, the TUI share is listed in the FTSE Eurotops 300 index. Interms of sustainability indices, the TUI share is listed in FTSE4Good, ASPI(Advanced Sustainable Performance Indices) and ESI (Ethibel Sustainabi-lity Index) and was newly admitted to the Dow Jones Sustainability WorldIndex in 2006. In the German stock market, it is, inter alia, included in thecalculation of the DAXplus Export Strategy.
Information on the TUI share31 December 2006
WKN TUAG00ISIN DE000TUAG000Stock category Registered ordinary sharesCapital stock € 641,722,069.41Number of shares 251,019,855 unitsMarket capitalisation € 3,800,440,605
In 2006, trading in TUI shares again rose substantially. On average,3,588,023 no-par value shares were traded per day, an increase of morethan 60% year-on-year. The total trading volume amounted to 914.6 millionno-par value shares. The number of option contracts on TUI shares tradedon the European futures and options exchange EUREX rose by 165% to15,582 contracts per day, i.e. a total of 3,973,370 contracts.
TUI share in the DAX30 and
prime standard
Trading in TUI shares up on
the previous year
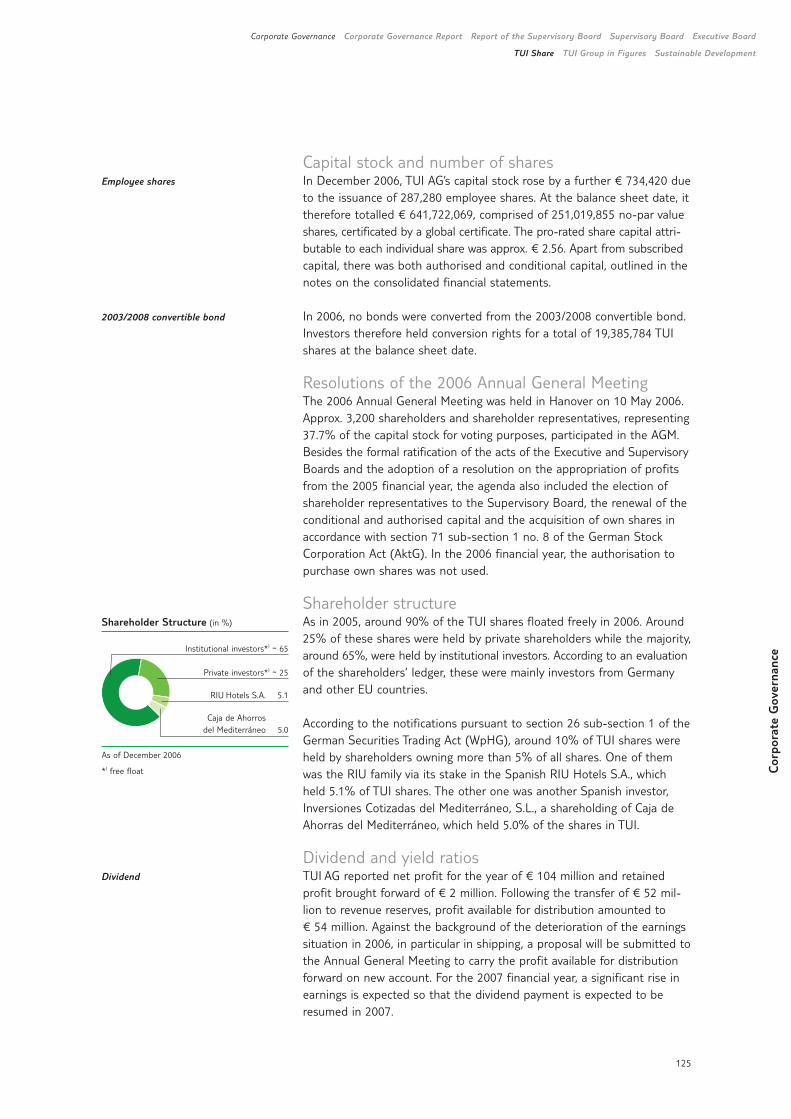
Cor
pora
te G
over
nanc
e
Corporate Governance Corporate Governance Report Report of the Supervisory Board Supervisory Board Executive Board
TUI Share TUI Group in Figures Sustainable Development
125
Capital stock and number of sharesIn December 2006, TUI AG’s capital stock rose by a further € 734,420 dueto the issuance of 287,280 employee shares. At the balance sheet date, ittherefore totalled € 641,722,069, comprised of 251,019,855 no-par valueshares, certificated by a global certificate. The pro-rated share capital attri-butable to each individual share was approx. € 2.56. Apart from subscribedcapital, there was both authorised and conditional capital, outlined in thenotes on the consolidated financial statements.
In 2006, no bonds were converted from the 2003/2008 convertible bond.Investors therefore held conversion rights for a total of 19,385,784 TUIshares at the balance sheet date.
Resolutions of the 2006 Annual General MeetingThe 2006 Annual General Meeting was held in Hanover on 10 May 2006.Approx. 3,200 shareholders and shareholder representatives, representing37.7% of the capital stock for voting purposes, participated in the AGM.Besides the formal ratification of the acts of the Executive and SupervisoryBoards and the adoption of a resolution on the appropriation of profitsfrom the 2005 financial year, the agenda also included the election ofshareholder representatives to the Supervisory Board, the renewal of theconditional and authorised capital and the acquisition of own shares inaccordance with section 71 sub-section 1 no. 8 of the German StockCorporation Act (AktG). In the 2006 financial year, the authorisation topurchase own shares was not used.
Shareholder structureAs in 2005, around 90% of the TUI shares floated freely in 2006. Around25% of these shares were held by private shareholders while the majority,around 65%, were held by institutional investors. According to an evaluationof the shareholders’ ledger, these were mainly investors from Germanyand other EU countries.
According to the notifications pursuant to section 26 sub-section 1 of theGerman Securities Trading Act (WpHG), around 10% of TUI shares wereheld by shareholders owning more than 5% of all shares. One of themwas the RIU family via its stake in the Spanish RIU Hotels S.A., whichheld 5.1% of TUI shares. The other one was another Spanish investor,Inversiones Cotizadas del Mediterráneo, S.L., a shareholding of Caja deAhorras del Mediterráneo, which held 5.0% of the shares in TUI.
Dividend and yield ratiosTUI AG reported net profit for the year of € 104 million and retained profit brought forward of € 2 million. Following the transfer of € 52 mil-lion to revenue reserves, profit available for distribution amounted to € 54 million. Against the background of the deterioration of the earningssituation in 2006, in particular in shipping, a proposal will be submitted tothe Annual General Meeting to carry the profit available for distributionforward on new account. For the 2007 financial year, a significant rise inearnings is expected so that the dividend payment is expected to be resumed in 2007.
Employee shares
2003/2008 convertible bond
Dividend
Shareholder Structure (in %)
Institutional investors*) ~ 65
Private investors*) ~ 25
RIU Hotels S.A. 5.1
Caja de Ahorros del Mediterráneo 5.0
As of December 2006
*) free float
126
Development of earnings and dividends of the TUI share€ 2002 2003 2004 2005 2006
Earnings per share 0.18 1.54 2.96 2.28 - 3.66Dividend 0.77 0.77 0.77 0.77 0.00
As before, the TUI share was an attractive investment for yield-orientedinvestors in 2006 despite the unsatisfactory share price trend. A TUI share-holder who purchased shares at the beginning of the year generated adividend yield of 4.5%. Shareholders with longer-term exposure who, forinstance, invested the equivalent of € 500 in then Preussag shares in1990, exercised their subscription rights and reinvested their dividendyields, held a TUI share portfolio worth € 916 at the balance sheet date.Their average annual return was almost 4.0%.
Rating As before, the international rating agencies Standard & Poor’s and Moody’sagain rated TUI’s financial strength in 2006 and early 2007. The currentlydifficult market environment, in particular in shipping, caused an adjust-ment of the long-term credit rating, which currently stands as follows:
Rating agency Corporate rating Outlook
Standard & Poor‘s BB negativeMoody’s B1 stable
The respective ratings and additional detailed information on the six bondstraded in the capital market is provided in the section ‘Financial position’.
Investor RelationsIn 2006, the activities of the Investor Relations team focused on up-to-dateinformation and open communication with shareholders, analysts, institu-tional investors and lenders. Debates with these stakeholder groups centredon Group strategy and business trends in the individual sectors in orderto enable them to make a realistic assessment of TUI’s future development.The Executive Board met analysts and investors at regular roadshows inEurope and America, at one-on-one meetings and at the analysts’ meet-ing on the occasion of the presentation of the annual financial statementsfor 2005 in March 2006 as well as the announcement of the strategicdecisions in December 2006. Conference calls were implemented and metwith a high level of interest every time an interim report was submitted.Another forum for ample discussion with the shareholders was the 2006Annual General Meeting.
In addition, the Investor Relations website was expanded so as to includea new internet tool which shareholders may now use on the InvestorRelations website to register for the Annual General Meeting, order aguest card and instruct one of the proxies provided by the Company. Thisservice was well received, with approx. 20% of shareholders ordering theiradmission tickets via the new internet tool.
Stock yield
Rating
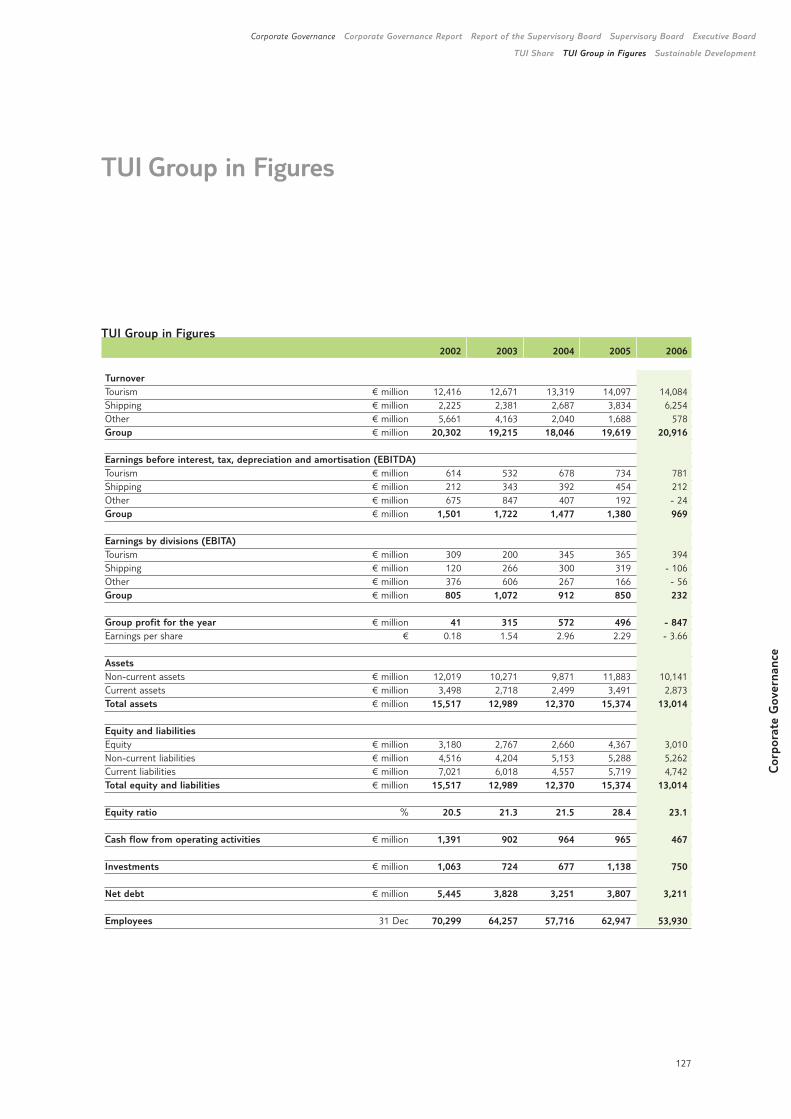
Cor
pora
te G
over
nanc
e
Corporate Governance Corporate Governance Report Report of the Supervisory Board Supervisory Board Executive Board
TUI Share TUI Group in Figures Sustainable Development
127
TUI Group in Figures
TUI Group in Figures2002 2003 2004 2005 2006
TurnoverTourism € million 12,416 12,671 13,319 14,097 14,084Shipping € million 2,225 2,381 2,687 3,834 6,254Other € million 5,661 4,163 2,040 1,688 578Group € million 20,302 19,215 18,046 19,619 20,916
Earnings before interest, tax, depreciation and amortisation (EBITDA)Tourism € million 614 532 678 734 781Shipping € million 212 343 392 454 212Other € million 675 847 407 192 - 24Group € million 1,501 1,722 1,477 1,380 969
Earnings by divisions (EBITA)Tourism € million 309 200 345 365 394Shipping € million 120 266 300 319 - 106Other € million 376 606 267 166 - 56Group € million 805 1,072 912 850 232
Group profit for the year € million 41 315 572 496 - 847Earnings per share € 0.18 1.54 2.96 2.29 - 3.66
AssetsNon-current assets € million 12,019 10,271 9,871 11,883 10,141Current assets € million 3,498 2,718 2,499 3,491 2,873Total assets € million 15,517 12,989 12,370 15,374 13,014
Equity and liabilitiesEquity € million 3,180 2,767 2,660 4,367 3,010Non-current liabilities € million 4,516 4,204 5,153 5,288 5,262Current liabilities € million 7,021 6,018 4,557 5,719 4,742Total equity and liabilities € million 15,517 12,989 12,370 15,374 13,014
Equity ratio % 20.5 21.3 21.5 28.4 23.1
Cash flow from operating activities € million 1,391 902 964 965 467
Investments € million 1,063 724 677 1,138 750
Net debt € million 5,445 3,828 3,251 3,807 3,211
Employees 31 Dec 70,299 64,257 57,716 62,947 53,930
For TUI, sustainable development means continuously balancing economic,ecological and social concerns. This secures the Group’s competitiveness,promotes the potential of its employees, strengthens cooperation withsocial stakeholder groups and ensures lasting enhancements of the efficientuse of natural resources at the corporate sites and in the holiday destina-tions.
TUI’s convincing sustainability performance in 2006 was confirmed byinternational rating agencies and sustainability analysts: TUI AG was theworld’s only tourism company in the travel & tourism sub-sector admittedto the Dow Jones Sustainability Index (DJSI) World. TUI also defended itsposition in other international ethics indices. In addition, TUI joined the‘European Alliance for Corporate Social Responsibility’ in order to bundle thespecific sustainability potential of companies and industry at a Europeanlevel and promote the international development towards sustainability.
EmployeesHighly committed and motivated employees who are well qualified fortheir work are the key to success of a company. Promoting employees is one of the main areas of the Group’s HR activities.
Initial, ongoing and further training Junior staff development and good internal training are indispensableelements in order to ensure the competitiveness of a company. In Ger-many, the companies of the TUI Group newly filled 257 initial trainingplacements. A total of 718 young employees participated in training schemesin 2006. At around 6.5%, the proportion of staff in training was thus keptat the previous year’s high level. TUI continued to participate in the ‘Fitfor a job application’ project in 2006. In the framework of this project, TUIHR managers supported young people in compiling their job applicationdocuments and preparing for job interviews.
One of the key tasks of central HR development is the development andlong-term retention of technical and executive staff at all managementlevels. The range of programmes offered was expanded again in 2006. An international procedure for personal skills assessment was offered to lower management functions, while a systematic process of selectivedevelopment measures based on a capability analysis was initiated forGermany’s top management functions. Next year, this process will also beapplied on a worldwide scale. The international trainee programme and thepromotion programmes for middle management functions were expanded,focusing on the participants’ personal development.
128
Junior staff development
and training
Development of senior
and executive staff
Sustainable Development Social responsibilityfor employees. Environmental quality manage-ment and climate protection by means ofenergy efficiency. Corporate citizenship.
Social responsibilityThe companies of the TUI Group offer their employees many differentways of participating in company-based and private pension schemes.Individual national conditions and the economic situation are taken intoaccount in the design of the models. Schemes offered to employees inGermany included pension fund contracts, direct insurance schemes andprivate pension insurance funds qualifying for state co-sponsorship (Riesterpension). In addition, deferred-compensation models were offered, underwhich employees were able to choose their pension scheme according totheir individual preferences. Demand for these schemes rose in 2006.
In German Group companies, approx. 400 employees worked under part-time early retirement contracts in the 2006 financial year. The resultingentitlements of these employees were hedged against insolvency of theemployer, irrespective of the effective date of the part-time early retirementcontract. TUI thus went substantially beyond the minimum standardrequired under the amended German part-time early retirement legislation,adopted in 2004, for the benefit of its employees. TUI provided approx. € 13.5 million in the 2006 financial year for this purpose.
In 2006, TUI signed the Luxemburg Declaration on Workplace Health Promotion in the European Union. Like the Group’s own guidelines, thisdeclaration aims to promote health at the workplace. All health-relatedissues are discussed at Group level via TUI’s health network. In addition,the Group has a national work-health-environment committee as well aslocal health and safety committees, for which employer and employeerepresentatives meet several times a year. In addition, TUI has joined theGerman Network for Company-Level Health Promotion.
Under the heading ‘Fit with TUI’, a health programme was put togetherfor Group employees. The companies of the TUI Group offered theiremployees various initiatives concerning different issues such as targetgroup-specific health seminars, programmes for the prevention of addictivebehaviour, cancer prevention or cardiovascular check-ups.
BKK TUI, whose administrative costs only amounted to around 3% oftotal expenses in 2006 (national average: around 6%) had a substantialnumber of new members in the financial year under review. Given its verygood price/performance ratio and a contribution rate of 12.6%, undercutt-ing the national average, its membership rose from around 10,800 to morethan 12,000 in the course of the year. The BKK offered highly attractiveproducts such as BKK FamilyPlus, which supports health activities withinfamilies by means of a contribution bonus.
The Group companies again implemented a large number of health andsafety activities. These activities included the preparation of hazard analyses, workplace visits and participation in the preparation of escapeand emergency schemes but also the organisation of driver safety trai-ning schemes in order to minimise accidents on the way to work.
In terms of external activities, TUI is one of the founding members of thenational network ‘Success factor family’. All companies of the TUI Group
Cor
pora
te G
over
nanc
e
Corporate Governance Corporate Governance Report Report of the Supervisory Board Supervisory Board Executive Board
TUI Share TUI Group in Figures Sustainable Development
Pension schemes
Part-time early retirement
Health promotion
Company health insurance fund
Health and safety
Work-life balance
129
offer a large variety of programmes in order to actively support a work-life balance. TUI offers for instance flexitime, part-time and teleworkschemes for all employees. At Group level, part-timers account for around21% of the workforce. In addition, German employees are free to extendtheir statutory parental leave by one extra year or go on unpaid leave inorder to take care of a family member in need of care.
Female employees account for around 65% of the Group’s workforce.During pregnancy and parental leave, employees are offered personalconsultation concerning any questions related to their return to workinglife any time. Access to internal information sources such as the intranetand use of voluntary social benefits such as special rates for holiday toursis to be taken for granted, as is the possibility of participating in furthertraining schemes. In addition, employees on parental leave are offeredthe opportunity to fill in as substitutes so as to remain involved in currentcorporate activities. Reapplications by employees who have not immediatelyreturned to their jobs following the end of their parental leave are givenpriority over external applications if qualifications are equal. At the Hanoversite, a company-run full-time day crèche was opened in 2006. Thisrepresented a major step towards encouraging employees to rapidlyreturn to their jobs.
In the TUI Group, both national and international workers’ representativeschemes existed within individual Group companies and at Group level. Incooperation with the Executive Board and the management of the com-panies, solutions were found for strategic, organisational and operationaldecisions that also entailed headcount reductions, taking account of theinterests of employees and management in a fair and balanced way.
The TUI European Forum, established in 1995 in addition to the statutoryemployee representative bodies required under national legislation, currentlycomprises 52 workers’ representatives from 17 European countries. Groupmanagement regularly briefs the Select Committee of the TUI EuropeanForum and discusses the current economic and HR situation within theGroup with it. The TUI European Forum meets once a year and renders asignificant contribution at international level to the transparency of majorentrepreneurial decisions and the integration of different nationalitieswithin the TUI Group.
Environmental managementThe TUI Group’s overall entrepreneurial action is largely determined byenvironmental aspects and the incorporation of environmental qualitystandards into business processes.
In the Good Company Ranking 2006, published by ‘manager magazin’ atthe beginning of 2007 and covering the 120 largest European groups, TUIcame out as the best company in the environmental category. The criteriaapplied in the environmental category included the company’s overallecological performance, the consideration of environmental aspects alongthe value chain, ecological innovation as well as dialogue and cooperationwith public stakeholder groups.
Employee representation
within the Group
TUI European Forum
130
Further information on environmental protection: 1 www.tui-umwelt.com1’Environment’ section in the management
report
Climate protection through energy efficiencyThrough the detailed monitoring of aircraft, ships and hotels, the Groupobtained fundamental information on fuel efficiency and associated emis-sions again in 2006. Particularly energy-efficient processes were applied tothe entire aircraft fleet by means of a standardisation of flight processesand procedures. Due to the ongoing aircraft renewal programme the ave-rage aircraft age amounted to 10.1 years; this helped to stabilise the fuelconsumption. Through joint fuel efficiency workshops, TUI began to developmore ways of promoting fuel efficiency and thus reduce specific green-house gas emissions.
In addition, TUI participated intensely in the debates concerning the inte-gration of air transportation into the European emissions trading scheme(EU-ETS), conducted within the aviation and industry associations. More-over, TUI participated in the ‘Carbon Disclosure Project 4’, which compileddetailed information about TUI’s climate policy and the climate effects ofits operations. Thomsonfly closely cooperated with the ‘Sustainable Aviation’initiative in the UK which jointly prepares strategies for sustainable aviationin cooperation with other leading aviation companies in the UK.
In shipping, emission-efficient drive systems were used for newly com-missioned vessels, resulting in a reduction in fuel consumption per TEUand nautical mile. In addition, alternative underwater coatings were testedand monitored for their effects on the resistance of floating vessels.
Preservation of biodiversity TUI carried out a large number of activities to promote protection ofmarine turtles in TUI destinations in the UNEP Year of the Turtle 2006.For 2007, the Year of the Dolphin, an integrated protection and informationcampaign was developed and presented to the international public at theUN campus in Bonn. The aim of these projects is to preserve and protectmarine mammals with the support of local inhabitants and tourists.
In the UK, TUI again supported various activities for the preservation ofbiodiversity and the protection of endangered species. For many years,Thomsonfly has sponsored the UNEP project ‘Great Apes Survival Project’ by the ‘Bornfree Initiative’. In the destinations TUI participated in reafforestation and population determination measures such as thoseconducted by the incoming agency Pollman’s in the Tsavo National Park inKenya or by TUI Nordic on the Canary Islands.
Specific activities in the destinations Worldwide, TUI Deutschland encourages the competition for successfulenvironmental management among its hotel partners by means of TUIEnvironmental Champion awards. Participation in the competition is con-ditional on participation in TUI’s environmental monitoring scheme forhotels and compliance with TUI’s minimum standards for environmentalquality. As before, the most successful hotel chain in 2006 was Robinsonwith 20 clubs receiving an award. In the scoring category for individualhotels, Iberotel Sarigerme Park in Turkey won the award for the tenthtime in succession. Thomson (TUI UK) introduced the ‘Green Medals’ asan environmental quality competition in its brochures and awardedmedals to fifteen outstanding hotels in 2006.
Cor
pora
te G
over
nanc
e
Corporate Governance Corporate Governance Report Report of the Supervisory Board Supervisory Board Executive Board
TUI Share TUI Group in Figures Sustainable Development
Partnership with UNEP = United Nations
Environment Programme
Environmental quality
in TUI hotel
131
In cooperation with Group environmental management, TUI Hotels &Resorts awarded the environmental quality label ‘EcoResort’ for Group-owned hotel chains for the first time in the 2006 financial year, followinga review by external environmental experts. In order for a hotel chain tobe awarded the label, it has to meet a number of criteria including highhealth and quality standards, sustainable development activities, a highlevel of eco-efficiency and a certified environmental management system.Fifteen Group-owned hotel and club facilities were awarded the ‘EcoResort’label for the 2006/2007 winter brochures. The aim of the quality label isbeside ecological quality assurance to promote sustainable developmentin the holiday regions.
Social responsibilityTUI AG and its subsidiaries attach great importance to being good corporatecitizens at their worldwide sites and in the holiday destinations. As before,Group activities in 2006 focused on support for disadvantaged childrenand young people, and on the promotion of education, research, cultureand sports.
Reconstruction aid in the Tsunami-stricken areasThe projects launched in Sri Lanka in 2005, implemented in cooperationwith the incoming agency Aitken Spence and the DRV association ‘Aidwithout frontiers’, were successfully completed. Around 100 families obtainednew homes and a basis for their future livelihood. The new village builtfor 200 families in cooperation with Plan International Deutschland wasofficially opened in October 2006 (www.tui-aid.com). In Sri Lanka, NouvellesFrontières supported the organisation ‘Réconstruire et vivre’ in building40 bungalows and two kindergartens. TUI Nordic supported the TakuapaSenanuku School in Kao Lak in Thailand, sponsoring books and teachingmaterials.
Support for disadvantaged children and young people TUI UK employees continued their sponsorship, initiated in 2005, for theMacmillan Cancer Relief aid organisation which takes care of children withcancer and their relatives. At the Hanover site, the sponsorship schemerun by employees of TUI companies for many years now benefited thechildren’s relief organisation ‘Hilfe für hungernde Kinder’ in 2006.
More than 300 TUI Leisure Travel travel agencies collected around € 20,000 for the ‘6 villages for 2006’ project of ‘SOS Kinderdörfer’, contri-buting to the establishment of new children’s villages in Brazil, Mexico,Nigeria, South Africa, Ukraine and Vietnam. For the fourth time in succes-sion, TUI Austria and TUI AG supported the international adventure andeducation network ‘Kids for Freedom’ (K4F). Around 60 deprived childrenfrom seven nations were offered a sailing trip in Turkey with trained youthworkers. As before, the RTL sponsorship marathon was actively supportedby the Group in 2006. Hapagfly staff collected around € 140,000 with airpassengers for various child aid projects. Several group companies in thetourism division also continued their worldwide activities to protect chil-dren against sexual abuse, e.g. by supporting the ECPAT organisation.Hapag-Lloyd continued its long-standing sponsorship schemes for chil-dren in China in cooperation with the aid organisation Plan International.
Environmental quality
label ‘EcoResort’
Sponsorships
Promotion of
non-profit organisations
132
The monthly contributions are used to finance community projects,schools, wells and basic health care in the children’s villages.
All tourism companies of the TUI Group particularly focused on activitiesin the destinations. Hapagfly carried around 17 tonnes of medical aidgoods to Sudan for the German Red Cross (DRK). In addition, the airlinecollected around € 50,000 on its flights, also benefiting DRK projects. RIUand TUI Deutschland supported the modernisation and expansion of theprimary school Kim Barosa in the Cape Verde islands. In Kenya, TUI spon-sored two youth clubs which inform young people, among others, aboutAIDS. TUI Dominicana supported the Patria Foundation, which is establishingan internet library for children and adults in Puerto Plata. Another projectsponsored in the Dominican Republic was a project to fight poverty, launchedby TUI Nordic in cooperation with the Cordaid organisation. In cooperationwith Tourism for Development (TFD), Nouvelles Frontières supported variousprojects in Kenya, Tanzania, Morocco, Brazil, Cambodia and the DominicanRepublic.
Activities by the FoundationsSponsorship of the scientific research activities accompanying the project‘Prevention by means of early promotion’ for children from highest-riskfamilies by the Criminological Research Institute of Lower Saxony wasintensified. Thanks to sponsorship of the 2006 training campaign, tenadditional vocational training placements were created for disadvantagedyoung people. In addition, the TUI Foundation supported the START pro-ject run by the non-profit Hertie Foundation, promoting particularly talentedpupils with a migration background. In terms of the sponsorship of scien-tific projects, the Rudolf Schoen Award was awarded for the nineteenthtime in 2006 to honour the best scientific publication at the Medical Uni-versity of Hanover.
Cooperation with selected partners at the Hamburg site was continued in2006. The promotion of young artists and talents played an essential role.Outstanding projects included sponsorship of ‘Junges Schauspielhaus’ inHamburg, the St. Pauli Theatre, the Young Music Theatre Forum and therestoration training placement for Hamburg-based museums.
Scientific cooperation schemesTUI attaches particular importance to the promotion of innovation in thetourism sector and close cooperation with universities and research institutions.In 2006, the Group founded TUI Campus, a scientific network initiative. Inthe framework of this project, symposia will be organised twice a year tobring experts and practitioners together for an exchange of informationand views concerning issues related to tourism and communication science.
Cor
pora
te G
over
nanc
e
Corporate Governance Corporate Governance Report Report of the Supervisory Board Supervisory Board Executive Board
TUI Share TUI Group in Figures Sustainable Development
Projects and initiatives
in the destinations
TUI Foundation
More information1 www.tui-stiftung.de
Hapag-Lloyd Foundation
More information1 www.hapag-lloyd.de
More information1 www.tui-campus.de
133
TUI has introduced a comprehensive programme aiming to cut debt and optimise its financing structures. This includes the divestments of peripheralactivities and the further optimisation of assets. Combined with the cost-cuttingmeasures in tourism and cash-flow from operating activities, this strategy willcontribute to a further reduction in Group debt and will lead to a furtherstrengthening of the Group’s finances.
134
Financial Statements
135
Fina
ncia
l Sta
tem
ents
/Not
es
136 Financial Statements
136 Consolidated Profit and Loss Statement137 Consolidated Balance Sheet138 Statement of Recognised Income and Expenses138 Cash Flow Statement
139 Notes
139 Notes on the Principles and Methods158 Segment Reporting167 Notes on the Consolidated Profit
and Loss Statement180 Notes on the Consolidated Balance Sheet216 Major Shareholdings217 Notes on the Cash Flow Statement219 Other Notes
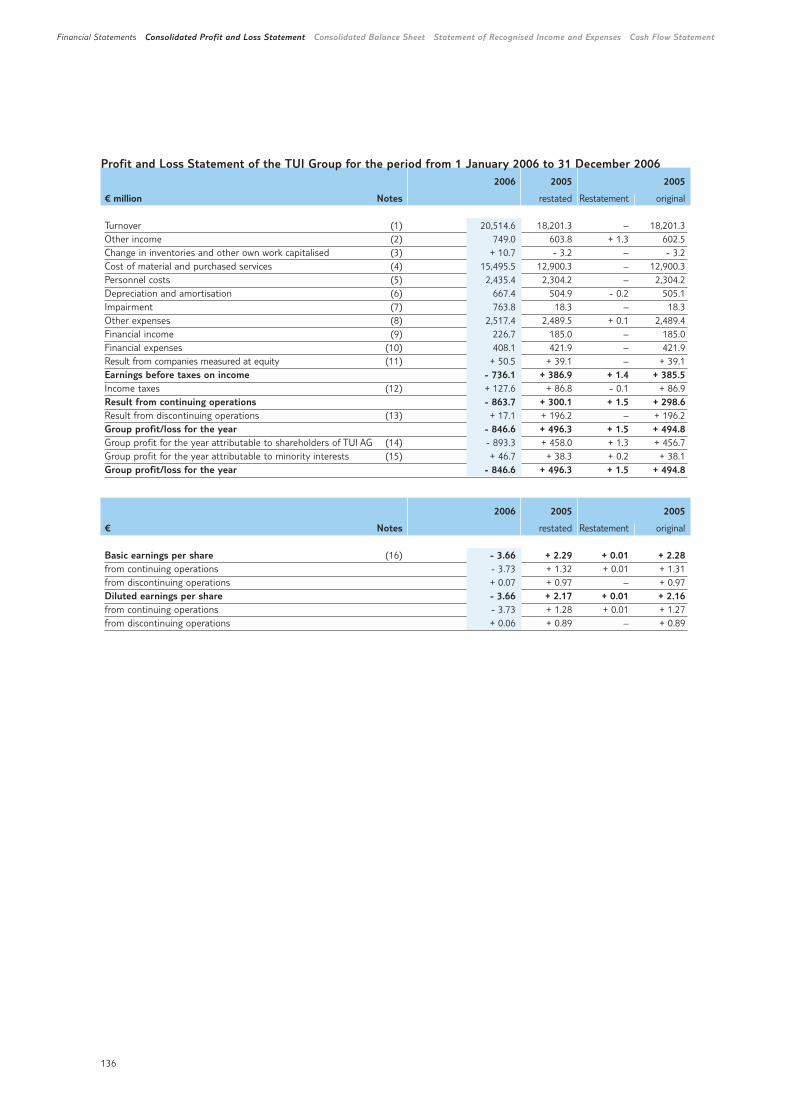
136
Profit and Loss Statement of the TUI Group for the period from 1 January 2006 to 31 December 20062006 2005 2005
€ million Notes restated Restatement original
Turnover (1) 20,514.6 18,201.3 – 18,201.3Other income (2) 749.0 603.8 + 1.3 602.5Change in inventories and other own work capitalised (3) + 10.7 - 3.2 – - 3.2Cost of material and purchased services (4) 15,495.5 12,900.3 – 12,900.3Personnel costs (5) 2,435.4 2,304.2 – 2,304.2Depreciation and amortisation (6) 667.4 504.9 - 0.2 505.1Impairment (7) 763.8 18.3 – 18.3Other expenses (8) 2,517.4 2,489.5 + 0.1 2,489.4Financial income (9) 226.7 185.0 – 185.0Financial expenses (10) 408.1 421.9 – 421.9Result from companies measured at equity (11) + 50.5 + 39.1 – + 39.1Earnings before taxes on income - 736.1 + 386.9 + 1.4 + 385.5Income taxes (12) + 127.6 + 86.8 - 0.1 + 86.9Result from continuing operations - 863.7 + 300.1 + 1.5 + 298.6Result from discontinuing operations (13) + 17.1 + 196.2 – + 196.2Group profit/loss for the year - 846.6 + 496.3 + 1.5 + 494.8Group profit for the year attributable to shareholders of TUI AG (14) - 893.3 + 458.0 + 1.3 + 456.7Group profit for the year attributable to minority interests (15) + 46.7 + 38.3 + 0.2 + 38.1Group profit/loss for the year - 846.6 + 496.3 + 1.5 + 494.8
2006 2005 2005
€ Notes restated Restatement original
Basic earnings per share (16) - 3.66 + 2.29 + 0.01 + 2.28from continuing operations - 3.73 + 1.32 + 0.01 + 1.31from discontinuing operations + 0.07 + 0.97 – + 0.97Diluted earnings per share - 3.66 + 2.17 + 0.01 + 2.16from continuing operations - 3.73 + 1.28 + 0.01 + 1.27from discontinuing operations + 0.06 + 0.89 – + 0.89
Financial Statements Consolidated Profit and Loss Statement Consolidated Balance Sheet Statement of Recognised Income and Expenses Cash Flow Statement
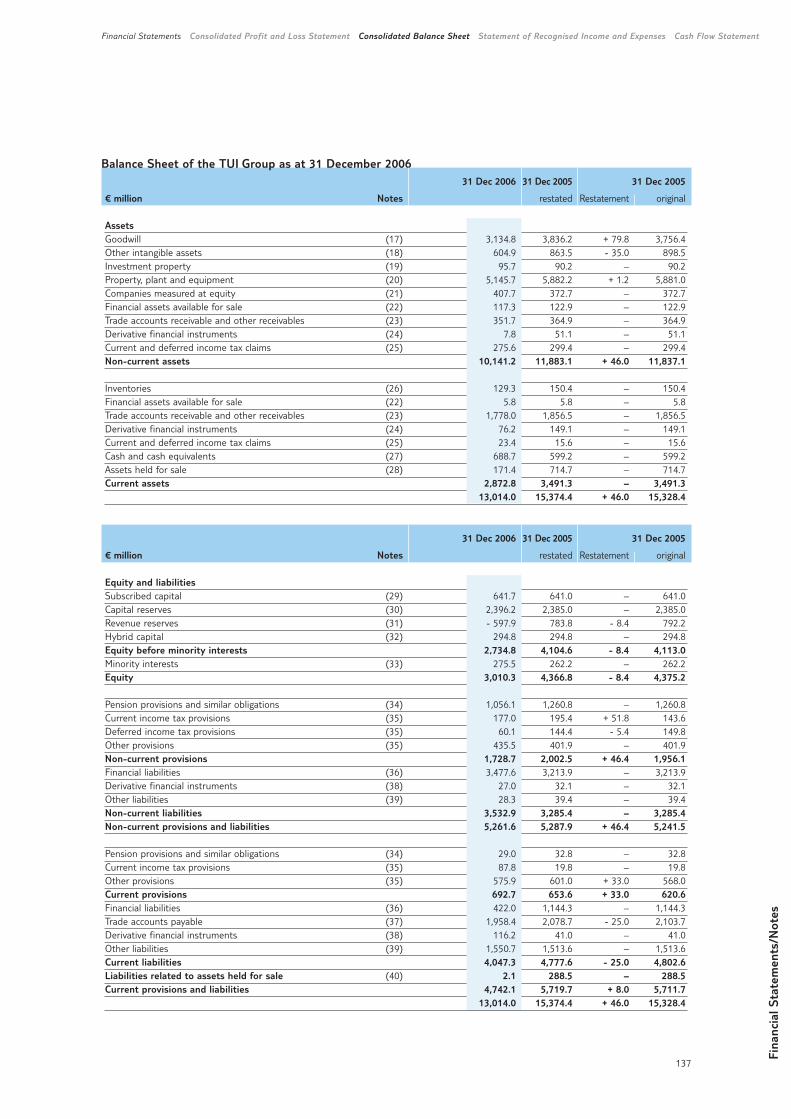
Fina
ncia
l Sta
tem
ents
/Not
es
137
Balance Sheet of the TUI Group as at 31 December 200631 Dec 2006 31 Dec 2005 31 Dec 2005
€ million Notes restated Restatement original
Assets Goodwill (17) 3,134.8 3,836.2 + 79.8 3,756.4Other intangible assets (18) 604.9 863.5 - 35.0 898.5Investment property (19) 95.7 90.2 – 90.2Property, plant and equipment (20) 5,145.7 5,882.2 + 1.2 5,881.0Companies measured at equity (21) 407.7 372.7 – 372.7Financial assets available for sale (22) 117.3 122.9 – 122.9Trade accounts receivable and other receivables (23) 351.7 364.9 – 364.9Derivative financial instruments (24) 7.8 51.1 – 51.1Current and deferred income tax claims (25) 275.6 299.4 – 299.4Non-current assets 10,141.2 11,883.1 + 46.0 11,837.1
Inventories (26) 129.3 150.4 – 150.4Financial assets available for sale (22) 5.8 5.8 – 5.8Trade accounts receivable and other receivables (23) 1,778.0 1,856.5 – 1,856.5Derivative financial instruments (24) 76.2 149.1 – 149.1Current and deferred income tax claims (25) 23.4 15.6 – 15.6Cash and cash equivalents (27) 688.7 599.2 – 599.2Assets held for sale (28) 171.4 714.7 – 714.7Current assets 2,872.8 3,491.3 – 3,491.3
13,014.0 15,374.4 + 46.0 15,328.4
31 Dec 2006 31 Dec 2005 31 Dec 2005
€ million Notes restated Restatement original
Equity and liabilitiesSubscribed capital (29) 641.7 641.0 – 641.0Capital reserves (30) 2,396.2 2,385.0 – 2,385.0Revenue reserves (31) - 597.9 783.8 - 8.4 792.2Hybrid capital (32) 294.8 294.8 – 294.8Equity before minority interests 2,734.8 4,104.6 - 8.4 4,113.0Minority interests (33) 275.5 262.2 – 262.2Equity 3,010.3 4,366.8 - 8.4 4,375.2
Pension provisions and similar obligations (34) 1,056.1 1,260.8 – 1,260.8Current income tax provisions (35) 177.0 195.4 + 51.8 143.6Deferred income tax provisions (35) 60.1 144.4 - 5.4 149.8Other provisions (35) 435.5 401.9 – 401.9Non-current provisions 1,728.7 2,002.5 + 46.4 1,956.1Financial liabilities (36) 3,477.6 3,213.9 – 3,213.9Derivative financial instruments (38) 27.0 32.1 – 32.1Other liabilities (39) 28.3 39.4 – 39.4Non-current liabilities 3,532.9 3,285.4 – 3,285.4Non-current provisions and liabilities 5,261.6 5,287.9 + 46.4 5,241.5
Pension provisions and similar obligations (34) 29.0 32.8 – 32.8Current income tax provisions (35) 87.8 19.8 – 19.8Other provisions (35) 575.9 601.0 + 33.0 568.0Current provisions 692.7 653.6 + 33.0 620.6Financial liabilities (36) 422.0 1,144.3 – 1,144.3Trade accounts payable (37) 1,958.4 2,078.7 - 25.0 2,103.7Derivative financial instruments (38) 116.2 41.0 – 41.0Other liabilities (39) 1,550.7 1,513.6 – 1,513.6Current liabilities 4,047.3 4,777.6 - 25.0 4,802.6Liabilities related to assets held for sale (40) 2.1 288.5 – 288.5Current provisions and liabilities 4,742.1 5,719.7 + 8.0 5,711.7
13,014.0 15,374.4 + 46.0 15,328.4
Financial Statements Consolidated Profit and Loss Statement Consolidated Balance Sheet Statement of Recognised Income and Expenses Cash Flow Statement
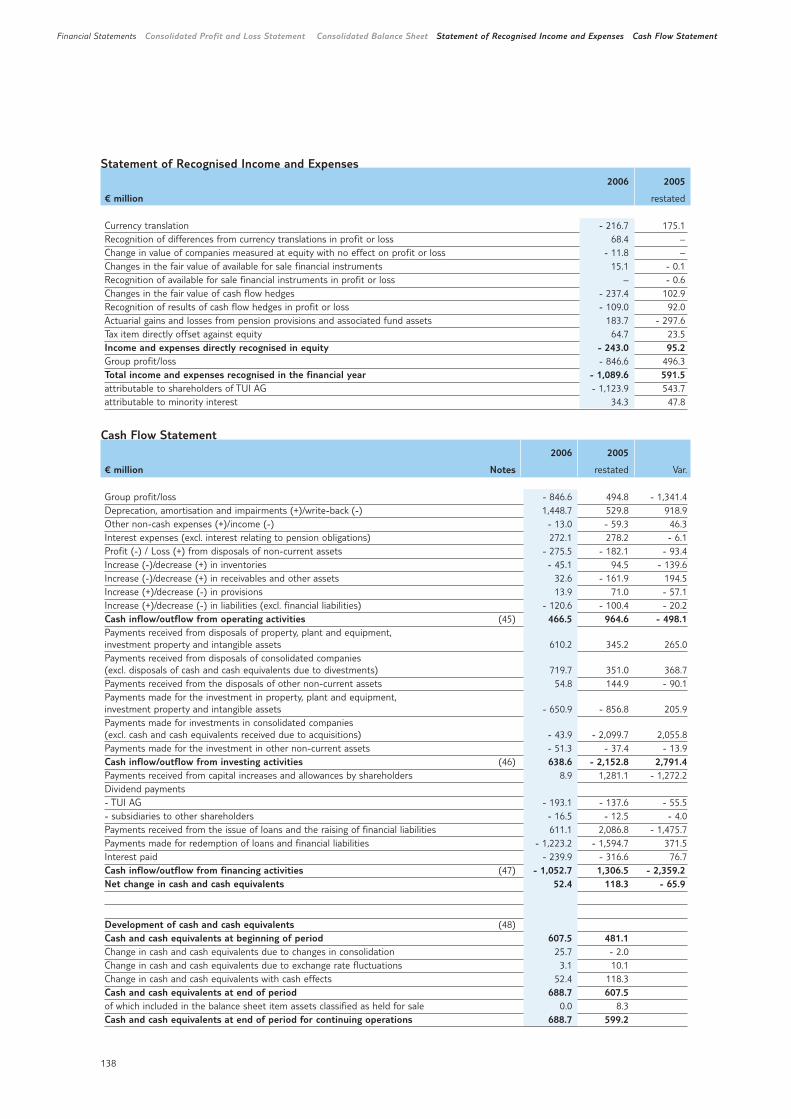
138
Statement of Recognised Income and Expenses2006 2005
€ million restated
Currency translation - 216.7 175.1Recognition of differences from currency translations in profit or loss 68.4 –Change in value of companies measured at equity with no effect on profit or loss - 11.8 –Changes in the fair value of available for sale financial instruments 15.1 - 0.1Recognition of available for sale financial instruments in profit or loss – - 0.6Changes in the fair value of cash flow hedges - 237.4 102.9Recognition of results of cash flow hedges in profit or loss - 109.0 92.0Actuarial gains and losses from pension provisions and associated fund assets 183.7 - 297.6Tax item directly offset against equity 64.7 23.5Income and expenses directly recognised in equity - 243.0 95.2Group profit/loss - 846.6 496.3Total income and expenses recognised in the financial year - 1,089.6 591.5attributable to shareholders of TUI AG - 1,123.9 543.7attributable to minority interest 34.3 47.8
Cash Flow Statement2006 2005
€ million Notes restated Var.
Group profit/loss - 846.6 494.8 - 1,341.4Deprecation, amortisation and impairments (+)/write-back (-) 1,448.7 529.8 918.9Other non-cash expenses (+)/income (-) - 13.0 - 59.3 46.3Interest expenses (excl. interest relating to pension obligations) 272.1 278.2 - 6.1Profit (-) / Loss (+) from disposals of non-current assets - 275.5 - 182.1 - 93.4Increase (-)/decrease (+) in inventories - 45.1 94.5 - 139.6Increase (-)/decrease (+) in receivables and other assets 32.6 - 161.9 194.5Increase (+)/decrease (-) in provisions 13.9 71.0 - 57.1Increase (+)/decrease (-) in liabilities (excl. financial liabilities) - 120.6 - 100.4 - 20.2Cash inflow/outflow from operating activities (45) 466.5 964.6 - 498.1Payments received from disposals of property, plant and equipment,investment property and intangible assets 610.2 345.2 265.0Payments received from disposals of consolidated companies (excl. disposals of cash and cash equivalents due to divestments) 719.7 351.0 368.7Payments received from the disposals of other non-current assets 54.8 144.9 - 90.1Payments made for the investment in property, plant and equipment,investment property and intangible assets - 650.9 - 856.8 205.9Payments made for investments in consolidated companies(excl. cash and cash equivalents received due to acquisitions) - 43.9 - 2,099.7 2,055.8Payments made for the investment in other non-current assets - 51.3 - 37.4 - 13.9Cash inflow/outflow from investing activities (46) 638.6 - 2,152.8 2,791.4Payments received from capital increases and allowances by shareholders 8.9 1,281.1 - 1,272.2Dividend payments - TUI AG - 193.1 - 137.6 - 55.5- subsidiaries to other shareholders - 16.5 - 12.5 - 4.0Payments received from the issue of loans and the raising of financial liabilities 611.1 2,086.8 - 1,475.7Payments made for redemption of loans and financial liabilities - 1,223.2 - 1,594.7 371.5Interest paid - 239.9 - 316.6 76.7Cash inflow/outflow from financing activities (47) - 1,052.7 1,306.5 - 2,359.2Net change in cash and cash equivalents 52.4 118.3 - 65.9
Development of cash and cash equivalents (48)Cash and cash equivalents at beginning of period 607.5 481.1Change in cash and cash equivalents due to changes in consolidation 25.7 - 2.0Change in cash and cash equivalents due to exchange rate fluctuations 3.1 10.1Change in cash and cash equivalents with cash effects 52.4 118.3Cash and cash equivalents at end of period 688.7 607.5of which included in the balance sheet item assets classified as held for sale 0.0 8.3Cash and cash equivalents at end of period for continuing operations 688.7 599.2
Financial Statements Consolidated Profit and Loss Statement Consolidated Balance Sheet Statement of Recognised Income and Expenses Cash Flow Statement
Notes Principles and Methods underlying the Consolidated Financial Statements
139
Fina
ncia
l Sta
tem
ents
/Not
es
Notes Notes on the Principles and Methods Segment Reporting Notes on the Consolidated Profit and Loss Statement
Notes on the Consolidated Balance Sheet Major Shareholdings Notes on the Cash Flow Statement Other Notes
GeneralTUI AG, based in Hanover, Karl-Wiechert-Allee 4, is the TUI Group’s parent compa-ny and a listed stock corporation under German law. The Company has been regis-tered in the commercial registers of the district courts of Berlin-Charlottenburg(HRB 321) and Hanover (HRB 6580).
TUI operates in two core businesses, tourism and shipping. TUI is Europe’s largestintegrated tourism group and, in terms of published turnover in 2005, market leaderin Germany, the UK and France as well as one of the leading tourism companies innine other European countries. Following the successful integration of CP Ships intoHapag-Lloyd, TUI operates one of the world’s five leading container lines. TUI’sshipping division also comprises a passenger shipping company.
The members of the Executive Board and the Supervisory Board, as well as otherboard memberships held by them, are listed separately in an annex to the section‘Corporate Governance’ in the annual report.
The Executive Board and the Supervisory Board have submitted the declaration ofcompliance concerning the German Corporate Governance Code required pursuantto section 161 of the German Stock Corporation Act (AktG) and made it perma-nently accessible to the general public on the Company’s website (www.tui-group.com).
The financial year of TUI AG and its main subsidiaries corresponds to the calendaryear. The consolidated financial statements were prepared in euro. Unless statedotherwise, all amounts are indicated in million euros (€ million).
Accounting principlesThe legal duty for TUI AG to prepare consolidated financial statements in accor-dance with the rules of the International Accounting Standards Board (IASB), theInternational Financial Reporting Standards (IFRS), is derived from section 315asub-section 1 of the German Commercial Code (HGB) in combination with theRegulation EEC No. 1606/2002 of the European Union.
The IFRS are applied in the form in which they have been transposed into nationallegislation in the framework of the endorsement process by the European Com-mission. In addition, the commercial-law provisions stipulated by section 315a sub-section 1 HGB are complied with. All requirements of each of the compulsory stan-dards applicable as per the balance sheet date were completely fulfilled. As of thebeginning of the 2006 financial year, the following standards, revised or newlypublished by the IASB, were applicable: IAS 21 The Effects of Changes in ForeignExchange Rates (amendment for net investment in a foreign operation), IAS 39Financial Instruments: Recognition and Measurement (amendment for cash flow
140
hedges of forecast intragroup transactions), IAS 39 Financial Instruments: Recogni-tion and Measurement (amendment for fair value option), IAS 39 Financial Instru-ments: Recognition and Measurement (amendment for financial guarantee con-tracts), IFRS 4 Insurance Contracts (amendment for financial guarantee contracts),IFRS 6 Exploration for and Evaluation of Mineral Assets, IFRIC 4 DeterminingWhether an Arrangement Contains a Lease, IFRIC 5 Rights to Interests Arising fromDecommissioning, Restoration and Environmental Rehabilitation Funds, IFRIC 6 Liabilities Arising from Participating in a Specific Market – Waste Electricaland Electronic Equipment. The application of these standards did not result in anysignificant changes in the TUI Group’s accounting and measurement methods.
In addition, the revised IAS 19 Employee Benefits has been effective since 1 Janu-ary 2006. This standard has already been applied voluntarily since 1 January 2005,and the option offered under this standard to offset actuarial gains or losses againstequity at the date they occur outside profit and loss was exercised.
The following amendments to published, revised or newly adopted standards, alreadyadopted by the IASB, were not yet applied in the 2006 financial year: – IAS 1 Presentation of Financial Statements (Amendement re. Capital Disclosures),– IFRS 7 Financial Instruments: Disclosures,– IFRS 8 Operating Segments, – IFRIC 7 Applying the Restatement Approach under IAS 29 Financial Reporting in
Hyperinflationary Economies,– IFRIC 8 Scope of IFRS 2, – IFRIC 9 Reassessment of Embedded Derivatives,– IFRIC 10 Interim Financial Reporting and Impairment, – IFRIC 11 Group and Treasury Share Transactions according to IFRS 2, – IFRIC 12 Service Concession Arrangements.These amendments are only effective as of the 2007 financial year or later. Theeffects of the application of these standards on TUI AG’s consolidated financial statements are not yet known or cannot be reliably assessed at the current pointin time.
Due to the short period between the acquisition of the CP Ships Group and thepreparation of the consolidated financial statements, the fair values of the acquiredassets and contingent liabilities as well as the acquisition costs were only determinedon a preliminary basis in the 2005 financial year. Final determination was effectedin the last quarter of the completed financial year within the twelve-month periodafter the acquisition date stipulated by IFRS 3.62. In accordance with IFRS 3, com-parative disclosures for periods prior to the completion of the first time accountingof the acquisition transaction must be presented retrospectively as if the purchaseprice allocation had already been completed at the date of the acquisition. In orderto enhance the comparability of figures, the restated figures for 2005 are thereforeprovided alongside the originally published figures for 2005, both for the profit andloss statement and the balance sheet. The table shown below provides an overviewof the retrospective changes in the purchase price allocation.
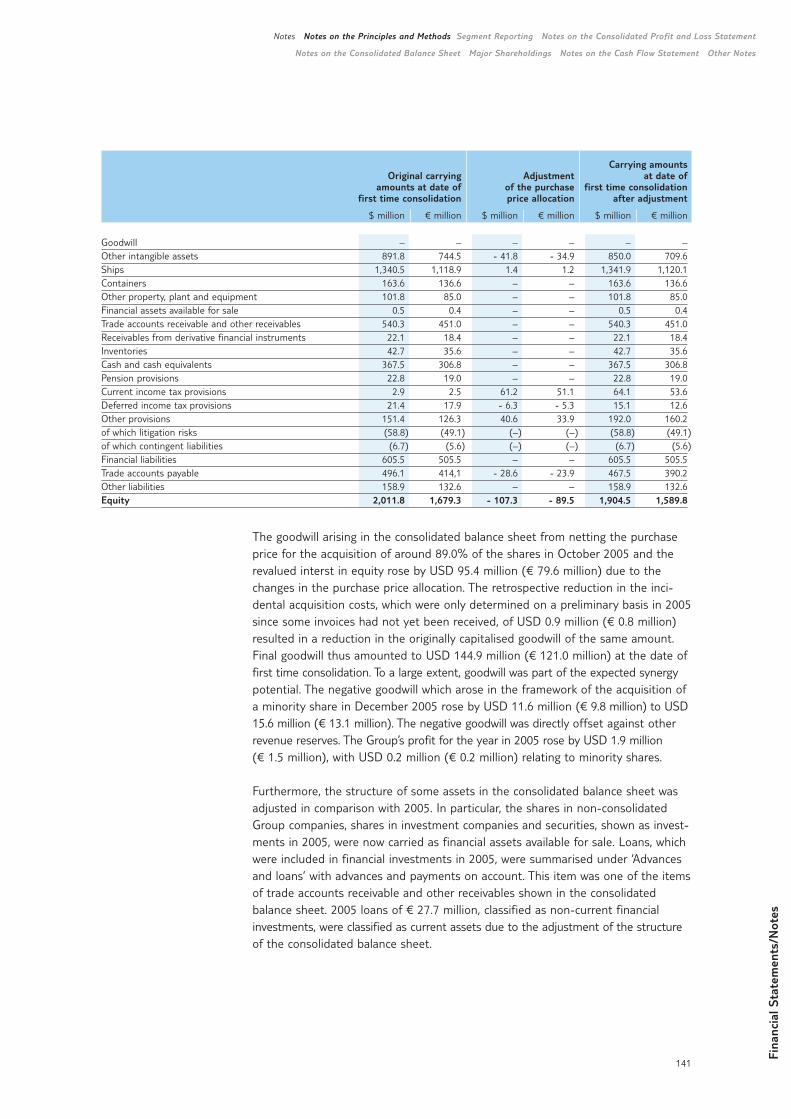
Fina
ncia
l Sta
tem
ents
/Not
es
141
Notes Notes on the Principles and Methods Segment Reporting Notes on the Consolidated Profit and Loss Statement
Notes on the Consolidated Balance Sheet Major Shareholdings Notes on the Cash Flow Statement Other Notes
The goodwill arising in the consolidated balance sheet from netting the purchaseprice for the acquisition of around 89.0% of the shares in October 2005 and therevalued interst in equity rose by USD 95.4 million (€ 79.6 million) due to thechanges in the purchase price allocation. The retrospective reduction in the inci-dental acquisition costs, which were only determined on a preliminary basis in 2005since some invoices had not yet been received, of USD 0.9 million (€ 0.8 million)resulted in a reduction in the originally capitalised goodwill of the same amount.Final goodwill thus amounted to USD 144.9 million (€ 121.0 million) at the date offirst time consolidation. To a large extent, goodwill was part of the expected synergypotential. The negative goodwill which arose in the framework of the acquisition ofa minority share in December 2005 rose by USD 11.6 million (€ 9.8 million) to USD15.6 million (€ 13.1 million). The negative goodwill was directly offset against otherrevenue reserves. The Group’s profit for the year in 2005 rose by USD 1.9 million(€ 1.5 million), with USD 0.2 million (€ 0.2 million) relating to minority shares.
Furthermore, the structure of some assets in the consolidated balance sheet wasadjusted in comparison with 2005. In particular, the shares in non-consolidatedGroup companies, shares in investment companies and securities, shown as invest-ments in 2005, were now carried as financial assets available for sale. Loans, whichwere included in financial investments in 2005, were summarised under ‘Advancesand loans’ with advances and payments on account. This item was one of the itemsof trade accounts receivable and other receivables shown in the consolidatedbalance sheet. 2005 loans of € 27.7 million, classified as non-current financialinvestments, were classified as current assets due to the adjustment of the structureof the consolidated balance sheet.
Carrying amountsOriginal carrying Adjustment at date of
amounts at date of of the purchase first time consolidationfirst time consolidation price allocation after adjustment
$ million € million $ million € million $ million € million
Goodwill – – – – – –Other intangible assets 891.8 744.5 - 41.8 - 34.9 850.0 709.6Ships 1,340.5 1,118.9 1.4 1.2 1,341.9 1,120.1Containers 163.6 136.6 – – 163.6 136.6Other property, plant and equipment 101.8 85.0 – – 101.8 85.0Financial assets available for sale 0.5 0.4 – – 0.5 0.4Trade accounts receivable and other receivables 540.3 451.0 – – 540.3 451.0Receivables from derivative financial instruments 22.1 18.4 – – 22.1 18.4Inventories 42.7 35.6 – – 42.7 35.6Cash and cash equivalents 367.5 306.8 – – 367.5 306.8Pension provisions 22.8 19.0 – – 22.8 19.0Current income tax provisions 2.9 2.5 61.2 51.1 64.1 53.6Deferred income tax provisions 21.4 17.9 - 6.3 - 5.3 15.1 12.6Other provisions 151.4 126.3 40.6 33.9 192.0 160.2of which litigation risks (58.8) (49.1) (–) (–) (58.8) (49.1)of which contingent liabilities (6.7) (5.6) (–) (–) (6.7) (5.6)Financial liabilities 605.5 505.5 – – 605.5 505.5Trade accounts payable 496.1 414,1 - 28.6 - 23.9 467.5 390.2Other liabilities 158.9 132.6 – – 158.9 132.6Equity 2,011.8 1,679.3 - 107.3 - 89.5 1,904.5 1,589.8
142
Principles and methods of consolidation
PrinciplesThe consolidated financial statements included all major companies in which TUI AGwas able, directly or indirectly, to determine the financial and operating policies soas to obtain benefits from the activity of these companies (subsidiaries). As a rule,the control was exercised by means of a majority of voting rights. The RIUSA IIGroup was included on the basis of equal equity interests and voting rights forTUI AG and its co-shareholder due to de facto control. In the light of overall circum-stances, TUI AG was able to determine the financial and operating policies so as toobtain benefits from the activity of this hotel group. In assessing whether the Companywas able to control these companies, the existence and effects of potential votingrights which the Company had a right to exercise or convert were taken into account.These companies were included in the consolidated financial statements as of thedate at which the TUI Group gained control. When the TUI Group ceased to controlthese companies, they were removed from consolidation.
The consolidated financial statements were prepared on the basis of the auditedindividual or consolidated annual financial statements of TUI AG and its subsidiaries,prepared on the basis of uniform accounting, measurement and consolidationmethods.
Shareholdings in companies in which the Group was able to exert significantinfluence over the financial and operating decisions within these companies (asso-ciated companies, shareholding of 20% to less than 50%) were measured at equity.Companies managed jointly with one or several partners ( joint ventures, sharehol-ding of 50%) were also measured at equity. The principles applied in determiningthe dates as of which associated companies and joint ventures were included in orremoved from the group of companies measured at equity corresponded to thoseapplying to subsidiaries. Equity measurement in each case was based on the lastannual or consolidated financial statements.
Group of consolidated companiesIn the 2006 financial year, the consolidated financial statements included a total of39 domestic and 348 foreign subsidiaries, besides TUI AG.
60 domestic and 111 foreign subsidiaries were not included in the consolidatedfinancial statements. Even when taken together, these companies were not signifi-cant for the presentation of a true and fair view of the financial position and per-formance of the Group.
After 31 December 2005, 26 companies were newly included in consolidation. Fivecompanies had to be included for the first time due to acquisitions. Another 16companies were included for the first time due to an expansion of their businessoperations, with five companies included in consolidation for the first time sincethey were newly established. 21 of the companies included in consolidation for thefirst time related to the tourism division, three companies to the shipping divisionand two companies to the holding companies sector.
Since 31 December 2005, a total of 82 companies were removed from consolidation.Of these deconsolidated companies, 47 companies were related to the tourism divi-sion, 18 companies to the shipping division, 15 companies to the trading sector
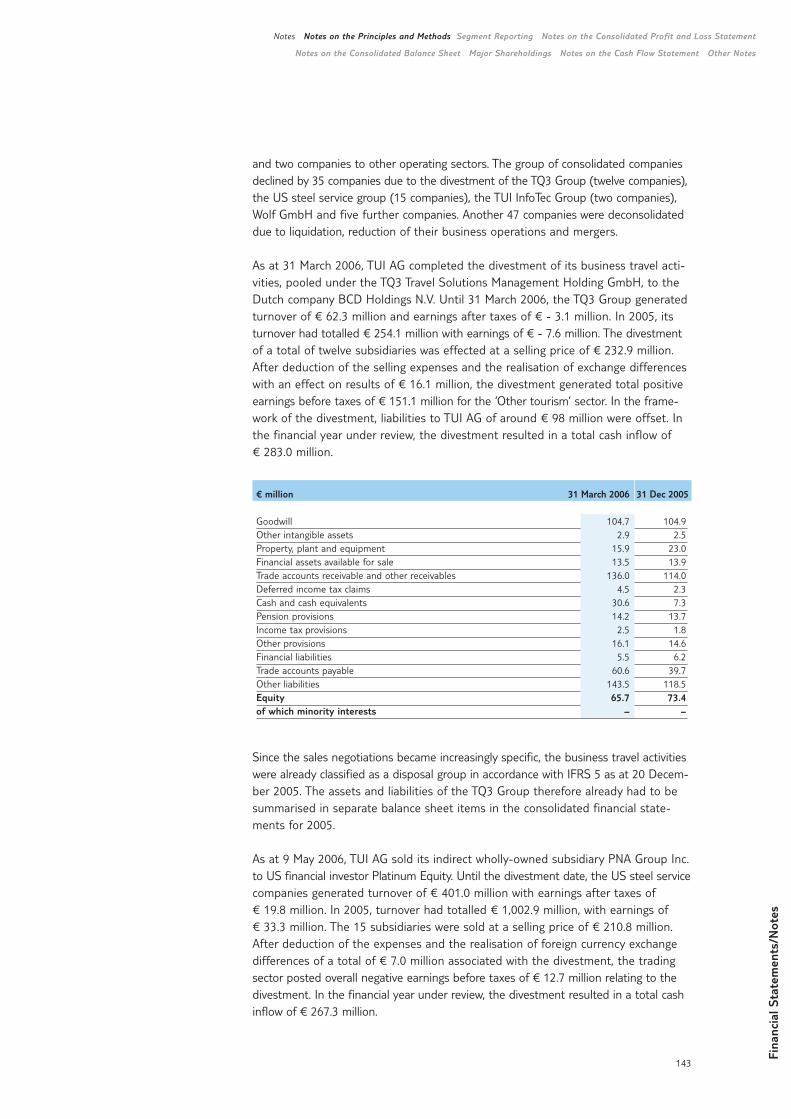
Fina
ncia
l Sta
tem
ents
/Not
es
143
Notes Notes on the Principles and Methods Segment Reporting Notes on the Consolidated Profit and Loss Statement
Notes on the Consolidated Balance Sheet Major Shareholdings Notes on the Cash Flow Statement Other Notes
and two companies to other operating sectors. The group of consolidated companiesdeclined by 35 companies due to the divestment of the TQ3 Group (twelve companies),the US steel service group (15 companies), the TUI InfoTec Group (two companies),Wolf GmbH and five further companies. Another 47 companies were deconsolidateddue to liquidation, reduction of their business operations and mergers.
As at 31 March 2006, TUI AG completed the divestment of its business travel acti-vities, pooled under the TQ3 Travel Solutions Management Holding GmbH, to theDutch company BCD Holdings N.V. Until 31 March 2006, the TQ3 Group generatedturnover of € 62.3 million and earnings after taxes of € - 3.1 million. In 2005, itsturnover had totalled € 254.1 million with earnings of € - 7.6 million. The divestmentof a total of twelve subsidiaries was effected at a selling price of € 232.9 million.After deduction of the selling expenses and the realisation of exchange differenceswith an effect on results of € 16.1 million, the divestment generated total positiveearnings before taxes of € 151.1 million for the ‘Other tourism’ sector. In the frame-work of the divestment, liabilities to TUI AG of around € 98 million were offset. Inthe financial year under review, the divestment resulted in a total cash inflow of€ 283.0 million.
€ million 31 March 2006 31 Dec 2005
Goodwill 104.7 104.9Other intangible assets 2.9 2.5Property, plant and equipment 15.9 23.0Financial assets available for sale 13.5 13.9Trade accounts receivable and other receivables 136.0 114.0Deferred income tax claims 4.5 2.3Cash and cash equivalents 30.6 7.3Pension provisions 14.2 13.7Income tax provisions 2.5 1.8Other provisions 16.1 14.6Financial liabilities 5.5 6.2Trade accounts payable 60.6 39.7Other liabilities 143.5 118.5Equity 65.7 73.4of which minority interests – –
Since the sales negotiations became increasingly specific, the business travel activitieswere already classified as a disposal group in accordance with IFRS 5 as at 20 Decem-ber 2005. The assets and liabilities of the TQ3 Group therefore already had to besummarised in separate balance sheet items in the consolidated financial state-ments for 2005.
As at 9 May 2006, TUI AG sold its indirect wholly-owned subsidiary PNA Group Inc.to US financial investor Platinum Equity. Until the divestment date, the US steel servicecompanies generated turnover of € 401.0 million with earnings after taxes of€ 19.8 million. In 2005, turnover had totalled € 1,002.9 million, with earnings of€ 33.3 million. The 15 subsidiaries were sold at a selling price of € 210.8 million.After deduction of the expenses and the realisation of foreign currency exchangedifferences of a total of € 7.0 million associated with the divestment, the tradingsector posted overall negative earnings before taxes of € 12.7 million relating to thedivestment. In the financial year under review, the divestment resulted in a total cashinflow of € 267.3 million.
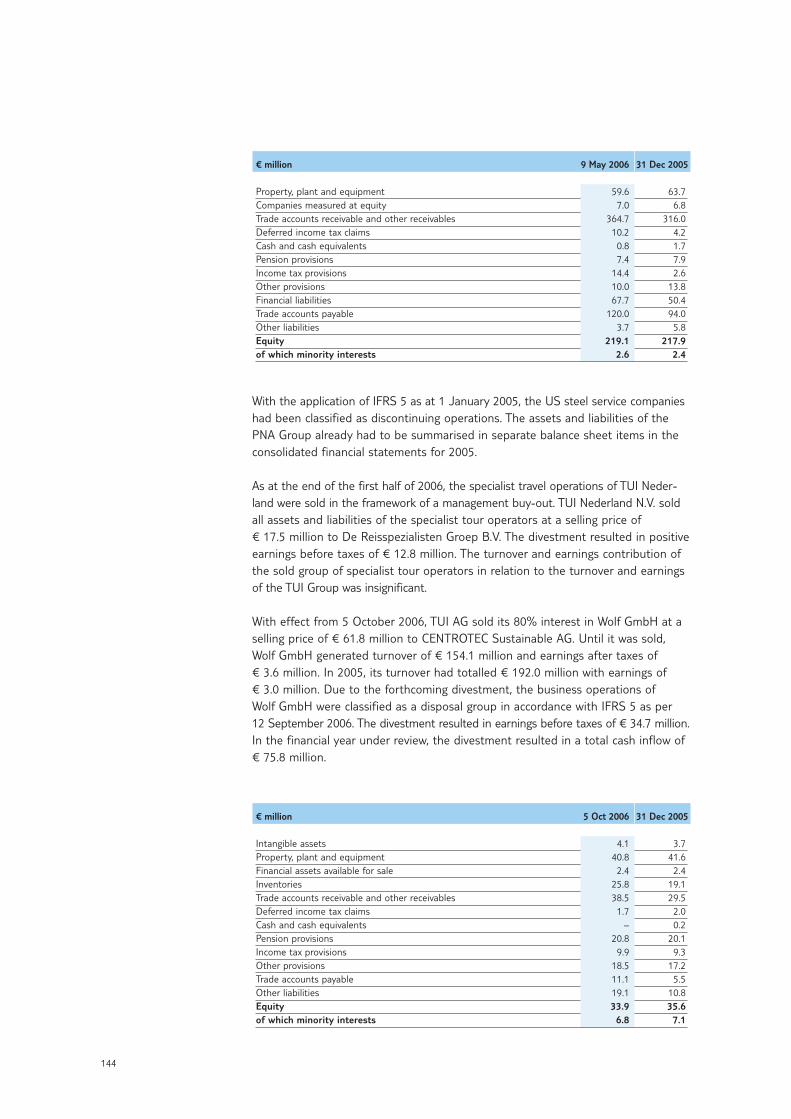
144
€ million 9 May 2006 31 Dec 2005
Property, plant and equipment 59.6 63.7Companies measured at equity 7.0 6.8Trade accounts receivable and other receivables 364.7 316.0Deferred income tax claims 10.2 4.2Cash and cash equivalents 0.8 1.7Pension provisions 7.4 7.9Income tax provisions 14.4 2.6Other provisions 10.0 13.8Financial liabilities 67.7 50.4Trade accounts payable 120.0 94.0Other liabilities 3.7 5.8Equity 219.1 217.9of which minority interests 2.6 2.4
With the application of IFRS 5 as at 1 January 2005, the US steel service companieshad been classified as discontinuing operations. The assets and liabilities of thePNA Group already had to be summarised in separate balance sheet items in theconsolidated financial statements for 2005.
As at the end of the first half of 2006, the specialist travel operations of TUI Neder-land were sold in the framework of a management buy-out. TUI Nederland N.V. soldall assets and liabilities of the specialist tour operators at a selling price of€ 17.5 million to De Reisspezialisten Groep B.V. The divestment resulted in positiveearnings before taxes of € 12.8 million. The turnover and earnings contribution ofthe sold group of specialist tour operators in relation to the turnover and earningsof the TUI Group was insignificant.
With effect from 5 October 2006, TUI AG sold its 80% interest in Wolf GmbH at aselling price of € 61.8 million to CENTROTEC Sustainable AG. Until it was sold,Wolf GmbH generated turnover of € 154.1 million and earnings after taxes of€ 3.6 million. In 2005, its turnover had totalled € 192.0 million with earnings of€ 3.0 million. Due to the forthcoming divestment, the business operations ofWolf GmbH were classified as a disposal group in accordance with IFRS 5 as per12 September 2006. The divestment resulted in earnings before taxes of € 34.7 million.In the financial year under review, the divestment resulted in a total cash inflow of€ 75.8 million.
€ million 5 Oct 2006 31 Dec 2005
Intangible assets 4.1 3.7Property, plant and equipment 40.8 41.6Financial assets available for sale 2.4 2.4Inventories 25.8 19.1Trade accounts receivable and other receivables 38.5 29.5Deferred income tax claims 1.7 2.0Cash and cash equivalents – 0.2Pension provisions 20.8 20.1Income tax provisions 9.9 9.3Other provisions 18.5 17.2Trade accounts payable 11.1 5.5Other liabilities 19.1 10.8Equity 33.9 35.6of which minority interests 6.8 7.1
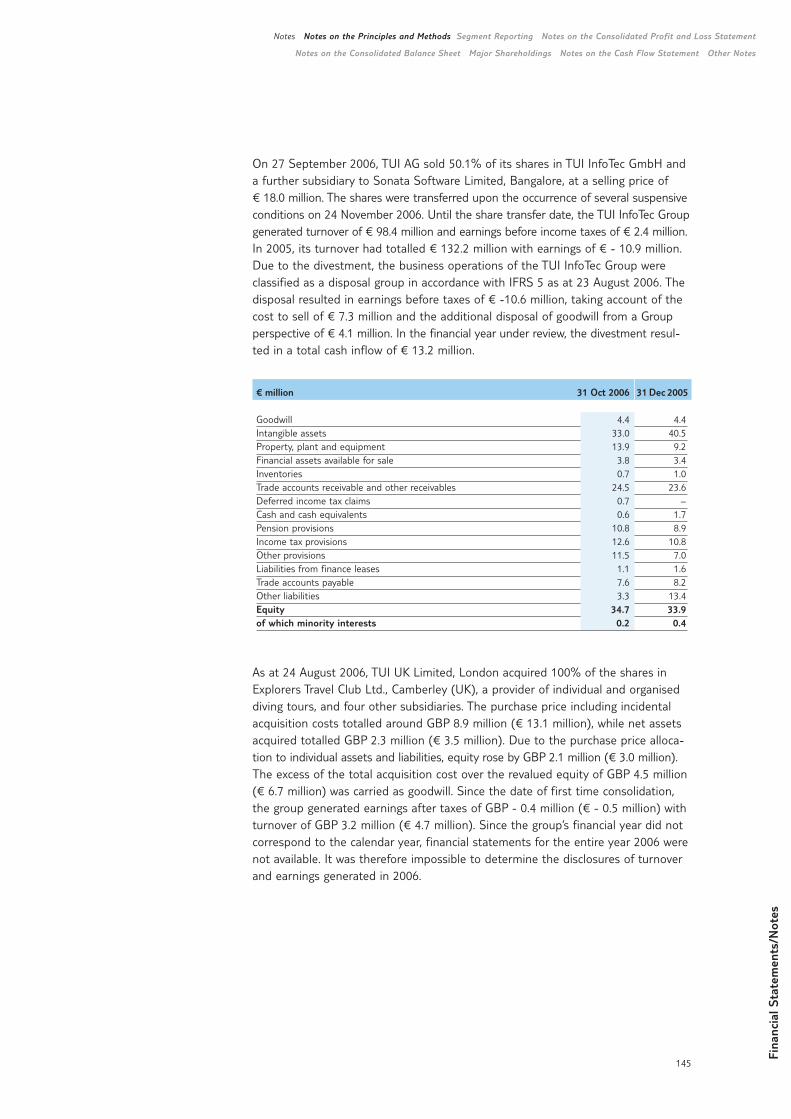
Fina
ncia
l Sta
tem
ents
/Not
es
Notes Notes on the Principles and Methods Segment Reporting Notes on the Consolidated Profit and Loss Statement
Notes on the Consolidated Balance Sheet Major Shareholdings Notes on the Cash Flow Statement Other Notes
On 27 September 2006, TUI AG sold 50.1% of its shares in TUI InfoTec GmbH anda further subsidiary to Sonata Software Limited, Bangalore, at a selling price of€ 18.0 million. The shares were transferred upon the occurrence of several suspensiveconditions on 24 November 2006. Until the share transfer date, the TUI InfoTec Groupgenerated turnover of € 98.4 million and earnings before income taxes of € 2.4 million.In 2005, its turnover had totalled € 132.2 million with earnings of € - 10.9 million.Due to the divestment, the business operations of the TUI InfoTec Group wereclassified as a disposal group in accordance with IFRS 5 as at 23 August 2006. Thedisposal resulted in earnings before taxes of € -10.6 million, taking account of thecost to sell of € 7.3 million and the additional disposal of goodwill from a Groupperspective of € 4.1 million. In the financial year under review, the divestment resul-ted in a total cash inflow of € 13.2 million.
€ million 31 Oct 2006 31 Dec 2005
Goodwill 4.4 4.4Intangible assets 33.0 40.5Property, plant and equipment 13.9 9.2Financial assets available for sale 3.8 3.4Inventories 0.7 1.0Trade accounts receivable and other receivables 24.5 23.6Deferred income tax claims 0.7 –Cash and cash equivalents 0.6 1.7Pension provisions 10.8 8.9Income tax provisions 12.6 10.8Other provisions 11.5 7.0Liabilities from finance leases 1.1 1.6Trade accounts payable 7.6 8.2Other liabilities 3.3 13.4Equity 34.7 33.9of which minority interests 0.2 0.4
As at 24 August 2006, TUI UK Limited, London acquired 100% of the shares inExplorers Travel Club Ltd., Camberley (UK), a provider of individual and organiseddiving tours, and four other subsidiaries. The purchase price including incidentalacquisition costs totalled around GBP 8.9 million (€ 13.1 million), while net assetsacquired totalled GBP 2.3 million (€ 3.5 million). Due to the purchase price alloca-tion to individual assets and liabilities, equity rose by GBP 2.1 million (€ 3.0 million).The excess of the total acquisition cost over the revalued equity of GBP 4.5 million(€ 6.7 million) was carried as goodwill. Since the date of first time consolidation,the group generated earnings after taxes of GBP - 0.4 million (€ - 0.5 million) withturnover of GBP 3.2 million (€ 4.7 million). Since the group’s financial year did notcorrespond to the calendar year, financial statements for the entire year 2006 werenot available. It was therefore impossible to determine the disclosures of turnoverand earnings generated in 2006.
145
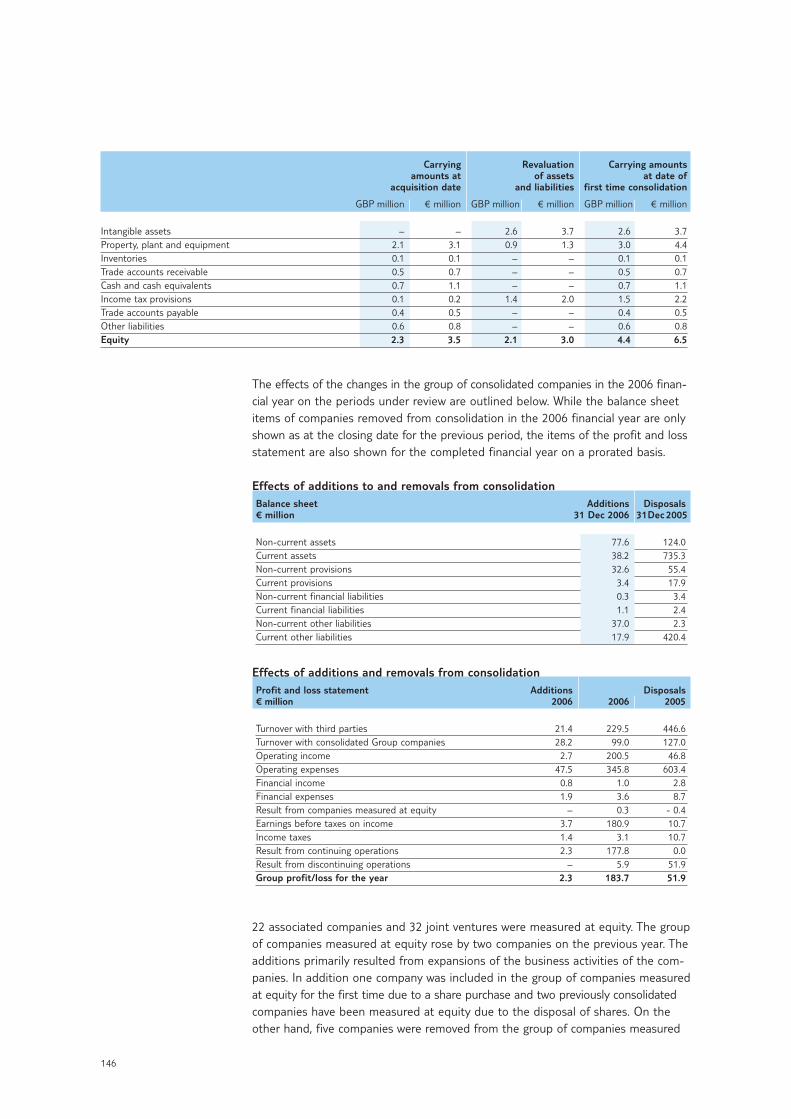
146
The effects of the changes in the group of consolidated companies in the 2006 finan-cial year on the periods under review are outlined below. While the balance sheetitems of companies removed from consolidation in the 2006 financial year are onlyshown as at the closing date for the previous period, the items of the profit and lossstatement are also shown for the completed financial year on a prorated basis.
Effects of additions to and removals from consolidationBalance sheet Additions Disposals€ million 31 Dec 2006 31Dec 2005
Non-current assets 77.6 124.0Current assets 38.2 735.3Non-current provisions 32.6 55.4Current provisions 3.4 17.9Non-current financial liabilities 0.3 3.4Current financial liabilities 1.1 2.4Non-current other liabilities 37.0 2.3Current other liabilities 17.9 420.4
Effects of additions and removals from consolidationProfit and loss statement Additions Disposals€ million 2006 2006 2005
Turnover with third parties 21.4 229.5 446.6Turnover with consolidated Group companies 28.2 99.0 127.0Operating income 2.7 200.5 46.8Operating expenses 47.5 345.8 603.4Financial income 0.8 1.0 2.8Financial expenses 1.9 3.6 8.7Result from companies measured at equity – 0.3 - 0.4Earnings before taxes on income 3.7 180.9 10.7Income taxes 1.4 3.1 10.7Result from continuing operations 2.3 177.8 0.0Result from discontinuing operations – 5.9 51.9Group profit/loss for the year 2.3 183.7 51.9
22 associated companies and 32 joint ventures were measured at equity. The groupof companies measured at equity rose by two companies on the previous year. Theadditions primarily resulted from expansions of the business activities of the com-panies. In addition one company was included in the group of companies measuredat equity for the first time due to a share purchase and two previously consolidatedcompanies have been measured at equity due to the disposal of shares. On theother hand, five companies were removed from the group of companies measured
Carrying Revaluation Carrying amountsamounts at of assets at date of
acquisition date and liabilities first time consolidation
GBP million € million GBP million € million GBP million € million
Intangible assets – – 2.6 3.7 2.6 3.7Property, plant and equipment 2.1 3.1 0.9 1.3 3.0 4.4Inventories 0.1 0.1 – – 0.1 0.1Trade accounts receivable 0.5 0.7 – – 0.5 0.7Cash and cash equivalents 0.7 1.1 – – 0.7 1.1Income tax provisions 0.1 0.2 1.4 2.0 1.5 2.2Trade accounts payable 0.4 0.5 – – 0.4 0.5Other liabilities 0.6 0.8 – – 0.6 0.8Equity 2.3 3.5 2.1 3.0 4.4 6.5
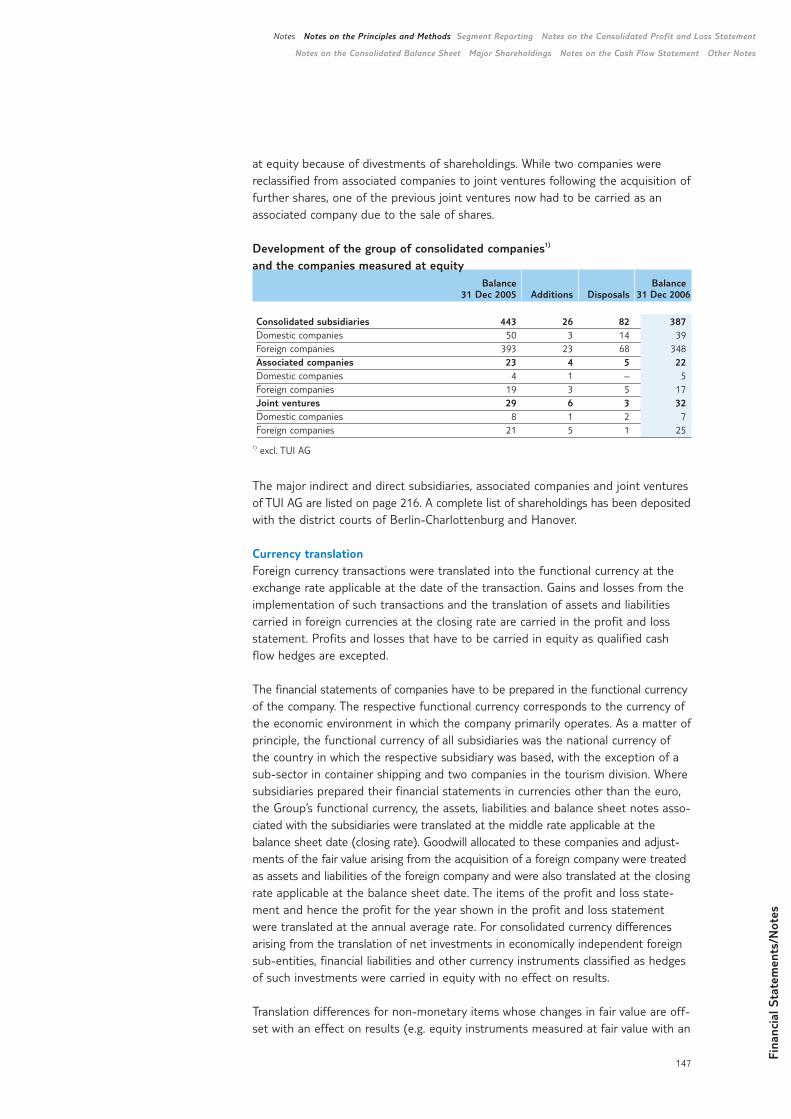
Fina
ncia
l Sta
tem
ents
/Not
es
147
Notes Notes on the Principles and Methods Segment Reporting Notes on the Consolidated Profit and Loss Statement
Notes on the Consolidated Balance Sheet Major Shareholdings Notes on the Cash Flow Statement Other Notes
at equity because of divestments of shareholdings. While two companies werereclassified from associated companies to joint ventures following the acquisition offurther shares, one of the previous joint ventures now had to be carried as anassociated company due to the sale of shares.
Development of the group of consolidated companies1)
and the companies measured at equity Balance Balance
31 Dec 2005 Additions Disposals 31 Dec 2006
Consolidated subsidiaries 443 26 82 387Domestic companies 50 3 14 39Foreign companies 393 23 68 348Associated companies 23 4 5 22Domestic companies 4 1 – 5Foreign companies 19 3 5 17Joint ventures 29 6 3 32Domestic companies 8 1 2 7Foreign companies 21 5 1 25
1) excl. TUI AG
The major indirect and direct subsidiaries, associated companies and joint venturesof TUI AG are listed on page 216. A complete list of shareholdings has been depositedwith the district courts of Berlin-Charlottenburg and Hanover.
Currency translationForeign currency transactions were translated into the functional currency at theexchange rate applicable at the date of the transaction. Gains and losses from theimplementation of such transactions and the translation of assets and liabilitiescarried in foreign currencies at the closing rate are carried in the profit and lossstatement. Profits and losses that have to be carried in equity as qualified cashflow hedges are excepted.
The financial statements of companies have to be prepared in the functional currencyof the company. The respective functional currency corresponds to the currency ofthe economic environment in which the company primarily operates. As a matter ofprinciple, the functional currency of all subsidiaries was the national currency ofthe country in which the respective subsidiary was based, with the exception of asub-sector in container shipping and two companies in the tourism division. Wheresubsidiaries prepared their financial statements in currencies other than the euro,the Group’s functional currency, the assets, liabilities and balance sheet notes asso-ciated with the subsidiaries were translated at the middle rate applicable at the balance sheet date (closing rate). Goodwill allocated to these companies and adjust-ments of the fair value arising from the acquisition of a foreign company were treatedas assets and liabilities of the foreign company and were also translated at the closingrate applicable at the balance sheet date. The items of the profit and loss state-ment and hence the profit for the year shown in the profit and loss statementwere translated at the annual average rate. For consolidated currency differencesarising from the translation of net investments in economically independent foreignsub-entities, financial liabilities and other currency instruments classified as hedgesof such investments were carried in equity with no effect on results.
Translation differences for non-monetary items whose changes in fair value are off-set with an effect on results (e.g. equity instruments measured at fair value with an
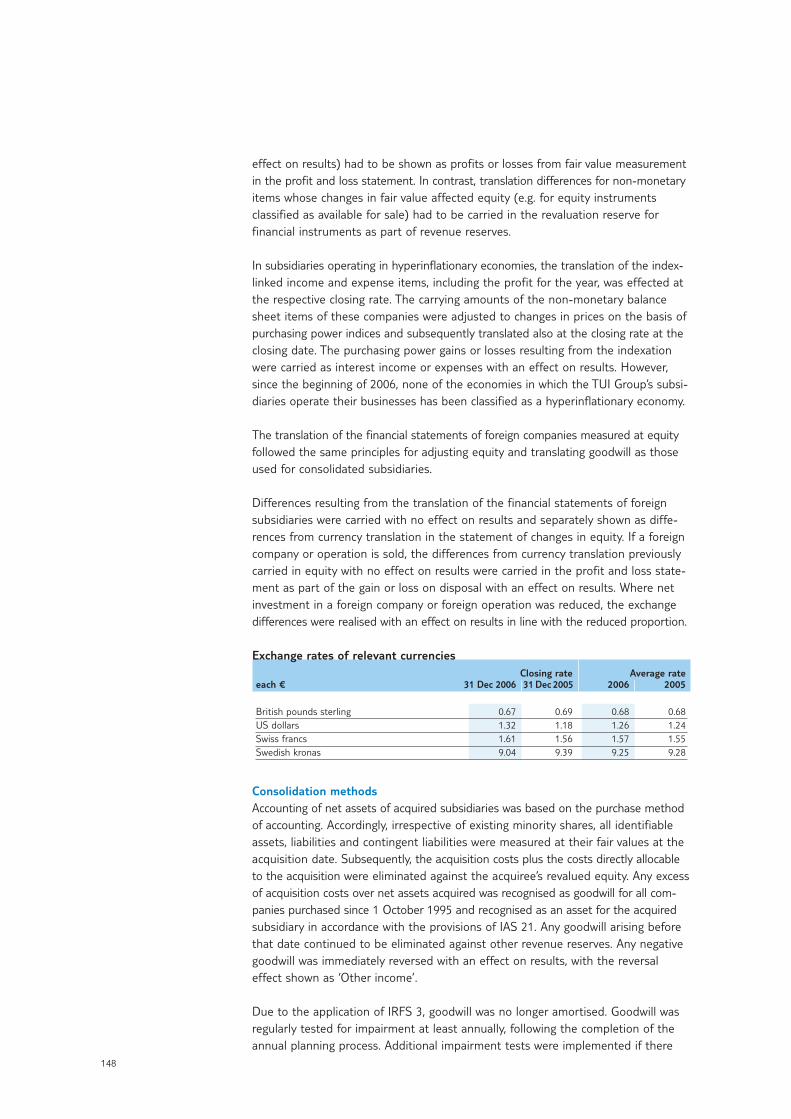
148
effect on results) had to be shown as profits or losses from fair value measurementin the profit and loss statement. In contrast, translation differences for non-monetaryitems whose changes in fair value affected equity (e.g. for equity instrumentsclassified as available for sale) had to be carried in the revaluation reserve forfinancial instruments as part of revenue reserves.
In subsidiaries operating in hyperinflationary economies, the translation of the index-linked income and expense items, including the profit for the year, was effected atthe respective closing rate. The carrying amounts of the non-monetary balancesheet items of these companies were adjusted to changes in prices on the basis ofpurchasing power indices and subsequently translated also at the closing rate at theclosing date. The purchasing power gains or losses resulting from the indexationwere carried as interest income or expenses with an effect on results. However,since the beginning of 2006, none of the economies in which the TUI Group’s subsi-diaries operate their businesses has been classified as a hyperinflationary economy.
The translation of the financial statements of foreign companies measured at equityfollowed the same principles for adjusting equity and translating goodwill as thoseused for consolidated subsidiaries.
Differences resulting from the translation of the financial statements of foreignsubsidiaries were carried with no effect on results and separately shown as diffe-rences from currency translation in the statement of changes in equity. If a foreigncompany or operation is sold, the differences from currency translation previouslycarried in equity with no effect on results were carried in the profit and loss state-ment as part of the gain or loss on disposal with an effect on results. Where netinvestment in a foreign company or foreign operation was reduced, the exchangedifferences were realised with an effect on results in line with the reduced proportion.
Exchange rates of relevant currenciesClosing rate Average rate
each € 31 Dec 2006 31 Dec 2005 2006 2005
British pounds sterling 0.67 0.69 0.68 0.68US dollars 1.32 1.18 1.26 1.24Swiss francs 1.61 1.56 1.57 1.55Swedish kronas 9.04 9.39 9.25 9.28
Consolidation methodsAccounting of net assets of acquired subsidiaries was based on the purchase methodof accounting. Accordingly, irrespective of existing minority shares, all identifiableassets, liabilities and contingent liabilities were measured at their fair values at theacquisition date. Subsequently, the acquisition costs plus the costs directly allocableto the acquisition were eliminated against the acquiree’s revalued equity. Any excessof acquisition costs over net assets acquired was recognised as goodwill for all com-panies purchased since 1 October 1995 and recognised as an asset for the acquiredsubsidiary in accordance with the provisions of IAS 21. Any goodwill arising beforethat date continued to be eliminated against other revenue reserves. Any negativegoodwill was immediately reversed with an effect on results, with the reversaleffect shown as ‘Other income’.
Due to the application of IRFS 3, goodwill was no longer amortised. Goodwill wasregularly tested for impairment at least annually, following the completion of theannual planning process. Additional impairment tests were implemented if there
Fina
ncia
l Sta
tem
ents
/Not
es
149
Notes Notes on the Principles and Methods Segment Reporting Notes on the Consolidated Profit and Loss Statement
Notes on the Consolidated Balance Sheet Major Shareholdings Notes on the Cash Flow Statement Other Notes
were any events or indications suggesting a potential impairment of goodwill.Transactions with minorities were treated as transactions with equity holders of theGroup. Goodwill, i. e. the difference between the acquisition costs and the interestin the carrying amount of the net assets of the subsidiary, arising in the frameworkof the acquisition of minority interests was directly eliminated against other reve-nue reserves. If minority interests were sold, the difference between the gain onthe disposal and the interest in the carrying amount was also offset against otherrevenue reserves.
In the event of step acquisitions, a complete fair value measurement of the assetsand liabilities of the acquired company was effected as at the date of each acquisitiontransaction. The goodwill to be recognised arose from the elimination of theacquisition cost against the acquiree’s revalued equity attributable to the acquiredshare at the respective acquisition date. Any changes in the fair values of assetsand liabilities arising in between the acquisition dates were taken to equity in theconsolidated balance sheet in line with the amount of holding which did not yetresult in a consolidation of the company and carried as a revaluation reserve withno effect on results. In the framework of the removal of a company from consoli-dation, this revaluation reserve was eliminated against other revenue reserves.
The difference between the income from the disposal of the subsidiary and propor-tionate Group equity, including differences from currency translation carried with noeffect on results, differences from the revaluation reserve, the revaluation reserve forfinancial assets as well as intercompany profits, was carried as a profit or loss from thedisposal of the subsidiary in the consolidated profit and loss statement as at the dis-posal date. This provision did not apply to actuarial gains or losses carried in Groupequity with no effect on results in accordance with IAS 19 in the framework of therecognition of pension provisions. In the disposal transaction, the goodwill allocable tothe subsidiaries was taken into account in determining the gains or losses on disposal.
The main associated companies and joint ventures of the Group were measured atequity and, at the acquisition date, carried at their acquisition costs. The Group’sshare in associated companies and joint ventures included the goodwill arising fromthe acquisition.
The Group’s share in the profits and losses of associated companies and joint ven-tures was carried in the profit and loss statement (result of companies measuredat equity) as of the acquisition date. The share in changes in reserves was carriedin Group revenue reserves. Cumulative post-acquisition changes were eliminatedagainst the carrying amount of the shareholding. Where the share in the loss of anassociated company or joint venture matched or exceeded the Group’s interest inthis company, including other unsecured receivables, as a matter of principles nomore losses are carried. Further losses were only carried if commitments had beenentered into for the associated company or joint venture, or if payments had beenmade for the company.
Intra-group receivables and liabilities or provisions were eliminated. Where the conditions for a consolidation of third-party liabilities were met, this consolidationmethod was applied. Intercompany profit from transactions between subsidiaries andcompanies measured at equity were eliminated in line with the Group’s interest inthe company. Intercompany losses were also eliminated where the transaction didnot indicate an impairment of the assets transferred. Where the accounting and
150
Realisation of income
Goodwill and other
intangible assets
measurement methods applied by associated companies and joint ventures differedfrom the Group-wide accounting standards and these deviations were accessible,adjustments were made.
Intercompany turnover and other income as well as the corresponding expenseswere eliminated. Intercompany profits and losses from intra-group deliveries orservices were eliminated with an effect on results, with deferred income taxes takeninto account. However, intercompany losses were taken as an indicator for the needto implement an impairment test for the asset transferred. Intra-group deliveries andservices were usually provided in conformity with the arm’s length principle. Inter-company profits from deliveries to and from companies measured at equity wereeliminated on the basis of the same principles when the corresponding facts wereknown.
Accounting and measurementThe financial statements of the companies included in the TUI Group were preparedin accordance with uniform accounting and measurement principles. The amountsstated in the consolidated financial statements were not determined by tax regula-tions but solely by the commercial presentation of the net worth and financialposition as set out in the rules of the IASB.
Turnover comprised the fair value of the consideration received or to be receivedfor the sale of products and services in the framework of ordinary business activities.Turnover was carried excluding value-added tax, returns, discounts and price rebatesand after elimination of intra-Group sales.
As a matter of principle, turnover and other income was carried upon rendering of the service or delivery of the assets and hence upon transfer of the risk.
The commission income from package tours sold by the travel agencies was recognised upon payment by the customers, but at the latest upon departure. Theservices of tour operators mainly consisted in the organisation and coordination ofpackage tours. Turnover from the organisation of tours was therefore fully recognisedupon the start of the tour. Turnover from individual travel modules directly bookedwith airlines, hotel companies and incoming agencies by the customers was realisedwhen the customers used the corresponding service.
Income from non-completed shipping tours was recognised according to the per-centage of completion at the balance sheet date. In container shipping, the percen-tage of completion corresponded to the relationship between the expenses alreadyincurred and the expected overall expense for the shipping tour. The realisation ofincome was based on the determined and constantly reviewed profit margins forthe individual trade lanes. In the cruise sector, the percentage of completion wasdetermined as the ratio between travel days completed by the balance sheet dateand overall travel days.
Interest income and expenses were reported on an accrual basis according to theeffective interest method. Dividends were reported when the legal claim had arisen.
Acquired intangible assets were carried at cost. Self-generated intangible assets,primarily software used by the Group itself, were capitalised at cost where aninflow of future economic benefits for the Group was probable and could be reliably
Fina
ncia
l Sta
tem
ents
/Not
es
151
Notes Notes on the Principles and Methods Segment Reporting Notes on the Consolidated Profit and Loss Statement
Notes on the Consolidated Balance Sheet Major Shareholdings Notes on the Cash Flow Statement Other Notes
Property, plant and equipment
measured. The cost of production comprised direct costs and directly allocable over-heads. Intangible assets with a limited service life were amortised over the expecteduseful life. Concessions and industrial property rights and similar rights and valueswere amortised over a period of up to 20 years. Software amortisation usuallycovered a period of up to three years, in exceptional cases of up to ten years. Intangible assets with an indefinite useful life were not amortised but had to betested for impairment at least annually. Additional impairment tests had to be con-ducted when there were any events or indications suggesting a potential impair-ment. Impairments were charged when the future recoverable amount from theasset was below its carrying amount. The recoverable amount of an asset was thefair value less cost to sell or the present value of future cash flows expected to arisefrom the asset (value in use), if higher. The Group’s intangible assets with an inde-finite useful life exclusively consisted of goodwill.
Impairment tests for goodwill were conducted on the basis of cash-generating units.According to the IASB rules, a cash-generating unit is the smallest identifiable groupof assets that generates cash inflows from continuing use that are largely independentof the cash inflows from other assets or groups of assets. In the tourism segment,cash-generating units were established for the individual source markets, i.e. forspecific countries, on the one hand and for individual subsidiaries in the touristdestinations on the other. The shipping segment was defined as one single cash-generating unit in its entirety.
In the framework of the impairment tests, the carrying amounts of the tested entitiesplus the allocated goodwill were compared with their value in use less expected coststo sell. The value in use less expected costs to sell is the amount that could begenerated for the cash-generating unit between knowledgeable, willing, independentbusiness partners after deduction of costs to sell. Details concerning the imple-mented impairment tests are outlined in note 7.
Where the original causes for impairments charged in previous years no longerapplied, the impairment was written back to other income. In accordance with IAS 36, write-backs of goodwill were not admissible.
Property, plant and equipment were recognised at amortised cost. The cost ofpurchase comprised all costs incurred to purchase an asset and bring it to workingcondition. The cost of production was determined on the basis of direct costs anddirectly allocable overheads and depreciation. The cost of finance for the acquisitionor the period of production was not capitalised.
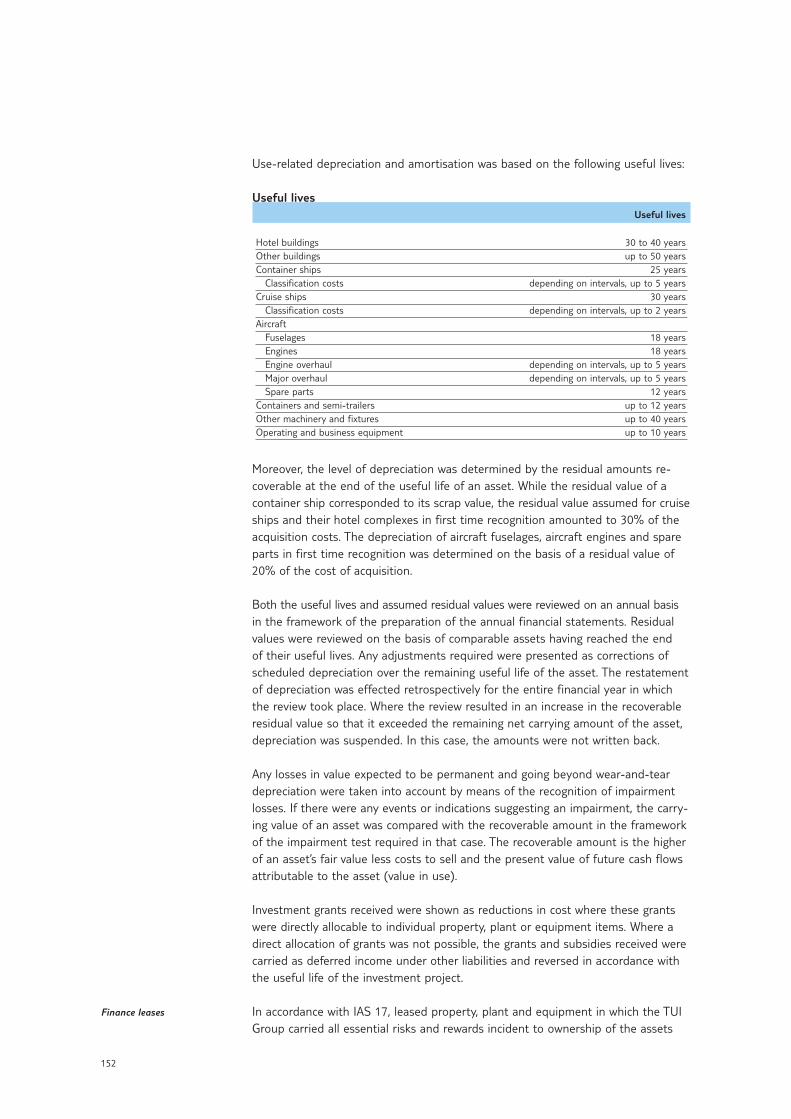
152
Finance leases
Use-related depreciation and amortisation was based on the following useful lives:
Useful livesUseful lives
Hotel buildings 30 to 40 yearsOther buildings up to 50 yearsContainer ships 25 years
Classification costs depending on intervals, up to 5 yearsCruise ships 30 years
Classification costs depending on intervals, up to 2 yearsAircraft
Fuselages 18 yearsEngines 18 yearsEngine overhaul depending on intervals, up to 5 yearsMajor overhaul depending on intervals, up to 5 yearsSpare parts 12 years
Containers and semi-trailers up to 12 yearsOther machinery and fixtures up to 40 yearsOperating and business equipment up to 10 years
Moreover, the level of depreciation was determined by the residual amounts re-coverable at the end of the useful life of an asset. While the residual value of acontainer ship corresponded to its scrap value, the residual value assumed for cruiseships and their hotel complexes in first time recognition amounted to 30% of theacquisition costs. The depreciation of aircraft fuselages, aircraft engines and spareparts in first time recognition was determined on the basis of a residual value of20% of the cost of acquisition.
Both the useful lives and assumed residual values were reviewed on an annual basisin the framework of the preparation of the annual financial statements. Residualvalues were reviewed on the basis of comparable assets having reached the end of their useful lives. Any adjustments required were presented as corrections ofscheduled depreciation over the remaining useful life of the asset. The restatementof depreciation was effected retrospectively for the entire financial year in whichthe review took place. Where the review resulted in an increase in the recoverableresidual value so that it exceeded the remaining net carrying amount of the asset,depreciation was suspended. In this case, the amounts were not written back.
Any losses in value expected to be permanent and going beyond wear-and-teardepreciation were taken into account by means of the recognition of impairmentlosses. If there were any events or indications suggesting an impairment, the carry-ing value of an asset was compared with the recoverable amount in the frameworkof the impairment test required in that case. The recoverable amount is the higherof an asset’s fair value less costs to sell and the present value of future cash flowsattributable to the asset (value in use).
Investment grants received were shown as reductions in cost where these grantswere directly allocable to individual property, plant or equipment items. Where adirect allocation of grants was not possible, the grants and subsidies received werecarried as deferred income under other liabilities and reversed in accordance withthe useful life of the investment project.
In accordance with IAS 17, leased property, plant and equipment in which the TUIGroup carried all essential risks and rewards incident to ownership of the assets
Fina
ncia
l Sta
tem
ents
/Not
es
153
Notes Notes on the Principles and Methods Segment Reporting Notes on the Consolidated Profit and Loss Statement
Notes on the Consolidated Balance Sheet Major Shareholdings Notes on the Cash Flow Statement Other Notes
Investment property
Financial assets
were capitalised. The capitalisation was based on the fair value of the asset or thepresent value of the minimum lease payments, if lower. Scheduled depreciationwas charged over the economic life or the lease term, if shorter, on the basis of thedepreciation method applicable to comparable purchased or manufactured assets.The payment obligations arising from future lease payments were carried as liabilities,with future interest expenses not taken into account. Every lease payment wasbroken down into an interest and a redemption portion so that the liability fromthe lease yielded constant interest. The interest portion was carried in the profitand loss statement with an effect on results.
Where companies of the TUI Group acted as lessors in finance leases, receivablesequivalent to the net investment value of the leases were carried. The periodicaldistribution of the income from finance leases resulted in constant interest pay-ments on the outstanding net investment volume of the leases over the course oftime. Rental income from operating leases was recognised on a straight-line basisover the term of the corresponding contracts.
Property not occupied for use by subsidiaries and exclusively held to generate rentalincome and capital gains was recognised at amortised cost. This property wasdepreciated over a period of up to 50 years.
Loans and receivables are non-derivative financial assets with fixed or fixable pay-ments not listed in an active market. Loans and receivables are shown under ‘Tradeaccounts receivable and other receivables’ in the balance sheet.
Financial assets measured at fair value with an effect on results were only held bythe Group in the form of derivative financial instruments exclusively held for trading.
Financial assets available for sale are non-derivative financial assets either allocatedto this category or could not be allocated to any other category of financial assets.They have to be allocated to non-current assets if the management does not intendto sell them within twelve months after the balance sheet date. The financial assetsallocated to this category were shares and securities held.
Financial assets were recognised at the trade date, on which the Group committedto buy or sell the asset. Loans and receivables as well as financial assets availablefor sale were at the beginning carried at fair value plus transaction costs. The assetsare derecognised as at the date on which the rights for payments from the assetcease or are transferred and therefore as at the date essentially all risks andrewards are transferred associated with ownership are transferred. Financial assetsavailable for sale were measured at their fair value after their first time recognition.Changes in the fair value were carried in equity with no effect on results until thedisposal of the asset. A permanent reduction in fair value gave rise to impairmentswith an effect on results. In the event of subsequent reversal of the impairment, theimpairment carried with an effect on results was not reversed for equity instrumentsbut eliminated against equity with no effect on results. Where a listed market pricein an active market was not available for shares held and other methods to deter-mine the objective market value were not applicable, the shares were measured atamortised cost. Loans and receivables were recognised at amortised cost based onthe effective interest method.
154
Derivative financial
instruments and hedging
Trade accounts receivable
In the framework of initial measurement, derivative financial instruments weremeasured at the fair value attributable to them on the day of the conclusion of theagreement. The follow-up measurement was also effected at the fair value applicableat the respective balance sheet date. The method applied in recording profits andlosses depended on whether the derivative financial instrument was classified as ahedge, and on the type of hedged item. As a matter of principle, the Group classifiesderivative financial instruments either as fair value hedges to hedge exposure tochanges in the fair value of assets or liabilities or as cash flow hedges to hedgeexposure to risks of varying cash flows from higly probable future transactions.
Upon conclusion of the transaction, the Group documents the hedging relationshipbetween the hedge and the underlying item, the risk management goal and thestrategy pursued in entering into the hedges. In addition, an assessment is madeboth at the beginning of the hedge relationship and on a continual basis as towhether the derivatives used for the hedge compensate for the changes in the fairvalues or cash flows of the underlying transactions in a highly effective manner.Derivative financial instruments held for trading were carried as current assets orliabilities.
The changes in the fair value of derivatives designated to hedge exposure to chan-ges in the fair value and qualify the hedge as a fair value hedge were carried in theprofit and loss statement together with the changes in the fair value of the hedgedassets or liabilities allocable to the hedged risk. If the conditions for hedge accountingwere no longer met and the previously designated underlying item was measured bymeans of the effective interest method, the necessary adjustment of the carryingamount of the underlying transaction had to be effected over its remaining term.
The effective part of changes in the fair value of derivatives drawn to hedge thecash flow and qualify as cash flow hedges was recognised in equity. The ineffectivepart of such changes in the fair value, in contrast, was taken directly to the profitand loss statement with an effect on results. Amounts taken to equity were reclas-sified into the profit and loss statement and carried as income or expenses in theperiod in which the underlying transaction had an effect on results. Where a hed-ged future transaction resulted in the recognition of a non-financial asset or a non-financial liability, the profits or losses previously carried in equity were included inthe first time measurement of the cost of the asset or liability.
If a hedge expired, was sold or no longer met the criteria for hedge accounting, theprofit or loss previously in equity by then remained in equity and was only carriedin the profit and loss statement with an effect on results if the originally hedgedfuture transaction occurred. If the future transaction was no longer expected tooccur, the cumulative profits or losses recognised in equity immediately had to bereclassified with an effect on results.
Changes in the fair values of derivative financial instruments not achieving the criteriafor hedge accounting were directly carried in the profit and loss statement with aneffect on results.
Trade accounts receivable were at the beginning initially carried at their fair valueand subsequently measured at amortised cost on the basis of the effective interestmethod and the deduction of impairments. An impairment of trade accounts recei-vable was carried if objective indications suggested that the amounts receivable
Fina
ncia
l Sta
tem
ents
/Not
es
155
Notes Notes on the Principles and Methods Segment Reporting Notes on the Consolidated Profit and Loss Statement
Notes on the Consolidated Balance Sheet Major Shareholdings Notes on the Cash Flow Statement Other Notes
Inventories
Cash and cash equivalents
Hybrid capital
Provisions
and due were not fully matched. The impaired amount was carried under ‘Otherexpenses’ with an effect on results.
Inventories were measured at the lower of cost or net realisable value. Net realisablevalue was the estimated selling price less the estimated cost incurred until the saleand the estimated variable costs required to sell. All inventories were written downindividually where the net realisable value of inventories was lower than their carry-ing amounts. Where the original causes of inventory write-downs no longer applied,the write-downs were reversed. The measurement method applied to similar inven-tory items was the weighted average cost formula.
Cash and cash equivalents comprised cash, sight deposits, other current highlyliquid financial assets with an original term of a maximum three months and currentaccounts. Used credits in current accounts were shown as liabilities to banks undercurrent financial liabilities.
In accordance with IAS 32, the bond terms of the hybrid capital issued as at theend of the 2005 financial year resulted in recognition as an equity component forthe Group. Accordingly, the tax-deductible interest payments were not shownunder interest expenses but were treated in analogy to dividend obligations to theshareholders. The costs of equity raising were directly deducted from the hybridcapital, taking account of deferred income taxes.
Provisions were formed where the Group had a current legal or constructive obligationresulting from a past event and where in addition it was probable that the paymentof the obligation would impact assets and the level of the provision could be reliablydetermined. Provisions for restructurings comprised payments for the premature ter-mination of rental agreements and severance payments to employees. No provisionswere carried for future operating losses.
Where a large number of similar obligations existed – such as in the event of legalguarantees and warranties – the probability of a burden on assets was determinedon the basis of this group of obligations. A provision was also carried under liabilitiesif the probability of a burden on assets was low in relation to a single obligationcontained in this group.
Provisions were measured at the net present value of the expected expenses withan interest rate before taxes taking account of current market expectations concern-ing the interest effect and the specific risks related to the obligation. The increasein the provisions due to the passage of time were carried as interest expenses withan effect on results.
The pension provision recognised for defined benefit plans corresponded to the netpresent value of the defined benefit obligations (DBOs) at the balance sheet date lessthe fair value of the plan assets. Actuarial gains and losses arising from the regular ad-justment of actuarial parameters were eliminated against equity when they occurredwith no effect on results. The DBOs are calculated on an annual basis by indepen-dent actuarial experts on the basis of the projected unit credit method. The netpresent value of the DBO is calculated by discounting the expected future outflowsof cash with the interest rate of high-quality corporate bonds.
156
Share-based payments
Liabilities
Deferred income taxes
Past service cost was immediately recognised with an effect on results if the changesin the pension plan did not depend on the employee remaining in the company fora defined period of time (period until non-forfeitability). In this case, the past servicecost was recognised with an effect on results on a straight line basis over the perioduntil the commencement of non-forfeitability.
For defined contribution plans, the Group pays contributions to public, contractualor private pension insurance plans on the basis of a statutory or contractual obligationor on a voluntary basis. The Group does not have any further payment obligationsbeyond the payment of the contributions. The contributions were carried underpersonnel costs when they fell due.
All share-based payment schemes existing in the Group were payment schemespaid in cash. At the date of the performance by the beneficiary, the resulting liabilityfor the Group was carried at its fair value. Until the liability was paid, the fair valueof the liability was remeasured at every reporting date and all changes in the fairvalue were carried with an effect on results.
As a matter of principle, liabilities were carried at the date on which they arose atthe fair value less the costs of borrowing and transaction costs. Over the course oftime, liabilities were measured at amortised cost based on the effective interest method.
When issuing bonds comprising both a pure dept component but also a secondcomponent in the form of conversion options or warrants, the funds ob-tained forthe respective components were recognised in accordance with their character. Atthe issuing date, the dept component was carried as a bond at a value that wouldhave been generated for the issue of this dept instrument without correspondingconversion options or warrants on the basis of existing market terms. Where theconversion options or warrants had to be classified as equity instruments, the diffe-rence compared with the issuing proceeds generated was transferred to the capitalreserve with deferred taxes taken into account. With effect from 3 April 2006, TUI AGirrevocably waived its unilateral option of paying cash in the event of an exercise ofthe conversion options from the convertible bond issued in October 2003, and therefore the conversion options have been treated as equity instruments sincethe waiver date.
Currency differences resulting from the translation of trade accounts receivablewere reported as a correction of the cost of purchased services and materials. Currency differences from the translation of liabilities not resulting from normalperformance processes were carried under other income and expenses.
Deferred taxes were carried for all temporary differences between the tax base ofthe assets/liabilities and their carrying amounts in the Group’s statements (liabilitymethod). However, if a transaction is shown as something other than a businessacquisition a deferred tax arises from the first time recognition of an asset or a liabilitywhich does not have an effect on profit of loss in the balance sheet or the taxbalance sheet at the transaction date, tax deferral was not effected. Deferred taxeswere measured on the basis of the tax rates (and tax provisions) which were appli-cable at the balance sheet date or had been adopted as law expected to be appli-cable at the realisation date of the deferred tax claim or the payment of the deferredtax liability.
Fina
ncia
l Sta
tem
ents
/Not
es
157
Notes Notes on the Principles and Methods Segment Reporting Notes on the Consolidated Profit and Loss Statement
Notes on the Consolidated Balance Sheet Major Shareholdings Notes on the Cash Flow Statement Other Notes
Essential assumptions and
estimates
Deferred tax claims were carried to the extent to which it was probable that taxableprofit would be available against which the temporary difference could be used.
Deferred tax liabilities arising from temporary differences in connection with parti-cipations in associated companies, joint ventures and subsidiaries were carriedunless the date of the reversal of the temporary differences could be determinedby the Group and it was probable that the temporary differences would thereforenot reverse in the foreseeable future.
Income tax provisions were offset against the corresponding tax refund claims wherethey existed in the same fiscal territory and had the same nature and maturity.
All estimates and judgments were constantly revalued and were based on pastexperience and other factors, including expectations concerning future events.
Goodwill was tested for impairment as at the balance sheet date. Details concer-ning the implementation of goodwill impairments tests are provided in note 7.
The determination of the present value of pension obligations largely depends onthe selection of the discount rate, determined at the end of each year. The discountrate used was the interest rate of high-quality corporate bonds that were denominatedin the currency in which the benefits will be paid, and that had terms to maturityapproximating the terms of the related pension liability. Detailed information isprovided in the explanations on recognised pension provisions in note 34.
The Group was liable to pay income taxes in numerous countries. Significant assump-tions were required in determining the worldwide provision for income taxes. Therewere transactions and calculations for which the ultimate tax determination wasuncertain during the ordinary course of business. The level of provisions for antici-pated tax audits was based on estimates of whether and to what extent additionalincome taxes will be due. In the period in which the final tax determination wasmade, the estimates were corrected, if required.
Other essential assumptions and estimates related to the determination of usefullives and recoverable residual values of property, plant and equipment. The deter-mined useful lives and residual values were reviewed at least annually. Details onuseful lives and residual values of property, plant and equipment are provided inthe section on ‘Property, plant and equipment’ in the chapter on ‘Accounting andmeasurement methods’.
In accounting for business combinations, the identifiable assets acquired and liabilitiesand contingent liabilities assumed were measured initially at their fair values. In thisprocess, cash flow-based methods were regularly used, which may produce diffe-rent results based on the underlying assumptions. In particular, the assessment ofthe useful lives of intangible assets and the determination of fair values of contingentliabilities entailed an element of uncertainty since assumptions needed to be made.
158
Segment reporting
Notes on the segmentsIn primary segment reporting, the individual companies of the TUI Group were attri-buted to the business segments, with tourism and shipping representing the Group’score businesses. Following the divestment of Wolf GmbH, the segment ‘Other operat-ing sectors’ exclusively consisted of the Group’s real estate companies. TUI AG assumesboth cross-divisional tasks such as finance, tax and legal, but also operating tasksfor the tourism division. In this connection, TUI AG in particular acquired ownershipin aircraft and container ships, passed on to the Group’s airlines and shipping com-panies in the framework of operating leases. For the purposes of segment reporting,economic ownership was allocated to the operating companies so that the aircraftand ships represented assets of the tourism and shipping segments. Correspondingexpenses and income were also allocated to the segments. The remaining operationsof TUI AG and other holding companies not unambiguously allocable to other seg-ments were pooled as non-allocable business operations (holdings).
Group segmentation was based on internal corporate control. The individual com-panies were allocated to the divisions and sectors based on economic criteria alone,irrespective of their participation structure under company law.
The tourism division covered all tourism companies of the Group with the excep-tion of Hapag-Lloyd Kreuzfahrten, covered by the shipping division as its entrepre-neurial management was effected by Hapag-Lloyd AG. The further classification ofthe tourism segment into the five sectors Central Europe, Northern Europe, WesternEurope, Destinations and Other tourism activities mainly followed geographicalaspects and the respective functions within the value chain.
The Central Europe sector comprised the distribution and tour operator activitiesin Germany, Switzerland, Austria and Poland as well as airlines Hapag-Lloyd Flug-gesellschaft mbH and Hapag-Lloyd Express GmbH. The Northern Europe sectorcovered the travel agencies and tour operators in the UK and Ireland, the Nordiccountries Sweden, Denmark, Norway and Finland as well as the airlines ThomsonflyLimited, TUIfly Nordic AB and Budget Air Ltd. The Western Europe sector comprisedthe distribution and tour operator activities in France, the Netherlands and Bel-gium as well as the airlines Corsair S.A., TUI Airlines Nederland B.V. and TUI AirlinesBelgium N.V. The destinations sector included the Group’s incoming agencies andhotel companies. The ‘Other tourism’ sector primarily comprised the business travelactivities, only included on a pro rata temporis basis due to the divestment, and com-panies providing central services for the division until the date of disposal of thesecompanies.
The shipping division covered both container shipping and cruise activities. In thecontainer shipping sector, Hapag-Lloyd and CP Ships did not only offer pure con-tainer shipping operations but in particular also door-to-door container transportservices. Using subcontractors, they thus offered services at all stages of the trans-port chain.
The Group’s discontinuing operations remaining at the end of the 2005 financial year,the US steel service companies, were sold in May of 2006. Rail and tank containerlogistics were already sold in the 2005 financial year.
Fina
ncia
l Sta
tem
ents
/Not
es
159
Notes Notes on the Principles and Methods Segment Reporting Notes on the Consolidated Profit and Loss Statement
Notes on the Consolidated Balance Sheet Major Shareholdings Notes on the Cash Flow Statement Other Notes
In secondary segment reporting, the Group’s business activities were broken downaccording to geographical criteria.
Notes on the segment dataAs a rule, inter-segment turnover was generated in line with the arm’s length prin-ciple, applied in transactions with third parties.
The operating segment assets and liabilities comprised the assets or liabilities, ex-cluding financial assets, financial liabilities and pension provisions as well as incometaxes. Goodwill was also shown as segment assets.
Investments were additions of property, plant and equipment as well as intangibleassets. Depreciation was related to segment assets and also included impairmentson goodwill.
Depreciation was not taken into account in the determination of non-cash expenses.
Earnings form the divestment of subsidiaries were allocated to the individual segmentearnings. The realisation of differences from currency translation with an effect onresults, effected in connection with capital reductions, was assessed as related tothe holding activities and therefore allocated to the holding companies in the segmentreport.
Financial assets as well as cash and cash equivalents were used to generate thefinancial result. Financial liabilities including pension provisions were carried asinterest-bearing liabilities and were used to finance the operating and investingactivities.
The reconciliation of segment assets and liabilities to the Group’s assets or liabilitiesresulted from the consideration of the income tax claims or income tax provisionsand liabilities not taken into account in accordance with IAS 14.
Segment reporting disclosed earnings indicators such as EBT, EBIT, EBITA, EBITDAand EBITDAR since these ratios were also used as the control basis for value-drivencorporate management. In determining the ratios of the discontinuing operations,the result from discontinuing operations was reallocated to the original positions ofincome and expenses.
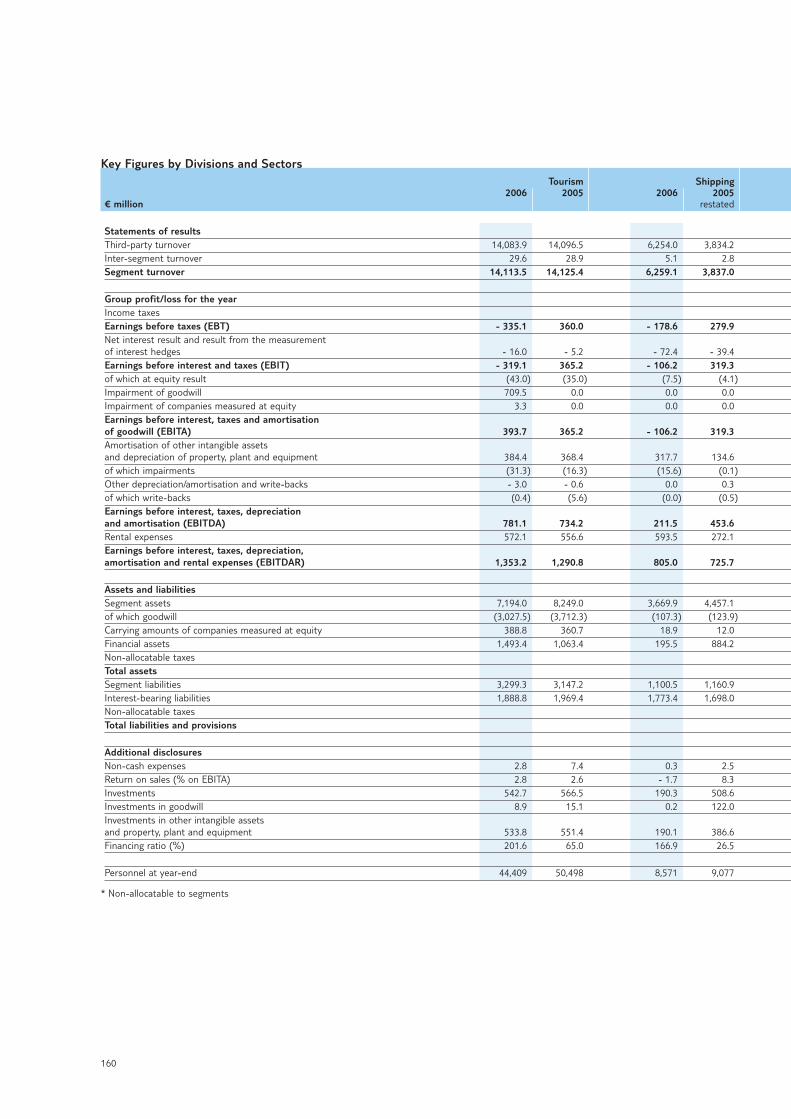
160
Key Figures by Divisions and SectorsTourism Shipping
2006 2005 2006 2005€ million restated
Statements of resultsThird-party turnover 14,083.9 14,096.5 6,254.0 3,834.2Inter-segment turnover 29.6 28.9 5.1 2.8Segment turnover 14,113.5 14,125.4 6,259.1 3,837.0
Group profit/loss for the yearIncome taxesEarnings before taxes (EBT) - 335.1 360.0 - 178.6 279.9Net interest result and result from the measurementof interest hedges - 16.0 - 5.2 - 72.4 - 39.4Earnings before interest and taxes (EBIT) - 319.1 365.2 - 106.2 319.3of which at equity result (43.0) (35.0) (7.5) (4.1)Impairment of goodwill 709.5 0.0 0.0 0.0Impairment of companies measured at equity 3.3 0.0 0.0 0.0Earnings before interest, taxes and amortisationof goodwill (EBITA) 393.7 365.2 - 106.2 319.3Amortisation of other intangible assets and depreciation of property, plant and equipment 384.4 368.4 317.7 134.6of which impairments (31.3) (16.3) (15.6) (0.1)Other depreciation/amortisation and write-backs - 3.0 - 0.6 0.0 0.3of which write-backs (0.4) (5.6) (0.0) (0.5)Earnings before interest, taxes, depreciationand amortisation (EBITDA) 781.1 734.2 211.5 453.6Rental expenses 572.1 556.6 593.5 272.1Earnings before interest, taxes, depreciation,amortisation and rental expenses (EBITDAR) 1,353.2 1,290.8 805.0 725.7
Assets and liabilitiesSegment assets 7,194.0 8,249.0 3,669.9 4,457.1of which goodwill (3,027.5) (3,712.3) (107.3) (123.9)Carrying amounts of companies measured at equity 388.8 360.7 18.9 12.0Financial assets 1,493.4 1,063.4 195.5 884.2Non-allocatable taxesTotal assetsSegment liabilities 3,299.3 3,147.2 1,100.5 1,160.9Interest-bearing liabilities 1,888.8 1,969.4 1,773.4 1,698.0Non-allocatable taxesTotal liabilities and provisions
Additional disclosuresNon-cash expenses 2.8 7.4 0.3 2.5Return on sales (% on EBITA) 2.8 2.6 - 1.7 8.3Investments 542.7 566.5 190.3 508.6Investments in goodwill 8.9 15.1 0.2 122.0Investments in other intangible assetsand property, plant and equipment 533.8 551.4 190.1 386.6Financing ratio (%) 201.6 65.0 166.9 26.5
Personnel at year-end 44,409 50,498 8,571 9,077
* Non-allocatable to segments
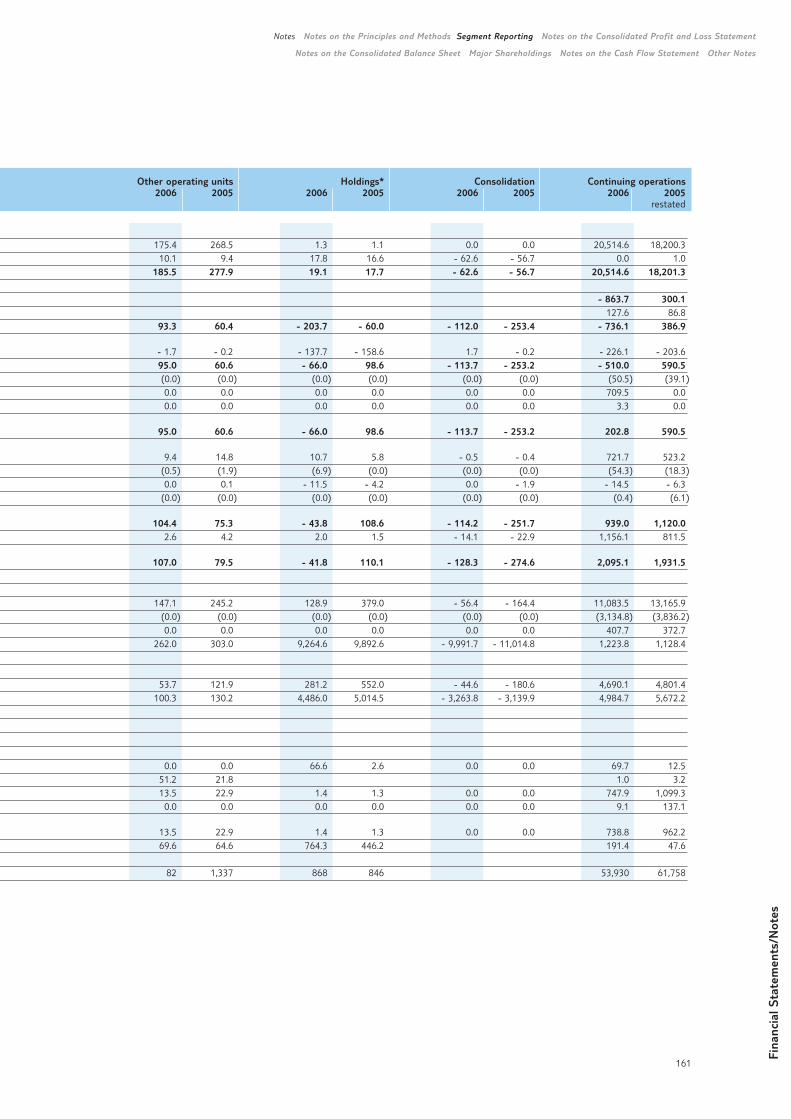
Fina
ncia
l Sta
tem
ents
/Not
es
161
Notes Notes on the Principles and Methods Segment Reporting Notes on the Consolidated Profit and Loss Statement
Notes on the Consolidated Balance Sheet Major Shareholdings Notes on the Cash Flow Statement Other Notes
Other operating units Holdings* Consolidation Continuing operations2006 2005 2006 2005 2006 2005 2006 2005
restated
175.4 268.5 1.3 1.1 0.0 0.0 20,514.6 18,200.310.1 9.4 17.8 16.6 - 62.6 - 56.7 0.0 1.0
185.5 277.9 19.1 17.7 - 62.6 - 56.7 20,514.6 18,201.3
- 863.7 300.1127.6 86.8
93.3 60.4 - 203.7 - 60.0 - 112.0 - 253.4 - 736.1 386.9
- 1.7 - 0.2 - 137.7 - 158.6 1.7 - 0.2 - 226.1 - 203.695.0 60.6 - 66.0 98.6 - 113.7 - 253.2 - 510.0 590.5(0.0) (0.0) (0.0) (0.0) (0.0) (0.0) (50.5) (39.1)0.0 0.0 0.0 0.0 0.0 0.0 709.5 0.00.0 0.0 0.0 0.0 0.0 0.0 3.3 0.0
95.0 60.6 - 66.0 98.6 - 113.7 - 253.2 202.8 590.5
9.4 14.8 10.7 5.8 - 0.5 - 0.4 721.7 523.2(0.5) (1.9) (6.9) (0.0) (0.0) (0.0) (54.3) (18.3)0.0 0.1 - 11.5 - 4.2 0.0 - 1.9 - 14.5 - 6.3
(0.0) (0.0) (0.0) (0.0) (0.0) (0.0) (0.4) (6.1)
104.4 75.3 - 43.8 108.6 - 114.2 - 251.7 939.0 1,120.02.6 4.2 2.0 1.5 - 14.1 - 22.9 1,156.1 811.5
107.0 79.5 - 41.8 110.1 - 128.3 - 274.6 2,095.1 1,931.5
147.1 245.2 128.9 379.0 - 56.4 - 164.4 11,083.5 13,165.9(0.0) (0.0) (0.0) (0.0) (0.0) (0.0) (3,134.8) (3,836.2)0.0 0.0 0.0 0.0 0.0 0.0 407.7 372.7
262.0 303.0 9,264.6 9,892.6 - 9,991.7 - 11,014.8 1,223.8 1,128.4
53.7 121.9 281.2 552.0 - 44.6 - 180.6 4,690.1 4,801.4100.3 130.2 4,486.0 5,014.5 - 3,263.8 - 3,139.9 4,984.7 5,672.2
0.0 0.0 66.6 2.6 0.0 0.0 69.7 12.551.2 21.8 1.0 3.213.5 22.9 1.4 1.3 0.0 0.0 747.9 1,099.30.0 0.0 0.0 0.0 0.0 0.0 9.1 137.1
13.5 22.9 1.4 1.3 0.0 0.0 738.8 962.269.6 64.6 764.3 446.2 191.4 47.6
82 1,337 868 846 53,930 61,758
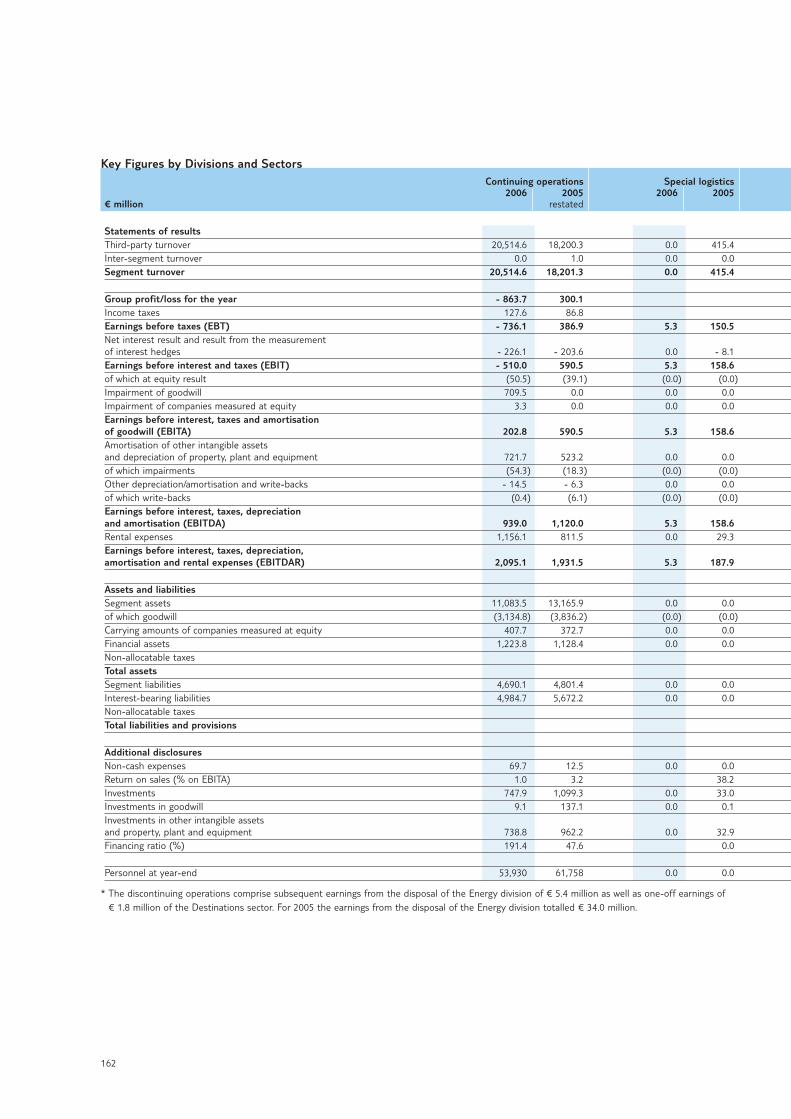
162
Key Figures by Divisions and SectorsContinuing operations Special logistics
2006 2005 2006 2005€ million restated
Statements of resultsThird-party turnover 20,514.6 18,200.3 0.0 415.4Inter-segment turnover 0.0 1.0 0.0 0.0Segment turnover 20,514.6 18,201.3 0.0 415.4
Group profit/loss for the year - 863.7 300.1Income taxes 127.6 86.8Earnings before taxes (EBT) - 736.1 386.9 5.3 150.5Net interest result and result from the measurementof interest hedges - 226.1 - 203.6 0.0 - 8.1Earnings before interest and taxes (EBIT) - 510.0 590.5 5.3 158.6of which at equity result (50.5) (39.1) (0.0) (0.0)Impairment of goodwill 709.5 0.0 0.0 0.0Impairment of companies measured at equity 3.3 0.0 0.0 0.0Earnings before interest, taxes and amortisationof goodwill (EBITA) 202.8 590.5 5.3 158.6Amortisation of other intangible assets and depreciation of property, plant and equipment 721.7 523.2 0.0 0.0of which impairments (54.3) (18.3) (0.0) (0.0)Other depreciation/amortisation and write-backs - 14.5 - 6.3 0.0 0.0of which write-backs (0.4) (6.1) (0.0) (0.0)Earnings before interest, taxes, depreciationand amortisation (EBITDA) 939.0 1,120.0 5.3 158.6Rental expenses 1,156.1 811.5 0.0 29.3Earnings before interest, taxes, depreciation,amortisation and rental expenses (EBITDAR) 2,095.1 1,931.5 5.3 187.9
Assets and liabilitiesSegment assets 11,083.5 13,165.9 0.0 0.0of which goodwill (3,134.8) (3,836.2) (0.0) (0.0)Carrying amounts of companies measured at equity 407.7 372.7 0.0 0.0Financial assets 1,223.8 1,128.4 0.0 0.0Non-allocatable taxesTotal assetsSegment liabilities 4,690.1 4,801.4 0.0 0.0Interest-bearing liabilities 4,984.7 5,672.2 0.0 0.0Non-allocatable taxesTotal liabilities and provisions
Additional disclosuresNon-cash expenses 69.7 12.5 0.0 0.0Return on sales (% on EBITA) 1.0 3.2 38.2Investments 747.9 1,099.3 0.0 33.0Investments in goodwill 9.1 137.1 0.0 0.1Investments in other intangible assetsand property, plant and equipment 738.8 962.2 0.0 32.9Financing ratio (%) 191.4 47.6 0.0
Personnel at year-end 53,930 61,758 0.0 0.0
* The discontinuing operations comprise subsequent earnings from the disposal of the Energy division of € 5.4 million as well as one-off earnings of€ 1.8 million of the Destinations sector. For 2005 the earnings from the disposal of the Energy division totalled € 34.0 million.
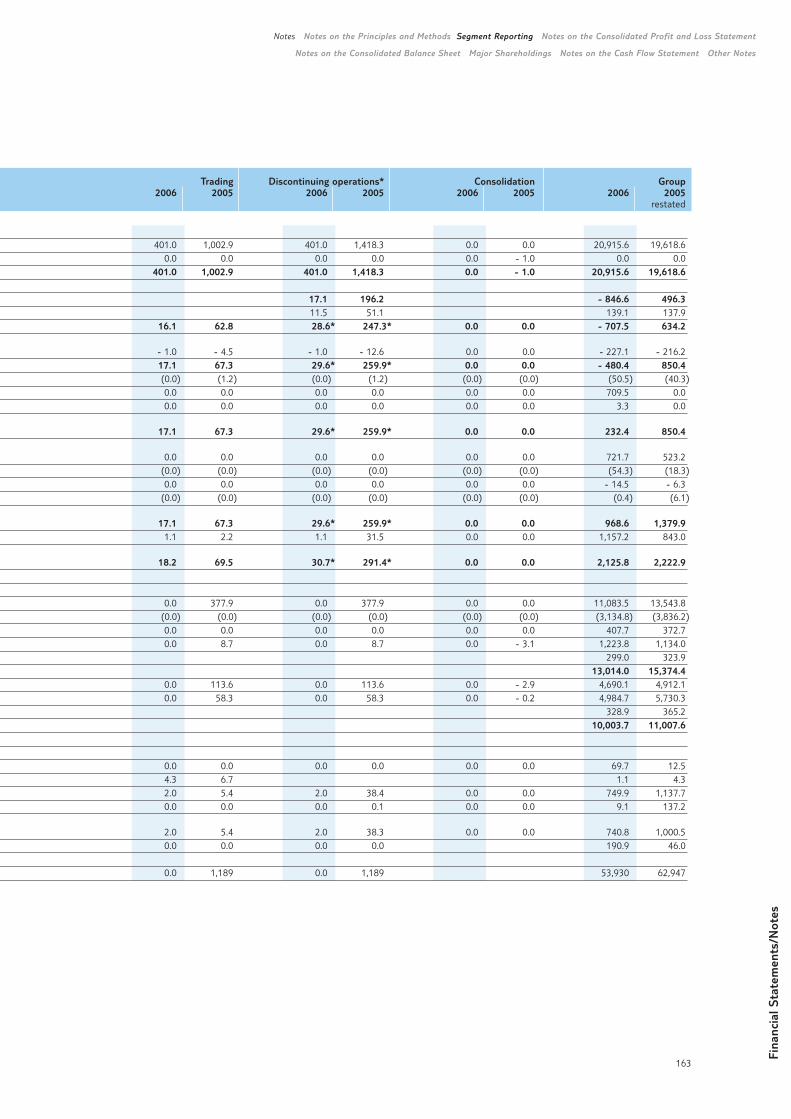
Fina
ncia
l Sta
tem
ents
/Not
es
163
Notes Notes on the Principles and Methods Segment Reporting Notes on the Consolidated Profit and Loss Statement
Notes on the Consolidated Balance Sheet Major Shareholdings Notes on the Cash Flow Statement Other Notes
Trading Discontinuing operations* Consolidation Group2006 2005 2006 2005 2006 2005 2006 2005
restated
401.0 1,002.9 401.0 1,418.3 0.0 0.0 20,915.6 19,618.60.0 0.0 0.0 0.0 0.0 - 1.0 0.0 0.0
401.0 1,002.9 401.0 1,418.3 0.0 - 1.0 20,915.6 19,618.6
17.1 196.2 - 846.6 496.311.5 51.1 139.1 137.9
16.1 62.8 28.6* 247.3* 0.0 0.0 - 707.5 634.2
- 1.0 - 4.5 - 1.0 - 12.6 0.0 0.0 - 227.1 - 216.217.1 67.3 29.6* 259.9* 0.0 0.0 - 480.4 850.4(0.0) (1.2) (0.0) (1.2) (0.0) (0.0) (50.5) (40.3)0.0 0.0 0.0 0.0 0.0 0.0 709.5 0.00.0 0.0 0.0 0.0 0.0 0.0 3.3 0.0
17.1 67.3 29.6* 259.9* 0.0 0.0 232.4 850.4
0.0 0.0 0.0 0.0 0.0 0.0 721.7 523.2(0.0) (0.0) (0.0) (0.0) (0.0) (0.0) (54.3) (18.3)0.0 0.0 0.0 0.0 0.0 0.0 - 14.5 - 6.3
(0.0) (0.0) (0.0) (0.0) (0.0) (0.0) (0.4) (6.1)
17.1 67.3 29.6* 259.9* 0.0 0.0 968.6 1,379.91.1 2.2 1.1 31.5 0.0 0.0 1,157.2 843.0
18.2 69.5 30.7* 291.4* 0.0 0.0 2,125.8 2,222.9
0.0 377.9 0.0 377.9 0.0 0.0 11,083.5 13,543.8(0.0) (0.0) (0.0) (0.0) (0.0) (0.0) (3,134.8) (3,836.2)0.0 0.0 0.0 0.0 0.0 0.0 407.7 372.70.0 8.7 0.0 8.7 0.0 - 3.1 1,223.8 1,134.0
299.0 323.913,014.0 15,374.4
0.0 113.6 0.0 113.6 0.0 - 2.9 4,690.1 4,912.10.0 58.3 0.0 58.3 0.0 - 0.2 4,984.7 5,730.3
328.9 365.210,003.7 11,007.6
0.0 0.0 0.0 0.0 0.0 0.0 69.7 12.54.3 6.7 1.1 4.32.0 5.4 2.0 38.4 0.0 0.0 749.9 1,137.70.0 0.0 0.0 0.1 0.0 0.0 9.1 137.2
2.0 5.4 2.0 38.3 0.0 0.0 740.8 1,000.50.0 0.0 0.0 0.0 190.9 46.0
0.0 1,189 0.0 1,189 53,930 62,947
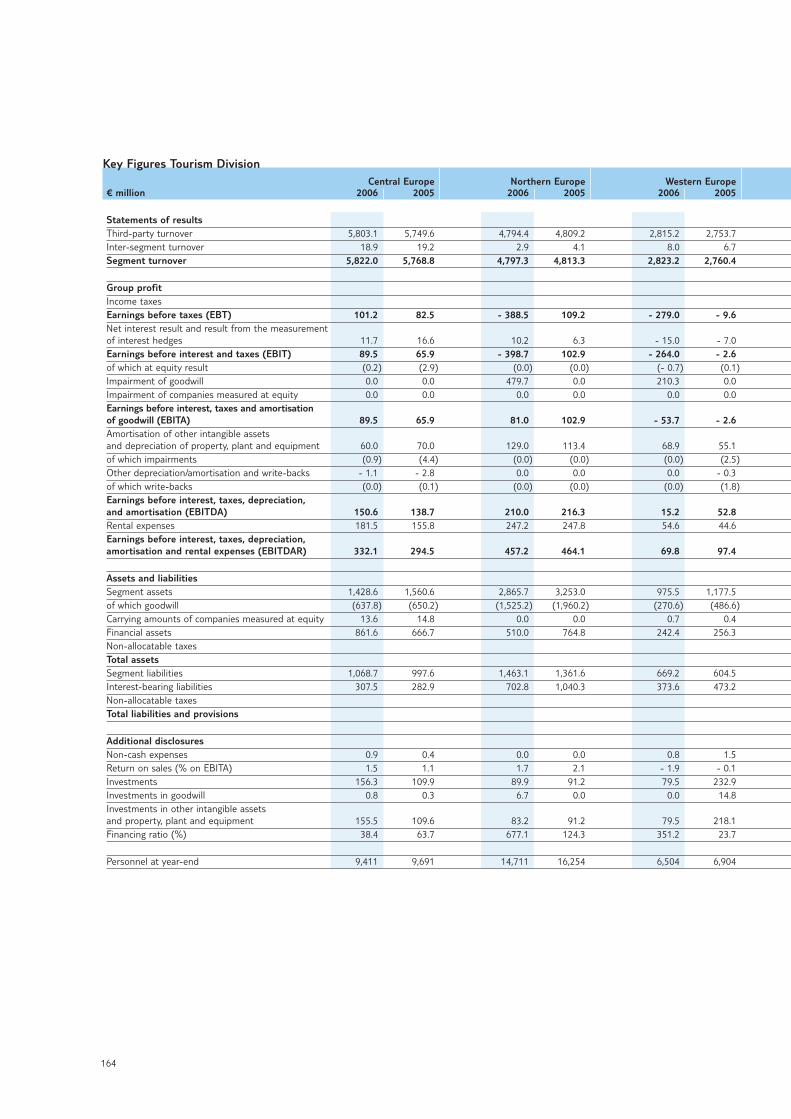
164
Key Figures Tourism DivisionCentral Europe Northern Europe Western Europe
€ million 2006 2005 2006 2005 2006 2005
Statements of resultsThird-party turnover 5,803.1 5,749.6 4,794.4 4,809.2 2,815.2 2,753.7Inter-segment turnover 18.9 19.2 2.9 4.1 8.0 6.7Segment turnover 5,822.0 5,768.8 4,797.3 4,813.3 2,823.2 2,760.4
Group profitIncome taxesEarnings before taxes (EBT) 101.2 82.5 - 388.5 109.2 - 279.0 - 9.6Net interest result and result from the measurementof interest hedges 11.7 16.6 10.2 6.3 - 15.0 - 7.0Earnings before interest and taxes (EBIT) 89.5 65.9 - 398.7 102.9 - 264.0 - 2.6of which at equity result (0.2) (2.9) (0.0) (0.0) (- 0.7) (0.1)Impairment of goodwill 0.0 0.0 479.7 0.0 210.3 0.0Impairment of companies measured at equity 0.0 0.0 0.0 0.0 0.0 0.0Earnings before interest, taxes and amortisationof goodwill (EBITA) 89.5 65.9 81.0 102.9 - 53.7 - 2.6Amortisation of other intangible assets and depreciation of property, plant and equipment 60.0 70.0 129.0 113.4 68.9 55.1of which impairments (0.9) (4.4) (0.0) (0.0) (0.0) (2.5)Other depreciation/amortisation and write-backs - 1.1 - 2.8 0.0 0.0 0.0 - 0.3of which write-backs (0.0) (0.1) (0.0) (0.0) (0.0) (1.8)Earnings before interest, taxes, depreciation,and amortisation (EBITDA) 150.6 138.7 210.0 216.3 15.2 52.8Rental expenses 181.5 155.8 247.2 247.8 54.6 44.6Earnings before interest, taxes, depreciation,amortisation and rental expenses (EBITDAR) 332.1 294.5 457.2 464.1 69.8 97.4
Assets and liabilitiesSegment assets 1,428.6 1,560.6 2,865.7 3,253.0 975.5 1,177.5of which goodwill (637.8) (650.2) (1,525.2) (1,960.2) (270.6) (486.6)Carrying amounts of companies measured at equity 13.6 14.8 0.0 0.0 0.7 0.4Financial assets 861.6 666.7 510.0 764.8 242.4 256.3Non-allocatable taxesTotal assetsSegment liabilities 1,068.7 997.6 1,463.1 1,361.6 669.2 604.5Interest-bearing liabilities 307.5 282.9 702.8 1,040.3 373.6 473.2Non-allocatable taxesTotal liabilities and provisions
Additional disclosuresNon-cash expenses 0.9 0.4 0.0 0.0 0.8 1.5Return on sales (% on EBITA) 1.5 1.1 1.7 2.1 - 1.9 - 0.1Investments 156.3 109.9 89.9 91.2 79.5 232.9Investments in goodwill 0.8 0.3 6.7 0.0 0.0 14.8Investments in other intangible assets and property, plant and equipment 155.5 109.6 83.2 91.2 79.5 218.1Financing ratio (%) 38.4 63.7 677.1 124.3 351.2 23.7
Personnel at year-end 9,411 9,691 14,711 16,254 6,504 6,904
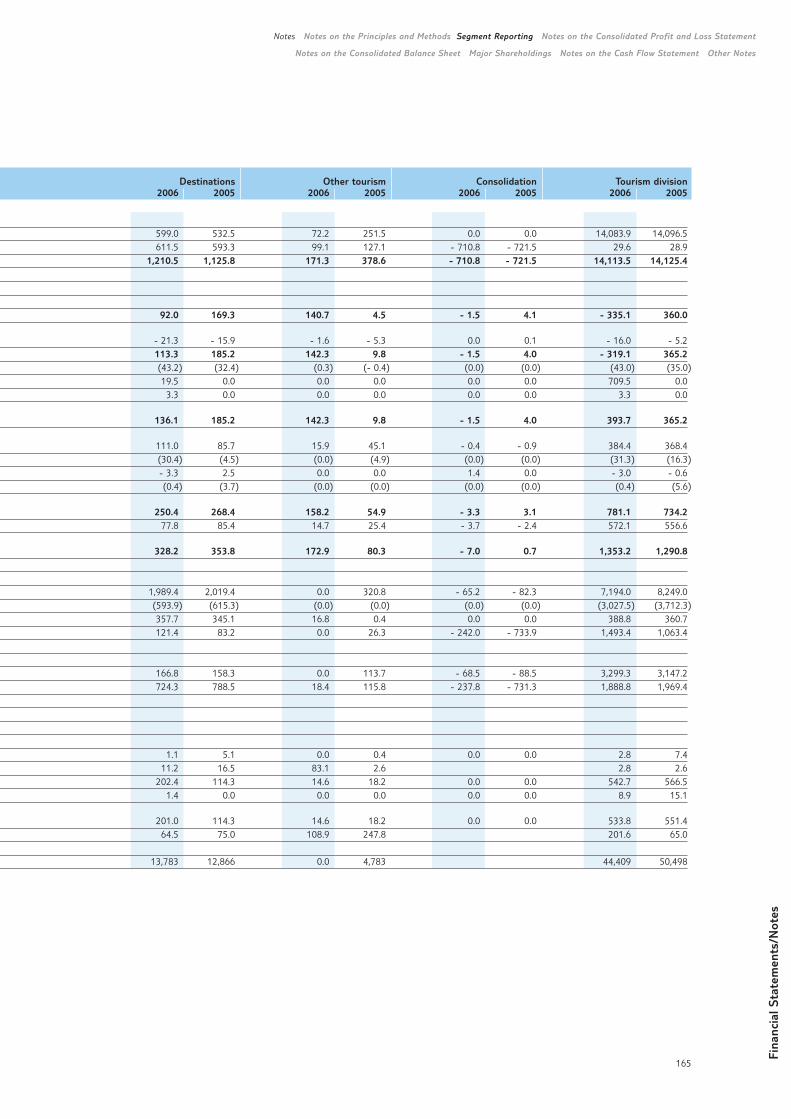
Fina
ncia
l Sta
tem
ents
/Not
es
165
Notes Notes on the Principles and Methods Segment Reporting Notes on the Consolidated Profit and Loss Statement
Notes on the Consolidated Balance Sheet Major Shareholdings Notes on the Cash Flow Statement Other Notes
Destinations Other tourism Consolidation Tourism division2006 2005 2006 2005 2006 2005 2006 2005
599.0 532.5 72.2 251.5 0.0 0.0 14,083.9 14,096.5611.5 593.3 99.1 127.1 - 710.8 - 721.5 29.6 28.9
1,210.5 1,125.8 171.3 378.6 - 710.8 - 721.5 14,113.5 14,125.4
92.0 169.3 140.7 4.5 - 1.5 4.1 - 335.1 360.0
- 21.3 - 15.9 - 1.6 - 5.3 0.0 0.1 - 16.0 - 5.2113.3 185.2 142.3 9.8 - 1.5 4.0 - 319.1 365.2(43.2) (32.4) (0.3) (- 0.4) (0.0) (0.0) (43.0) (35.0)19.5 0.0 0.0 0.0 0.0 0.0 709.5 0.03.3 0.0 0.0 0.0 0.0 0.0 3.3 0.0
136.1 185.2 142.3 9.8 - 1.5 4.0 393.7 365.2
111.0 85.7 15.9 45.1 - 0.4 - 0.9 384.4 368.4(30.4) (4.5) (0.0) (4.9) (0.0) (0.0) (31.3) (16.3)- 3.3 2.5 0.0 0.0 1.4 0.0 - 3.0 - 0.6(0.4) (3.7) (0.0) (0.0) (0.0) (0.0) (0.4) (5.6)
250.4 268.4 158.2 54.9 - 3.3 3.1 781.1 734.277.8 85.4 14.7 25.4 - 3.7 - 2.4 572.1 556.6
328.2 353.8 172.9 80.3 - 7.0 0.7 1,353.2 1,290.8
1,989.4 2,019.4 0.0 320.8 - 65.2 - 82.3 7,194.0 8,249.0(593.9) (615.3) (0.0) (0.0) (0.0) (0.0) (3,027.5) (3,712.3)357.7 345.1 16.8 0.4 0.0 0.0 388.8 360.7121.4 83.2 0.0 26.3 - 242.0 - 733.9 1,493.4 1,063.4
166.8 158.3 0.0 113.7 - 68.5 - 88.5 3,299.3 3,147.2724.3 788.5 18.4 115.8 - 237.8 - 731.3 1,888.8 1,969.4
1.1 5.1 0.0 0.4 0.0 0.0 2.8 7.411.2 16.5 83.1 2.6 2.8 2.6
202.4 114.3 14.6 18.2 0.0 0.0 542.7 566.51.4 0.0 0.0 0.0 0.0 0.0 8.9 15.1
201.0 114.3 14.6 18.2 0.0 0.0 533.8 551.464.5 75.0 108.9 247.8 201.6 65.0
13,783 12,866 0.0 4,783 44,409 50,498
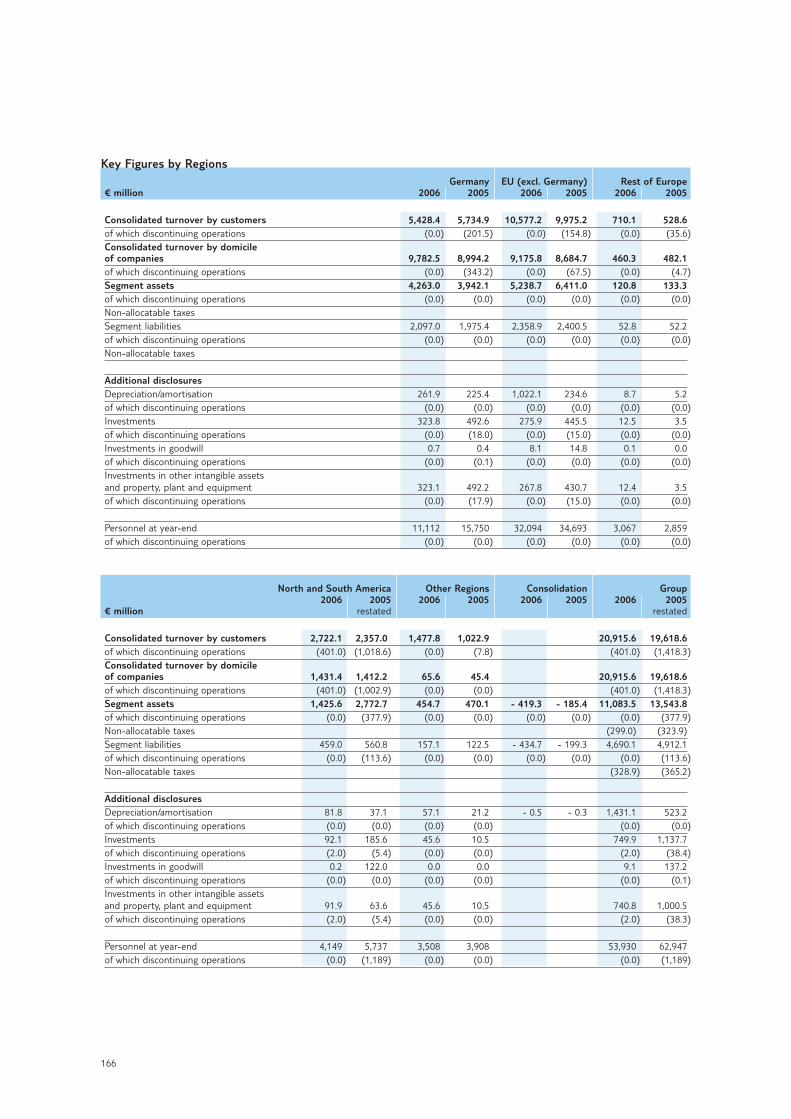
166
Key Figures by RegionsGermany EU (excl. Germany) Rest of Europe
€ million 2006 2005 2006 2005 2006 2005
Consolidated turnover by customers 5,428.4 5,734.9 10,577.2 9,975.2 710.1 528.6of which discontinuing operations (0.0) (201.5) (0.0) (154.8) (0.0) (35.6)Consolidated turnover by domicile of companies 9,782.5 8,994.2 9,175.8 8,684.7 460.3 482.1of which discontinuing operations (0.0) (343.2) (0.0) (67.5) (0.0) (4.7)Segment assets 4,263.0 3,942.1 5,238.7 6,411.0 120.8 133.3of which discontinuing operations (0.0) (0.0) (0.0) (0.0) (0.0) (0.0)Non-allocatable taxesSegment liabilities 2,097.0 1,975.4 2,358.9 2,400.5 52.8 52.2of which discontinuing operations (0.0) (0.0) (0.0) (0.0) (0.0) (0.0)Non-allocatable taxes
Additional disclosuresDepreciation/amortisation 261.9 225.4 1,022.1 234.6 8.7 5.2of which discontinuing operations (0.0) (0.0) (0.0) (0.0) (0.0) (0.0)Investments 323.8 492.6 275.9 445.5 12.5 3.5of which discontinuing operations (0.0) (18.0) (0.0) (15.0) (0.0) (0.0)Investments in goodwill 0.7 0.4 8.1 14.8 0.1 0.0of which discontinuing operations (0.0) (0.1) (0.0) (0.0) (0.0) (0.0)Investments in other intangible assets and property, plant and equipment 323.1 492.2 267.8 430.7 12.4 3.5of which discontinuing operations (0.0) (17.9) (0.0) (15.0) (0.0) (0.0)
Personnel at year-end 11,112 15,750 32,094 34,693 3,067 2,859of which discontinuing operations (0.0) (0.0) (0.0) (0.0) (0.0) (0.0)
North and South America Other Regions Consolidation Group2006 2005 2006 2005 2006 2005 2006 2005
€ million restated restated
Consolidated turnover by customers 2,722.1 2,357.0 1,477.8 1,022.9 20,915.6 19,618.6of which discontinuing operations (401.0) (1,018.6) (0.0) (7.8) (401.0) (1,418.3)Consolidated turnover by domicile of companies 1,431.4 1,412.2 65.6 45.4 20,915.6 19,618.6of which discontinuing operations (401.0) (1,002.9) (0.0) (0.0) (401.0) (1,418.3)Segment assets 1,425.6 2,772.7 454.7 470.1 - 419.3 - 185.4 11,083.5 13,543.8of which discontinuing operations (0.0) (377.9) (0.0) (0.0) (0.0) (0.0) (0.0) (377.9)Non-allocatable taxes (299.0) (323.9)Segment liabilities 459.0 560.8 157.1 122.5 - 434.7 - 199.3 4,690.1 4,912.1of which discontinuing operations (0.0) (113.6) (0.0) (0.0) (0.0) (0.0) (0.0) (113.6)Non-allocatable taxes (328.9) (365.2)
Additional disclosuresDepreciation/amortisation 81.8 37.1 57.1 21.2 - 0.5 - 0.3 1,431.1 523.2of which discontinuing operations (0.0) (0.0) (0.0) (0.0) (0.0) (0.0)Investments 92.1 185.6 45.6 10.5 749.9 1,137.7of which discontinuing operations (2.0) (5.4) (0.0) (0.0) (2.0) (38.4)Investments in goodwill 0.2 122.0 0.0 0.0 9.1 137.2of which discontinuing operations (0.0) (0.0) (0.0) (0.0) (0.0) (0.1)Investments in other intangible assets and property, plant and equipment 91.9 63.6 45.6 10.5 740.8 1,000.5of which discontinuing operations (2.0) (5.4) (0.0) (0.0) (2.0) (38.3)
Personnel at year-end 4,149 5,737 3,508 3,908 53,930 62,947of which discontinuing operations (0.0) (1,189) (0.0) (0.0) (0.0) (1,189)
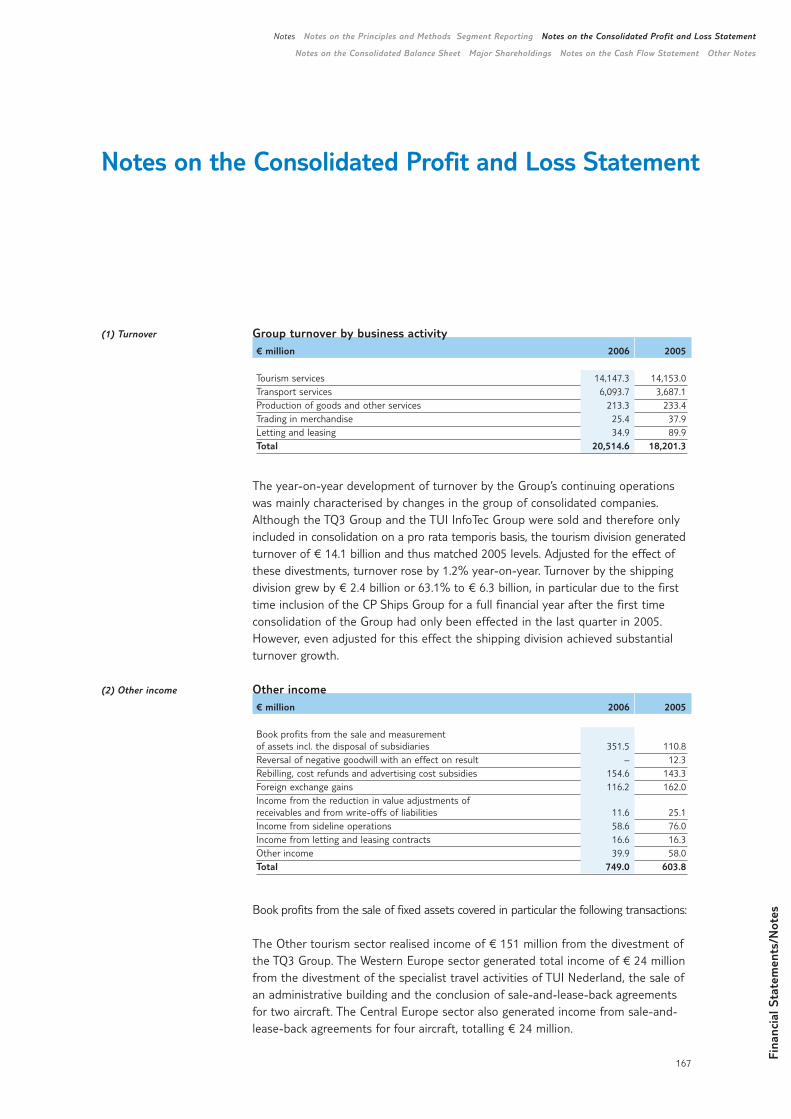
Notes on the Consolidated Profit and Loss Statement
167
Fina
ncia
l Sta
tem
ents
/Not
es
Notes Notes on the Principles and Methods Segment Reporting Notes on the Consolidated Profit and Loss Statement
Notes on the Consolidated Balance Sheet Major Shareholdings Notes on the Cash Flow Statement Other Notes
(1) Turnover
(2) Other income
Group turnover by business activity€ million 2006 2005
Tourism services 14,147.3 14,153.0Transport services 6,093.7 3,687.1Production of goods and other services 213.3 233.4Trading in merchandise 25.4 37.9Letting and leasing 34.9 89.9Total 20,514.6 18,201.3
The year-on-year development of turnover by the Group’s continuing operationswas mainly characterised by changes in the group of consolidated companies. Although the TQ3 Group and the TUI InfoTec Group were sold and therefore onlyincluded in consolidation on a pro rata temporis basis, the tourism division generatedturnover of € 14.1 billion and thus matched 2005 levels. Adjusted for the effect ofthese divestments, turnover rose by 1.2% year-on-year. Turnover by the shippingdivision grew by € 2.4 billion or 63.1% to € 6.3 billion, in particular due to the firsttime inclusion of the CP Ships Group for a full financial year after the first timeconsolidation of the Group had only been effected in the last quarter in 2005.However, even adjusted for this effect the shipping division achieved substantialturnover growth.
Other income€ million 2006 2005
Book profits from the sale and measurement of assets incl. the disposal of subsidiaries 351.5 110.8Reversal of negative goodwill with an effect on result – 12.3Rebilling, cost refunds and advertising cost subsidies 154.6 143.3Foreign exchange gains 116.2 162.0Income from the reduction in value adjustments ofreceivables and from write-offs of liabilities 11.6 25.1Income from sideline operations 58.6 76.0Income from letting and leasing contracts 16.6 16.3Other income 39.9 58.0Total 749.0 603.8
Book profits from the sale of fixed assets covered in particular the following transactions:
The Other tourism sector realised income of € 151 million from the divestment ofthe TQ3 Group. The Western Europe sector generated total income of € 24 millionfrom the divestment of the specialist travel activities of TUI Nederland, the sale ofan administrative building and the conclusion of sale-and-lease-back agreementsfor two aircraft. The Central Europe sector also generated income from sale-and-lease-back agreements for four aircraft, totalling € 24 million.
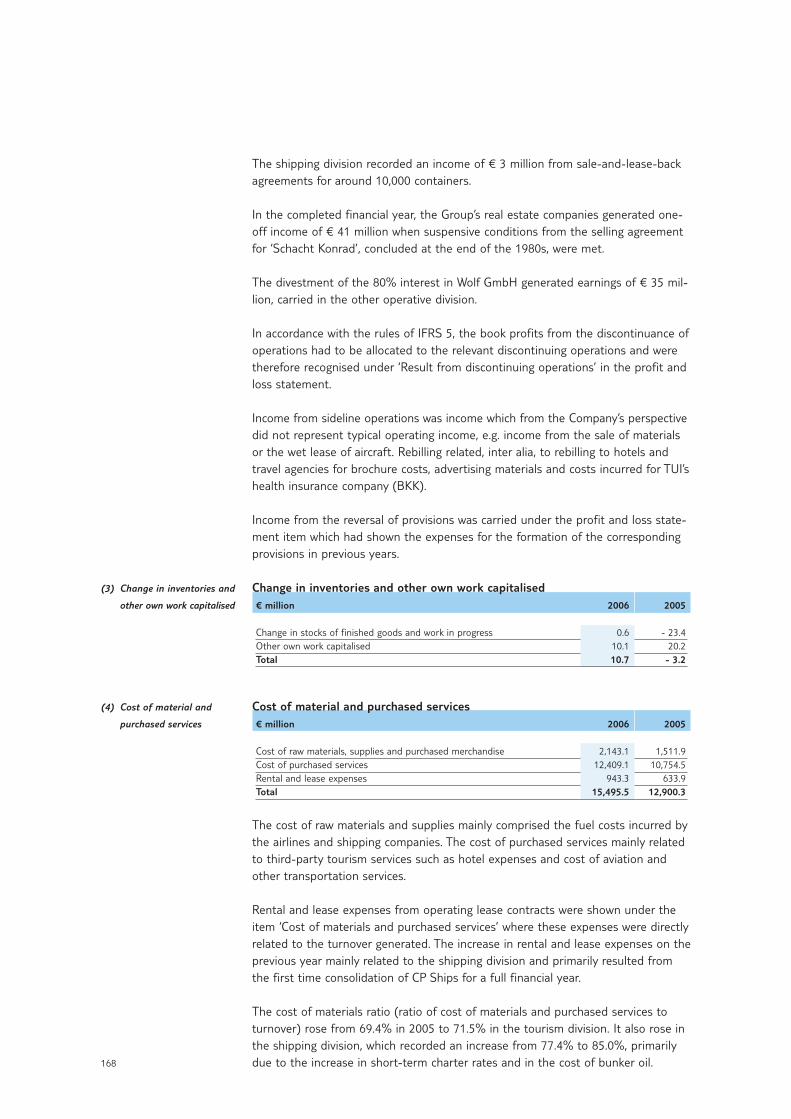
168
(3) Change in inventories and
other own work capitalised
(4) Cost of material and
purchased services
The shipping division recorded an income of € 3 million from sale-and-lease-backagreements for around 10,000 containers.
In the completed financial year, the Group’s real estate companies generated one-off income of € 41 million when suspensive conditions from the selling agreementfor ‘Schacht Konrad’, concluded at the end of the 1980s, were met.
The divestment of the 80% interest in Wolf GmbH generated earnings of € 35 mil-lion, carried in the other operative division.
In accordance with the rules of IFRS 5, the book profits from the discontinuance ofoperations had to be allocated to the relevant discontinuing operations and weretherefore recognised under ‘Result from discontinuing operations’ in the profit andloss statement.
Income from sideline operations was income which from the Company’s perspectivedid not represent typical operating income, e.g. income from the sale of materialsor the wet lease of aircraft. Rebilling related, inter alia, to rebilling to hotels andtravel agencies for brochure costs, advertising materials and costs incurred for TUI’shealth insurance company (BKK).
Income from the reversal of provisions was carried under the profit and loss state-ment item which had shown the expenses for the formation of the correspondingprovisions in previous years.
Change in inventories and other own work capitalised€ million 2006 2005
Change in stocks of finished goods and work in progress 0.6 - 23.4Other own work capitalised 10.1 20.2Total 10.7 - 3.2
Cost of material and purchased services€ million 2006 2005
Cost of raw materials, supplies and purchased merchandise 2,143.1 1,511.9Cost of purchased services 12,409.1 10,754.5Rental and lease expenses 943.3 633.9Total 15,495.5 12,900.3
The cost of raw materials and supplies mainly comprised the fuel costs incurred bythe airlines and shipping companies. The cost of purchased services mainly relatedto third-party tourism services such as hotel expenses and cost of aviation andother transportation services.
Rental and lease expenses from operating lease contracts were shown under theitem ‘Cost of materials and purchased services’ where these expenses were directlyrelated to the turnover generated. The increase in rental and lease expenses on theprevious year mainly related to the shipping division and primarily resulted fromthe first time consolidation of CP Ships for a full financial year.
The cost of materials ratio (ratio of cost of materials and purchased services toturnover) rose from 69.4% in 2005 to 71.5% in the tourism division. It also rose inthe shipping division, which recorded an increase from 77.4% to 85.0%, primarilydue to the increase in short-term charter rates and in the cost of bunker oil.
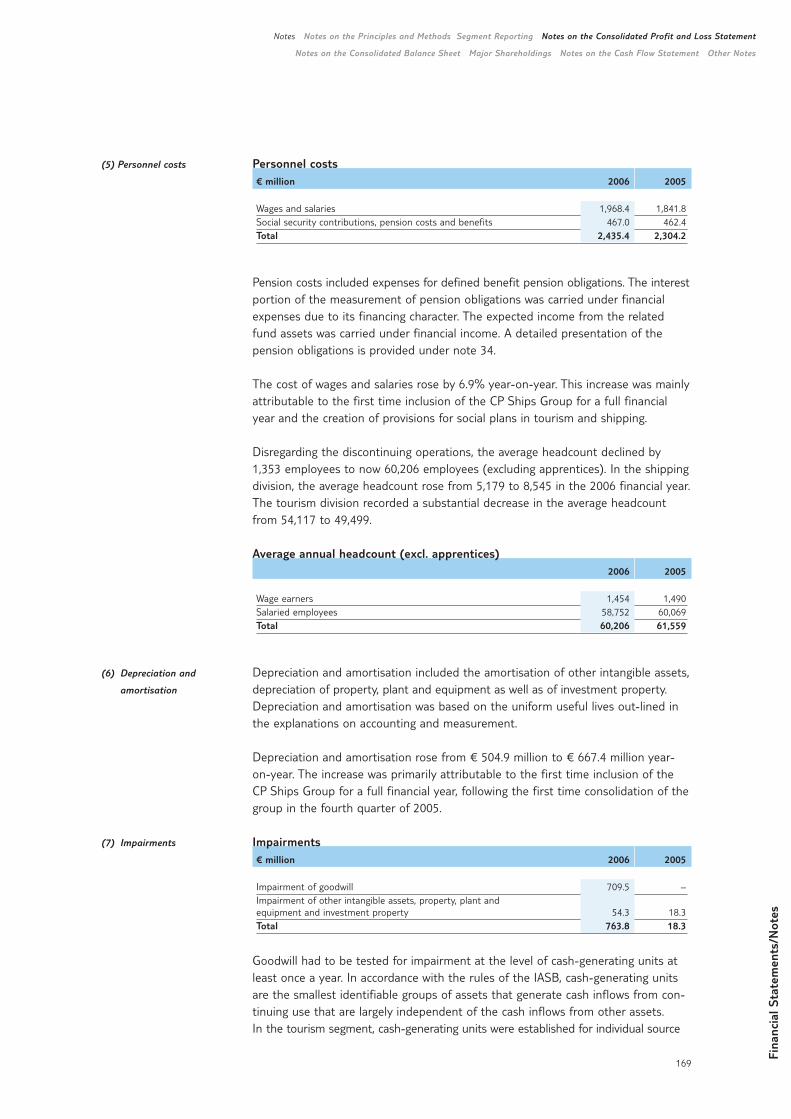
Fina
ncia
l Sta
tem
ents
/Not
es
169
Notes Notes on the Principles and Methods Segment Reporting Notes on the Consolidated Profit and Loss Statement
Notes on the Consolidated Balance Sheet Major Shareholdings Notes on the Cash Flow Statement Other Notes
(5) Personnel costs
(6) Depreciation and
amortisation
(7) Impairments
Personnel costs€ million 2006 2005
Wages and salaries 1,968.4 1,841.8Social security contributions, pension costs and benefits 467.0 462.4Total 2,435.4 2,304.2
Pension costs included expenses for defined benefit pension obligations. The interestportion of the measurement of pension obligations was carried under financialexpenses due to its financing character. The expected income from the relatedfund assets was carried under financial income. A detailed presentation of the pension obligations is provided under note 34.
The cost of wages and salaries rose by 6.9% year-on-year. This increase was mainlyattributable to the first time inclusion of the CP Ships Group for a full financialyear and the creation of provisions for social plans in tourism and shipping.
Disregarding the discontinuing operations, the average headcount declined by1,353 employees to now 60,206 employees (excluding apprentices). In the shippingdivision, the average headcount rose from 5,179 to 8,545 in the 2006 financial year.The tourism division recorded a substantial decrease in the average headcountfrom 54,117 to 49,499.
Average annual headcount (excl. apprentices)2006 2005
Wage earners 1,454 1,490Salaried employees 58,752 60,069Total 60,206 61,559
Depreciation and amortisation included the amortisation of other intangible assets,depreciation of property, plant and equipment as well as of investment property.Depreciation and amortisation was based on the uniform useful lives out-lined inthe explanations on accounting and measurement.
Depreciation and amortisation rose from € 504.9 million to € 667.4 million year-on-year. The increase was primarily attributable to the first time inclusion of theCP Ships Group for a full financial year, following the first time consolidation of thegroup in the fourth quarter of 2005.
Impairments€ million 2006 2005
Impairment of goodwill 709.5 –Impairment of other intangible assets, property, plant and equipment and investment property 54.3 18.3Total 763.8 18.3
Goodwill had to be tested for impairment at the level of cash-generating units atleast once a year. In accordance with the rules of the IASB, cash-generating unitsare the smallest identifiable groups of assets that generate cash inflows from con-tinuing use that are largely independent of the cash inflows from other assets. In the tourism segment, cash-generating units were established for individual source
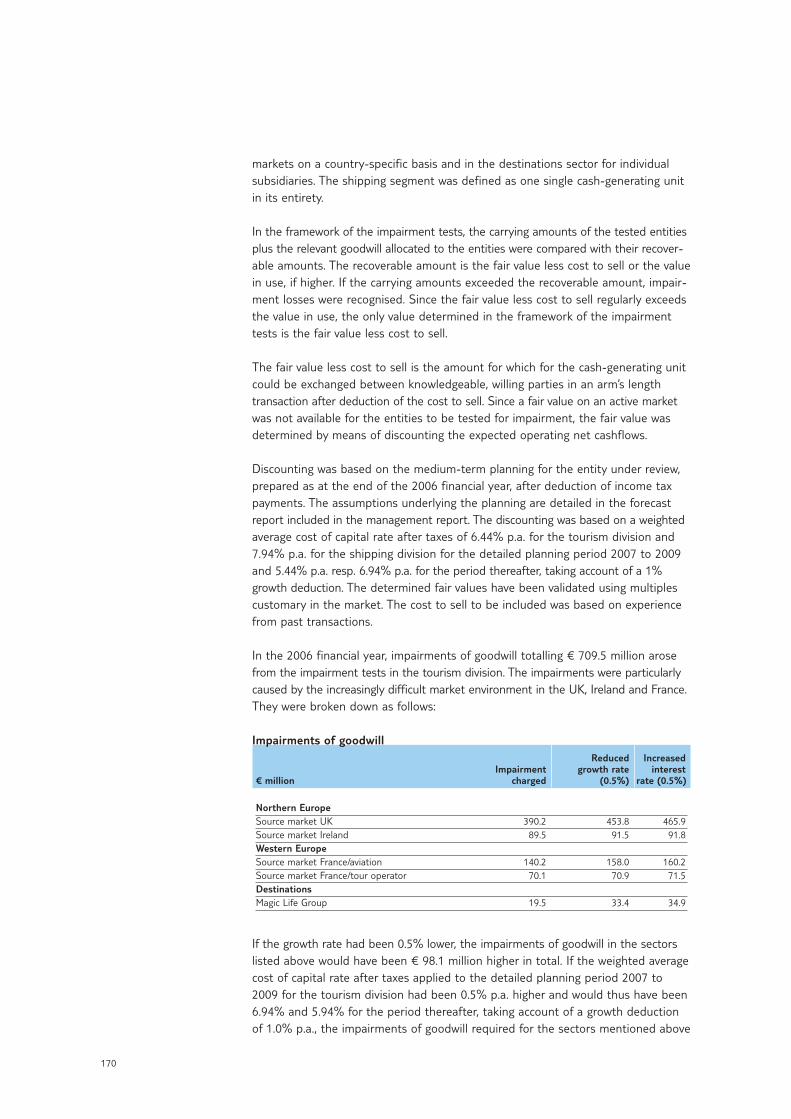
170
markets on a country-specific basis and in the destinations sector for individualsubsidiaries. The shipping segment was defined as one single cash-generating unitin its entirety.
In the framework of the impairment tests, the carrying amounts of the tested entitiesplus the relevant goodwill allocated to the entities were compared with their recover-able amounts. The recoverable amount is the fair value less cost to sell or the valuein use, if higher. If the carrying amounts exceeded the recoverable amount, impair-ment losses were recognised. Since the fair value less cost to sell regularly exceedsthe value in use, the only value determined in the framework of the impairmenttests is the fair value less cost to sell.
The fair value less cost to sell is the amount for which for the cash-generating unitcould be exchanged between knowledgeable, willing parties in an arm’s lengthtransaction after deduction of the cost to sell. Since a fair value on an active marketwas not available for the entities to be tested for impairment, the fair value wasdetermined by means of discounting the expected operating net cashflows.
Discounting was based on the medium-term planning for the entity under review,prepared as at the end of the 2006 financial year, after deduction of income taxpayments. The assumptions underlying the planning are detailed in the forecastreport included in the management report. The discounting was based on a weightedaverage cost of capital rate after taxes of 6.44% p.a. for the tourism division and7.94% p.a. for the shipping division for the detailed planning period 2007 to 2009and 5.44% p.a. resp. 6.94% p.a. for the period thereafter, taking account of a 1%growth deduction. The determined fair values have been validated using multiplescustomary in the market. The cost to sell to be included was based on experiencefrom past transactions.
In the 2006 financial year, impairments of goodwill totalling € 709.5 million arosefrom the impairment tests in the tourism division. The impairments were particularlycaused by the increasingly difficult market environment in the UK, Ireland and France.They were broken down as follows:
Impairments of goodwillReduced Increased
Impairment growth rate interest€ million charged (0.5%) rate (0.5%)
Northern EuropeSource market UK 390.2 453.8 465.9Source market Ireland 89.5 91.5 91.8Western EuropeSource market France/aviation 140.2 158.0 160.2Source market France/tour operator 70.1 70.9 71.5DestinationsMagic Life Group 19.5 33.4 34.9
If the growth rate had been 0.5% lower, the impairments of goodwill in the sectorslisted above would have been € 98.1 million higher in total. If the weighted averagecost of capital rate after taxes applied to the detailed planning period 2007 to2009 for the tourism division had been 0.5% p.a. higher and would thus have been6.94% and 5.94% for the period thereafter, taking account of a growth deductionof 1.0% p.a., the impairments of goodwill required for the sectors mentioned above
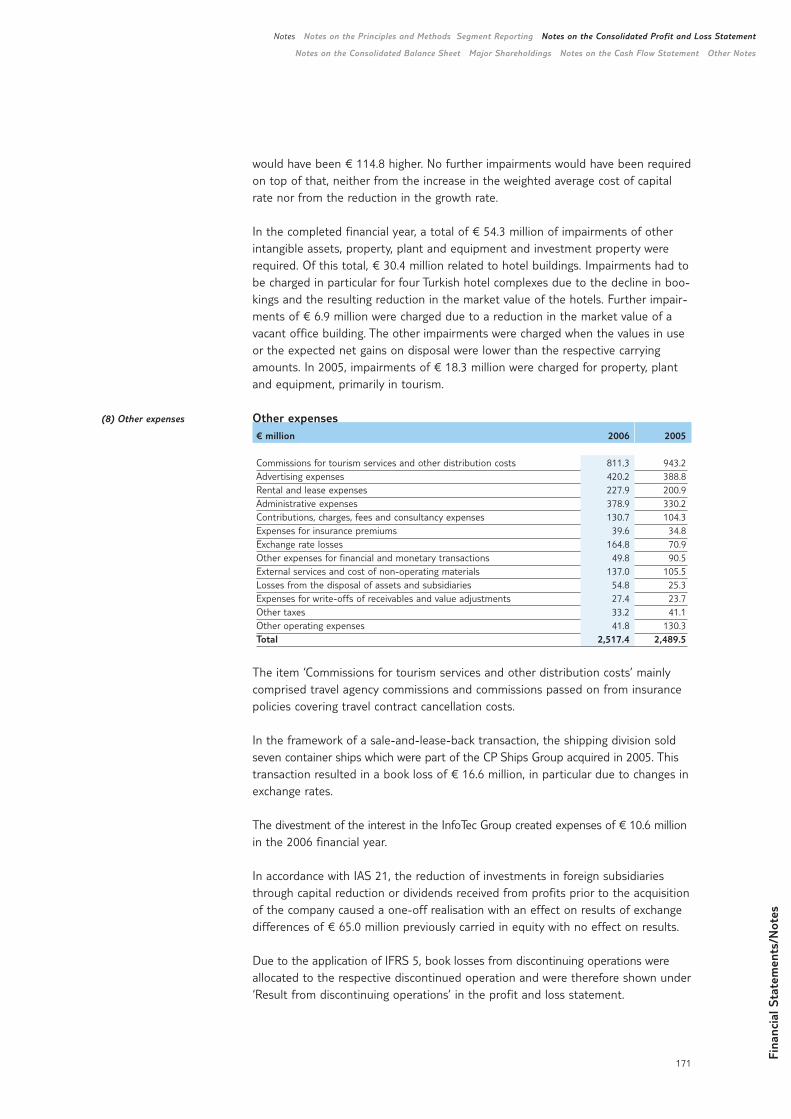
Fina
ncia
l Sta
tem
ents
/Not
es
171
Notes Notes on the Principles and Methods Segment Reporting Notes on the Consolidated Profit and Loss Statement
Notes on the Consolidated Balance Sheet Major Shareholdings Notes on the Cash Flow Statement Other Notes
(8) Other expenses
would have been € 114.8 higher. No further impairments would have been requiredon top of that, neither from the increase in the weighted average cost of capitalrate nor from the reduction in the growth rate.
In the completed financial year, a total of € 54.3 million of impairments of otherintangible assets, property, plant and equipment and investment property wererequired. Of this total, € 30.4 million related to hotel buildings. Impairments had tobe charged in particular for four Turkish hotel complexes due to the decline in boo-kings and the resulting reduction in the market value of the hotels. Further impair-ments of € 6.9 million were charged due to a reduction in the market value of avacant office building. The other impairments were charged when the values in useor the expected net gains on disposal were lower than the respective carryingamounts. In 2005, impairments of € 18.3 million were charged for property, plantand equipment, primarily in tourism.
Other expenses€ million 2006 2005
Commissions for tourism services and other distribution costs 811.3 943.2Advertising expenses 420.2 388.8Rental and lease expenses 227.9 200.9Administrative expenses 378.9 330.2Contributions, charges, fees and consultancy expenses 130.7 104.3Expenses for insurance premiums 39.6 34.8Exchange rate losses 164.8 70.9Other expenses for financial and monetary transactions 49.8 90.5External services and cost of non-operating materials 137.0 105.5Losses from the disposal of assets and subsidiaries 54.8 25.3Expenses for write-offs of receivables and value adjustments 27.4 23.7Other taxes 33.2 41.1Other operating expenses 41.8 130.3Total 2,517.4 2,489.5
The item ‘Commissions for tourism services and other distribution costs’ mainlycomprised travel agency commissions and commissions passed on from insurancepolicies covering travel contract cancellation costs.
In the framework of a sale-and-lease-back transaction, the shipping division soldseven container ships which were part of the CP Ships Group acquired in 2005. Thistransaction resulted in a book loss of € 16.6 million, in particular due to changes inexchange rates.
The divestment of the interest in the InfoTec Group created expenses of € 10.6 millionin the 2006 financial year.
In accordance with IAS 21, the reduction of investments in foreign subsidiariesthrough capital reduction or dividends received from profits prior to the acquisitionof the company caused a one-off realisation with an effect on results of exchangedifferences of € 65.0 million previously carried in equity with no effect on results.
Due to the application of IFRS 5, book losses from discontinuing operations wereallocated to the respective discontinued operation and were therefore shown under‘Result from discontinuing operations’ in the profit and loss statement.
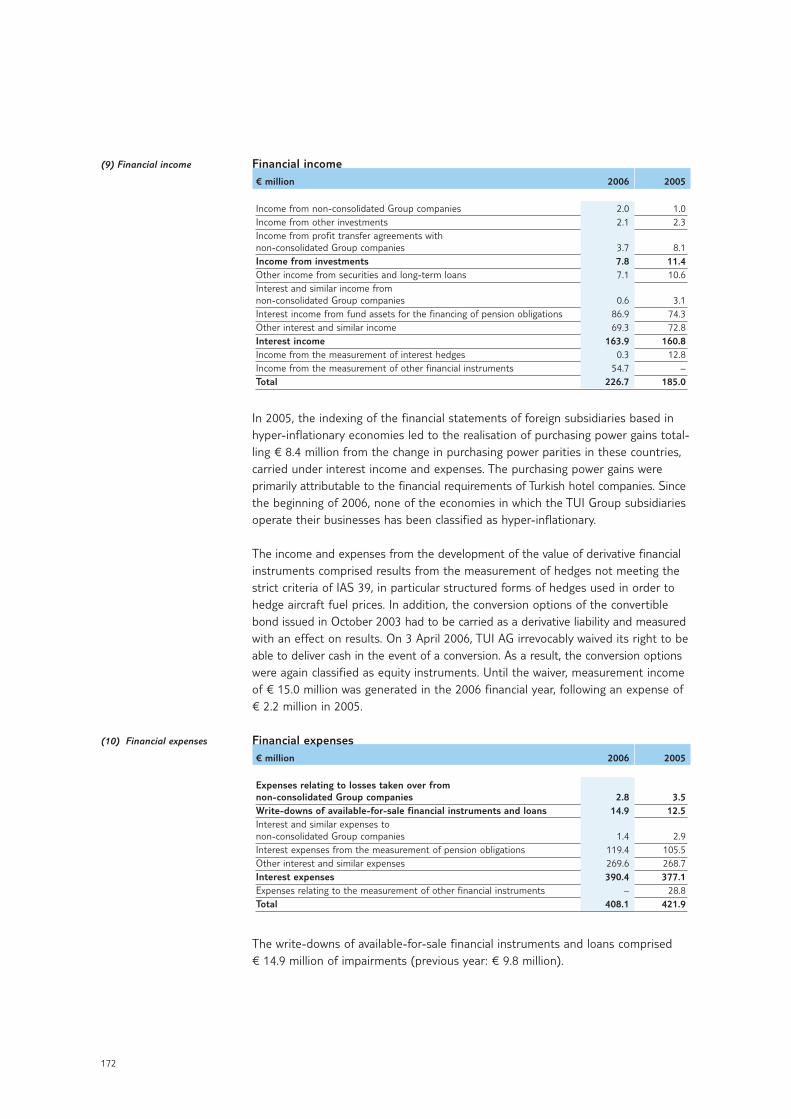
172
(9) Financial income
(10) Financial expenses
Financial income€ million 2006 2005
Income from non-consolidated Group companies 2.0 1.0Income from other investments 2.1 2.3Income from profit transfer agreements with non-consolidated Group companies 3.7 8.1Income from investments 7.8 11.4Other income from securities and long-term loans 7.1 10.6Interest and similar income from non-consolidated Group companies 0.6 3.1Interest income from fund assets for the financing of pension obligations 86.9 74.3Other interest and similar income 69.3 72.8Interest income 163.9 160.8Income from the measurement of interest hedges 0.3 12.8Income from the measurement of other financial instruments 54.7 –Total 226.7 185.0
In 2005, the indexing of the financial statements of foreign subsidiaries based inhyper-inflationary economies led to the realisation of purchasing power gains total-ling € 8.4 million from the change in purchasing power parities in these countries,carried under interest income and expenses. The purchasing power gains were primarily attributable to the financial requirements of Turkish hotel companies. Sincethe beginning of 2006, none of the economies in which the TUI Group subsidiariesoperate their businesses has been classified as hyper-inflationary.
The income and expenses from the development of the value of derivative financialinstruments comprised results from the measurement of hedges not meeting thestrict criteria of IAS 39, in particular structured forms of hedges used in order tohedge aircraft fuel prices. In addition, the conversion options of the convertiblebond issued in October 2003 had to be carried as a derivative liability and measuredwith an effect on results. On 3 April 2006, TUI AG irrevocably waived its right to beable to deliver cash in the event of a conversion. As a result, the conversion optionswere again classified as equity instruments. Until the waiver, measurement incomeof € 15.0 million was generated in the 2006 financial year, following an expense of€ 2.2 million in 2005.
Financial expenses€ million 2006 2005
Expenses relating to losses taken over from non-consolidated Group companies 2.8 3.5Write-downs of available-for-sale financial instruments and loans 14.9 12.5Interest and similar expenses to non-consolidated Group companies 1.4 2.9Interest expenses from the measurement of pension obligations 119.4 105.5Other interest and similar expenses 269.6 268.7Interest expenses 390.4 377.1Expenses relating to the measurement of other financial instruments – 28.8Total 408.1 421.9
The write-downs of available-for-sale financial instruments and loans comprised € 14.9 million of impairments (previous year: € 9.8 million).
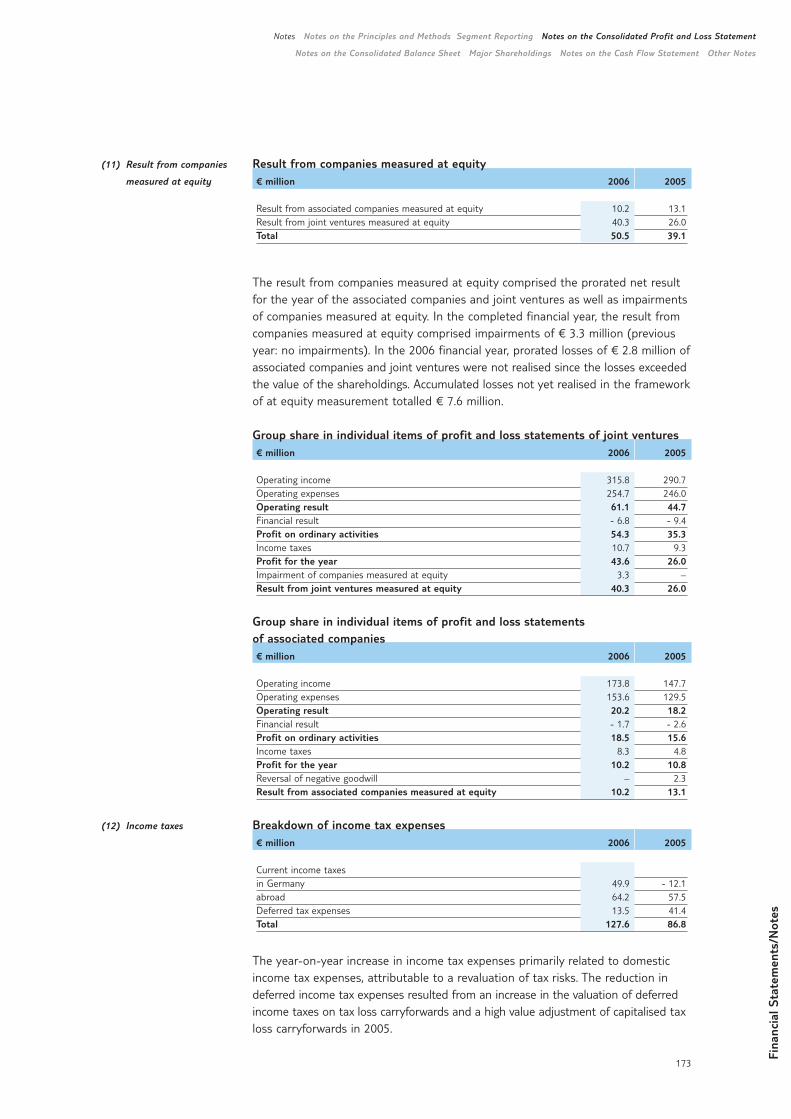
Fina
ncia
l Sta
tem
ents
/Not
es
173
Notes Notes on the Principles and Methods Segment Reporting Notes on the Consolidated Profit and Loss Statement
Notes on the Consolidated Balance Sheet Major Shareholdings Notes on the Cash Flow Statement Other Notes
(11) Result from companies
measured at equity
(12) Income taxes
Result from companies measured at equity€ million 2006 2005
Result from associated companies measured at equity 10.2 13.1Result from joint ventures measured at equity 40.3 26.0Total 50.5 39.1
The result from companies measured at equity comprised the prorated net resultfor the year of the associated companies and joint ventures as well as impairmentsof companies measured at equity. In the completed financial year, the result fromcompanies measured at equity comprised impairments of € 3.3 million (previousyear: no impairments). In the 2006 financial year, prorated losses of € 2.8 million ofassociated companies and joint ventures were not realised since the losses exceededthe value of the shareholdings. Accumulated losses not yet realised in the frameworkof at equity measurement totalled € 7.6 million.
Group share in individual items of profit and loss statements of joint ventures€ million 2006 2005
Operating income 315.8 290.7Operating expenses 254.7 246.0Operating result 61.1 44.7Financial result - 6.8 - 9.4Profit on ordinary activities 54.3 35.3Income taxes 10.7 9.3Profit for the year 43.6 26.0Impairment of companies measured at equity 3.3 –Result from joint ventures measured at equity 40.3 26.0
Group share in individual items of profit and loss statements of associated companies€ million 2006 2005
Operating income 173.8 147.7Operating expenses 153.6 129.5Operating result 20.2 18.2Financial result - 1.7 - 2.6Profit on ordinary activities 18.5 15.6Income taxes 8.3 4.8Profit for the year 10.2 10.8Reversal of negative goodwill – 2.3Result from associated companies measured at equity 10.2 13.1
Breakdown of income tax expenses€ million 2006 2005
Current income taxesin Germany 49.9 - 12.1abroad 64.2 57.5Deferred tax expenses 13.5 41.4Total 127.6 86.8
The year-on-year increase in income tax expenses primarily related to domesticincome tax expenses, attributable to a revaluation of tax risks. The reduction indeferred income tax expenses resulted from an increase in the valuation of deferredincome taxes on tax loss carryforwards and a high value adjustment of capitalised taxloss carryforwards in 2005.
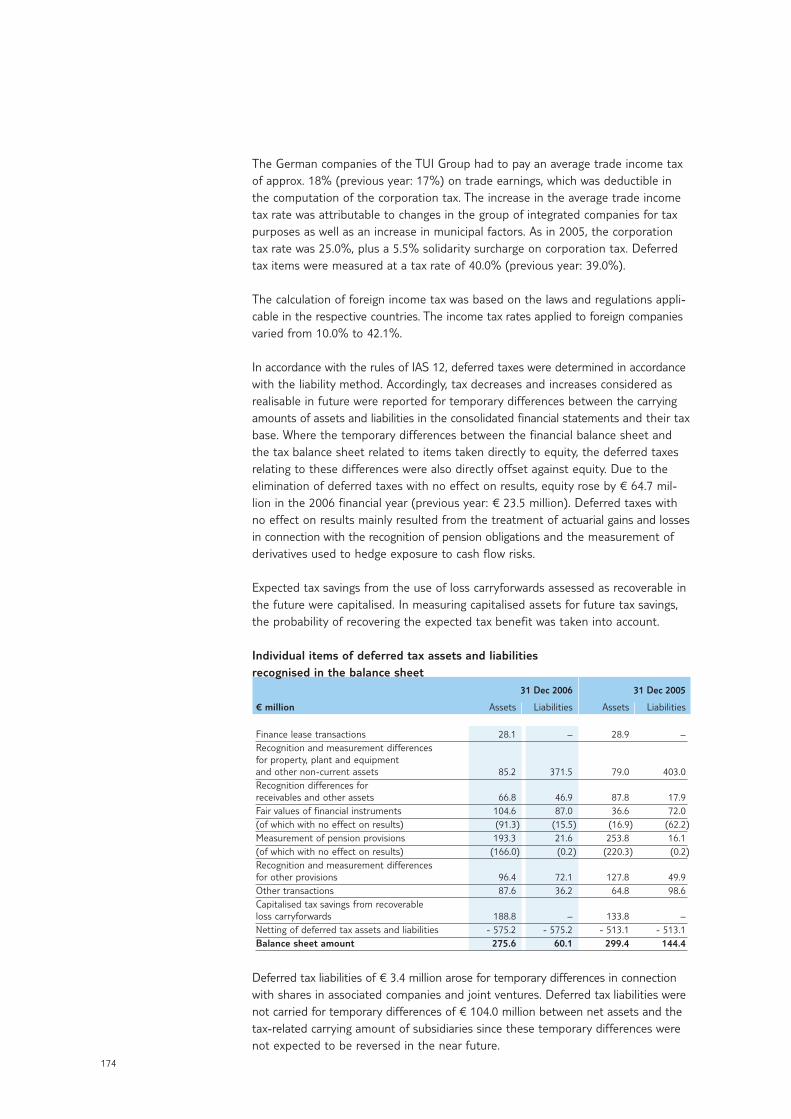
174
The German companies of the TUI Group had to pay an average trade income taxof approx. 18% (previous year: 17%) on trade earnings, which was deductible inthe computation of the corporation tax. The increase in the average trade incometax rate was attributable to changes in the group of integrated companies for taxpurposes as well as an increase in municipal factors. As in 2005, the corporationtax rate was 25.0%, plus a 5.5% solidarity surcharge on corporation tax. Deferredtax items were measured at a tax rate of 40.0% (previous year: 39.0%).
The calculation of foreign income tax was based on the laws and regulations appli-cable in the respective countries. The income tax rates applied to foreign companiesvaried from 10.0% to 42.1%.
In accordance with the rules of IAS 12, deferred taxes were determined in accordancewith the liability method. Accordingly, tax decreases and increases considered asrealisable in future were reported for temporary differences between the carryingamounts of assets and liabilities in the consolidated financial statements and their taxbase. Where the temporary differences between the financial balance sheet andthe tax balance sheet related to items taken directly to equity, the deferred taxesrelating to these differences were also directly offset against equity. Due to the elimination of deferred taxes with no effect on results, equity rose by € 64.7 mil-lion in the 2006 financial year (previous year: € 23.5 million). Deferred taxes withno effect on results mainly resulted from the treatment of actuarial gains and lossesin connection with the recognition of pension obligations and the measurement ofderivatives used to hedge exposure to cash flow risks.
Expected tax savings from the use of loss carryforwards assessed as recoverable inthe future were capitalised. In measuring capitalised assets for future tax savings,the probability of recovering the expected tax benefit was taken into account.
Individual items of deferred tax assets and liabilities recognised in the balance sheet
31 Dec 2006 31 Dec 2005
€ million Assets Liabilities Assets Liabilities
Finance lease transactions 28.1 – 28.9 –Recognition and measurement differences for property, plant and equipment and other non-current assets 85.2 371.5 79.0 403.0Recognition differences forreceivables and other assets 66.8 46.9 87.8 17.9Fair values of financial instruments 104.6 87.0 36.6 72.0(of which with no effect on results) (91.3) (15.5) (16.9) (62.2)Measurement of pension provisions 193.3 21.6 253.8 16.1(of which with no effect on results) (166.0) (0.2) (220.3) (0.2)Recognition and measurement differencesfor other provisions 96.4 72.1 127.8 49.9Other transactions 87.6 36.2 64.8 98.6Capitalised tax savings from recoverable loss carryforwards 188.8 – 133.8 –Netting of deferred tax assets and liabilities - 575.2 - 575.2 - 513.1 - 513.1Balance sheet amount 275.6 60.1 299.4 144.4
Deferred tax liabilities of € 3.4 million arose for temporary differences in connectionwith shares in associated companies and joint ventures. Deferred tax liabilities werenot carried for temporary differences of € 104.0 million between net assets and thetax-related carrying amount of subsidiaries since these temporary differences werenot expected to be reversed in the near future.
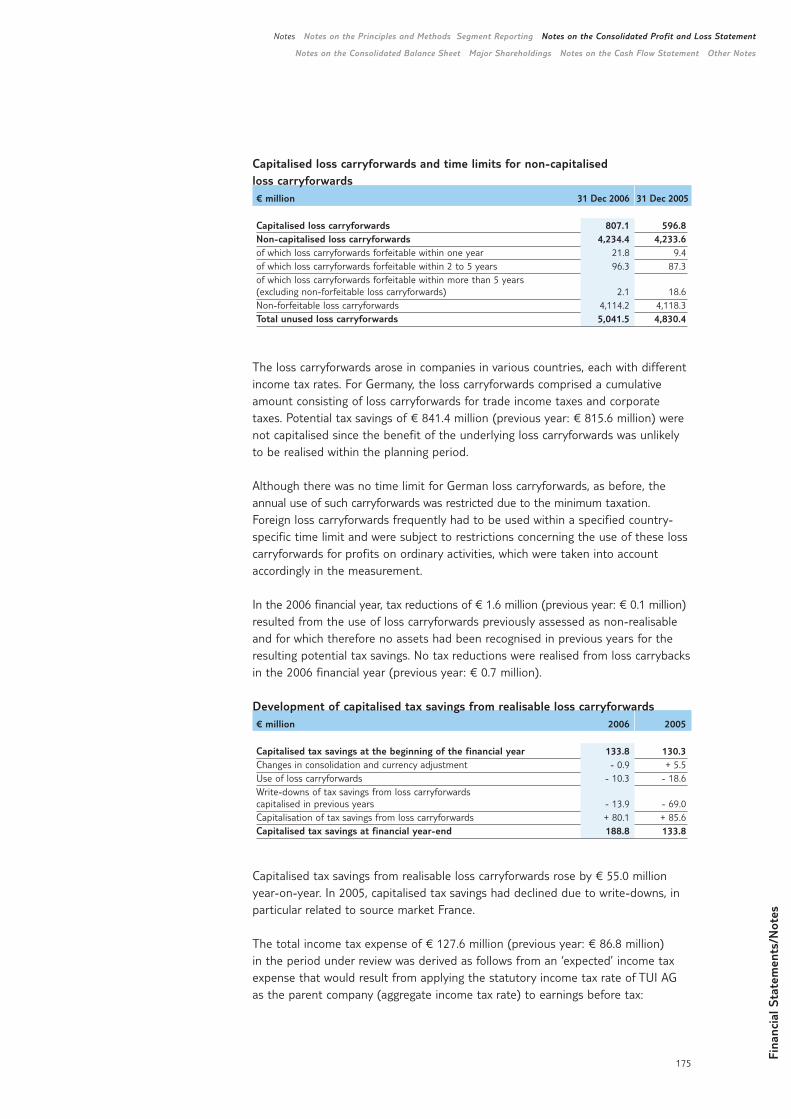
Fina
ncia
l Sta
tem
ents
/Not
es
175
Notes Notes on the Principles and Methods Segment Reporting Notes on the Consolidated Profit and Loss Statement
Notes on the Consolidated Balance Sheet Major Shareholdings Notes on the Cash Flow Statement Other Notes
Capitalised loss carryforwards and time limits for non-capitalised loss carryforwards € million 31 Dec 2006 31 Dec 2005
Capitalised loss carryforwards 807.1 596.8Non-capitalised loss carryforwards 4,234.4 4,233.6of which loss carryforwards forfeitable within one year 21.8 9.4of which loss carryforwards forfeitable within 2 to 5 years 96.3 87.3of which loss carryforwards forfeitable within more than 5 years (excluding non-forfeitable loss carryforwards) 2.1 18.6Non-forfeitable loss carryforwards 4,114.2 4,118.3Total unused loss carryforwards 5,041.5 4,830.4
The loss carryforwards arose in companies in various countries, each with differentincome tax rates. For Germany, the loss carryforwards comprised a cumulativeamount consisting of loss carryforwards for trade income taxes and corporatetaxes. Potential tax savings of € 841.4 million (previous year: € 815.6 million) werenot capitalised since the benefit of the underlying loss carryforwards was unlikelyto be realised within the planning period.
Although there was no time limit for German loss carryforwards, as before, theannual use of such carryforwards was restricted due to the minimum taxation.Foreign loss carryforwards frequently had to be used within a specified country-specific time limit and were subject to restrictions concerning the use of these losscarryforwards for profits on ordinary activities, which were taken into accountaccordingly in the measurement.
In the 2006 financial year, tax reductions of € 1.6 million (previous year: € 0.1 million)resulted from the use of loss carryforwards previously assessed as non-realisableand for which therefore no assets had been recognised in previous years for theresulting potential tax savings. No tax reductions were realised from loss carrybacksin the 2006 financial year (previous year: € 0.7 million).
Development of capitalised tax savings from realisable loss carryforwards€ million 2006 2005
Capitalised tax savings at the beginning of the financial year 133.8 130.3Changes in consolidation and currency adjustment - 0.9 + 5.5Use of loss carryforwards - 10.3 - 18.6Write-downs of tax savings from loss carryforwards capitalised in previous years - 13.9 - 69.0Capitalisation of tax savings from loss carryforwards + 80.1 + 85.6Capitalised tax savings at financial year-end 188.8 133.8
Capitalised tax savings from realisable loss carryforwards rose by € 55.0 millionyear-on-year. In 2005, capitalised tax savings had declined due to write-downs, inparticular related to source market France.
The total income tax expense of € 127.6 million (previous year: € 86.8 million) in the period under review was derived as follows from an ‘expected’ income taxexpense that would result from applying the statutory income tax rate of TUI AGas the parent company (aggregate income tax rate) to earnings before tax:
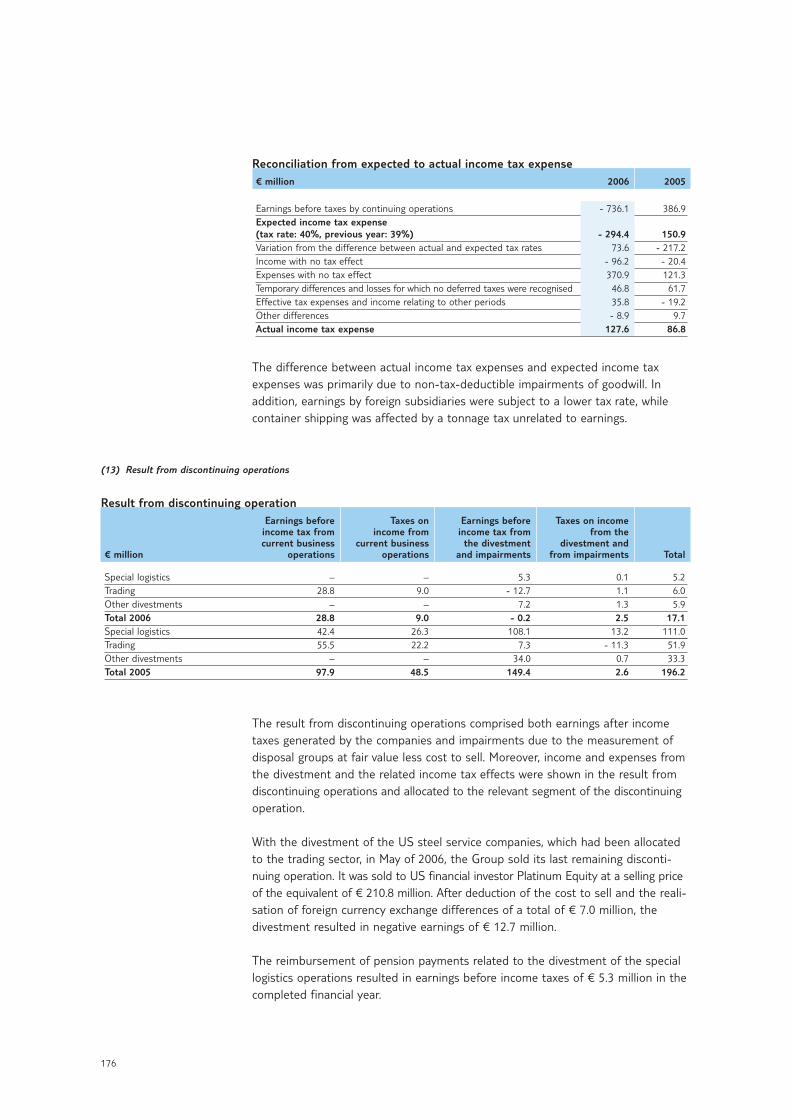
176
Reconciliation from expected to actual income tax expense € million 2006 2005
Earnings before taxes by continuing operations - 736.1 386.9Expected income tax expense(tax rate: 40%, previous year: 39%) - 294.4 150.9Variation from the difference between actual and expected tax rates 73.6 - 217.2Income with no tax effect - 96.2 - 20.4Expenses with no tax effect 370.9 121.3Temporary differences and losses for which no deferred taxes were recognised 46.8 61.7Effective tax expenses and income relating to other periods 35.8 - 19.2Other differences - 8.9 9.7Actual income tax expense 127.6 86.8
The difference between actual income tax expenses and expected income taxexpenses was primarily due to non-tax-deductible impairments of goodwill. Inaddition, earnings by foreign subsidiaries were subject to a lower tax rate, whilecontainer shipping was affected by a tonnage tax unrelated to earnings.
The result from discontinuing operations comprised both earnings after incometaxes generated by the companies and impairments due to the measurement ofdisposal groups at fair value less cost to sell. Moreover, income and expenses fromthe divestment and the related income tax effects were shown in the result fromdiscontinuing operations and allocated to the relevant segment of the discontinuingoperation.
With the divestment of the US steel service companies, which had been allocatedto the trading sector, in May of 2006, the Group sold its last remaining disconti-nuing operation. It was sold to US financial investor Platinum Equity at a selling priceof the equivalent of € 210.8 million. After deduction of the cost to sell and the reali-sation of foreign currency exchange differences of a total of € 7.0 million, thedivestment resulted in negative earnings of € 12.7 million.
The reimbursement of pension payments related to the divestment of the speciallogistics operations resulted in earnings before income taxes of € 5.3 million in thecompleted financial year.
(13) Result from discontinuing operations
Result from discontinuing operationEarnings before Taxes on Earnings before Taxes on income
income tax from income from income tax from from thecurrent business current business the divestment divestment and
€ million operations operations and impairments from impairments Total
Special logistics – – 5.3 0.1 5.2Trading 28.8 9.0 - 12.7 1.1 6.0Other divestments – – 7.2 1.3 5.9Total 2006 28.8 9.0 - 0.2 2.5 17.1Special logistics 42.4 26.3 108.1 13.2 111.0Trading 55.5 22.2 7.3 - 11.3 51.9Other divestments – – 34.0 0.7 33.3Total 2005 97.9 48.5 149.4 2.6 196.2
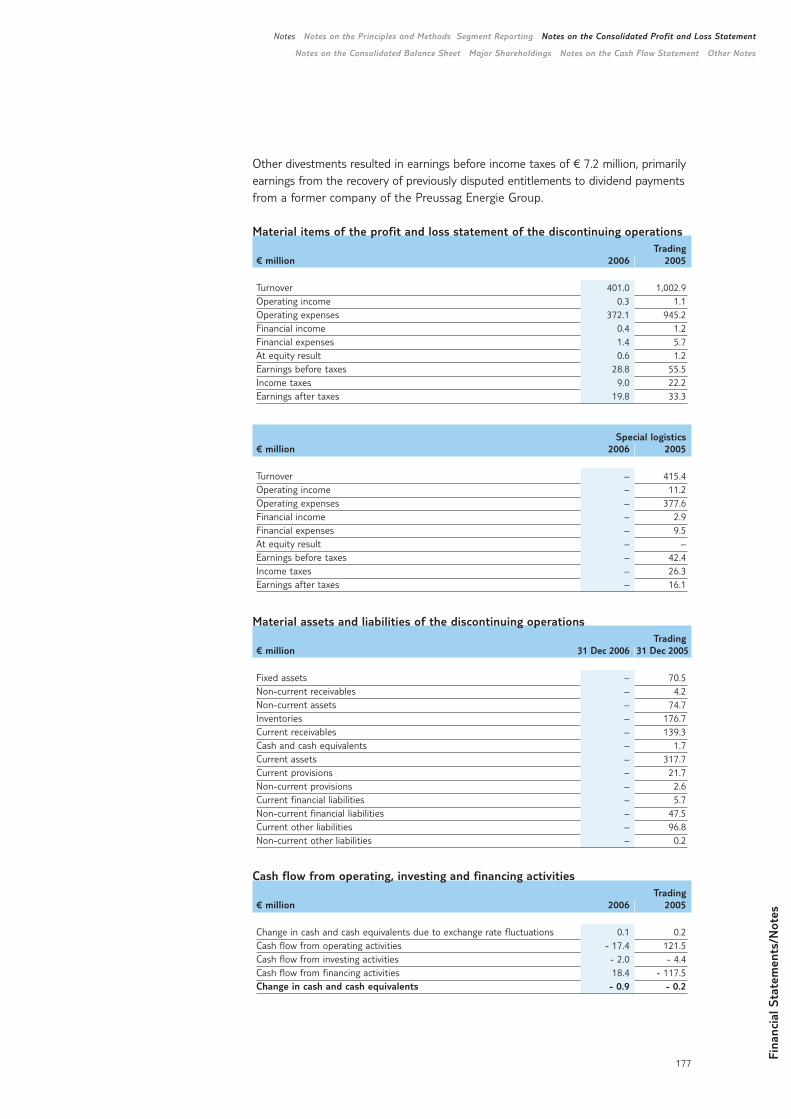
Fina
ncia
l Sta
tem
ents
/Not
es
177
Notes Notes on the Principles and Methods Segment Reporting Notes on the Consolidated Profit and Loss Statement
Notes on the Consolidated Balance Sheet Major Shareholdings Notes on the Cash Flow Statement Other Notes
Other divestments resulted in earnings before income taxes of € 7.2 million, primarilyearnings from the recovery of previously disputed entitlements to dividend paymentsfrom a former company of the Preussag Energie Group.
Material items of the profit and loss statement of the discontinuing operationsTrading
€ million 2006 2005
Turnover 401.0 1,002.9Operating income 0.3 1.1Operating expenses 372.1 945.2Financial income 0.4 1.2Financial expenses 1.4 5.7At equity result 0.6 1.2Earnings before taxes 28.8 55.5Income taxes 9.0 22.2Earnings after taxes 19.8 33.3
Special logistics€ million 2006 2005
Turnover – 415.4Operating income – 11.2Operating expenses – 377.6Financial income – 2.9Financial expenses – 9.5At equity result – –Earnings before taxes – 42.4Income taxes – 26.3Earnings after taxes – 16.1
Material assets and liabilities of the discontinuing operations Trading
€ million 31 Dec 2006 31 Dec 2005
Fixed assets – 70.5Non-current receivables – 4.2Non-current assets – 74.7Inventories – 176.7Current receivables – 139.3Cash and cash equivalents – 1.7Current assets – 317.7Current provisions – 21.7Non-current provisions – 2.6Current financial liabilities – 5.7Non-current financial liabilities – 47.5Current other liabilities – 96.8Non-current other liabilities – 0.2
Cash flow from operating, investing and financing activitiesTrading
€ million 2006 2005
Change in cash and cash equivalents due to exchange rate fluctuations 0.1 0.2Cash flow from operating activities - 17.4 121.5Cash flow from investing activities - 2.0 - 4.4Cash flow from financing activities 18.4 - 117.5Change in cash and cash equivalents - 0.9 - 0.2
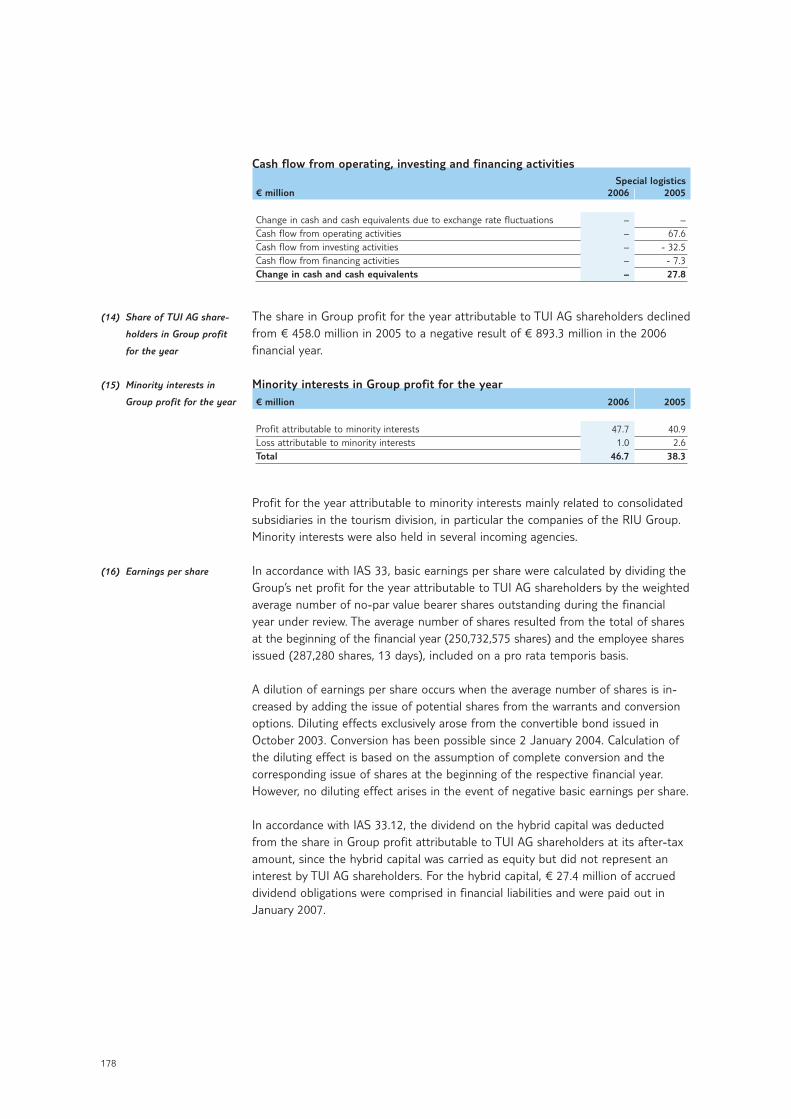
178
(14) Share of TUI AG share-
holders in Group profit
for the year
(15) Minority interests in
Group profit for the year
(16) Earnings per share
Cash flow from operating, investing and financing activitiesSpecial logistics
€ million 2006 2005
Change in cash and cash equivalents due to exchange rate fluctuations – –Cash flow from operating activities – 67.6Cash flow from investing activities – - 32.5Cash flow from financing activities – - 7.3Change in cash and cash equivalents – 27.8
The share in Group profit for the year attributable to TUI AG shareholders declinedfrom € 458.0 million in 2005 to a negative result of € 893.3 million in the 2006financial year.
Minority interests in Group profit for the year€ million 2006 2005
Profit attributable to minority interests 47.7 40.9Loss attributable to minority interests 1.0 2.6Total 46.7 38.3
Profit for the year attributable to minority interests mainly related to consolidatedsubsidiaries in the tourism division, in particular the companies of the RIU Group.Minority interests were also held in several incoming agencies.
In accordance with IAS 33, basic earnings per share were calculated by dividing theGroup’s net profit for the year attributable to TUI AG shareholders by the weightedaverage number of no-par value bearer shares outstanding during the financialyear under review. The average number of shares resulted from the total of sharesat the beginning of the financial year (250,732,575 shares) and the employee sharesissued (287,280 shares, 13 days), included on a pro rata temporis basis.
A dilution of earnings per share occurs when the average number of shares is in-creased by adding the issue of potential shares from the warrants and conversionoptions. Diluting effects exclusively arose from the convertible bond issued in October 2003. Conversion has been possible since 2 January 2004. Calculation ofthe diluting effect is based on the assumption of complete conversion and the corresponding issue of shares at the beginning of the respective financial year.However, no diluting effect arises in the event of negative basic earnings per share.
In accordance with IAS 33.12, the dividend on the hybrid capital was deductedfrom the share in Group profit attributable to TUI AG shareholders at its after-taxamount, since the hybrid capital was carried as equity but did not represent aninterest by TUI AG shareholders. For the hybrid capital, € 27.4 million of accrueddividend obligations were comprised in financial liabilities and were paid out inJanuary 2007.
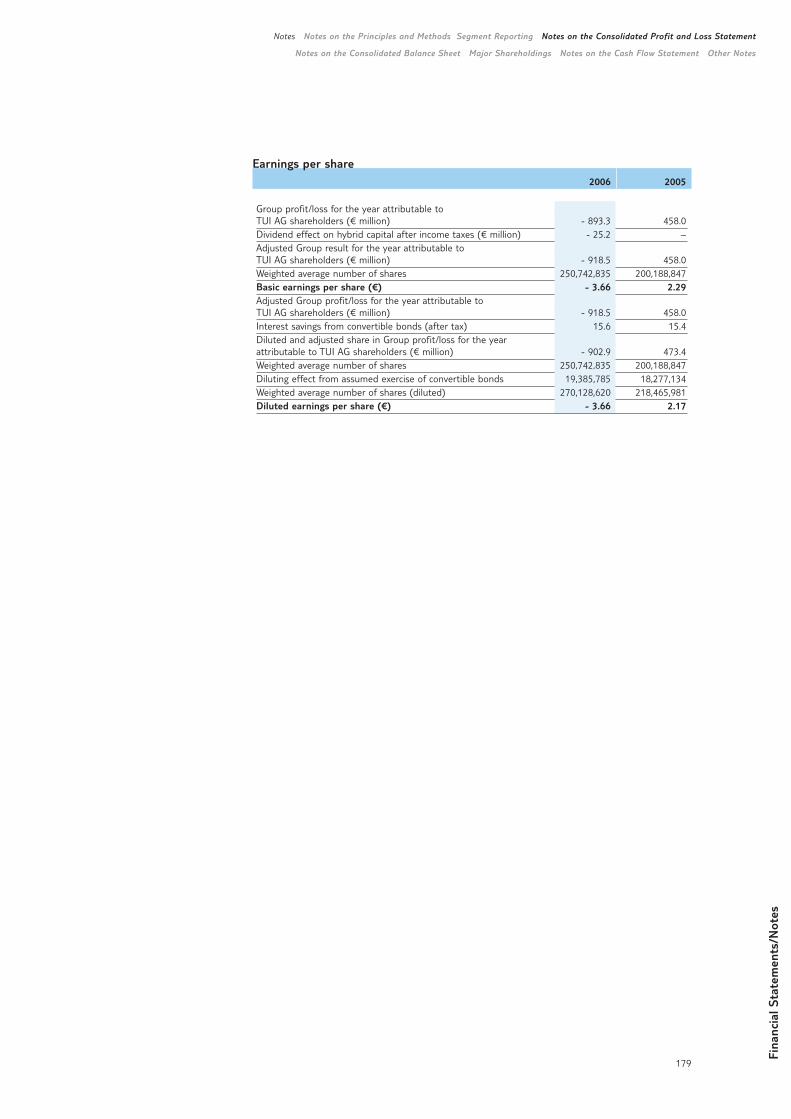
Fina
ncia
l Sta
tem
ents
/Not
es
179
Notes Notes on the Principles and Methods Segment Reporting Notes on the Consolidated Profit and Loss Statement
Notes on the Consolidated Balance Sheet Major Shareholdings Notes on the Cash Flow Statement Other Notes
Earnings per share2006 2005
Group profit/loss for the year attributable to TUI AG shareholders (€ million) - 893.3 458.0Dividend effect on hybrid capital after income taxes (€ million) - 25.2 –Adjusted Group result for the year attributable to TUI AG shareholders (€ million) - 918.5 458.0Weighted average number of shares 250,742,835 200,188,847Basic earnings per share (€) - 3.66 2.29Adjusted Group profit/loss for the year attributable to TUI AG shareholders (€ million) - 918.5 458.0Interest savings from convertible bonds (after tax) 15.6 15.4Diluted and adjusted share in Group profit/loss for the yearattributable to TUI AG shareholders (€ million) - 902.9 473.4Weighted average number of shares 250,742,835 200,188,847Diluting effect from assumed exercise of convertible bonds 19,385,785 18,277,134Weighted average number of shares (diluted) 270,128,620 218,465,981Diluted earnings per share (€) - 3.66 2.17
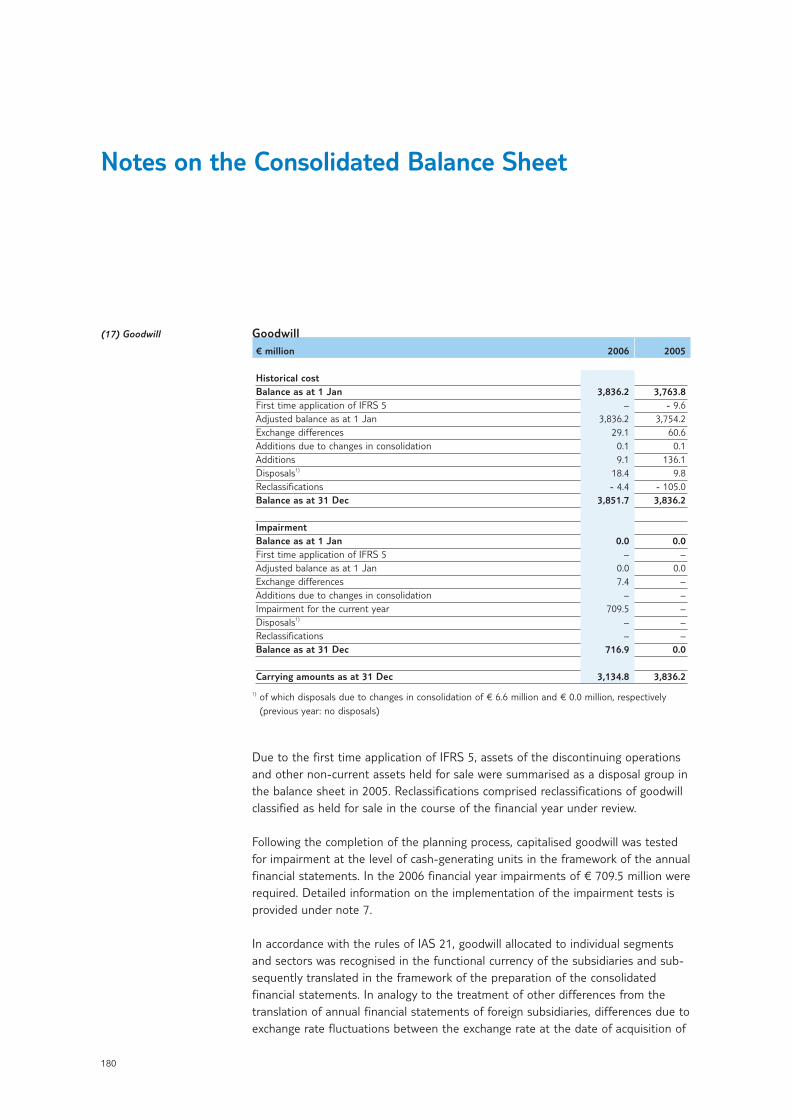
Notes on the Consolidated Balance Sheet
180
(17) Goodwill Goodwill€ million 2006 2005
Historical costBalance as at 1 Jan 3,836.2 3,763.8First time application of IFRS 5 – - 9.6Adjusted balance as at 1 Jan 3,836.2 3,754.2Exchange differences 29.1 60.6Additions due to changes in consolidation 0.1 0.1Additions 9.1 136.1Disposals1) 18.4 9.8Reclassifications - 4.4 - 105.0Balance as at 31 Dec 3,851.7 3,836.2
ImpairmentBalance as at 1 Jan 0.0 0.0First time application of IFRS 5 – –Adjusted balance as at 1 Jan 0.0 0.0Exchange differences 7.4 –Additions due to changes in consolidation – –Impairment for the current year 709.5 –Disposals1) – –Reclassifications – –Balance as at 31 Dec 716.9 0.0
Carrying amounts as at 31 Dec 3,134.8 3,836.2
1) of which disposals due to changes in consolidation of € 6.6 million and € 0.0 million, respectively(previous year: no disposals)
Due to the first time application of IFRS 5, assets of the discontinuing operationsand other non-current assets held for sale were summarised as a disposal group inthe balance sheet in 2005. Reclassifications comprised reclassifications of goodwillclassified as held for sale in the course of the financial year under review.
Following the completion of the planning process, capitalised goodwill was testedfor impairment at the level of cash-generating units in the framework of the annualfinancial statements. In the 2006 financial year impairments of € 709.5 million wererequired. Detailed information on the implementation of the impairment tests isprovided under note 7.
In accordance with the rules of IAS 21, goodwill allocated to individual segmentsand sectors was recognised in the functional currency of the subsidiaries and sub-sequently translated in the framework of the preparation of the consolidatedfinancial statements. In analogy to the treatment of other differences from thetranslation of annual financial statements of foreign subsidiaries, differences due toexchange rate fluctuations between the exchange rate at the date of acquisition of
Fina
ncia
l Sta
tem
ents
/Not
es
181
Notes Notes on the Principles and Methods Segment Reporting Notes on the Consolidated Profit and Loss Statement
Notes on the Consolidated Balance Sheet Major Shareholdings Notes on the Cash Flow Statement Other Notes
the subsidiary and the exchange rate at the balance sheet date were taken directlyto and recognised separately under equity. In the 2006 financial year, the carryingamount of goodwill rose by € 21.7 million (previous year: € 60.6 million) due toexchange differences. In addition, goodwill of GBP 4.5 million (€ 6.7 million) arosefrom the acquisition of Explorers Travel Club Ltd., Camberly (UK). The divestmentof subsidiaries in the financial year under review resulted in a disposal of goodwillof € 18.4 million.
A substantial portion of the goodwill recognised related to the source markets UK(€ 1,169.4 million), Germany (€ 338.9 million) and the Nordic countries (€ 321.0 mil-lion). In the hotel companies sector, goodwill of € 356.8 million was carried for theRIU Group. Goodwill of € 107.3 million related to the shipping segment.
The goodwill of € 0.9 million (previous year: € 19.9 million) from the acquisition ofminority interests in the financial year under review was directly offset againstother revenue reserves.
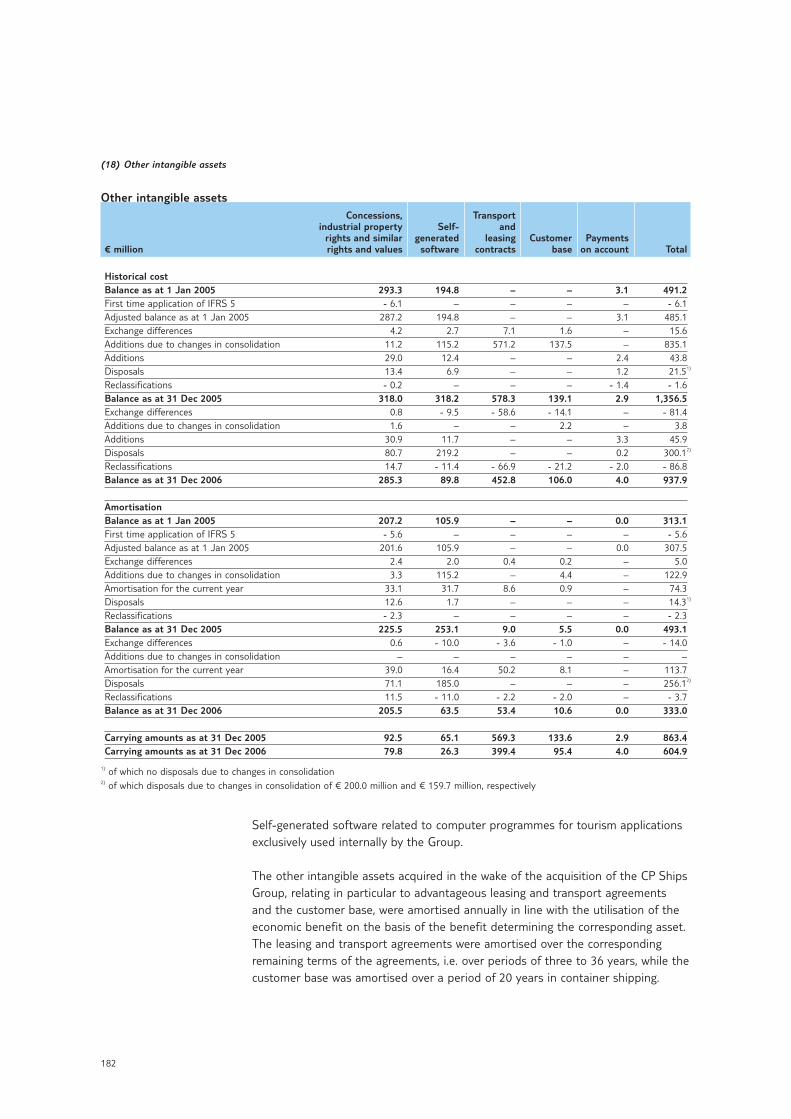
182
Self-generated software related to computer programmes for tourism applicationsexclusively used internally by the Group.
The other intangible assets acquired in the wake of the acquisition of the CP ShipsGroup, relating in particular to advantageous leasing and transport agreements and the customer base, were amortised annually in line with the utilisation of theeconomic benefit on the basis of the benefit determining the corresponding asset.The leasing and transport agreements were amortised over the correspondingremaining terms of the agreements, i.e. over periods of three to 36 years, while thecustomer base was amortised over a period of 20 years in container shipping.
(18) Other intangible assets
Other intangible assetsConcessions, Transport
industrial property Self- andrights and similar generated leasing Customer Payments
€ million rights and values software contracts base on account Total
Historical costBalance as at 1 Jan 2005 293.3 194.8 – – 3.1 491.2First time application of IFRS 5 - 6.1 – – – – - 6.1Adjusted balance as at 1 Jan 2005 287.2 194.8 – – 3.1 485.1Exchange differences 4.2 2.7 7.1 1.6 – 15.6Additions due to changes in consolidation 11.2 115.2 571.2 137.5 – 835.1Additions 29.0 12.4 – – 2.4 43.8Disposals 13.4 6.9 – – 1.2 21.51)
Reclassifications - 0.2 – – – - 1.4 - 1.6Balance as at 31 Dec 2005 318.0 318.2 578.3 139.1 2.9 1,356.5Exchange differences 0.8 - 9.5 - 58.6 - 14.1 – - 81.4Additions due to changes in consolidation 1.6 – – 2.2 – 3.8Additions 30.9 11.7 – – 3.3 45.9Disposals 80.7 219.2 – – 0.2 300.12)
Reclassifications 14.7 - 11.4 - 66.9 - 21.2 - 2.0 - 86.8Balance as at 31 Dec 2006 285.3 89.8 452.8 106.0 4.0 937.9
AmortisationBalance as at 1 Jan 2005 207.2 105.9 – – 0.0 313.1First time application of IFRS 5 - 5.6 – – – – - 5.6Adjusted balance as at 1 Jan 2005 201.6 105.9 – – 0.0 307.5Exchange differences 2.4 2.0 0.4 0.2 – 5.0Additions due to changes in consolidation 3.3 115.2 – 4.4 – 122.9Amortisation for the current year 33.1 31.7 8.6 0.9 – 74.3Disposals 12.6 1.7 – – – 14.31)
Reclassifications - 2.3 – – – – - 2.3Balance as at 31 Dec 2005 225.5 253.1 9.0 5.5 0.0 493.1Exchange differences 0.6 - 10.0 - 3.6 - 1.0 – - 14.0Additions due to changes in consolidation – – – – – –Amortisation for the current year 39.0 16.4 50.2 8.1 – 113.7Disposals 71.1 185.0 – – – 256.12)
Reclassifications 11.5 - 11.0 - 2.2 - 2.0 – - 3.7Balance as at 31 Dec 2006 205.5 63.5 53.4 10.6 0.0 333.0
Carrying amounts as at 31 Dec 2005 92.5 65.1 569.3 133.6 2.9 863.4Carrying amounts as at 31 Dec 2006 79.8 26.3 399.4 95.4 4.0 604.9
1) of which no disposals due to changes in consolidation 2) of which disposals due to changes in consolidation of € 200.0 million and € 159.7 million, respectively
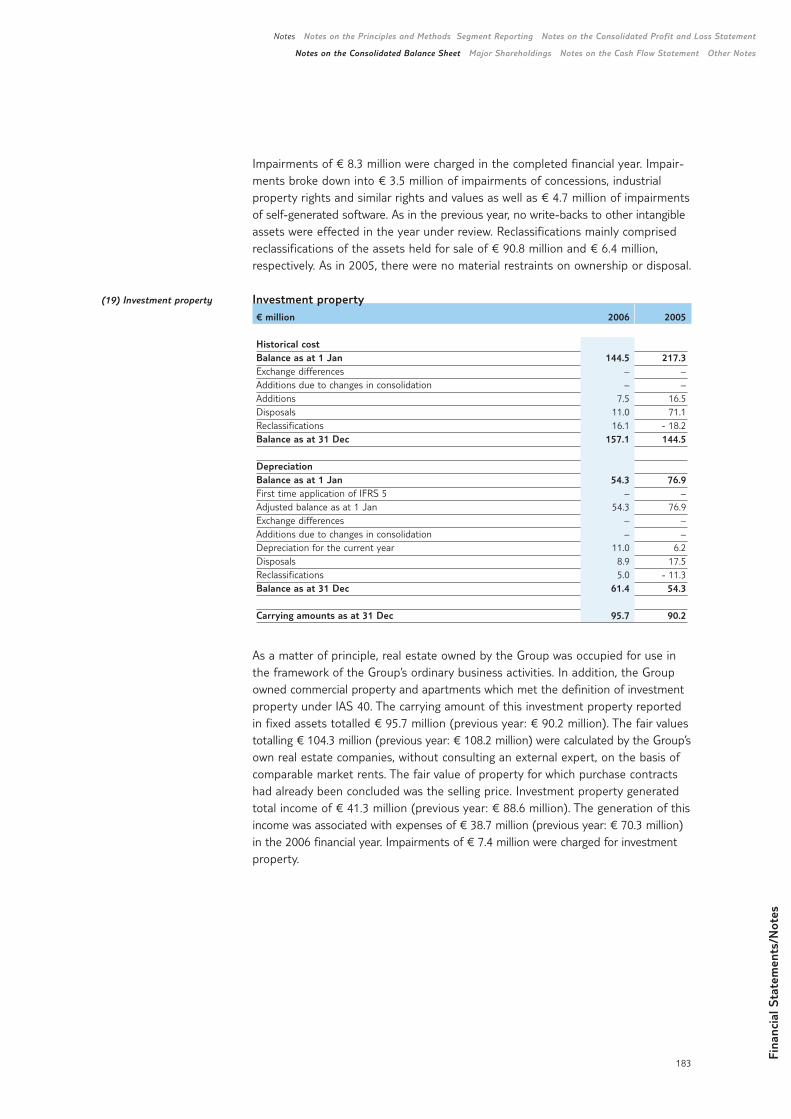
Fina
ncia
l Sta
tem
ents
/Not
es
183
Notes Notes on the Principles and Methods Segment Reporting Notes on the Consolidated Profit and Loss Statement
Notes on the Consolidated Balance Sheet Major Shareholdings Notes on the Cash Flow Statement Other Notes
(19) Investment property
Impairments of € 8.3 million were charged in the completed financial year. Impair-ments broke down into € 3.5 million of impairments of concessions, industrial property rights and similar rights and values as well as € 4.7 million of impairmentsof self-generated software. As in the previous year, no write-backs to other intangibleassets were effected in the year under review. Reclassifications mainly comprisedreclassifications of the assets held for sale of € 90.8 million and € 6.4 million, respectively. As in 2005, there were no material restraints on ownership or disposal.
Investment property€ million 2006 2005
Historical costBalance as at 1 Jan 144.5 217.3Exchange differences – –Additions due to changes in consolidation – –Additions 7.5 16.5Disposals 11.0 71.1Reclassifications 16.1 - 18.2Balance as at 31 Dec 157.1 144.5
DepreciationBalance as at 1 Jan 54.3 76.9First time application of IFRS 5 – –Adjusted balance as at 1 Jan 54.3 76.9Exchange differences – –Additions due to changes in consolidation – –Depreciation for the current year 11.0 6.2Disposals 8.9 17.5Reclassifications 5.0 - 11.3Balance as at 31 Dec 61.4 54.3
Carrying amounts as at 31 Dec 95.7 90.2
As a matter of principle, real estate owned by the Group was occupied for use inthe framework of the Group’s ordinary business activities. In addition, the Groupowned commercial property and apartments which met the definition of investmentproperty under IAS 40. The carrying amount of this investment property reportedin fixed assets totalled € 95.7 million (previous year: € 90.2 million). The fair valuestotalling € 104.3 million (previous year: € 108.2 million) were calculated by the Group’sown real estate companies, without consulting an external expert, on the basis ofcomparable market rents. The fair value of property for which purchase contractshad already been concluded was the selling price. Investment property generatedtotal income of € 41.3 million (previous year: € 88.6 million). The generation of thisincome was associated with expenses of € 38.7 million (previous year: € 70.3 million)in the 2006 financial year. Impairments of € 7.4 million were charged for investmentproperty.
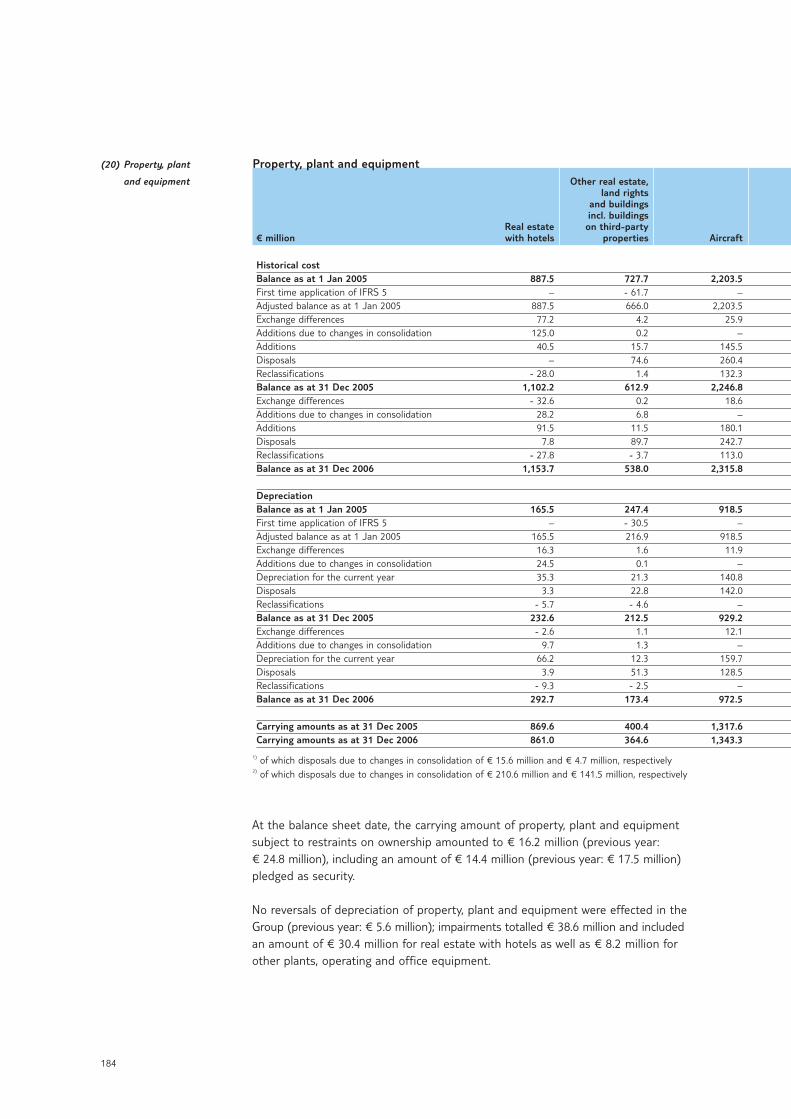
184
At the balance sheet date, the carrying amount of property, plant and equipmentsubject to restraints on ownership amounted to € 16.2 million (previous year: € 24.8 million), including an amount of € 14.4 million (previous year: € 17.5 million)pledged as security.
No reversals of depreciation of property, plant and equipment were effected in theGroup (previous year: € 5.6 million); impairments totalled € 38.6 million and includedan amount of € 30.4 million for real estate with hotels as well as € 8.2 million forother plants, operating and office equipment.
Property, plant and equipmentOther real estate,
land rightsand buildingsincl. buildings
Real estate on third-party€ million with hotels properties Aircraft
Historical costBalance as at 1 Jan 2005 887.5 727.7 2,203.5First time application of IFRS 5 – - 61.7 –Adjusted balance as at 1 Jan 2005 887.5 666.0 2,203.5Exchange differences 77.2 4.2 25.9Additions due to changes in consolidation 125.0 0.2 –Additions 40.5 15.7 145.5Disposals – 74.6 260.4Reclassifications - 28.0 1.4 132.3Balance as at 31 Dec 2005 1,102.2 612.9 2,246.8Exchange differences - 32.6 0.2 18.6Additions due to changes in consolidation 28.2 6.8 –Additions 91.5 11.5 180.1Disposals 7.8 89.7 242.7Reclassifications - 27.8 - 3.7 113.0Balance as at 31 Dec 2006 1,153.7 538.0 2,315.8
DepreciationBalance as at 1 Jan 2005 165.5 247.4 918.5First time application of IFRS 5 – - 30.5 –Adjusted balance as at 1 Jan 2005 165.5 216.9 918.5Exchange differences 16.3 1.6 11.9Additions due to changes in consolidation 24.5 0.1 –Depreciation for the current year 35.3 21.3 140.8Disposals 3.3 22.8 142.0Reclassifications - 5.7 - 4.6 –Balance as at 31 Dec 2005 232.6 212.5 929.2Exchange differences - 2.6 1.1 12.1Additions due to changes in consolidation 9.7 1.3 –Depreciation for the current year 66.2 12.3 159.7Disposals 3.9 51.3 128.5Reclassifications - 9.3 - 2.5 –Balance as at 31 Dec 2006 292.7 173.4 972.5
Carrying amounts as at 31 Dec 2005 869.6 400.4 1,317.6Carrying amounts as at 31 Dec 2006 861.0 364.6 1,343.3
1) of which disposals due to changes in consolidation of € 15.6 million and € 4.7 million, respectively2) of which disposals due to changes in consolidation of € 210.6 million and € 141.5 million, respectively
(20) Property, plant
and equipment
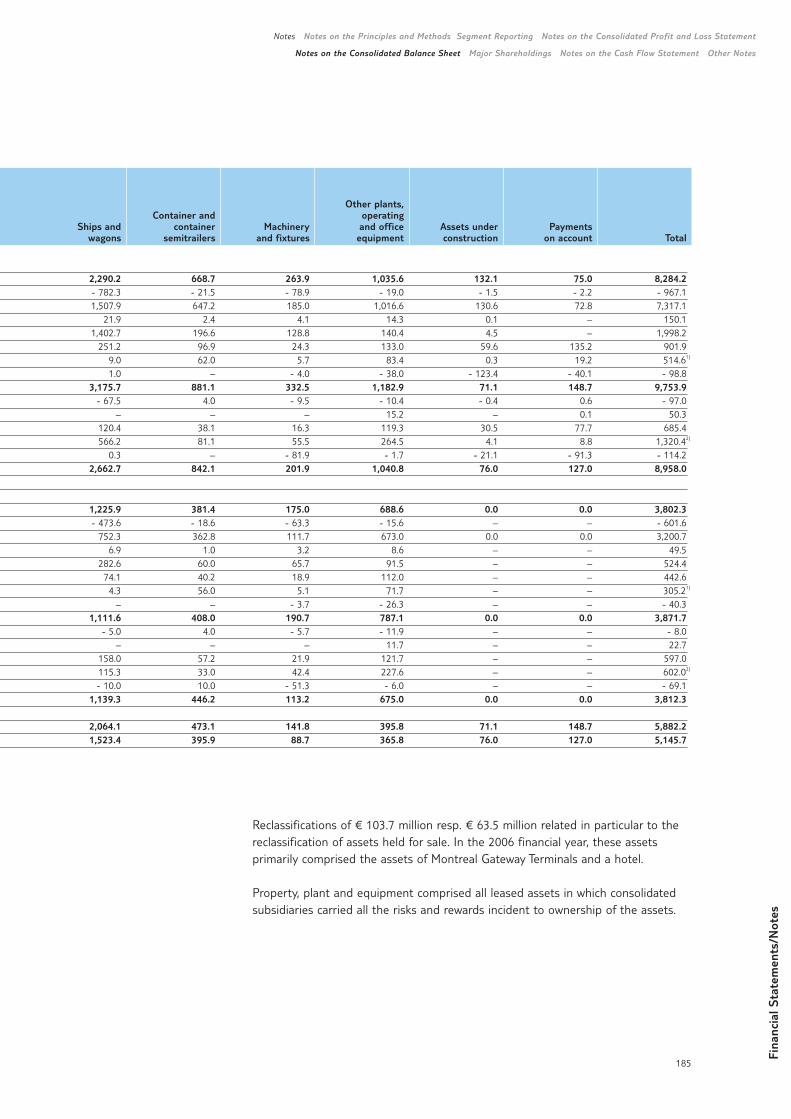
Fina
ncia
l Sta
tem
ents
/Not
es
185
Notes Notes on the Principles and Methods Segment Reporting Notes on the Consolidated Profit and Loss Statement
Notes on the Consolidated Balance Sheet Major Shareholdings Notes on the Cash Flow Statement Other Notes
Reclassifications of € 103.7 million resp. € 63.5 million related in particular to thereclassification of assets held for sale. In the 2006 financial year, these assets primarily comprised the assets of Montreal Gateway Terminals and a hotel.
Property, plant and equipment comprised all leased assets in which consolidatedsubsidiaries carried all the risks and rewards incident to ownership of the assets.
Other plants,Container and operating
Ships and container Machinery and office Assets under Paymentswagons semitrailers and fixtures equipment construction on account Total
2,290.2 668.7 263.9 1,035.6 132.1 75.0 8,284.2- 782.3 - 21.5 - 78.9 - 19.0 - 1.5 - 2.2 - 967.11,507.9 647.2 185.0 1,016.6 130.6 72.8 7,317.1
21.9 2.4 4.1 14.3 0.1 – 150.11,402.7 196.6 128.8 140.4 4.5 – 1,998.2
251.2 96.9 24.3 133.0 59.6 135.2 901.99.0 62.0 5.7 83.4 0.3 19.2 514.61)
1.0 – - 4.0 - 38.0 - 123.4 - 40.1 - 98.83,175.7 881.1 332.5 1,182.9 71.1 148.7 9,753.9
- 67.5 4.0 - 9.5 - 10.4 - 0.4 0.6 - 97.0– – – 15.2 – 0.1 50.3
120.4 38.1 16.3 119.3 30.5 77.7 685.4566.2 81.1 55.5 264.5 4.1 8.8 1,320.42)
0.3 – - 81.9 - 1.7 - 21.1 - 91.3 - 114.22,662.7 842.1 201.9 1,040.8 76.0 127.0 8,958.0
1,225.9 381.4 175.0 688.6 0.0 0.0 3,802.3- 473.6 - 18.6 - 63.3 - 15.6 – – - 601.6
752.3 362.8 111.7 673.0 0.0 0.0 3,200.76.9 1.0 3.2 8.6 – – 49.5
282.6 60.0 65.7 91.5 – – 524.474.1 40.2 18.9 112.0 – – 442.64.3 56.0 5.1 71.7 – – 305.21)
– – - 3.7 - 26.3 – – - 40.31,111.6 408.0 190.7 787.1 0.0 0.0 3,871.7
- 5.0 4.0 - 5.7 - 11.9 – – - 8.0– – – 11.7 – – 22.7
158.0 57.2 21.9 121.7 – – 597.0115.3 33.0 42.4 227.6 – – 602.02)
- 10.0 10.0 - 51.3 - 6.0 – – - 69.11,139.3 446.2 113.2 675.0 0.0 0.0 3,812.3
2,064.1 473.1 141.8 395.8 71.1 148.7 5,882.21,523.4 395.9 88.7 365.8 76.0 127.0 5,145.7
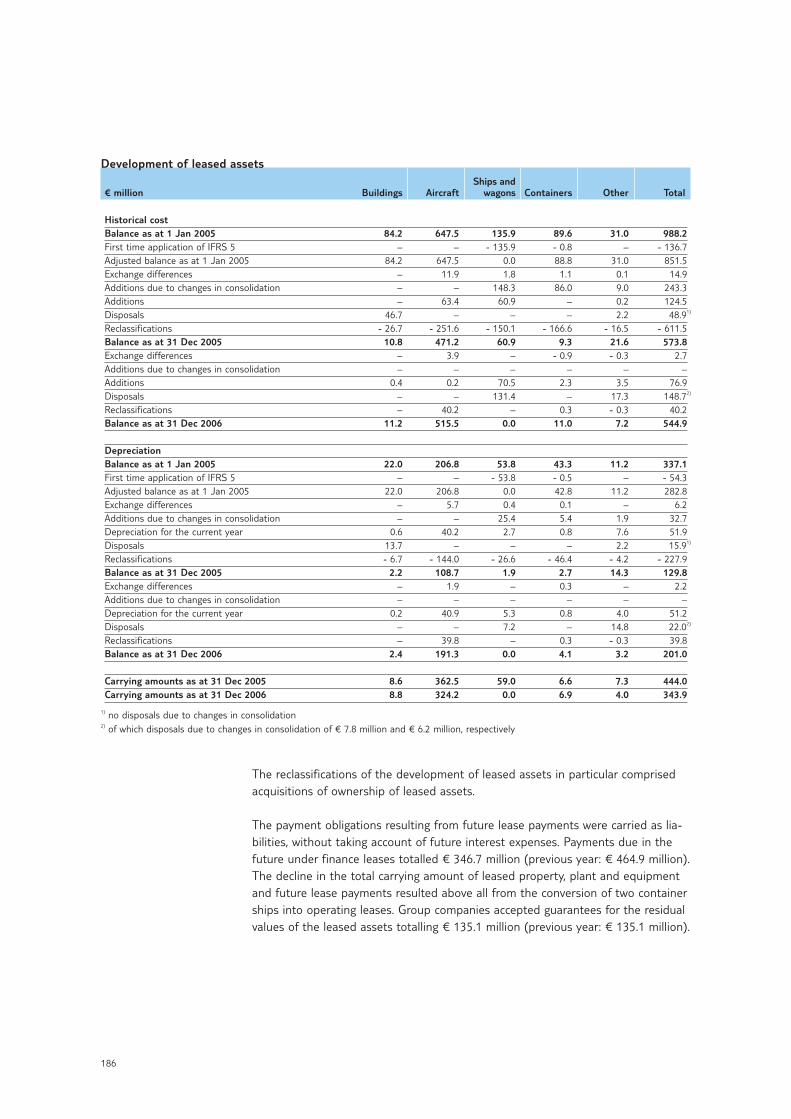
186
The reclassifications of the development of leased assets in particular comprisedacquisitions of ownership of leased assets.
The payment obligations resulting from future lease payments were carried as lia-bilities, without taking account of future interest expenses. Payments due in thefuture under finance leases totalled € 346.7 million (previous year: € 464.9 million).The decline in the total carrying amount of leased property, plant and equipmentand future lease payments resulted above all from the conversion of two containerships into operating leases. Group companies accepted guarantees for the residualvalues of the leased assets totalling € 135.1 million (previous year: € 135.1 million).
Development of leased assetsShips and
€ million Buildings Aircraft wagons Containers Other Total
Historical costBalance as at 1 Jan 2005 84.2 647.5 135.9 89.6 31.0 988.2First time application of IFRS 5 – – - 135.9 - 0.8 – - 136.7Adjusted balance as at 1 Jan 2005 84.2 647.5 0.0 88.8 31.0 851.5Exchange differences – 11.9 1.8 1.1 0.1 14.9Additions due to changes in consolidation – – 148.3 86.0 9.0 243.3Additions – 63.4 60.9 – 0.2 124.5Disposals 46.7 – – – 2.2 48.91)
Reclassifications - 26.7 - 251.6 - 150.1 - 166.6 - 16.5 - 611.5Balance as at 31 Dec 2005 10.8 471.2 60.9 9.3 21.6 573.8Exchange differences – 3.9 – - 0.9 - 0.3 2.7Additions due to changes in consolidation – – – – – –Additions 0.4 0.2 70.5 2.3 3.5 76.9Disposals – – 131.4 – 17.3 148.72)
Reclassifications – 40.2 – 0.3 - 0.3 40.2Balance as at 31 Dec 2006 11.2 515.5 0.0 11.0 7.2 544.9
DepreciationBalance as at 1 Jan 2005 22.0 206.8 53.8 43.3 11.2 337.1First time application of IFRS 5 – – - 53.8 - 0.5 – - 54.3Adjusted balance as at 1 Jan 2005 22.0 206.8 0.0 42.8 11.2 282.8Exchange differences – 5.7 0.4 0.1 – 6.2Additions due to changes in consolidation – – 25.4 5.4 1.9 32.7Depreciation for the current year 0.6 40.2 2.7 0.8 7.6 51.9Disposals 13.7 – – – 2.2 15.91)
Reclassifications - 6.7 - 144.0 - 26.6 - 46.4 - 4.2 - 227.9Balance as at 31 Dec 2005 2.2 108.7 1.9 2.7 14.3 129.8Exchange differences – 1.9 – 0.3 – 2.2Additions due to changes in consolidation – – – – – –Depreciation for the current year 0.2 40.9 5.3 0.8 4.0 51.2Disposals – – 7.2 – 14.8 22.02)
Reclassifications – 39.8 – 0.3 - 0.3 39.8Balance as at 31 Dec 2006 2.4 191.3 0.0 4.1 3.2 201.0
Carrying amounts as at 31 Dec 2005 8.6 362.5 59.0 6.6 7.3 444.0Carrying amounts as at 31 Dec 2006 8.8 324.2 0.0 6.9 4.0 343.9
1) no disposals due to changes in consolidation2) of which disposals due to changes in consolidation of € 7.8 million and € 6.2 million, respectively
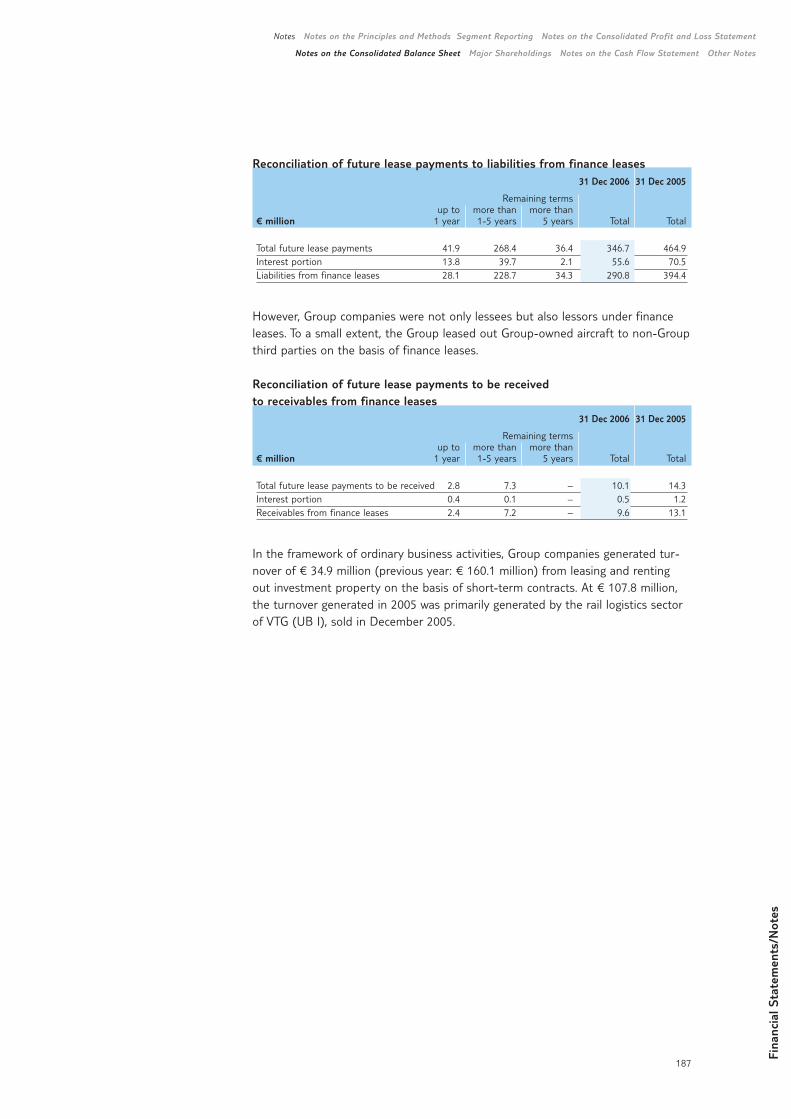
Fina
ncia
l Sta
tem
ents
/Not
es
187
Notes Notes on the Principles and Methods Segment Reporting Notes on the Consolidated Profit and Loss Statement
Notes on the Consolidated Balance Sheet Major Shareholdings Notes on the Cash Flow Statement Other Notes
Reconciliation of future lease payments to liabilities from finance leases31 Dec 2006 31 Dec 2005
Remaining termsup to more than more than
€ million 1 year 1-5 years 5 years Total Total
Total future lease payments 41.9 268.4 36.4 346.7 464.9Interest portion 13.8 39.7 2.1 55.6 70.5Liabilities from finance leases 28.1 228.7 34.3 290.8 394.4
However, Group companies were not only lessees but also lessors under financeleases. To a small extent, the Group leased out Group-owned aircraft to non-Groupthird parties on the basis of finance leases.
Reconciliation of future lease payments to be received to receivables from finance leases
31 Dec 2006 31 Dec 2005
Remaining termsup to more than more than
€ million 1 year 1-5 years 5 years Total Total
Total future lease payments to be received 2.8 7.3 – 10.1 14.3Interest portion 0.4 0.1 – 0.5 1.2Receivables from finance leases 2.4 7.2 – 9.6 13.1
In the framework of ordinary business activities, Group companies generated tur-nover of € 34.9 million (previous year: € 160.1 million) from leasing and rentingout investment property on the basis of short-term contracts. At € 107.8 million,the turnover generated in 2005 was primarily generated by the rail logistics sectorof VTG (UB I), sold in December 2005.
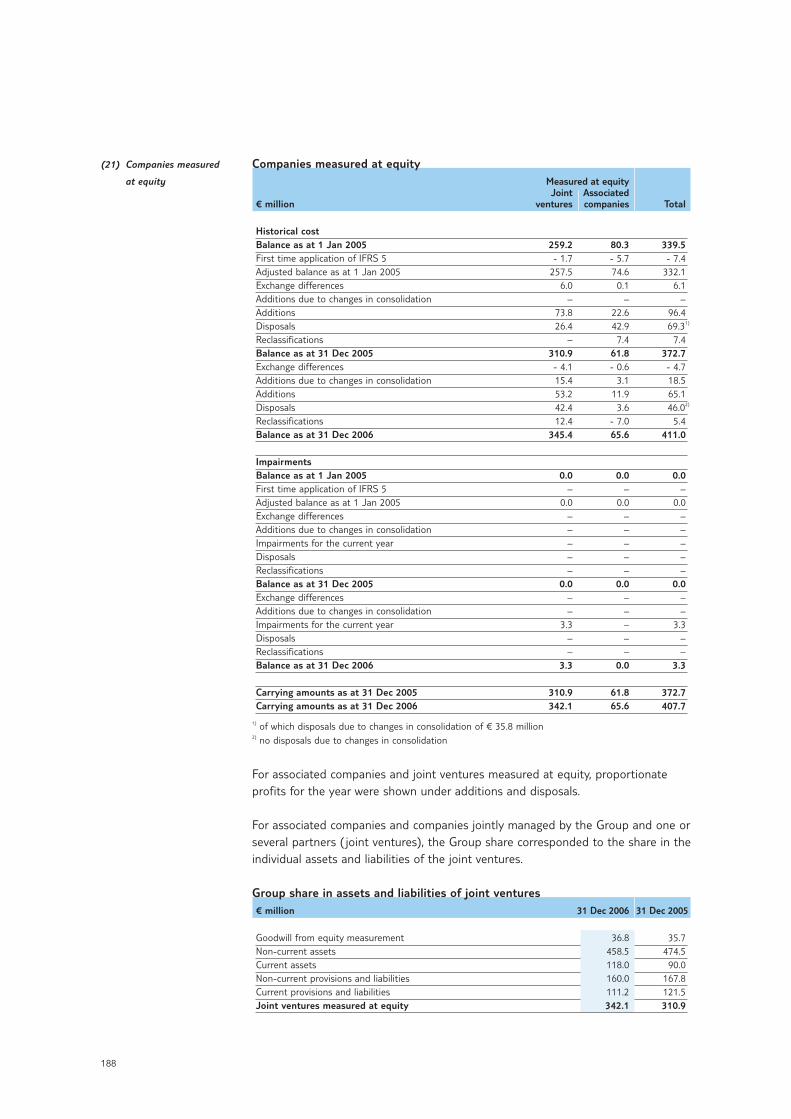
188
(21) Companies measured
at equity
Companies measured at equityMeasured at equityJoint Associated
€ million ventures companies Total
Historical costBalance as at 1 Jan 2005 259.2 80.3 339.5First time application of IFRS 5 - 1.7 - 5.7 - 7.4Adjusted balance as at 1 Jan 2005 257.5 74.6 332.1Exchange differences 6.0 0.1 6.1Additions due to changes in consolidation – – –Additions 73.8 22.6 96.4Disposals 26.4 42.9 69.31)
Reclassifications – 7.4 7.4Balance as at 31 Dec 2005 310.9 61.8 372.7Exchange differences - 4.1 - 0.6 - 4.7Additions due to changes in consolidation 15.4 3.1 18.5Additions 53.2 11.9 65.1Disposals 42.4 3.6 46.02)
Reclassifications 12.4 - 7.0 5.4Balance as at 31 Dec 2006 345.4 65.6 411.0
ImpairmentsBalance as at 1 Jan 2005 0.0 0.0 0.0First time application of IFRS 5 – – –Adjusted balance as at 1 Jan 2005 0.0 0.0 0.0Exchange differences – – –Additions due to changes in consolidation – – –Impairments for the current year – – –Disposals – – –Reclassifications – – –Balance as at 31 Dec 2005 0.0 0.0 0.0Exchange differences – – –Additions due to changes in consolidation – – –Impairments for the current year 3.3 – 3.3Disposals – – –Reclassifications – – –Balance as at 31 Dec 2006 3.3 0.0 3.3
Carrying amounts as at 31 Dec 2005 310.9 61.8 372.7Carrying amounts as at 31 Dec 2006 342.1 65.6 407.7
1) of which disposals due to changes in consolidation of € 35.8 million2) no disposals due to changes in consolidation
For associated companies and joint ventures measured at equity, proportionateprofits for the year were shown under additions and disposals.
For associated companies and companies jointly managed by the Group and one orseveral partners ( joint ventures), the Group share corresponded to the share in theindividual assets and liabilities of the joint ventures.
Group share in assets and liabilities of joint ventures€ million 31 Dec 2006 31 Dec 2005
Goodwill from equity measurement 36.8 35.7Non-current assets 458.5 474.5Current assets 118.0 90.0Non-current provisions and liabilities 160.0 167.8Current provisions and liabilities 111.2 121.5Joint ventures measured at equity 342.1 310.9
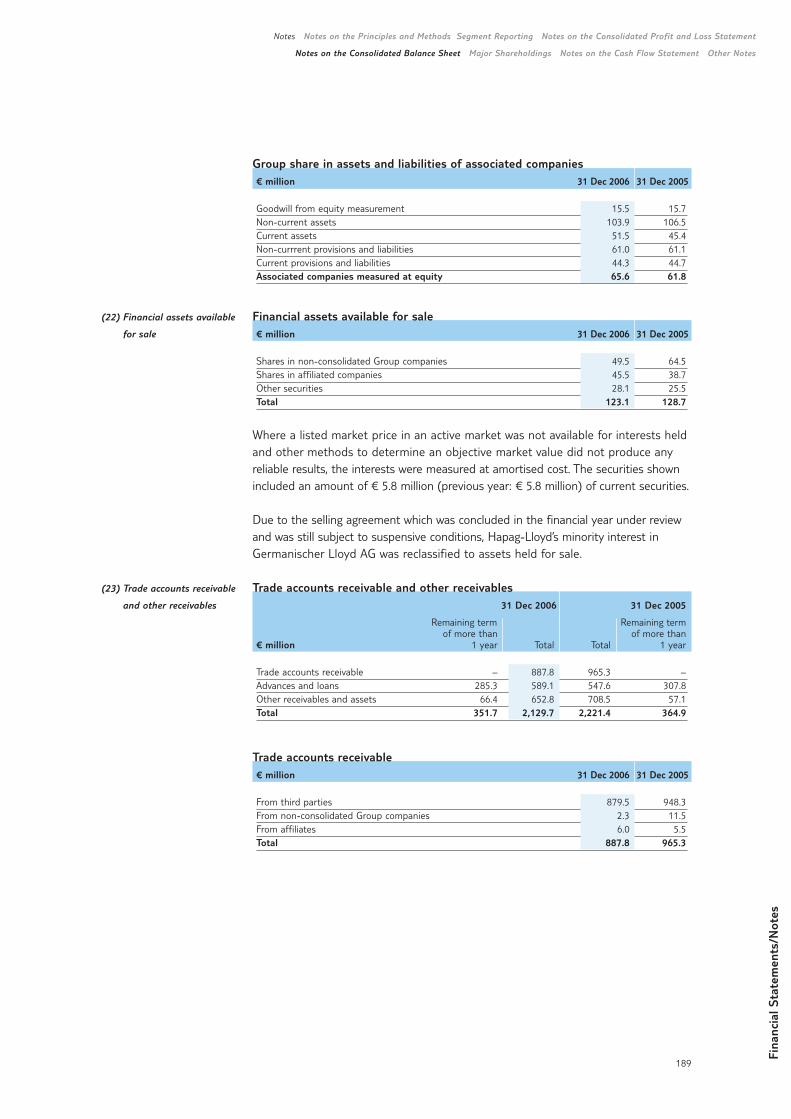
Fina
ncia
l Sta
tem
ents
/Not
es
189
Notes Notes on the Principles and Methods Segment Reporting Notes on the Consolidated Profit and Loss Statement
Notes on the Consolidated Balance Sheet Major Shareholdings Notes on the Cash Flow Statement Other Notes
(22) Financial assets available
for sale
(23) Trade accounts receivable
and other receivables
Group share in assets and liabilities of associated companies € million 31 Dec 2006 31 Dec 2005
Goodwill from equity measurement 15.5 15.7Non-current assets 103.9 106.5Current assets 51.5 45.4Non-currrent provisions and liabilities 61.0 61.1Current provisions and liabilities 44.3 44.7Associated companies measured at equity 65.6 61.8
Financial assets available for sale € million 31 Dec 2006 31 Dec 2005
Shares in non-consolidated Group companies 49.5 64.5Shares in affiliated companies 45.5 38.7Other securities 28.1 25.5Total 123.1 128.7
Where a listed market price in an active market was not available for interests heldand other methods to determine an objective market value did not produce anyreliable results, the interests were measured at amortised cost. The securities shownincluded an amount of € 5.8 million (previous year: € 5.8 million) of current securities.
Due to the selling agreement which was concluded in the financial year under reviewand was still subject to suspensive conditions, Hapag-Lloyd’s minority interest in Germanischer Lloyd AG was reclassified to assets held for sale.
Trade accounts receivable and other receivables31 Dec 2006 31 Dec 2005
Remaining term Remaining termof more than of more than
€ million 1 year Total Total 1 year
Trade accounts receivable – 887.8 965.3 –Advances and loans 285.3 589.1 547.6 307.8Other receivables and assets 66.4 652.8 708.5 57.1Total 351.7 2,129.7 2,221.4 364.9
Trade accounts receivable€ million 31 Dec 2006 31 Dec 2005
From third parties 879.5 948.3From non-consolidated Group companies 2.3 11.5From affiliates 6.0 5.5Total 887.8 965.3

190
(24) Derivative financial
instruments
(25) Current and deferred
income tax claims
Advances and loans 31 Dec 2006 31 Dec 2005
Remaining Remainingterm of more term of more
€ million than 1 year Total Total than 1 year
Advances to non-consolidated Group companies 4.5 9.3 34.9 28.8Loans to non-consolidated Group companies 1.2 1.2 1.1 0.3Advances to affiliates 0.9 16.4 23.3 9.8Loans to affiliates 1.1 9.7 6.4 3.5Advances to third parties 13.3 66.3 21.7 4.0Loans to third parties 150.9 176.2 191.8 167.8Payments on account 113.4 310.0 268.4 93.6Total 285.3 589.1 547.6 307.8
Payments on account mainly related to advance payments for future tourism services,in particular hotel services, customary in the industry.
Loans and advances were recognised at amortised cost, based on the effectiveinterest method.
Other receivables and assets31 Dec 2006 31 Dec 2005
Remaining Remainingterm of more term of more
€ million than 1 year Total Total than 1 year
Other receivables from non-consolidated Group companies 2.0 4.8 8.5 0.4Other receivables from affiliates 2.8 8.7 10.4 2.5Interest deferral 3.9 15.8 20.6 9.0Receivables from finance leases 7.2 9.6 13.1 10.6Other tax refund claims 9.6 86.5 61.8 –Other assets 38.8 221.6 312.5 34.4Prepaid expenses 2.1 305.8 281.6 0.2Total 66.4 652.8 708.5 57.1
Prepaid expenses mainly comprised accrued expenses for return flights taking place after the balance sheet date and accrued rental costs.
Derivative financial instruments31 Dec 2006 31 Dec 2005
Remaining Remainingterm of more term of more
€ million than 1 year Total Total than 1 year
Receivables from derivative financial instruments 7.8 84.0 200.2 51.1
Derivative financial instruments, primarily serving to hedge the future operativebusiness, are detailed in the explanations on financial instruments.
Income tax claims€ million 31 Dec 2006 31 Dec 2005
Deferred income tax claims 275.6 299.4Current income tax claims 23.4 15.6Total 299.0 315.0
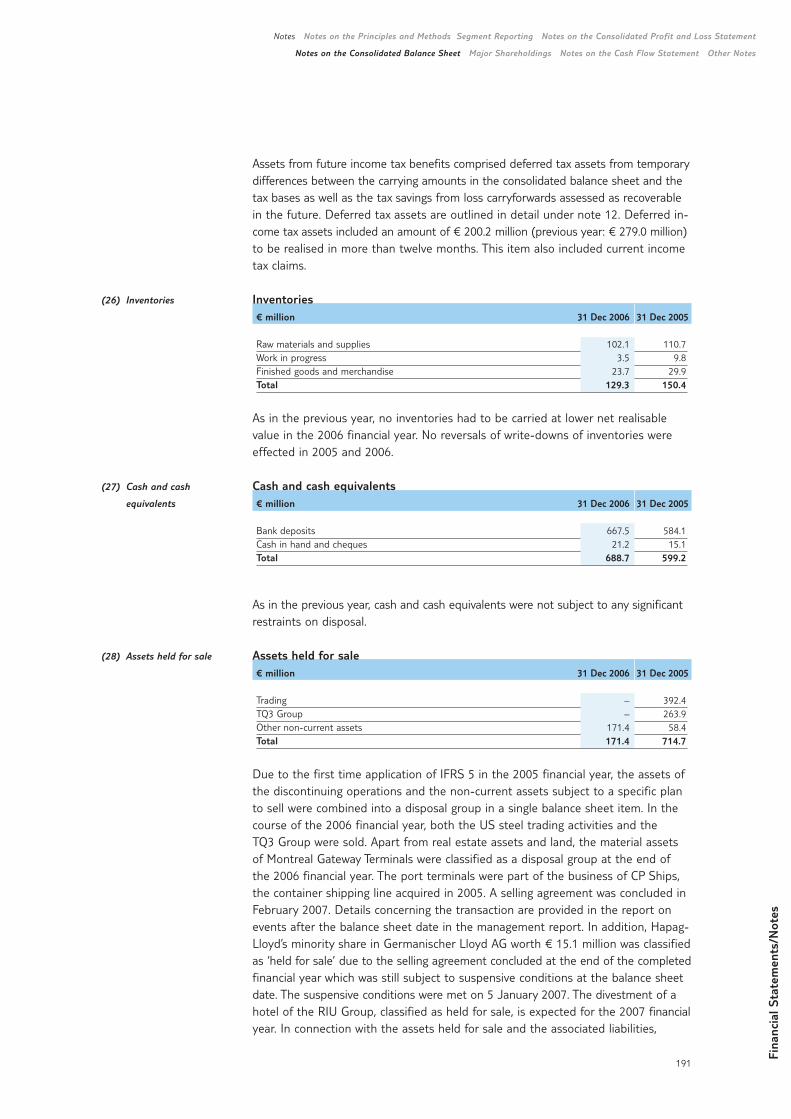
Fina
ncia
l Sta
tem
ents
/Not
es
191
Notes Notes on the Principles and Methods Segment Reporting Notes on the Consolidated Profit and Loss Statement
Notes on the Consolidated Balance Sheet Major Shareholdings Notes on the Cash Flow Statement Other Notes
(26) Inventories
(27) Cash and cash
equivalents
(28) Assets held for sale
Assets from future income tax benefits comprised deferred tax assets from temporarydifferences between the carrying amounts in the consolidated balance sheet and thetax bases as well as the tax savings from loss carryforwards assessed as recoverablein the future. Deferred tax assets are outlined in detail under note 12. Deferred in-come tax assets included an amount of € 200.2 million (previous year: € 279.0 million)to be realised in more than twelve months. This item also included current incometax claims.
Inventories€ million 31 Dec 2006 31 Dec 2005
Raw materials and supplies 102.1 110.7Work in progress 3.5 9.8Finished goods and merchandise 23.7 29.9Total 129.3 150.4
As in the previous year, no inventories had to be carried at lower net realisablevalue in the 2006 financial year. No reversals of write-downs of inventories wereeffected in 2005 and 2006.
Cash and cash equivalents€ million 31 Dec 2006 31 Dec 2005
Bank deposits 667.5 584.1Cash in hand and cheques 21.2 15.1Total 688.7 599.2
As in the previous year, cash and cash equivalents were not subject to any significantrestraints on disposal.
Assets held for sale€ million 31 Dec 2006 31 Dec 2005
Trading – 392.4TQ3 Group – 263.9Other non-current assets 171.4 58.4Total 171.4 714.7
Due to the first time application of IFRS 5 in the 2005 financial year, the assets ofthe discontinuing operations and the non-current assets subject to a specific planto sell were combined into a disposal group in a single balance sheet item. In thecourse of the 2006 financial year, both the US steel trading activities and the TQ3 Group were sold. Apart from real estate assets and land, the material assetsof Montreal Gateway Terminals were classified as a disposal group at the end ofthe 2006 financial year. The port terminals were part of the business of CP Ships,the container shipping line acquired in 2005. A selling agreement was concluded inFebruary 2007. Details concerning the transaction are provided in the report onevents after the balance sheet date in the management report. In addition, Hapag-Lloyd’s minority share in Germanischer Lloyd AG worth € 15.1 million was classifiedas ‘held for sale’ due to the selling agreement concluded at the end of the completedfinancial year which was still subject to suspensive conditions at the balance sheetdate. The suspensive conditions were met on 5 January 2007. The divestment of ahotel of the RIU Group, classified as held for sale, is expected for the 2007 financialyear. In connection with the assets held for sale and the associated liabilities,
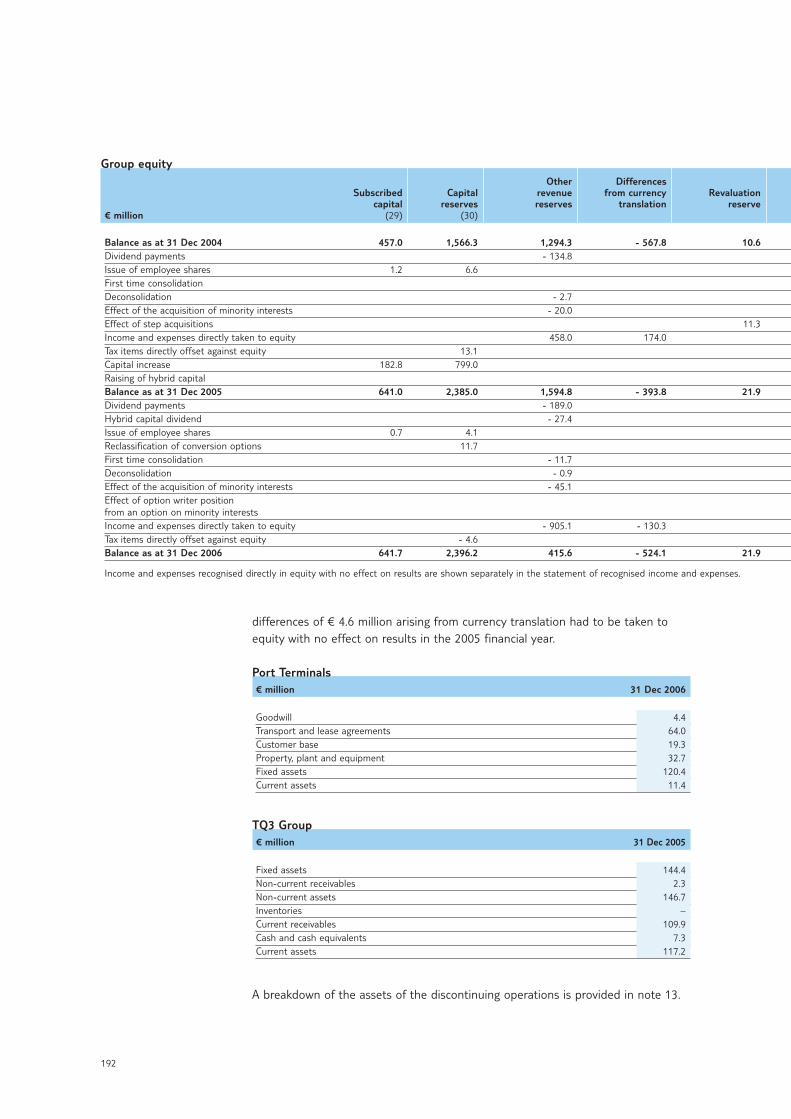
192
differences of € 4.6 million arising from currency translation had to be taken toequity with no effect on results in the 2005 financial year.
Port Terminals€ million 31 Dec 2006
Goodwill 4.4Transport and lease agreements 64.0Customer base 19.3Property, plant and equipment 32.7Fixed assets 120.4Current assets 11.4
TQ3 Group € million 31 Dec 2005
Fixed assets 144.4Non-current receivables 2.3Non-current assets 146.7Inventories –Current receivables 109.9Cash and cash equivalents 7.3Current assets 117.2
A breakdown of the assets of the discontinuing operations is provided in note 13.
Group equityOther Differences
Subscribed Capital revenue from currency Revaluationcapital reserves reserves translation reserve
€ million (29) (30)
Balance as at 31 Dec 2004 457.0 1,566.3 1,294.3 - 567.8 10.6Dividend payments - 134.8Issue of employee shares 1.2 6.6First time consolidationDeconsolidation - 2.7Effect of the acquisition of minority interests - 20.0Effect of step acquisitions 11.3Income and expenses directly taken to equity 458.0 174.0Tax items directly offset against equity 13.1Capital increase 182.8 799.0Raising of hybrid capitalBalance as at 31 Dec 2005 641.0 2,385.0 1,594.8 - 393.8 21.9Dividend payments - 189.0Hybrid capital dividend - 27.4Issue of employee shares 0.7 4.1Reclassification of conversion options 11.7First time consolidation - 11.7Deconsolidation - 0.9Effect of the acquisition of minority interests - 45.1Effect of option writer position from an option on minority interestsIncome and expenses directly taken to equity - 905.1 - 130.3Tax items directly offset against equity - 4.6Balance as at 31 Dec 2006 641.7 2,396.2 415.6 - 524.1 21.9
Income and expenses recognised directly in equity with no effect on results are shown separately in the statement of recognised income and expenses.
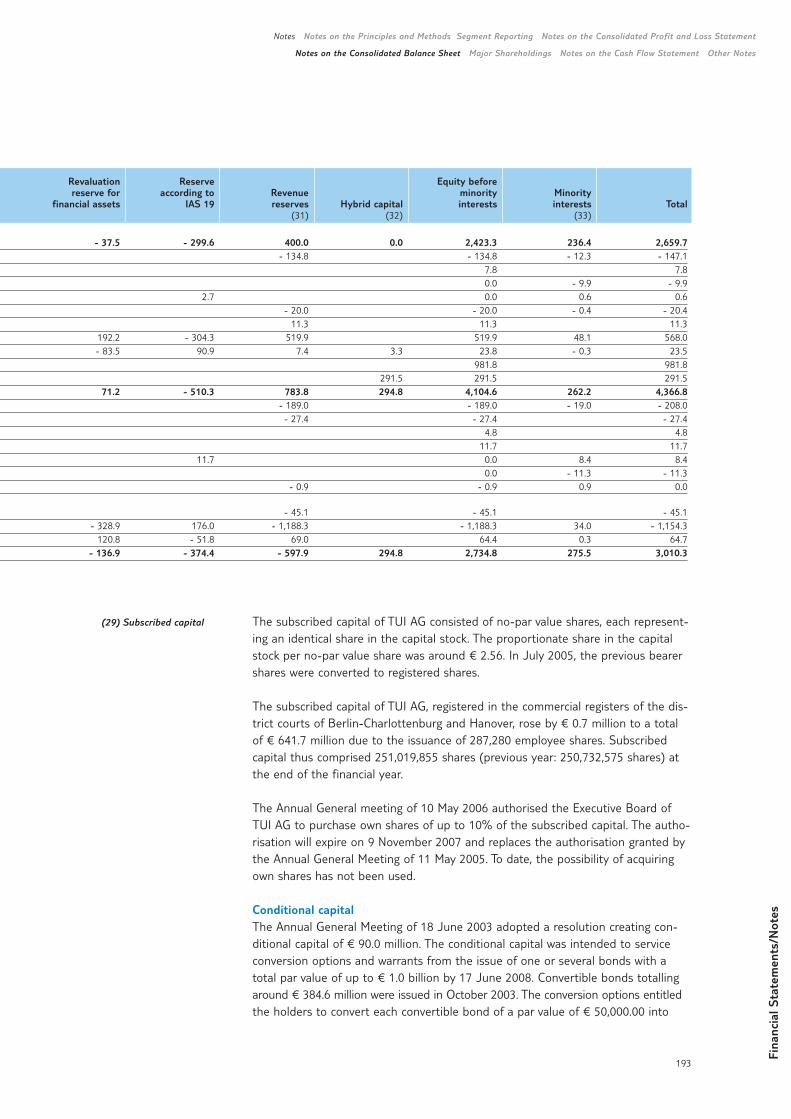
Fina
ncia
l Sta
tem
ents
/Not
es
193
Notes Notes on the Principles and Methods Segment Reporting Notes on the Consolidated Profit and Loss Statement
Notes on the Consolidated Balance Sheet Major Shareholdings Notes on the Cash Flow Statement Other Notes
(29) Subscribed capital The subscribed capital of TUI AG consisted of no-par value shares, each represent-ing an identical share in the capital stock. The proportionate share in the capitalstock per no-par value share was around € 2.56. In July 2005, the previous bearershares were converted to registered shares.
The subscribed capital of TUI AG, registered in the commercial registers of the dis-trict courts of Berlin-Charlottenburg and Hanover, rose by € 0.7 million to a totalof € 641.7 million due to the issuance of 287,280 employee shares. Subscribedcapital thus comprised 251,019,855 shares (previous year: 250,732,575 shares) atthe end of the financial year.
The Annual General meeting of 10 May 2006 authorised the Executive Board ofTUI AG to purchase own shares of up to 10% of the subscribed capital. The autho-risation will expire on 9 November 2007 and replaces the authorisation granted bythe Annual General Meeting of 11 May 2005. To date, the possibility of acquiringown shares has not been used.
Conditional capitalThe Annual General Meeting of 18 June 2003 adopted a resolution creating con-ditional capital of € 90.0 million. The conditional capital was intended to serviceconversion options and warrants from the issue of one or several bonds with atotal par value of up to € 1.0 billion by 17 June 2008. Convertible bonds totallingaround € 384.6 million were issued in October 2003. The conversion options entitledthe holders to convert each convertible bond of a par value of € 50,000.00 into
Revaluation Reserve Equity beforereserve for according to Revenue minority Minority
financial assets IAS 19 reserves Hybrid capital interests interests Total(31) (32) (33)
- 37.5 - 299.6 400.0 0.0 2,423.3 236.4 2,659.7- 134.8 - 134.8 - 12.3 - 147.1
7.8 7.80.0 - 9.9 - 9.9
2.7 0.0 0.6 0.6- 20.0 - 20.0 - 0.4 - 20.4
11.3 11.3 11.3192.2 - 304.3 519.9 519.9 48.1 568.0- 83.5 90.9 7.4 3.3 23.8 - 0.3 23.5
981.8 981.8291.5 291.5 291.5
71.2 - 510.3 783.8 294.8 4,104.6 262.2 4,366.8- 189.0 - 189.0 - 19.0 - 208.0- 27.4 - 27.4 - 27.4
4.8 4.811.7 11.7
11.7 0.0 8.4 8.40.0 - 11.3 - 11.3
- 0.9 - 0.9 0.9 0.0
- 45.1 - 45.1 - 45.1- 328.9 176.0 - 1,188.3 - 1,188.3 34.0 - 1,154.3
120.8 - 51.8 69.0 64.4 0.3 64.7- 136.9 - 374.4 - 597.9 294.8 2,734.8 275.5 3,010.3
194
(30) Capital reserves
2,520 shares in TUI AG. This far, the holders of the convertible bonds have not yet exercised any conversion rights.
In order to retain the possibility of issuing bonds, the Annual General Meeting of 10 May 2006 adopted a resolution creating further conditional capital of€ 100.0 million. Accordingly, bonds with conversion options and warrants as well asprofit-sharing rights and income bonds with a total par value of up to € 1.0 billion(with and without fixed terms) may be issued by 9 May 2011. The correspondingresolution by the Annual General Meeting of 18 May 2004 on the creation of con-ditional capital of € 70.0 million was cancelled.
Authorised capitalAt the end of the 2005 financial year, the authorised capital of € 10.0 million createdat the Annual General Meeting of 18 May 2004 for the issuance of employee sharesstood at € 8.1 million. The authorised capital was partly used in the 2006 financialyear to issue 287,280 employee shares (previous year: 473,420 shares). The remain-ing authorised capital for the issuance of employee shares thus stood at € 7.3 millionat the end of the 2006 financial year. The Executive Board of TUI AG has beenauthorised to use this capital by 17 May 2009.
In addition to the authorised capital for the issuance of employee shares, the AnnualGeneral Meeting of 10 May 2006 resolved to create authorised capital for the issuanceof new shares against cash or non-cash contribution totalling € 310.0 million. Theissue of new shares against non-cash contribution was limited to € 128.0 million. TheExecutive Board of TUI AG has been authorised to use the authorised capital by9 May 2011. Of the authorised capital of € 215.6 million, created by a resolution ofthe Annual General Meeting of 18 May 2004, an amount of € 182.8 million was usedfor the issue of 71,502,616 shares against cash contribution in the 2005 financial year.The authorised capital remaining at the end of 2005 of € 32.8 million was cancelled.
Including the remaining authorised capital for the issuance of employee shares,total unused authorised capital amounted to € 317.3 million.
The capital reserves mainly comprised transfers of premiums from the issue of sharesand amounts generated by issuing bonds for conversion options and warrants topurchase shares in TUI AG where the conversion options and warrants had to beclassified as equity instruments in accordance with IAS 32. Premiums from theissue of shares due to the exercise of conversion options and warrants were alsotransferred to the capital reserves. The funding costs for the issue of conversionoptions and warrants and for the capital increase by means of the issue of newshares against cash contribution were eliminated against the transfers to the capitalreserves resulting from these transactions.
In accordance with the revised IAS 32 in combination with IAS 39, the conversionright of the convertible bond issued in October 2003 had to be classified as a deri-vative liability. Since on 3 April 2006 TUI AG irrevocably waived its right to be ableto deliver cash in the event of a conversion, the conversion option had to be classifiedas an equity instrument. As a result, the capital reserves rose by € 7.2 million. Inthe financial year under review, the capital reserves rose by € 4.1 million (previousyear: € 6.6 million) due to the issuance of employee shares. In 2005, the capitalreserves had risen by € 812.1 million due to the issue of new shares against cashcontribution.
Fina
ncia
l Sta
tem
ents
/Not
es
195
Notes Notes on the Principles and Methods Segment Reporting Notes on the Consolidated Profit and Loss Statement
Notes on the Consolidated Balance Sheet Major Shareholdings Notes on the Cash Flow Statement Other Notes
(31) Revenue reserves
(32) Hybrid capital
Other revenue reserves comprised transfers from the results of the current or pre-vious financial years as well as eliminations of goodwill from capital consolidationand at equity measurement of subsidiaries purchased until 30 September 1995.
Furthermore, adjustments with no effect on results from the first time applicationof new or revised accounting standards and effects of changes in accounting andmeasurement methods were transferred to or eliminated against other revenuereserves.
In accordance with section 58 subsection 2 of the German Stock Corporation Act,dividend payments to TUI AG shareholders were based on net profit available fordistribution of the commercial-law financial statements of TUI AG. A proposal willbe submitted to the Annual General Meeting by the Executive and the SupervisoryBoard to carry the profit of € 54.3 million available for distribution forward on newaccount.
In the 2006 financial year, the option writer position from an option on minorityinterests resulted in a reduction in other revenue reserves outside profit and lossof € 45.1 million.
Differences arising from currency translation comprised differences from the currencytranslation of the financial statements of foreign subsidiaries as well as differencesfrom the translation of goodwill denominated in a foreign currency.
The revaluation reserve was formed in the framework of step acquisitions of com-panies. At the date of first time consolidation, the changes in the fair values of theassets and liabilities of the acquired company arising in between the individualacquisition dates were recognised in the revaluation reserve with no effect on resultsbased on the interest held prior to first time consolidation. In the framework ofdeconsolidation, the revaluation reserves were eliminated against other revenuereserves.
The revaluation reserve for financial assets comprised the portion of gains and lossesfrom hedges which was determined as an effective hedge of future cash flows. Therevaluation reserve for financial assets was released with an effect on results in thesame period in which the hedged transaction had an effect on results or was nolonger assessed as probable.
The reserve according to IAS 19 comprised profits and losses from changes inactuarial parameters in connection with the measurement of pension obligationsand the associated fund assets, recognised with no effect on results.
In the 2006 financial year, the increase in the long-term interest rate level in theUK was the main reason for a reduction in pension obligations and the relatedincrease in the reserve according to IAS 19. The reserve stood at € -374.4 million(previous year: € -510.3 million) at the end of the financial year under review.
In accordance with IAS 32, the subordinated hybrid capital issued by TUI AG inDecember 2005 with a nominal volume of € 300.0 million represented Group equity.The capital procurement costs of € 8.5 million were deducted from the hybridcapital with no effect on results, taking account of deferred income taxes. Dividend
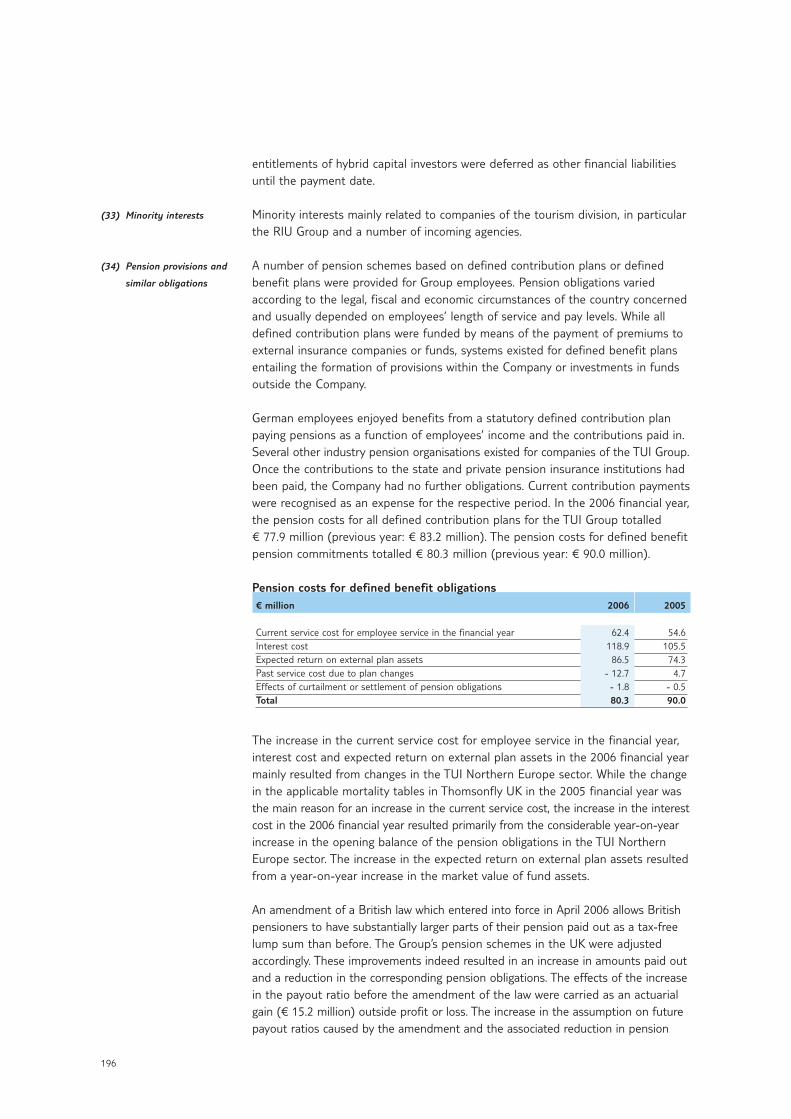
196
(33) Minority interests
(34) Pension provisions and
similar obligations
entitlements of hybrid capital investors were deferred as other financial liabilitiesuntil the payment date.
Minority interests mainly related to companies of the tourism division, in particularthe RIU Group and a number of incoming agencies.
A number of pension schemes based on defined contribution plans or definedbenefit plans were provided for Group employees. Pension obligations variedaccording to the legal, fiscal and economic circumstances of the country concernedand usually depended on employees’ length of service and pay levels. While alldefined contribution plans were funded by means of the payment of premiums toexternal insurance companies or funds, systems existed for defined benefit plansentailing the formation of provisions within the Company or investments in fundsoutside the Company.
German employees enjoyed benefits from a statutory defined contribution planpaying pensions as a function of employees’ income and the contributions paid in.Several other industry pension organisations existed for companies of the TUI Group.Once the contributions to the state and private pension insurance institutions hadbeen paid, the Company had no further obligations. Current contribution paymentswere recognised as an expense for the respective period. In the 2006 financial year,the pension costs for all defined contribution plans for the TUI Group totalled € 77.9 million (previous year: € 83.2 million). The pension costs for defined benefitpension commitments totalled € 80.3 million (previous year: € 90.0 million).
Pension costs for defined benefit obligations€ million 2006 2005
Current service cost for employee service in the financial year 62.4 54.6Interest cost 118.9 105.5Expected return on external plan assets 86.5 74.3Past service cost due to plan changes - 12.7 4.7Effects of curtailment or settlement of pension obligations - 1.8 - 0.5Total 80.3 90.0
The increase in the current service cost for employee service in the financial year,interest cost and expected return on external plan assets in the 2006 financial yearmainly resulted from changes in the TUI Northern Europe sector. While the changein the applicable mortality tables in Thomsonfly UK in the 2005 financial year wasthe main reason for an increase in the current service cost, the increase in the interestcost in the 2006 financial year resulted primarily from the considerable year-on-yearincrease in the opening balance of the pension obligations in the TUI NorthernEurope sector. The increase in the expected return on external plan assets resultedfrom a year-on-year increase in the market value of fund assets.
An amendment of a British law which entered into force in April 2006 allows Britishpensioners to have substantially larger parts of their pension paid out as a tax-freelump sum than before. The Group’s pension schemes in the UK were adjustedaccordingly. These improvements indeed resulted in an increase in amounts paid outand a reduction in the corresponding pension obligations. The effects of the increasein the payout ratio before the amendment of the law were carried as an actuarialgain (€ 15.2 million) outside profit or loss. The increase in the assumption on futurepayout ratios caused by the amendment and the associated reduction in pension
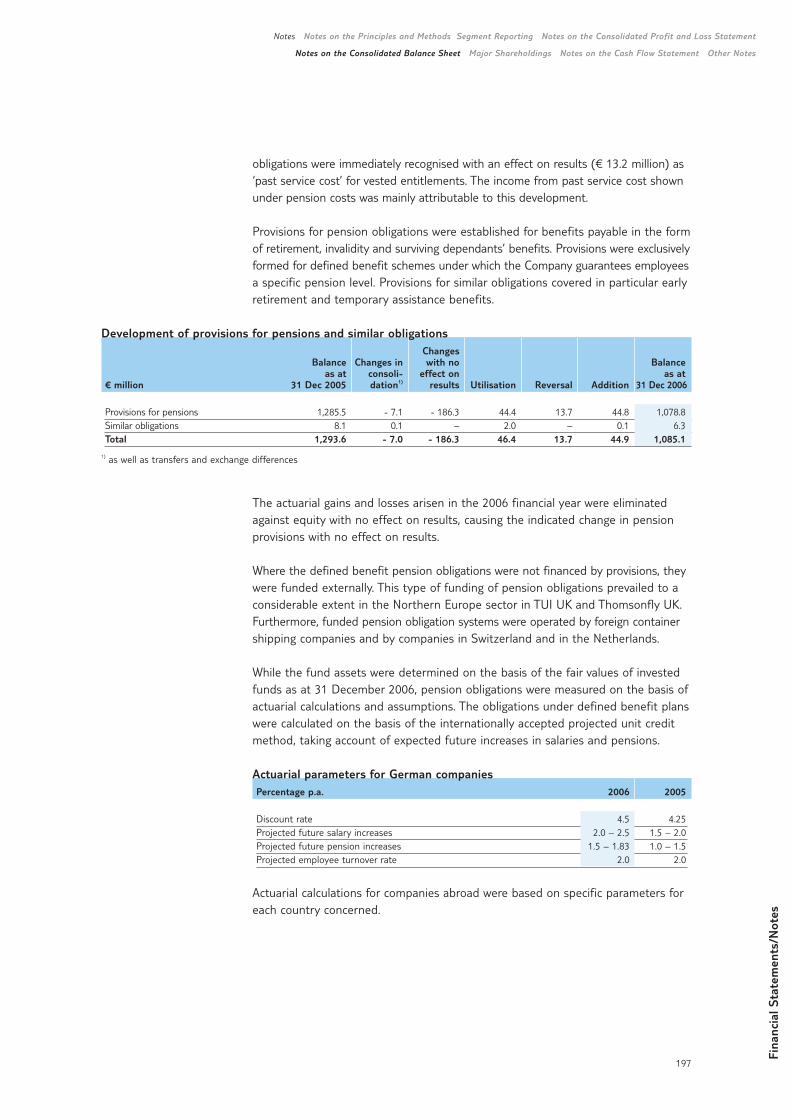
Fina
ncia
l Sta
tem
ents
/Not
es
197
Notes Notes on the Principles and Methods Segment Reporting Notes on the Consolidated Profit and Loss Statement
Notes on the Consolidated Balance Sheet Major Shareholdings Notes on the Cash Flow Statement Other Notes
obligations were immediately recognised with an effect on results (€ 13.2 million) as‘past service cost’ for vested entitlements. The income from past service cost shownunder pension costs was mainly attributable to this development.
Provisions for pension obligations were established for benefits payable in the formof retirement, invalidity and surviving dependants’ benefits. Provisions were exclusivelyformed for defined benefit schemes under which the Company guarantees employeesa specific pension level. Provisions for similar obligations covered in particular earlyretirement and temporary assistance benefits.
The actuarial gains and losses arisen in the 2006 financial year were eliminatedagainst equity with no effect on results, causing the indicated change in pensionprovisions with no effect on results.
Where the defined benefit pension obligations were not financed by provisions, theywere funded externally. This type of funding of pension obligations prevailed to aconsiderable extent in the Northern Europe sector in TUI UK and Thomsonfly UK.Furthermore, funded pension obligation systems were operated by foreign containershipping companies and by companies in Switzerland and in the Netherlands.
While the fund assets were determined on the basis of the fair values of investedfunds as at 31 December 2006, pension obligations were measured on the basis ofactuarial calculations and assumptions. The obligations under defined benefit planswere calculated on the basis of the internationally accepted projected unit creditmethod, taking account of expected future increases in salaries and pensions.
Actuarial parameters for German companiesPercentage p.a. 2006 2005
Discount rate 4.5 4.25Projected future salary increases 2.0 – 2.5 1.5 – 2.0Projected future pension increases 1.5 – 1.83 1.0 – 1.5Projected employee turnover rate 2.0 2.0
Actuarial calculations for companies abroad were based on specific parameters foreach country concerned.
Development of provisions for pensions and similar obligationsChanges
Balance Changes in with no Balanceas at consoli- effect on as at
€ million 31 Dec 2005 dation1) results Utilisation Reversal Addition 31 Dec 2006
Provisions for pensions 1,285.5 - 7.1 - 186.3 44.4 13.7 44.8 1,078.8Similar obligations 8.1 0.1 – 2.0 – 0.1 6.3Total 1,293.6 - 7.0 - 186.3 46.4 13.7 44.9 1,085.1
1) as well as transfers and exchange differences
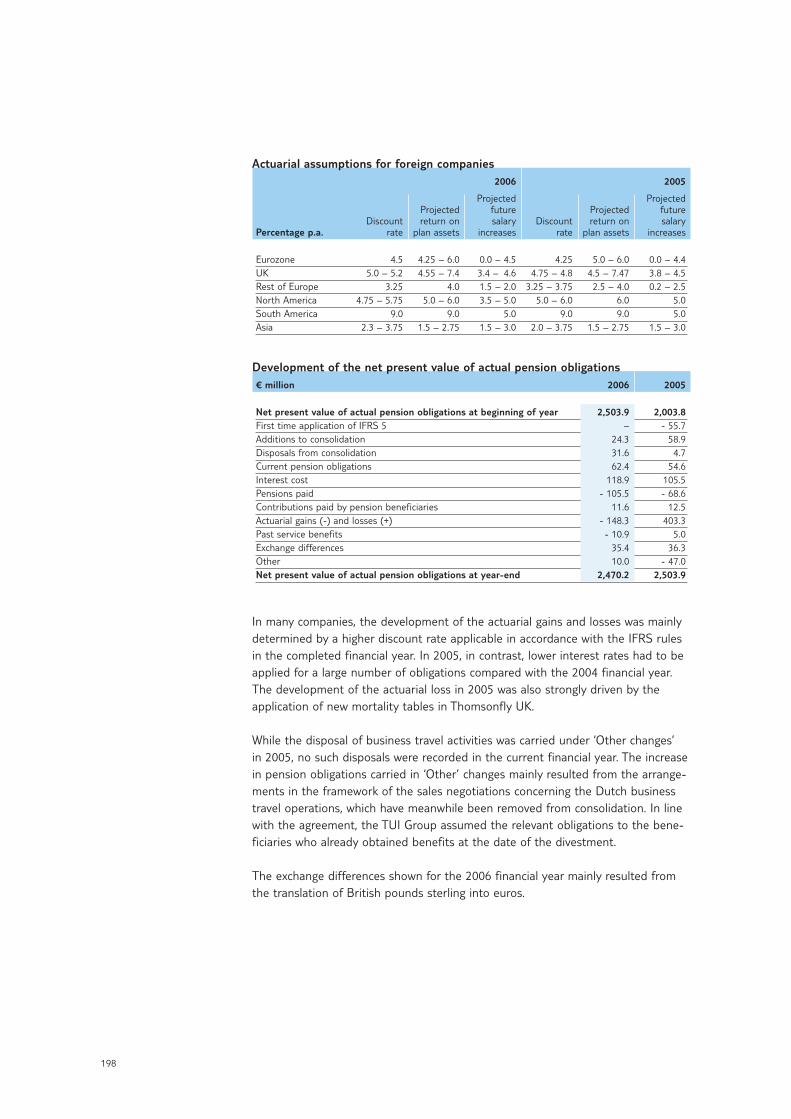
198
Actuarial assumptions for foreign companies2006 2005
Projected ProjectedProjected future Projected future
Discount return on salary Discount return on salaryPercentage p.a. rate plan assets increases rate plan assets increases
Eurozone 4.5 4.25 – 6.0 0.0 – 4.5 4.25 5.0 – 6.0 0.0 – 4.4UK 5.0 – 5.2 4.55 – 7.4 3.4 – 4.6 4.75 – 4.8 4.5 – 7.47 3.8 – 4.5Rest of Europe 3.25 4.0 1.5 – 2.0 3.25 – 3.75 2.5 – 4.0 0.2 – 2.5North America 4.75 – 5.75 5.0 – 6.0 3.5 – 5.0 5.0 – 6.0 6.0 5.0South America 9.0 9.0 5.0 9.0 9.0 5.0Asia 2.3 – 3.75 1.5 – 2.75 1.5 – 3.0 2.0 – 3.75 1.5 – 2.75 1.5 – 3.0
Development of the net present value of actual pension obligations€ million 2006 2005
Net present value of actual pension obligations at beginning of year 2,503.9 2,003.8First time application of IFRS 5 – - 55.7Additions to consolidation 24.3 58.9Disposals from consolidation 31.6 4.7Current pension obligations 62.4 54.6Interest cost 118.9 105.5Pensions paid - 105.5 - 68.6Contributions paid by pension beneficiaries 11.6 12.5Actuarial gains (-) and losses (+) - 148.3 403.3Past service benefits - 10.9 5.0Exchange differences 35.4 36.3Other 10.0 - 47.0Net present value of actual pension obligations at year-end 2,470.2 2,503.9
In many companies, the development of the actuarial gains and losses was mainlydetermined by a higher discount rate applicable in accordance with the IFRS rulesin the completed financial year. In 2005, in contrast, lower interest rates had to beapplied for a large number of obligations compared with the 2004 financial year.The development of the actuarial loss in 2005 was also strongly driven by theapplication of new mortality tables in Thomsonfly UK.
While the disposal of business travel activities was carried under ‘Other changes’ in 2005, no such disposals were recorded in the current financial year. The increasein pension obligations carried in ‘Other’ changes mainly resulted from the arrange-ments in the framework of the sales negotiations concerning the Dutch businesstravel operations, which have meanwhile been removed from consolidation. In linewith the agreement, the TUI Group assumed the relevant obligations to the bene-ficiaries who already obtained benefits at the date of the divestment.
The exchange differences shown for the 2006 financial year mainly resulted fromthe translation of British pounds sterling into euros.
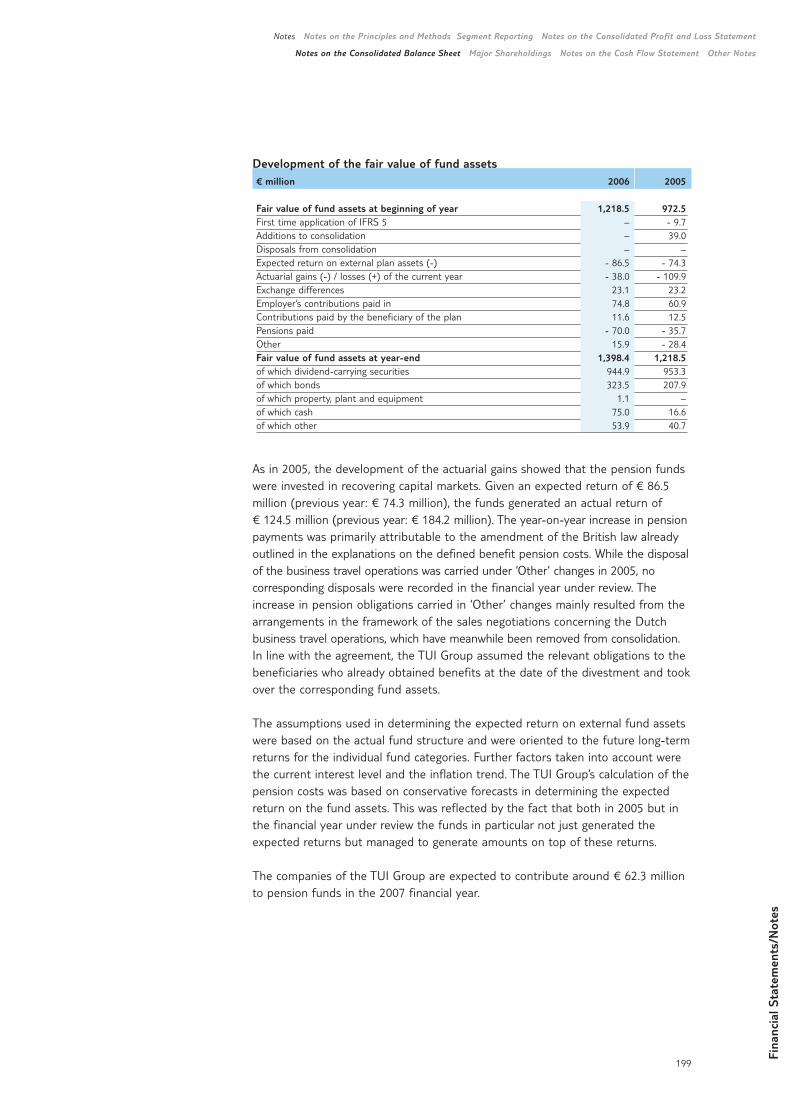
Fina
ncia
l Sta
tem
ents
/Not
es
199
Notes Notes on the Principles and Methods Segment Reporting Notes on the Consolidated Profit and Loss Statement
Notes on the Consolidated Balance Sheet Major Shareholdings Notes on the Cash Flow Statement Other Notes
Development of the fair value of fund assets€ million 2006 2005
Fair value of fund assets at beginning of year 1,218.5 972.5First time application of IFRS 5 – - 9.7Additions to consolidation – 39.0Disposals from consolidation – –Expected return on external plan assets (-) - 86.5 - 74.3Actuarial gains (-) / losses (+) of the current year - 38.0 - 109.9Exchange differences 23.1 23.2Employer’s contributions paid in 74.8 60.9Contributions paid by the beneficiary of the plan 11.6 12.5Pensions paid - 70.0 - 35.7Other 15.9 - 28.4Fair value of fund assets at year-end 1,398.4 1,218.5of which dividend-carrying securities 944.9 953.3of which bonds 323.5 207.9of which property, plant and equipment 1.1 –of which cash 75.0 16.6of which other 53.9 40.7
As in 2005, the development of the actuarial gains showed that the pension fundswere invested in recovering capital markets. Given an expected return of € 86.5million (previous year: € 74.3 million), the funds generated an actual return of€ 124.5 million (previous year: € 184.2 million). The year-on-year increase in pensionpayments was primarily attributable to the amendment of the British law alreadyoutlined in the explanations on the defined benefit pension costs. While the disposalof the business travel operations was carried under ‘Other’ changes in 2005, nocorresponding disposals were recorded in the financial year under review. The increase in pension obligations carried in ‘Other’ changes mainly resulted from thearrangements in the framework of the sales negotiations concerning the Dutchbusiness travel operations, which have meanwhile been removed from consolidation.In line with the agreement, the TUI Group assumed the relevant obligations to thebeneficiaries who already obtained benefits at the date of the divestment and tookover the corresponding fund assets.
The assumptions used in determining the expected return on external fund assetswere based on the actual fund structure and were oriented to the future long-termreturns for the individual fund categories. Further factors taken into account werethe current interest level and the inflation trend. The TUI Group’s calculation of thepension costs was based on conservative forecasts in determining the expectedreturn on the fund assets. This was reflected by the fact that both in 2005 but inthe financial year under review the funds in particular not just generated theexpected returns but managed to generate amounts on top of these returns.
The companies of the TUI Group are expected to contribute around € 62.3 millionto pension funds in the 2007 financial year.
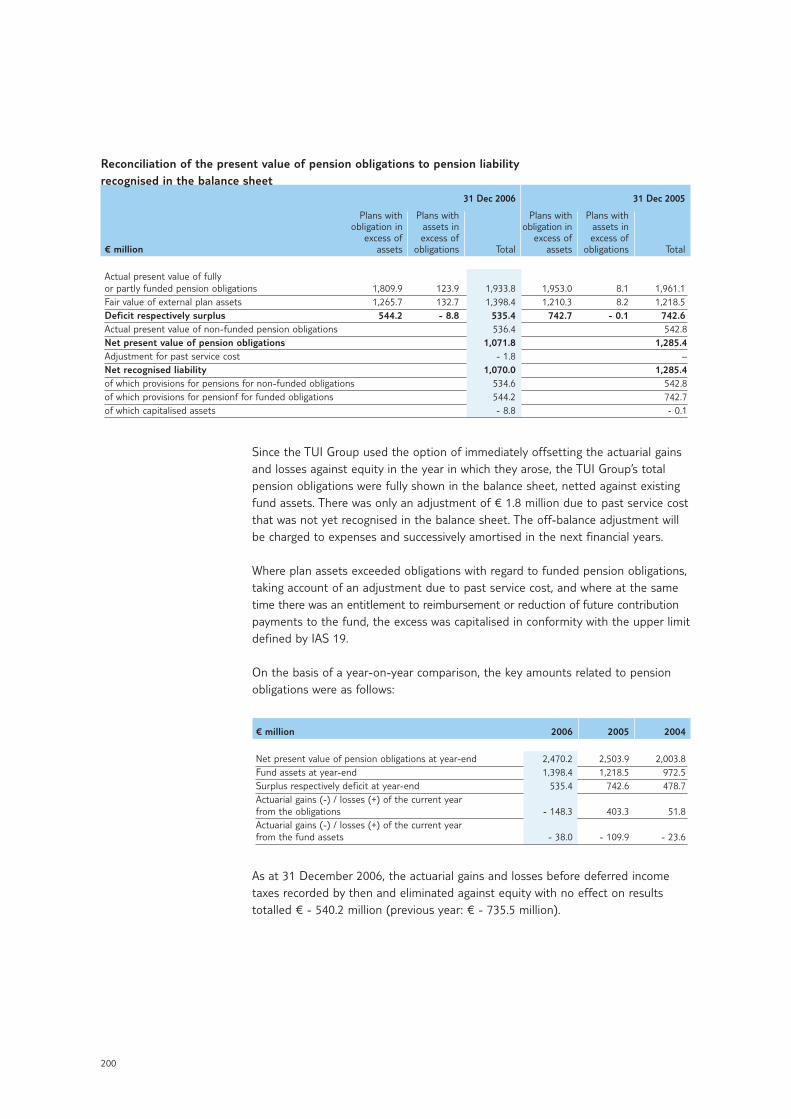
200
Since the TUI Group used the option of immediately offsetting the actuarial gainsand losses against equity in the year in which they arose, the TUI Group’s totalpension obligations were fully shown in the balance sheet, netted against existingfund assets. There was only an adjustment of € 1.8 million due to past service costthat was not yet recognised in the balance sheet. The off-balance adjustment willbe charged to expenses and successively amortised in the next financial years.
Where plan assets exceeded obligations with regard to funded pension obligations,taking account of an adjustment due to past service cost, and where at the sametime there was an entitlement to reimbursement or reduction of future contributionpayments to the fund, the excess was capitalised in conformity with the upper limitdefined by IAS 19.
On the basis of a year-on-year comparison, the key amounts related to pensionobligations were as follows:
€ million 2006 2005 2004
Net present value of pension obligations at year-end 2,470.2 2,503.9 2,003.8Fund assets at year-end 1,398.4 1,218.5 972.5Surplus respectively deficit at year-end 535.4 742.6 478.7Actuarial gains (-) / losses (+) of the current yearfrom the obligations - 148.3 403.3 51.8Actuarial gains (-) / losses (+) of the current yearfrom the fund assets - 38.0 - 109.9 - 23.6
As at 31 December 2006, the actuarial gains and losses before deferred incometaxes recorded by then and eliminated against equity with no effect on resultstotalled € - 540.2 million (previous year: € - 735.5 million).
Reconciliation of the present value of pension obligations to pension liability recognised in the balance sheet
31 Dec 2006 31 Dec 2005
Plans with Plans with Plans with Plans withobligation in assets in obligation in assets in
excess of excess of excess of excess of€ million assets obligations Total assets obligations Total
Actual present value of fullyor partly funded pension obligations 1,809.9 123.9 1,933.8 1,953.0 8.1 1,961.1Fair value of external plan assets 1,265.7 132.7 1,398.4 1,210.3 8.2 1,218.5Deficit respectively surplus 544.2 - 8.8 535.4 742.7 - 0.1 742.6Actual present value of non-funded pension obligations 536.4 542.8Net present value of pension obligations 1,071.8 1,285.4Adjustment for past service cost - 1.8 –Net recognised liability 1,070.0 1,285.4of which provisions for pensions for non-funded obligations 534.6 542.8of which provisions for pensionf for funded obligations 544.2 742.7of which capitalised assets - 8.8 - 0.1
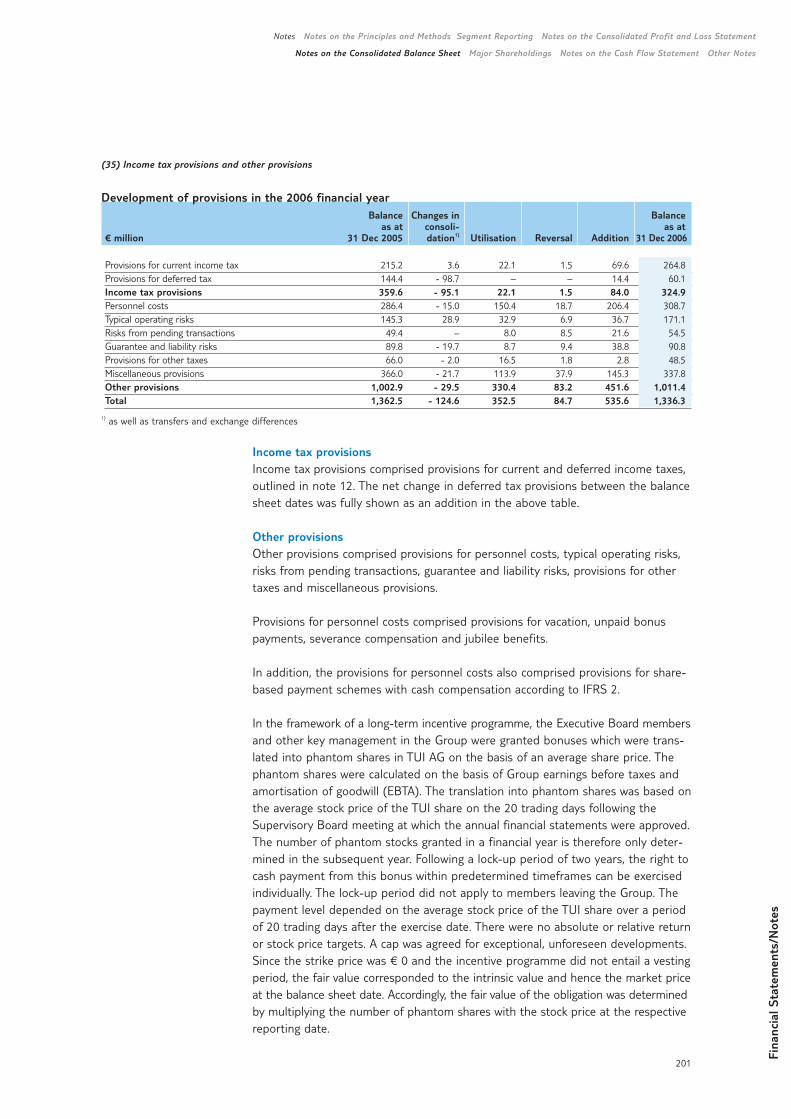
Fina
ncia
l Sta
tem
ents
/Not
es
201
Notes Notes on the Principles and Methods Segment Reporting Notes on the Consolidated Profit and Loss Statement
Notes on the Consolidated Balance Sheet Major Shareholdings Notes on the Cash Flow Statement Other Notes
Income tax provisionsIncome tax provisions comprised provisions for current and deferred income taxes,outlined in note 12. The net change in deferred tax provisions between the balancesheet dates was fully shown as an addition in the above table.
Other provisionsOther provisions comprised provisions for personnel costs, typical operating risks,risks from pending transactions, guarantee and liability risks, provisions for othertaxes and miscellaneous provisions.
Provisions for personnel costs comprised provisions for vacation, unpaid bonuspayments, severance compensation and jubilee benefits.
In addition, the provisions for personnel costs also comprised provisions for share-based payment schemes with cash compensation according to IFRS 2.
In the framework of a long-term incentive programme, the Executive Board membersand other key management in the Group were granted bonuses which were trans-lated into phantom shares in TUI AG on the basis of an average share price. Thephantom shares were calculated on the basis of Group earnings before taxes andamortisation of goodwill (EBTA). The translation into phantom shares was based onthe average stock price of the TUI share on the 20 trading days following theSupervisory Board meeting at which the annual financial statements were approved.The number of phantom stocks granted in a financial year is therefore only deter-mined in the subsequent year. Following a lock-up period of two years, the right tocash payment from this bonus within predetermined timeframes can be exercisedindividually. The lock-up period did not apply to members leaving the Group. Thepayment level depended on the average stock price of the TUI share over a periodof 20 trading days after the exercise date. There were no absolute or relative returnor stock price targets. A cap was agreed for exceptional, unforeseen developments.Since the strike price was € 0 and the incentive programme did not entail a vestingperiod, the fair value corresponded to the intrinsic value and hence the market priceat the balance sheet date. Accordingly, the fair value of the obligation was determinedby multiplying the number of phantom shares with the stock price at the respectivereporting date.
(35) Income tax provisions and other provisions
Development of provisions in the 2006 financial yearBalance Changes in Balance
as at consoli- as at€ million 31 Dec 2005 dation1) Utilisation Reversal Addition 31 Dec 2006
Provisions for current income tax 215.2 3.6 22.1 1.5 69.6 264.8Provisions for deferred tax 144.4 - 98.7 – – 14.4 60.1Income tax provisions 359.6 - 95.1 22.1 1.5 84.0 324.9Personnel costs 286.4 - 15.0 150.4 18.7 206.4 308.7Typical operating risks 145.3 28.9 32.9 6.9 36.7 171.1Risks from pending transactions 49.4 – 8.0 8.5 21.6 54.5Guarantee and liability risks 89.8 - 19.7 8.7 9.4 38.8 90.8Provisions for other taxes 66.0 - 2.0 16.5 1.8 2.8 48.5Miscellaneous provisions 366.0 - 21.7 113.9 37.9 145.3 337.8Other provisions 1,002.9 - 29.5 330.4 83.2 451.6 1,011.4Total 1,362.5 - 124.6 352.5 84.7 535.6 1,336.3
1) as well as transfers and exchange differences
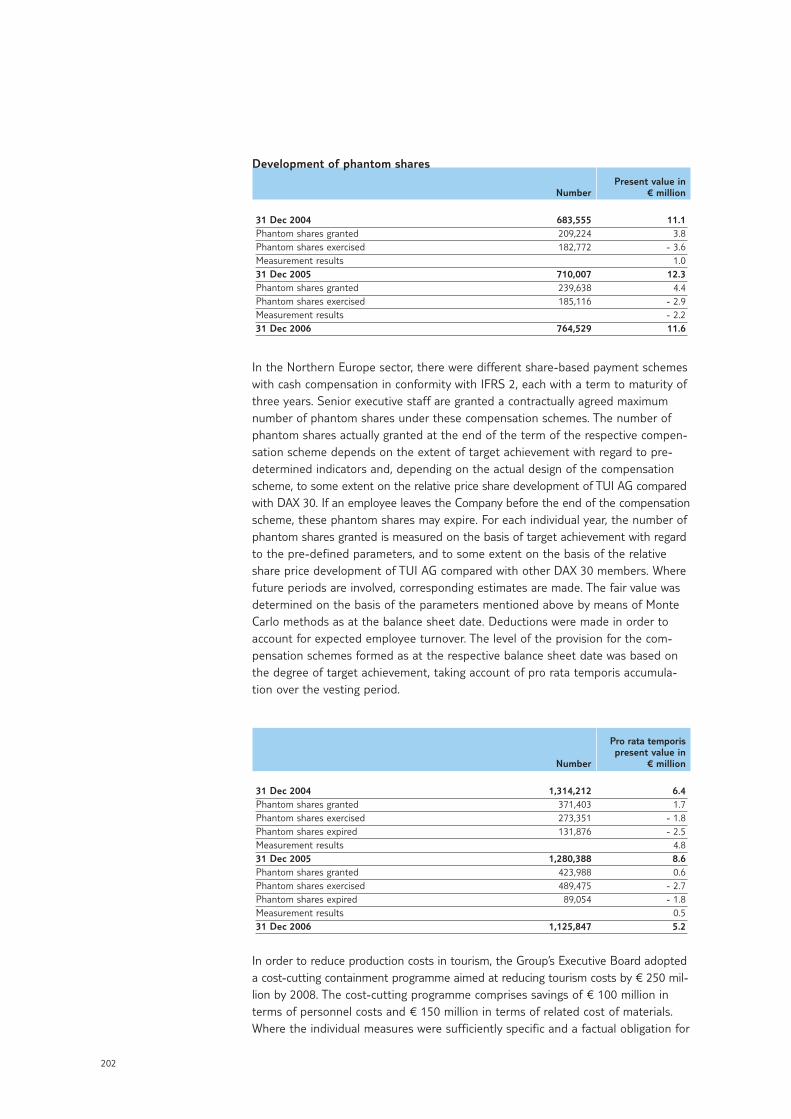
202
Development of phantom sharesPresent value in
Number € million
31 Dec 2004 683,555 11.1Phantom shares granted 209,224 3.8Phantom shares exercised 182,772 - 3.6Measurement results 1.031 Dec 2005 710,007 12.3Phantom shares granted 239,638 4.4Phantom shares exercised 185,116 - 2.9Measurement results - 2.231 Dec 2006 764,529 11.6
In the Northern Europe sector, there were different share-based payment schemeswith cash compensation in conformity with IFRS 2, each with a term to maturity ofthree years. Senior executive staff are granted a contractually agreed maximumnumber of phantom shares under these compensation schemes. The number ofphantom shares actually granted at the end of the term of the respective compen-sation scheme depends on the extent of target achievement with regard to pre-determined indicators and, depending on the actual design of the compensationscheme, to some extent on the relative price share development of TUI AG comparedwith DAX 30. If an employee leaves the Company before the end of the compensationscheme, these phantom shares may expire. For each individual year, the number ofphantom shares granted is measured on the basis of target achievement with regardto the pre-defined parameters, and to some extent on the basis of the relativeshare price development of TUI AG compared with other DAX 30 members. Wherefuture periods are involved, corresponding estimates are made. The fair value wasdetermined on the basis of the parameters mentioned above by means of MonteCarlo methods as at the balance sheet date. Deductions were made in order toaccount for expected employee turnover. The level of the provision for the com-pensation schemes formed as at the respective balance sheet date was based onthe degree of target achievement, taking account of pro rata temporis accumula-tion over the vesting period.
Pro rata temporispresent value in
Number € million
31 Dec 2004 1,314,212 6.4Phantom shares granted 371,403 1.7Phantom shares exercised 273,351 - 1.8Phantom shares expired 131,876 - 2.5Measurement results 4.831 Dec 2005 1,280,388 8.6Phantom shares granted 423,988 0.6Phantom shares exercised 489,475 - 2.7Phantom shares expired 89,054 - 1.8Measurement results 0.531 Dec 2006 1,125,847 5.2
In order to reduce production costs in tourism, the Group’s Executive Board adopteda cost-cutting containment programme aimed at reducing tourism costs by € 250 mil-lion by 2008. The cost-cutting programme comprises savings of € 100 million interms of personnel costs and € 150 million in terms of related cost of materials.Where the individual measures were sufficiently specific and a factual obligation for
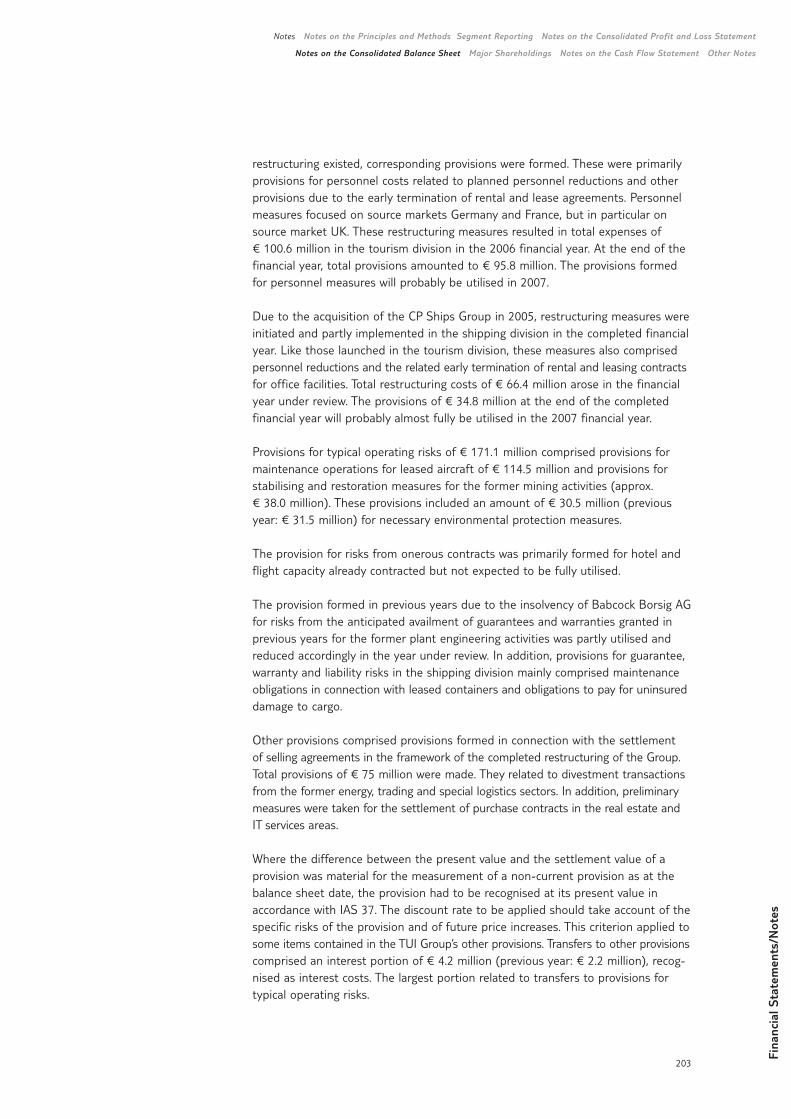
Fina
ncia
l Sta
tem
ents
/Not
es
203
Notes Notes on the Principles and Methods Segment Reporting Notes on the Consolidated Profit and Loss Statement
Notes on the Consolidated Balance Sheet Major Shareholdings Notes on the Cash Flow Statement Other Notes
restructuring existed, corresponding provisions were formed. These were primarilyprovisions for personnel costs related to planned personnel reductions and otherprovisions due to the early termination of rental and lease agreements. Personnelmeasures focused on source markets Germany and France, but in particular onsource market UK. These restructuring measures resulted in total expenses of€ 100.6 million in the tourism division in the 2006 financial year. At the end of thefinancial year, total provisions amounted to € 95.8 million. The provisions formedfor personnel measures will probably be utilised in 2007.
Due to the acquisition of the CP Ships Group in 2005, restructuring measures wereinitiated and partly implemented in the shipping division in the completed financialyear. Like those launched in the tourism division, these measures also comprisedpersonnel reductions and the related early termination of rental and leasing contractsfor office facilities. Total restructuring costs of € 66.4 million arose in the financialyear under review. The provisions of € 34.8 million at the end of the completedfinancial year will probably almost fully be utilised in the 2007 financial year.
Provisions for typical operating risks of € 171.1 million comprised provisions formaintenance operations for leased aircraft of € 114.5 million and provisions forstabilising and restoration measures for the former mining activities (approx. € 38.0 million). These provisions included an amount of € 30.5 million (previousyear: € 31.5 million) for necessary environmental protection measures.
The provision for risks from onerous contracts was primarily formed for hotel andflight capacity already contracted but not expected to be fully utilised.
The provision formed in previous years due to the insolvency of Babcock Borsig AGfor risks from the anticipated availment of guarantees and warranties granted inprevious years for the former plant engineering activities was partly utilised andreduced accordingly in the year under review. In addition, provisions for guarantee,warranty and liability risks in the shipping division mainly comprised maintenanceobligations in connection with leased containers and obligations to pay for uninsureddamage to cargo.
Other provisions comprised provisions formed in connection with the settlement of selling agreements in the framework of the completed restructuring of the Group.Total provisions of € 75 million were made. They related to divestment transactionsfrom the former energy, trading and special logistics sectors. In addition, preliminarymeasures were taken for the settlement of purchase contracts in the real estate andIT services areas.
Where the difference between the present value and the settlement value of aprovision was material for the measurement of a non-current provision as at thebalance sheet date, the provision had to be recognised at its present value inaccordance with IAS 37. The discount rate to be applied should take account of thespecific risks of the provision and of future price increases. This criterion applied tosome items contained in the TUI Group’s other provisions. Transfers to other provisionscomprised an interest portion of € 4.2 million (previous year: € 2.2 million), recog-nised as interest costs. The largest portion related to transfers to provisions fortypical operating risks.
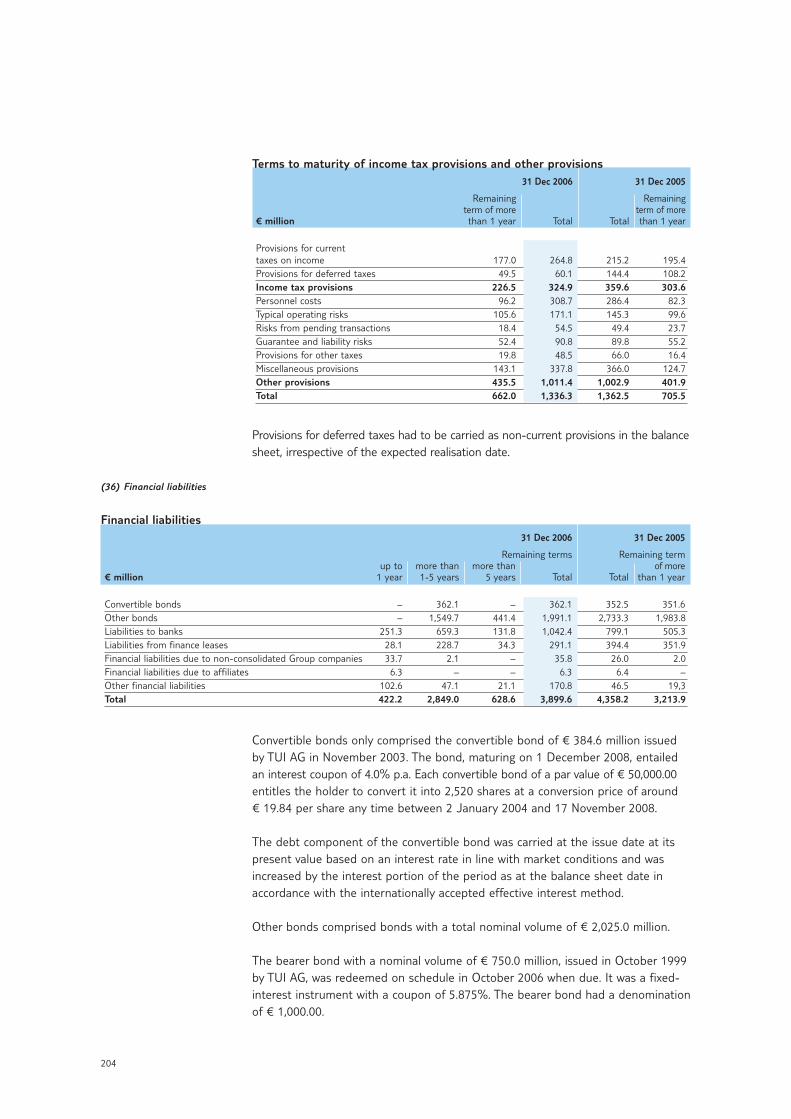
204
Terms to maturity of income tax provisions and other provisions31 Dec 2006 31 Dec 2005
Remaining Remainingterm of more term of more
€ million than 1 year Total Total than 1 year
Provisions for current taxes on income 177.0 264.8 215.2 195.4Provisions for deferred taxes 49.5 60.1 144.4 108.2Income tax provisions 226.5 324.9 359.6 303.6Personnel costs 96.2 308.7 286.4 82.3Typical operating risks 105.6 171.1 145.3 99.6Risks from pending transactions 18.4 54.5 49.4 23.7Guarantee and liability risks 52.4 90.8 89.8 55.2Provisions for other taxes 19.8 48.5 66.0 16.4Miscellaneous provisions 143.1 337.8 366.0 124.7Other provisions 435.5 1,011.4 1,002.9 401.9Total 662.0 1,336.3 1,362.5 705.5
Provisions for deferred taxes had to be carried as non-current provisions in the balancesheet, irrespective of the expected realisation date.
Convertible bonds only comprised the convertible bond of € 384.6 million issuedby TUI AG in November 2003. The bond, maturing on 1 December 2008, entailedan interest coupon of 4.0% p.a. Each convertible bond of a par value of € 50,000.00entitles the holder to convert it into 2,520 shares at a conversion price of around € 19.84 per share any time between 2 January 2004 and 17 November 2008.
The debt component of the convertible bond was carried at the issue date at itspresent value based on an interest rate in line with market conditions and wasincreased by the interest portion of the period as at the balance sheet date inaccordance with the internationally accepted effective interest method.
Other bonds comprised bonds with a total nominal volume of € 2,025.0 million.
The bearer bond with a nominal volume of € 750.0 million, issued in October 1999by TUI AG, was redeemed on schedule in October 2006 when due. It was a fixed-interest instrument with a coupon of 5.875%. The bearer bond had a denominationof € 1,000.00.
(36) Financial liabilities
Financial liabilities31 Dec 2006 31 Dec 2005
Remaining terms Remaining termup to more than more than of more
€ million 1 year 1-5 years 5 years Total Total than 1 year
Convertible bonds – 362.1 – 362.1 352.5 351.6Other bonds – 1,549.7 441.4 1,991.1 2,733.3 1,983.8Liabilities to banks 251.3 659.3 131.8 1,042.4 799.1 505.3Liabilities from finance leases 28.1 228.7 34.3 291.1 394.4 351.9Financial liabilities due to non-consolidated Group companies 33.7 2.1 – 35.8 26.0 2.0Financial liabilities due to affiliates 6.3 – – 6.3 6.4 –Other financial liabilities 102.6 47.1 21.1 170.8 46.5 19,3Total 422.2 2,849.0 628.6 3,899.6 4,358.2 3,213.9
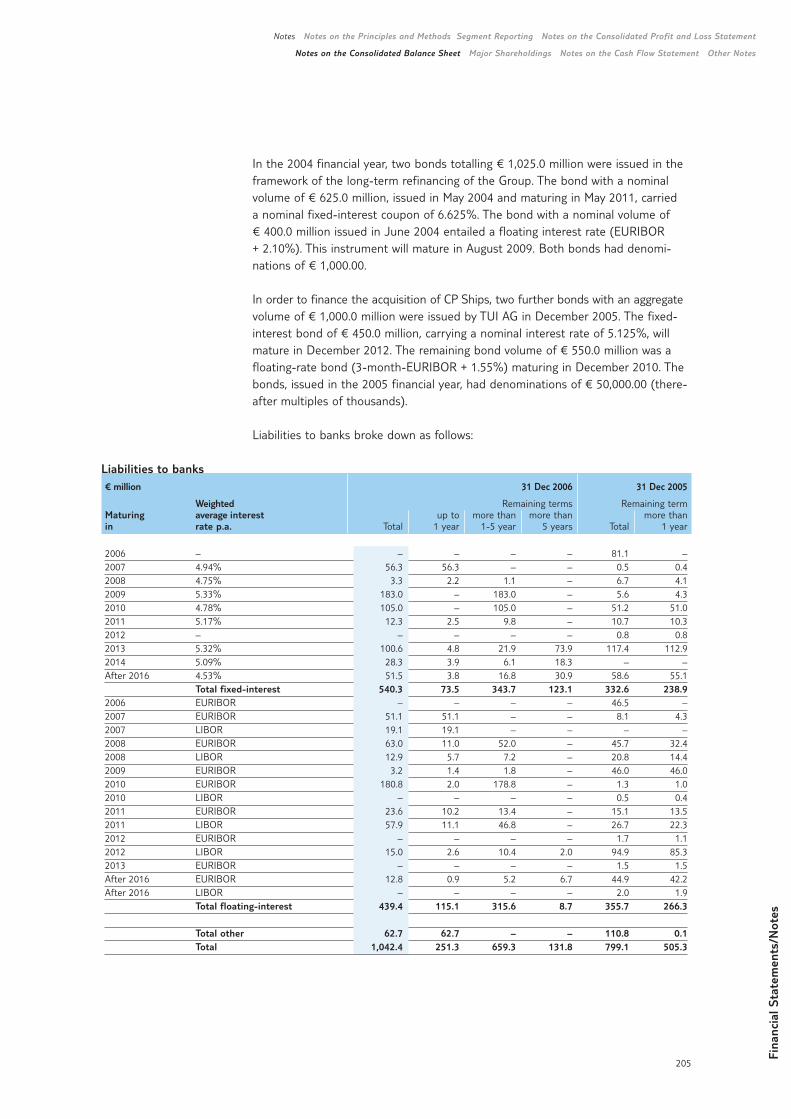
Fina
ncia
l Sta
tem
ents
/Not
es
205
Notes Notes on the Principles and Methods Segment Reporting Notes on the Consolidated Profit and Loss Statement
Notes on the Consolidated Balance Sheet Major Shareholdings Notes on the Cash Flow Statement Other Notes
In the 2004 financial year, two bonds totalling € 1,025.0 million were issued in theframework of the long-term refinancing of the Group. The bond with a nominalvolume of € 625.0 million, issued in May 2004 and maturing in May 2011, carried a nominal fixed-interest coupon of 6.625%. The bond with a nominal volume of€ 400.0 million issued in June 2004 entailed a floating interest rate (EURIBOR + 2.10%). This instrument will mature in August 2009. Both bonds had denomi-nations of € 1,000.00.
In order to finance the acquisition of CP Ships, two further bonds with an aggregatevolume of € 1,000.0 million were issued by TUI AG in December 2005. The fixed-interest bond of € 450.0 million, carrying a nominal interest rate of 5.125%, willmature in December 2012. The remaining bond volume of € 550.0 million was afloating-rate bond (3-month-EURIBOR + 1.55%) maturing in December 2010. Thebonds, issued in the 2005 financial year, had denominations of € 50,000.00 (there-after multiples of thousands).
Liabilities to banks broke down as follows:
Liabilities to banks€ million 31 Dec 2006 31 Dec 2005
Weighted Remaining terms Remaining termMaturing average interest up to more than more than more thanin rate p.a. Total 1 year 1-5 year 5 years Total 1 year
2006 – – – – – 81.1 –2007 4.94% 56.3 56.3 – – 0.5 0.42008 4.75% 3.3 2.2 1.1 – 6.7 4.12009 5.33% 183.0 – 183.0 – 5.6 4.32010 4.78% 105.0 – 105.0 – 51.2 51.02011 5.17% 12.3 2.5 9.8 – 10.7 10.32012 – – – – – 0.8 0.82013 5.32% 100.6 4.8 21.9 73.9 117.4 112.92014 5.09% 28.3 3.9 6.1 18.3 – –After 2016 4.53% 51.5 3.8 16.8 30.9 58.6 55.1
Total fixed-interest 540.3 73.5 343.7 123.1 332.6 238.92006 EURIBOR – – – – 46.5 –2007 EURIBOR 51.1 51.1 – – 8.1 4.32007 LIBOR 19.1 19.1 – – – –2008 EURIBOR 63.0 11.0 52.0 – 45.7 32.42008 LIBOR 12.9 5.7 7.2 – 20.8 14.42009 EURIBOR 3.2 1.4 1.8 – 46.0 46.02010 EURIBOR 180.8 2.0 178.8 – 1.3 1.02010 LIBOR – – – – 0.5 0.42011 EURIBOR 23.6 10.2 13.4 – 15.1 13.52011 LIBOR 57.9 11.1 46.8 – 26.7 22.32012 EURIBOR – – – – 1.7 1.12012 LIBOR 15.0 2.6 10.4 2.0 94.9 85.32013 EURIBOR – – – – 1.5 1.5After 2016 EURIBOR 12.8 0.9 5.2 6.7 44.9 42.2After 2016 LIBOR – – – – 2.0 1.9
Total floating-interest 439.4 115.1 315.6 8.7 355.7 266.3
Total other 62.7 62.7 – – 110.8 0.1Total 1,042.4 251.3 659.3 131.8 799.1 505.3
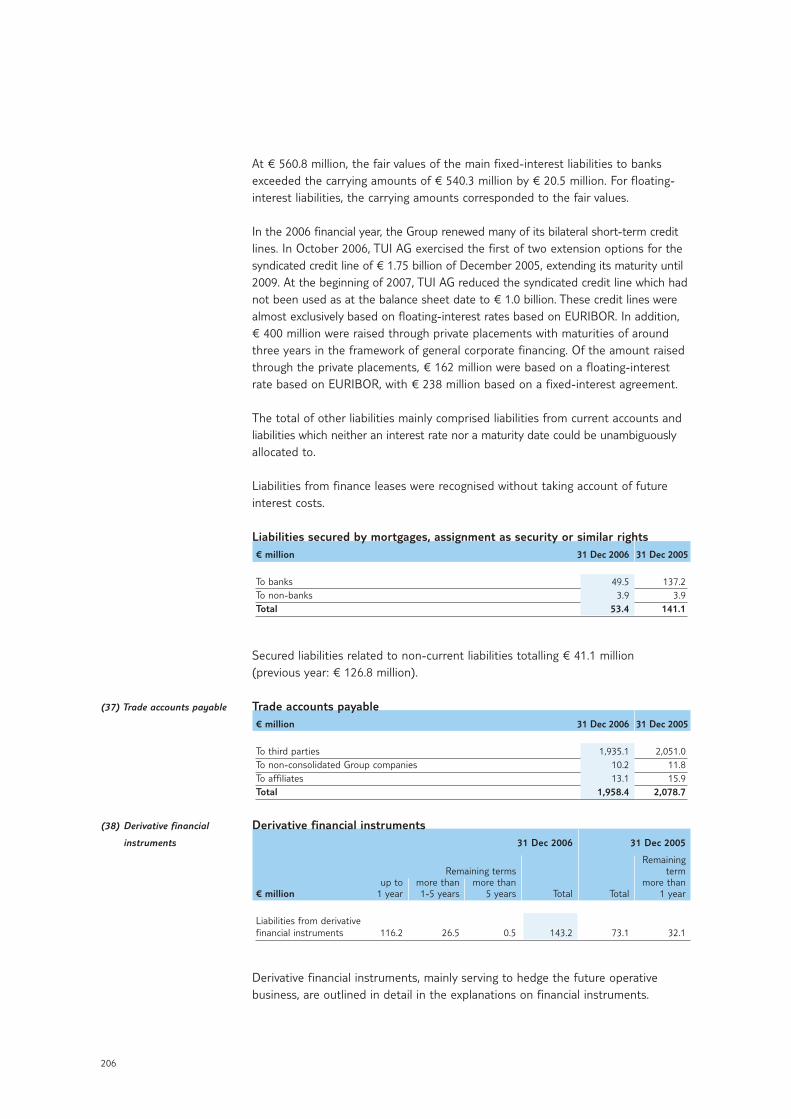
206
At € 560.8 million, the fair values of the main fixed-interest liabilities to banksexceeded the carrying amounts of € 540.3 million by € 20.5 million. For floating-interest liabilities, the carrying amounts corresponded to the fair values.
In the 2006 financial year, the Group renewed many of its bilateral short-term creditlines. In October 2006, TUI AG exercised the first of two extension options for thesyndicated credit line of € 1.75 billion of December 2005, extending its maturity until2009. At the beginning of 2007, TUI AG reduced the syndicated credit line which hadnot been used as at the balance sheet date to € 1.0 billion. These credit lines werealmost exclusively based on floating-interest rates based on EURIBOR. In addition,€ 400 million were raised through private placements with maturities of aroundthree years in the framework of general corporate financing. Of the amount raisedthrough the private placements, € 162 million were based on a floating-interestrate based on EURIBOR, with € 238 million based on a fixed-interest agreement.
The total of other liabilities mainly comprised liabilities from current accounts andliabilities which neither an interest rate nor a maturity date could be unambiguouslyallocated to.
Liabilities from finance leases were recognised without taking account of futureinterest costs.
Liabilities secured by mortgages, assignment as security or similar rights € million 31 Dec 2006 31 Dec 2005
To banks 49.5 137.2To non-banks 3.9 3.9Total 53.4 141.1
Secured liabilities related to non-current liabilities totalling € 41.1 million (previous year: € 126.8 million).
Trade accounts payable € million 31 Dec 2006 31 Dec 2005
To third parties 1,935.1 2,051.0To non-consolidated Group companies 10.2 11.8To affiliates 13.1 15.9Total 1,958.4 2,078.7
Derivative financial instruments31 Dec 2006 31 Dec 2005
RemainingRemaining terms term
up to more than more than more than€ million 1 year 1-5 years 5 years Total Total 1 year
Liabilities from derivative financial instruments 116.2 26.5 0.5 143.2 73.1 32.1
Derivative financial instruments, mainly serving to hedge the future operative business, are outlined in detail in the explanations on financial instruments.
(37) Trade accounts payable
(38) Derivative financial
instruments
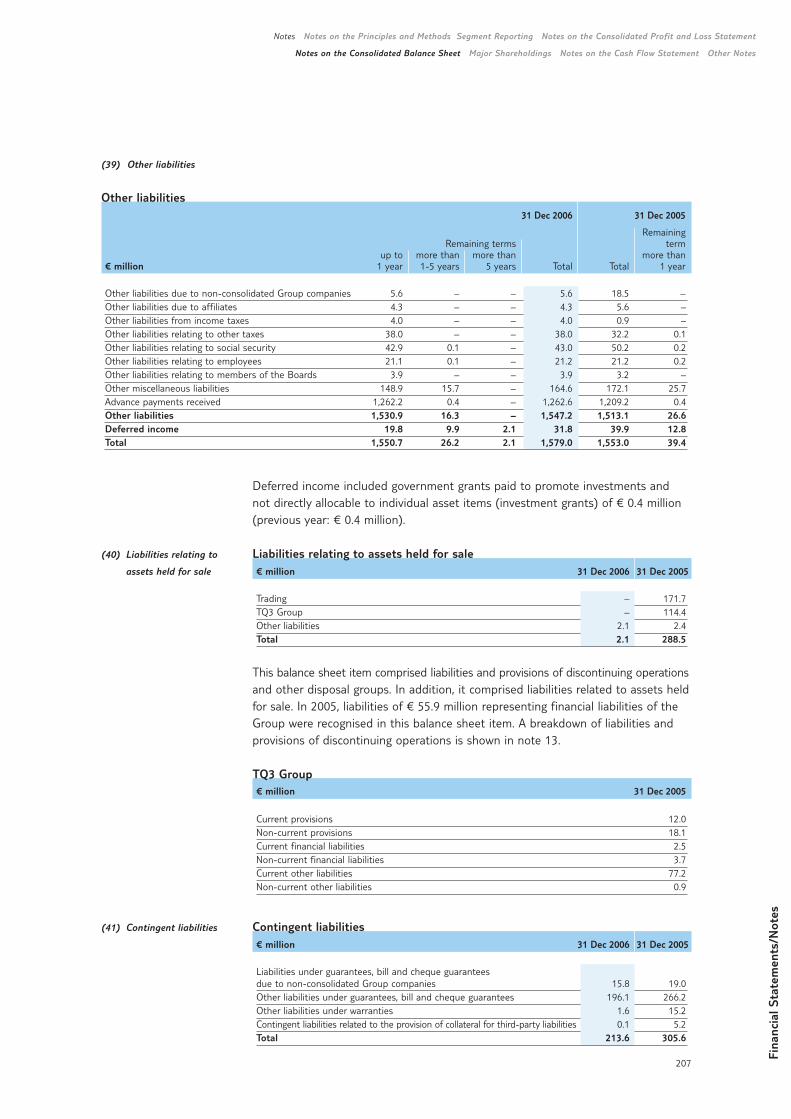
Fina
ncia
l Sta
tem
ents
/Not
es
207
Notes Notes on the Principles and Methods Segment Reporting Notes on the Consolidated Profit and Loss Statement
Notes on the Consolidated Balance Sheet Major Shareholdings Notes on the Cash Flow Statement Other Notes
(40) Liabilities relating to
assets held for sale
(41) Contingent liabilities
Deferred income included government grants paid to promote investments and not directly allocable to individual asset items (investment grants) of € 0.4 million (previous year: € 0.4 million).
Liabilities relating to assets held for sale € million 31 Dec 2006 31 Dec 2005
Trading – 171.7TQ3 Group – 114.4Other liabilities 2.1 2.4Total 2.1 288.5
This balance sheet item comprised liabilities and provisions of discontinuing operationsand other disposal groups. In addition, it comprised liabilities related to assets heldfor sale. In 2005, liabilities of € 55.9 million representing financial liabilities of theGroup were recognised in this balance sheet item. A breakdown of liabilities andprovisions of discontinuing operations is shown in note 13.
TQ3 Group € million 31 Dec 2005
Current provisions 12.0Non-current provisions 18.1Current financial liabilities 2.5Non-current financial liabilities 3.7Current other liabilities 77.2Non-current other liabilities 0.9
Contingent liabilities€ million 31 Dec 2006 31 Dec 2005
Liabilities under guarantees, bill and cheque guarantees due to non-consolidated Group companies 15.8 19.0Other liabilities under guarantees, bill and cheque guarantees 196.1 266.2Other liabilities under warranties 1.6 15.2Contingent liabilities related to the provision of collateral for third-party liabilities 0.1 5.2Total 213.6 305.6
(39) Other liabilities
Other liabilities31 Dec 2006 31 Dec 2005
RemainingRemaining terms term
up to more than more than more than€ million 1 year 1-5 years 5 years Total Total 1 year
Other liabilities due to non-consolidated Group companies 5.6 – – 5.6 18.5 –Other liabilities due to affiliates 4.3 – – 4.3 5.6 –Other liabilities from income taxes 4.0 – – 4.0 0.9 –Other liabilities relating to other taxes 38.0 – – 38.0 32.2 0.1Other liabilities relating to social security 42.9 0.1 – 43.0 50.2 0.2Other liabilities relating to employees 21.1 0.1 – 21.2 21.2 0.2Other liabilities relating to members of the Boards 3.9 – – 3.9 3.2 –Other miscellaneous liabilities 148.9 15.7 – 164.6 172.1 25.7Advance payments received 1,262.2 0.4 – 1,262.6 1,209.2 0.4Other liabilities 1,530.9 16.3 – 1,547.2 1,513.1 26.6Deferred income 19.8 9.9 2.1 31.8 39.9 12.8Total 1,550.7 26.2 2.1 1,579.0 1,553.0 39.4
208
(42) Litigation
Contingent liabilities were carried at the level of estimated completion amount asat the balance sheet date.
Liabilities under warranties were all contractual liabilities to third parties not to beclassified as guarantees and going beyond the typical scope of the business andthe industry.
In connection with the insolvency of Babcock Borsig AG, provisions were formed inprevious years to fully cover the guarantees and warranties related to activities inthe former plant engineering and ship building sectors which were likely to be calledin. All remaining guarantees and warranties from former plant engineering and ship-building activities served the settlement of ongoing business transactions and wereshown at their respective amounts at the balance sheet date. The reduction in guarantees and warranties led to a reduction in the relevant amount in the yearunder review.
TUI Group companies were jointly and severally liable for participations in civil-lawpartnerships for which profit and loss transfer agreements with subsidiaries existed,for participations in joint ventures and participations in partnerships as generalpartner.
Neither TUI AG nor any of its subsidiaries were involved in pending or foreseeablecourt or arbitration proceedings which might have a significant impact on its economicposition or had such an impact in the past two years, nor were any such proceedingsforeseeable. This also applied to actions claiming warranty, repayment or any othercompensation brought forward in connection with the divestment of subsidiariesand sectors implemented over the past few years. The provision formed for thefinancial charge from the declaratory action submitted by the insolvency trustee ofBabcock Borsig AG (in insolvency) at the district court of Duisburg in 2004 andmeanwhile pending at the regional court of Frankfurt/Main only amounted to thelevel of the anticipated non-refundable cost of proceedings since the action wasexpected to be dismissed.
In 1999, the operator of the container terminal in Zeebrugge in Belgium broughtan action for damages against CP Ships Ltd. and several of its subsidiaries due toan alleged breach of agreement in connection with the change of the Belgian portof call from Zeebrugge to Antwerp. Furthermore, seven shareholder class actionswere brought against CP Ships in the US and a further three in Canada due toalleged irregularities in the reporting by the CP Ships Group in connection with theadjustments of the financial statements in 2004, resulting in particular in thereduction in profits for the first quarter of 2004 and for the preceding years 2002and 2003. Based on the findings and assessments currently available, the prerequi-sites for the recognition of obligations are not met in either of the two pendingcases. In the framework of the purchase price allocation as at 25 October 2005, thesetwo actions were carried and recognised as contingent liabilities of USD 58.8 million.Offsetting refund claims under insurance policies and other agreements were notrecognised since they were not assessed as highly probable.
As in previous years, the respective Group companies had formed provisions orexpected adequate insurance benefits to cover any potential financial charges fromother court or arbitration proceedings. Overall, the future financial position is there-fore unlikely to be substantially affected by such charges.
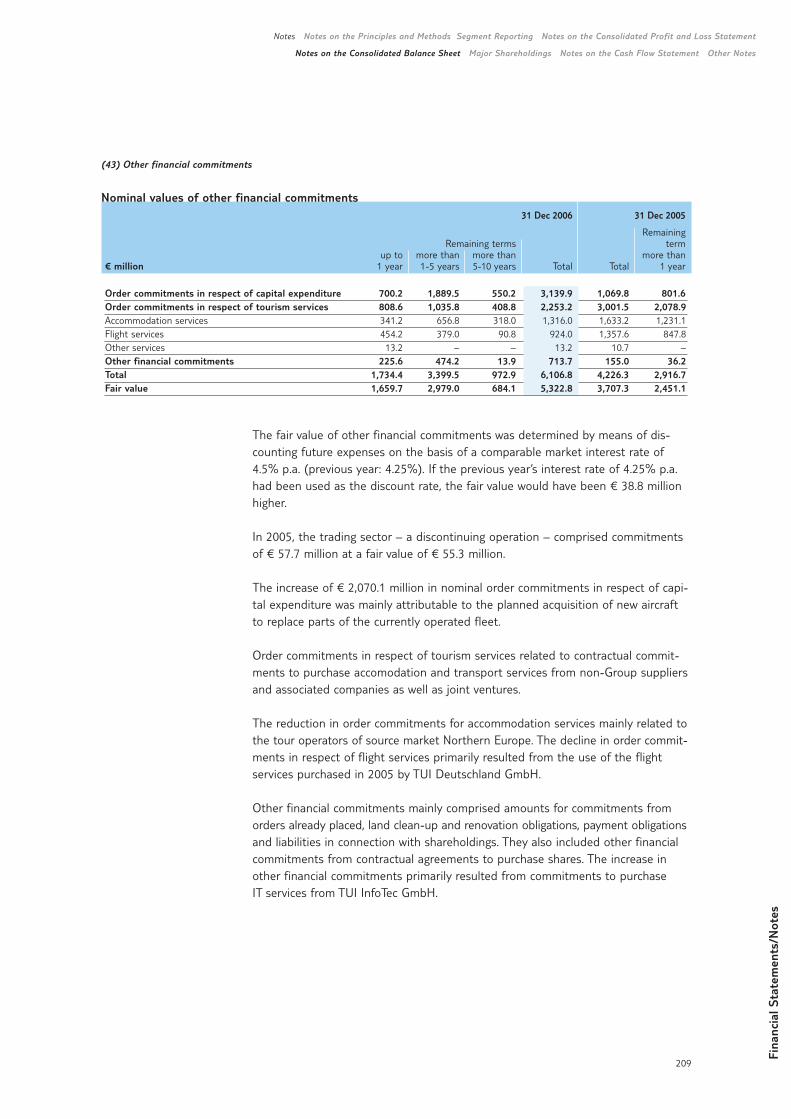
Fina
ncia
l Sta
tem
ents
/Not
es
209
Notes Notes on the Principles and Methods Segment Reporting Notes on the Consolidated Profit and Loss Statement
Notes on the Consolidated Balance Sheet Major Shareholdings Notes on the Cash Flow Statement Other Notes
The fair value of other financial commitments was determined by means of dis-counting future expenses on the basis of a comparable market interest rate of4.5% p.a. (previous year: 4.25%). If the previous year’s interest rate of 4.25% p.a.had been used as the discount rate, the fair value would have been € 38.8 millionhigher.
In 2005, the trading sector – a discontinuing operation – comprised commitmentsof € 57.7 million at a fair value of € 55.3 million.
The increase of € 2,070.1 million in nominal order commitments in respect of capi-tal expenditure was mainly attributable to the planned acquisition of new aircraftto replace parts of the currently operated fleet.
Order commitments in respect of tourism services related to contractual commit-ments to purchase accomodation and transport services from non-Group suppliersand associated companies as well as joint ventures.
The reduction in order commitments for accommodation services mainly related tothe tour operators of source market Northern Europe. The decline in order commit-ments in respect of flight services primarily resulted from the use of the flight services purchased in 2005 by TUI Deutschland GmbH.
Other financial commitments mainly comprised amounts for commitments fromorders already placed, land clean-up and renovation obligations, payment obligationsand liabilities in connection with shareholdings. They also included other financialcommitments from contractual agreements to purchase shares. The increase inother financial commitments primarily resulted from commitments to purchase IT services from TUI InfoTec GmbH.
(43) Other financial commitments
Nominal values of other financial commitments 31 Dec 2006 31 Dec 2005
RemainingRemaining terms term
up to more than more than more than€ million 1 year 1-5 years 5-10 years Total Total 1 year
Order commitments in respect of capital expenditure 700.2 1,889.5 550.2 3,139.9 1,069.8 801.6Order commitments in respect of tourism services 808.6 1,035.8 408.8 2,253.2 3,001.5 2,078.9Accommodation services 341.2 656.8 318.0 1,316.0 1,633.2 1,231.1Flight services 454.2 379.0 90.8 924.0 1,357.6 847.8Other services 13.2 – – 13.2 10.7 –Other financial commitments 225.6 474.2 13.9 713.7 155.0 36.2Total 1,734.4 3,399.5 972.9 6,106.8 4,226.3 2,916.7Fair value 1,659.7 2,979.0 684.1 5,322.8 3,707.3 2,451.1
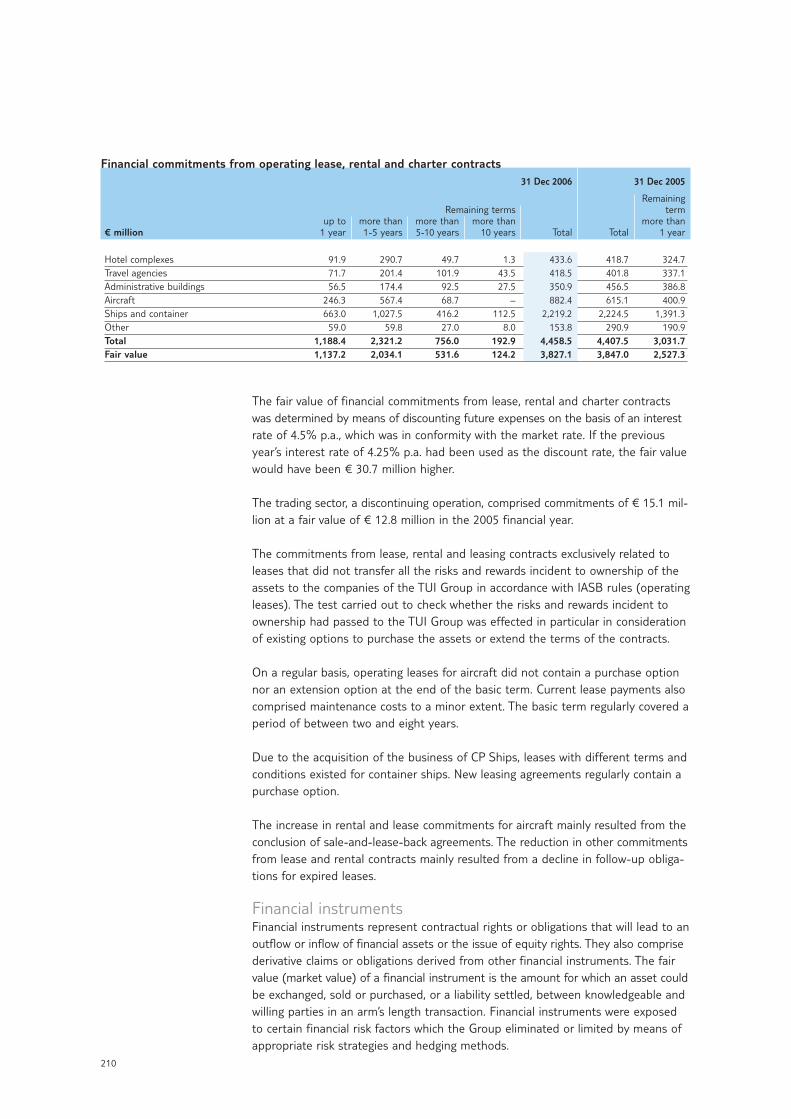
210
The fair value of financial commitments from lease, rental and charter contractswas determined by means of discounting future expenses on the basis of an interestrate of 4.5% p.a., which was in conformity with the market rate. If the previousyear’s interest rate of 4.25% p.a. had been used as the discount rate, the fair valuewould have been € 30.7 million higher.
The trading sector, a discontinuing operation, comprised commitments of € 15.1 mil-lion at a fair value of € 12.8 million in the 2005 financial year.
The commitments from lease, rental and leasing contracts exclusively related toleases that did not transfer all the risks and rewards incident to ownership of theassets to the companies of the TUI Group in accordance with IASB rules (operatingleases). The test carried out to check whether the risks and rewards incident toownership had passed to the TUI Group was effected in particular in considerationof existing options to purchase the assets or extend the terms of the contracts.
On a regular basis, operating leases for aircraft did not contain a purchase optionnor an extension option at the end of the basic term. Current lease payments alsocomprised maintenance costs to a minor extent. The basic term regularly covered aperiod of between two and eight years.
Due to the acquisition of the business of CP Ships, leases with different terms andconditions existed for container ships. New leasing agreements regularly contain apurchase option.
The increase in rental and lease commitments for aircraft mainly resulted from theconclusion of sale-and-lease-back agreements. The reduction in other commitmentsfrom lease and rental contracts mainly resulted from a decline in follow-up obliga-tions for expired leases.
Financial instrumentsFinancial instruments represent contractual rights or obligations that will lead to anoutflow or inflow of financial assets or the issue of equity rights. They also comprisederivative claims or obligations derived from other financial instruments. The fairvalue (market value) of a financial instrument is the amount for which an asset couldbe exchanged, sold or purchased, or a liability settled, between knowledgeable andwilling parties in an arm’s length transaction. Financial instruments were exposedto certain financial risk factors which the Group eliminated or limited by means ofappropriate risk strategies and hedging methods.
Financial commitments from operating lease, rental and charter contracts 31 Dec 2006 31 Dec 2005
RemainingRemaining terms term
up to more than more than more than more than€ million 1 year 1-5 years 5-10 years 10 years Total Total 1 year
Hotel complexes 91.9 290.7 49.7 1.3 433.6 418.7 324.7Travel agencies 71.7 201.4 101.9 43.5 418.5 401.8 337.1Administrative buildings 56.5 174.4 92.5 27.5 350.9 456.5 386.8Aircraft 246.3 567.4 68.7 – 882.4 615.1 400.9Ships and container 663.0 1,027.5 416.2 112.5 2,219.2 2,224.5 1,391.3Other 59.0 59.8 27.0 8.0 153.8 290.9 190.9Total 1,188.4 2,321.2 756.0 192.9 4,458.5 4,407.5 3,031.7Fair value 1,137.2 2,034.1 531.6 124.2 3,827.1 3,847.0 2,527.3
Fina
ncia
l Sta
tem
ents
/Not
es
211
Notes Notes on the Principles and Methods Segment Reporting Notes on the Consolidated Profit and Loss Statement
Notes on the Consolidated Balance Sheet Major Shareholdings Notes on the Cash Flow Statement Other Notes
Hedging strategy and risk managementIn accordance with the Group’s corporate financial goal, financial risks had to belimited. In order to implement this goal, the Group operated central risk manage-ment activities in the framework of which TUI AG acted as the Group’s bank. As amatter of principle, it was responsible for all financial transactions for the Groupcompanies and Group-wide financial risk management, based on guidelines andrules fixing binding decision bases, competencies and responsibilities for all financialtransactions.
Derivative financial instruments were only used in the framework of internally fixedlimits and other regulations. The instruments used had to be controllable with theGroup’s own resources (human resources, organisational resources, systems). Thehedges used were exclusively non-listed derivatives, primarily fixed-price transactions(e.g. futures and swaps) as well as options. The transactions were concluded atarm’s length with top-rated contracting counterparties in the financial sector. As a matter of principle, all hedging transactions of the Group were based onappropriately recognised or future underlying items.
There was a strict organisational separation between the functional areas of trading,settlement and control. Compliance with the set limits and guidelines was regularlymonitored. Recognised standard software was used for the assessment, monitoringand reporting of the hedges entered into and the underlying items. The processes,the methods applied and the organisation of risk management were reviewed forcompliance with the relevant regulations at least annually by the internal auditdepartment and external auditors. In this context, the Group also performed abenchmarking against general industry standards.
The hedging transactions by the Group companies were based on the risk profileand hedge schedule of the respective company. The Group companies submittedmonthly reports on their current and planned foreign currency and fuel requirements(or surpluses) to TUI AG. Based on the risk profile, the hedge schedule and themonthly reports submitted by the companies, each company defined its specifichedging strategy, on the basis of which TUI AG established its hedge portfolio.
TUI AG concluded appropriate hedge transactions with external counterparties,using potential netting effects (netting of income and expenses in the same currencyand with equivalent terms).
Hedges of currency transactions in the tourism division covered between 95% and100% of the planned foreign currency requirements in the respective tourism seasonafter the calculated brochure prices had been fixed. The hedged volumes wereadjusted to changes in planning requirements based on the monthly reports by thesubsidiaries.
Currency transactions of the companies in the shipping division were also hedgedin accordance with the planned exposures listed in the monthly reports submittedby the companies. Between 80% and 100% of the reported exposures were hedgedin this division.
Hedges of price risks related to aircraft fuel were based on the hedging modelused by the tourism companies. When calculations for the respective season weremade, at least 95% of the exposures were hedged, taking account of possibilitiesof levying fuel price surcharges.
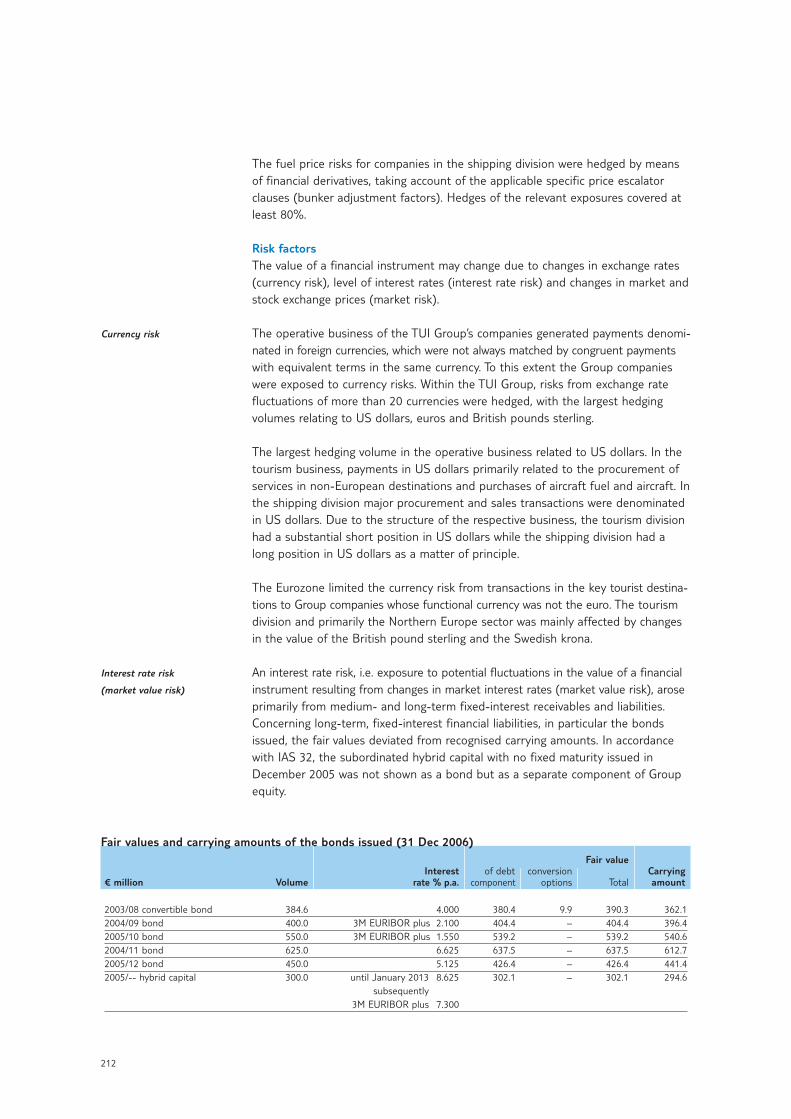
212
Currency risk
Interest rate risk
(market value risk)
The fuel price risks for companies in the shipping division were hedged by meansof financial derivatives, taking account of the applicable specific price escalatorclauses (bunker adjustment factors). Hedges of the relevant exposures covered atleast 80%.
Risk factorsThe value of a financial instrument may change due to changes in exchange rates(currency risk), level of interest rates (interest rate risk) and changes in market andstock exchange prices (market risk).
The operative business of the TUI Group’s companies generated payments denomi-nated in foreign currencies, which were not always matched by congruent paymentswith equivalent terms in the same currency. To this extent the Group companieswere exposed to currency risks. Within the TUI Group, risks from exchange ratefluctuations of more than 20 currencies were hedged, with the largest hedgingvolumes relating to US dollars, euros and British pounds sterling.
The largest hedging volume in the operative business related to US dollars. In thetourism business, payments in US dollars primarily related to the procurement ofservices in non-European destinations and purchases of aircraft fuel and aircraft. Inthe shipping division major procurement and sales transactions were denominatedin US dollars. Due to the structure of the respective business, the tourism divisionhad a substantial short position in US dollars while the shipping division had along position in US dollars as a matter of principle.
The Eurozone limited the currency risk from transactions in the key tourist destina-tions to Group companies whose functional currency was not the euro. The tourismdivision and primarily the Northern Europe sector was mainly affected by changesin the value of the British pound sterling and the Swedish krona.
An interest rate risk, i.e. exposure to potential fluctuations in the value of a financialinstrument resulting from changes in market interest rates (market value risk), aroseprimarily from medium- and long-term fixed-interest receivables and liabilities.Concerning long-term, fixed-interest financial liabilities, in particular the bondsissued, the fair values deviated from recognised carrying amounts. In accordancewith IAS 32, the subordinated hybrid capital with no fixed maturity issued inDecember 2005 was not shown as a bond but as a separate component of Groupequity.
Fair values and carrying amounts of the bonds issued (31 Dec 2006)Fair value
Interest of debt conversion Carrying€ million Volume rate % p.a. component options Total amount
2003/08 convertible bond 384.6 4.000 380.4 9.9 390.3 362.12004/09 bond 400.0 3M EURIBOR plus 2.100 404.4 – 404.4 396.42005/10 bond 550.0 3M EURIBOR plus 1.550 539.2 – 539.2 540.62004/11 bond 625.0 6.625 637.5 – 637.5 612.72005/12 bond 450.0 5.125 426.4 – 426.4 441.42005/-- hybrid capital 300.0 until January 2013 8.625 302.1 – 302.1 294.6
subsequently3M EURIBOR plus 7.300
Fina
ncia
l Sta
tem
ents
/Not
es
213
Notes Notes on the Principles and Methods Segment Reporting Notes on the Consolidated Profit and Loss Statement
Notes on the Consolidated Balance Sheet Major Shareholdings Notes on the Cash Flow Statement Other Notes
Market risk
Credit risk
Liquidity risk
Cash flow risk
Market risk arises from the fact that the value of a financial instrument may changedue to fluctuating market prices. In accordance with the rules of IAS 39, marketablesecurities were recognised at their fair values. Marketable available-for-sale securitiesmainly comprised listed shares and funds which were subject to normal price fluc-tuations on the capital markets. The market price risk of these investments wasnot hedged. As a matter of principle, changes in the market value of available-for-sale securities were taken directly to the revaluation reserve for financial instru-ments. Where any substantial impairments of available-for-sale securities occurred,the cumulative net loss previously shown in equity was recognised as an impairmentin the result for the period.
The credit risk in non-derivative financial instruments results from the risk of non-performance of contractual payment obligations by counterparties.
Maximum credit risk exposure was mainly reported as the total of the fair values ofthe non-derivative financial assets, taking account of legally enforceable possibilitiesof netting financial assets and liabilities but not considering existing collateral. Sincethe TUI Group operated in many different business areas and regions in a diversifiedmanner, significant credit risk concentrations from receivables from and loans tospecific debtors or groups of debtors were not to be expected; a significant con-centration of credit risks related to specific countries was not to be expected either.The Group covered the identifiable credit risk of individual receivables and the generalcredit risk by means of corresponding specific bad debt allowances. In addition,bad debt allowances based on empirical values were made on a portfolio basis.
For derivative financial instruments entered into, the maximum credit risk was thetotal of all positive market values of these instruments, since in the event of non-performance by the counterparties asset losses would be incurred only up to thisamount. Since derivative financial instruments were concluded with a variety oftop-rated debtors, no credit risk exposure was to be expected.
The Group’s liquidity requirements were determined by means of its liquidity planningand covered by committed credit lines so that the Group’s liquidity was guaranteedat any time.
The cash flow risk results from uncertainty about the levels and timing of cash inflowsor outflows from future transactions. The Group’s floating-rate financial liabilities inparticular entailed the risk of fluctuations in future cash flows due to changes ininterest rates level. In order to minimise this risk, interest rate hedges were conclu-ded where necessary to limit the potential cost of borrowing funds. The effectiveportion of the changes in the market values of these financial instruments, classi-fied as cash flow hedges in accordance with the rules of IAS 39, was taken directlyto equity.
The cash flow risks resulting from future cash flows in foreign currencies were hedgedthrough derivative financial instruments. To this end, the foreign currency require-ments of the tourism division attributable to expected bookings for future tourismseasons were hedged by means of corresponding forward exchange or option contracts. The foreign currency risks from planned future payment flows in theshipping division were also hedged by corresponding forward exchange or optioncontracts.
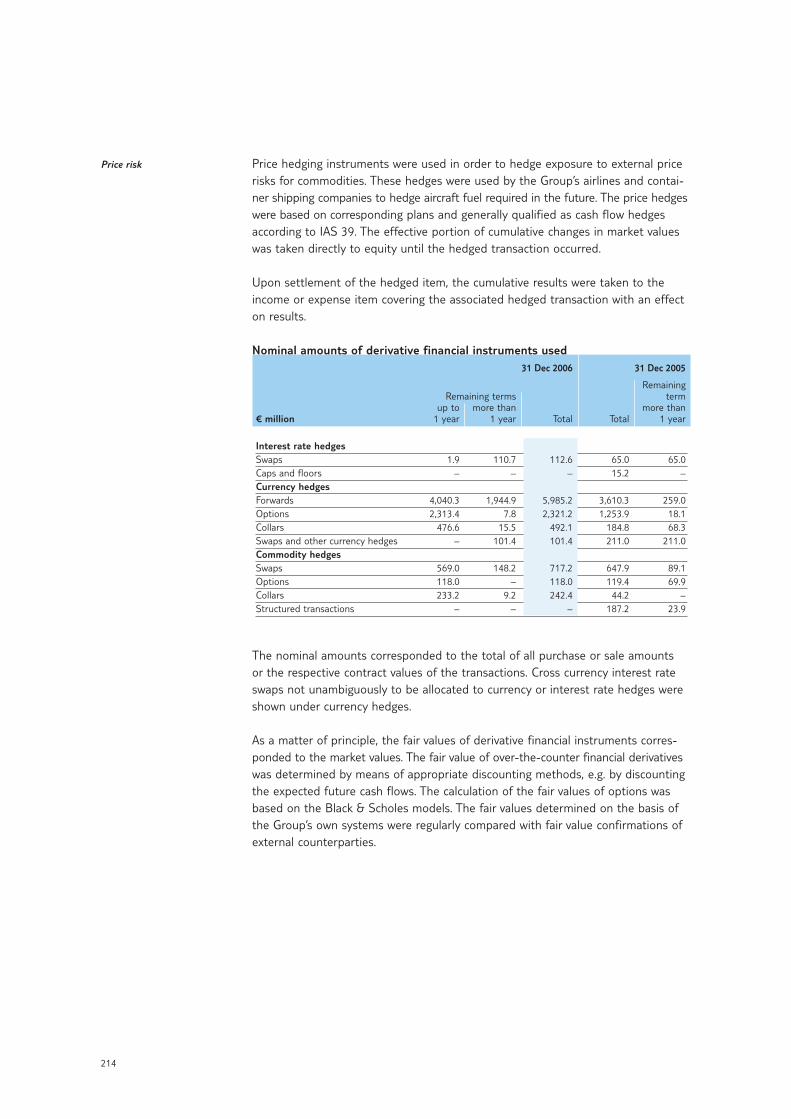
214
Price risk Price hedging instruments were used in order to hedge exposure to external pricerisks for commodities. These hedges were used by the Group’s airlines and contai-ner shipping companies to hedge aircraft fuel required in the future. The price hedgeswere based on corresponding plans and generally qualified as cash flow hedgesaccording to IAS 39. The effective portion of cumulative changes in market valueswas taken directly to equity until the hedged transaction occurred.
Upon settlement of the hedged item, the cumulative results were taken to theincome or expense item covering the associated hedged transaction with an effecton results.
Nominal amounts of derivative financial instruments used 31 Dec 2006 31 Dec 2005
RemainingRemaining terms term
up to more than more than€ million 1 year 1 year Total Total 1 year
Interest rate hedgesSwaps 1.9 110.7 112.6 65.0 65.0Caps and floors – – – 15.2 –Currency hedgesForwards 4,040.3 1,944.9 5,985.2 3,610.3 259.0Options 2,313.4 7.8 2,321.2 1,253.9 18.1Collars 476.6 15.5 492.1 184.8 68.3Swaps and other currency hedges – 101.4 101.4 211.0 211.0Commodity hedgesSwaps 569.0 148.2 717.2 647.9 89.1Options 118.0 – 118.0 119.4 69.9Collars 233.2 9.2 242.4 44.2 –Structured transactions – – – 187.2 23.9
The nominal amounts corresponded to the total of all purchase or sale amounts or the respective contract values of the transactions. Cross currency interest rateswaps not unambiguously to be allocated to currency or interest rate hedges wereshown under currency hedges.
As a matter of principle, the fair values of derivative financial instruments corres-ponded to the market values. The fair value of over-the-counter financial derivativeswas determined by means of appropriate discounting methods, e.g. by discountingthe expected future cash flows. The calculation of the fair values of options wasbased on the Black & Scholes models. The fair values determined on the basis ofthe Group’s own systems were regularly compared with fair value confirmations ofexternal counterparties.
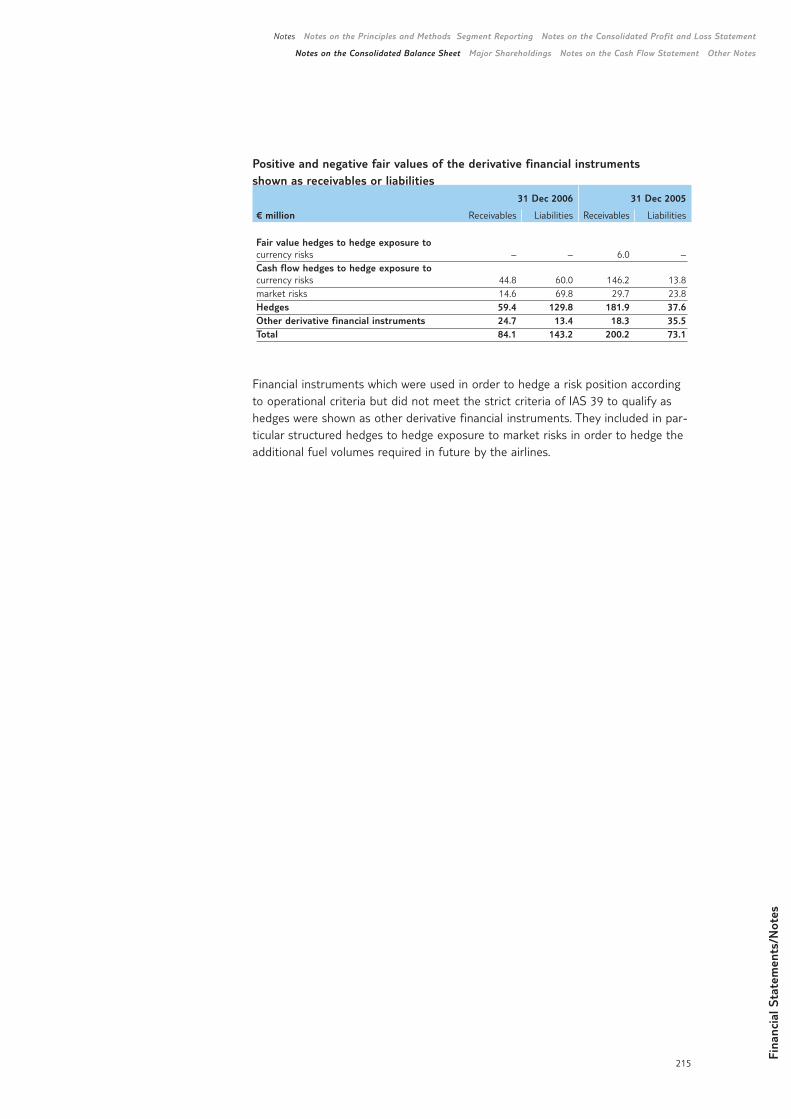
Fina
ncia
l Sta
tem
ents
/Not
es
215
Notes Notes on the Principles and Methods Segment Reporting Notes on the Consolidated Profit and Loss Statement
Notes on the Consolidated Balance Sheet Major Shareholdings Notes on the Cash Flow Statement Other Notes
Positive and negative fair values of the derivative financial instruments shown as receivables or liabilities
31 Dec 2006 31 Dec 2005
€ million Receivables Liabilities Receivables Liabilities
Fair value hedges to hedge exposure tocurrency risks – – 6.0 –Cash flow hedges to hedge exposure to currency risks 44.8 60.0 146.2 13.8market risks 14.6 69.8 29.7 23.8Hedges 59.4 129.8 181.9 37.6Other derivative financial instruments 24.7 13.4 18.3 35.5Total 84.1 143.2 200.2 73.1
Financial instruments which were used in order to hedge a risk position accordingto operational criteria but did not meet the strict criteria of IAS 39 to qualify ashedges were shown as other derivative financial instruments. They included in par-ticular structured hedges to hedge exposure to market risks in order to hedge theadditional fuel volumes required in future by the airlines.
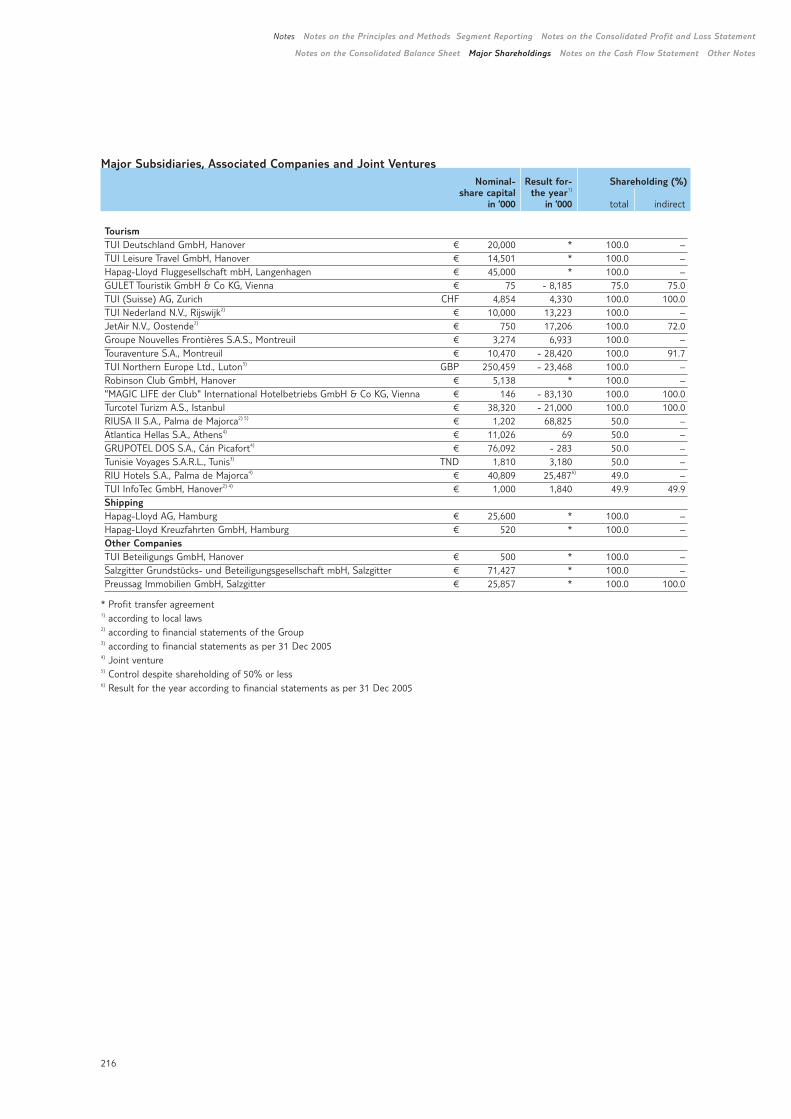
216
Notes Notes on the Principles and Methods Segment Reporting Notes on the Consolidated Profit and Loss Statement
Notes on the Consolidated Balance Sheet Major Shareholdings Notes on the Cash Flow Statement Other Notes
Major Subsidiaries, Associated Companies and Joint VenturesNominal- Result for- Shareholding (%)
share capital the year1)
in ‘000 in ‘000 total indirect
TourismTUI Deutschland GmbH, Hanover € 20,000 * 100.0 –TUI Leisure Travel GmbH, Hanover € 14,501 * 100.0 –Hapag-Lloyd Fluggesellschaft mbH, Langenhagen € 45,000 * 100.0 –GULET Touristik GmbH & Co KG, Vienna € 75 - 8,185 75.0 75.0TUI (Suisse) AG, Zurich CHF 4,854 4,330 100.0 100.0TUI Nederland N.V., Rijswijk2) € 10,000 13,223 100.0 –JetAir N.V., Oostende2) € 750 17,206 100.0 72.0Groupe Nouvelles Frontières S.A.S., Montreuil € 3,274 6,933 100.0 –Touraventure S.A., Montreuil € 10,470 - 28,420 100.0 91.7TUI Northern Europe Ltd., Luton3) GBP 250,459 - 23,468 100.0 –Robinson Club GmbH, Hanover € 5,138 * 100.0 –"MAGIC LIFE der Club" International Hotelbetriebs GmbH & Co KG, Vienna € 146 - 83,130 100.0 100.0Turcotel Turizm A.S., Istanbul € 38,320 - 21,000 100.0 100.0RIUSA II S.A., Palma de Majorca2) 5) € 1,202 68,825 50.0 –Atlantica Hellas S.A., Athens4) € 11,026 69 50.0 –GRUPOTEL DOS S.A., Cán Picafort4) € 76,092 - 283 50.0 –Tunisie Voyages S.A.R.L., Tunis3) TND 1,810 3,180 50.0 –RIU Hotels S.A., Palma de Majorca4) € 40,809 25,4876) 49.0 –TUI InfoTec GmbH, Hanover2) 4) € 1,000 1,840 49.9 49.9ShippingHapag-Lloyd AG, Hamburg € 25,600 * 100.0 –Hapag-Lloyd Kreuzfahrten GmbH, Hamburg € 520 * 100.0 –Other CompaniesTUI Beteiligungs GmbH, Hanover € 500 * 100.0 –Salzgitter Grundstücks- und Beteiligungsgesellschaft mbH, Salzgitter € 71,427 * 100.0 –Preussag Immobilien GmbH, Salzgitter € 25,857 * 100.0 100.0
* Profit transfer agreement1) according to local laws2) according to financial statements of the Group3) according to financial statements as per 31 Dec 20054) Joint venture5) Control despite shareholding of 50% or less6) Result for the year according to financial statements as per 31 Dec 2005
217
Fina
ncia
l Sta
tem
ents
/Not
es
Notes Notes on the Principles and Methods Segment Reporting Notes on the Consolidated Profit and Loss Statement
Notes on the Consolidated Balance Sheet Major Shareholdings Notes on the Cash Flow Statement Other Notes
Notes on the Cash Flow Statement
(45) Cash inflow/outflow
from operating activities
(46) Cash inflow/outflow
from investing activities
Notes on the cash flow statementThe cash flow statement showed the flow of cash and cash equivalents on the basisof a separate presentation of cash inflows and outflows from operating, investingand financing activities. The effects of changes in the group of consolidated com-panies were eliminated. The assets and liabilities grouped together as disposalgroups in accordance with IFRS 5 were reallocated to the original balance sheetitems for the purposes of the cash flow statement. The cash flow statement for2005 thus deviates from the consolidated balance sheet, in particular with regardto cash and cash equivalents carried.
The cash inflow from operating activities included interest received. Compared withthe previous financial year, the cash flow from operating activities was mainly affectedby a decline in the cash inflow from shipping operations due to the drop in ear-nings in the shipping sector in the financial year under review. The key factorsinfluencing this trend were the increase in bunker costs and the integration costsincurred. The cash flow from operating activities was also affected by the develop-ment of the steel trading activities. While the steel service companies contributed€ 121.5 million to the cash flow from operating activities in 2005, they caused acash outflow of € 17.4 million in the completed financial year. In 2005, the cashflow had also benefited from the cash inflow of € 67.6 million from special logisticsactivities. In the year under review, interest payments received totalled € 64.5 million(previous year: € 58.6 million). In the 2006 financial year, income tax paymentsresulted in a cash outflow of € 62.1 million (previous year: € 116.2 million).
The cash payments for investments in property, plant and equipment and intangibleassets or the cash receipts from corresponding disposals did not match the additionsor disposals shown under the development of fixed assets, which included non-cashinvestments and disposals. The cash outflow from investing activities comprisedthe payments for the acquisition of interests in companies to be included in con-solidation, offset against the amount of cash and cash equivalents acquired. The consolidated balance sheet comprised additions of goodwill, assets and liabilitiesdue to the acquisition of interests in subsidiaries included in consolidation. In thecompleted financial year, dividend payments received including dividends receivedby the companies measured at equity generated cash inflows of € 22.9 million (pre-vious year: € 32.5 million).
Overall, payments of around € 43.9 million (previous year: around € 2,099.7 million)were made in the 2006 financial year for acquisitions of interests in subsidiariesand participations. The amount of cash and cash equivalents acquired with theseacquisitions totalled around € 1.1 million. The high cash outflow in 2005 mainlyresulted from the acquisition of CP Ships in the fourth quarter. In the 2005 financialyear, the divestment of the US steel service companies, the TQ3 Group, Wolf GmbH,
218
(47) Cash inflow/outflow
from financing activities
(48) Development of cash
and cash equivalents
the TUI InfoTec Group and further divestments resulted in a total cash inflow of€ 719.7 million. The amount of cash and cash equivalents sold due to these divest-ments totalled around € 32.1 million in the 2006 financial year.
Non-cash investments in the shipping and tourism divisions were primarily effectedby means of finance leases. Lease agreements resulted in total investments of€ 76.9 million (previous year: € 124.5 million).
In the 2006 financial year, the cash flow from financing activities was substantiallycharacterised by the redemption of the bearer bond of € 750.0 million which maturedin October 2006. The redemption was primarily effected with cash inflows fromdivestments of subsidiaries. In addition, € 400 million were raised through privateplacements with maturities of around three years in the framework of general cor-porate refinancing. In the previous year the capital increase and the issue of twobonds resulted in a cash inflow of € 2.0 billion. The hybrid capital carried as equitygenerated an additional cash inflow of € 0.3 billion. Cash flows from financing activities included cash flows due to financial liabilities taken up or redeemed andinterest paid in the financial year under review.
Cash and cash equivalents comprised all liquid funds, i.e. cash in hand, bank balancesand cheques. The impact of changes in cash and cash equivalents due to exchangerate fluctuations is shown separately. Also outlined separately are the changes incash and cash equivalents attributable to changes in consolidation which did notresult from the acquisition or divestment of companies. As in 2005, cash and cashequivalents were not subject to any restraints on disposal as at 31 December 2006.
219
Fina
ncia
l Sta
tem
ents
/Not
es
Notes Notes on the Principles and Methods Segment Reporting Notes on the Consolidated Profit and Loss Statement
Notes on the Consolidated Balance Sheet Major Shareholdings Notes on the Cash Flow Statement Other Notes
Other Notes
Significant events after the balance sheet dateThe integration of CP Ships into Hapag-Lloyd changed the primary economic environment of the companies operating in the shipping division to such an extentthat the functional currency was changed from the euro to the US dollar. Theassessment of the functional currency was based on freight rates, cash inflow andcost structures. As of 1 January 2007, the companies operating in the containershipping division will therefore prepare their financial statements in US dollars.
On 22 February 2007, CP Ships Limited concluded a contract on the sale of thematerial assets of Montreal Gateway Terminals to Montreal Gateway Terminals Limited Partnership, a company specifically established by Morgan Stanley Infra-structure Partners for this purpose. Montreal Gateway Terminals was a constituentof the business of the container shipping line CP Ships acquired in 2005 by TUI AG.Montreal Gateway Terminals is the second largest container terminal in Canada andthe third largest on the eastern coast of North America. This sale was effected inthe framework of the reduction in invested capital, announced by TUI AG.
Montreal Gateway Terminals Limited Partnership acquired the container terminalbusiness on the basis of an asset deal. TUI continues to hold a 20% interest in thenew Montreal Gateway Terminals Limited Partnership through CP Ships Limited.The purchase price of the transaction totalled around € 300 million. As a key account,Hapag-Lloyd continues its relationship with the terminal on the basis of a long-termcontract.
Apart from this transaction, no further material transactions were resolved, initiatedor implemented in the period between the balance sheet date and the day onwhich the audit certificate was granted by the auditors (5 March 2007).
Services of the auditors of the consolidated financial statementsIn the 2006 financial year, total expenses of € 4.8 million were carried for the pro-fessional services provided by the auditors of the consolidated financial statements,PricewaterhouseCoopers Aktiengesellschaft Wirtschaftsprüfungsgesellschaft. Ofthis total, € 2.5 million were related to audits, € 2.2 million to other attestation ormeasurement services, and € 0.1 million to other services provided for TUI AG orits subsidiaries.
Remuneration of the Executive and Supervisory Board members In the financial year under review, remuneration paid to Board members totalled € 7,368.0 thousand (previous year: € 9,130.3 thousand).
In the framework of the long-term incentive programme, the Board membersreceived a compensation of € 17.0 thousand (previous year: € 2,005.5 thousand)for the financial year under review. The amount paid in the previous year was
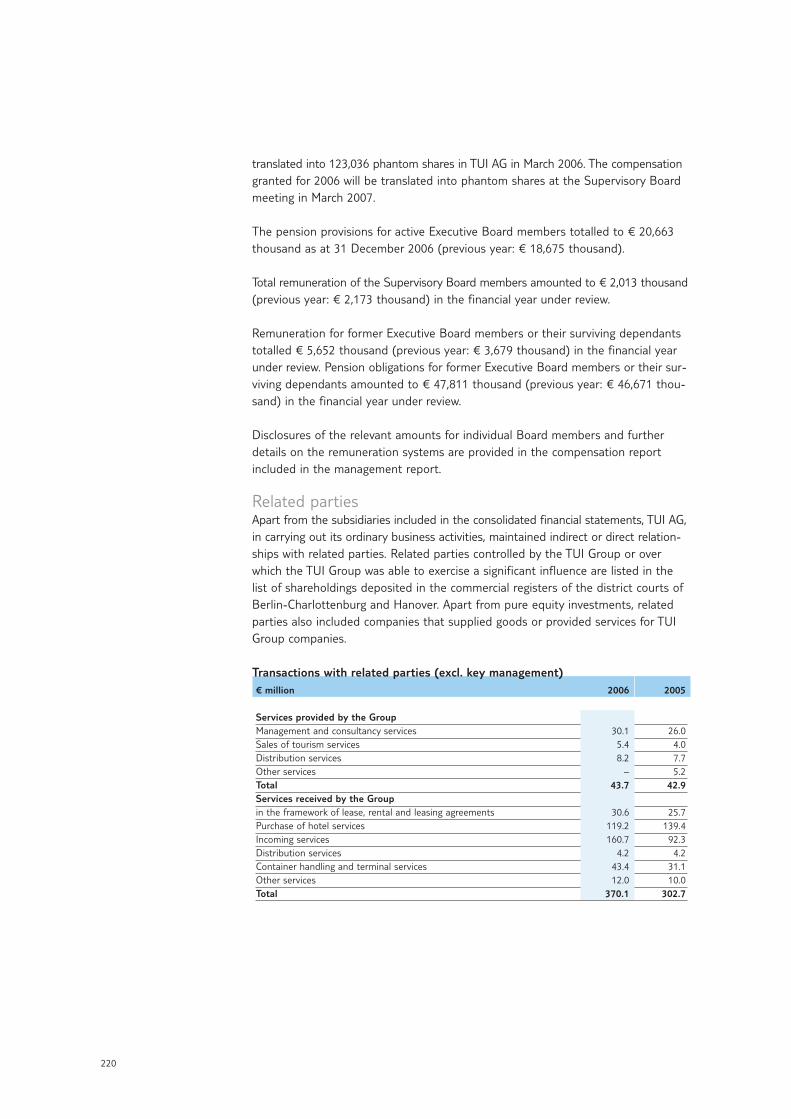
220
translated into 123,036 phantom shares in TUI AG in March 2006. The compensationgranted for 2006 will be translated into phantom shares at the Supervisory Boardmeeting in March 2007.
The pension provisions for active Executive Board members totalled to € 20,663thousand as at 31 December 2006 (previous year: € 18,675 thousand).
Total remuneration of the Supervisory Board members amounted to € 2,013 thousand(previous year: € 2,173 thousand) in the financial year under review.
Remuneration for former Executive Board members or their surviving dependantstotalled € 5,652 thousand (previous year: € 3,679 thousand) in the financial yearunder review. Pension obligations for former Executive Board members or their sur-viving dependants amounted to € 47,811 thousand (previous year: € 46,671 thou-sand) in the financial year under review.
Disclosures of the relevant amounts for individual Board members and furtherdetails on the remuneration systems are provided in the compensation reportincluded in the management report.
Related partiesApart from the subsidiaries included in the consolidated financial statements, TUI AG,in carrying out its ordinary business activities, maintained indirect or direct relation-ships with related parties. Related parties controlled by the TUI Group or overwhich the TUI Group was able to exercise a significant influence are listed in thelist of shareholdings deposited in the commercial registers of the district courts ofBerlin-Charlottenburg and Hanover. Apart from pure equity investments, relatedparties also included companies that supplied goods or provided services for TUIGroup companies.
Transactions with related parties (excl. key management)€ million 2006 2005
Services provided by the GroupManagement and consultancy services 30.1 26.0Sales of tourism services 5.4 4.0Distribution services 8.2 7.7Other services – 5.2Total 43.7 42.9Services received by the Groupin the framework of lease, rental and leasing agreements 30.6 25.7Purchase of hotel services 119.2 139.4Incoming services 160.7 92.3Distribution services 4.2 4.2Container handling and terminal services 43.4 31.1Other services 12.0 10.0Total 370.1 302.7
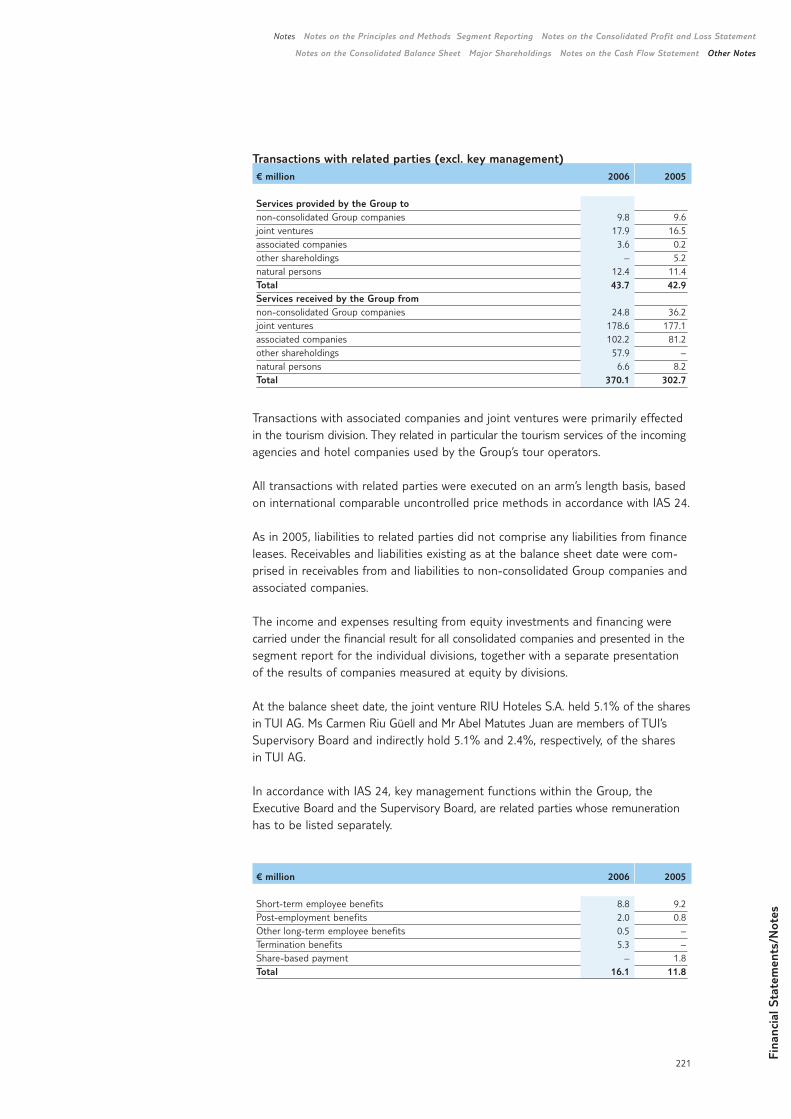
Fina
ncia
l Sta
tem
ents
/Not
es
221
Notes Notes on the Principles and Methods Segment Reporting Notes on the Consolidated Profit and Loss Statement
Notes on the Consolidated Balance Sheet Major Shareholdings Notes on the Cash Flow Statement Other Notes
Transactions with related parties (excl. key management)€ million 2006 2005
Services provided by the Group tonon-consolidated Group companies 9.8 9.6joint ventures 17.9 16.5associated companies 3.6 0.2other shareholdings – 5.2natural persons 12.4 11.4Total 43.7 42.9Services received by the Group fromnon-consolidated Group companies 24.8 36.2joint ventures 178.6 177.1associated companies 102.2 81.2other shareholdings 57.9 –natural persons 6.6 8.2Total 370.1 302.7
Transactions with associated companies and joint ventures were primarily effectedin the tourism division. They related in particular the tourism services of the incomingagencies and hotel companies used by the Group’s tour operators.
All transactions with related parties were executed on an arm’s length basis, basedon international comparable uncontrolled price methods in accordance with IAS 24.
As in 2005, liabilities to related parties did not comprise any liabilities from financeleases. Receivables and liabilities existing as at the balance sheet date were com-prised in receivables from and liabilities to non-consolidated Group companies andassociated companies.
The income and expenses resulting from equity investments and financing werecarried under the financial result for all consolidated companies and presented in thesegment report for the individual divisions, together with a separate presentationof the results of companies measured at equity by divisions.
At the balance sheet date, the joint venture RIU Hoteles S.A. held 5.1% of the sharesin TUI AG. Ms Carmen Riu Güell and Mr Abel Matutes Juan are members of TUI’sSupervisory Board and indirectly hold 5.1% and 2.4%, respectively, of the shares in TUI AG.
In accordance with IAS 24, key management functions within the Group, the Executive Board and the Supervisory Board, are related parties whose remunerationhas to be listed separately.
€ million 2006 2005
Short-term employee benefits 8.8 9.2Post-employment benefits 2.0 0.8Other long-term employee benefits 0.5 –Termination benefits 5.3 –Share-based payment – 1.8Total 16.1 11.8
222
The termination benefits were expensed additions to pension provisions for activeBoard members in the respective financial year. In accordance with the CorporateGovernance Code, these expenses do not represent remuneration of the Executiveand Supervisory Board. Termination benefits included an amount of € 3.3 millionfor the additions to provision.
Hanover, 5 March 2007
The Executive Board
Frenzel
Behrendt Engelen Feuerhake
Mueller Rothwell
223
Fina
ncia
l Sta
tem
ents
/Not
es
Auditor’s Report
‘We have audited the consolidated financial statements prepared by the TUI AG, Berlin and Hanover, comprisingthe balance sheet, the income statement, statement of recognised income and expense, cash flow statementand the notes to the consolidated financial statements, together with the group management report, which iscombined with the management report of the TUI AG for the business year from January 1 to December 31, 2006.The preparation of the consolidated financial statements and the combined management report in accordancewith the IFRSs, as adopted by the EU, and the additional requirements of German commercial law pursuant to§ (Article) 315a Abs. (paragraph) 1 HGB ("Handelsgesetzbuch": German Commercial Code) are the responsibilityof the parent Company's Board of Managing Directors. Our responsibility is to express an opinion on the consoli-dated financial statements and the combined management report based on our audit.
We conducted our audit of the consolidated financial statements in accordance with § 317 HGB and Germangenerally accepted standards for the audit of financial statements promulgated by the Institut der Wirtschafts-prüfer (Institute of Public Auditors in Germany) (IDW) and additionally observed the International Standards onAuditing (ISA). Those standards require that we plan and perform the audit such that misstatements materiallyaffecting the presentation of the net assets, financial position and results of operations in the consolidated financialstatements in accordance with the applicable financial reporting framework and in the combined managementreport are detected with reasonable assurance. Knowledge of the business activities and the economic and legal environment of the Group and expectations as to possible misstatements are taken into account in thedetermination of audit procedures. The effectiveness of the accounting-related internal control system and theevidence supporting the disclosures in the consolidated financial statements and the combined managementreport are examined primarily on a test basis within the framework of the audit. The audit includes assessingthe annual financial statements of those entities included in consolidation, the determination of the entities tobe included in consolidation, the accounting and consolidation principles used and significant estimates made bythe Company´s Board of Managing Directors, as well as evaluating the overall presentation of the consolidatedfinancial statements and the combined management report. We believe that our audit provides a reasonablebasis for our opinion.
Our audit has not led to any reservations.
In our opinion based on the findings of our audit the consolidated financial statements comply with the IFRSs asadopted by the EU, the additional requirements of German commercial law pursuant to § 315a Abs. 1 HGB andgive a true and fair view of the net assets, financial position and results of operations of the Group in accordancewith these provisions. The combined management report is consistent with the consolidated financial statementsand as a whole provides a suitable view of the Group's position and suitably presents the opportunities andrisks of future development.’
Hanover, 5 March 2007PricewaterhouseCoopers
AktiengesellschaftWirtschaftsprüfungsgesellschaft
Prof. Dr. Winkeljohann Dr. RolfesWirtschaftsprüfer Wirtschaftsprüfer
Forward-looking Statements
224
The annual report, in particular the report on expected developments included inthe management report, includes various forecasts and expectations as well as statements relating to the future development of the TUI Group and TUI AG. Thesestatements are based on assumptions and estimates and may entail known andunknown risks and uncertainties. Actual development and results as well as thefinancial and asset situation may therefore differ substantially from the expecta-tions and assumptions made. This may be due to market fluctuations, the develop-ment of world market prices for commodities, of financial markets and exchangerates, amendments to national and international legislation and provisions orfundamental changes in the economic and political environment. TUI does notintend to and does not undertake an obligation to update or revise any forward-looking statements to adapt them to events or developments after the publicationof this annual report.
Imprint
Concept, design and productionHGB Hamburger Geschäftsberichte GmbH & Co. KG, HamburgIrlenkäuser Communication GmbH, Düsseldorf
PhotographyArmin Brosch (Cover, pg. 4, 20/21)Boeing (pg. 12/13)Corbis (pg. 10/11)Hapag-Lloyd (pg. 3, 16/17, 18/19, Cover: U4)World of TUI Picture Pool (pg. 2, 14/15, 40, 54, Cover: U2+U3)
PrintingD+L Printpartner GmbH, Bocholt
The German version of this report is legally binding. The Companycannot be held responsible for any misunderstandings or misinter-pretations arising from this translation. Both versions are availableon the web: www.tui-group.com.
4 To our Shareholders
4 Letter to our Shareholders7 Two strong pillars, one Group.8 Challenging tasks. Clear goals.
22 Management Report
24 Business and Operating Environment34 Group Turnover and Earnings40 Tourism54 Shipping61 Discontinuing Operations 62 Earnings67 Net Assets72 Financial Position82 Report on Subsequent Events83 Risk Report 90 Remuneration Report 95 Research and Development97 Human Resources99 Environmental Protection
101 Report on Expected Developments
106 Corporate Governance
108 Corporate Governance Report112 Report of the Supervisory Board118 Supervisory Board121 Executive Board123 TUI Share127 TUI Group in Figures128 Sustainable Development
134 Financial Statements
136 Consolidated Profit and Loss Statement
137 Consolidated Balance Sheet138 Statement of Recognised Income
and Expenses138 Cash Flow Statement
139 Notes
139 Notes on the Principles and Methods
158 Segment Reporting167 Notes on the Consolidated Profit
and Loss Statement180 Notes on the Consolidated
Balance Sheet216 Major Shareholdings217 Notes on the Cash Flow Statement219 Other Notes
Table of Contents
Financial Calendar 2007
Interim Report January to March 2007 11 May 2007Annual General Meeting 2007 16 May 2007Interim Report January to June 2007 9 August 2007Interim Report January to September 2007 8 November 2007
Contact
TUI AGKarl-Wiechert-Allee 430625 HanoverGermany
P. O. Box 61 02 0930602 Hanover
Phone +49.0511.566-00Telefax +49.0511.566-1901E-Mail [email protected] www.tui-group.com
Investor RelationsE-Mail [email protected] +49.0511.566-1425 oder -1442Telefax +49.0511.566-1096
Group CommunicationsE-Mail [email protected] +49.0511.566-1408Telefax +49.0511.566-1166

TUI AGKarl-Wiechert-Allee 430625 HanoverGermany