annual procurement report 2012 - african … procurement report for 2012 ii table of contents...
TRANSCRIPT
Procurement
and Fiduciary
Services
Department
February 2014
African Development Bank
Group
Annual Procurement
Report for 2012
i
Those wishing to submit comments or questions or to obtain additional information on procurement and fiduciary services under Bank-financed projects, are encouraged to contact: Procurement & Fiduciary Services Department (ORPF) African Development Bank (www.afdb.org) Temporary Relocation Agency – Tunis (Tunisia) 13 Avenue du Ghana BP. 323, 1002 Tunis-Belvedere Tunisia Tel.: +216 – 7110 2027 Fax: +216 – 7183 3944 Email: [email protected] Procurement & Fiduciary Services Department (ORPF) African Development Bank (www.afdb.org) Headquarters – Abidjan (Côte d'Ivoire) 5 Avenue Joseph Anoma 01 B.P. 1387, Abidjan 01 Côte d'Ivoire Tel.: +225 - 2020 4444 Fax: +225 - 2021 7753 Email: [email protected]
Annual Procurement Report for 2012
ii
Table of Contents Acronyms ........................................................................................................................iv
Definitions ....................................................................................................................... v
Preface ............................................................................................................................vi
Executive Summary ....................................................................................................... vii
1. Introduction .............................................................................................................. 1
1.1 Purpose............................................................................................................. 1
1.2 Scope ................................................................................................................ 1
1.3 General Considerations, Procedures and Criteria for Contract Award .............. 2
2. Analysis of Contract Data ......................................................................................... 4
2.1 Trend in Business Volume in the last decade ................................................... 4
2.2 Share of Contracts by Borrower Countries........................................................ 6
2.3 Share of Procurement by Sector ....................................................................... 7
2.4 Distribution of Contract Awards Between Regional and Non-Regional Firms ... 9
2.5 Distribution of Contracts Across Categories of Expenditure (Goods, Works, Consulting Services) .................................................................................................. 14
2.6 Contract Amendments .................................................................................... 15
2.7 Disbursement .................................................................................................. 16
3. Improving Procurement Governance and Capacity................................................ 17
3.1 Implementation of the Cross-Debarment Agreement ...................................... 17
3.2 Review and Harmonization of Procurement Policy ......................................... 17
3.3 Procurement Reviews ..................................................................................... 18
3.4 Assessment of Electronic Government Procurement (E-GP) Implementation in Countries in Africa ..................................................................................................... 18
3.5 Readiness Review (RR) .................................................................................. 19
3.6 Procurement Risks Assessment and Management (PROCRAM) ................... 19
3.7 Assistance in Implementation of the 2012 Delegation of Authority Matrix (DAM) ........................................................................................................................ 20
3.8 Capacity Development Activities ..................................................................... 20
4. Economy and Efficiency ......................................................................................... 21
4.1 Time Efficiency ................................................................................................ 21
5. Equal opportunity and Transparency ..................................................................... 22
5.1 Publication of Procurement Notices ................................................................ 22
Annual Procurement Report for 2012
iii
5.2 Business Opportunity Seminars. ..................................................................... 22
5.3 Use of Competitive Procedures ...................................................................... 23
5.4 Participation by Bidders .................................................................................. 25
5.5 Complaint Handling and Anticorruption ........................................................... 25
6. Development of domestic and regional Contracting and manufacturing industries 27
6.1 Domestic and Regional Preferences ............................................................... 27
6.2 Use of African Contractors, Suppliers and Consultants .................................. 27
6.3 Job Creation Through Bank Projects .............................................................. 28
7. Use of Country Systems ........................................................................................ 29
7.1 Progress on the Use of Country Procurement Systems (UCPS) .................... 29
7.2 Patterns of National Share in ICB for Goods and Works Contract Awards ..... 30
7.3 Definition of new ICB Thresholds .................................................................... 33
7.4 Patterns of Contract Size for Goods and Works Contract Awards .................. 36
8. Conclusions and Recommendations ...................................................................... 39
Appendix 1: African Development Bank Group Member Countries ........................... 40
Appendix 2: Procurement Process Timelines for Goods, Works and Consultancy Services Under Bank Financed Projects ................................................................... 41
Appendix 3: Processing a Complaint Case ................................................................ 46
Appendix 4: Contract Award in 2012 by Borrower and Source of Financing ............. 47
Appendix 5: Contract Award in 2012 by Borrower and Procurement Method ............ 48
Appendix 6: Contract Award in 2012 by Source of Supply in NRMCs and Source of Financing ................................................................................................................... 49
Appendix 7: Contract Award by Source of Supply and Procurement Method in 2012 50
Annual Procurement Report for 2012
iv
Acronyms
ADB African Development Bank (also AfDB) ADF African Development Fund CPAR Country Procurement Assessment Report CQS Selection Based on Consultant Qualification FBS Fixed Budget Selection FM Financial Management GPN General Procurement Notice IACD Integrity and Anti-Corruption Department IAGP International Advisory Group of Procurement ICB International Competitive Bidding ISH International Shopping LCS Least-Cost-Selection LIB Limited International Competitive Bidding MAR Main Assessment Reports MDB Multilateral Development Banks MEI Goods Market Efficiency Index MSI Market Size Index NCB National Competitive Bidding NRMC Non Regional Member Country NSH National Shopping NTF Nigeria Trust Fund ORPF Procurement and Fiduciary Services Department PIU Projet Implementation Unit PROCRAM Procurement Risks Assessment and Management QaE Quality at Entry QBS Quality Based Selection QCBS Quality and Cost Based-Selection REC Regional Economic Community RMC Regional Member Country RR Readiness Review SBD Standard Bidding Documents SHL Shortlist SME Small and Medium-sized Enterprise SPN Specific Procurement Notice SSS Single Source Selection TOR Terms of Reference UA Unit of Account UCS Use of Country Systems UNDB United Nations Development Business Journal

Annual Procurement Report for 2012
v
Definitions
The African Development Bank Group comprises the African Development Bank (ADB), the African Development Fund (ADF), and the Nigeria Trust Fund (NTF). For the purpose of this report, the African Development Bank Group is hereafter referred to as “the Bank” unless otherwise specified. “Regional Member Countries” in this report refer to Bank’s member countries in Africa while “Non Regional Member Countries” refer to those member countries of the Bank that are outside Africa. Similarly, “Region” in this report refers to the African continent unless the context otherwise requires. "Borrower" means a party to a Financing Agreement with the Bank and includes the Borrower in a loan agreement with the Bank or the recipient of any other type of Financing from the Bank. Financing from the Bank in the context of this report shall mean Sovereign Guaranteed Loans or Grants or Technical Assistances provided by ADB, ADF, NTF or other funds administered by the Bank.

Annual Procurement Report for 2012
vi
Preface
The African Development Bank’s Procurement Policy constitutes a pivotal element of its lending framework. This is because the Agreement Establishing the Bank makes it mandatory for it to ensure that the loans granted by it are used for the purposes intended, a fiduciary obligation.
At the centre of how the operating policy that governs investment lending would evolve, is adopting at the project level, a “fit for purpose” procurement approach, making greater Use of Country Systems in investment operations, while managing associated risks and taking a stronger, more risk-based approach.
Globalization and integration have transformed the market for items financed by the Bank such that merchandise export from developing countries has multiplied many times. Supplying countries for Bank financed operations are increasingly developing economies with national companies progressively winning contracts in their countries. On the other hand developed countries have become more specialized, emphasizing on high-value and technologically-driven goods.
After the global analysis of procurement activities handled by the Bank during the last 10 years, as described in this report, and because of these transformations, it is our intention to undertake a comprehensive and detailed review of the procurement framework to clearly define a path for revision of procurement policies, procedures and internal practices to ensure that they remain in tune with the changing world situation and continue to effectively serve our borrowers. At the same time the purpose is also to help the Bank’s Regional Member Countries to develop, adapt and adopt best practices while addressing the needs of their public procurement systems and developing their capacity to meet their operational needs.
This Annual Report was prepared by the Operations Procurement and Fiduciary Services Department (ORPF) and task managed by Ms. Blandine Wu Chebili, Principal Procurement Policy Officer. The analysis is based on data obtained from the IT systems of the Bank and multiple other documents. Several staff and the managers from ORPF and other departments contributed to the preparation of the report.
To help us to further improve the quality of our Annual Procurement Report and make it more useful and relevant in the future, we welcome feedback from our readers. Comments and suggestions may be sent to [email protected].
Vinay Sharma Director, Procurement and Fiduciary Services Department
Annual Procurement Report for 2012
vii
Executive Summary
The procurement activities of the Bank reflect enhanced institutional effectiveness for results through a focus on five key priority areas: (i) results and performance; (ii) decentralization; (iii) streamlined internal processes; (iv) strengthening risk management capacity; and (v) leveraging resources to deliver.
In supporting the Operations Complexes, the Procurement and Fiduciary Services Department (ORPF) contributes to the Bank’s broader strategy by addressing internal and external challenges facing the fiduciary function in the Bank. The department provides support in Procurement and Financial Management to the operations complexes in all aspects of the project cycle including in design, preparation, appraisal, supervision and completion of projects and programs financed by the Bank.
Good public procurement practices are a major determinant of the effectiveness of public expenditure and are associated with better development outcomes in Bank projects.
The trend in the recent years has been that African firms are increasing their share of contracts financed by the Bank. In 2012, USD 838.670 million (46.51%) of the contracts by value (and 88% by number) went to African firms. It may be noted that these do not include smaller contracts that are paid for by Special Account, and that almost invariably go to local firms. The share of the African firms in bank financed contracts, therefore, exceeds 50% by value. The other encouraging trend is that African firms are increasingly winning contracts in countries other than where they are domiciled, often against severe competition from foreign firms.
Encouragement of the national industries and consultants is one of the principles in the Procurement Policy of the Bank. Statistics show that, mainly as a result of sound project design, African contractors, suppliers and consultants obtain significant business in Bank financed projects. While completed projects help in the economic and social improvement of the Regional Member Countries (RMCs), it is evident that the project implementation activities themselves result in substantial job creation and use of African Small and Medium-size Enterprises (SMEs).
The Bank engages with client countries for building capacity in public procurement at a number of levels. Apart from the launching workshops normally held at the time of start of a project (where procurement officers work with client staff on advising on the procurement issues in the project), the Bank is progressively using Fiduciary Clinics to resolve Procurement, Financial Management (FM) and disbursement issues in countries. In these clinics, an assessment of the problems faced by various projects is carried out, and specific focused trainings imparted to resolve such issues.
With increased decentralization, Bank staff is also increasingly working with Project Implementation Units (PIU) staff to advise on complex procurement cases. This has helped significantly resolve issues and the lead time of procurement in the portfolio is progressively coming down. For example, the average time taken for International Competitive Bidding (ICB) contracts in the Bank is now 250 days against 286 days for the World Bank and 417 days for the Asian Development Bank.
The Bank also works with other development partners in diagnostic assessments of

Annual Procurement Report for 2012
viii
procurement systems. This helps in identifying gaps and designing projects for providing assistance to various African countries in improving the Public Procurement systems.
The broad goal of the Bank’s promotion for the use of partner country systems is to simplify and reduce transaction costs for both the borrowing RMCs and the Bank, promote country ownership, contribute to capacity development and increase harmonization with other development partners without reducing fiduciary standards in any way. The Rules and Procedures of the Bank provide for a country’s procedures to be used for National Competitive Bidding (NCB) provided these have been found acceptable (after review and modification, if necessary) to assure economy, efficiency, transparency and broad consistency with the procurement principles of the Bank. At the present moment, the Bank has finalized the review of the NCB procedures of 48 countries.
The Bank hase done an assessment of the legal, institutional and regulatory framework of public procurement in these 48 countries and examined in detail the Standard Bidding Documents if used by the countries. The studies have revealed that in almost 75% of the countries, the National Bidding Procedures can be used (with minor changes) for most small and medium value contracts financed by the Bank. The results of these studies are being discussed with the countries. The Bank is progressively allowing the use of such procedures (for countries where such procedures are found acceptable) in projects that it finances for NCB contracts. As a result of engagement with partner countries, an agreement was recently signed with the Government of Morocco for use of the Moroccan National Bidding Procedures for NCB contracts with minor differences. It is expected that by the first quarter of 2014, such agreements will be signed by about 8 more countries where the discussions with the authorities are advanced.
Harmonization in procurement policy and procedures among the various Multilateral Development Banks (MDBs) has been going on for the last many years. Today, the procurement policies of the Bank are substantially harmonized with those of other MDBs (particularly the World Bank) with some differences on eligibility and preferences for National or regional goods or works. Again this has resulted in reduction of transaction costs of the Borrowers and brings efficiency in operations, including co-funded projects with other institutions.
While some progress has been made on country systems, harmonization, and procurement reforms, more remains to be done. It is time to move from the one-size fits all approach to one that facilitates these requirements and accounts for country risks. New challenges such as value for money, best fit for purpose, tailor-made procurement, environmentally and socially responsible procurement, technology and other innovations must be given recognition.
In order to continue to align its procurement policies and processes more effectively to the achievement of true development effectiveness in the rapidly evolving economic climate in its borrowing RMCs, given its commitments, and also to continue to ensure modernization and simplification of its processes, the Bank has decided to undertake a comprehensive and detailed review of its procurement policy.
The expected output from the review exercise will be a much more nimble and flexible policy that would acknowledge the differences in needs in different set of countries, the

Annual Procurement Report for 2012
ix
different sectors and sustainability in procurement. It will make the process more efficient without reducing fiduciary standards.
Annual Procurement Report for 2012
1 / 50
INTRODUCTION 1.
1.1 Purpose
This Annual Procurement Report for 2012 (the Report) is prepared by the Procurement and Fiduciary Services Department (ORPF) of the African Development Bank (AfDB or the Bank) to provide stakeholders with relevant information on the procurement activities under projects financed by the African Development Bank Group. Wherever necessary, to determine trends, data for the ten year period 2003 to 2012 is also used. The statistics are drawn from the details of the contracts entered by the Task Managers in the SAP PS (Project Systems) module and relate primarily to the Bank’s sovereign portfolio.
It is hoped that this report will be found useful by the member countries of the Bank, the business community, Civil Society and the general public. The information provided in this report may also be used for evaluating the procurement performance of the Bank’s portfolio.
1.2 Scope
While the emphasis of the Report is on contracts that were entered in the SAP-PS that were signed in 2012 by the projects financed in whole or in part by the Bank, it also covers, wherever necessary, all contracts awarded by the borrowers for the last ten years for Goods, Works and Consulting Services. The source of the data is the SAP-PS (Project System) of the Bank where information for contracts is entered by the Task Managers. The procurement for these contracts was carried out by the borrowers of the Bank following the Bank’s “Rules and Procedures for Procurement of Goods and Works” or “Rules and Procedures for the Use of Consultants” (hereafter may be collectively referred to as “Rules and Procedures”), as required by the Project Financing Agreements. For projects that are partially financed by the Bank, the procurement value included in this report reflects the amount financed by the Bank. This report does not cover procurement under policy-based lending 1 or private and non-sovereign guaranteed loans, lines of credit, debt relief, private equity participations and Special Fund allocations 2 . The contracts also do not include some paid for through the Special Accounts (revolving funds) being maintained by the projects and replenished by the Bank from time to time. Such contracts, though large in number, are generally small in individual value and their exclusion will not materially affect the results of the various analyses in the report.
1 Since the mid-1980s, the need for structural reforms called for the introduction of a different
mechanism to ensure faster-disbursing and policy-based loans. This led to the introduction of Structural Adjustment Programmes at the macro-economic level, and Sectorial Adjustment Programs at the sectorial level via Structural Adjustment Loans (SALs) and Sectorial Adjustment Loans (SECALs). Policy-based lending accounts for 39.9% of the Bank’s total lending to Middle-Income Countries in the region.
2 UA 1.59 billion was directed towards debt relief, private equity participations and Special Fund
allocations, accounting for 27.8% of the Bank’s total approval of UA 5.72 billion for new operations in 2012 (Source: African Development Annual Report 2012, Chapter 2 Section 2).
Annual Procurement Report for 2012
2 / 50
This report also does not cover contracts financed through the Administrative or Capital Expenditure Budgets of the Bank.
The data on contract awards shown in most parts of this report are based on the value of the contracts at signature. Reduction or increase in the original contract amount through contract amendments are dealt with separately in Section 2.6 on contract amendments.
For the purpose of this report, unless otherwise specified in the contents, the time taken for procurement is the time elapsed from the preparation of the Bidding documents by the Borrower to signing of the contract. The time unit is calendar day unless otherwise indicated.
The Bank uses a unit of account (the “Unit of Account” or “UA”) equivalent to the IMF’s Special Drawing Right (SDR) as its reporting currency. The value of the SDR varies from day to day. For the purposes of this report, however, the values are expressed in United States Dollars (USD3).
An overall analysis of the procurement performance in 2012 is provided in Chapter 2, followed by major measures taken by ORPF during the year for improving procurement governance and capacity in chapter 3. Chapter 4, 5 and 6 further address the four general considerations of economy and efficiency, transparency, equal opportunity and development of local industry in the Bank’s procurement policy. Chapter 7 provides a preliminary assessment on International Competitive Bidding (ICB) vs. National Competitive Bidding (NCB) and offers a set of inputs that are proposed to be used for further studies on the Use of Country Procurement Systems (UCPS). The Report concludes with some practical recommendations for future actions.
General Considerations, Procedures and Criteria for Contract Award
The Agreements Establishing the African Development Bank, the African Development Fund and the Nigeria Trust Fund give the Bank a fiduciary responsibility to ensure that the proceeds of loans are used only for specified purposes, with due attention to economy and efficiency and without regard to political and other non-economic influences and considerations. To carry out this responsibility, the Bank oversees Borrowers’ use of Bank funds to procure Goods, Works and services. The Bank’s ability to raise financial resources from its member countries and in the capital markets also depends in part on the impartial administration of this procurement. Accordingly, the Bank has established rules for the use of its loans and for supervising the execution of projects it helps to finance.
Four considerations guide these rules: (a) the need for economy and efficiency in project implementation including the procurement of Goods, Works and services financed by the Bank, as mandated by the Articles; (b) the Bank’s interest in giving all eligible bidders the
3 The conversion rates of the ADB, ADF and NTF Unit of Account (UA) to US Dollar for various years
are as follows (Source: ADB Annual Reports from 2003 to 2012):
2003 1.48597 2006 1.50440 2009 1.56769 2012 1.53692
2004 1.55301 2007 1.58025 2010 1.54003 2005 1.42927 2008 1.54027 2011 1.53527

Annual Procurement Report for 2012
3 / 50
same information and equal opportunity to compete in providing Goods and Works financed by the Bank; (c) the Bank’s interest in encouraging the development of domestic and regional contracting, and manufacturing industries in the Borrower’s country; and (d) the importance of transparency in the procurement process. For the acquisition of Consulting Services, the need for high quality services is an important added consideration.
The policies, which are endorsed by the Bank’s Executive Board, are set out in the “Rules and Procedures for Procurement of Goods and Works” and “Rules and Procedures for the Use of Consultants”. These apply equally when procurement is carried out by the Borrowers, their agents or other intermediaries on behalf of the Borrower.
The Rules and Procedures emphasize that open competition is the basis for efficient public procurement. In most cases of procurement for Goods or Works, International Competitive Bidding (ICB), properly administered, and with the allowance for preferences for domestically or regionally manufactured Goods or for domestic or regional contractors for Works under prescribed conditions is the preferred method. Where ICB is not appropriate, other methods of procurement for Goods and Works such as Limited International Competitive Bidding (LIB), National Competitive Bidding (NCB) or Shopping may be used. For procurement of consulting services, the Quality and Cost Based-Selection (QCBS) is standard procedure for the majority of consultants’ recruitments unless other selection methods such as Quality Based Selection (QBS), Fixed Budget Selection (FBS), Least-Cost-Selection (LCS), Selection Based on Consultant Qualification (CQS) or Single Source Selection (SSS) are justified. While QBS and CQS consider technical merit as the sole factor in selecting consultants, all other selection methods take cost into account at various degrees for the decision of contract award.
The African Development Fund (ADF) permits firms and individuals from all countries to offer Goods, Works and Services for the projects it finances. However, the proceeds of any Financing undertaken in the operations of the African Development Bank (ADB) and the Nigeria Trust Fund (NTF) can be used for procurement only from bidders from the Bank’s member countries4.
4 It must be mentioned that apart from country of origin, there are other criteria establishing eligibility,
including those relating to conflict of interest.
Annual Procurement Report for 2012
4 / 50
ANALYSIS OF CONTRACT DATA 2.
2.1 Trend in Business Volume in the last decade
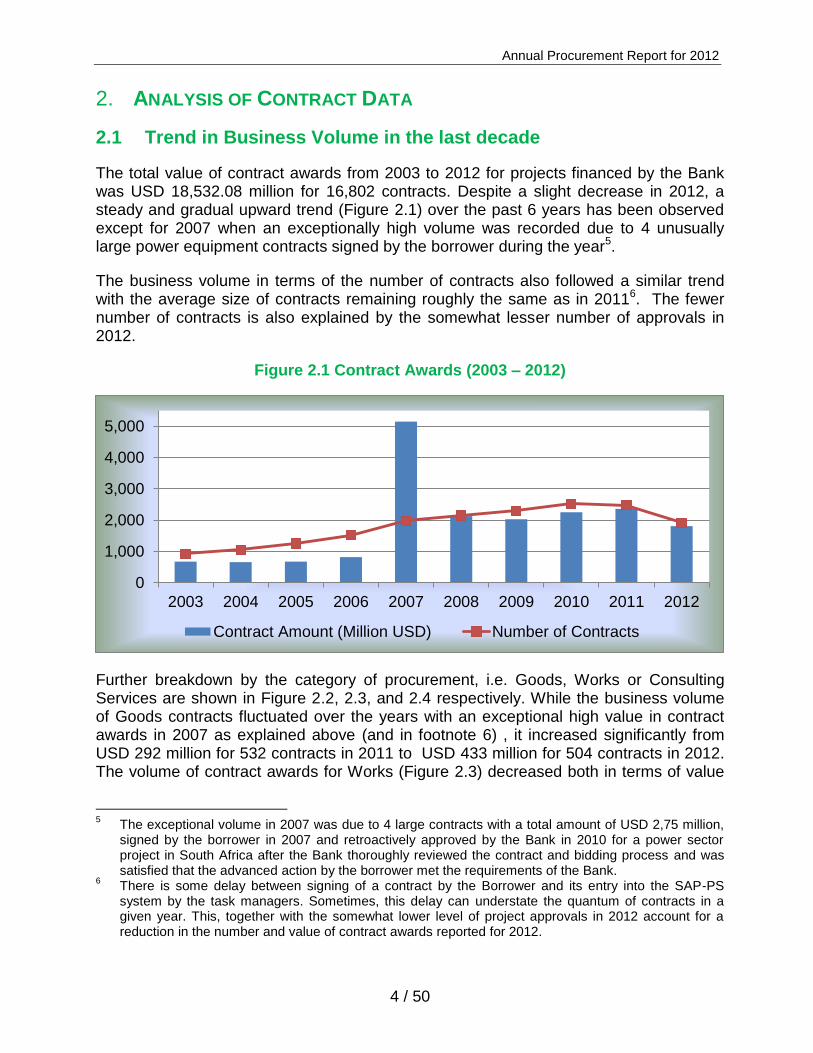
The total value of contract awards from 2003 to 2012 for projects financed by the Bank was USD 18,532.08 million for 16,802 contracts. Despite a slight decrease in 2012, a steady and gradual upward trend (Figure 2.1) over the past 6 years has been observed except for 2007 when an exceptionally high volume was recorded due to 4 unusually large power equipment contracts signed by the borrower during the year5.
The business volume in terms of the number of contracts also followed a similar trend with the average size of contracts remaining roughly the same as in 20116. The fewer number of contracts is also explained by the somewhat lesser number of approvals in 2012.
Figure 2.1 Contract Awards (2003 – 2012)
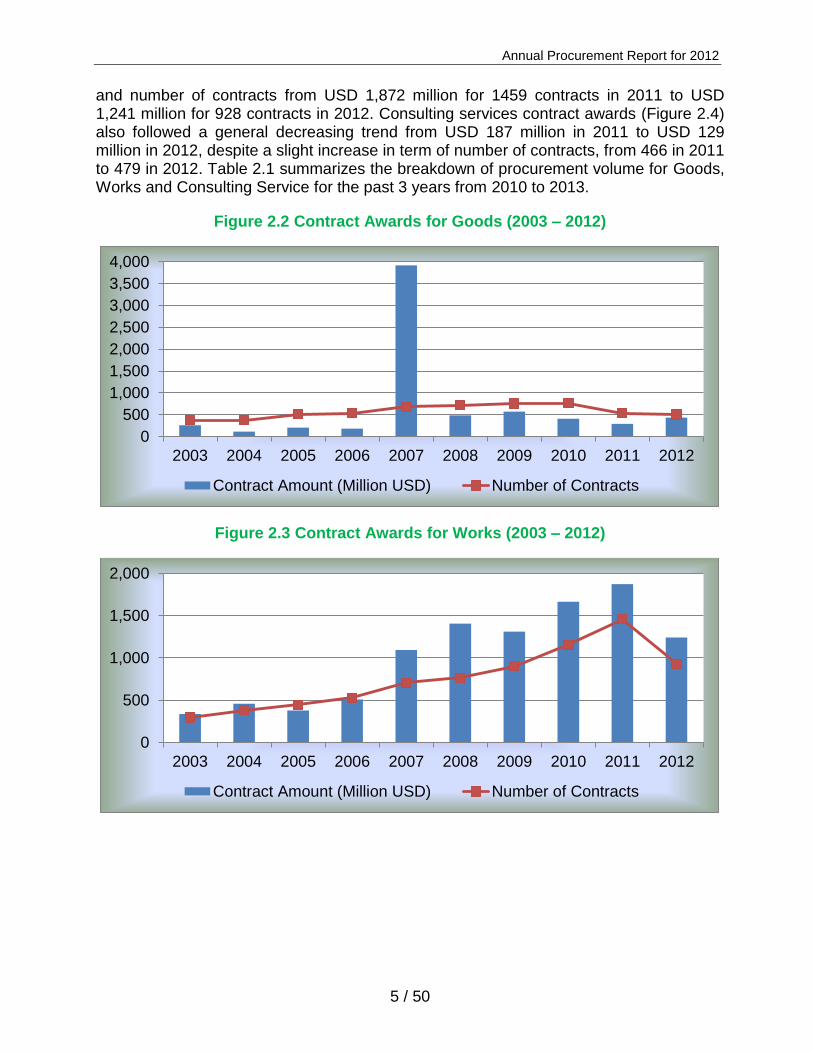
Further breakdown by the category of procurement, i.e. Goods, Works or Consulting Services are shown in Figure 2.2, 2.3, and 2.4 respectively. While the business volume of Goods contracts fluctuated over the years with an exceptional high value in contract awards in 2007 as explained above (and in footnote 6) , it increased significantly from USD 292 million for 532 contracts in 2011 to USD 433 million for 504 contracts in 2012. The volume of contract awards for Works (Figure 2.3) decreased both in terms of value
5 The exceptional volume in 2007 was due to 4 large contracts with a total amount of USD 2,75 million,
signed by the borrower in 2007 and retroactively approved by the Bank in 2010 for a power sector project in South Africa after the Bank thoroughly reviewed the contract and bidding process and was satisfied that the advanced action by the borrower met the requirements of the Bank.
6 There is some delay between signing of a contract by the Borrower and its entry into the SAP-PS
system by the task managers. Sometimes, this delay can understate the quantum of contracts in a given year. This, together with the somewhat lower level of project approvals in 2012 account for a reduction in the number and value of contract awards reported for 2012.
0
1,000
2,000
3,000
4,000
5,000
2003 2004 2005 2006 2007 2008 2009 2010 2011 2012
Contract Amount (Million USD) Number of Contracts
Annual Procurement Report for 2012
5 / 50
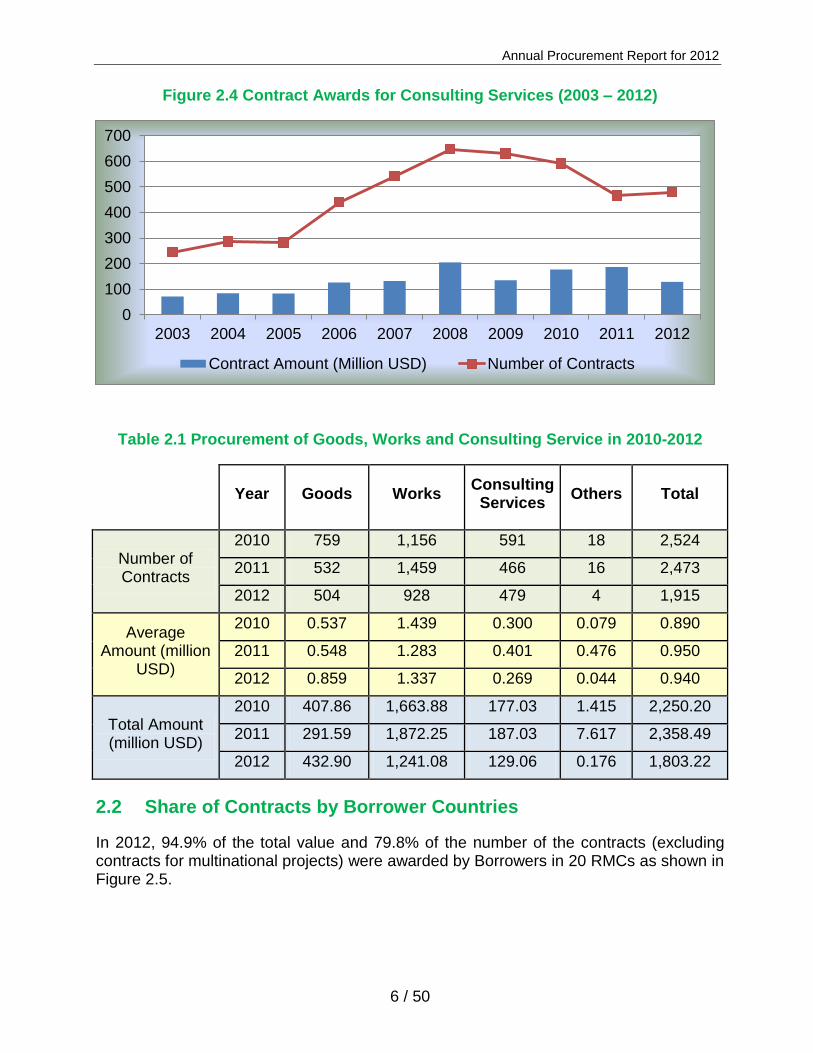
and number of contracts from USD 1,872 million for 1459 contracts in 2011 to USD 1,241 million for 928 contracts in 2012. Consulting services contract awards (Figure 2.4) also followed a general decreasing trend from USD 187 million in 2011 to USD 129 million in 2012, despite a slight increase in term of number of contracts, from 466 in 2011 to 479 in 2012. Table 2.1 summarizes the breakdown of procurement volume for Goods, Works and Consulting Service for the past 3 years from 2010 to 2013.
Figure 2.2 Contract Awards for Goods (2003 – 2012)
Figure 2.3 Contract Awards for Works (2003 – 2012)
0
500
1,000
1,500
2,000
2,500
3,000
3,500
4,000
2003 2004 2005 2006 2007 2008 2009 2010 2011 2012
Contract Amount (Million USD) Number of Contracts
0
500
1,000
1,500
2,000
2003 2004 2005 2006 2007 2008 2009 2010 2011 2012
Contract Amount (Million USD) Number of Contracts
Annual Procurement Report for 2012
6 / 50
Figure 2.4 Contract Awards for Consulting Services (2003 – 2012)
Table 2.1 Procurement of Goods, Works and Consulting Service in 2010-2012
Year Goods Works Consulting Services
Others Total
Number of Contracts
2010 759 1,156 591 18 2,524
2011 532 1,459 466 16 2,473
2012 504 928 479 4 1,915
Average Amount (million
USD)
2010 0.537 1.439 0.300 0.079 0.890
2011 0.548 1.283 0.401 0.476 0.950
2012 0.859 1.337 0.269 0.044 0.940
Total Amount (million USD)
2010 407.86 1,663.88 177.03 1.415 2,250.20
2011 291.59 1,872.25 187.03 7.617 2,358.49
2012 432.90 1,241.08 129.06 0.176 1,803.22
2.2 Share of Contracts by Borrower Countries
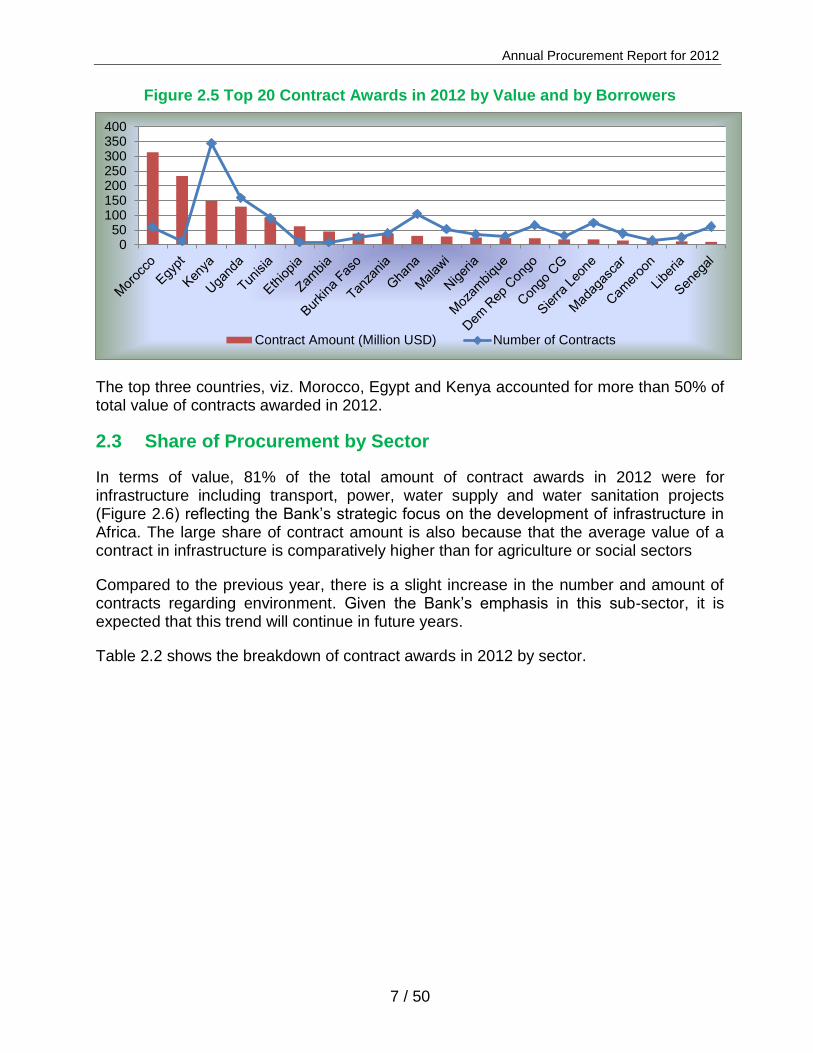
In 2012, 94.9% of the total value and 79.8% of the number of the contracts (excluding contracts for multinational projects) were awarded by Borrowers in 20 RMCs as shown in Figure 2.5.
0
100
200
300
400
500
600
700
2003 2004 2005 2006 2007 2008 2009 2010 2011 2012
Contract Amount (Million USD) Number of Contracts
Annual Procurement Report for 2012
7 / 50
Figure 2.5 Top 20 Contract Awards in 2012 by Value and by Borrowers
The top three countries, viz. Morocco, Egypt and Kenya accounted for more than 50% of total value of contracts awarded in 2012.
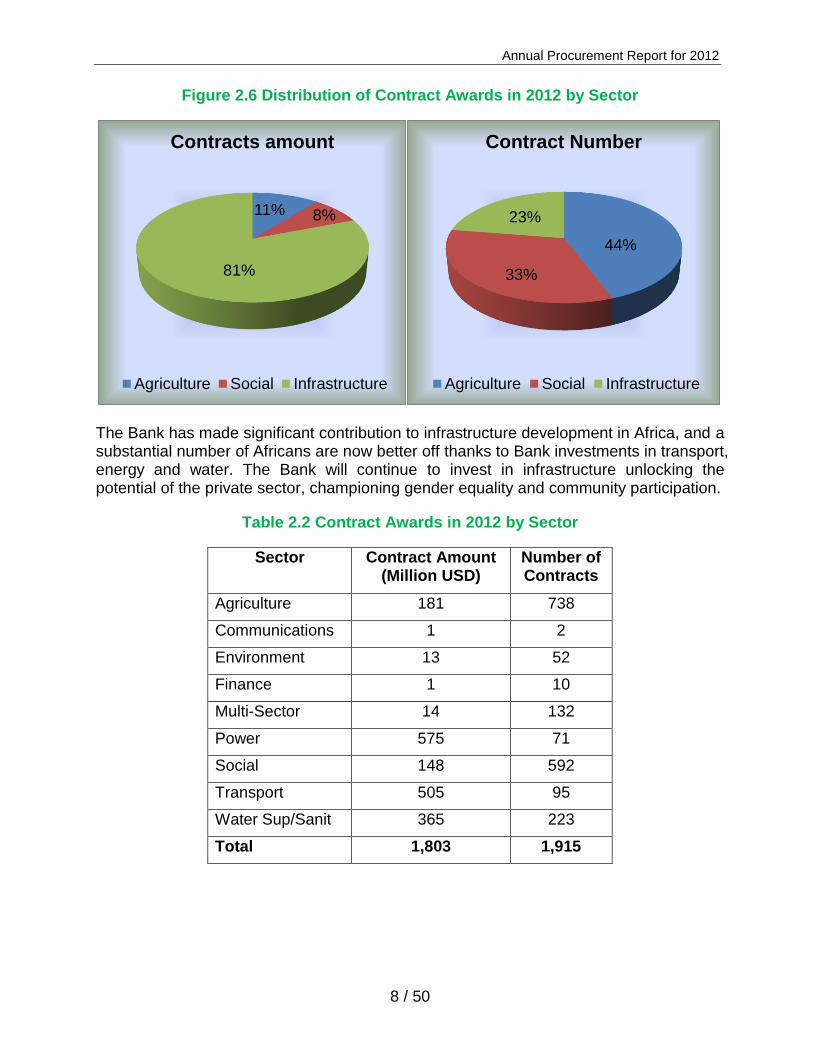
2.3 Share of Procurement by Sector
In terms of value, 81% of the total amount of contract awards in 2012 were for infrastructure including transport, power, water supply and water sanitation projects (Figure 2.6) reflecting the Bank’s strategic focus on the development of infrastructure in Africa. The large share of contract amount is also because that the average value of a contract in infrastructure is comparatively higher than for agriculture or social sectors
Compared to the previous year, there is a slight increase in the number and amount of contracts regarding environment. Given the Bank’s emphasis in this sub-sector, it is expected that this trend will continue in future years.
Table 2.2 shows the breakdown of contract awards in 2012 by sector.
050
100150200250300350400
Contract Amount (Million USD) Number of Contracts
Annual Procurement Report for 2012
8 / 50
Figure 2.6 Distribution of Contract Awards in 2012 by Sector
The Bank has made significant contribution to infrastructure development in Africa, and a substantial number of Africans are now better off thanks to Bank investments in transport, energy and water. The Bank will continue to invest in infrastructure unlocking the potential of the private sector, championing gender equality and community participation.
Table 2.2 Contract Awards in 2012 by Sector
Sector Contract Amount (Million USD)
Number of Contracts
Agriculture 181 738
Communications 1 2
Environment 13 52
Finance 1 10
Multi-Sector 14 132
Power 575 71
Social 148 592
Transport 505 95
Water Sup/Sanit 365 223
Total 1,803 1,915
11% 8%
81%
Contracts amount
Agriculture Social Infrastructure
44%
33%
23%
Contract Number
Agriculture Social Infrastructure

Annual Procurement Report for 2012
9 / 50
2.4 Distribution of Contract Awards Between Regional and Non-Regional Firms
Recent years have seen African firms increase their share of contracts financed by the Bank. As mentioned earlier in the report, the data used does not include many small value contracts which are paid for using Special Accounts and which are almost entirely awarded to local firms or individuals. The total share of Regional firms in contract awards, therefore, could be higher than what is indicated in Figure 2.7 and Figure 2.8.
Figure 2.7 Share of Regional vs Non Regional7 Contract Awards in Value (%)
Figure 2.8 Share of Regional vs Non Regional8 Contract Awards in Number (%)
In 2012, USD 838.67 million (46.51%) of the contracts by value (and 88% by number) were awarded to African firms. It may be noted that these do not include smaller contracts paid for through Special Accounts, and that almost invariably go to local firms.
7 Excluding multinational projects.
8 Excluding multinational projects.
20%
30%
40%
50%
60%
70%
80%
2003 2004 2005 2006 2007 2008 2009 2010 2011 2012
Non-regional member countries Regional member countries
0%
20%
40%
60%
80%
100%
2003 2004 2005 2006 2007 2008 2009 2010 2011 2012
Non-regional member countries Regional member countries

Annual Procurement Report for 2012
10 / 50
The share of the African firms in Bank financed contracts would, therefore, exceed 50% by value. The other encouraging trend is that African firms are increasingly winning contracts in countries other than where they are domiciled, often against severe competition from foreign firms.
In 2012, regional contractors, suppliers and consultants for Civil Works, Goods and Consulting Services signed 1,744 (91.07%) contracts while only 165 contracts (8.62%) were awarded to the firms or individuals from Non-Regional countries. This reflects the increase of competitiveness of African firms and the success of the measures taken by the Bank (through more generic specifications and appropriate lot sizes) to promote local or regional firms.
A deeper analysis was undertaken to examine the changing share of Non-Regional firms in contracts financed by the African Development Bank. The increased share of contracts to Non-Regional firms from 2008 was driven largely by Chinese (and to some extent Indian) firms winning large contracts. Between 2008 and 2011, China accounted for a quarter of all contracts financed by the Bank. The share of contracts won by firms from the four largest Non-Regional countries between 2003 and 2012 is shown below.
Figure 2.9 Contracts won by firms from Non-Regional countries
0
500
1,000
1,500
2,000
2,500
3,000
3,500
2003 2004 2005 2006 2007 2008 2009 2010 2011 2012
To
tal C
on
tract
Am
ou
nt
(Mil
lio
n U
SD
)
Austria Belgium Brazil Canada
China Denmark Finland France
Germany India Italy Japan
Kuwait Netherlands Norway Portugal
Saudi Arabia South Korea Spain Sweden
Switzerland United Kingdom United States
Annual Procurement Report for 2012
11 / 50
Figure 2.10 Regional vs. Non-Regional9 Contract Awards in 2012
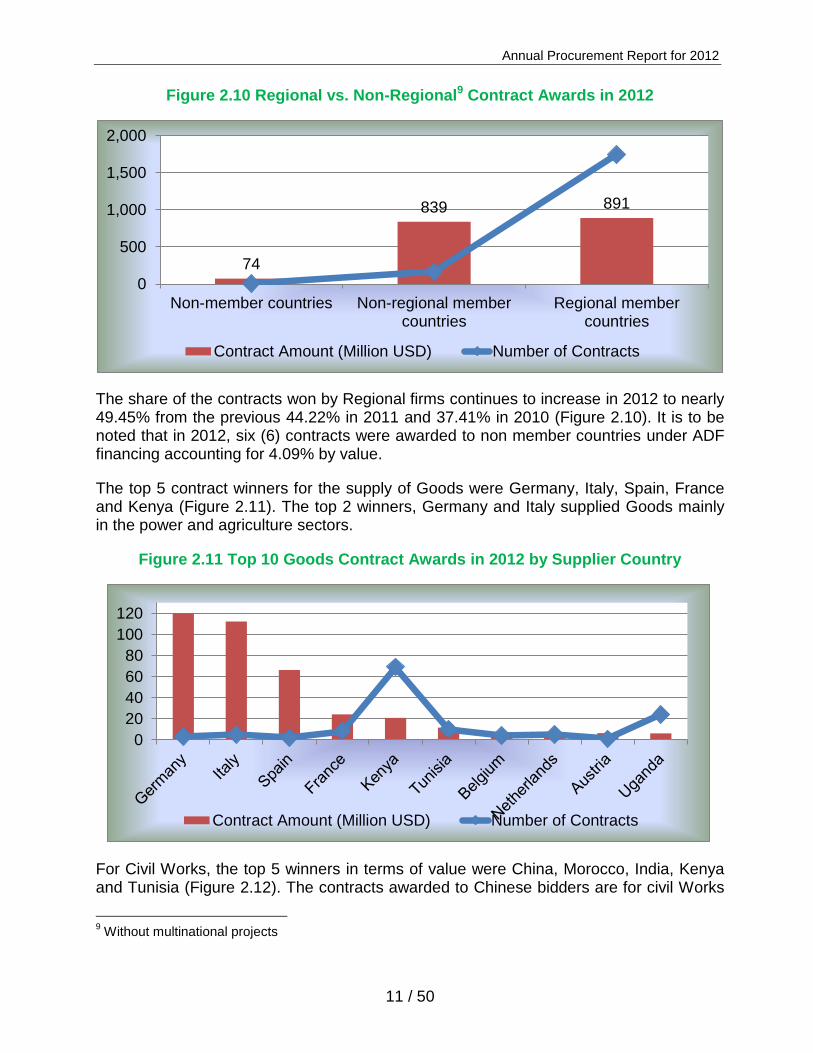
The share of the contracts won by Regional firms continues to increase in 2012 to nearly 49.45% from the previous 44.22% in 2011 and 37.41% in 2010 (Figure 2.10). It is to be noted that in 2012, six (6) contracts were awarded to non member countries under ADF financing accounting for 4.09% by value.
The top 5 contract winners for the supply of Goods were Germany, Italy, Spain, France and Kenya (Figure 2.11). The top 2 winners, Germany and Italy supplied Goods mainly in the power and agriculture sectors.
Figure 2.11 Top 10 Goods Contract Awards in 2012 by Supplier Country
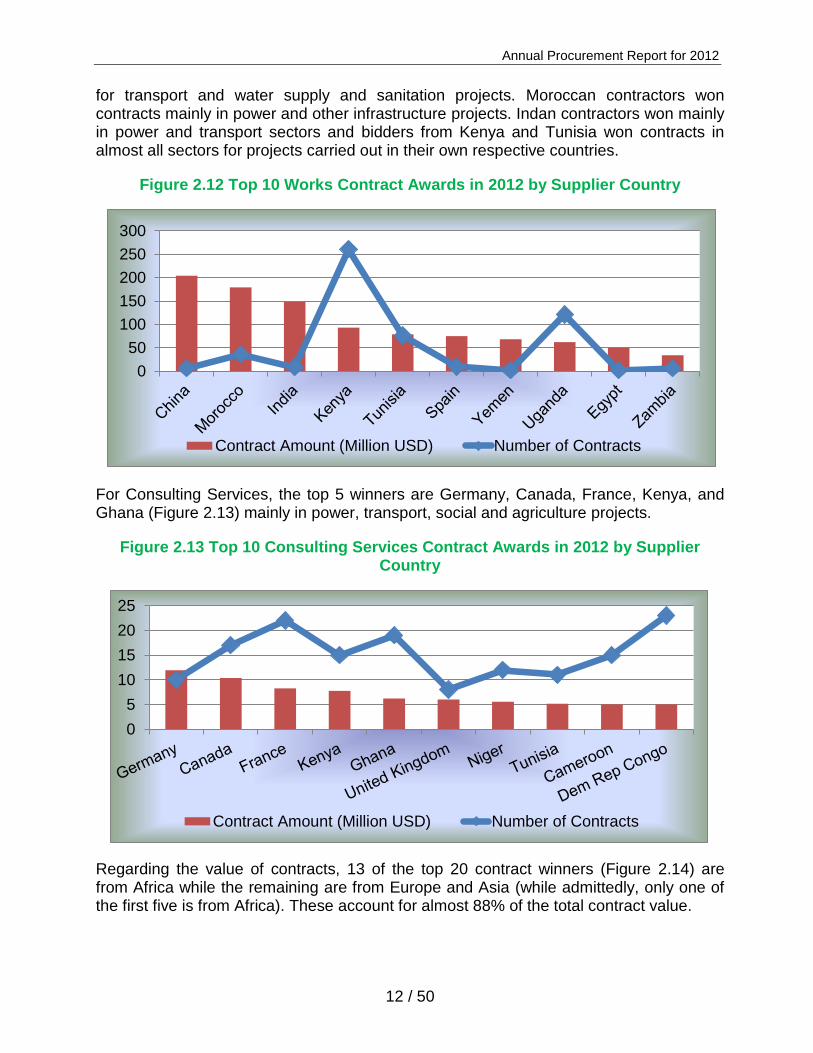
For Civil Works, the top 5 winners in terms of value were China, Morocco, India, Kenya and Tunisia (Figure 2.12). The contracts awarded to Chinese bidders are for civil Works
9 Without multinational projects
74
839 891
0
500
1,000
1,500
2,000
Non-member countries Non-regional membercountries
Regional membercountries
Contract Amount (Million USD) Number of Contracts
0
20
40
60
80
100
120
Contract Amount (Million USD) Number of Contracts
Annual Procurement Report for 2012
12 / 50
for transport and water supply and sanitation projects. Moroccan contractors won contracts mainly in power and other infrastructure projects. Indan contractors won mainly in power and transport sectors and bidders from Kenya and Tunisia won contracts in almost all sectors for projects carried out in their own respective countries.
Figure 2.12 Top 10 Works Contract Awards in 2012 by Supplier Country
For Consulting Services, the top 5 winners are Germany, Canada, France, Kenya, and Ghana (Figure 2.13) mainly in power, transport, social and agriculture projects.
Figure 2.13 Top 10 Consulting Services Contract Awards in 2012 by Supplier Country
Regarding the value of contracts, 13 of the top 20 contract winners (Figure 2.14) are from Africa while the remaining are from Europe and Asia (while admittedly, only one of the first five is from Africa). These account for almost 88% of the total contract value.
0
50
100
150
200
250
300
Contract Amount (Million USD) Number of Contracts
0
5
10
15
20
25
Contract Amount (Million USD) Number of Contracts

Annual Procurement Report for 2012
13 / 50
Figure 2.14 Contract Awards by Supplier Country in 2012 - Top 20 by Value (Million USD)
In terms of number of contracts awarded, the top 15 countries were all from Africa (Figure 2.15). Only one Non-Regional country (France) figures in the top twenty countries based on number of contracts. This shows that African firms are increasingly winning small and medium sized contracts. As most of these are awarded to SMEs, they have a significant effect of increasing job creation and inclusive growth.
Figure 2.15 2012 Contract Awards by Supplier Country -Top 20 by Number
0
50
100
150
200
250
Contract Amount (Million USD)
0
50
100
150
200
250
300
350
400
Number of Contracts
Annual Procurement Report for 2012
14 / 50
The largest single contract awarded in 2012 was valued at USD 130 million to a Chinese firm for Works in a transport project for a multinational project in East Africa. The largest Goods contract awarded in 2012 was valued at USD 108.762 million to an Italian firm for a power project in Egypt. The largest Consulting Services contract was won by a consulting firm from Niger for USD 4.409 million for a social project in Equitorial Guinea.
The largest contract amount awarded to an Regional firm was USD 48 million, won by an Egyptian contractor for Works under a regional transport project in East Africa.
2.5 Distribution of Contracts Across Categories of Expenditure (Goods, Works, Consulting Services)
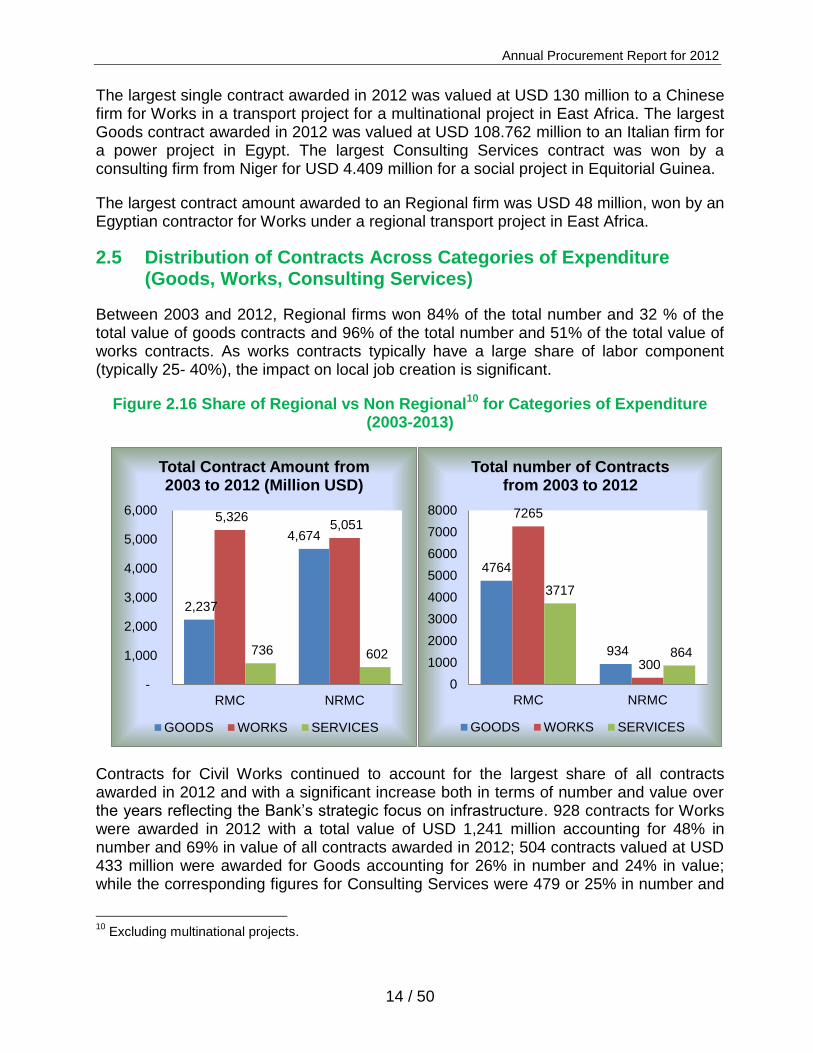
Between 2003 and 2012, Regional firms won 84% of the total number and 32 % of the total value of goods contracts and 96% of the total number and 51% of the total value of works contracts. As works contracts typically have a large share of labor component (typically 25- 40%), the impact on local job creation is significant.
Figure 2.16 Share of Regional vs Non Regional10 for Categories of Expenditure (2003-2013)
Contracts for Civil Works continued to account for the largest share of all contracts awarded in 2012 and with a significant increase both in terms of number and value over the years reflecting the Bank’s strategic focus on infrastructure. 928 contracts for Works were awarded in 2012 with a total value of USD 1,241 million accounting for 48% in number and 69% in value of all contracts awarded in 2012; 504 contracts valued at USD 433 million were awarded for Goods accounting for 26% in number and 24% in value; while the corresponding figures for Consulting Services were 479 or 25% in number and
10
Excluding multinational projects.
2,237
4,674
5,326 5,051
736 602
-
1,000
2,000
3,000
4,000
5,000
6,000
RMC NRMC
Total Contract Amount from 2003 to 2012 (Million USD)
GOODS WORKS SERVICES
4764
934
7265
300
3717
864
0
1000
2000
3000
4000
5000
6000
7000
8000
RMC NRMC
Total number of Contracts from 2003 to 2012
GOODS WORKS SERVICES

Annual Procurement Report for 2012
15 / 50
USD 129 million or 7% in value (Figure 2.17).
Figure 2.17 Contract Awards by Expenditure Category in 2012
2.6 Contract Amendments
Amendments are most common in Works and Consultancy contracts and usually depend on the length and the complexity. Contract Amendments take place due to a large number of factors including the accuracy of cost estimate, adequacy of the specifications, quality of the project design and supervision and other unexpected factors during contract execution..
A total of 169 amendments of contracts signed in 2012 were approved for a total value of USD 1.142 million (Table 2.3).
Table 2.3 Contract Amendments in 2012
Expenditure Category
Number of Amendments
Number of Contracts
% Amendments in Number
Amendment amount (million USD)
Amended Contracts initial amount (million USD)
% Amendments in Value
GOODS 22 504 4.37% 0.279 6.769 4.12%
SERVICES 31 928 3.34% 0.216 5.594 3.86%
WORKS 116 479 24.22% 0.647 113.011 0.57%
Total 169 1911 8.84% 1.142 125.373 0.91%
As indicated in Table 2.4, nearly 74% of the amendments are within 20% of the original contract value. However, this table only presents the contract amendments done in 2012 and do not cover all contract amendments during the entire life of the contracts awarded during or before 2012. A separate comprehensive study will be conducted in 2014 on this issue.
24.01%
68.83%
7.16%
26.32%
48.46%
25.01%
0%
10%
20%
30%
40%
50%
60%
70%
80%
Goods Works Consulting Services
Contract Amount (Million USD) Number of Contracts
Annual Procurement Report for 2012
16 / 50
Table 2.4 2012 Contract Amendments (as Percentage of the Original)
Amendments as % of Original Value of
Contracts
Number of Amendments
% Amendments
in Number
Amendment amount (million USD)
Share of Total Value
of Amendments
0-10% 67 39.64% 0.718 5.81%
10%-20% 59 34.91% 8.418 68.14%
20%-30% 11 6.51% 0.764 6.18%
30%-40% 7 4.14% 0.276 2.24%
40%-50% 7 4.14% 0.304 2.46%
50%-60% 3 1.78% 0.732 5.92%
60%-70% 3 1.78% 0.234 1.89%
70%-80% 0 0.00% 0.000 0.00%
80%-90% 2 1.18% 0.540 4.37%
90%-100% 10 5.92% 0.369 2.98%
Grand Total 169 100.00% 12.354 100.00%
2.7 Disbursement
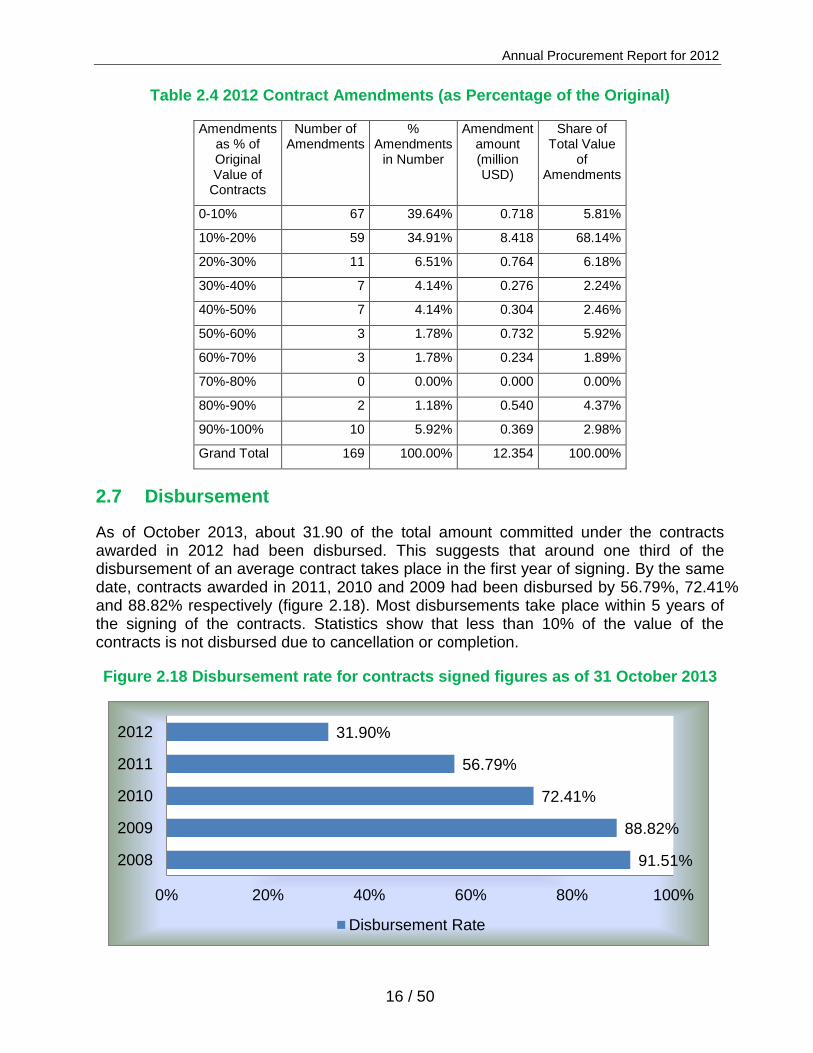
As of October 2013, about 31.90 of the total amount committed under the contracts awarded in 2012 had been disbursed. This suggests that around one third of the disbursement of an average contract takes place in the first year of signing. By the same date, contracts awarded in 2011, 2010 and 2009 had been disbursed by 56.79%, 72.41% and 88.82% respectively (figure 2.18). Most disbursements take place within 5 years of the signing of the contracts. Statistics show that less than 10% of the value of the contracts is not disbursed due to cancellation or completion.
Figure 2.18 Disbursement rate for contracts signed figures as of 31 October 2013
91.51%
88.82%
72.41%
56.79%
31.90%
0% 20% 40% 60% 80% 100%
2008
2009
2010
2011
2012
Disbursement Rate

Annual Procurement Report for 2012
17 / 50
IMPROVING PROCUREMENT GOVERNANCE AND CAPACITY 3.
The Procurement and Fiduciary Services Department continued its active participation in MDBs meetings in order to harmonize procurement policy and Standard Bidding Documents. In addition, the department took a series of initiatives to streamline its procurement and Financial Management functions and to improve service efficiency and quality to its clients. Some of these are given below:
3.1 Implementation of the Cross-Debarment Agreement
The Boards of Directors of the African Development Bank Group, on 05 July 2012 approved a proposal of policies designed to further strengthen the institution’s anti-corruption agenda through application of the International Finance Institutions (IFIs)’s cross debarment provisions. The proposal covering the implementation of a sanctions process within the ADB Group includes the establishment of (i) a Sanctions Office with a Sanctions Commissioner, an Alternate Sanctions Commissioner, and a Secretary; (ii) a Sanctions Appeal Board of three substantive members, three alternate members and a Secretary; (iii) terms of reference for the Sanctions and Appeal Boards; and (iv) expansion of the range of sanctions to include reprimand, conditional non-debarment, debarment, restitution and remedy. This approval empowers the Bank to execute the Agreement for Mutual Enforcement of Debarment Decisions signed by the IFIs on 9 April 2010 in as much as the firms and individuals sanctioned by these Institutions are concerned. The agreement establishes a framework within which entities or persons found to have engaged in wrongdoing in development projects financed by the IFIs may be sanctioned for the same misconduct by other participating development Banks in circumstances where such entity or person is debarred by one IFI for a period exceeding a year.
3.2 Review and Harmonization of Procurement Policy
Harmonization of procurement policy and procedures among the various MDBs has been going on for the last many years. In recent years, dedicated implementation of the MDBs harmonization agenda which is aimed at keeping in step with the overarching goal of the assurance of the highest standards of fiduciary oversight at the MDBs/IFIs level and continued reduction in transaction costs at the borrower level, has led to the situation in which, presently, the MDB’s procurement policy documents - called Guidelines or Rules depending on the MDB- are substantially harmonized. These Guidelines or Rules are supported by Manuals and Standard Bidding Documents (SBDs). In particular the bidding community have felt that the SBDs have introduced considerable improvements into the bidding process. In projects financed jointly with the World Bank, the two MDBs often agree on a common procurement arrangements and bidding documents. This has resulted in reduction of transaction costs to the Borrowers and brought efficiency in operations.
Annual Procurement Report for 2012
18 / 50
Much progress has been made in advancing good procurement practices, over the years through revisions of the Rules as new demands have emerged but now there is a certain perception of limited positive impact. The key to the effectiveness of the policy lies in their implementation. It is here that operational experience has highlighted delays in project execution from the use of these Rules. The general perception is that the complexity and prescriptiveness of the Rules, while reflecting the complexity of the procurement processes, have limited their positive impact especially in RMCs that lack capacity and sound institutional, legal and governance systems. It is in this light that, in order to continue to align its procurement policies and processes more effectively to the achievement of true development effectiveness in the rapidly evolving economic climate in its borrowing Regional Member Countries (RMCs), given its commitments, and also to continue to ensure modernization and simplification of its processes, that the Bank has decided to undertake a comprehensive and detailed review of its procurement policy, procedures and processes.
3.3 Procurement Reviews
The Bank’s Rules and Procedures in its Appendix 1 mandate the review by the Bank of Borrowers’ procurement decisions. For long term improvement and enhancement of the performance of procurement of Goods, Works and Consulting Services, the Bank undertakes Project Post Procurement Review (PPPR) missions in order to identify problem areas to (i) provide the necessary corrective measures to the procurement practices used by the project when it is still possible and, thus, contribute to the imrovement of their execution, and (ii) apply lessons learned in new operations. The PPPR includes a review of a representative sample of contracts for Goods, Works and Consulting Services financed under the financing agreements concluded with the borrowers.
As an effective discharge of its fiduciary oversight activities, the department conducted the following in 2012:
- Prior Review of large, complex or sensitive contracts; - Post Review of contracts during supervision; - Project Post Procurement Reviews: 9 projects reviewed during 2012.
3.4 Assessment of Electronic Government Procurement (E-GP) Implementation in Countries in Africa
The Bank has adopted a clear and concise step-by-step methodology to e-GP project formulation, design and implementation that is broadly consistent with the research, guiding principles and tools devised by the Multilateral Development Bank (MDB) working group on e-GP, of which the Bank is a member. It is foreseen that the Bank will need to gauge the advancement of E-Procurement in Africa and assess the practices of Regional Member Countries (RMCs) with a view to eventually providing assistance, including addressing issues of authenticity, security, access, and harmonization. A study was undertaken to establish the status of e-GP in countries in Africa and to understand the policies on e-GP of the Regional Economic Communities (RECs). This study is intended to assist in the development of the Bank’s overall E-Government Procurement
Annual Procurement Report for 2012
19 / 50
Policy.
3.5 Readiness Review (RR)
The Quality at Entry (QaE) of Bank operations is assured through comprehensive Readiness Reviews undertaken by ORQR. ORPF participates in the review in respect of Procurement and Financial Management Ratings. Other instruments or tools aimed at enhancing the quality and results-focus of operations throughout the operational cycle are being developed or revised as part of this agenda. The Readiness Review (RR) performs its functions primarily at two levels, viz. at the level of individual operations and at corporate level. At individual operations, the RR assesses and enhances the results focus and QaE of projects/programmes, by providing the Country Teams in charge of project processing with a structured set of comments, accompanied by ratings, on the various QaE dimensions examined. At the corporate level, the RR assesses and monitors progress in the QaE of Bank operations over time, based on a set of clearly defined quality criteria and standards.
3.6 Procurement Risks Assessment and Management (PROCRAM)
ORPF has developed a Procurement Risk Assessment and Management (PROCRAM) Tool to assist Bank staff to integrate the various stages and facets of procurement safeguards from project preparation to implementation, and to monitor procurement risks and contribute to capacity development. This tool aims to ensure that Bank-financed projects are executed with due attention to principles of economy and efficiency. Globally, it aims at ensuring that the use of the proceeds of any loan or grant is consistent with the policies, rules and procedures that govern the procurement of goods, works, and services required for projects, and is used for the purposes for which the financing was granted, while ensuring that the Borrower’s fiduciary risks are adequately mitigated to comply with the Bank’s fiduciary obligations. This integrated approach avoids the frequent disconnect between assessments conducted for the purpose of project preparation/appraisal and review mechanisms required to fulfil the Bank’s fiduciary responsibilities. This approach has some analogy with performance audits and risk profiling, and it intends to ensure effective implementation in compliance with Bank’s procedures and international best practices. PROCRAM encapsulates a series of tools seeking to identify, evaluate and monitor fiduciary risks prior to and during the project cycle. It includes a series of assessments and reviews which are combined together as follows: (i) procurement risks and capacity assessment; (ii) risk mitigation measures to minimize fiduciary risks through Bank’s and governments’ oversight; (iii) Post Procurement Reviews (PPRs) / Independent Procurement Reviews (IPRs) for ensuring that Bank-financed projects are implemented in compliance with the agreed provisions in the Financing Agreements and the Rules and Procedures; and (iv) monitoring in an dynamic manner the implementation of PPRs/IPRs’ recommendations with a view to reducing fiduciary risks, building procurement capacity and improving the effectiveness of projects’ implementation.

Annual Procurement Report for 2012
20 / 50
3.7 Assistance in Implementation of the 2012 Delegation of Authority Matrix (DAM)
The Bank’s new Delegation of Authority Matrix (DAM) approved in October 2012 has given significant procurement responsibilities to sector task managers. ORPF undertook several Training Workshops at the end of 2012 to empower Operations Staff to implement their responsibilities under the DAM.
3.8 Capacity Development Activities
The Bank engages with client countries for building capacity in public procurement at a number of levels. A total of 112 Bank staff were trained in 2012. Of these, 70% were Task managers and these trainings enhanced their skills in procurement rules and procedures. Apart from the launching workshops normally held at the time of start of a project (where procurement officers work with client staff on advising on the procurement issues in the project), the Bank is progressively using Fiduciary Clinics to resolve Procurement (and FM and disbursement) issues in countries. In these clinics, an assessment of the problems faced by various projects is carried out, and specific focused trainings imparted to resolve such issues. With increased decentralization, Bank staff is also increasingly working with PIU staff to advise on complex procurement cases. This has helped significantly resolve issues and the lead time of procurement in the portfolio is progressively coming down.
Building capacity in RMCs is a natural outcome of the work the Bank does to support the design and implementation of Bank-financed projects. However, these skills are associated with project implementation according to Bank policies and procedures and not on procurement and Financial Management capacity in the public governance sector of the country. Both are important. The Bank’s major delivery of assistance is through projects; therefore internal procurement and financial management technical capacity is needed to support and oversee project implementation and ensure that funds are expended for intended purposes. This is the primary fiduciary contribution of the procurement and Financial Management staff in the Bank. Increasingly, the Bank, like other IFIs, is moving towards building the governance capacity in countries in recognition that the country environment has a major impact on project success and overall development effectiveness. The increased focus on building country capacity demonstrates the shift in thinking from “ring-fenced projects” to projects that are fully embedded in national agencies and rely on acceptable government systems in place. Work on building RMC capacity has been underway for many years and the results of that work are now becoming evident, providing the basis for the shift by donors to greater reliance on country systems.
Annual Procurement Report for 2012
21 / 50
ECONOMY AND EFFICIENCY 4.
4.1 Time Efficiency
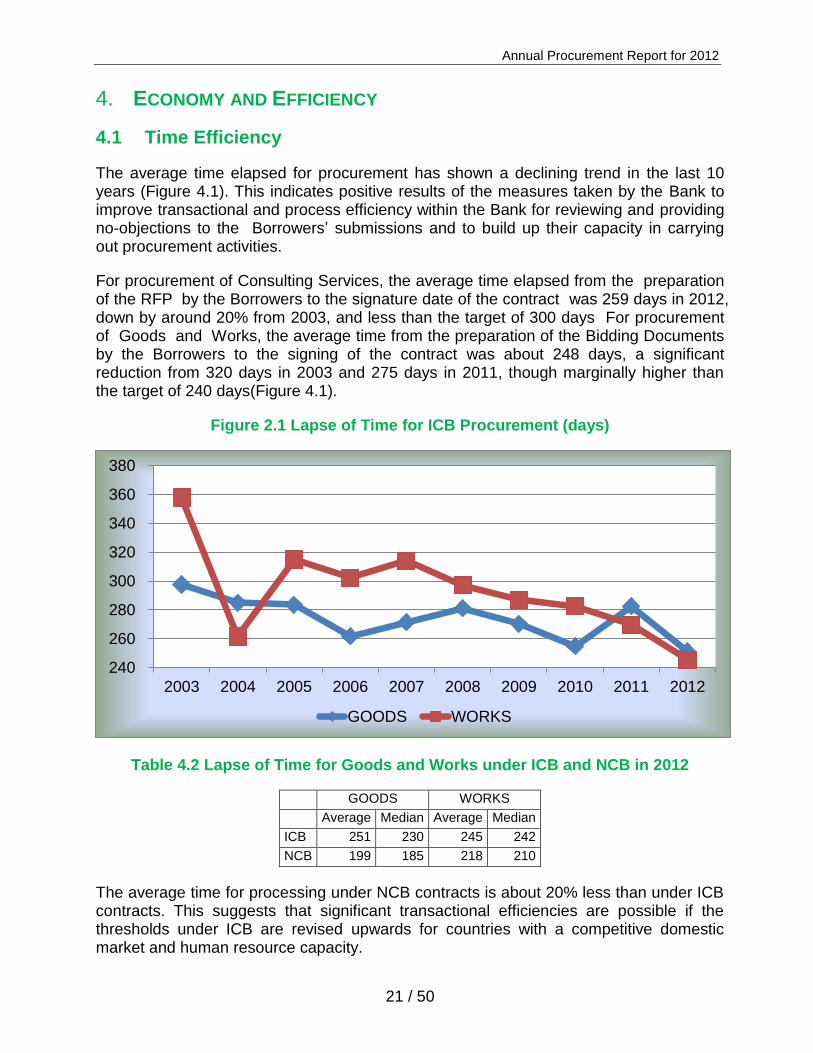
The average time elapsed for procurement has shown a declining trend in the last 10 years (Figure 4.1). This indicates positive results of the measures taken by the Bank to improve transactional and process efficiency within the Bank for reviewing and providing no-objections to the Borrowers’ submissions and to build up their capacity in carrying out procurement activities.
For procurement of Consulting Services, the average time elapsed from the preparation of the RFP by the Borrowers to the signature date of the contract was 259 days in 2012, down by around 20% from 2003, and less than the target of 300 days For procurement of Goods and Works, the average time from the preparation of the Bidding Documents by the Borrowers to the signing of the contract was about 248 days, a significant reduction from 320 days in 2003 and 275 days in 2011, though marginally higher than the target of 240 days(Figure 4.1).
Figure 2.1 Lapse of Time for ICB Procurement (days)
Table 4.2 Lapse of Time for Goods and Works under ICB and NCB in 2012
GOODS WORKS
Average Median Average Median
ICB 251 230 245 242
NCB 199 185 218 210
The average time for processing under NCB contracts is about 20% less than under ICB contracts. This suggests that significant transactional efficiencies are possible if the thresholds under ICB are revised upwards for countries with a competitive domestic market and human resource capacity.
240
260
280
300
320
340
360
380
2003 2004 2005 2006 2007 2008 2009 2010 2011 2012
GOODS WORKS
Annual Procurement Report for 2012
22 / 50
EQUAL OPPORTUNITY AND TRANSPARENCY 5.
5.1 Publication of Procurement Notices
To inform the private business and general public in advance about the business opportunities offered from the projects financed by the African Development Bank Group and to encourage and provide equal opportunities for competition, the Bank’s Rules and Procedures for Procurement of Goods and Works require the Borrower to publish a General Procurement Notice (GPN) after the Bank has approved the financing. For each case of ICB, a Specific Procurement Notice (SPN) is required to be published in the online edition of United Nations Development Business Journal (UNDB) as well as on the Bank’s web-site. For NCB Contracts, advertising may be limited to at least an electronic portal of free access where the Borrower advertises all government business opportunities or in its absence, in a national newspaper of wide circulation. Similar requirements are applied to procurement of Consulting Services through international competitive selection or nationally.
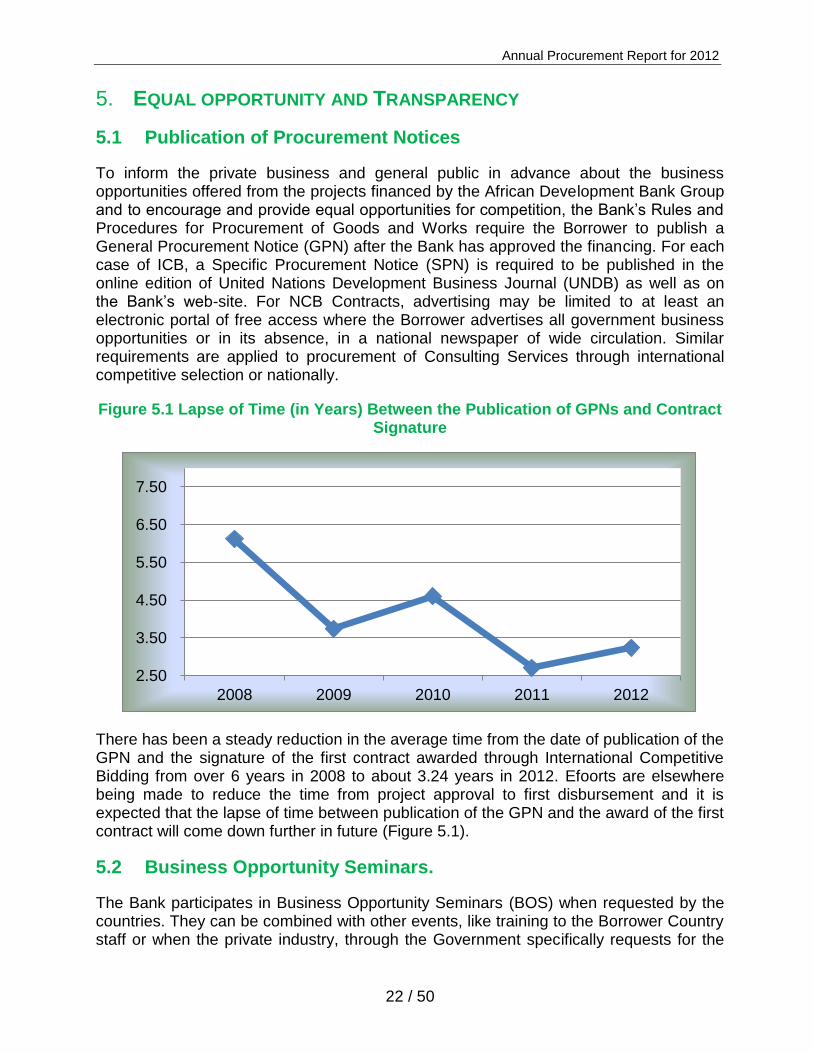
Figure 5.1 Lapse of Time (in Years) Between the Publication of GPNs and Contract Signature
There has been a steady reduction in the average time from the date of publication of the GPN and the signature of the first contract awarded through International Competitive Bidding from over 6 years in 2008 to about 3.24 years in 2012. Efoorts are elsewhere being made to reduce the time from project approval to first disbursement and it is expected that the lapse of time between publication of the GPN and the award of the first contract will come down further in future (Figure 5.1).
5.2 Business Opportunity Seminars.
The Bank participates in Business Opportunity Seminars (BOS) when requested by the countries. They can be combined with other events, like training to the Borrower Country staff or when the private industry, through the Government specifically requests for the
2.50
3.50
4.50
5.50
6.50
7.50
2008 2009 2010 2011 2012

Annual Procurement Report for 2012
23 / 50
same. In 2012, apart from over 10 BOS events, ORPF also participated in seminars organized by some Regional Economic Communities such as The Economic Community of West African States (UEMOA) and West African Economic and Monetary Union (WAEMU), as well as with African professional organizations such as the FIDIC 11 ’s regional networking Group of Africa Member Associations and Associate Members GAMA.
5.3 Use of Competitive Procedures
The Bank’s Rules and Procedures emphasize that open competition is the basis for efficient public procurement. Borrowers are required to select the most appropriate method for the specific procurement. In most cases, ICB is considered the most appropriate procurement method. NCB is also an open competitive method and used for procuring Goods or Works that, by their nature or scope, are unlikely to attract foreign competition. In 2012, Bank’s borrowers generally met this requirement.
For Goods, for contracts awarded in 2012, 99.6% by value and 96.8% by number were through competitive procurement. Of these, open competitive methods, viz. ICB and NCB accounted for 96.3% by value and 68.3% by number while shopping (comparing quotations for small purcases) were used for 3.2% by value and 28.6% by number. Non-competitive procurement was used only for 0.4% by value and 3.2% by number (Figure 5.2 and 5.3).
Figure 5.2 Distribution of Goods Contracts by Procurement Mode in 2012
For Works, in terms of value, nearly 100% of the USD 1,241 million awarded in 2012 was through competitive bidding procedures (ICB, NCB or shopping). Open competition accounted for 99.1% by value 96.2% by number while restricted competition was used for 0.7% by value and 1.8% by number. Direct procurement was used very rarely, in 1.94%
11
International Federation of Consulting Engineers.
DNP, 0.43%
ICB, 87.33%
SH, 3.24%
NCB, 9.00%
Competitive,
99.57%
By Value
DNP ICB SH NCB
DNP, 3.17%
ICB, 17.06%
SH, 28.57%
NCB, 51.19%
Competitive,
96.83%
By Number
DNP ICB SH NCB

Annual Procurement Report for 2012
24 / 50
of cases that were less tha 0.23% by value (Figures 5.4 and 5.5).
Figure 5.3 Distribution of Works Contracts by Procurement Mode in 2012
For Consulting Services, 75% of the total number were awarded through competitive selection methods amounting to 85% of the value (Figure 5.6 and 5.7).
Figure 5.4 Distribution of Consulting Services Contracts by Procurement Mode in 2012
DNP, 0.23%
ICB, 75.73%
SH, 0.65%
NCB, 23.40%
Competitive,
99.77%
By Value
DNP ICB SH NCB
DNP, 1.94%
ICB, 15.09%
SH, 1.83%
NCB, 81.14%
Competitive,
98.06%
By Number
DNP ICB SH NCB
25%
75%
By Number
SSS Competitive
15%
85%
By Value
SSS Competitive

Annual Procurement Report for 2012
25 / 50
5.4 Participation by Bidders
Contracts under Infrastructure received, on an average, 8.47 bids per tender, the highest among all sectors. Agriculture sector received an average of 7.86 bids, while the average for social sector was 6.43.
The median number of bids received is roughly the same for all sectors, but there is an increase compared to 2011 for all sectors. For example, the median number for Agriculture in 2011 was 4 bids. This could be on accont of greater interest in firms in bidding for Bank financed contracts or the result of more diligent data entry by task managers, efforts for which are being made in recent years..
Figure 5.5 Participation of Bidders by Sector in 2012 (Bids Received in Each Bidding)
5.5 Complaint Handling and Anticorruption
The processing time to handle complaints is between 1 to 6 months, with an average of 2.5 months. This confirms that the Bank has an effective oversight mechanism for handling complaints. A brief description of the process followed is provided in Annex 3. Cases where fraud and corruption is suspected are transferred to the Integrity and Anti-Corruption Department (IACD). In the coming years, further enhancements for an effective capture in the system and the follow-up of complaints are envisaged. In addition, some training will be programmed in order to ensure that operations staff within the Bank is made aware of the procedures for complaint handling of procurement complaints.
Bidders for contracts financed by the Bank may send their complaints to the Borrowers or directly to the Bank (the Sector Director for the project, with a copy to the Resident Representative / Regional Director and ORPF) if the complaint concerns an issue related to procurement procedures, or to the Integrity and Anti-Corruption Department (IACD) if the compliant concerns a possible case of corruption, fraud or other sanctionable practices. Complaints received by the Bank are normally communicated to the concerned Borrower for clarification and it is Borrower’s responsibility to address the
7.86
8.47
6.43
6
6
6
0.00 1.00 2.00 3.00 4.00 5.00 6.00 7.00 8.00 9.00
Agriculture
Infrastructure
Social
Mediane Average Number of bids received per Contracts
Annual Procurement Report for 2012
26 / 50
compliant directly with the concerned bidder. The Bank’s responsibility is to ensure that all complaints related to procurement issues are addressed by the Borrower in line with the Bank’s Rules and Procedures.
A good and effective complaint handling policy is essential to maintaining a transparent system of procurement and preventing corruption. It is the Bank’s policy to require that Borrowers (including beneficiaries of Bank Financing), bidders, suppliers, contractors and their agents (whether declared or not), sub-contractors, sub-consultants, service providers or suppliers, and any personnel thereof, observe the highest standard of ethics during the procurement and execution of Bank-financed contracts. In order to enhance good governance and transparency, the Bank has a Whistle-blowing and Complaints Handling Policy to provide an avenue for raising concerns related to prohibited practices and to protect whistleblowers from retaliation. Complaints may be filed through the Bank’s website or by email, fax or phone to IACD.
Below is a brief summary of the cases registered by IACD in 2012:
Radical change of bid price at bid evaluation
Allegation of bribes paid by a contractor to a consultant in order to manipulate the bidding process in the favor of the said contractor.
Allegation of collusion between implementation officials and contractors
Allegation of collusion between a contractor, project coordinator and members of Delivery of Works committee to falsify meeting minutes in order to circumvent penalties imposed on the said contractor.
Allegation into contract discrepancies and collusion between contractors in order to fix bid prices.
Allegation of fraud and corruption after a contractor who had previously been awarded a contract following a competitive bidding process, had the contract cancelled and bid process re-launched.
All these case were under investigation.

Annual Procurement Report for 2012
27 / 50
DEVELOPMENT OF DOMESTIC AND REGIONAL CONTRACTING AND 6.MANUFACTURING INDUSTRIES
6.1 Domestic and Regional Preferences
Encouragement the development of national and regional contracting, manufacturing and consulting industries in RMCs is one of the principles in the Procurement Policy of the Bank. Statistics show that, increasingly, with better design of procurement packages, African contractors, suppliers and consultants obtain significant business in Bank financed projects. While completed projects help in the economic and social improvement of the RMCs, it is evident that the project implementation activities themselves result in substantial job creation and use of African SMEs.
The following are some of the measures taken to promote local industries:
Preference: The Rules of the Bank provide, at the option of the Borrower, for preference margins for national (or regional) bidders for the procurement of Goods and Works in contracts bid through ICB. The Rules for recruitment of consultants also provide for short lists of consultants to include at least one firm from a Regional Member Country unless qualified firms from Regional Member Countries are not available. For small value consultancy assignments, it is possible to have the shortlist comprising entirely of national consultants. The evaluation criteria also have weightage given to participation of nationals in the team as also, in some cases, to the transfer of knowledge to the Borrower country.
A significant number of contracts are awarded through NCB or shopping. By the very nature of these contracts, these are normally awarded to national firms;
The Bank’s procurement rules require contractors, to as much as possible, to source labor from the local market.
For the transfer of technology and know-how to African firms, joint ventures between Regional and Non-Regional firms are encouraged.
Rough estimates indicate that the works contracts financed by the Bank help in creation of many hundred thousand jobs every year.
6.2 Use of African Contractors, Suppliers and Consultants
For the last 10 years, over 88% by number of contracts have been won by African firms or individuals. As most of them were of relatively of small value, these contracts represented about 45% by value. In addition to these, payments were effected for small value contracts through Revolving Funds managed by project EAs or PIUs. Such payments, almost always were made to African SMEs or individual service providers. This does not include assistance given to the countries through Budget Support or Policy Based loans, a significant amount of which is normally spent on procurement from local industries.

Annual Procurement Report for 2012
28 / 50
6.3 Job Creation Through Bank Projects
An attempt was made to determine the extent of jobs that are created through works contracts that are financed by the Bank. As has been mentioned, the significant majority of small and medium value works contracts are awarded to local African contractors, and such contracts are normally labor intensive. Also, Bank Standard Bidding Documents also stipulate that foreign contractors should use local personnel at least for unskilled activities. Based on the information of the contracts awarded between 2009 and 2011, we have estimated that the jobs in the construction industry through works contracts of the Bank have been on an average of about half a million per year. This does not include the jobs that have been created through supply or consulting contracts.
Annual Procurement Report for 2012
29 / 50
USE OF COUNTRY SYSTEMS 7.
7.1 Progress on the Use of Country Procurement Systems (UCPS)
In pursuit of implementing the Paris Declaration, the Bank’s Policy Paper on the Use of Country Systems (UCS policy) was approved by the Boards of Directors on July 2, 2008 12 . It was aimed at enhancing the use of country systems in Bank-financed operations, and it focused on (i) putting greater emphasis on projects and programmes supporting procurement reforms in RMCs; (ii) implementing the existing provisions of the Rules and Procedures for Procurement of Goods and Works (R&P) aimed at enhancing the use of country procurement procedures; and (iii) joining as observer the World Bank (WB) Use of Country Procurement Systems (UCPS) Piloting Programme 13 to draw lessons from it. Going forward, the Bank Group’s efforts in this area were anchored on three complementary pillars: (i) definition of a methodology and tools for assessing country systems against agreed standards, (ii) strengthening Regional Member Countries’ (RMCs’) systems to bring them up to the agreed standards, and (iii) strengthening Bank Group capacity to assess and promote UCS. Followign from this ORPF developed a UCPS Strategy in 2012, centred on the key principles of strengthening country procurement systems and selectivity, in addition to the guiding principles set by the UCS Policy Paper. These were intended to ensure that the programme will be implemented following a measured approach that will comply with the Bank’s standards of efficiency, economy, transparency and equal opportunity. The UCPS proposed a three –phased approache gradually progressing from; Phase I - assessment of country procurement procedures and documents and expanding their use; through Phase II - use of country procurement systems for non- ICB; to Phase III - use of country procurement systems for ICB procurement. The ORPF’s UCPS Strategy has not yet been presented to the Board of Directors for approval.
In pursuance of implementing Phase 1 – Use of Country NCB systems as mandated by the Rules and Procedures approved by the Boards in 200814, the Bank has finalized assessments of the NCB procedures of 48 RMCs for acceptability. The studies have undertaken an assessment of the legal, institutional and regulatory framework of public procurement in these countries and examined in detail the National Standard Bidding Documents (NSBDs). The results have indicated that in almost 75% of the countries, the National Bidding Procedures and Documents can be used (with minor changes) for most small and medium value contracts financed by the Bank. The results of these studies are being discussed with the countries and the Bank is progressively allowing the use of the procedures and documents of the RMCs found acceptable for NCB procurement in projects that it finances. An agreement was recently signed with the Government of Morocco for use of the Moroccan National Bidding Procedures and Documents for NCB
12
Bank Group Approach Towards Enhancing the Use of Country Systems, Operational Policies and Compliance Department (May, 2008)
13 World Bank’s Procurement Policies and Procedures: Policy Review – Initiating Discussion Paper.
Operations Policy and Country Services. March 29, 2012 14
Clause 3.3 on National Competitive Bidding.Rules and Procedures for Procurement of Goods and Works. Procurement and Fiduciary Services Department.may 2008 Edition Revised July 2012.
Annual Procurement Report for 2012
30 / 50
procurement with minor differences. It is expected that by Q1 2014, such agreements will be signed by about 12 more countries..
Table 7.1 Status report of the review the Main Assessment Reports (MAR) on Country Procurement NCB Procedures
Summary of the review of NCB reports
Total % A+B
Reports/ MARs reviewed 48 100
Rating scenario A 7 14.5 37
Rating scenario B 30 62.5
Rating scenario C 11 22.9
On hold 7 12.7
Scenario A: Utilization of country procedures and documents is accepted with only minor adjustments that are implemented through the loan agreement and applicable bidding documents.
Scenario B: Utilization of country procedures and documents is subject to implementation of an Action Plan for improvement and Bank-financed projects will address such deviations in the loan agreement and applicable bidding documents.
Scenario C: Bank procedures and documents will be applied under Bank-financed projects with a view towards future assessment and consideration.
7.2 Patterns of National Share in ICB for Goods and Works Contract Awards
A closer examination of the contract award details (Table 7.2) reveals that national bidders15 in 5 RMCs, namely Uganda, Kenya, Morocco, Tunisia and Malawi won in 2012 Works contracts through ICB with success rate ranging from 76% to 100%.
In value, the top 5 countries (Egypt, Morocco, Kenya, Uganda andTunisia) getting Works contracts through ICB represent 52% of the USD 1,317 million of contracts awarded to African firms (Table 7.3).
15
May include international companies registered in the RMC.

Annual Procurement Report for 2012
31 / 50
Table 7.2 Number of ICB Contract Awards in RMCs in 2012
Project Country Number of ICB
Contracts
ICB Contracts Awarded to National Bidders
ICB Contracts Awarded to International Bidders
Share of Goods
contracts awaraded
to national bidders
Share of Works
contracts awaraded
to national bidders Goods Works Total Goods Works Total
Uganda 31 6 19 25 3 3 6 24% 76%
Kenya 24 5 18 23 1 1 22% 78%
Morocco 23 1 11 12 6 5 11 8% 92%
Tunisia 19 3 16 19 0 16% 84%
Malawi 18 16 16 2 2 0% 100%
Tanzania 12 3 8 11 1 1 27% 73%
Burkina Faso 8 3 3 6 1 1 2 50% 50%
Nigeria 7 1 6 7 0 14% 86%
Guinea 7 4 4 3 3 100% 0%
Dem Rep Congo
6 2 2 4 4 100% 0%
Congo CG 6 3 3 3 3 0% 100%
Rwanda 5 1 1 4 4 100% 0%
Egypt 4 0 4 4 0% 0%
Zambia 4 3 3 1 1 0% 100%
Ethiopia 3 0 1 2 3 0% 0%
Guinea-Bissau 3 0 3 3 0% 0%
Madagascar 3 3 3 0 0% 100%
Niger 2 2 2 0 100% 0%
Lesotho 2 1 1 1 1 100% 0%
Benin 1 1 1 0 0% 100%
Mozambique 1 1 1 0 0% 100%
Centrafrique 1 0 1 1 0% 0%
Cameroon 1 0 1 1 0% 0%
Burundi 1 1 1 0 100% 0%
Senegal 1 1 1 0 100% 0%
Ghana 1 0 1 1 0% 0%
Sierra Leone 1 1 1 0 100% 0%
Multinational 31 0 14 17 31 0% 0%
Grand Total 226 35 108 143 51 32 83 24% 76%
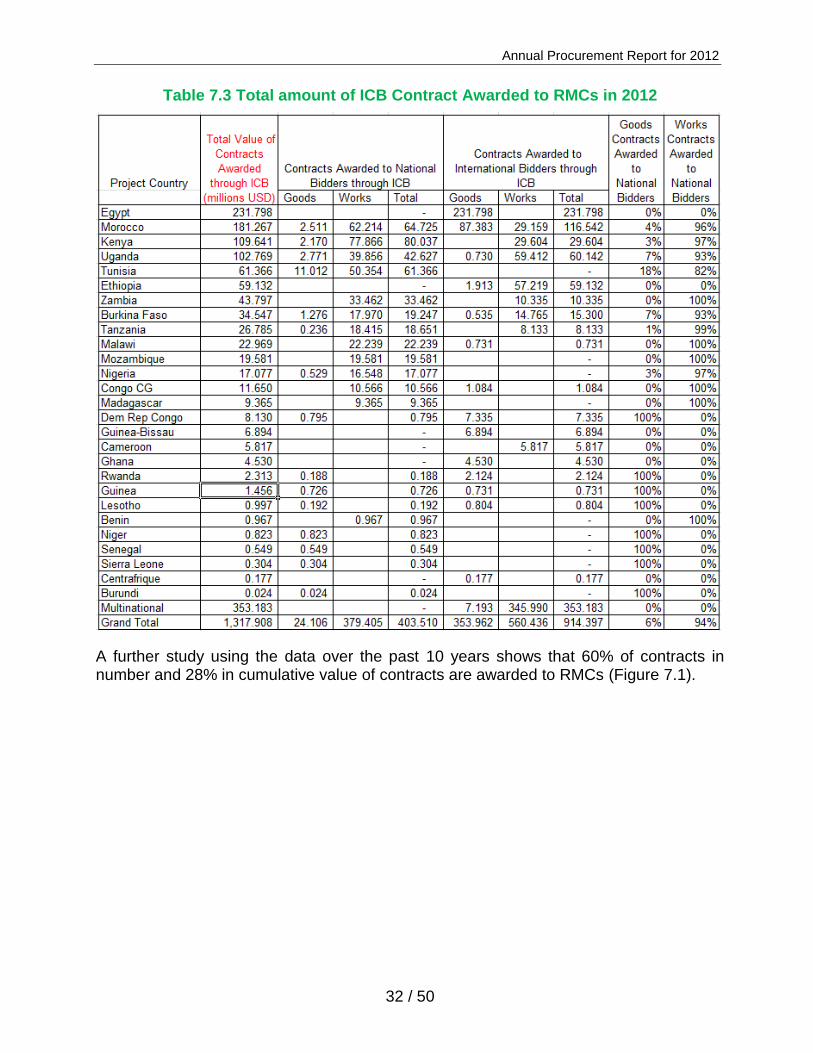
Annual Procurement Report for 2012
32 / 50
Table 7.3 Total amount of ICB Contract Awarded to RMCs in 2012
A further study using the data over the past 10 years shows that 60% of contracts in number and 28% in cumulative value of contracts are awarded to RMCs (Figure 7.1).

Annual Procurement Report for 2012
33 / 50
Figure 7.1 ICB Contract Awards in RMCs from 2003 to 2012
As ICB contracts, following the Bank’s Rules and Procedures do not impose any barriers to international bidders, the data presented above indicates strong evidence that the national bidders16 and local capacity for civil Works in these countries have a clear comparative advantage over foreign bidders and the situation is likely to continue as the national industry continues to grow. The data also suggests that raising NCB threshold in countries where national bidders have a long record of high success rate would help further enhance the country’s procurement system by using its national procedures without having adversary impact on the results of the competition. This, of course, may only be considered if the national procedures comply with the Bank’s requirement in the Rules and Procedures of fairness, predictability and non-discrimination to foreign firms.
7.3 Definition of new ICB Thresholds
New thresholds have been defined through an empirical approach by reviewing historical data, establishing past trends on contract awards, examining factors categorizing the Bank’s RMCs into three project implementation risk groups and attaching monetary thresholds. The impact of the application of the proposed thresholds on Borrower’s project implementation performance will revolve mostly around savings in procurement processing times and with the Bank’s current average investments of 93 projects per year, it is estimated that introduction of the new thresholds will lead to average time savings of 5.5 months per project.
The key factors that are taken into account in determining the monetary thresholds (Table 7.4) for NCB contracts and for post reviews, in the procurement of Goods and Works would include: (i) size of the country’s economy; (ii) industrial performance as a measure of socio-economic development; (iii) conditions, size and depth of the country’s
16
May include international companies registered in the RMC.
0%
10%
20%
30%
40%
50%
60%
70%
2003 2004 2005 2006 2007 2008 2009 2010 2011 2012
Share of Goods and Works Contracts Awarded to National Bidders
Contracts amount (millions USD) Number of Contracts
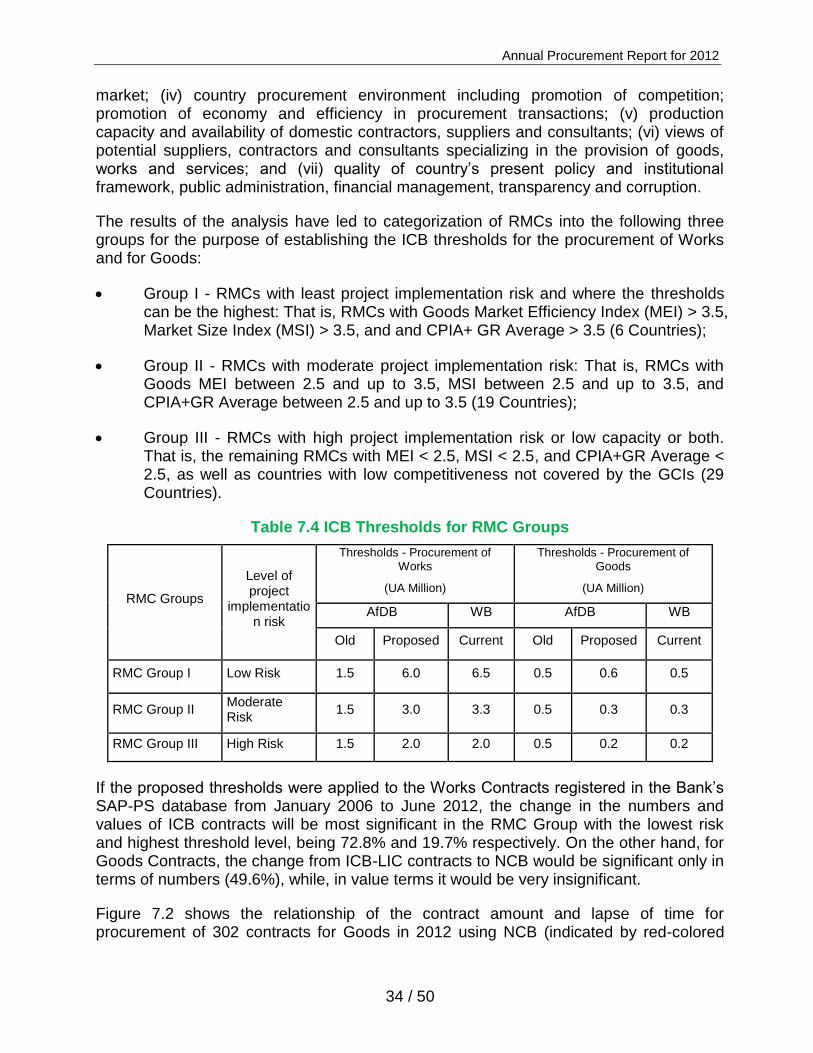
Annual Procurement Report for 2012
34 / 50
market; (iv) country procurement environment including promotion of competition; promotion of economy and efficiency in procurement transactions; (v) production capacity and availability of domestic contractors, suppliers and consultants; (vi) views of potential suppliers, contractors and consultants specializing in the provision of goods, works and services; and (vii) quality of country’s present policy and institutional framework, public administration, financial management, transparency and corruption.
The results of the analysis have led to categorization of RMCs into the following three groups for the purpose of establishing the ICB thresholds for the procurement of Works and for Goods:
Group I - RMCs with least project implementation risk and where the thresholds can be the highest: That is, RMCs with Goods Market Efficiency Index (MEI) > 3.5, Market Size Index (MSI) > 3.5, and and CPIA+ GR Average > 3.5 (6 Countries);
Group II - RMCs with moderate project implementation risk: That is, RMCs with Goods MEI between 2.5 and up to 3.5, MSI between 2.5 and up to 3.5, and CPIA+GR Average between 2.5 and up to 3.5 (19 Countries);
Group III - RMCs with high project implementation risk or low capacity or both. That is, the remaining RMCs with MEI < 2.5, MSI < 2.5, and CPIA+GR Average < 2.5, as well as countries with low competitiveness not covered by the GCIs (29 Countries).
Table 7.4 ICB Thresholds for RMC Groups
RMC Groups
Level of project
implementation risk
Thresholds - Procurement of Works
(UA Million)
Thresholds - Procurement of Goods
(UA Million)
AfDB WB AfDB WB
Old Proposed Current Old Proposed Current
RMC Group I Low Risk 1.5 6.0 6.5 0.5 0.6 0.5
RMC Group II Moderate Risk
1.5 3.0 3.3 0.5 0.3 0.3
RMC Group III High Risk 1.5 2.0 2.0 0.5 0.2 0.2
If the proposed thresholds were applied to the Works Contracts registered in the Bank’s SAP-PS database from January 2006 to June 2012, the change in the numbers and values of ICB contracts will be most significant in the RMC Group with the lowest risk and highest threshold level, being 72.8% and 19.7% respectively. On the other hand, for Goods Contracts, the change from ICB-LIC contracts to NCB would be significant only in terms of numbers (49.6%), while, in value terms it would be very insignificant.
Figure 7.2 shows the relationship of the contract amount and lapse of time for procurement of 302 contracts for Goods in 2012 using NCB (indicated by red-colored
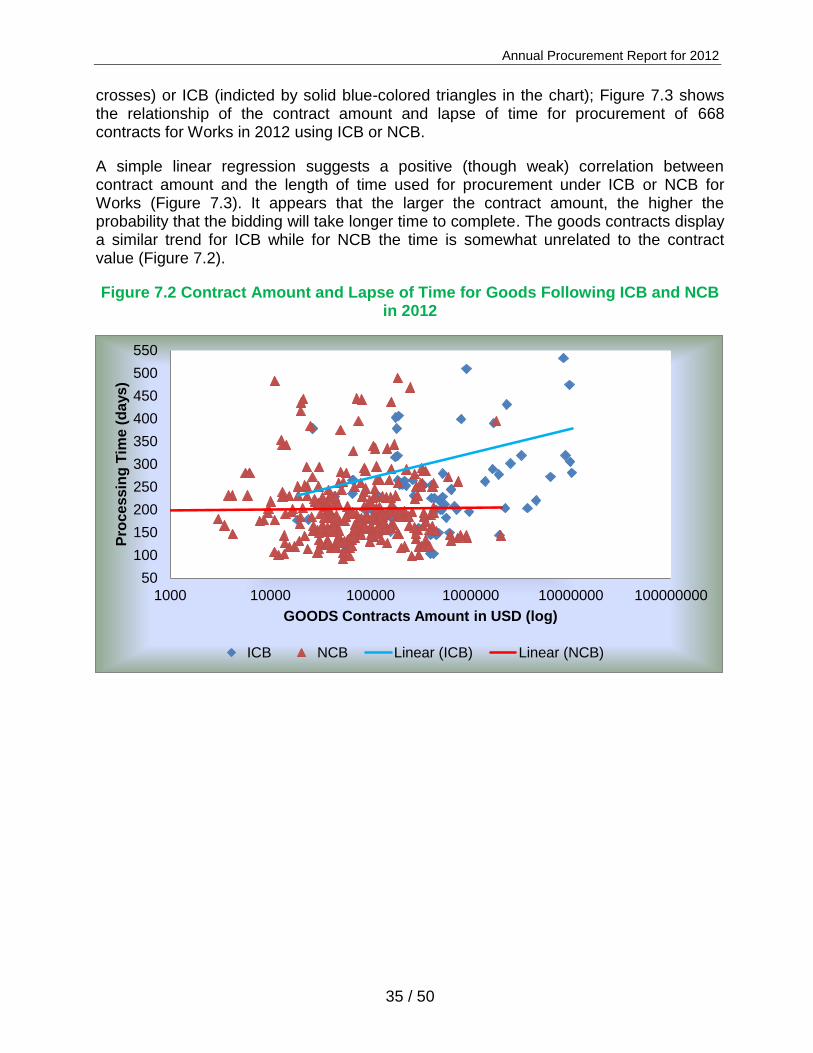
Annual Procurement Report for 2012
35 / 50
crosses) or ICB (indicted by solid blue-colored triangles in the chart); Figure 7.3 shows the relationship of the contract amount and lapse of time for procurement of 668 contracts for Works in 2012 using ICB or NCB.
A simple linear regression suggests a positive (though weak) correlation between contract amount and the length of time used for procurement under ICB or NCB for Works (Figure 7.3). It appears that the larger the contract amount, the higher the probability that the bidding will take longer time to complete. The goods contracts display a similar trend for ICB while for NCB the time is somewhat unrelated to the contract value (Figure 7.2).
Figure 7.2 Contract Amount and Lapse of Time for Goods Following ICB and NCB in 2012
50
100
150
200
250
300
350
400
450
500
550
1000 10000 100000 1000000 10000000 100000000
Pro
cessin
g T
ime (
days)
GOODS Contracts Amount in USD (log)
ICB NCB Linear (ICB) Linear (NCB)
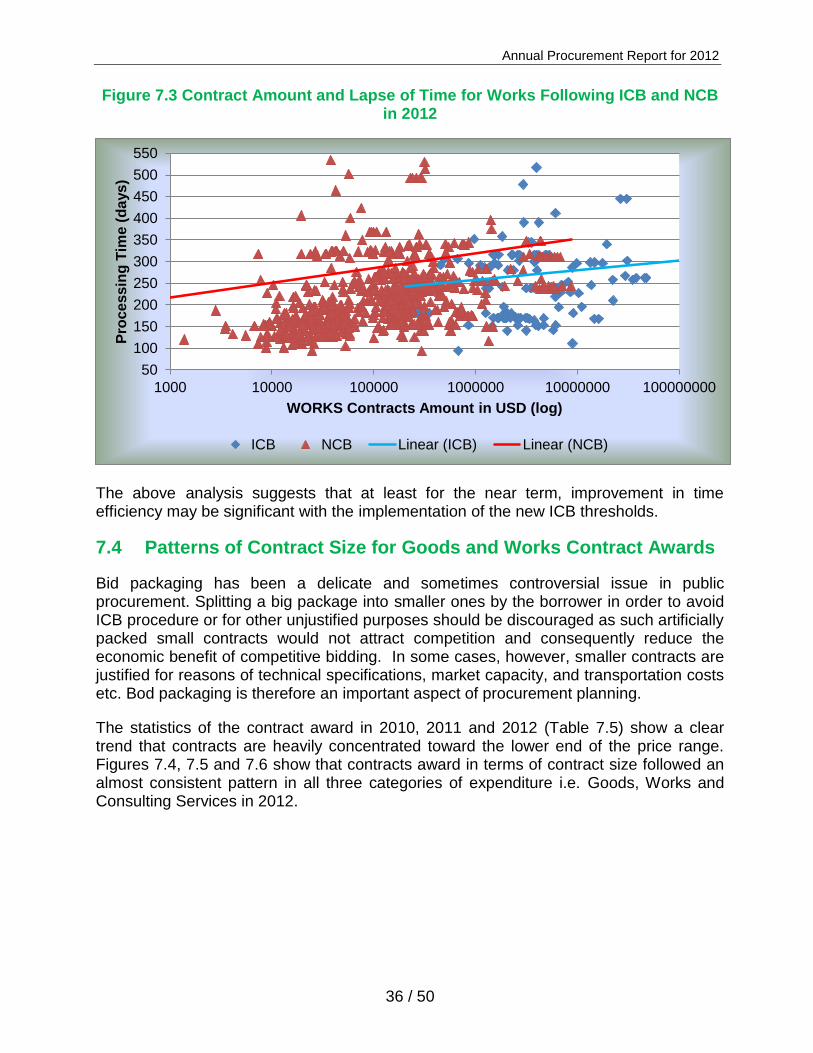
Annual Procurement Report for 2012
36 / 50
Figure 7.3 Contract Amount and Lapse of Time for Works Following ICB and NCB in 2012
The above analysis suggests that at least for the near term, improvement in time efficiency may be significant with the implementation of the new ICB thresholds.
7.4 Patterns of Contract Size for Goods and Works Contract Awards
Bid packaging has been a delicate and sometimes controversial issue in public procurement. Splitting a big package into smaller ones by the borrower in order to avoid ICB procedure or for other unjustified purposes should be discouraged as such artificially packed small contracts would not attract competition and consequently reduce the economic benefit of competitive bidding. In some cases, however, smaller contracts are justified for reasons of technical specifications, market capacity, and transportation costs etc. Bod packaging is therefore an important aspect of procurement planning.
The statistics of the contract award in 2010, 2011 and 2012 (Table 7.5) show a clear trend that contracts are heavily concentrated toward the lower end of the price range. Figures 7.4, 7.5 and 7.6 show that contracts award in terms of contract size followed an almost consistent pattern in all three categories of expenditure i.e. Goods, Works and Consulting Services in 2012.
50
100
150
200
250
300
350
400
450
500
550
1000 10000 100000 1000000 10000000 100000000
Pro
cessin
g T
ime (
days)
WORKS Contracts Amount in USD (log)
ICB NCB Linear (ICB) Linear (NCB)
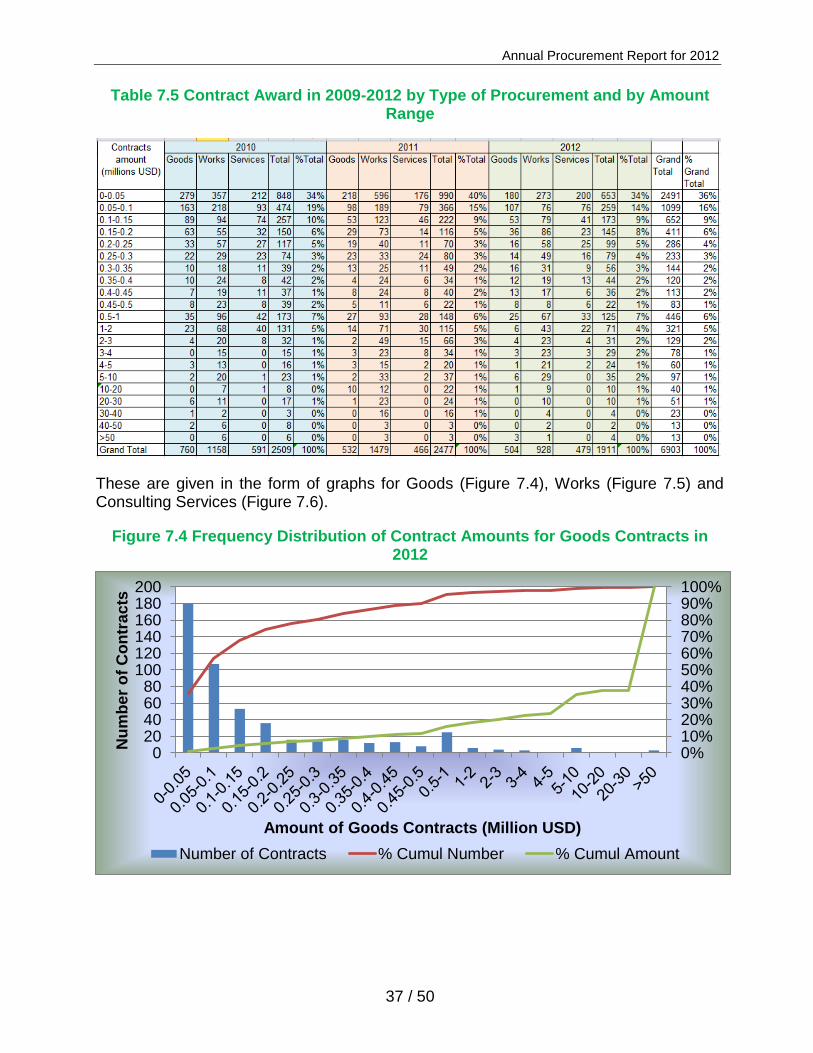
Annual Procurement Report for 2012
37 / 50
Table 7.5 Contract Award in 2009-2012 by Type of Procurement and by Amount Range
These are given in the form of graphs for Goods (Figure 7.4), Works (Figure 7.5) and Consulting Services (Figure 7.6).
Figure 7.4 Frequency Distribution of Contract Amounts for Goods Contracts in 2012
0%10%20%30%40%50%60%70%80%90%100%
020406080
100120140160180200
Nu
mb
er
of
Co
ntr
ac
ts
Amount of Goods Contracts (Million USD)
Number of Contracts % Cumul Number % Cumul Amount
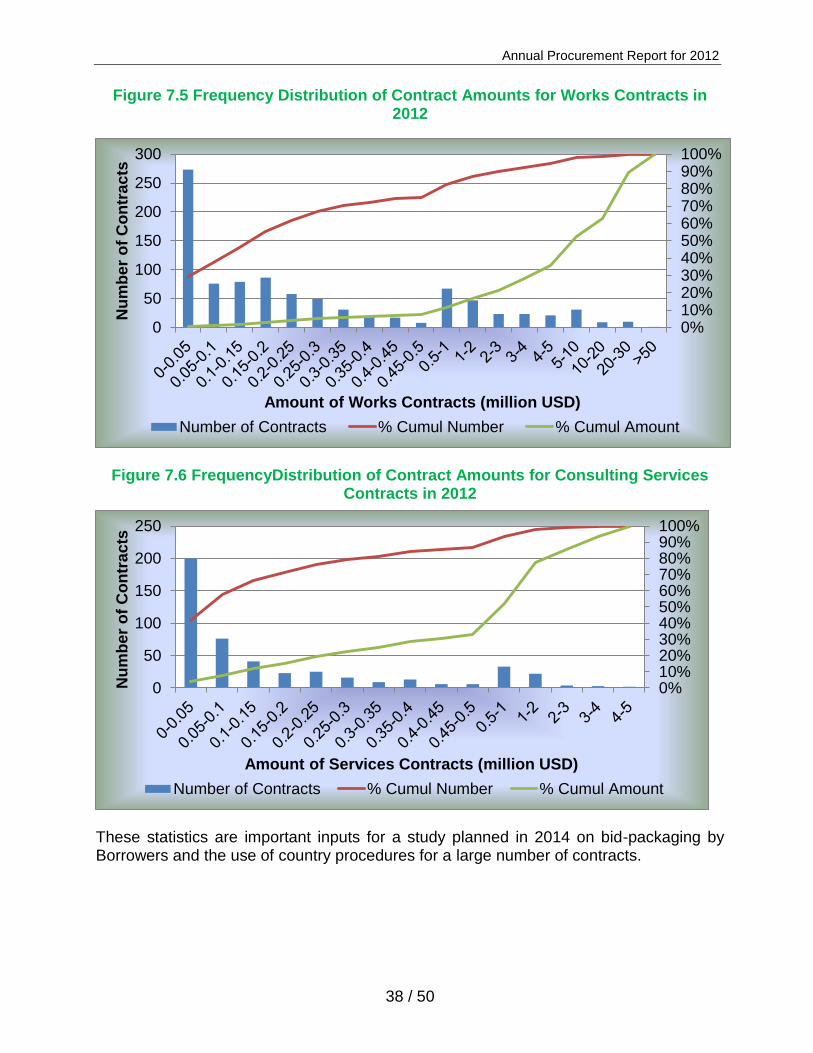
Annual Procurement Report for 2012
38 / 50
Figure 7.5 Frequency Distribution of Contract Amounts for Works Contracts in 2012
Figure 7.6 FrequencyDistribution of Contract Amounts for Consulting Services Contracts in 2012
These statistics are important inputs for a study planned in 2014 on bid-packaging by Borrowers and the use of country procedures for a large number of contracts.
0%10%20%30%40%50%60%70%80%90%100%
0
50
100
150
200
250
300
Nu
mb
er
of
Co
ntr
ac
ts
Amount of Works Contracts (million USD)
Number of Contracts % Cumul Number % Cumul Amount
0%10%20%30%40%50%60%70%80%90%100%
0
50
100
150
200
250
Nu
mb
er
of
Co
ntr
ac
ts
Amount of Services Contracts (million USD)
Number of Contracts % Cumul Number % Cumul Amount
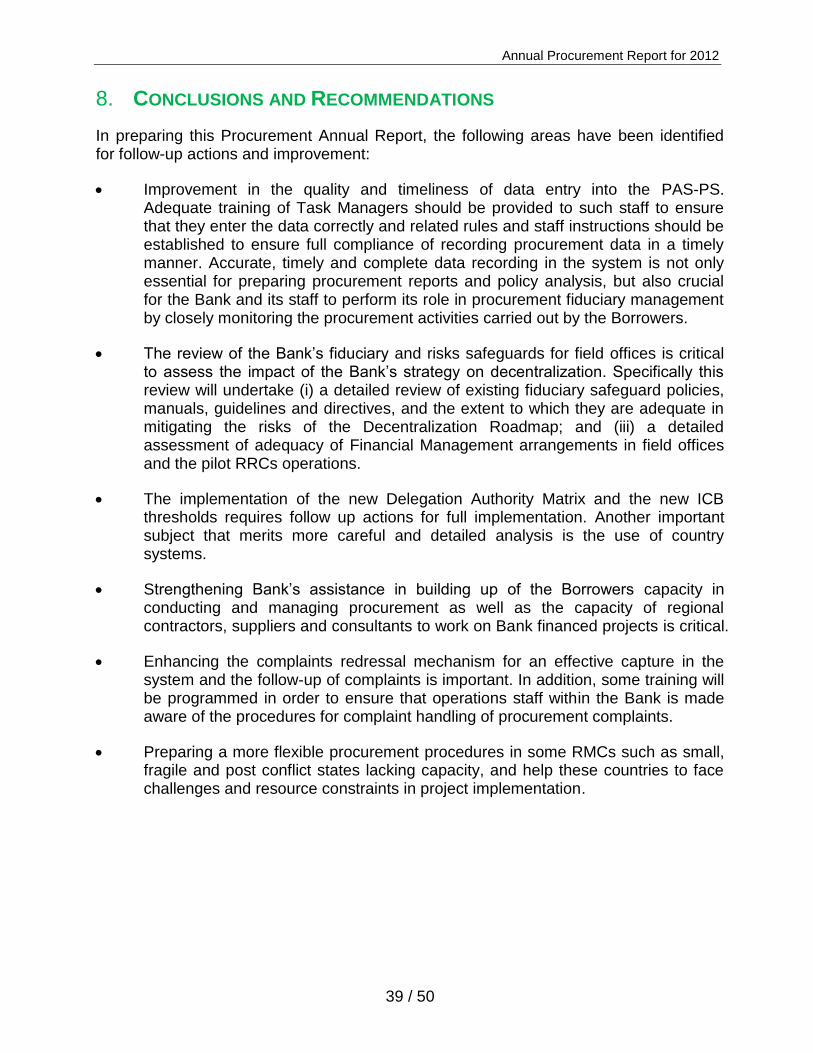
Annual Procurement Report for 2012
39 / 50
CONCLUSIONS AND RECOMMENDATIONS 8.
In preparing this Procurement Annual Report, the following areas have been identified for follow-up actions and improvement:
Improvement in the quality and timeliness of data entry into the PAS-PS. Adequate training of Task Managers should be provided to such staff to ensure that they enter the data correctly and related rules and staff instructions should be established to ensure full compliance of recording procurement data in a timely manner. Accurate, timely and complete data recording in the system is not only essential for preparing procurement reports and policy analysis, but also crucial for the Bank and its staff to perform its role in procurement fiduciary management by closely monitoring the procurement activities carried out by the Borrowers.
The review of the Bank’s fiduciary and risks safeguards for field offices is critical to assess the impact of the Bank’s strategy on decentralization. Specifically this review will undertake (i) a detailed review of existing fiduciary safeguard policies, manuals, guidelines and directives, and the extent to which they are adequate in mitigating the risks of the Decentralization Roadmap; and (iii) a detailed assessment of adequacy of Financial Management arrangements in field offices and the pilot RRCs operations.
The implementation of the new Delegation Authority Matrix and the new ICB thresholds requires follow up actions for full implementation. Another important subject that merits more careful and detailed analysis is the use of country systems.
Strengthening Bank’s assistance in building up of the Borrowers capacity in conducting and managing procurement as well as the capacity of regional contractors, suppliers and consultants to work on Bank financed projects is critical.
Enhancing the complaints redressal mechanism for an effective capture in the system and the follow-up of complaints is important. In addition, some training will be programmed in order to ensure that operations staff within the Bank is made aware of the procedures for complaint handling of procurement complaints.
Preparing a more flexible procurement procedures in some RMCs such as small, fragile and post conflict states lacking capacity, and help these countries to face challenges and resource constraints in project implementation.
Annual Procurement Report for 2012
40 / 50
Appendix 1: African Development Bank Group Member Countries
Regional Member Countries
Algeria Ghana Somalia
Angola Guinea South Africa
Benin Guinea-Bissau Sudan
Botswana Kenya Swaziland
Burkina Faso Lesotho Tanzania
Burundi Liberia Tunisia
Cameroon Libya Uganda
Cape Verde Madagascar Zambia
Central African Republic Malawi Zimbabwe
Chad Mali
Comoros Mauritania
Congo Mauritius
Côte d’Ivoire Morocco
Democratic Republic of Mozambique
Congo Namibia
Djibouti Niger
Egypt Nigeria
Equatorial Guinea Rwanda
Eritrea São Tomé & Príncipe
Ethiopia Senegal
Gabon Seychelles
Gambia Sierra Leone
Non Regional Member Countries
Argentina Korea United Arab Emirates Austria Kuwait (ADF member only) Belgium Netherlands Brazil Norway
Canada Portugal China Saudi Arabia Denmark Spain Finland Sweden France Switzerland Germany United Kingdom India United States of Italy America Japan
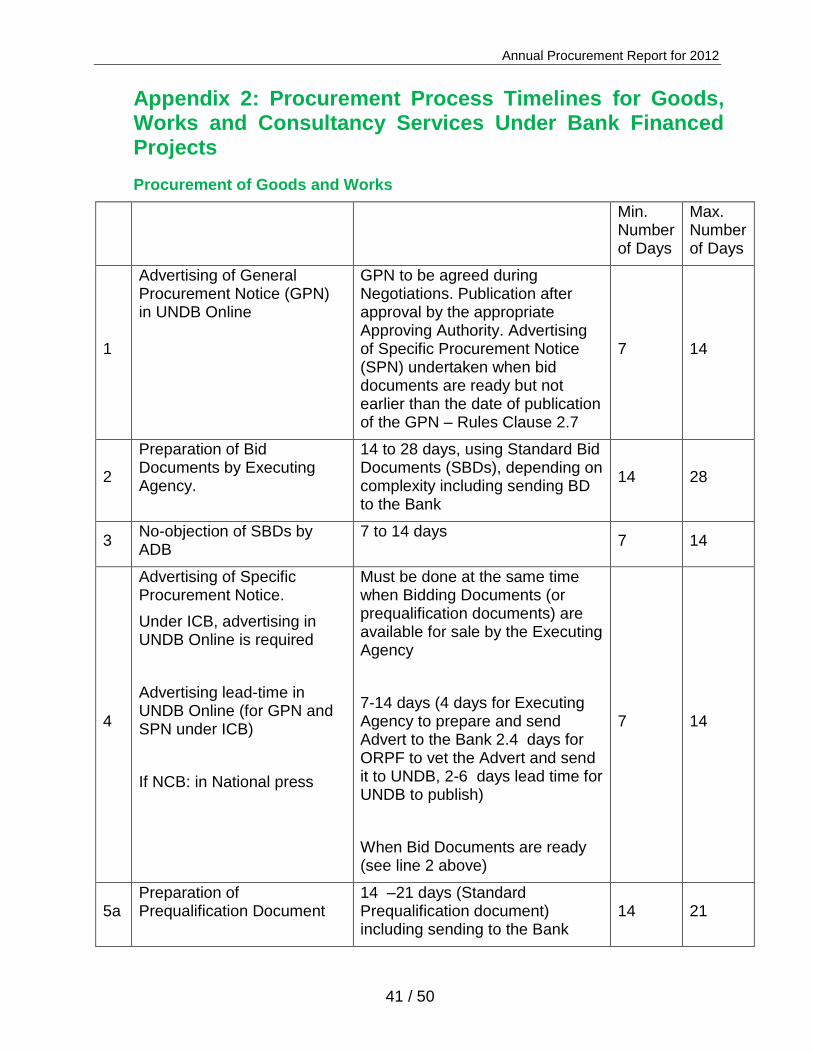
Annual Procurement Report for 2012
41 / 50
Appendix 2: Procurement Process Timelines for Goods, Works and Consultancy Services Under Bank Financed Projects
Procurement of Goods and Works
Min.
Number of Days
Max. Number of Days
1
Advertising of General Procurement Notice (GPN) in UNDB Online
GPN to be agreed during Negotiations. Publication after approval by the appropriate Approving Authority. Advertising of Specific Procurement Notice (SPN) undertaken when bid documents are ready but not earlier than the date of publication of the GPN – Rules Clause 2.7
7 14
2
Preparation of Bid Documents by Executing Agency.
14 to 28 days, using Standard Bid Documents (SBDs), depending on complexity including sending BD to the Bank
14 28
3 No-objection of SBDs by ADB
7 to 14 days 7 14
4
Advertising of Specific Procurement Notice.
Under ICB, advertising in UNDB Online is required
Advertising lead-time in UNDB Online (for GPN and SPN under ICB)
If NCB: in National press
Must be done at the same time when Bidding Documents (or prequalification documents) are available for sale by the Executing Agency
7-14 days (4 days for Executing Agency to prepare and send Advert to the Bank 2.4 days for ORPF to vet the Advert and send it to UNDB, 2-6 days lead time for UNDB to publish)
When Bid Documents are ready (see line 2 above)
7 14
5a Preparation of Prequalification Document
14 –21 days (Standard Prequalification document) including sending to the Bank
14 21
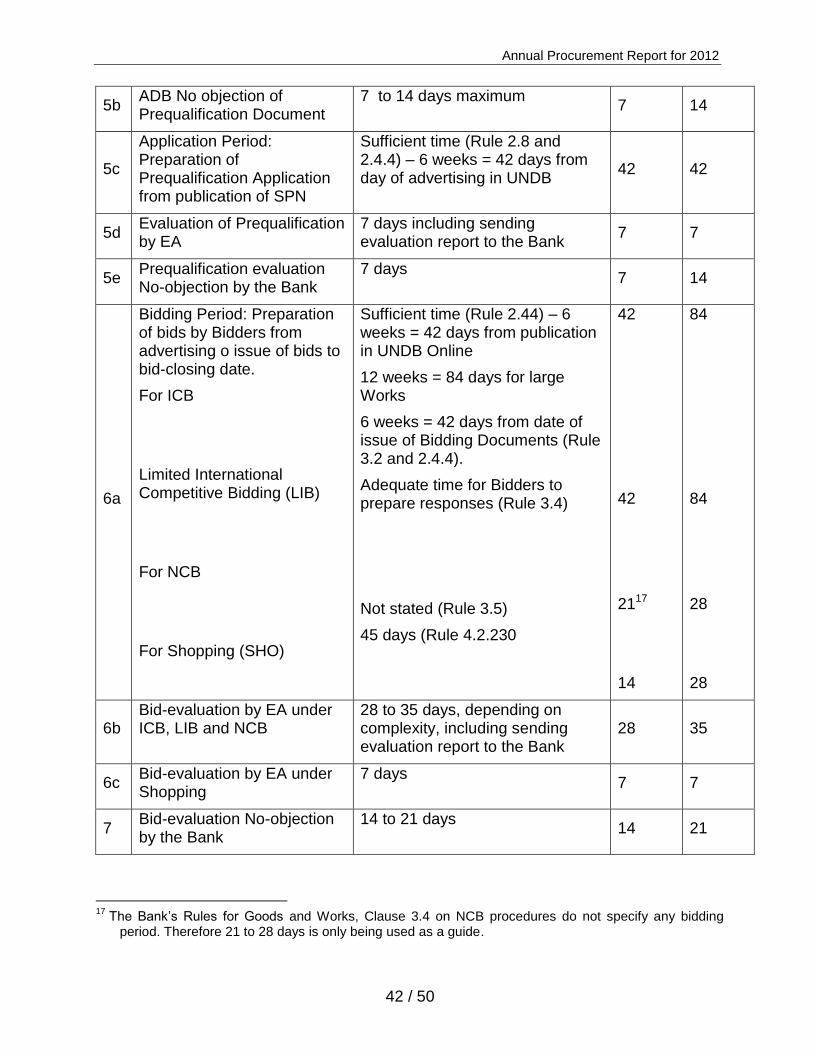
Annual Procurement Report for 2012
42 / 50
5b ADB No objection of Prequalification Document
7 to 14 days maximum 7 14
5c
Application Period: Preparation of Prequalification Application from publication of SPN
Sufficient time (Rule 2.8 and 2.4.4) – 6 weeks = 42 days from day of advertising in UNDB
42 42
5d Evaluation of Prequalification by EA
7 days including sending evaluation report to the Bank
7 7
5e Prequalification evaluation No-objection by the Bank
7 days 7 14
6a
Bidding Period: Preparation of bids by Bidders from advertising o issue of bids to bid-closing date.
For ICB
Limited International Competitive Bidding (LIB)
For NCB
For Shopping (SHO)
Sufficient time (Rule 2.44) – 6 weeks = 42 days from publication in UNDB Online
12 weeks = 84 days for large Works
6 weeks = 42 days from date of issue of Bidding Documents (Rule 3.2 and 2.4.4).
Adequate time for Bidders to prepare responses (Rule 3.4)
Not stated (Rule 3.5)
45 days (Rule 4.2.230
42
42
2117
14
84
84
28
28
6b Bid-evaluation by EA under ICB, LIB and NCB
28 to 35 days, depending on complexity, including sending evaluation report to the Bank
28 35
6c Bid-evaluation by EA under Shopping
7 days 7 7
7 Bid-evaluation No-objection by the Bank
14 to 21 days 14 21
17
The Bank’s Rules for Goods and Works, Clause 3.4 on NCB procedures do not specify any bidding period. Therefore 21 to 28 days is only being used as a guide.
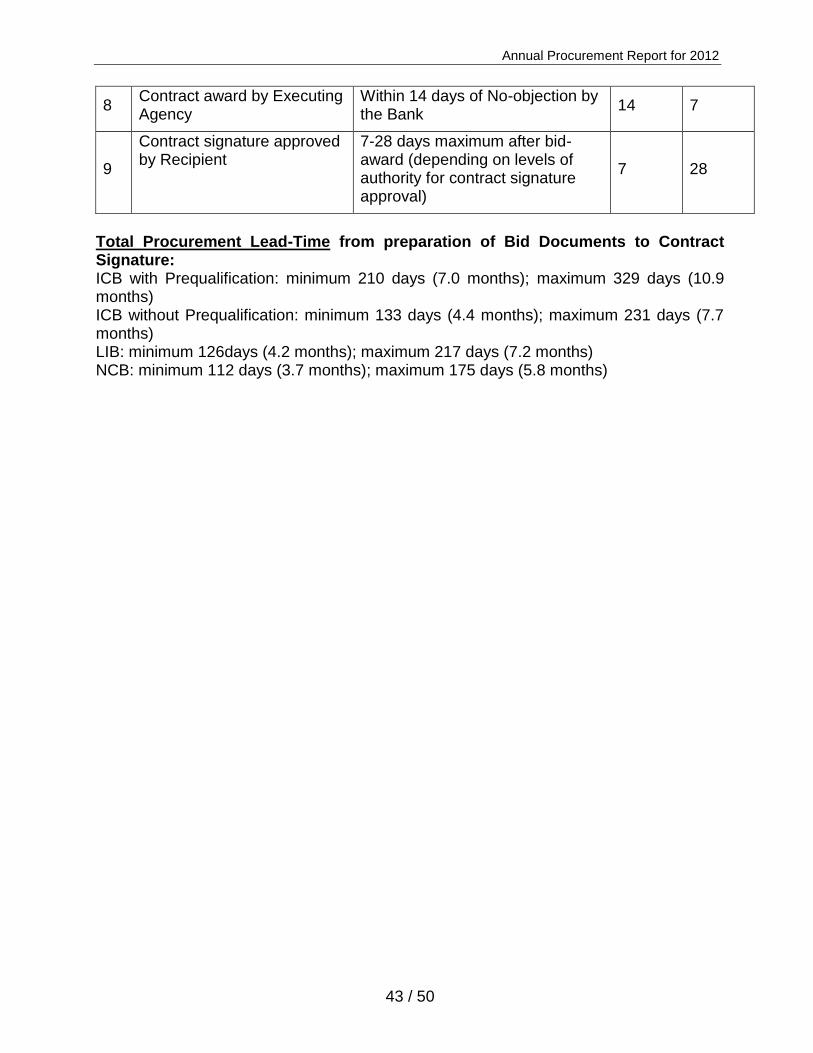
Annual Procurement Report for 2012
43 / 50
8 Contract award by Executing Agency
Within 14 days of No-objection by the Bank
14 7
9
Contract signature approved by Recipient
7-28 days maximum after bid-award (depending on levels of authority for contract signature approval)
7 28
Total Procurement Lead-Time from preparation of Bid Documents to Contract Signature: ICB with Prequalification: minimum 210 days (7.0 months); maximum 329 days (10.9 months) ICB without Prequalification: minimum 133 days (4.4 months); maximum 231 days (7.7 months) LIB: minimum 126days (4.2 months); maximum 217 days (7.2 months) NCB: minimum 112 days (3.7 months); maximum 175 days (5.8 months)

Annual Procurement Report for 2012
44 / 50
Procurement of Consultancy Services
Min. Number of Days
Max. Number of Days
1 Advertising of General Procurement Notice (GPN) in UNDB Online (with Goods, Works and Consultancy Services combined, requesting General Expressions of Interest (EOI) for Services
GPN to be agreed during Negotiations. Publication after approval by the appropriate Approving Authority. Advertising of Specific Procurement Notice (SPN) undertaken when requests for proposals documents are ready but not earlier than the date of publication of the GPN – Rule 2.5
7 14
2 Publication of the Specific Procurement Notice (SPN) for Expressions of Interest in UNDB Online required for Contracts of value greater than UA 200,000 (Rule 2.5).
14 days (4 days for EA to prepare and forward the Advert to the Bank; 3 days for the Bank to review and send to ORPF to vet the Advert and send it to UNDB; and 7 days lead time for UNDB to publish Online
7 14
3 Lead time for receiving Expressions of Interest after (i) publication in UNDB Online (Rule 2.5)
(ii) publication in National Press for Contract value less than UA 200,000 (Euros 200,000) (Rule 2.5)
14 days
14 14
4 Preparation by EA of Shortlist based on GPN and SPN and qualifications needed for carrying out the TOR
7 days, including communicating Shortlist to the Bank
7 14
5 Preparation of Terms of Reference (TOR) and the RFP, by the Executing Agency (EA)
14 to 35 days, depending on complexity of the assignment including correspondence with Bank
14 35
6 No objection of the Shortlist , TOR and RFP, by the Bank
7 to 14 days 7 14

Annual Procurement Report for 2012
45 / 50
7 Preparation of Proposals by Short listed Consulting Firms
4 weeks = 28 days to 3 months = 90 days, depending on complexity for preparation and submission of proposals. Rules Clause 2.13
45 days (Rule 4.2.230
28 90
8 Opening of Technical Proposals and evaluation by the EA
14 to 28 days including submission of technical proposals evaluation report to the Bank
14 28
9 Technical Evaluation No objection by the Bank
7 to 14 days, maximum 7 14
10 Public Opening of the Financial Proposals, Evaluation and Compilation of the Final Report by the EA
7 to 21 days including submission of combined technical and financial evaluation report to the Bank
7 21
11 EA invites selected Consulting Firm for negotiations
7 to 14 days from receipt of No-objection from the Bank 7 14
12 No-objection to the Minutes of Negotiations and negotiated Contract.
7 days from end of negotiations 7 14
13 Contract award by Executing Agency
Within 7 days of No-objection by Bank
7 7
14 Contract signature 7 to 28 days from receiving Bank No 0bjection
7 28
Total Procurement Lead-Time from preparation of TOR and RFP Documents to Contract Signature: Contracts of Value greater than UA 200,000 (Euros 200,000): minimum 11918 days (3.9 months); maximum 272 days (9 months) Contracts of Value less than UA 200,000 (Euros 200,000): minimum 112 days (3.7 months); maximum 258 days (8.6 months)
18
Assumed TOR will be prepared concurrently with other activities.

Annual Procurement Report for 2012
46 / 50
Appendix 3: Processing a Complaint Case
This diagram highlights the major steps undertaken in the review and processing of a project procurement complaint. Depending on the procurement stage at which the complaint is received however, certain steps may not be relevant.
TM : Task Manager ED : Executive Director EA : Executing Agency
PS : Procurement Specialists
RPC : Regional Procurement Coordinators
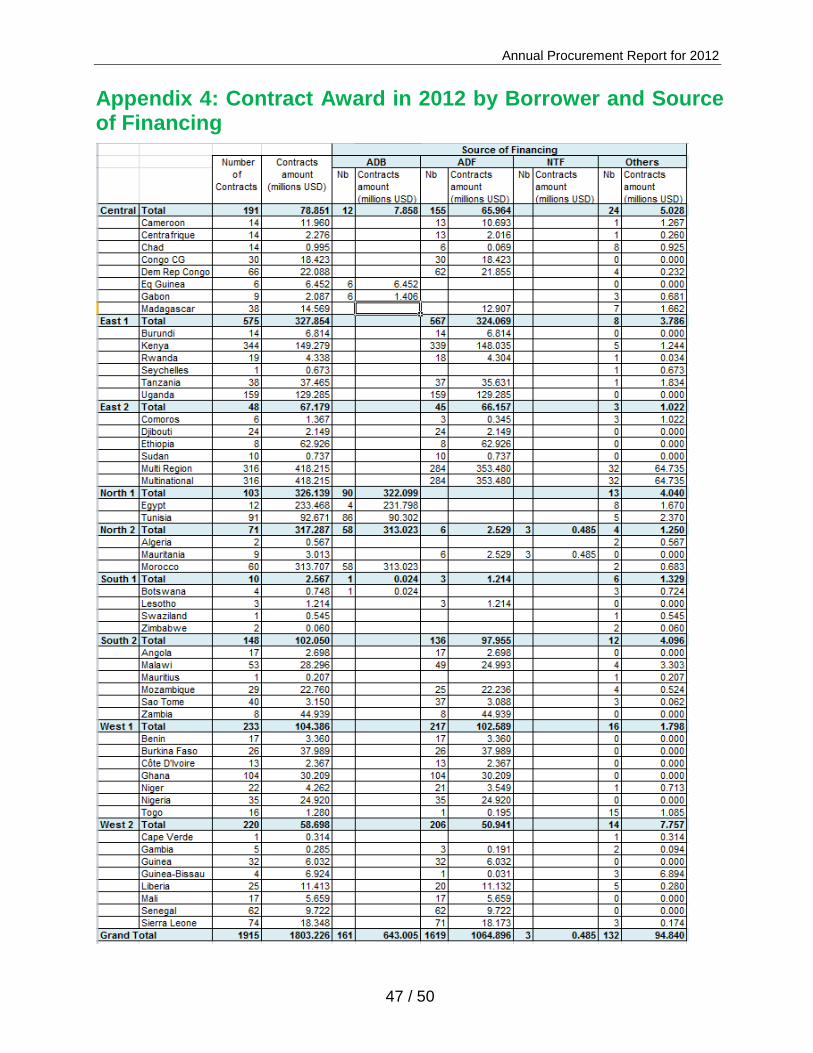
Annual Procurement Report for 2012
47 / 50
Appendix 4: Contract Award in 2012 by Borrower and Source of Financing
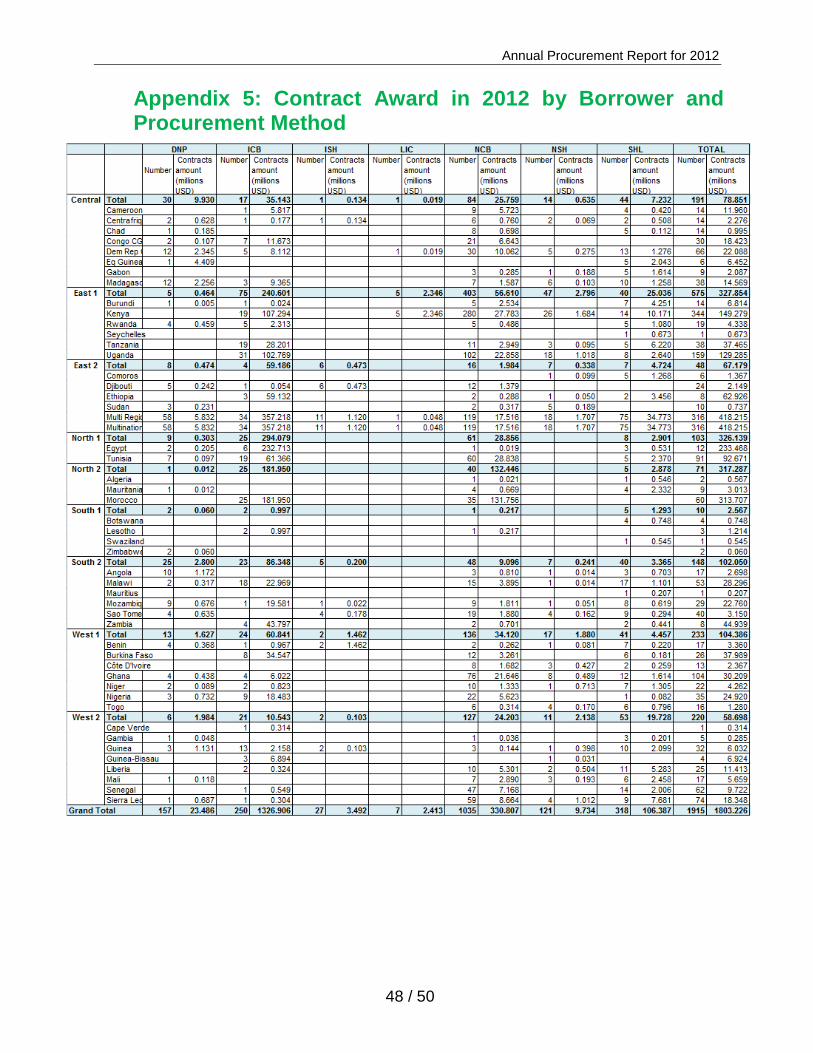
Annual Procurement Report for 2012
48 / 50
Appendix 5: Contract Award in 2012 by Borrower and Procurement Method

Annual Procurement Report for 2012
49 / 50
Appendix 6: Contract Award in 2012 by Source of Supply in NRMCs and Source of Financing
Source of Financing
Number of
Contracts
Contracts amount (million USD)
Number of Contracts Contracts amount (million USD)
ADB ADF Others ADB ADF Others
Austria 1 6.292 1 0 6.292 0.000
Belgium 5 8.006 3 2 2.082 5.924
Brazil 2 1.546 2 0 1.546 0.000
Canada 17 10.390 15 2 9.393 0.997
China 10 207.203 10 0 207.203 0.000
Denmark 3 2.042 2 1 1.835 0.207
France 30 32.460 5 19 6 24.328 7.316 0.816
Germany 13 131.926 2 10 1 113.281 18.076 0.569
India 13 152.862 11 2 125.294 27.569
Italy 7 114.566 2 5 0 110.160 4.406 0.000
Multinational 12 1.566 3 9 0.168 1.398
Netherlands 7 7.193 5 2 5.787 1.406
Portugal 8 8.597 2 5 1 7.623 0.660 0.314
Spain 14 143.372 8 2 4 101.935 8.508 32.929
Sweden 1 0.009 1 0 0.009 0.000
Switzerland 2 0.607 1 1 0.446 0.162
United Kingdom
15 8.030 13 2 7.092 0.938
United States 5 2.003 3 2 1.851 0.152
TOTAL NRMC 165 838.670 20 110 35 363.618 401.671 73.381
Annual Procurement Report for 2012
50 / 50
Appendix 7: Contract Award by Source of Supply and Procurement Method in 2012
The following statistics, available on the Bank’s Internet web page http://www.afdb.org/en/projects-and-operations/procurement/tools-reports/procurement-statistics/, give the distribution of contracts for goods, works, consulting services and others (including operating costs, food crisis expenses and personnel costs).
The contracts referred to are those approved by the Bank and signed by the Executing Agencies from January 2009 to December 2013. The data was extracted from the SAP Project Management System on 10th January 2014. It is to be noted that some of the contracts that are mainly paid through Special Accounts do not appear in these statistics.
Contracts statistics by non-regional member country Listing of Awarded Contracts Contracts Awarded to Non-Members Countries Distribution of contracts among members countries Contracts statistics by regional member country Procurement Summary by Country Procurement Summary by Year