annual performance report ffy 2012 - tennessee · form in appendix i at the end of this report. ......
TRANSCRIPT

Part B APR FFY 2012 Tennessee
Annual Performance Report FFY 2012
Tennessee Department of Education
Division of Special Populations

Part B APR FFY 2012 Tennessee
February 3, 2014 2
TABLE OF CONTENTS
OVERVIEW OF THE ANNUAL PERFORMANCE REPORT DEVELOPMENT .......................................... 3 INDICATOR 1: GRADUATION .................................................................................................................... 4 INDICATOR 2: DROP-OUT ......................................................................................................................... 6 INDICATOR 3: STATEWIDE ASSESSMENTS .......................................................................................... 8 INDICATOR 4A: SUSPENSION/EXPULSION SIGNIFICANT DISCREPANCY ....................................... 15 INDICATOR 4B: SUSPENSION/EXPULSION SIGNIFICANT DISCREPANCY BY
RACE/ETHNICITY ......................................................................................................... 20 INDICATOR 5: LRE PLACEMENT ........................................................................................................... 25 INDICATOR 6: PRE-SCHOOL SETTING ................................................................................................. 28 INDICATOR 7: PRE-SCHOOL SKILLS .................................................................................................... 31 INDICATOR 8: PARENT INVOLVEMENT ................................................................................................ 36 INDICATOR 9: DISPROPORTIONATE REPRESENTATION IN SPECIAL EDUCATION ...................... 39 INDICATOR 10: DISPROPORTIONATE REPRESENTATION BY SPECIFIC DISABILITY CATEGORIES ................................................................................................................ 43 INDICATOR 11: CHILDFIND ..................................................................................................................... 47 INDICATOR 12: PART C TO B TRANSITION .......................................................................................... 51 INDICATOR 13: SECONDARY TRANSITION WITH IEP GOALS ........................................................... 55 INDICATOR 14: SECONDARY TRANSITION AFTER SECONDARY SCHOOL .................................... 58 INDICATOR 15: MONITORING ................................................................................................................. 67
INDICATOR 15 WORKSHEET ...................................................................................................... 70
INDICATOR 16: COMPLAINTS (no longer required) .............................................................................. 76
INDICATOR 17: HEARING REQUESTS FULLY ADJUDICATED WITHIN TIMELINE (no longer required) ...................................................................................................... 77 INDICATOR 18: HEARING RESOLVED DURING RESOLUTION SESSION ......................................... 83
INDICATOR 19: MEDIATION .................................................................................................................... 84 INDICATOR 20: EFFECTIVE GENERAL SUPERVISION PART B/ GENERAL SUPERVISION ............ 85 APPENDIX: ................................................................................................................................................ 87

Part B APR FFY 2012 Tennessee
February 3, 2014 3
State of Tennessee
Part B Annual Performance Report for Federal Fiscal Year FFY 2012
Overview of the Annual Performance Report Development
The attached document is the Tennessee Department of Education (TDOE) Part B Annual Performance Report (APR) for FFY 2012. The APR provides information specific to measuring the State’s progress on indicators identified by the United States Department of Education, Office of Special Education Programs (OSEP). Based on a determination of “meets requirements”, as reported to TDOE in the OSEP SPP/APR Report of June, 2013, no required technical assistance activities focused on a particular indicator are reported. However, it should be noted that Indicator 13 and 14 work has been enhanced through a technical assistance agreement with the National Secondary Transition Technical Assistance Center (NSTTAC) as well as guidance provided by the National Post School Outcomes (NPSO) Center. To complete this APR:
1. Data were gathered from Federal Data Reports, State End of Year (EOY) Reports, State and Federal statistical analysis reports, surveys, monitoring information, and advocacy and local education agency (LEA) personnel whenever possible. The Office of Data Services reformatted information into tables that could be used to complete indicators.
2. All indicator chairpersons were assigned tasks specific to overall management and accountability as well as specific timelines for completion of assigned indicators. The SPP/APR Director was responsible for overall completion and submission of the final APR.
3. In developing the APR TDOE solicits input of the Student’s with Disabilities Advisory Council through meetings, presentations of data, and constructive Q&A. The TDOE SPP/APR Coordinator ensured that all stakeholder input and suggestions was considered in the development and finalization of each indicator. Additionally, staff from TDOE’s various Division’s provided data, analysis, and explanations toward completion of the APR. Indicator chairpersons were involved in establishing, updating, and in some cases, conducting improvement activities as part of their indicator completion duties.
4. The entire draft document was submitted to TDOE’s federal technical assistance center, Mid-South Regional Resource Center (MSRRC) in early January 2014, for review prior to finalization and submission to OSEP.
5. A report of slippage and summary of improvement activities has been provided in consolidated form in Appendix I at the end of this report.
6. TDOE reports annually to the public on progress or slippage in meeting the “measurable and rigorous targets” which are included in the SPP/APR as well as local district data through the State’s website at: http://tn.gov/education/speced/data_reports.shtml

Part B APR FFY 2012 Tennessee
February 3, 2014 4
Part B State Annual Performance Report (APR) for FFY 2012
Overview of the Annual Performance Report Development: See page 3
Monitoring Priority: FAPE in the LRE-
INDICATOR 1: Percent of youth with IEPs graduating from high school with a regular diploma. (20 U.S.C. 1416 (a)(3)(A))
Measurement: States must report using the graduation rate calculation and timeline established by the Department under the ESEA.
FFY Measurable and Rigorous Target
2012
(data from 2011-12)
Increase the graduation rate of students with disabilities 1.5% per year.
Actual Target Data for FFY 2012
# of cohort members graduating with regular HS diplomas by the end of 2011-12 = 6,350 (# of first-time 9
th graders in fall of 2008) + (transfers in) – (transfers out) – (emigrated out) – (deceased)
= 8,717
6,350 / 8,717 x 100 = 72.8%
The data used to measure Indicator 1 is the same as that used for reporting to the Department under Title I of the Elementary and Secondary Education Act (ESEA), using the adjusted four-year cohort graduation rate required under the ESEA for 2011-2012.
Graduation requirements that must be met for all students, including students with disabilities, to receive a regular high school diploma, are listed below:
REQUIREMENT NUMBER OF UNITS
English 4.0
Mathematics 4.0
Science 3.0
Social Studies 3.0
Foreign Language 2.0
Fine Arts 1.0
Physical Education & Wellness 1.5
Personal Finance 0.5
Elective Focus 3.0

Part B APR FFY 2012 Tennessee
February 3, 2014 5
To earn a regular high school diploma all students must earn the prescribed 22 unit minimum and have satisfactory attendance and discipline records.
Discussion of Improvement Activities Completed and Explanation of Slippage if the State did not meet its target for FFY 2012 TDOE’s target of an increase of 1.5% per year was achieved. Data for FFY 2012 reveals a 72.8% graduation rate of students with disabilities whereas in FFY 2011, the percentage was 67.4%. This represents progress of 5.4%. Target met. TDOEs current efforts, designed to influence positive growth of the graduation rate, include: eliminating the State’s alternate achievement exam (MAAS), more support to LEAs who have been flagged due to lower graduation rates, an increase in focus on literacy skills in lower grades, more emphasis/training on writing instructionally appropriate IEPs- especially for “at risk” students, and development and implementation of Response to Intervention and Instruction (RTI²) practices statewide Improvement initiatives being considered for the FFY 2013 SPP/APR or beyond include: LEAs with high graduation rates sharing strategies utilized, tracking 5 and 6 year graduation data to emphasize success for those SWD receiving a regular high school diploma over a time period longer than 4 years and a summer, and continued emphasis on parent involvement. Improvement Activities (See Appendix I) Additional Information Required by the OSEP APR Response Table for this Indicator (if applicable):
Statement from the Response Table State’s Response
“Submit a revised SPP with FFY 2011 baseline data for this indicator.”
See revision of SPP Indicator # 1 attached with this submission.
Revisions, with Justification, to Proposed Targets / Improvement Activities / Timelines / Resources for FFY 2012
Activities Timeline Resources
None

Part B APR FFY 2012 Tennessee
February 3, 2014 6
Part B State Annual Performance Report (APR) for FFY 2012
Overview of the Annual Performance Report Development: See page 3
Monitoring Priority: FAPE in the LRE
INDICATOR 2: Percent of youth with IEPs dropping out of high school. (20 U.S.C. 1416 (a)(3)(A))
Measurement: States must report using the dropout data used in the ESEA graduation rate calculation and follow the timeline established by the Department under the ESEA.
FFY Measurable and Rigorous Target
2012
(data from 2011-2012)
Decrease the dropout rate of students with disabilities1.5% per year.
Actual Target Data for FFY 2012)
Numbers of students with disabilities who dropped out: 1,073
Numbers of students with disabilities in grades 9-12 in 2011-12 school year: 30,883
1,073 / 30,883 = 3.47%
The data for FFY 2011 reporting was collected absent an IDEA data manager to fully process, clean, and deliver data to the respective APR chair. This led to incorrect numbers being utilized to calculate the FFY 2011 dropout rate for the APR submitted in February, 2013. The rate reported was 9.6%. In the FFY 2011 calculation the count of ALL special education students that dropped out was used for the numerator (not just those in 9th-12th grades, which would be the accurate demographic range). Moreover, the denominator used was the count of students from the December 1 Census report in only grades 9-12. Accordingly, this denominator was far too low. Coupled with the higher count of students in the numerator, the FFY 2011 calculation yielded an inappropriately high dropout rate. Once the IDEA data manager position was filled, the FFY 2011 spike was investigated and the aforementioned problems were found. Proper business rules that apply across all departments in the TDOE were developed so that those calculating the 032 EdFacts report for dropouts would have information that would be congruent with that reported for this indicator. These efforts produced a far more accurate rate that is more aligned with years prior to FFY 2011. Note the increase in the count of SWD dropouts in grades 9-12. This is because of a change in business rules which included two more exit reasons for dropouts. These reasons are: "transfer to another school in the same school system with no subsequent enrollment" and "transfer to another school in the state with no subsequent enrollment". These additions to dropout exit reasons led to an overall increase in dropouts throughout the state in all areas.

Part B APR FFY 2012 Tennessee
February 3, 2014 7
Year-to-year comparison on this indicator indicates a decrease in dropout rate from 9.6% in FFY 2011 to 3.47in FFY 2012. The State target of a 1.5% decrease was met.
Discussion of Improvement Activities Completed and Explanation of Slippage if the State did not meet its target for FFY 2012: Target met. No slippage to explain.
Improvement Activities (See Appendix I)
Revisions, with Justification, to Proposed Targets / Improvement Activities / Timelines / Resources for FFY 2012 (if applicable):
Activities Timeline Resources
None
Part B APR FFY 2012 Tennessee
February 3, 2014 8
Part B State Annual Performance Report (APR) for FFY 2012
Overview of the Annual Performance Report Development: See page 3
Monitoring Priority: FAPE in the LRE
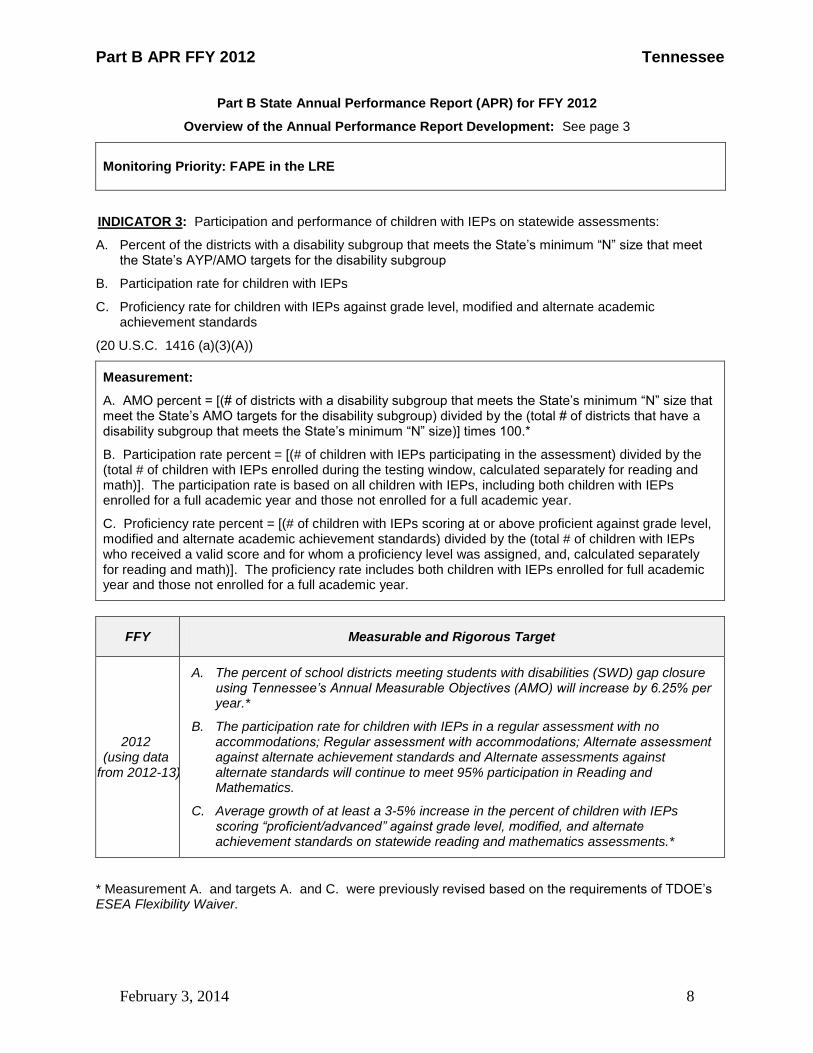
INDICATOR 3: Participation and performance of children with IEPs on statewide assessments:
A. Percent of the districts with a disability subgroup that meets the State’s minimum “N” size that meet the State’s AYP/AMO targets for the disability subgroup
B. Participation rate for children with IEPs
C. Proficiency rate for children with IEPs against grade level, modified and alternate academic achievement standards
(20 U.S.C. 1416 (a)(3)(A))
Measurement:
A. AMO percent = [(# of districts with a disability subgroup that meets the State’s minimum “N” size that meet the State’s AMO targets for the disability subgroup) divided by the (total # of districts that have a disability subgroup that meets the State’s minimum “N” size)] times 100.*
B. Participation rate percent = [(# of children with IEPs participating in the assessment) divided by the (total # of children with IEPs enrolled during the testing window, calculated separately for reading and math)]. The participation rate is based on all children with IEPs, including both children with IEPs enrolled for a full academic year and those not enrolled for a full academic year.
C. Proficiency rate percent = [(# of children with IEPs scoring at or above proficient against grade level, modified and alternate academic achievement standards) divided by the (total # of children with IEPs who received a valid score and for whom a proficiency level was assigned, and, calculated separately for reading and math)]. The proficiency rate includes both children with IEPs enrolled for full academic year and those not enrolled for a full academic year.
FFY Measurable and Rigorous Target
2012 (using data
from 2012-13)
A. The percent of school districts meeting students with disabilities (SWD) gap closure using Tennessee’s Annual Measurable Objectives (AMO) will increase by 6.25% per year.*
B. The participation rate for children with IEPs in a regular assessment with no accommodations; Regular assessment with accommodations; Alternate assessment against alternate achievement standards and Alternate assessments against alternate standards will continue to meet 95% participation in Reading and Mathematics.
C. Average growth of at least a 3-5% increase in the percent of children with IEPs scoring “proficient/advanced” against grade level, modified, and alternate achievement standards on statewide reading and mathematics assessments.*
* Measurement A. and targets A. and C. were previously revised based on the requirements of TDOE’s ESEA Flexibility Waiver.
Part B APR FFY 2012 Tennessee
February 3, 2014 9
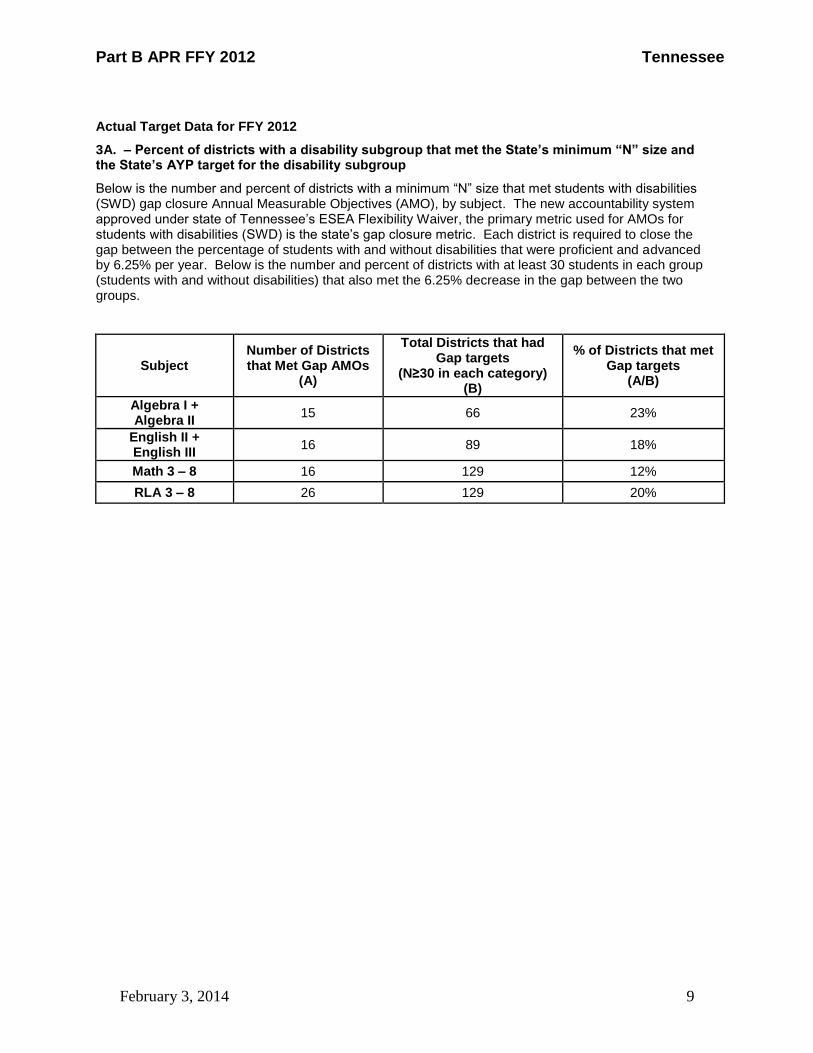
Actual Target Data for FFY 2012
3A. – Percent of districts with a disability subgroup that met the State’s minimum “N” size and the State’s AYP target for the disability subgroup
Below is the number and percent of districts with a minimum “N” size that met students with disabilities (SWD) gap closure Annual Measurable Objectives (AMO), by subject. The new accountability system approved under state of Tennessee’s ESEA Flexibility Waiver, the primary metric used for AMOs for students with disabilities (SWD) is the state’s gap closure metric. Each district is required to close the gap between the percentage of students with and without disabilities that were proficient and advanced by 6.25% per year. Below is the number and percent of districts with at least 30 students in each group (students with and without disabilities) that also met the 6.25% decrease in the gap between the two groups.
Subject Number of Districts that Met Gap AMOs
(A)
Total Districts that had Gap targets
(N≥30 in each category) (B)
% of Districts that met Gap targets
(A/B)
Algebra I + Algebra II
15 66 23%
English II + English III
16 89 18%
Math 3 – 8 16 129 12%
RLA 3 – 8 26 129 20%

Part B APR FFY 2012 Tennessee
February 3, 2014 10
3.B – Actual Participation Target Data for FFY 2012
Disaggregated Target Data for Reading Participation
TN Statewide Assessment 2012-2013
Participation Reading Total
Grade 3-8 English II # %
A Children with IEPs 58938 6977 65631
B
IEPs in regular assessments
without accommodations
9283 2104 11387 17.4%
(%) 15.8% 30.2%
C
IEPs in regular assessments with accommodations
26249 3940 30189 46%
(%) 44.8% 56.5%
d
IEPs in alternate assessments
against modified standards
17948 0 17948 27.3%
(%) 30.6% 0.00%
e
IEPs in alternate assessments
against alternate standards
5038 794 5832 8.9%
(%) 8.6% 11.4%
Overall Total (b+c+d+e) Participation (%)
58518 6838 65356 99.6%
99.8% 98%
Data below are included in ‘a’ but not included in ‘b’, ‘c’, ‘d’, or ‘e’
f Invalid 28 3 31 0.05%
g Medically Exempt
45 8 53 0.08%
h ELL/R 69 12 81 0.1%
i Absent 278 116 394 0.6%
Overall (b+c+d+e+f+g+h+i) Total Sum = 100%
58938 6977
100% 100%
Part B APR FFY 2012 Tennessee
February 3, 2014 11
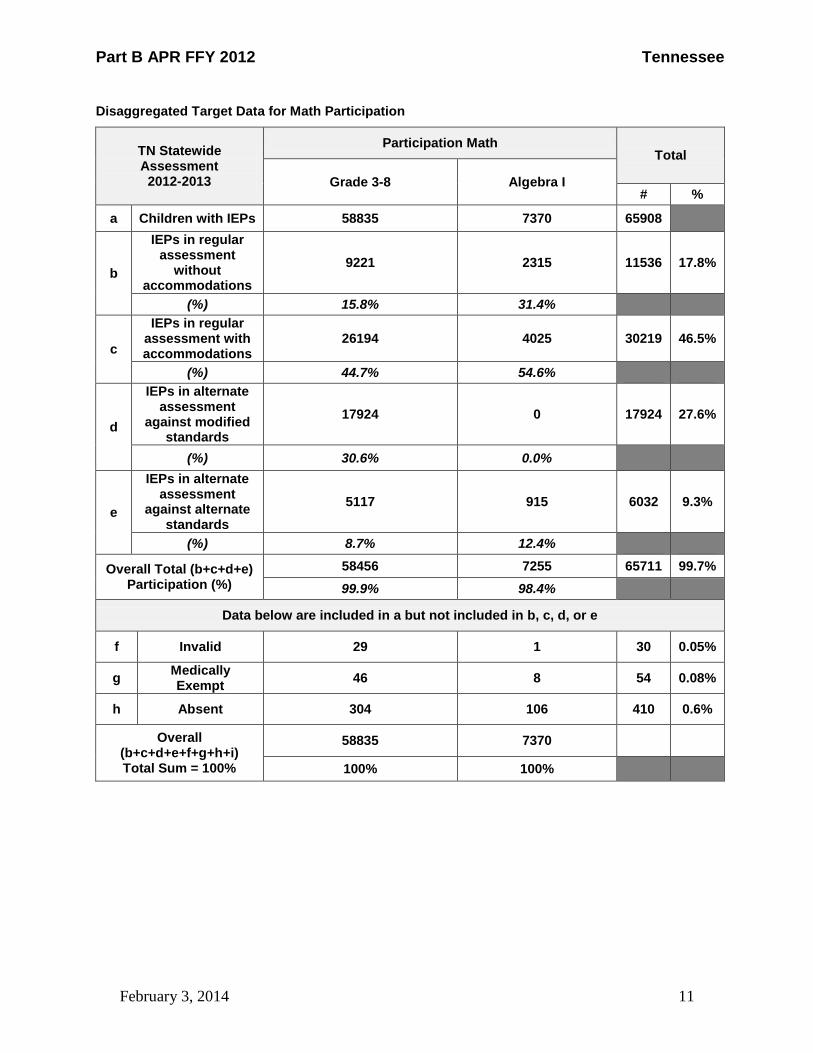
Disaggregated Target Data for Math Participation
TN Statewide Assessment 2012-2013
Participation Math Total
Grade 3-8 Algebra I # %
a Children with IEPs 58835 7370 65908
b
IEPs in regular assessment
without accommodations
9221 2315 11536 17.8%
(%) 15.8% 31.4%
c
IEPs in regular assessment with accommodations
26194 4025 30219 46.5%
(%) 44.7% 54.6%
d
IEPs in alternate assessment
against modified standards
17924 0 17924 27.6%
(%) 30.6% 0.0%
e
IEPs in alternate assessment
against alternate standards
5117 915 6032 9.3%
(%) 8.7% 12.4%
Overall Total (b+c+d+e) Participation (%)
58456 7255 65711 99.7%
99.9% 98.4%
Data below are included in a but not included in b, c, d, or e
f Invalid 29 1 30 0.05%
g Medically Exempt
46 8 54 0.08%
h Absent 304 106 410 0.6%
Overall (b+c+d+e+f+g+h+i) Total Sum = 100%
58835 7370
100% 100%
Part B APR FFY 2012 Tennessee
February 3, 2014 12
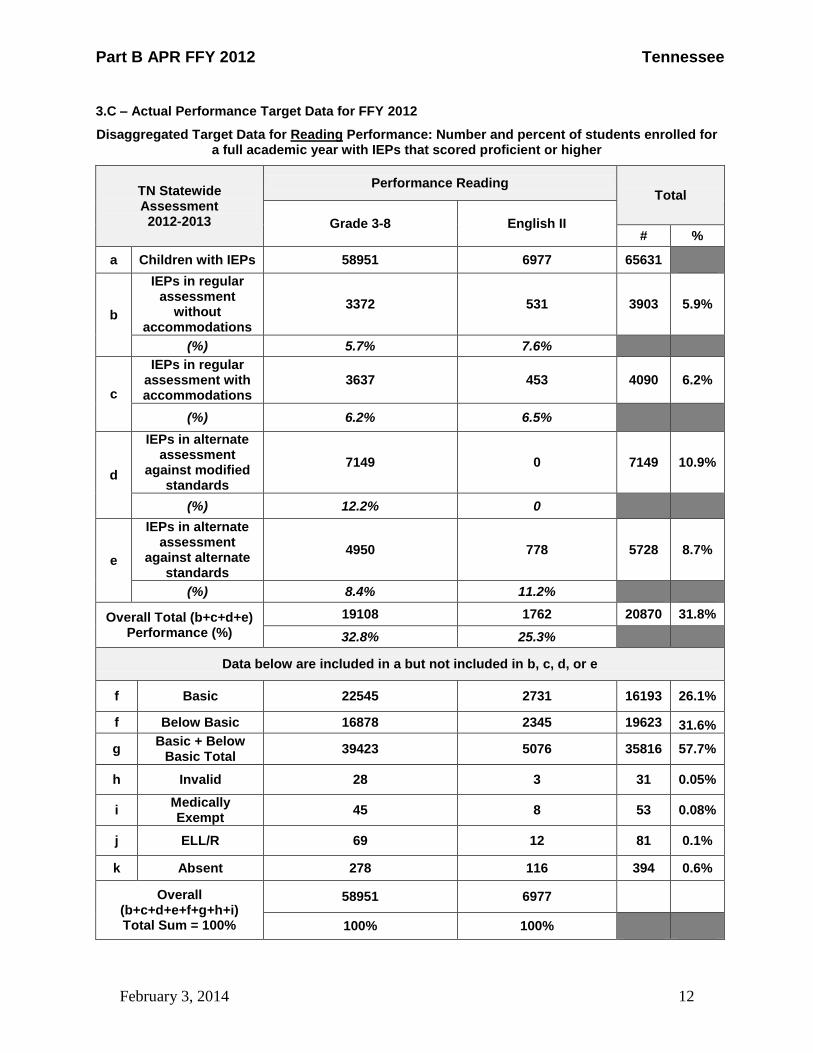
3.C – Actual Performance Target Data for FFY 2012
Disaggregated Target Data for Reading Performance: Number and percent of students enrolled for a full academic year with IEPs that scored proficient or higher
TN Statewide Assessment 2012-2013
Performance Reading Total
Grade 3-8 English II # %
a Children with IEPs 58951 6977 65631
b
IEPs in regular assessment
without accommodations
3372 531 3903 5.9%
(%) 5.7% 7.6%
c
IEPs in regular assessment with accommodations
3637 453 4090 6.2%
(%) 6.2% 6.5%
d
IEPs in alternate assessment
against modified standards
7149 0 7149 10.9%
(%) 12.2% 0
e
IEPs in alternate assessment
against alternate standards
4950 778 5728 8.7%
(%) 8.4% 11.2%
Overall Total (b+c+d+e) Performance (%)
19108 1762 20870 31.8%
32.8% 25.3%
Data below are included in a but not included in b, c, d, or e
f Basic 22545 2731 16193 26.1%
f Below Basic 16878 2345 19623 31.6%
g Basic + Below
Basic Total 39423 5076 35816 57.7%
h Invalid 28 3 31 0.05%
i Medically Exempt
45 8 53 0.08%
j ELL/R 69 12 81 0.1%
k Absent 278 116 394 0.6%
Overall (b+c+d+e+f+g+h+i) Total Sum = 100%
58951 6977
100% 100%
Part B APR FFY 2012 Tennessee
February 3, 2014 13
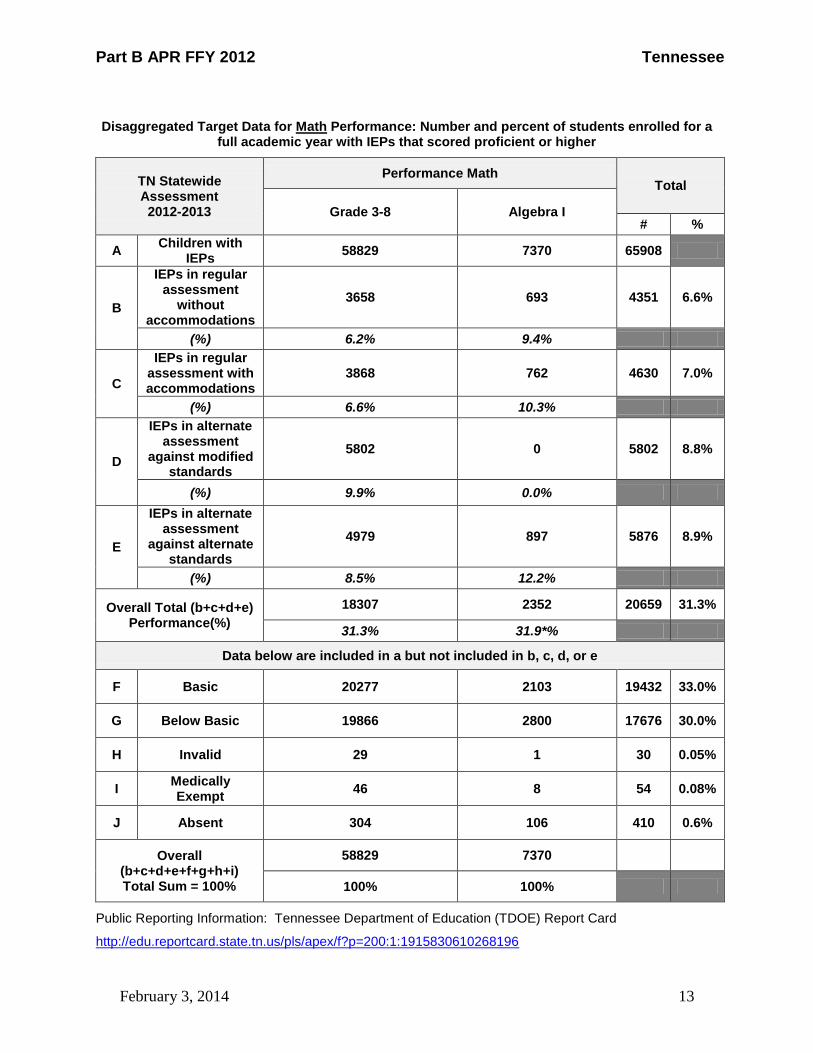
Disaggregated Target Data for Math Performance: Number and percent of students enrolled for a full academic year with IEPs that scored proficient or higher
TN Statewide Assessment 2012-2013
Performance Math Total
Grade 3-8 Algebra I # %
A Children with
IEPs 58829 7370 65908
B
IEPs in regular assessment
without accommodations
3658 693 4351 6.6%
(%) 6.2% 9.4%
C
IEPs in regular assessment with accommodations
3868 762 4630 7.0%
(%) 6.6% 10.3%
D
IEPs in alternate assessment
against modified standards
5802 0 5802 8.8%
(%) 9.9% 0.0%
E
IEPs in alternate assessment
against alternate standards
4979 897 5876 8.9%
(%) 8.5% 12.2%
Overall Total (b+c+d+e) Performance(%)
18307 2352 20659 31.3%
31.3% 31.9*%
Data below are included in a but not included in b, c, d, or e
F Basic 20277 2103 19432 33.0%
G Below Basic 19866 2800 17676 30.0%
H Invalid 29 1 30 0.05%
I Medically Exempt
46 8 54 0.08%
J Absent 304 106 410 0.6%
Overall (b+c+d+e+f+g+h+i) Total Sum = 100%
58829 7370
100% 100%
Public Reporting Information: Tennessee Department of Education (TDOE) Report Card
http://edu.reportcard.state.tn.us/pls/apex/f?p=200:1:1915830610268196
Part B APR FFY 2012 Tennessee
February 3, 2014 14
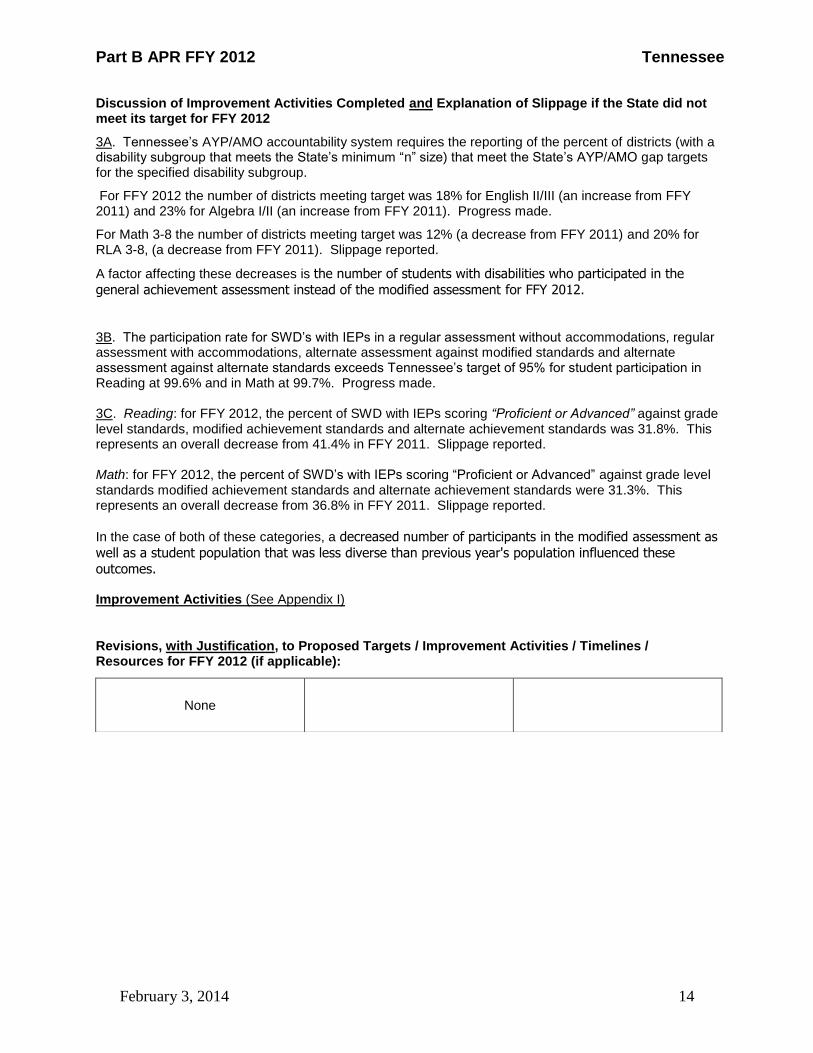
Discussion of Improvement Activities Completed and Explanation of Slippage if the State did not meet its target for FFY 2012
3A. Tennessee’s AYP/AMO accountability system requires the reporting of the percent of districts (with a disability subgroup that meets the State’s minimum “n” size) that meet the State’s AYP/AMO gap targets for the specified disability subgroup.
For FFY 2012 the number of districts meeting target was 18% for English II/III (an increase from FFY 2011) and 23% for Algebra I/II (an increase from FFY 2011). Progress made.
For Math 3-8 the number of districts meeting target was 12% (a decrease from FFY 2011) and 20% for RLA 3-8, (a decrease from FFY 2011). Slippage reported.
A factor affecting these decreases is the number of students with disabilities who participated in the
general achievement assessment instead of the modified assessment for FFY 2012.
3B. The participation rate for SWD’s with IEPs in a regular assessment without accommodations, regular assessment with accommodations, alternate assessment against modified standards and alternate assessment against alternate standards exceeds Tennessee’s target of 95% for student participation in Reading at 99.6% and in Math at 99.7%. Progress made. 3C. Reading: for FFY 2012, the percent of SWD with IEPs scoring “Proficient or Advanced” against grade level standards, modified achievement standards and alternate achievement standards was 31.8%. This represents an overall decrease from 41.4% in FFY 2011. Slippage reported. Math: for FFY 2012, the percent of SWD’s with IEPs scoring “Proficient or Advanced” against grade level standards modified achievement standards and alternate achievement standards were 31.3%. This represents an overall decrease from 36.8% in FFY 2011. Slippage reported.
In the case of both of these categories, a decreased number of participants in the modified assessment as
well as a student population that was less diverse than previous year's population influenced these
outcomes. Improvement Activities (See Appendix I)
Revisions, with Justification, to Proposed Targets / Improvement Activities / Timelines / Resources for FFY 2012 (if applicable):
None
Part B APR FFY 2012 Tennessee
February 3, 2014 15
Part B State Annual Performance Report (APR) for FFY 2012
Overview of the Annual Performance Report Development: See page 3
Monitoring Priority: FAPE in the LRE
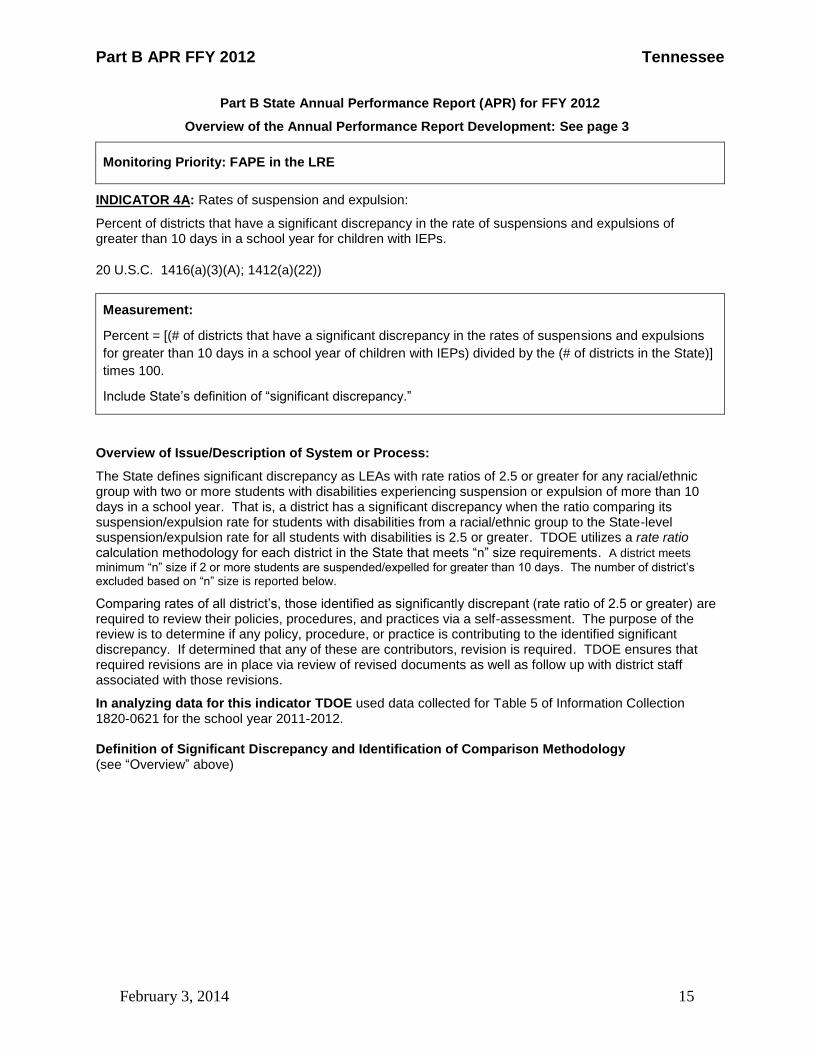
INDICATOR 4A: Rates of suspension and expulsion:
Percent of districts that have a significant discrepancy in the rate of suspensions and expulsions of greater than 10 days in a school year for children with IEPs.
20 U.S.C. 1416(a)(3)(A); 1412(a)(22))
Measurement:
Percent = [(# of districts that have a significant discrepancy in the rates of suspensions and expulsions
for greater than 10 days in a school year of children with IEPs) divided by the (# of districts in the State)]
times 100.
Include State’s definition of “significant discrepancy.”
Overview of Issue/Description of System or Process:
The State defines significant discrepancy as LEAs with rate ratios of 2.5 or greater for any racial/ethnic group with two or more students with disabilities experiencing suspension or expulsion of more than 10 days in a school year. That is, a district has a significant discrepancy when the ratio comparing its suspension/expulsion rate for students with disabilities from a racial/ethnic group to the State-level suspension/expulsion rate for all students with disabilities is 2.5 or greater. TDOE utilizes a rate ratio calculation methodology for each district in the State that meets “n” size requirements. A district meets
minimum “n” size if 2 or more students are suspended/expelled for greater than 10 days. The number of district’s excluded based on “n” size is reported below.
Comparing rates of all district’s, those identified as significantly discrepant (rate ratio of 2.5 or greater) are required to review their policies, procedures, and practices via a self-assessment. The purpose of the review is to determine if any policy, procedure, or practice is contributing to the identified significant discrepancy. If determined that any of these are contributors, revision is required. TDOE ensures that required revisions are in place via review of revised documents as well as follow up with district staff associated with those revisions.
In analyzing data for this indicator TDOE used data collected for Table 5 of Information Collection 1820-0621 for the school year 2011-2012. Definition of Significant Discrepancy and Identification of Comparison Methodology (see “Overview” above)
Part B APR FFY 2012 Tennessee
February 3, 2014 16
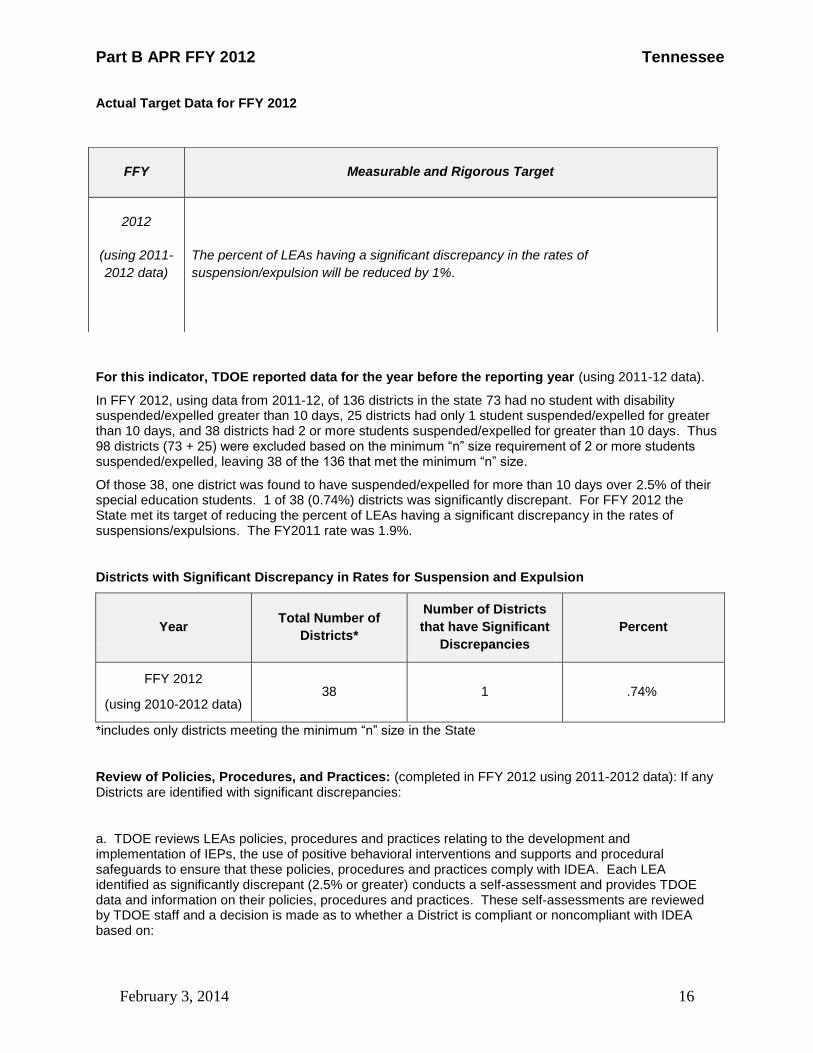
Actual Target Data for FFY 2012
For this indicator, TDOE reported data for the year before the reporting year (using 2011-12 data).
In FFY 2012, using data from 2011-12, of 136 districts in the state 73 had no student with disability suspended/expelled greater than 10 days, 25 districts had only 1 student suspended/expelled for greater than 10 days, and 38 districts had 2 or more students suspended/expelled for greater than 10 days. Thus 98 districts (73 + 25) were excluded based on the minimum “n” size requirement of 2 or more students suspended/expelled, leaving 38 of the 136 that met the minimum “n” size.
Of those 38, one district was found to have suspended/expelled for more than 10 days over 2.5% of their special education students. 1 of 38 (0.74%) districts was significantly discrepant. For FFY 2012 the State met its target of reducing the percent of LEAs having a significant discrepancy in the rates of suspensions/expulsions. The FY2011 rate was 1.9%.
Districts with Significant Discrepancy in Rates for Suspension and Expulsion
Year Total Number of
Districts*
Number of Districts
that have Significant
Discrepancies
Percent
FFY 2012
(using 2010-2012 data) 38 1 .74%
*includes only districts meeting the minimum “n” size in the State
Review of Policies, Procedures, and Practices: (completed in FFY 2012 using 2011-2012 data): If any Districts are identified with significant discrepancies:
a. TDOE reviews LEAs policies, procedures and practices relating to the development and implementation of IEPs, the use of positive behavioral interventions and supports and procedural safeguards to ensure that these policies, procedures and practices comply with IDEA. Each LEA identified as significantly discrepant (2.5% or greater) conducts a self-assessment and provides TDOE data and information on their policies, procedures and practices. These self-assessments are reviewed by TDOE staff and a decision is made as to whether a District is compliant or noncompliant with IDEA based on:
FFY Measurable and Rigorous Target
2012
(using 2011-
2012 data)
The percent of LEAs having a significant discrepancy in the rates of
suspension/expulsion will be reduced by 1%.
Part B APR FFY 2012 Tennessee
February 3, 2014 17
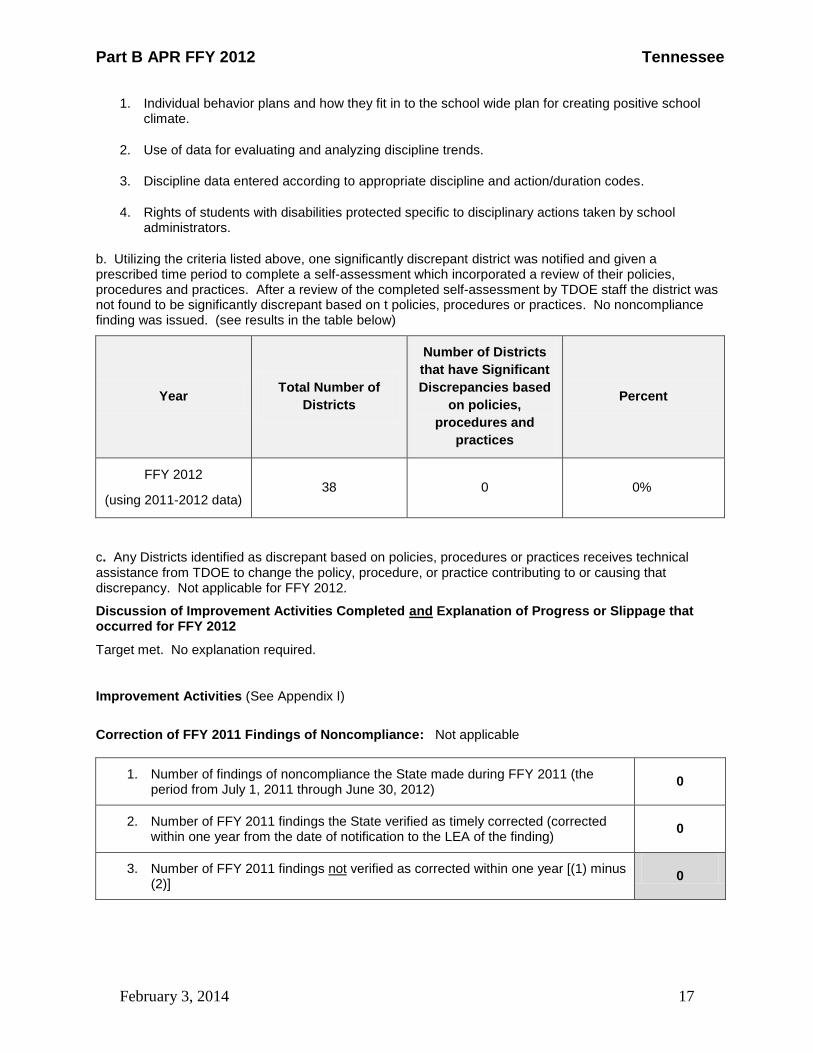
1. Individual behavior plans and how they fit in to the school wide plan for creating positive school climate.
2. Use of data for evaluating and analyzing discipline trends.
3. Discipline data entered according to appropriate discipline and action/duration codes.
4. Rights of students with disabilities protected specific to disciplinary actions taken by school administrators.
b. Utilizing the criteria listed above, one significantly discrepant district was notified and given a prescribed time period to complete a self-assessment which incorporated a review of their policies, procedures and practices. After a review of the completed self-assessment by TDOE staff the district was not found to be significantly discrepant based on t policies, procedures or practices. No noncompliance finding was issued. (see results in the table below)
Year Total Number of
Districts
Number of Districts
that have Significant
Discrepancies based
on policies,
procedures and
practices
Percent
FFY 2012
(using 2011-2012 data) 38 0 0%
c. Any Districts identified as discrepant based on policies, procedures or practices receives technical assistance from TDOE to change the policy, procedure, or practice contributing to or causing that discrepancy. Not applicable for FFY 2012.
Discussion of Improvement Activities Completed and Explanation of Progress or Slippage that occurred for FFY 2012
Target met. No explanation required.
Improvement Activities (See Appendix I)
Correction of FFY 2011 Findings of Noncompliance: Not applicable
1. Number of findings of noncompliance the State made during FFY 2011 (the period from July 1, 2011 through June 30, 2012)
0
2. Number of FFY 2011 findings the State verified as timely corrected (corrected within one year from the date of notification to the LEA of the finding)
0
3. Number of FFY 2011 findings not verified as corrected within one year [(1) minus (2)]
0

Part B APR FFY 2012 Tennessee
February 3, 2014 18
Correction of FFY 2011 Findings of Noncompliance Not Timely Corrected (corrected more than one year from identification of the noncompliance):
4. Number of FFY 2011 findings not timely corrected (same as the number from (3) above)
0
5. Number of FFY 2011 findings the State has verified as corrected beyond the one-year timeline (“subsequent correction”)
0
6. Number of FFY 2011 findings not yet verified as corrected [(4) minus (5)]
Actions Taken if Noncompliance Not Corrected: NOT APPLICABLE Verification of Correction (either timely or subsequent): NOT APPLICABLE
Describe the specific actions that the State took to verify the correction of findings of noncompliance identified in FFY 2011: NOT APPLICABLE
Correction of Remaining FFY 2010 Findings of Noncompliance (if applicable): NOT APPLICABLE For FFY 2010 findings for which the State has not yet verified correction, explain what the State has done to identify the root cause(s) of continuing noncompliance, and what the State is doing about the continued lack of compliance, including, as appropriate, enforcement actions taken against an LEA that continues to show noncompliance.
1. Number of remaining FFY 2010 findings noted in OSEP’s July 1, 2013 FFY 2011 APR response table for this indicator
0
2. Number of remaining FFY 2010 findings the State has verified as corrected 0
3. Number of remaining FFY 2010 findings the State has not verified as corrected [(1) minus (2)]
0
Correction of Any Remaining Findings of Noncompliance from FFY 2009 or Earlier (if applicable): Provide information regarding correction using the same Table format provided above. NOT APPLICABLE

Part B APR FFY 2012 Tennessee
February 3, 2014 19
Additional Information Required by the OSEP APR Response Table for this Indicator (if applicable): NOT APPLICABLE
Statement from the Response Table State’s Response
None None
Revisions, with Justification, to Proposed Targets (see SPP) / Improvement Activities / Timelines / Resources for FFY 2012 (if applicable):
Activities Timeline Resource
None

Part B APR FFY 2012 Tennessee
February 3, 2014 20
Part B State Annual Performance Report (APR) for FFY 2012
Overview of the Annual Performance Report Development: See page 3
Monitoring Priority: FAPE in the LRE
INDICATOR 4B: Rates of suspension and expulsion:
Percent of districts that have: (a) a significant discrepancy, by race or ethnicity, in the rate of suspensions and expulsions of greater than 10 days in a school year for children with IEPs; and (b) policies, procedures or practices that contribute to the significant discrepancy and do not comply with requirements relating to the development and implementation of IEPs, the use of positive behavioral interventions and supports and procedural safeguards.
(20 U.S.C. 1416(a)(3)(A); 1412(a)(22))
Measurement:
Percent = [(# of districts that have: (a) a significant discrepancy by race or ethnicity in the rates of
suspensions and expulsions of greater than 10 days in a school year of children with IEPs; and
(b) policies, procedures or practices that contribute to the significant discrepancy and do not comply with
requirements relating to the development and implementation of IEPs, the use of positive behavioral
interventions and supports and procedural safeguards) divided by the (# of districts in the State)] times
100.
Include State’s definition of “significant discrepancy.”
Overview of Issue/Description of System or Process:
The State defines significant discrepancy as LEAs with rate ratios of 2.0 or greater for any racial/ethnic group with two or more students with disabilities experiencing suspension or expulsion of more than 10 days in a school year. That is, a district has a significant discrepancy when the ratio comparing its suspension/expulsion rate for students with disabilities from a racial/ethnic group to the State-level suspension/expulsion rate for all students with disabilities is 2.0 or greater. TDOE utilizes a rate ratio calculation methodology for each district in the State, which meets “n” size requirements.
* A minimum “n” size of 2 or more students suspended/expelled for greater than ten days within each race/ethnicity group within the district. The number of district’s excluded based on “n” size is reported below.
Comparing rates of all districts, those identified as significantly discrepant are required to review their policies, procedures, and practices via self-assessment. The purpose of the review is to determine if any policy, procedure, or practice in place is contributing to the identified significant discrepancy. If determined that any of these are contributors, revision is required. TDOE ensures that required revisions are in place via review of revised documents as well as interview of district staff associated with those revisions.
In analyzing data for this indicator TDOE used data collected for Table 5 of Information Collection 1820-0621 for the school year 2011-2012. No sampling of 618 data occurred.

Part B APR FFY 2012 Tennessee
February 3, 2014 21
Definition of Significant Discrepancy and Methodology
The rate ratio calculation requires first establishing the statewide percentage of students with disabilities suspended or expelled for greater than 10 days. Then a two-step process is used to determine the rate ratio for each racial/ethnic group within each district. The two calculations used are:
# SWD suspended/expelled > 10 days from specific race/ethnic group from specific LEA # SWD from specific race/ethnic group from specific LEA
The calculation above generates the percentage of SWD suspended/expelled from each race/ethnic group for each district. Then the rate ratio is generated using the above and the state average with the following calculation:
LEA level s/e rate for each specific race/ethnicity (above results) Statewide average
For any race/ethnic category with a rate ratio of 2.0 or greater, that LEA was flagged for significant discrepancy and required to review associated policies, procedures, and practices. Note that for indicator 4B TDOE uses a minimum “n” size of 2 or more in the numerator (2 or more students within a specific race/ethnic group within the LEA have been suspended/ expelled for greater than 10 days in a school year). This assures small LEAs with only one student suspended/expelled for greater than 10 days, will not be subjected to repeated annual reviews of their policies, procedures and practices resulting from just one student’s suspension or expulsion.
Actual Target Data FFY 2012 (using 2011-2012 data)
Results of State examination of data:
In FFY 2012 one district had one or more significantly discrepant race/ethnic groups with a rate ratio over 2.0 compared to 8 districts in FFY 2011. TDOE saw an overall decrease in the rates of suspensions/expulsions greater than 10 days in many districts across the state. These changes may be attributed to TDOE’s efforts to a) make districts more cognizant of discipline alternatives, b) support more PBIS initiatives, c) fund discretionary grants targeting reductions in suspensions, and d) requiring that districts previously found significantly discrepant spend internal staff time reviewing their policies, procedures, and practices which further increases local district awareness.
FFY Measurable and Rigorous Target
2012
(using 2011-2012 data)
0%
Part B APR FFY 2012 Tennessee
February 3, 2014 22
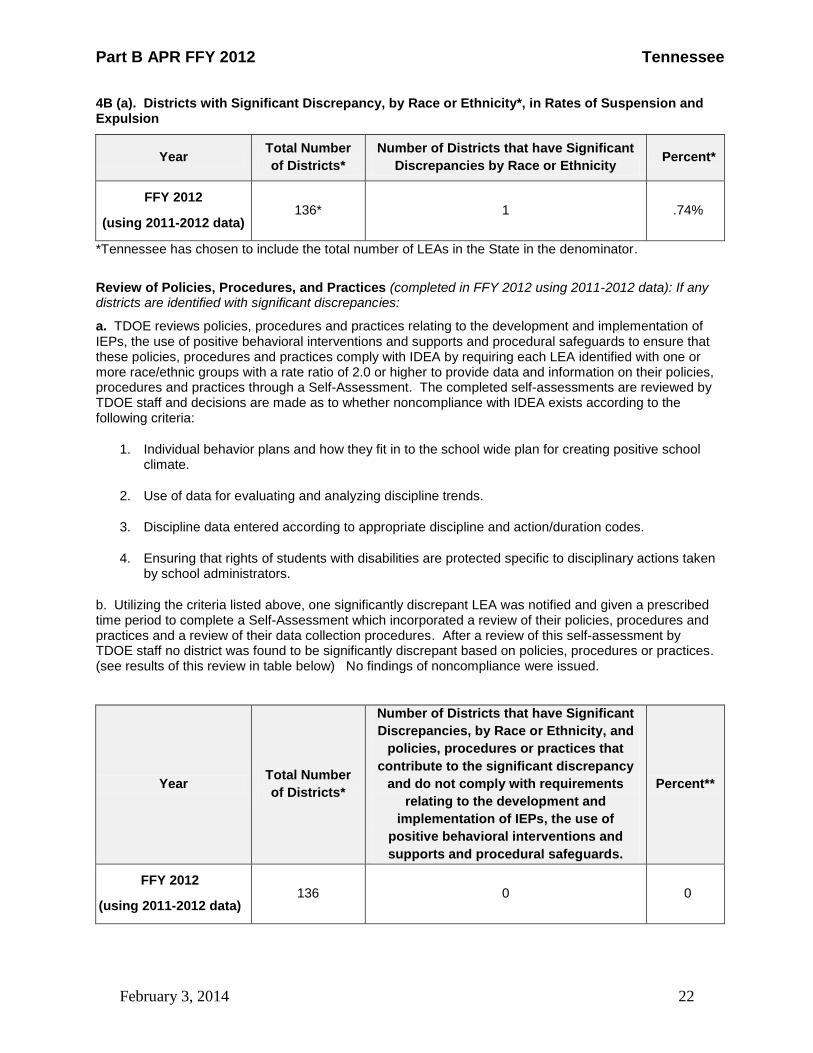
4B (a). Districts with Significant Discrepancy, by Race or Ethnicity*, in Rates of Suspension and Expulsion
Year Total Number
of Districts*
Number of Districts that have Significant
Discrepancies by Race or Ethnicity Percent*
FFY 2012
(using 2011-2012 data) 136* 1 .74%
*Tennessee has chosen to include the total number of LEAs in the State in the denominator.
Review of Policies, Procedures, and Practices (completed in FFY 2012 using 2011-2012 data): If any districts are identified with significant discrepancies:
a. TDOE reviews policies, procedures and practices relating to the development and implementation of IEPs, the use of positive behavioral interventions and supports and procedural safeguards to ensure that these policies, procedures and practices comply with IDEA by requiring each LEA identified with one or more race/ethnic groups with a rate ratio of 2.0 or higher to provide data and information on their policies, procedures and practices through a Self-Assessment. The completed self-assessments are reviewed by TDOE staff and decisions are made as to whether noncompliance with IDEA exists according to the following criteria:
1. Individual behavior plans and how they fit in to the school wide plan for creating positive school climate.
2. Use of data for evaluating and analyzing discipline trends.
3. Discipline data entered according to appropriate discipline and action/duration codes.
4. Ensuring that rights of students with disabilities are protected specific to disciplinary actions taken by school administrators.
b. Utilizing the criteria listed above, one significantly discrepant LEA was notified and given a prescribed time period to complete a Self-Assessment which incorporated a review of their policies, procedures and practices and a review of their data collection procedures. After a review of this self-assessment by TDOE staff no district was found to be significantly discrepant based on policies, procedures or practices. (see results of this review in table below) No findings of noncompliance were issued.
Year Total Number
of Districts*
Number of Districts that have Significant
Discrepancies, by Race or Ethnicity, and
policies, procedures or practices that
contribute to the significant discrepancy
and do not comply with requirements
relating to the development and
implementation of IEPs, the use of
positive behavioral interventions and
supports and procedural safeguards.
Percent**
FFY 2012
(using 2011-2012 data) 136 0 0

Part B APR FFY 2012 Tennessee
February 3, 2014 23
c. Any Districts identified as discrepant based on policies, procedures or practices receives technical assistance from TDOE in changing the policy, procedure, or practice contributing to or causing that discrepancy. Not applicable for FFY 2012..
Discussion of Improvement Activities Completed and Explanation of Progress or Slippage that occurred in FFY 2012:
Target met. No explanation required. Improvement Activities (see Appendix I) Correction of FFY 2011 Findings of Noncompliance: Not applicable
1. Number of findings of noncompliance the State made during FFY 2011 (the period from July 1, 2011 through June 30, 2012)
0
2. Number of FFY 2011 findings the State verified as timely corrected (corrected within one year from the date of notification to the LEA of the finding)
0
3. Number of FFY 2011 findings not verified as corrected within one year [(1) minus (2)]
0
Correction of FFY 2011 Findings of Noncompliance Not Timely Corrected (corrected more than one year from identification of the noncompliance):
4. Number of FFY 2011 findings not timely corrected (same as the number from (3) above)
0
5. Number of FFY 2011 findings the State has verified as corrected beyond the one-year timeline (“subsequent correction”)
0
6. Number of FFY 2011 findings not yet verified as corrected [(4) minus (5)] 0
Actions Taken if Noncompliance Not Corrected: NOT APPLICABLE Verification of Correction (either timely or subsequent): NOT APPLICABLE Describe the specific actions that the State took to verify the correction of findings of noncompliance identified in FFY 2011: NOT APPLICABLE Correction of Remaining FFY 2010 Findings of Noncompliance (if applicable): NOT APPLICABLE
1. Number of remaining FFY 2010 findings noted in OSEP’s July 1, 2013 FFY 2011 APR response table for this indicator
0
2. Number of remaining FFY 2010 findings the State has verified as corrected 0
3. Number of remaining FFY 2010 findings the State has not verified as corrected [(1) minus (2)]
0
Part B APR FFY 2012 Tennessee
February 3, 2014 24
Correction of Any Remaining Findings of Noncompliance from FFY 2009 or Earlier (if applicable): Provide information regarding correction using the same Table format provided above. NOT APPLICABLE Additional Information Required by the OSEP APR Response Table for this Indicator (if applicable): NOT APPLICABLE
Statement from the Response Table State’s Response
None None
Revisions, with Justification, to Proposed Targets (see SPP) / Improvement Activities / Timelines / Resources for FFY 2012 (if applicable):
Activities Timeline Resource
None
Part B APR FFY 2012 Tennessee
February 3, 2014 25
Part B State Annual Performance Report (APR) for FFY 2012
Overview of the Annual Performance Report Development: See page 3
Monitoring Priority: FAPE in the LRE
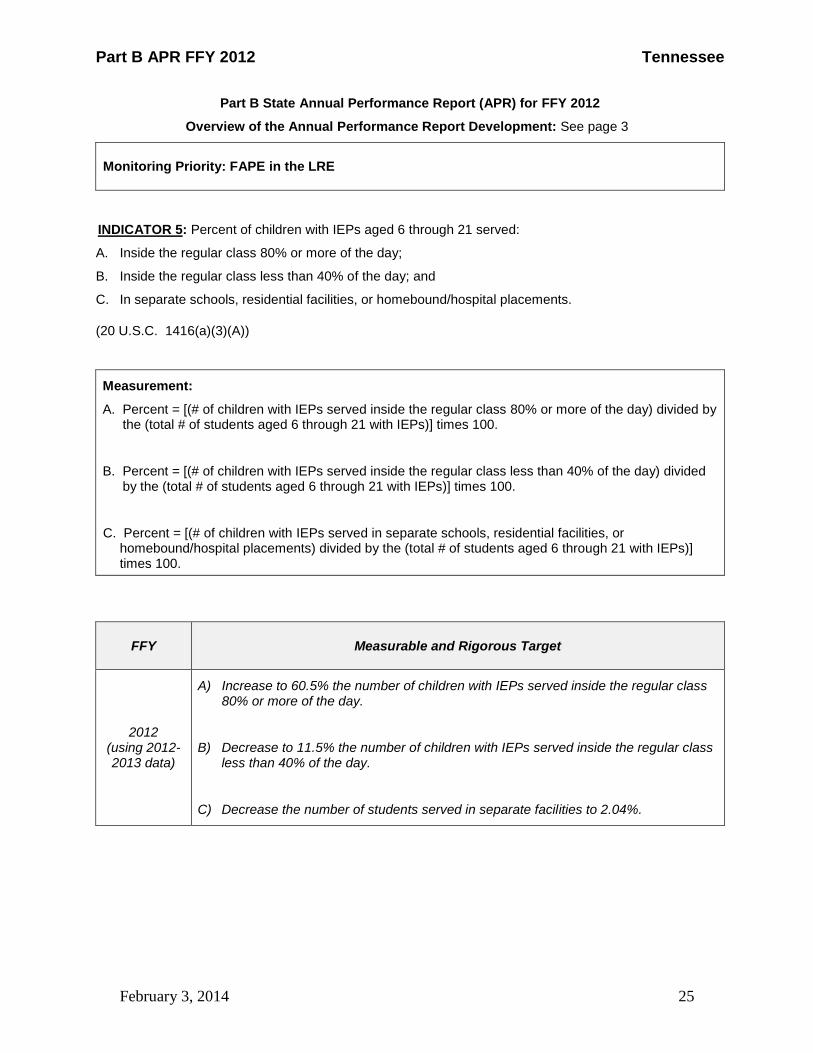
INDICATOR 5: Percent of children with IEPs aged 6 through 21 served:
A. Inside the regular class 80% or more of the day;
B. Inside the regular class less than 40% of the day; and
C. In separate schools, residential facilities, or homebound/hospital placements.
(20 U.S.C. 1416(a)(3)(A))
Measurement:
A. Percent = [(# of children with IEPs served inside the regular class 80% or more of the day) divided by the (total # of students aged 6 through 21 with IEPs)] times 100.
B. Percent = [(# of children with IEPs served inside the regular class less than 40% of the day) divided by the (total # of students aged 6 through 21 with IEPs)] times 100.
C. Percent = [(# of children with IEPs served in separate schools, residential facilities, or homebound/hospital placements) divided by the (total # of students aged 6 through 21 with IEPs)] times 100.
FFY Measurable and Rigorous Target
2012 (using 2012-2013 data)
A) Increase to 60.5% the number of children with IEPs served inside the regular class 80% or more of the day.
B) Decrease to 11.5% the number of children with IEPs served inside the regular class less than 40% of the day.
C) Decrease the number of students served in separate facilities to 2.04%.
Part B APR FFY 2012 Tennessee
February 3, 2014 26
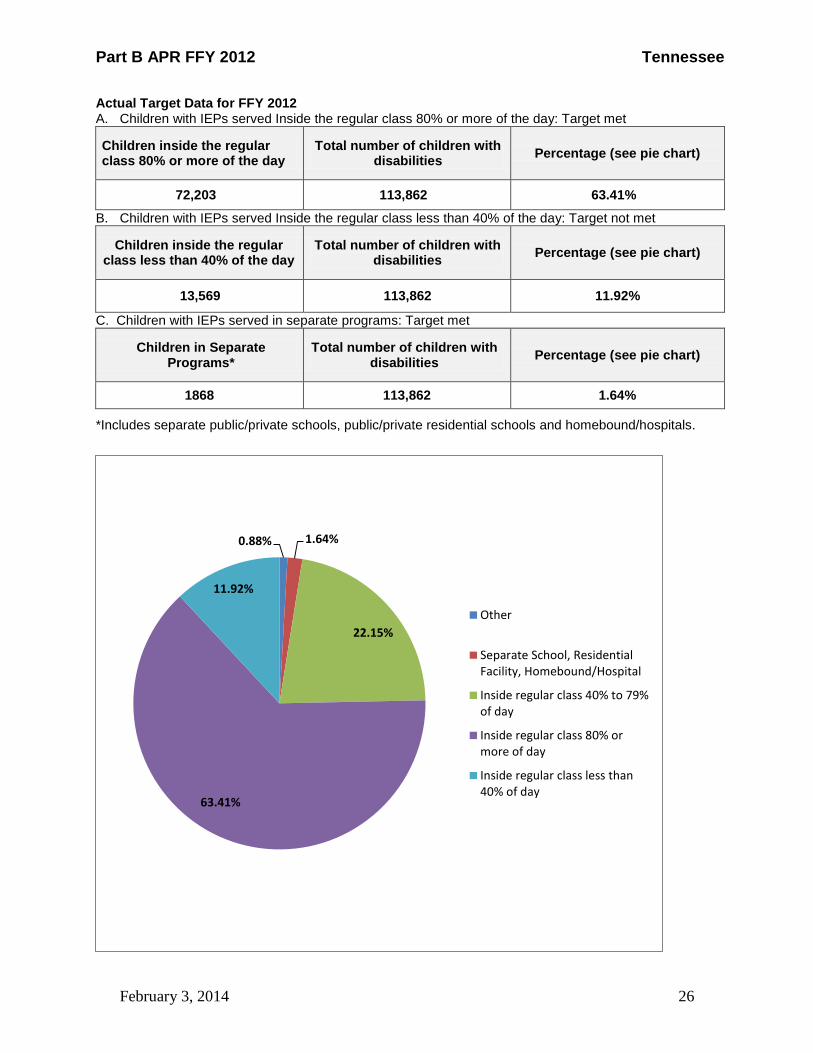
Actual Target Data for FFY 2012 A. Children with IEPs served Inside the regular class 80% or more of the day: Target met
Children inside the regular class 80% or more of the day
Total number of children with disabilities
Percentage (see pie chart)
72,203 113,862 63.41%
B. Children with IEPs served Inside the regular class less than 40% of the day: Target not met
Children inside the regular class less than 40% of the day
Total number of children with disabilities
Percentage (see pie chart)
13,569 113,862 11.92%
C. Children with IEPs served in separate programs: Target met
Children in Separate Programs*
Total number of children with disabilities
Percentage (see pie chart)
1868 113,862 1.64%
*Includes separate public/private schools, public/private residential schools and homebound/hospitals.
0.88% 1.64%
22.15%
63.41%
11.92%
Other
Separate School, ResidentialFacility, Homebound/Hospital
Inside regular class 40% to 79%of day
Inside regular class 80% ormore of day
Inside regular class less than40% of day
Part B APR FFY 2012 Tennessee
February 3, 2014 27
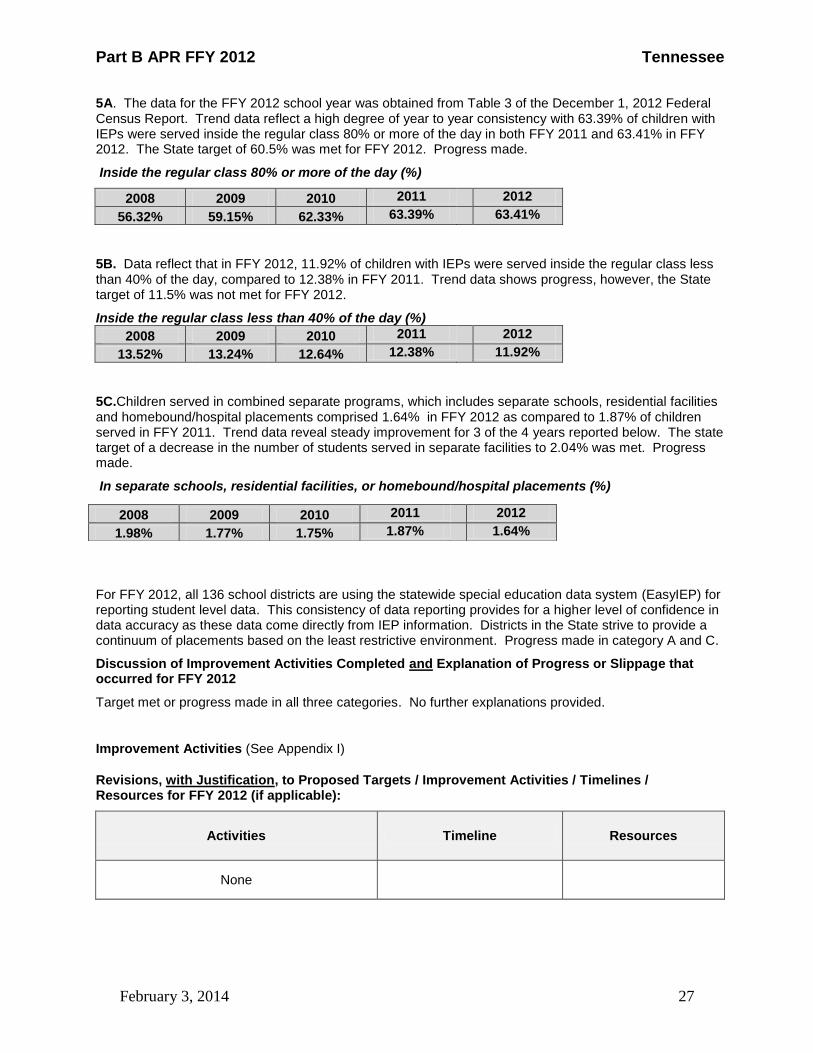
5A. The data for the FFY 2012 school year was obtained from Table 3 of the December 1, 2012 Federal Census Report. Trend data reflect a high degree of year to year consistency with 63.39% of children with IEPs were served inside the regular class 80% or more of the day in both FFY 2011 and 63.41% in FFY 2012. The State target of 60.5% was met for FFY 2012. Progress made.
Inside the regular class 80% or more of the day (%)
2008 2009 2010 2011
2012
56.32% 59.15% 62.33% 63.39%
63.41%
5B. Data reflect that in FFY 2012, 11.92% of children with IEPs were served inside the regular class less than 40% of the day, compared to 12.38% in FFY 2011. Trend data shows progress, however, the State target of 11.5% was not met for FFY 2012.
Inside the regular class less than 40% of the day (%)
2008 2009 2010 2011
2012
13.52% 13.24% 12.64% 12.38%
11.92%
5C.Children served in combined separate programs, which includes separate schools, residential facilities and homebound/hospital placements comprised 1.64% in FFY 2012 as compared to 1.87% of children served in FFY 2011. Trend data reveal steady improvement for 3 of the 4 years reported below. The state target of a decrease in the number of students served in separate facilities to 2.04% was met. Progress made.
In separate schools, residential facilities, or homebound/hospital placements (%)
For FFY 2012, all 136 school districts are using the statewide special education data system (EasyIEP) for reporting student level data. This consistency of data reporting provides for a higher level of confidence in data accuracy as these data come directly from IEP information. Districts in the State strive to provide a continuum of placements based on the least restrictive environment. Progress made in category A and C.
Discussion of Improvement Activities Completed and Explanation of Progress or Slippage that occurred for FFY 2012
Target met or progress made in all three categories. No further explanations provided.
Improvement Activities (See Appendix I)
Revisions, with Justification, to Proposed Targets / Improvement Activities / Timelines / Resources for FFY 2012 (if applicable):
Activities Timeline Resources
None
2008 2009 2010 2011
2012
1.98% 1.77% 1.75% 1.87%
1.64%

Part B APR FFY 2012 Tennessee
February 3, 2014 28
Part B State Annual Performance Report (APR) for FFY 2012
Overview of the Annual Performance Report Development: See page 3
Monitoring Priority: FAPE in the LRE
INDICATOR 6: PERCENT OF CHILDREN AGED 3 THROUGH 5 WITH IEPS ATTENDING A:
A. Regular early childhood program and receiving the majority of special education and related services in the regular early childhood program; and
B. Separate special education class, separate school or residential facility.
(20 U.S.C. 1416(a)(3)(A
Measurement:
A. Percent = [(# of children aged 3 through 5 with IEPs attending a regular early childhood program and receiving the majority of special education and related services in the regular early childhood program) divided by the (total # of children aged 3 through 5 with IEPs)] times 100.
8.7% = 1,141 divided by 13,067 times 100
B. Percent = [(# of children aged 3 through 5 with IEPs attending a separate special education class, separate school or residential facility) divided by the (total # of children aged 3 through 5 with IEPs)] times 100.
13.8% = (1,670 + 133 + 0) divided by 13,067 times 100
Overview of Issue/Description of System or Process:
The Tennessee Department of Education (TDOE) collects and analyzes educational environment data and reports these data on the 618 Annual Report of Children, Table 3: Educational Environments Preschool (3-5). These same data, reported in this indicator, are collected locally and entered into the Part B data system (Easy IEP) used by all Local Education Agencies (LEAs). On December 1, 2012, LEAs in Tennessee provided services to 13,067 children ages three through five with disabilities. These services were provided through a continuum of education environment options. The inclusion of children receiving special education services with typically developing peers is emphasized by TDOE in trainings, technical assistance, and conferences. As part of the continuum of options for children ages three through five with disabilities, LEAs in Tennessee administered 434 IDEA 619 preschool classrooms during FFY 2012. The classroom settings include self-contained environments, blended programs, and reverse inclusion. In addition preschool aged students with disabilities were served in separate schools, home, service provider locations and regular early childhood programs.
Part B APR FFY 2012 Tennessee
February 3, 2014 29
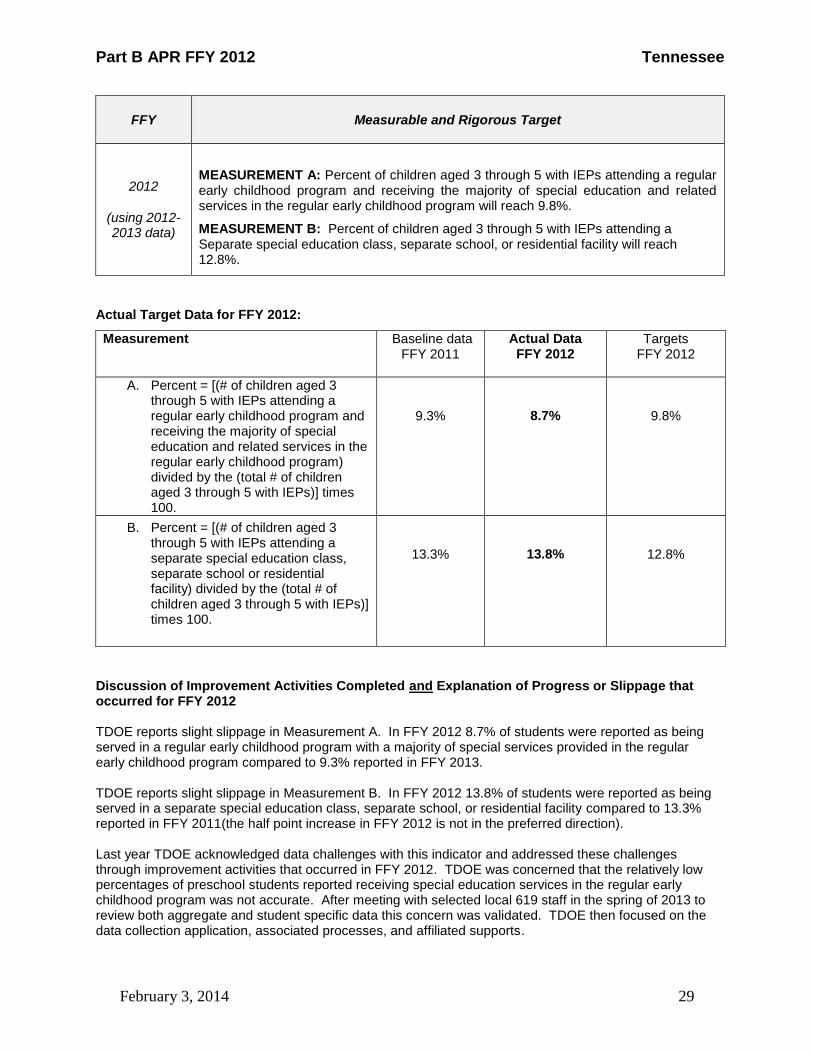
FFY Measurable and Rigorous Target
2012
(using 2012-2013 data)
MEASUREMENT A: Percent of children aged 3 through 5 with IEPs attending a regular early childhood program and receiving the majority of special education and related services in the regular early childhood program will reach 9.8%.
MEASUREMENT B: Percent of children aged 3 through 5 with IEPs attending a Separate special education class, separate school, or residential facility will reach 12.8%.
Actual Target Data for FFY 2012:
Measurement Baseline data FFY 2011
Actual Data FFY 2012
Targets FFY 2012
A. Percent = [(# of children aged 3 through 5 with IEPs attending a regular early childhood program and receiving the majority of special education and related services in the regular early childhood program) divided by the (total # of children aged 3 through 5 with IEPs)] times 100.
9.3%
8.7%
9.8%
B. Percent = [(# of children aged 3 through 5 with IEPs attending a separate special education class, separate school or residential facility) divided by the (total # of children aged 3 through 5 with IEPs)] times 100.
13.3%
13.8%
12.8%
Discussion of Improvement Activities Completed and Explanation of Progress or Slippage that occurred for FFY 2012 TDOE reports slight slippage in Measurement A. In FFY 2012 8.7% of students were reported as being served in a regular early childhood program with a majority of special services provided in the regular early childhood program compared to 9.3% reported in FFY 2013. TDOE reports slight slippage in Measurement B. In FFY 2012 13.8% of students were reported as being served in a separate special education class, separate school, or residential facility compared to 13.3% reported in FFY 2011(the half point increase in FFY 2012 is not in the preferred direction). Last year TDOE acknowledged data challenges with this indicator and addressed these challenges through improvement activities that occurred in FFY 2012. TDOE was concerned that the relatively low percentages of preschool students reported receiving special education services in the regular early childhood program was not accurate. After meeting with selected local 619 staff in the spring of 2013 to review both aggregate and student specific data this concern was validated. TDOE then focused on the data collection application, associated processes, and affiliated supports.

Part B APR FFY 2012 Tennessee
February 3, 2014 30
During FFY 2012 TDOE worked with the data application vendor to redesign, develop, and improve the collection process so valid and reliable data would be collected. During the FFY 2012 data application redesign effort, TDOE accessed and utilized the following resources to inform the improved data collection process: ECTA staff, external LEA stakeholders, data consultant, vendor, and 619 staff from other states. The data application design and development occurred during FFY 2012; however the actual implementation of the redesigned data collection commenced in FFY 2013 with the first updated educational environments data being collected in the fall of 2013. Therefore, as reported in the FFY 2011 SPP: TDOE has identified necessary steps reflected in the improvement activities for FFY 2012 to address data collection and reporting. TDOE anticipates that these improvements will be reflected in the data reported for FFY 2013. As changes to the data collection process will provide more accurate education environments data TDOE will continue to evaluate and if necessary reset targets based on improved data. In addition to the changes in the data application and collection process, TDOE 619 staff conducted focus groups across the state and at statewide conferences to inform local agency staff about upcoming changes to the preschool education environment data collection process and the importance of the data being collected. 619 staff created informative support materials for local agency staff to augment these upcoming trainings which will be available via the updated data application. Support documents include: FAQs, step-by-step instructions, scenario descriptions, a TDOE-specific decision tree (based off the ECTA decision tree), improved education environment descriptions, and a tutorial series (still under development). The effects of the FFY 2012 data collection improvements and extensive training will only begin to be seen in FFY 2013. The final changes to the application will be implemented in FFY2013. All of the education environment data in the database for FFY 2013 will not be updated until on or after December 5, 2013. However, TDOE plans to measure the effectiveness of the data application changes by accessing and reviewing the updated educational environments data during the spring of 2014. By comparing the data pre and post of the application update, TDOE can confirm the effect of the upgrades and may consider updating targets in the future.
Improvement Activities (See Appendix I)
Additional Information Required by the OSEP APR Response Table for this Indicator (if applicable):
Statement from the Response Table State’s Response
“Provide an explanation of why valid and reliable data are not yet available and description of
actions being taken to collect and report valid and reliable data”.
See revision of SPP Indicator # 6 attached with this submission.
Revisions, with Justification, to Proposed Targets / Improvement Activities / Timelines / Resources for FFY 2012 (if applicable):
Activities Timeline Resources
None
Part B APR FFY 2012 Tennessee
February 3, 2014 31
Part B State Annual Performance Report (APR) for FFY 2012
Overview of the Annual Performance Report Development: See page 3
Monitoring Priority: FAPE in the LRE
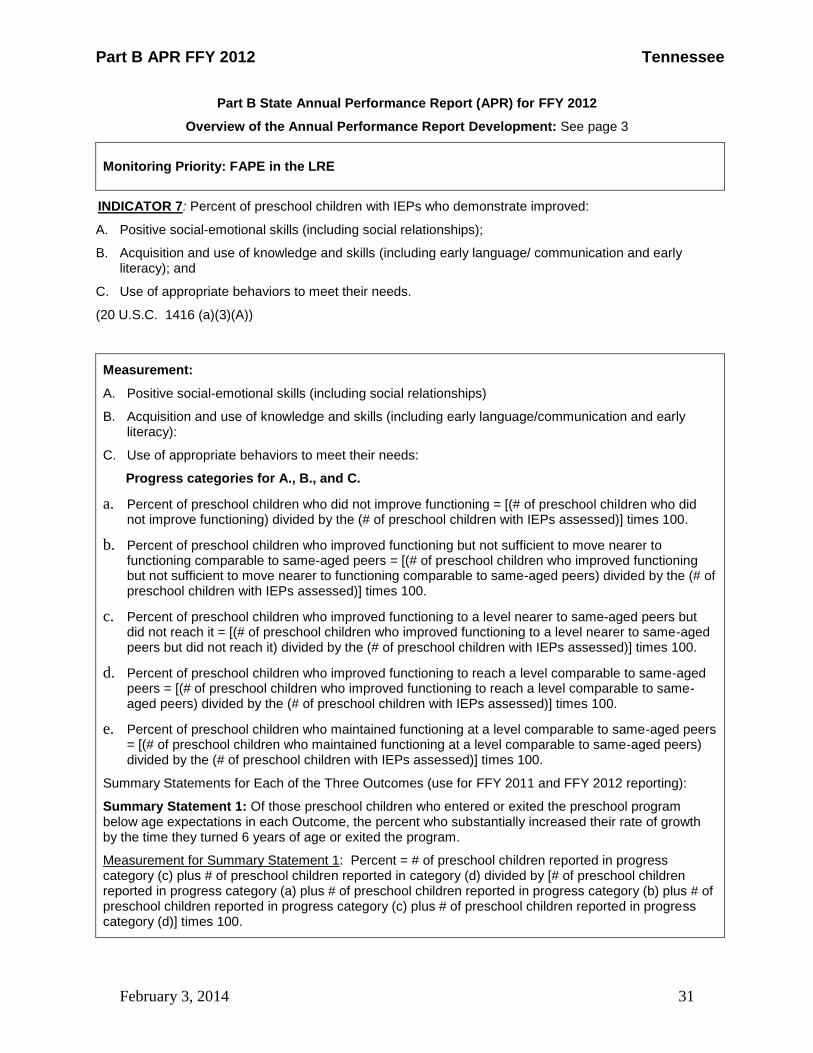
INDICATOR 7: Percent of preschool children with IEPs who demonstrate improved:
A. Positive social-emotional skills (including social relationships);
B. Acquisition and use of knowledge and skills (including early language/ communication and early literacy); and
C. Use of appropriate behaviors to meet their needs.
(20 U.S.C. 1416 (a)(3)(A))
Measurement:
A. Positive social-emotional skills (including social relationships)
B. Acquisition and use of knowledge and skills (including early language/communication and early literacy):
C. Use of appropriate behaviors to meet their needs:
Progress categories for A., B., and C.
a. Percent of preschool children who did not improve functioning = [(# of preschool children who did not improve functioning) divided by the (# of preschool children with IEPs assessed)] times 100.
b. Percent of preschool children who improved functioning but not sufficient to move nearer to functioning comparable to same-aged peers = [(# of preschool children who improved functioning but not sufficient to move nearer to functioning comparable to same-aged peers) divided by the (# of preschool children with IEPs assessed)] times 100.
c. Percent of preschool children who improved functioning to a level nearer to same-aged peers but did not reach it = [(# of preschool children who improved functioning to a level nearer to same-aged peers but did not reach it) divided by the (# of preschool children with IEPs assessed)] times 100.
d. Percent of preschool children who improved functioning to reach a level comparable to same-aged peers = [(# of preschool children who improved functioning to reach a level comparable to same-aged peers) divided by the (# of preschool children with IEPs assessed)] times 100.
e. Percent of preschool children who maintained functioning at a level comparable to same-aged peers = [(# of preschool children who maintained functioning at a level comparable to same-aged peers) divided by the (# of preschool children with IEPs assessed)] times 100.
Summary Statements for Each of the Three Outcomes (use for FFY 2011 and FFY 2012 reporting):
Summary Statement 1: Of those preschool children who entered or exited the preschool program below age expectations in each Outcome, the percent who substantially increased their rate of growth by the time they turned 6 years of age or exited the program.
Measurement for Summary Statement 1: Percent = # of preschool children reported in progress category (c) plus # of preschool children reported in category (d) divided by [# of preschool children reported in progress category (a) plus # of preschool children reported in progress category (b) plus # of preschool children reported in progress category (c) plus # of preschool children reported in progress category (d)] times 100.

Part B APR FFY 2012 Tennessee
February 3, 2014 32
Summary Statement 2: The percent of preschool children who were functioning within age expectations in each Outcome by the time they turned 6 years of age or exited the program.
Measurement for Summary Statement 2: Percent = # of preschool children reported in progress category (d) plus [# of preschool children reported in progress category (e) divided by the total # of preschool children reported in progress categories (a) + (b) + (c) + (d) + (e)] times 100.
Measurable and Rigorous Targets
Summary Statements
Actual FFY 2011 (% of children)
Actual FFY 2012 (% of children)
Targets FFY 2012
(% of children)
Outcome A: Positive social-emotional skills (including social relationships)
1. Of those children who entered or exited the program below age-expectations in Outcome A, the percent who substantially increased their rate of growth by the time they exited the program.
90.0% 88.0% 92.7%
2. The percent of children who were functioning within age-expectations in Outcome A by the time they exited the program.
59.5% 57.8% 58.4%
Outcome B: Acquisition and use of knowledge and skills (including early language/ communication and early literacy):
1. Of those children who entered or exited the program below age-expectations in Outcome B, the percent who substantially increased their rate of growth by the time they exited the program.
88.9% 87.0% 90.5%
2. The percent of children who were functioning within age-expectations in Outcome B by the time they exited the program.
56.9% 55.5% 56.7%
Outcome C: Use of appropriate behaviors to meet their needs
1. Of those children who entered or exited the program below age-expectations in Outcome C, the percent who substantially increased their rate of growth by the time they exited the program.
89.6% 88.6% 93.6%
2. The percent of children who were functioning within age-expectations in Outcome C by the time they exited the program.
69.2% 68.3% 69.0%

Part B APR FFY 2012 Tennessee
February 3, 2014 33
Actual Target (progress) Data for Preschool Children FFY 2012
A. Positive social-emotional skills (including social relationships):
Actual FFY 2012-2013 (# and % of children)
Actual FFY 2011-2012 (# and % of children)
a. Percent of children who did not improve functioning. 28 0.6% 36 0.9%
b. Percent of children who improved functioning, but not sufficient to move nearer to functioning comparable to same-aged peers.
467 9.4% 293 7.4%
c. Percent of children who improved functioning to a level nearer to same-aged peers, but did not reach it.
1,599 32.2% 1,269 32.2%
d. Percent of children who improved functioning to reach a level comparable to same-aged peers.
2,031 41.0% 1,701 43.1%
e. Percent of children who maintained functioning at a level comparable to same-aged peers.
834 16.8% 645 16.4%
Total N=4,959 100% N=3,944 100%
B. Acquisition and use of knowledge and skills (including early language/communication and early literacy):
Actual FFY 2012-2013 (# and % of children)
Actual FFY 2011-2012 (# and % of children)
a. Percent of children who did not improve functioning. 30 0.6% 30 0.8%
b. Percent of children who improved functioning, but not sufficient to move nearer to functioning comparable to same-aged peers.
498 10.1% 335 8.5%
c. Percent of children who improved functioning to a level nearer to same-aged peers, but did not reach it.
1,677 33.9% 1,334 33.9%
d. Percent of children who improved functioning to reach a level comparable to same-aged peers.
1,870 37.8% 1,584 40.2%
e. Percent of children who maintained functioning at a level comparable to same-aged peers.
877 17.7% 657 16.7%
Total N=4,952 100% N=3,940 100%
C. Use of appropriate behaviors to meet their needs:
Actual FFY 2012-2013
(# and % of children)
Actual FFY 2011-2012 (# and % of children)
a. Percent of children who did not improve functioning. 30 0.6% 38 0.9%
b. Percent of children who improved functioning, but not sufficient to move nearer to functioning comparable to same-aged peers.
376 7.6% 263 6.7%
c. Percent of children who improved functioning to a level nearer to same-aged peers, but did not reach it.
1,154 23.4% 904 23.1%
d. Percent of children who improved functioning to reach a level comparable to same-aged peers.
2,004 40.7% 1,691 43.2%
e. Percent of children who maintained functioning at a level comparable to same-aged peers.
1,363 27.7% 1,021 26.1%
Total N=4,927 100% N=3,917 100%
Part B APR FFY 2012 Tennessee
February 3, 2014 34
Discussion of Summary Statements
All LEAs were required to begin entering ECO data into the State data base (Easy IEP) July 1, 2009. After analysis of the FFY 2011 ECO data, patterns and trends led Tennessee to determine that additional training of those collecting and entering the data was needed. Training was developed in conjunction with Tennessee’s Early Intervention System (TEIS – Part C) and was delivered regionally in all parts of the state in February and March 2013. Tennessee expects to see a change in patterns and trends as the quality of the data reported increases. Tennessee did not meet its targets for the Early Childhood Outcomes Summary Statements. While the perceived improvement in data quality mentioned above is positive and important, it does make comparing data reported to targets more difficult. If the quality of the previous data was not high, and if the quality of the data being reported now is increasing, then the comparison to targets set based on low quality data is questionable. Tennessee believes that the targets were based on imprecise baseline data and were set too high due to data quality issues.
Discussion of a-e Progress Data
The a-e progress data have been analyzed to compare data and determine trends from FFY 2009 thru FFY 2012. The analysis across all three outcomes reveals that the percentage of ‘a’ continues to decrease. This decrease corresponds with TDOE’s expectations as the percentage of students who did not improve functioning is anticipated to be extremely low. Another trend identified is the percentages for ‘d’ have remained the highest reported for the past four fiscal years, while the percentages for ‘c’ follow as the second highest. This also aligns with TDOE’s expectations as the percentages of students who improved functioning to a level nearer to same aged peers, but did not reach it, and percentages of students who improve functioning to reach a level comparable to same-aged peers is predicted to be the progress categories where the most growth is shown. Tennessee will continue to track data for these two progress categories statewide and at the local level to determine if the percentages correctly reflect the progress of students and what effect the regional trainings had on this trend.
In addition, the percentage of ‘b’ continues to increase across all outcomes. Tennessee is concerned as this represents the percent of children who improved but not enough to move nearer to functioning comparable to same-age peers. Tennessee will continue to monitor the percentages of this category to determine if this truly reflects accurate data or if the additional trainings change this category. Tennessee also plans to drill down these data to determine if patterns can be seen specific to LEAs, and if so, what type of technical assistance can help improve data collection and programming. The percentage of ‘e’ appears to be the most dynamic over the past four fiscal years. Initially, it showed no change or an increase but then showed a decrease before showing another increase across all outcomes. Tennessee theorizes that this will become more stable as the data collection process has been clarified. TDOE will continue to examine these data and determine if this parallels appropriate expectations for the a-e categories. TDOE recognizes a need for continued technical assistance in drawing conclusions from data, in determining the validity of state targets, in utilizing data reports to analyze data at the state and local level, and in developing data analysis training for state and local staff. Any analysis of these data must be viewed with knowledge of inconsistencies in previous data quality and expected improvement after training and technical assistance. In addition, after considering the variances of the N size between outcomes, Tennessee has identified a need to decrease the possibility of missing data. Changes are being made to the database to alert users of missing data and to require its entry. The Easy IEP ECO page has been redesigned to be more user-friendly in appearance. New validations are being added to the Easy IEP database to prevent data entry errors for ECO, to ensure complete data are entered, and to attempt to remind LEAs to collect the data at the appropriate times. Expectations are that this will further increase the quality of the data collected and reported.
Part B APR FFY 2012 Tennessee
February 3, 2014 35
Tennessee believes the quality of the data will further improve as a result of the regional trainings emphasis on both quantitative data and qualitative data.
Discussion of Improvement Activities Completed and Explanation of Progress or Slippage that occurred for FFY 2012
See discussion of Summary Statements and a-e progress data above.
Improvement Activities (See Appendix I)
Revisions, with Justification, to Proposed Targets (see SPP) / Improvement Activities / Timelines / Resources for FFY 2012 (if applicable):
Activities Timeline Resources
None
Part B APR FFY 2012 Tennessee
February 3, 2014 36
Part B State Annual Performance Report (APR) for FFY 2012
Overview of the Annual Performance Report Development: See page 3
Monitoring Priority: FAPE in the LRE
INDICATOR 8: Percent of parents with a child receiving special education services who report that schools facilitated parent involvement as a means of improving services and results for children with disabilities.
(20 U.S.C. 1416(a)(3)(A))
Measurement: Percent = [(# of respondent parents who report schools facilitated parent involvement as a means of improving services and results for children with disabilities) divided by the (total # of respondent parents of children with disabilities)] times 100.
FFY Measurable and Rigorous Target
2012 The percentage of parents reporting that the schools facilitated their involvement as a means of improving services and results for children with disabilities will be at least 97%
Actual Target Data for FFY 2012
During FFY 2012 school year, the Parent Survey (as described in the State Performance Plan) was administered to all parents of students with disabilities ages 3 through 21 in 35 LEAs selected by the OSEP approved sampling by the Division of Special Populations. The State’s three largest LEAs participate in this survey each year. In FFY 2012 a total of 26,359 surveys were distributed to parents. There were 4,821 survey responses with usable data for a response rate of 18.3%.
Item one on the survey queried parents regarding schools facilitation of parent involvement. Of the 4,821 parents responding to item one, 97.3.0% (4,692 /4,821) agreed that the schools facilitated their involvement as a means of improving services and results for children with disabilities. The State target of 97% was met.
TDOE contracts with East Tennessee State University (ETSU) to administer the survey through two different methods. The methods of soliciting parent surveys are described below:
1. Direct Email to Parents: Parents who had e-mail addresses were directly emailed and provided a URL to take the survey electronically. A letter from TDOE in both English and Spanish was attached explaining the survey. Alternatively, parents could choose to print, complete and return a hard copy of the survey to ETSU by US mail. An email was sent two additional times to remind parents to complete the survey.
2. Mailing of Survey Packets to Special Education Directors: Special Education Directors were mailed quantities of paper surveys with student name, district, school, and numeric identifier, with postage paid envelopes and letters to parents explaining the survey in English and Spanish. These were distributed to school principals who were asked to disseminate the surveys to students to be taken home to parents. A letter attached to the survey provided parents a URL as an alternate means of completion of the survey if they did not want to complete the hard copy.

Part B APR FFY 2012 Tennessee
February 3, 2014 37
Federal Fiscal Year Parent Response Rate
Surveys Conducted by School Districts*
2006 33.0%
2007 28.2%
Surveys Conducted by State Contractor**
2008 15.3%
2009 18.5%
2010 17.9%
2011 18.9%
2012 18.3%
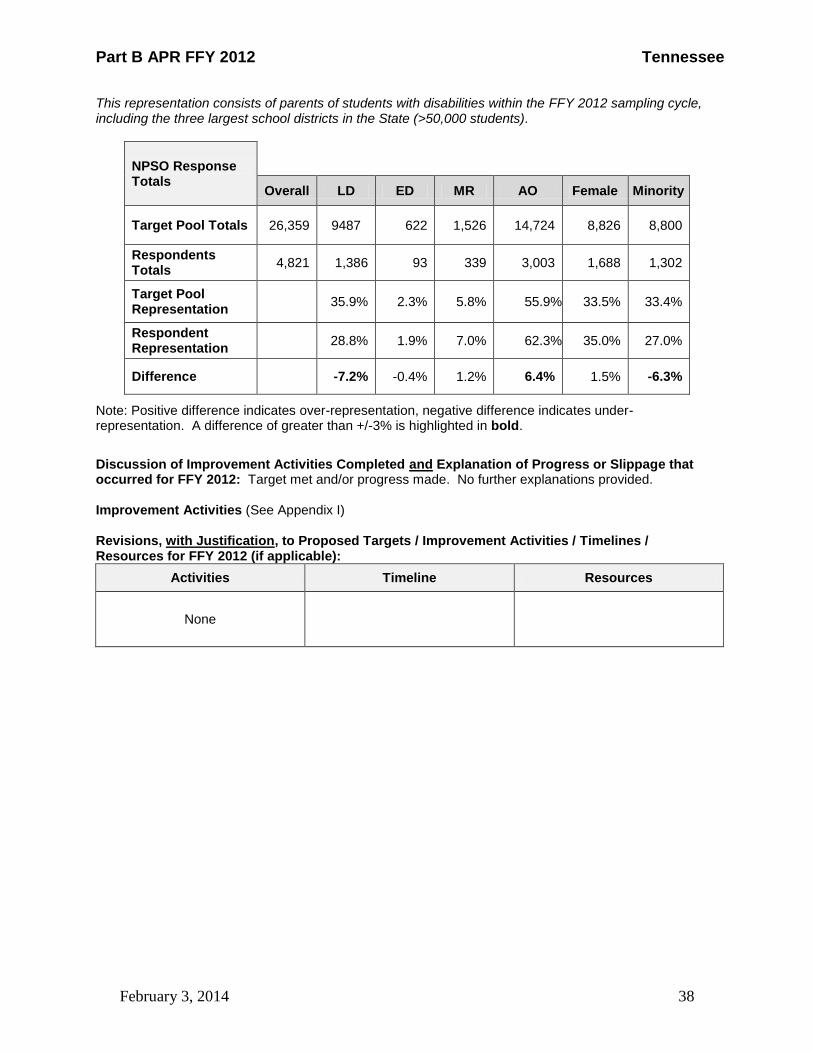
*In 2006 and 2007 surveys were conducted by LEA staff, using paper copies only and manual tabulation of results. Therefore survey findings may be slightly inflated. **In FFY 2008 TDOE began utilizing three methods to distribute surveys (electronic, direct US mail, and take home surveys). A sampling of students was used instead of a census method and a lower response rate resulted. From FFY 2009 through FFY 2013, electronic and take home surveys continue to be utilized with minimal change in response rate. The table on the next page provides summary representativeness data on all FFY 2012 Parent Survey respondents. The calculation, borrowed from the National Post-School Outcomes Center, compares the respondent pool of parents against the targeted group of parents. Did the respondents represent the entire group of parents that could have responded to the survey? The difference row compares the two proportions (target proportion against respondent proportion) by selected attributes including: child disability, child gender, and child minority race/ethnicity status. Cells in the difference row that are > +/- 3%, indicate that the respondent group over or under represents the entire group of targeted respondents. For this Parent Survey parents of minority students were under represented in the respondent group (-6.3%) as were parents of children with learning disabilities (-7.2%). Parents of students from all other (non-listed) disability groups were overrepresented in the respondents (6.4%). Based on respondent disaggregation (see table below) these results are representativeness of the population.
Part B APR FFY 2012 Tennessee
February 3, 2014 38
This representation consists of parents of students with disabilities within the FFY 2012 sampling cycle, including the three largest school districts in the State (>50,000 students).
NPSO Response Totals
Overall LD ED MR AO Female Minority
Target Pool Totals 26,359 9487 622 1,526 14,724 8,826 8,800
Respondents Totals
4,821 1,386 93 339 3,003 1,688 1,302
Target Pool Representation
35.9% 2.3% 5.8% 55.9% 33.5% 33.4%
Respondent Representation
28.8% 1.9% 7.0% 62.3% 35.0% 27.0%
Difference
-7.2% -0.4% 1.2% 6.4% 1.5% -6.3%
Note: Positive difference indicates over-representation, negative difference indicates under-representation. A difference of greater than +/-3% is highlighted in bold.
Discussion of Improvement Activities Completed and Explanation of Progress or Slippage that occurred for FFY 2012: Target met and/or progress made. No further explanations provided. Improvement Activities (See Appendix I) Revisions, with Justification, to Proposed Targets / Improvement Activities / Timelines / Resources for FFY 2012 (if applicable):
Activities Timeline Resources
None

Part B APR FFY 2012 Tennessee
February 3, 2014 39
Part B State Annual Performance Report (APR) for FFY 2012
Overview of the Annual Performance Report Development: See page 3
Monitoring Priority: Disproportionality
INDICATOR 9: Percent of districts with disproportionate representation of racial and ethnic groups in special education and related services that is the result of inappropriate identification.
(20 U.S.C. 1416(a)(3)(C))
Measurement
Percent = [(# of districts with disproportionate representation of racial and ethnic groups in special education and related services that is the result of inappropriate identification) divided by the (# of districts in the State)] times 100
Criteria (Definition) of Disproportionate Representation
Tennessee utilized the Westat spreadsheet for calculating both Relative Risk Ratio (RRR) and Weighted Risk Ratio (WRR) on district race and ethnicity data. With FFY 2012 data, the following methodology was used to calculate and examine data to determine disproportionate overrepresentation in special education. Data Sources: The October 1, 2012 Enrollment data (from CCD, EDEN file N052) and December 1, 2012 IDEA Child Count data (from EasyIEP) were used in the disproportionate representation calculations for each of Tennessee’s 136 school districts. When a district was found disproportionate, additional district data were accessed by the district to complete their self-assessment to determine if policies, procedures, and or practices resulted in inappropriate identification.
Both Relative Risk Ratios and Weighted Risk Ratios were generated for all LEAs based on the number of students receiving special education and related services in each LEA for reporting race/ethnicity categories of Hispanic/Latino, American Indian/Alaska Native, Asian, Black, Hawaiian/Pacific Islander, White and 2+ (multiple race/ethnicities). Each school district was examined for the seven race/ethnicity student sub-groups to determine if the district’s identification of students receiving special education and related services met each of the following three criteria:
a. Both a relative risk ratio (RRR) and a weighted risk ratio (WRR) of 3.00 or higher; b. Student sub-group enrollments of all students that have a race/ethnicity N count equal to or
greater than 50; and, c. A minimum special education child count of 45 students in the district receiving special
education and related services. The N of 45 is the N used for adequate yearly progress (AYP) for student subgroups. It is found in Tennessee’s NCLB Accountability Workbook (http://www.ed.gov/admins/lead/account/stateplans03/tncsa.pdf) on page 28 which states: “In calculating AYP for student subgroups, 45 or more students must be included to assure high levels of reliability”.
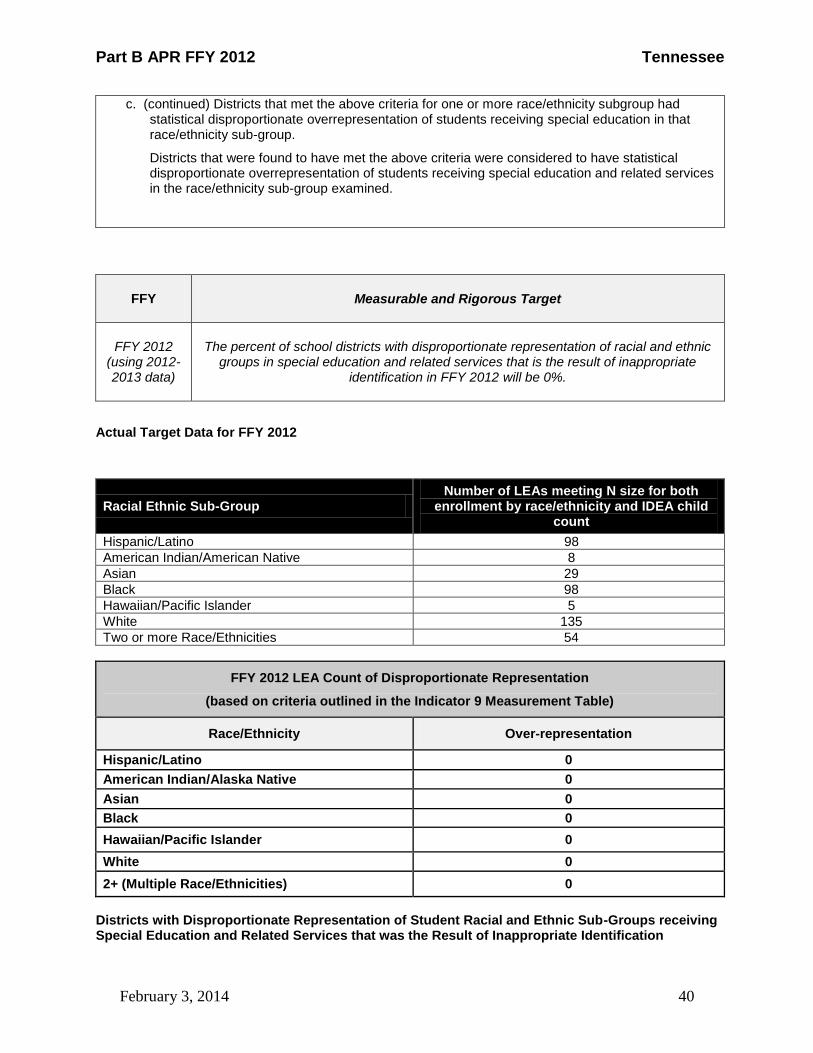
Part B APR FFY 2012 Tennessee
February 3, 2014 40
c. (continued) Districts that met the above criteria for one or more race/ethnicity subgroup had statistical disproportionate overrepresentation of students receiving special education in that race/ethnicity sub-group.
Districts that were found to have met the above criteria were considered to have statistical disproportionate overrepresentation of students receiving special education and related services in the race/ethnicity sub-group examined.
FFY Measurable and Rigorous Target
FFY 2012 (using 2012-2013 data)
The percent of school districts with disproportionate representation of racial and ethnic groups in special education and related services that is the result of inappropriate
identification in FFY 2012 will be 0%.
Actual Target Data for FFY 2012
Racial Ethnic Sub-Group Number of LEAs meeting N size for both
enrollment by race/ethnicity and IDEA child count
Hispanic/Latino 98
American Indian/American Native 8
Asian 29
Black 98
Hawaiian/Pacific Islander 5
White 135
Two or more Race/Ethnicities 54
FFY 2012 LEA Count of Disproportionate Representation
(based on criteria outlined in the Indicator 9 Measurement Table)
Race/Ethnicity Over-representation
Hispanic/Latino 0
American Indian/Alaska Native 0
Asian 0
Black 0
Hawaiian/Pacific Islander 0
White 0
2+ (Multiple Race/Ethnicities) 0
Districts with Disproportionate Representation of Student Racial and Ethnic Sub-Groups receiving Special Education and Related Services that was the Result of Inappropriate Identification
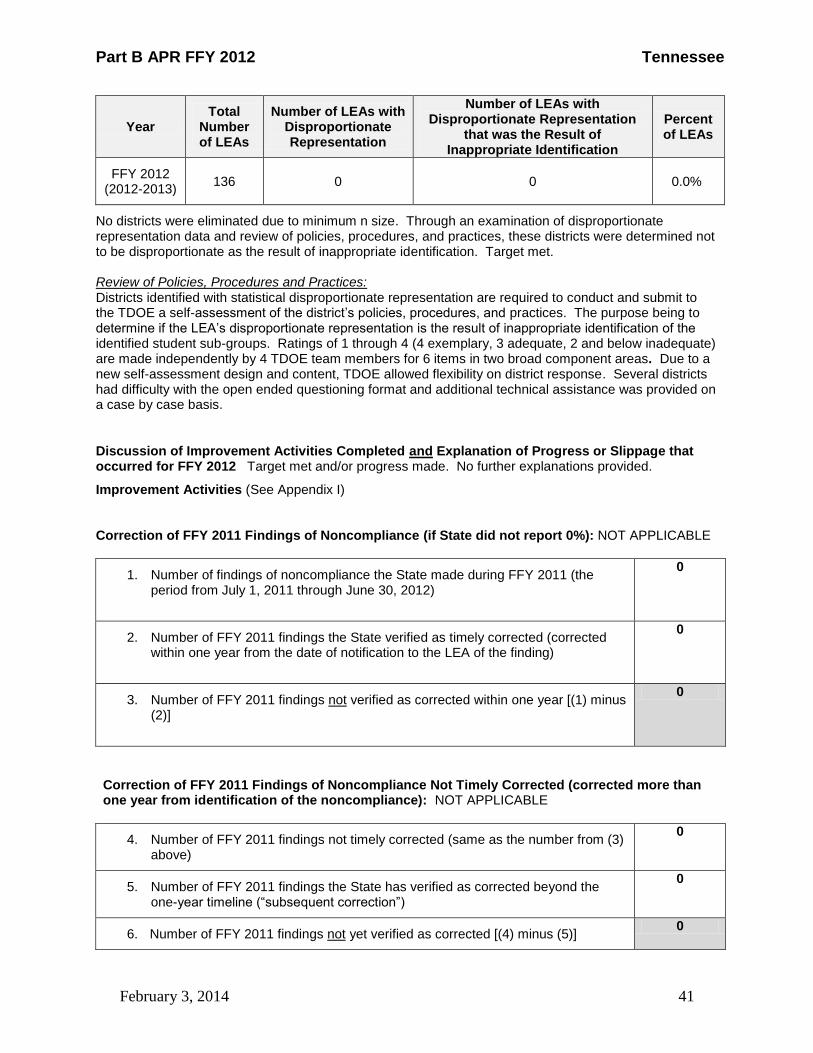
Part B APR FFY 2012 Tennessee
February 3, 2014 41
Year Total
Number of LEAs
Number of LEAs with Disproportionate Representation
Number of LEAs with Disproportionate Representation
that was the Result of Inappropriate Identification
Percent of LEAs
FFY 2012 (2012-2013)
136 0 0 0.0%
No districts were eliminated due to minimum n size. Through an examination of disproportionate representation data and review of policies, procedures, and practices, these districts were determined not to be disproportionate as the result of inappropriate identification. Target met. Review of Policies, Procedures and Practices: Districts identified with statistical disproportionate representation are required to conduct and submit to the TDOE a self-assessment of the district’s policies, procedures, and practices. The purpose being to determine if the LEA’s disproportionate representation is the result of inappropriate identification of the identified student sub-groups. Ratings of 1 through 4 (4 exemplary, 3 adequate, 2 and below inadequate) are made independently by 4 TDOE team members for 6 items in two broad component areas. Due to a new self-assessment design and content, TDOE allowed flexibility on district response. Several districts had difficulty with the open ended questioning format and additional technical assistance was provided on a case by case basis.
Discussion of Improvement Activities Completed and Explanation of Progress or Slippage that occurred for FFY 2012 Target met and/or progress made. No further explanations provided.
Improvement Activities (See Appendix I) Correction of FFY 2011 Findings of Noncompliance (if State did not report 0%): NOT APPLICABLE
1. Number of findings of noncompliance the State made during FFY 2011 (the period from July 1, 2011 through June 30, 2012)
0
2. Number of FFY 2011 findings the State verified as timely corrected (corrected within one year from the date of notification to the LEA of the finding)
0
3. Number of FFY 2011 findings not verified as corrected within one year [(1) minus (2)]
0
Correction of FFY 2011 Findings of Noncompliance Not Timely Corrected (corrected more than one year from identification of the noncompliance): NOT APPLICABLE
4. Number of FFY 2011 findings not timely corrected (same as the number from (3) above)
0
5. Number of FFY 2011 findings the State has verified as corrected beyond the one-year timeline (“subsequent correction”)
0
6. Number of FFY 2011 findings not yet verified as corrected [(4) minus (5)] 0

Part B APR FFY 2012 Tennessee
February 3, 2014 42
Actions Taken if Noncompliance Not Corrected: NOT APPLICABLE Verification of Correction (either timely or subsequent): NOT APPLICABLE
Describe the specific actions that the State took to verify the correction of findings of noncompliance identified in FFY 2011: NOT APPLICABLE
Correction of Remaining FFY 2010 Findings of Noncompliance (if applicable): NOT APPLICABLE
1. Number of remaining FFY 2010 findings noted in OSEP’s July 1, 2013 FFY 2011 APR response table for this indicator
0
2. Number of remaining FFY 2010 findings the State has verified as corrected 0
3. Number of remaining FFY 2010 findings the State has not verified as corrected [(1) minus (2)]
0
Verification of Correction of Remaining FFY 2010 findings: NOT APPLICABLE Describe the specific actions that the State took to verify the correction of findings of noncompliance identified in FFY 2010: NOT APPLICABLE Correction of Any Remaining Findings of Noncompliance from FFY 2009 or Earlier (if applicable): Provide information regarding correction using the same Table format provided above. NOT APPLICABLE Additional Information Required by the OSEP APR Response Table for this Indicator (if applicable): NOT APPLICABLE
Statement from the Response Table State’s Response
None None
Revisions, with Justification, to Proposed Targets (see SPP) / Improvement Activities / Timelines / Resources for FFY 2012 (if applicable):
Activities Timeline Resource
None
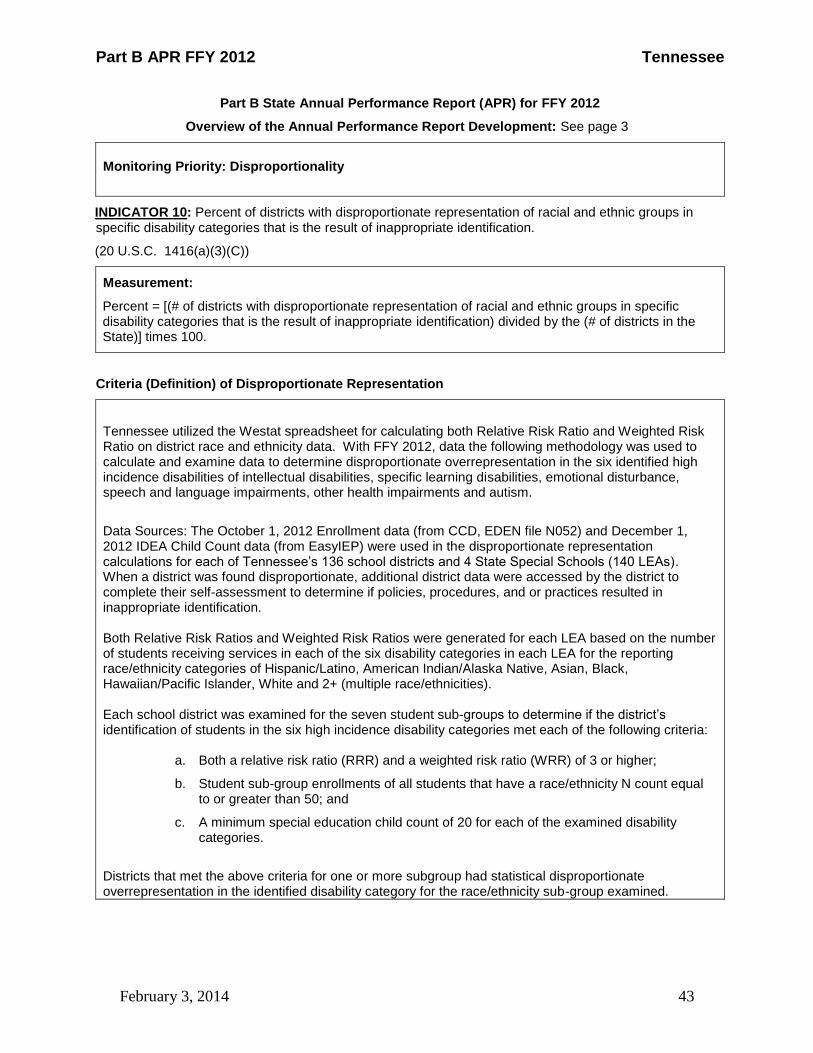
Part B APR FFY 2012 Tennessee
February 3, 2014 43
Part B State Annual Performance Report (APR) for FFY 2012
Overview of the Annual Performance Report Development: See page 3
Monitoring Priority: Disproportionality
INDICATOR 10: Percent of districts with disproportionate representation of racial and ethnic groups in specific disability categories that is the result of inappropriate identification.
(20 U.S.C. 1416(a)(3)(C))
Measurement:
Percent = [(# of districts with disproportionate representation of racial and ethnic groups in specific disability categories that is the result of inappropriate identification) divided by the (# of districts in the State)] times 100.
Criteria (Definition) of Disproportionate Representation
Tennessee utilized the Westat spreadsheet for calculating both Relative Risk Ratio and Weighted Risk Ratio on district race and ethnicity data. With FFY 2012, data the following methodology was used to calculate and examine data to determine disproportionate overrepresentation in the six identified high incidence disabilities of intellectual disabilities, specific learning disabilities, emotional disturbance, speech and language impairments, other health impairments and autism.
Data Sources: The October 1, 2012 Enrollment data (from CCD, EDEN file N052) and December 1, 2012 IDEA Child Count data (from EasyIEP) were used in the disproportionate representation calculations for each of Tennessee’s 136 school districts and 4 State Special Schools (140 LEAs). When a district was found disproportionate, additional district data were accessed by the district to complete their self-assessment to determine if policies, procedures, and or practices resulted in inappropriate identification.
Both Relative Risk Ratios and Weighted Risk Ratios were generated for each LEA based on the number of students receiving services in each of the six disability categories in each LEA for the reporting race/ethnicity categories of Hispanic/Latino, American Indian/Alaska Native, Asian, Black, Hawaiian/Pacific Islander, White and 2+ (multiple race/ethnicities). Each school district was examined for the seven student sub-groups to determine if the district’s identification of students in the six high incidence disability categories met each of the following criteria:
a. Both a relative risk ratio (RRR) and a weighted risk ratio (WRR) of 3 or higher;
b. Student sub-group enrollments of all students that have a race/ethnicity N count equal to or greater than 50; and
c. A minimum special education child count of 20 for each of the examined disability categories.
Districts that met the above criteria for one or more subgroup had statistical disproportionate overrepresentation in the identified disability category for the race/ethnicity sub-group examined.

Part B APR FFY 2012 Tennessee
February 3, 2014 44
FFY Measurable and Rigorous Target
2012
(using 2012-2013 data)
The percent of school districts with disproportionate representation of racial and ethnic groups in special education and related services that is the result of inappropriate
identification of students with Autism, Emotional Disturbance, Intellectual Disabilities, Other Health Impairment, Specific Learning Disabilities, and Speech/Language
Impairments in FFY 2012 will be 0%
Actual Target Data for FFY 2012 .
FFY 2012 LEA Count of Disproportionate Representation
Race/Ethnicity AUT EMD ID OHI SLD SLI
Hispanic/Latino 0 0 0 0 0 0
American Indian/Alaska Native
0 0 2 2 0 0
Asian 0 1 0 0 0 1
Black 3 1 4 2 2 4
Hawaiian/Pacific Islander
0 0 0 0 0 0
White 2 3 7 2 2 1
2+ (Multiple Race/Ethnicities)
0 1 0 1 0 1
Districts with Disproportionate Representation of Student Racial and Ethnic Groups in Specific Disability categories that was the Result of Inappropriate Identification
Year Total
Number of LEAs
Number of LEAs with
Disproportionate Representation
Number of LEAs with Disproportionate Representation
that was the Result of Inappropriate Identification
Percent of LEAs
FFY 2012 (2012-2013)
136 34 2 1.47%
Note that no districts were eliminated due to minimum N size
Through an examination of disproportionate representation data and review of policies, procedures, and practices to address child find, evaluation and eligibility requirements, two LEAs were determined to be disproportionate as the result of inappropriate identification. The state did not meet its target of 0%. Review of Policies, Procedures and Practices: Districts identified with statistical disproportionate representation are required to conduct and submit to the TDOE a self-assessment of the district’s policies, procedures, and practices. The purpose being to determine if the LEA’s disproportionate representation is the result of inappropriate identification of the identified student sub-groups. Ratings of 1 through 4 (4 exemplary, 3 adequate, 2 and below inadequate) are made independently by 4 TDOE team members for 6 items in two broad component areas. Each

Part B APR FFY 2012 Tennessee
February 3, 2014 45
district’s scores are averaged and those “below 2”* are considered to maintain inappropriate policies, practices, or procedures. A finding of non-compliance was issued to these districts and revision to the policy, procedure or practice in question will be required within a prescribed time frame. Due to a new self-assessment design and content, TDOE allowed flexibility on district response. Several districts had difficulty with the open ended questioning format and additional technical assistance was provided on a case by case basis.
Discussion of Improvement Activities Completed and Explanation of Progress or Slippage that occurred for FFY 2012
Slippage: possibly due to change to a more rigorous review of policies procedures and practices.
Improvement Activities (See Appendix I) Correction of FFY 2011 Findings of Noncompliance (if State did not report 0%): NOT APPLICABLE
1. Number of findings of noncompliance the State made during FFY 2011 (the period from July 1, 2011 through June 30, 2012)
0
2. Number of FFY 2011 findings the State verified as timely corrected (corrected within one year from the date of notification to the LEA of the finding)
0
3. Number of FFY 2011 findings not verified as corrected within one year [(1) minus (2)]
0
Correction of FFY 2011 Findings of Noncompliance Not Timely Corrected (corrected more than one year from identification of the noncompliance): NOT APPLICABLE
1. Number of FFY 2011 findings not timely corrected (same as the number from (3) above)
0
2. Number of FFY 2011 findings the State has verified as corrected beyond the one-year timeline (“subsequent correction”)
0
3. Number of FFY 2011 findings not yet verified as corrected [(4) minus (5)] 0
Actions Taken if Noncompliance Not Corrected: NOT APPLICABLE Verification of Correction (either timely or subsequent): NOT APPLICABLE
Describe the specific actions that the State took to verify the correction of findings of noncompliance identified in FFY 2011: NOT APPLICABLE
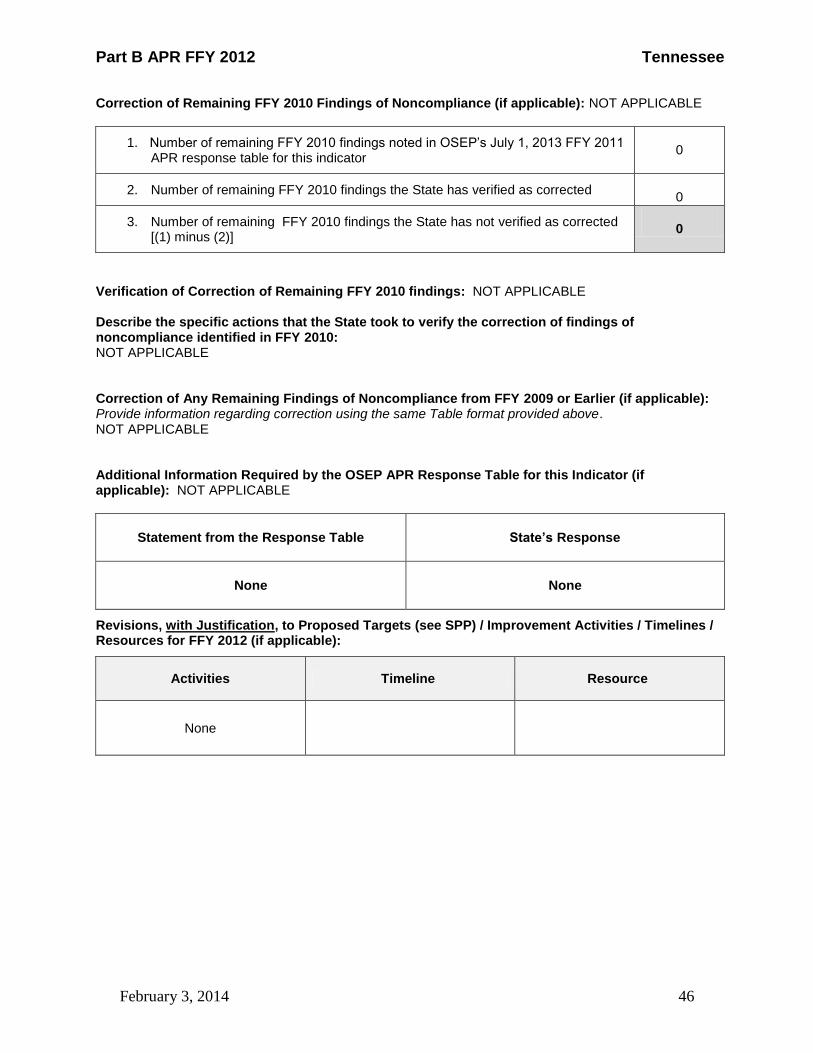
Part B APR FFY 2012 Tennessee
February 3, 2014 46
Correction of Remaining FFY 2010 Findings of Noncompliance (if applicable): NOT APPLICABLE
1. Number of remaining FFY 2010 findings noted in OSEP’s July 1, 2013 FFY 2011 APR response table for this indicator
0
2. Number of remaining FFY 2010 findings the State has verified as corrected 0
3. Number of remaining FFY 2010 findings the State has not verified as corrected [(1) minus (2)]
0
Verification of Correction of Remaining FFY 2010 findings: NOT APPLICABLE Describe the specific actions that the State took to verify the correction of findings of noncompliance identified in FFY 2010: NOT APPLICABLE Correction of Any Remaining Findings of Noncompliance from FFY 2009 or Earlier (if applicable): Provide information regarding correction using the same Table format provided above. NOT APPLICABLE Additional Information Required by the OSEP APR Response Table for this Indicator (if applicable): NOT APPLICABLE
Statement from the Response Table State’s Response
None None
Revisions, with Justification, to Proposed Targets (see SPP) / Improvement Activities / Timelines / Resources for FFY 2012 (if applicable):
Activities Timeline Resource
None
Part B APR FFY 2012 Tennessee
February 3, 2014 47
Part B State Annual Performance Report (APR) for FFY 2012
Overview of the Annual Performance Report Development: See page 3
Monitoring Priority: Effective General Supervision Part B / Child Find
INDICATOR 11: Percent of children who were evaluated within 60 days of receiving parental consent for initial evaluation or, if the State establishes a timeframe within which the evaluation must be conducted, within that timeframe.
(20 U.S.C. 1416(a)(3)(B))
Measurement:
a. # of children for whom parental consent to evaluate was received.
b. # of children whose evaluations were completed within 60 days (or State-established timeline).
Account for children included in a. but not included in b. Indicate the range of days beyond the timeline when the evaluation was completed and any reasons for the delays.
Percent = [(b) divided by (a)] times 100.
Actual Target Data for FFY 2012
FFY Measurable and Rigorous Target
2012 100%
a. # of children for whom parental consent to evaluate was received
(28,320 – 610 acceptable delays) = 27,710
b. # of children whose evaluations were completed within 60 days (or State-established timeline)
= (27,710 - 587) = 27,123
27,123/27,710 = 97.9%
Method Used to Collect Data
TDOE collected data on initial consent for eligibility determination on all students with signed consent forms during FFY 2012 (July 1, 2012 – June 30, 2013). Data were collected from the State data collection system (EasyIEP). Data were collected on all of Tennessee’s 136 LEAs. The following specific student level data were obtained through the State data collection system:
Student name
District
Date of initial consent for eligibility determination
Date of eligibility determination
Eligibility determination (eligible or ineligible)
Days from date of initial parent consent to date of eligibility determination
Part B APR FFY 2012 Tennessee
February 3, 2014 48
Where applicable, the following were also collected:
Number of days over 40 school day timeline
Reasons for the delay
FFY 2012 was the fourth year these student level data were collected through the State data collection system. Upon initial review of the data, some individual districts were contacted to confirm and in some cases provide what appeared to be missing data (e.g., some districts initially failed to “close” records of students found ineligible).
Children Evaluated Within 60 Days (or State-established timeline)
The total number of students initially referred to special education was 28,320 in FFY 2012. For 27,123 of those students, their evaluations (eligibility determinations in Tennessee) were completed within the State-established timeline of 40 school days. Of the 28,320 students, 610 had delays deemed acceptable by IDEA or were granted extensions through Tennessee Rules and Regulations. These 610 are excluded from both the numerator and denominator in the calculation used to determine the percent of students provided timely child find. The revised numbers for the calculation are shown in the table below:
a. Number of children for whom parental consent to evaluate was received 27,710
b. Number of children whose evaluations were completed within 60 days (or State-established timeline)
27,123
c. Percent of children with parental consent to evaluate, who were evaluated within 60 days (or State established-timeline) (Percent = [(b) divided by (a)] times 100)
97.9%
Children Excluded from Numerator and Denominator
610 delays were acceptable or approvable based on IDEA and/or Tennessee Rules and Regulations. The table below notes the specific reasons for these 610 exclusions and the number excluded:
IDEA statute §300.301: Initial evaluations
(d) Exception. The timeframe described in paragraph (c)(1) of this section does not apply to a public agency if—
(1) The parent of a child repeatedly fails or refuses to produce the child for the evaluation;
or
(2) A child enrolls in a school of another public agency after the relevant timeframe in paragraph (c)(1) of this section has begun, and prior to a determination by the child’s previous public agency as to whether the child is a child with a disability under §300.8.
(e) The exception in paragraph (d)(2) of this section applies only if the subsequent public agency is making sufficient progress to ensure a prompt completion of the evaluation, and the parent and subsequent public agency agree to a specific time when the evaluation will be completed. (Authority: 20 U.S.C. 1414(a))
473
Tennessee Rules and Regulations permit the use of an Evaluation, Eligibility, Placement Timeline Extension Request process whereby districts may seek approval to extend the 40 school day evaluation timeline based on acceptable reasons for delay. Acceptable reasons for delay have been expanded based on the exceptions outlined in IDEA as well as State Board of Education Policy.
137
Excluded from numerator and denominator 610
Range of Days Beyond Timeline and Reasons for Delays
Part B APR FFY 2012 Tennessee
February 3, 2014 49
A total of 1,197 students (28,320 - 27,123) did not have their eligibility determinations and placement completed within Tennessee’s required 40 school days. Days beyond the timeline ranged from 1 to 212 days. Reasons for delays are built into the State data collection system and are required whenever the 40 school day timeline is not met. These reasons are as follows with an asterisk denoting those deemed acceptable.
1) Limited access to professional staff (e.g., staff shortages, staff illness, in-service trainings, vacancies, holiday schedules, etc.)
2) Student or family language caused delays in testing/meeting (including need for interpreter)
*3) Student transferred to another district
4) Student transferred within district
5) Student turned 3 in (e.g., June), services didn’t start until (e.g., August)
6) Waiting on specialist(s): reports, second assessment, observation data, review, medical data, etc.)
*7) Excessive student absences (> 8 in 40 school days) resulted in rescheduling of assessment(s)*
*8) Parent did not show for scheduled meeting. Or parent cancelled scheduled meeting too late—no time to reschedule within 40 school days. Or parent requested to schedule meeting outside of timeline.*
*9) Student/parent serious medical issues (e.g., hospitalization, surgery recuperation) required postponement and/or rescheduling.*
*10) Repeated attempts to contact parents failed (minimum 3 unsuccessful mailings plus repeated phone calls)*
11) Other (not listed above)
For FFY 2012, TDOE did not meet the rigorous target of 100% compliance. In FFY 2011, TDOE reported that 97.9% of its students were evaluated within State-established timeline. In FFY 2012, TDOE also reported 97.9% of its students were evaluated within State-established timeline.
Discussion of Improvement Activities Completed and Explanation of Progress or Slippage that Occurred for FFY 2012:
The target of 100% compliance was not met. However, no progress or slippage occurred.
Improvement Activities (See Appendix I) Correction of FFY 2011 Findings of Noncompliance (if State reported less than 100% compliance) Level of compliance (actual target data) State reported for FFY 2011 for this indicator: 97.9%.
Districts
1. Number of findings of noncompliance the State made during FFY 2011 (the period from July 1, 2011 through June 30, 2012)
78
2. Number of FFY 2011 findings the State verified as timely corrected (corrected within one year from the date of notification to the LEA of the finding)
78
3. Number of FFY 2011 findings not verified as corrected within one year (1) minus (2)]
0

Part B APR FFY 2012 Tennessee
February 3, 2014 50
Correction of FFY 2011 Findings of Noncompliance Not Timely Corrected (corrected more than one year from identification of the noncompliance)
Actions Taken if Noncompliance Not Corrected
Not Applicable
Verification of Correction of FFY 2011 noncompliance (either timely or subsequent)
TDOE has verified the timely correction for all FFY 2011 findings of noncompliance as described below. Describe the actions the State took to verify the correction of findings of noncompliance identified in FFY 2011
Prong 1 Verification Activities (Correction of Student Level Noncompliance) The State level data collection system (modified in 2009) is used to collect the data necessary to determine timely evaluation. This same data system was also used to follow up on all instances of FFY2011 student level noncompliance - instances where the eligibility determination exceeded State timelines. TDOE initially provided districts with found noncompliance a listing of their FFY 2011 students where initial eligibility was late and still open (eligibility not yet determined). These LEAs were required to research individual students and update the data system if the eligibility determination had been made (with the corresponding reason for delay). In the case of students where eligibility determination was still pending, LEAs were required to determine eligibility as soon as possible. In all 501 instances, the evaluation (eligibility determination) was completed for children whose initial evaluation was not timely (except where a child was no longer within the jurisdiction of the LEA). All evaluations were completed within 365 days of the notification of noncompliance.
Prong 2 Verification Activities (Verification of Correct Implementation of Regulatory Requirements) For those LEAs with one or more of the 501, late student evaluations during FFY 2011, TDOE staff conducted data pulls of Written Parental Permissions signed in FFY 2012 to determine 100% compliance. TDOE looked at additional initial referrals from each of these LEAs. For LEAs with less than 500 initial referrals for eligibility in FFY 2011, TDOE required they demonstrate 100% compliance for initial eligibility determinations for a minimum of 30 consecutive days in FFY 2012. For districts with more than 500 initial referrals for eligibility in FFY 2011, TDOE required they demonstrate 100% compliance for initial eligibility determinations for a minimum of 10 consecutive days in FFY 2012. After TDOE verified that the LEA was 100% compliant for at least a 30-day or 10-day time period and that all student level noncompliance from FFY 2011 had been corrected (Prong 1), the finding was closed and the LEA was notified. Revisions, with Justification, to Proposed Targets / Improvement Activities / Timelines / Resources for FFY 2012 (if applicable):
Activities Timeline Resources
None
4. Number of FFY 2011 findings not timely corrected (same as the number from (3) above)
0
5. Number of FFY 2011 findings the State has verified as corrected beyond the one-year timeline (“subsequent correction”)
0
6. Number of FFY 2011 findings not verified as corrected [(4) minus (5)] 0
Part B APR FFY 2012 Tennessee
February 3, 2014 51
Part B State Annual Performance Report (APR) for FFY 2012
Overview of the Annual Performance Report Development: See page 3
Monitoring Priority: Effective General Supervision Part B – Effective Transition
INDICATOR 12: Part C to B Transition: Percent of children referred by Part C prior to age 3, who are found eligible for Part B, and who have an IEP developed and implemented by their third birthdays. (20 U.S.C. 1416(a)(3)(B))
Measurement
a. # of children who have been served in Part C and referred to Part B for eligibility determination.
b. # of those referred determined to be NOT eligible and whose eligibilities were determined prior to
their third birthdays.
c. # of those found eligible who have an IEP developed and implemented by their third birthdays.
d. # of children for whom parent refusal to provide consent caused delays in evaluation or initial
services.
e. # of children who were referred to Part C less than 90 days before their third birthdays
Account for children included in a. but not included in b., c. or d. Indicate the range of days beyond the
third birthday when eligibility was determined and the IEP developed and the reasons for the delays.
Percent = [(c) divided by (a – b – d - e)] times 100.
98.71%= [(1,303) divided by (1,835 – 311 – 153 -- 51)] times 100.
FFY Measurable and Rigorous Target
100% of children referred by Part C prior to age three, who are found eligible for Part B,
have an IEP developed and implemented by their third birthdays.
Measurement = C (Eligible) DIVIDED BY [A (Total) MINUS B (Not Eligible) MINUS D
(Parent Refusal)] TIMES 100.
a. All children who have been served in Part C will be referred to Part B for eligibility
determination.
b. All referrals determined to be NOT eligible for Part B will have eligibilities determined
prior to their third birthdays. Children from A not included here will be explained.
Reasons for delay of eligibility for Part B will be explained.
c. All referrals determined to be eligible for Part B will have an IEP developed and
implemented by their third birthdays. Children from A not included here will be
explained. Reasons for delay of eligibility for Part B will be explained.
d. All referrals for whom parent refusal to provide consent caused delays in evaluation
or initial services will have eligibility determined. Children from A not included here
will be explained.
e. All children who were referred to Part C less than 90 days before their third
birthdays.

Part B APR FFY 2012 Tennessee
February 3, 2014 52
Actual Target Data for FFY 2012/Actual State Data (numbers)
a. # of children who have been served in Part C and referred to Part B
for Part B eligibility determination. 1,835
b. # of those referred determined to be NOT eligible and whose
eligibility was determined prior to third birthday 311
c. # of those found eligible who have an IEP developed and
implemented by their third birthdays 1,303
d. # for whom parent refusals to provide consent caused delays in
evaluation or initial services or to whom exceptions under 34 CFR
§300.301(d) applied.
153
e. # of children who were referred to Part C less than 90 days before
their third birthdays. 51
# in a but not in b, c, d, or, e. 17
Percent of children referred by Part C prior to age 3 who are found
eligible for Part B, and who have an IEP developed and implemented by
their third birthdays. Percent = [(c) / (a-b-d-e)] * 100
98.71%
98.71% of children referred by Part C prior to age 3 and who were found eligible for Part B had an IEP developed and implemented by their third birthdays.
There were 17 children who were served in Part C and referred to Part B for eligibility determination who did not have eligibility determined by their third birthdays or did not have an IEP developed and implemented by their third birthdays. The range of days beyond the third birthday until eligibility was determined or an IEP was developed and implemented, was 2 to 199.
System reasons identified for untimely IEPs include lack of early childhood transition procedures/processes at the LEA level, LEA staff not aware of requirements, appropriate LEA staff not available for evaluations or IEP meetings, and children turning three during the summer or on holidays. In addition, documented exceptional family circumstances for delay in timely IEP development include family’s preferred scheduling, child/family sickness, and families who have moved, could not be located, or changed their minds regarding evaluation or services
The seventeen findings of noncompliance were issued to 10 associated LEAs. Corrections*, at the student level, will be addressed in the FFY 2013 APR and a review of additional data (prong 2) will occur to assure correct implementation of regulatory requirements. *(Proper data collection technical assistance requests and/or training, as well as the submission of an Early Childhood Transition Plan may be required from LEAs when noncompliance is found).

Part B APR FFY 2012 Tennessee
February 3, 2014 53
Discussion of Improvement Activities Completed and Explanation of Progress or Slippage that Occurred for FFY 2012
The target of 100% compliance was not met, however, TDOE identifies progress of 0.2%, in going from 98.5% compliance in FFY 2011 to 98.7% compliance in FFY 2012. The number of District’s issued a finding of noncompliance relative to Indicator 12 decreased from 12 to 10 and the number of children identified as having an untimely IEP decreased from 22 in FFY 2011 to 17 for FFY 2012.
Improvement Activities (See Appendix I)
Correction of FFY 2011 Findings of Noncompliance (if State reported less than 100% compliance in its FFY 2010 APR) Level of compliance (actual target data) State reported for FFY 2011 for this indicator: 98.5%
1. Number of findings of noncompliance the State made during FFY 2011 (the period
from July 1, 2010 through June 30, 2011) 12
2. Number of FFY 2011 findings the State verified as timely corrected (corrected
within one year from the date of notification to the LEA of the finding) 12
3. Number of FFY 2011 findings not verified as corrected within one year [(1) minus
(2)] 0
Correction of FFY 2011 Findings of Noncompliance Not Timely Corrected (corrected more than
one year from identification of the noncompliance)
4. Number of FFY 2011 findings not timely corrected (same as the number from (3)
above) 0
5. Number of FFY 2011 findings the State has verified as corrected beyond the one-
year timeline (“subsequent correction”) 0
6. Number of FFY 2011 findings not verified as corrected [(4) minus (5)] 0
Actions Taken if Noncompliance Not Corrected
TDOE has verified correction for all FFY 2011 findings of noncompliance.
Verification of Correction (either timely or subsequent)
Data were collected for the entire reporting year from all 136 LEAs in the state for FFY 2011. There were 22 children who were served in Part C and referred to Part B who were found eligible and did not have an IEP developed and implemented by their third birthday due to system reasons. As a result, twelve LEAs with findings of noncompliance relative to Indicator 12 were identified for FFY 2011.
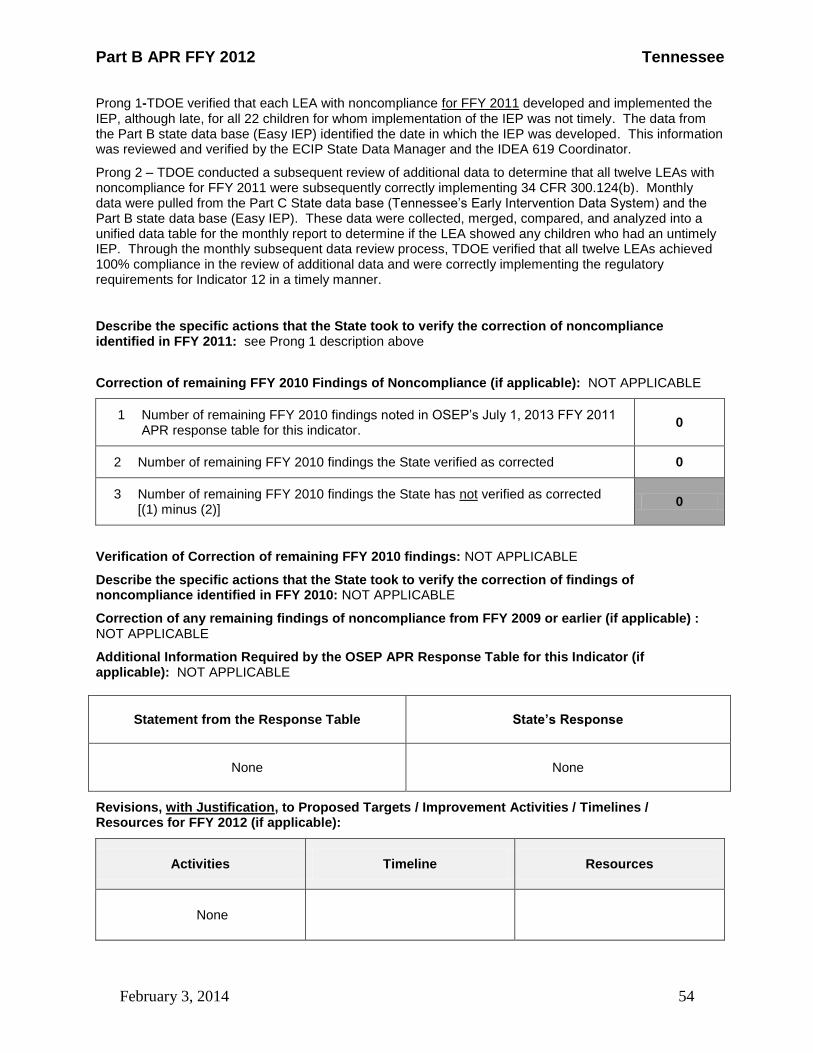
Part B APR FFY 2012 Tennessee
February 3, 2014 54
Prong 1-TDOE verified that each LEA with noncompliance for FFY 2011 developed and implemented the IEP, although late, for all 22 children for whom implementation of the IEP was not timely. The data from the Part B state data base (Easy IEP) identified the date in which the IEP was developed. This information was reviewed and verified by the ECIP State Data Manager and the IDEA 619 Coordinator.
Prong 2 – TDOE conducted a subsequent review of additional data to determine that all twelve LEAs with noncompliance for FFY 2011 were subsequently correctly implementing 34 CFR 300.124(b). Monthly data were pulled from the Part C State data base (Tennessee’s Early Intervention Data System) and the Part B state data base (Easy IEP). These data were collected, merged, compared, and analyzed into a unified data table for the monthly report to determine if the LEA showed any children who had an untimely IEP. Through the monthly subsequent data review process, TDOE verified that all twelve LEAs achieved 100% compliance in the review of additional data and were correctly implementing the regulatory requirements for Indicator 12 in a timely manner.
Describe the specific actions that the State took to verify the correction of noncompliance identified in FFY 2011: see Prong 1 description above
Correction of remaining FFY 2010 Findings of Noncompliance (if applicable): NOT APPLICABLE
1 Number of remaining FFY 2010 findings noted in OSEP’s July 1, 2013 FFY 2011 APR response table for this indicator.
0
2 Number of remaining FFY 2010 findings the State verified as corrected 0
3 Number of remaining FFY 2010 findings the State has not verified as corrected [(1) minus (2)]
0
Verification of Correction of remaining FFY 2010 findings: NOT APPLICABLE
Describe the specific actions that the State took to verify the correction of findings of noncompliance identified in FFY 2010: NOT APPLICABLE
Correction of any remaining findings of noncompliance from FFY 2009 or earlier (if applicable) : NOT APPLICABLE
Additional Information Required by the OSEP APR Response Table for this Indicator (if applicable): NOT APPLICABLE
Statement from the Response Table State’s Response
None None
Revisions, with Justification, to Proposed Targets / Improvement Activities / Timelines / Resources for FFY 2012 (if applicable):
Activities Timeline Resources
None
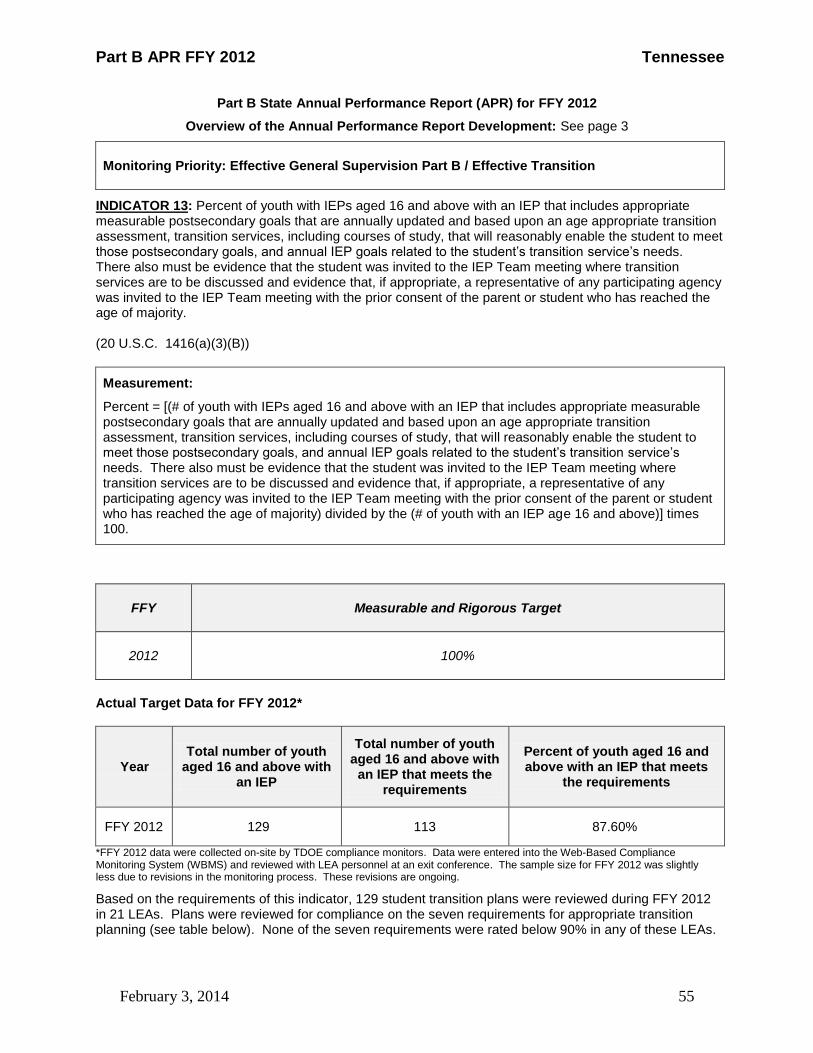
Part B APR FFY 2012 Tennessee
February 3, 2014 55
Part B State Annual Performance Report (APR) for FFY 2012
Overview of the Annual Performance Report Development: See page 3
Monitoring Priority: Effective General Supervision Part B / Effective Transition
INDICATOR 13: Percent of youth with IEPs aged 16 and above with an IEP that includes appropriate measurable postsecondary goals that are annually updated and based upon an age appropriate transition assessment, transition services, including courses of study, that will reasonably enable the student to meet those postsecondary goals, and annual IEP goals related to the student’s transition service’s needs. There also must be evidence that the student was invited to the IEP Team meeting where transition services are to be discussed and evidence that, if appropriate, a representative of any participating agency was invited to the IEP Team meeting with the prior consent of the parent or student who has reached the age of majority. (20 U.S.C. 1416(a)(3)(B))
Measurement:
Percent = [(# of youth with IEPs aged 16 and above with an IEP that includes appropriate measurable postsecondary goals that are annually updated and based upon an age appropriate transition assessment, transition services, including courses of study, that will reasonably enable the student to meet those postsecondary goals, and annual IEP goals related to the student’s transition service’s needs. There also must be evidence that the student was invited to the IEP Team meeting where transition services are to be discussed and evidence that, if appropriate, a representative of any participating agency was invited to the IEP Team meeting with the prior consent of the parent or student who has reached the age of majority) divided by the (# of youth with an IEP age 16 and above)] times 100.
FFY Measurable and Rigorous Target
2012 100%
Actual Target Data for FFY 2012*
Year Total number of youth
aged 16 and above with an IEP
Total number of youth aged 16 and above with
an IEP that meets the requirements
Percent of youth aged 16 and above with an IEP that meets
the requirements
FFY 2012 129 113 87.60%
*FFY 2012 data were collected on-site by TDOE compliance monitors. Data were entered into the Web-Based Compliance Monitoring System (WBMS) and reviewed with LEA personnel at an exit conference. The sample size for FFY 2012 was slightly less due to revisions in the monitoring process. These revisions are ongoing.
Based on the requirements of this indicator, 129 student transition plans were reviewed during FFY 2012 in 21 LEAs. Plans were reviewed for compliance on the seven requirements for appropriate transition planning (see table below). None of the seven requirements were rated below 90% in any of these LEAs.

Part B APR FFY 2012 Tennessee
February 3, 2014 56
There was vast improvement in Student Invitation to Meeting with the area now requiring the most attention being Course of Study.
In summary, 14 of 21 LEAs monitored and 113 of 129 plans reviewed (87.6%), were 100% compliant. Progress from 87.2% in FFY 2011 to 87.6% in FFY 2012 is also noted. There were 16 findings of noncompliance in 7 LEAs
TDOE did not meet its target of 100%.
Discussion of Improvement Activities Completed and Explanation of Progress or Slippage that occurred for FFY 2012: Target not met. Progress made. No further explanations provided.
Improvement Activities: (See Appendix I)
Correction of FFY 2011 Findings of Noncompliance
Level of compliance (actual target data) State reported for FFY 2011 for this indicator: 87.2%
1 Number of findings of noncompliance the State made during FFY 2011 (the period from July 1, 2011 through June 30, 2012)
24
2 Number of FFY 2011 findings the State verified as timely corrected (corrected within one year from the date of notification to the LEA of the finding)
24
3 Number of FFY 2011 findings not verified as corrected within one year [(1) minus (2)]
0
Correction of FFY 2011 Findings of Noncompliance Not Timely Corrected (corrected more than one year from identification of the noncompliance)
4 Number of FFY 2011 findings not timely corrected (same as the number from (3) above)
0
5 Number of FFY 2011 findings the State has verified as corrected beyond the one-year timeline (“subsequent correction”)
0
6 Number of FFY 2011 findings not yet verified as corrected [(4) minus (5)] 0
Review item N Yes No Percentage
Annual IEP Goals 129 129 0 100.0%
Activities and Strategies 129 129 0 100.0%
Age-Appropriate Transition Assessment 129 128 1 99.2%
Measurable Post-Secondary Goals 129 128 1 99.2%
Agency Invitation to meeting 129 126 3 97.7%
Student Invitation to Meeting 129 126 3 97.7%
Course of Study 129 117 12 90.6%
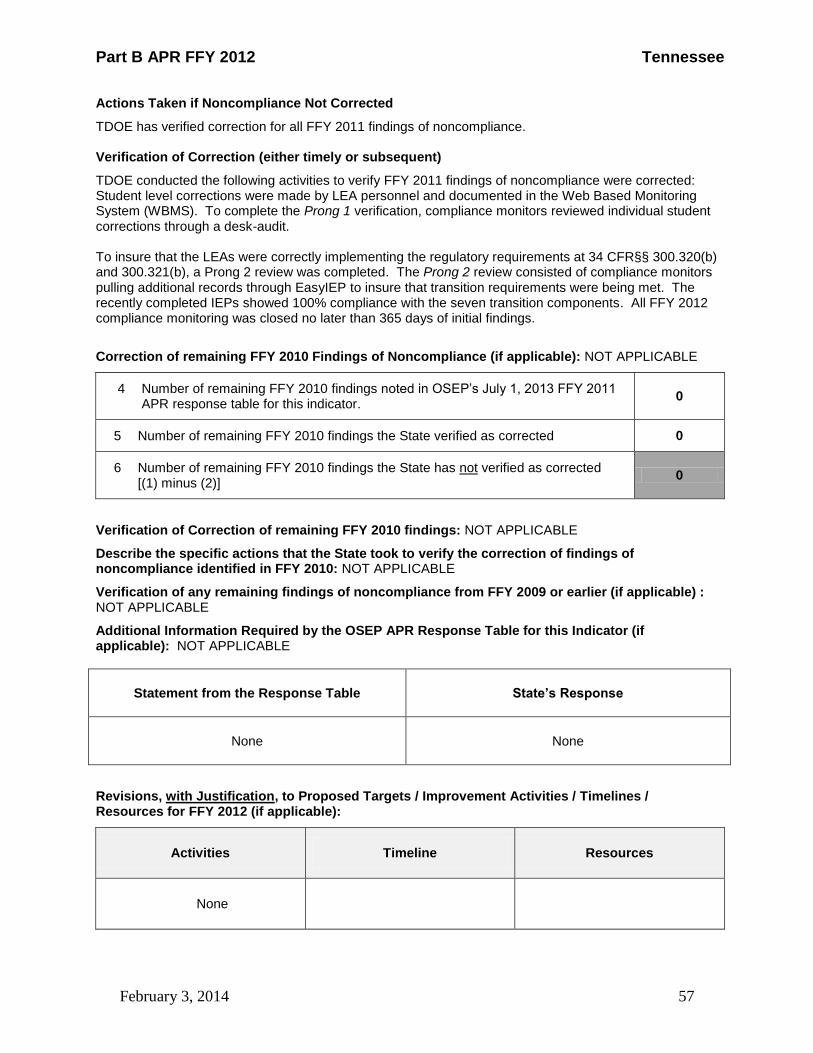
Part B APR FFY 2012 Tennessee
February 3, 2014 57
Actions Taken if Noncompliance Not Corrected
TDOE has verified correction for all FFY 2011 findings of noncompliance. Verification of Correction (either timely or subsequent)
TDOE conducted the following activities to verify FFY 2011 findings of noncompliance were corrected: Student level corrections were made by LEA personnel and documented in the Web Based Monitoring System (WBMS). To complete the Prong 1 verification, compliance monitors reviewed individual student corrections through a desk-audit. To insure that the LEAs were correctly implementing the regulatory requirements at 34 CFR§§ 300.320(b) and 300.321(b), a Prong 2 review was completed. The Prong 2 review consisted of compliance monitors pulling additional records through EasyIEP to insure that transition requirements were being met. The recently completed IEPs showed 100% compliance with the seven transition components. All FFY 2012 compliance monitoring was closed no later than 365 days of initial findings.
Correction of remaining FFY 2010 Findings of Noncompliance (if applicable): NOT APPLICABLE
4 Number of remaining FFY 2010 findings noted in OSEP’s July 1, 2013 FFY 2011 APR response table for this indicator.
0
5 Number of remaining FFY 2010 findings the State verified as corrected 0
6 Number of remaining FFY 2010 findings the State has not verified as corrected [(1) minus (2)]
0
Verification of Correction of remaining FFY 2010 findings: NOT APPLICABLE
Describe the specific actions that the State took to verify the correction of findings of noncompliance identified in FFY 2010: NOT APPLICABLE
Verification of any remaining findings of noncompliance from FFY 2009 or earlier (if applicable) : NOT APPLICABLE
Additional Information Required by the OSEP APR Response Table for this Indicator (if applicable): NOT APPLICABLE
Statement from the Response Table State’s Response
None None
Revisions, with Justification, to Proposed Targets / Improvement Activities / Timelines / Resources for FFY 2012 (if applicable):
Activities Timeline Resources
None

Part B APR FFY 2012 Tennessee
February 3, 2014 58
Part B State Annual Performance Report (APR) for FFY 2012
Overview of the Annual Performance Report Development: See page 3
Monitoring Priority: Effective General Supervision Part B / Effective Transition
INDICATOR 14: Percent of youth who are no longer in secondary school, had IEPs in effect at the time they left school, and were:
A. Enrolled in higher education within one year of leaving high school.
B. Enrolled in higher education or competitively employed within one year of leaving high school.
C. Enrolled in higher education or in some other postsecondary education or training program; or competitively employed or in some other employment within one year of leaving high school.
(20 U.S.C. 1416(a)(3)(B))
Measurement
A. Percent enrolled in higher education = [(# of youth who are no longer in secondary school, had IEPs in effect at the time they left school and were enrolled in higher education within one year of leaving high school) divided by the (# of respondent youth who are no longer in secondary school and had IEPs in effect at the time they left school)] times 100.
B. Percent enrolled in higher education or competitively employed within one year of leaving high school = [(# of youth who are no longer in secondary school, had IEPs in effect at the time they left school and were enrolled in higher education or competitively employed within one year of leaving high school) divided by the (# of respondent youth who are no longer in secondary school and had IEPs in effect at the time they left school)] times 100.
C. Percent enrolled in higher education, or in some other postsecondary education or training program; or competitively employed or in some other employment = [(# of youth who are no longer in secondary school, had IEPs in effect at the time they left school and were enrolled in higher education, or in some other postsecondary education or training program; or competitively employed or in some other employment) divided by the (# of respondent youth who are no longer in secondary school and had IEPs in effect at the time they left school)] times 100.
FFY Measurable and Rigorous Target
2012
a) Percent enrolled in Higher Education – 23.5%
b) Percent enrolled in higher education or competitively employed – 58.5%
c) Percent enrolled in higher education or some other postsecondary education or training program or competitively employed or in some other employment – 67.5%
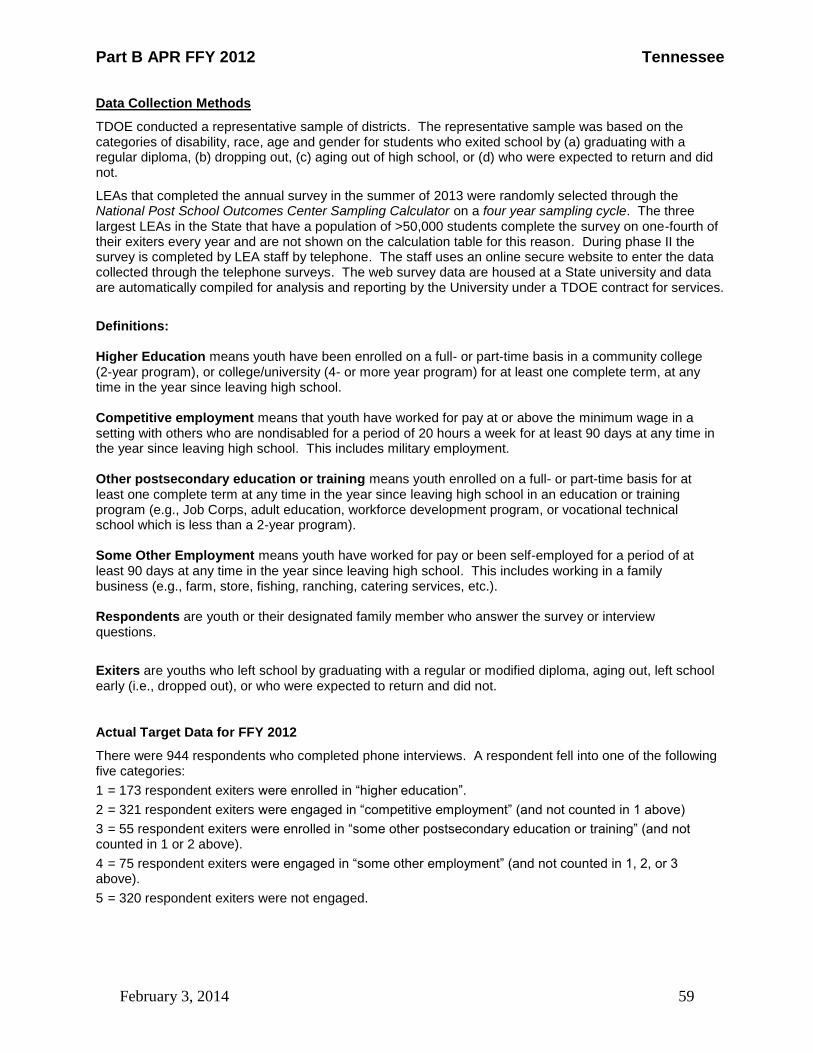
Part B APR FFY 2012 Tennessee
February 3, 2014 59
Data Collection Methods
TDOE conducted a representative sample of districts. The representative sample was based on the categories of disability, race, age and gender for students who exited school by (a) graduating with a regular diploma, (b) dropping out, (c) aging out of high school, or (d) who were expected to return and did not.
LEAs that completed the annual survey in the summer of 2013 were randomly selected through the National Post School Outcomes Center Sampling Calculator on a four year sampling cycle. The three largest LEAs in the State that have a population of >50,000 students complete the survey on one-fourth of their exiters every year and are not shown on the calculation table for this reason. During phase II the survey is completed by LEA staff by telephone. The staff uses an online secure website to enter the data collected through the telephone surveys. The web survey data are housed at a State university and data are automatically compiled for analysis and reporting by the University under a TDOE contract for services.
Definitions:
Higher Education means youth have been enrolled on a full- or part-time basis in a community college (2-year program), or college/university (4- or more year program) for at least one complete term, at any time in the year since leaving high school. Competitive employment means that youth have worked for pay at or above the minimum wage in a setting with others who are nondisabled for a period of 20 hours a week for at least 90 days at any time in the year since leaving high school. This includes military employment. Other postsecondary education or training means youth enrolled on a full- or part-time basis for at least one complete term at any time in the year since leaving high school in an education or training program (e.g., Job Corps, adult education, workforce development program, or vocational technical school which is less than a 2-year program). Some Other Employment means youth have worked for pay or been self-employed for a period of at least 90 days at any time in the year since leaving high school. This includes working in a family business (e.g., farm, store, fishing, ranching, catering services, etc.). Respondents are youth or their designated family member who answer the survey or interview questions.
Exiters are youths who left school by graduating with a regular or modified diploma, aging out, left school early (i.e., dropped out), or who were expected to return and did not.
Actual Target Data for FFY 2012
There were 944 respondents who completed phone interviews. A respondent fell into one of the following five categories:
1 = 173 respondent exiters were enrolled in “higher education”.
2 = 321 respondent exiters were engaged in “competitive employment” (and not counted in 1 above)
3 = 55 respondent exiters were enrolled in “some other postsecondary education or training” (and not counted in 1 or 2 above).
4 = 75 respondent exiters were engaged in “some other employment” (and not counted in 1, 2, or 3 above).
5 = 320 respondent exiters were not engaged.
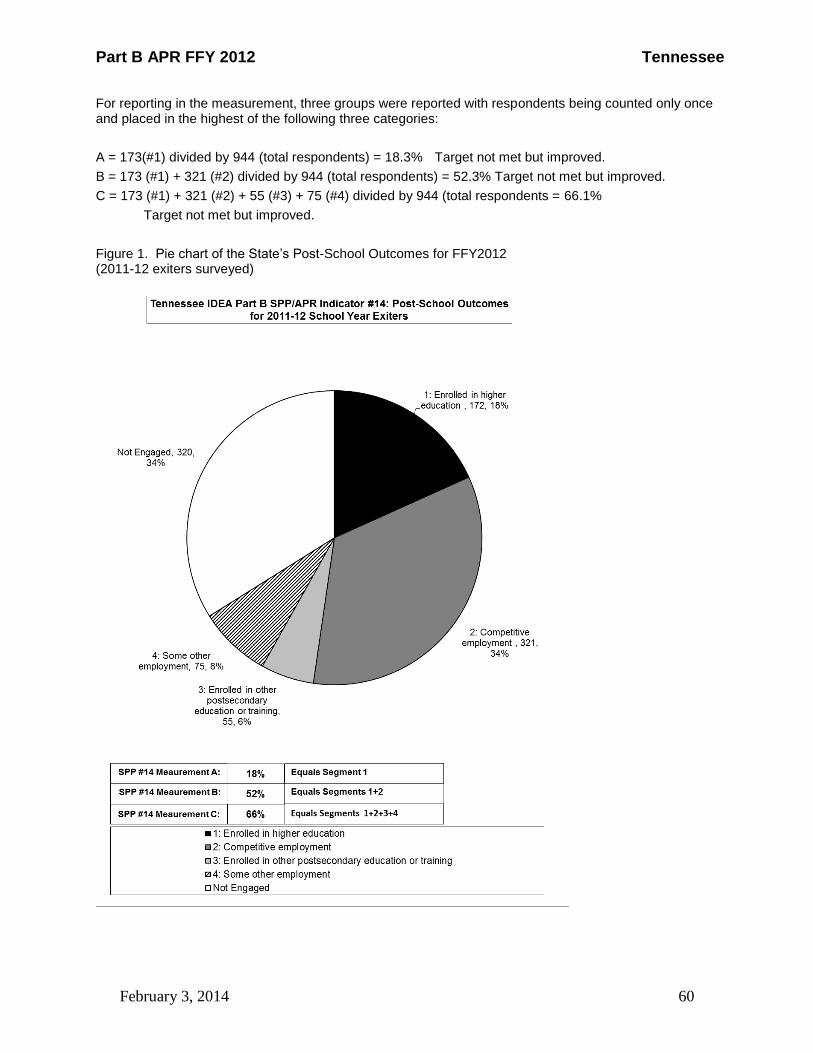
Part B APR FFY 2012 Tennessee
February 3, 2014 60
For reporting in the measurement, three groups were reported with respondents being counted only once and placed in the highest of the following three categories:
A = 173(#1) divided by 944 (total respondents) = 18.3% Target not met but improved.
B = 173 (#1) + 321 (#2) divided by 944 (total respondents) = 52.3% Target not met but improved.
C = 173 (#1) + 321 (#2) + 55 (#3) + 75 (#4) divided by 944 (total respondents = 66.1%
Target not met but improved.
Figure 1. Pie chart of the State’s Post-School Outcomes for FFY2012 (2011-12 exiters surveyed)

Part B APR FFY 2012 Tennessee
February 3, 2014 61
There was an increase in FFY 2012 across all measurements. Tennessee’s data results show that the greatest category of respondents is in the Competitively Employed category (34%). Non-engaged respondents dropped this year to 34% from 40% in FFY 2011. Since FFY 2009, Tennessee has experienced unemployment higher than the national average and the loss of many jobs; especially hard hit were rural areas with limited industry and transportation difficulties.
This increase in competitive employment has occurred even though information from the Annie E. Casey Foundation, which administers the Kids Count program identified decreased employment rates among Americans ages 16 to 24 still remains at the lowest point in 50 years. In Tennessee in 2012, fewer than 25% of 16- to 19-year olds had a job, and only 60% of Tennesseans 20-24 worked in 2012. Entry level jobs are being taken by displaced, older workers.
Not Engaged
As we examined our data in Figure 1, 320 (34%) youth who responded were categorized as not engaged. To further examine the group of youth classified as not engaged, we used the NPSO Data Display Template Revised to Include Not Engaged. This tool examines the not engaged in two categories (a) those youth who never enrolled in further education or who have never worked since leaving high school and (b) those youth who enrolled in further education or worked since leaving high school, but did not meet the criteria to be counted in one of the OSEP engagement categories (i.e., higher education, competitive employment, other postsecondary education or training, some other employment). Of the 320 youth, 84 were enrolled or working but did not meet the OSEP criteria to be counted as engaged while 236 were neither working nor had they been enrolled.
Of the 84 respondents who report some level of engagement but did not meet the criterion defined by OSEP:
32 had enrolled in higher education or other postsecondary education and training, but did not complete one term;
57 had worked but, o Had not worked at least 90 days o Made less than minimum wage o Worked less than 20 hours per week o Worked in a sheltered setting
Because work experience in high school is such a strong predictor of long-term working success and the need to support students in their challenges with obtaining and maintaining employment, the TDOE is working closely with the TN Department of Intellectual/Developmental Disabilities Services (DIDDs), TN Department of Labor and Workforce Development, TN Department of Vocational Rehabilitation, the Developmental Disabilities Council, and Vanderbilt University to encourage LEAs to provide work experiences for students prior to leaving high school. These efforts have been enhanced through grants awarded to Tennessee:
Disability Employment Initiative (DEI) – Department of Labor (DOL) grant to improve education, training, employment opportunities & outcomes for youth and adults who are unemployed, underemployed and/or receiving Social Security disability benefits.
Employment First Leadership State Mentoring Project – Office of Disability Employment Policy (ODEP) grant to help states align policies, regulations & funding priorities to encourage integrated employment as the primary outcome for individuals with significant disabilities.
Partnerships in Employment Systems Change Grant (TN Works) - Administration on Intellectual and Developmental Disabilities (AIDD) grant to focus on systems change to prioritize employment as the first and preferred option for youth and young adults with intellectual and developmental disabilities. The grant will encourage partnerships to promote systems change efforts, development of policies that support competitive employment in integrated settings.
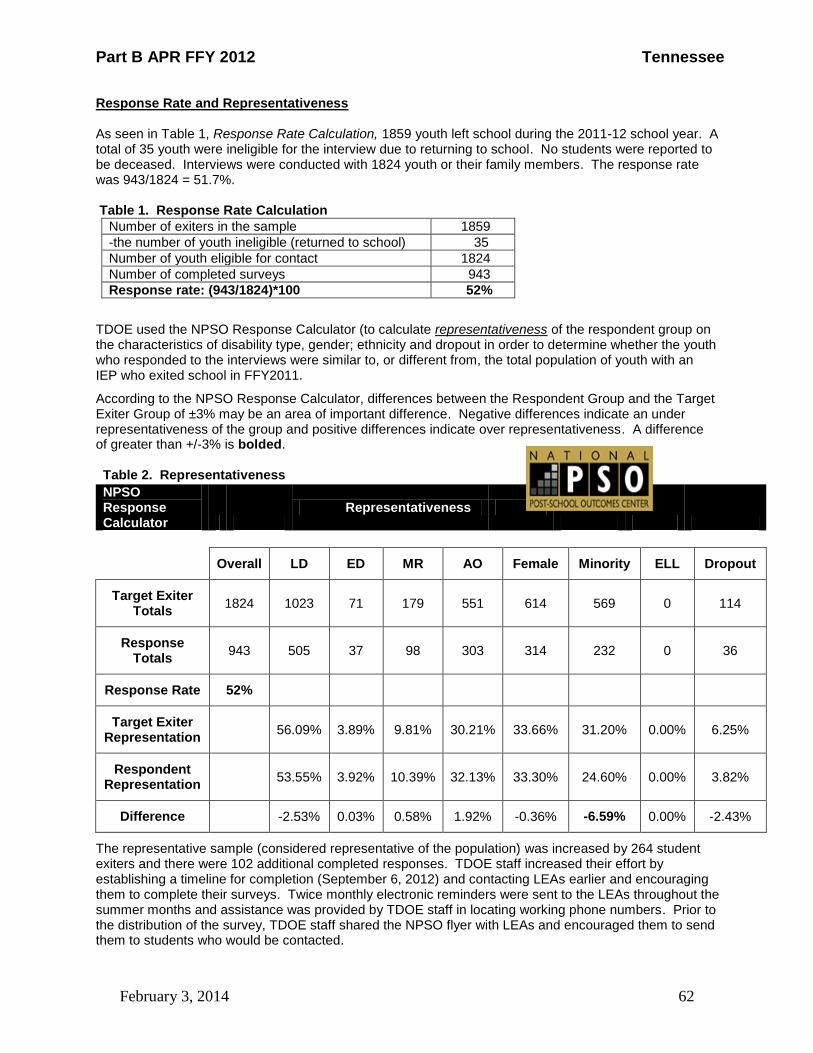
Part B APR FFY 2012 Tennessee
February 3, 2014 62
Response Rate and Representativeness As seen in Table 1, Response Rate Calculation, 1859 youth left school during the 2011-12 school year. A total of 35 youth were ineligible for the interview due to returning to school. No students were reported to be deceased. Interviews were conducted with 1824 youth or their family members. The response rate was 943/1824 = 51.7%. Table 1. Response Rate Calculation
Number of exiters in the sample 1859
-the number of youth ineligible (returned to school) 35
Number of youth eligible for contact 1824
Number of completed surveys 943
Response rate: (943/1824)*100 52%
TDOE used the NPSO Response Calculator (to calculate representativeness of the respondent group on the characteristics of disability type, gender; ethnicity and dropout in order to determine whether the youth who responded to the interviews were similar to, or different from, the total population of youth with an IEP who exited school in FFY2011.
According to the NPSO Response Calculator, differences between the Respondent Group and the Target Exiter Group of ±3% may be an area of important difference. Negative differences indicate an under representativeness of the group and positive differences indicate over representativeness. A difference of greater than +/-3% is bolded. Table 2. Representativeness
NPSO Response Calculator
Representativeness
Overall LD ED MR AO Female Minority ELL Dropout
Target Exiter Totals
1824 1023 71 179 551 614 569 0 114
Response Totals
943 505 37 98 303 314 232 0 36
Response Rate 52%
Target Exiter Representation
56.09% 3.89% 9.81% 30.21% 33.66% 31.20% 0.00% 6.25%
Respondent Representation
53.55% 3.92% 10.39% 32.13% 33.30% 24.60% 0.00% 3.82%
Difference -2.53% 0.03% 0.58% 1.92% -0.36% -6.59% 0.00% -2.43%
The representative sample (considered representative of the population) was increased by 264 student exiters and there were 102 additional completed responses. TDOE staff increased their effort by establishing a timeline for completion (September 6, 2012) and contacting LEAs earlier and encouraging them to complete their surveys. Twice monthly electronic reminders were sent to the LEAs throughout the summer months and assistance was provided by TDOE staff in locating working phone numbers. Prior to the distribution of the survey, TDOE staff shared the NPSO flyer with LEAs and encouraged them to send them to students who would be contacted.
Part B APR FFY 2012 Tennessee
February 3, 2014 63
Missing Data
LEAs were unable to reach 48% or 881 members of the exiter population. Four LEAs accounted for 56.8% or 500 of the exiters never reached. Follow-up information from these four LEAs indicates that many of the exiters could not be contacted because of invalid or incomplete contact information. Multiple calls or additional contacts are recommended to LEAs to improve the response level.
Selection Bias
The under representativeness of minority youth can be attributed to this group of youth being difficult to reach. Minority students are traditionally the ones with poor contact information. Tennessee has greatly reduced the discrepancy in representation in the areas of Minority participation over the past two years by almost 13% with our improvement strategies. This approach will become standard operating procedure.
Trend Data
Using the NPSO Trend Data Display+3, we compared our Actual Target Data achieved this year to the Rigorous and Measurable Targets for FFY 2012 established in FFY 2009. The following figures from the Trend Data Displays +3 for measures A, B, and C displays columns for baseline and targets, and a () square symbol denoting annual data achieved for each FFY. In each chart below, the black column on the left represents the baseline data, the three gray columns represent the targets set for FFY 2010 –2013, and the () square symbol represents the annual data achieved for FFY 2011 - 2012. The position of the () square symbol represents the achieved data in relation to the target. The line that connects the () square symbols illustrates the trend (i.e., positive or negative) in the data. We determine progress or slippage for each measure A, B, and C by comparing achieved data for FFY 2012 to achieved data from FFY 2011.
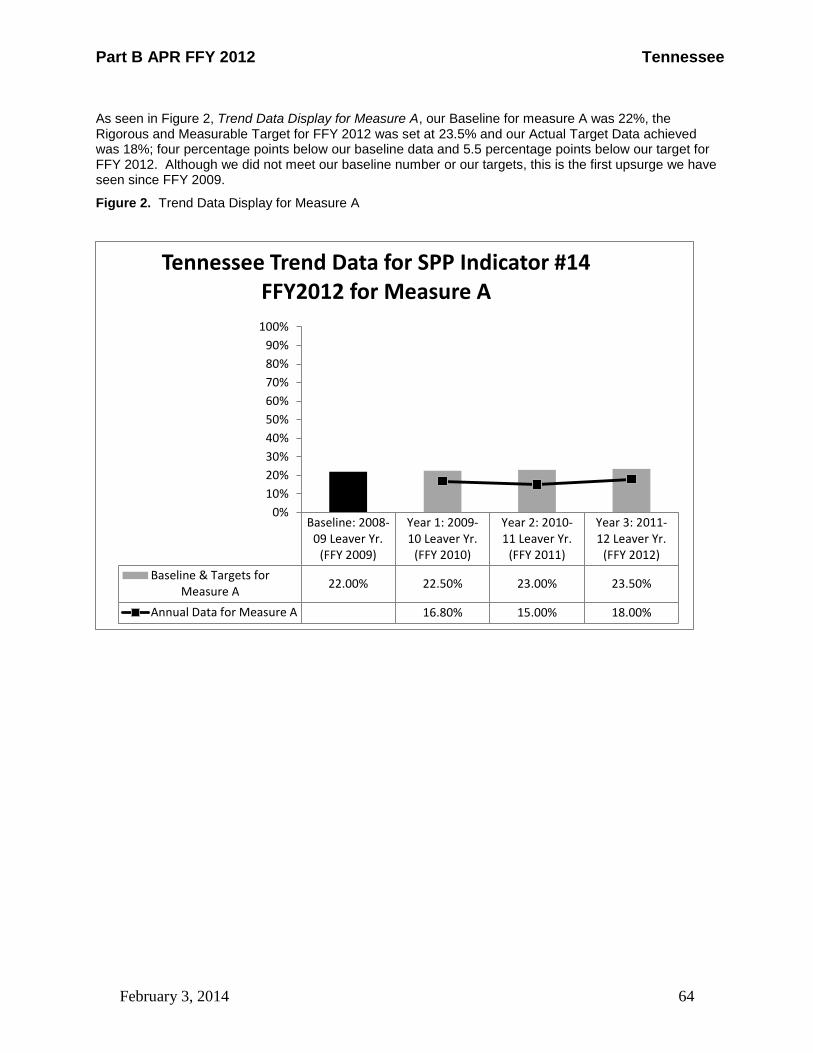
Part B APR FFY 2012 Tennessee
February 3, 2014 64
As seen in Figure 2, Trend Data Display for Measure A, our Baseline for measure A was 22%, the Rigorous and Measurable Target for FFY 2012 was set at 23.5% and our Actual Target Data achieved was 18%; four percentage points below our baseline data and 5.5 percentage points below our target for FFY 2012. Although we did not meet our baseline number or our targets, this is the first upsurge we have seen since FFY 2009.
Figure 2. Trend Data Display for Measure A
Baseline: 2008-09 Leaver Yr.
(FFY 2009)
Year 1: 2009-10 Leaver Yr.
(FFY 2010)
Year 2: 2010-11 Leaver Yr.
(FFY 2011)
Year 3: 2011-12 Leaver Yr.
(FFY 2012)
Baseline & Targets forMeasure A
22.00% 22.50% 23.00% 23.50%
Annual Data for Measure A 16.80% 15.00% 18.00%
0%
10%
20%
30%
40%
50%
60%
70%
80%
90%
100%
Tennessee Trend Data for SPP Indicator #14 FFY2012 for Measure A

Part B APR FFY 2012 Tennessee
February 3, 2014 65
As seen in figure 3, Trend Data Display for Measure B, our Baseline for measure B was 57%, the Rigorous and Measurable Target for FFY 2012 was set 58.5% and our Actual Target Data achieved was 52%; five points below our baseline data and 6.5 percentage points below our target for FFY 2012. Although we did not meet our baseline number or our targets, we are able to report some progress. Figure 3. Trend Data Display for Measure B
Baseline: 2008-09 Leaver Yr.
(FFY 2009)
Year 1: 2009-10Leaver Yr. (FFY
2010)
Year 2: 2010-11Leaver Yr. (FFY
2011)
Year 3: 2011-12Leaver Yr. (FFY
2012)
Baseline & Annual Data forMeasure B
57.00% 57.50% 58.00% 58.50%
Annual Data for Measure B 51.40% 50.90% 52.00%
0%
10%
20%
30%
40%
50%
60%
70%
80%
90%
100%
Tennessee Trend Data for SPP Indicator #14 FFY2012 for Measure B
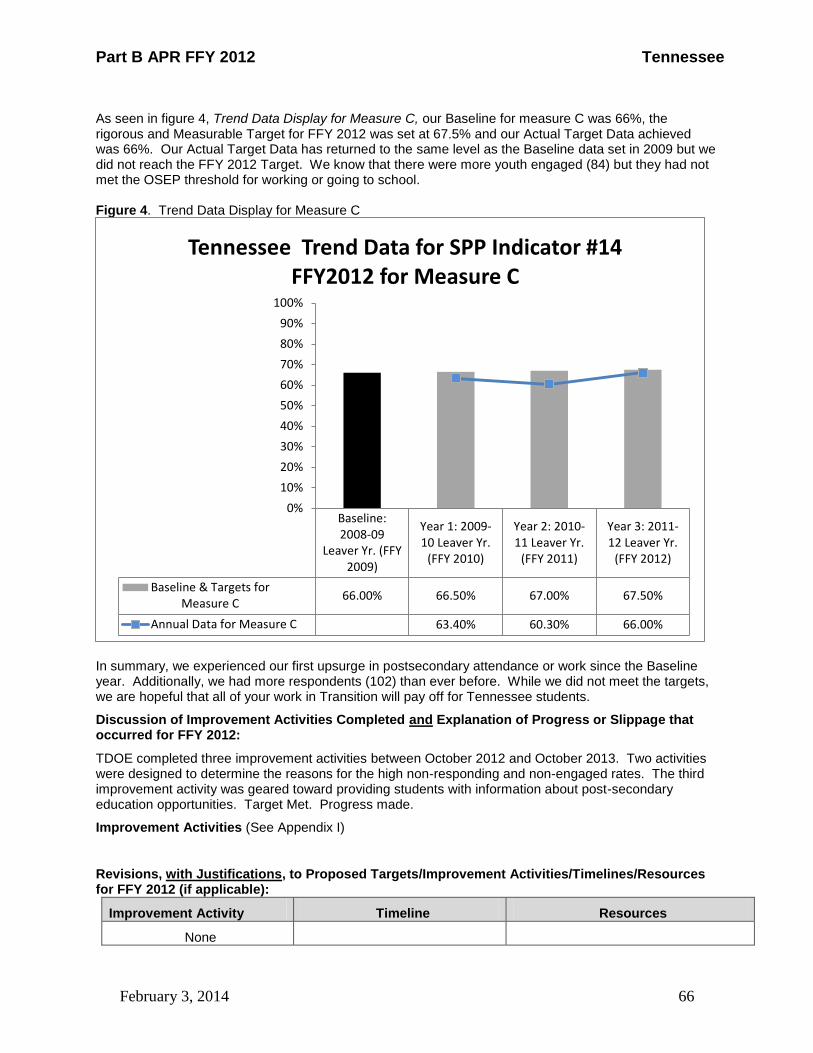
Part B APR FFY 2012 Tennessee
February 3, 2014 66
As seen in figure 4, Trend Data Display for Measure C, our Baseline for measure C was 66%, the rigorous and Measurable Target for FFY 2012 was set at 67.5% and our Actual Target Data achieved was 66%. Our Actual Target Data has returned to the same level as the Baseline data set in 2009 but we did not reach the FFY 2012 Target. We know that there were more youth engaged (84) but they had not met the OSEP threshold for working or going to school. Figure 4. Trend Data Display for Measure C
In summary, we experienced our first upsurge in postsecondary attendance or work since the Baseline year. Additionally, we had more respondents (102) than ever before. While we did not meet the targets, we are hopeful that all of your work in Transition will pay off for Tennessee students.
Discussion of Improvement Activities Completed and Explanation of Progress or Slippage that occurred for FFY 2012:
TDOE completed three improvement activities between October 2012 and October 2013. Two activities were designed to determine the reasons for the high non-responding and non-engaged rates. The third improvement activity was geared toward providing students with information about post-secondary education opportunities. Target Met. Progress made.
Improvement Activities (See Appendix I)
Revisions, with Justifications, to Proposed Targets/Improvement Activities/Timelines/Resources for FFY 2012 (if applicable):
Improvement Activity Timeline Resources
None
Baseline:2008-09
Leaver Yr. (FFY2009)
Year 1: 2009-10 Leaver Yr.
(FFY 2010)
Year 2: 2010-11 Leaver Yr.
(FFY 2011)
Year 3: 2011-12 Leaver Yr.
(FFY 2012)
Baseline & Targets forMeasure C
66.00% 66.50% 67.00% 67.50%
Annual Data for Measure C 63.40% 60.30% 66.00%
0%
10%
20%
30%
40%
50%
60%
70%
80%
90%
100%
Tennessee Trend Data for SPP Indicator #14 FFY2012 for Measure C
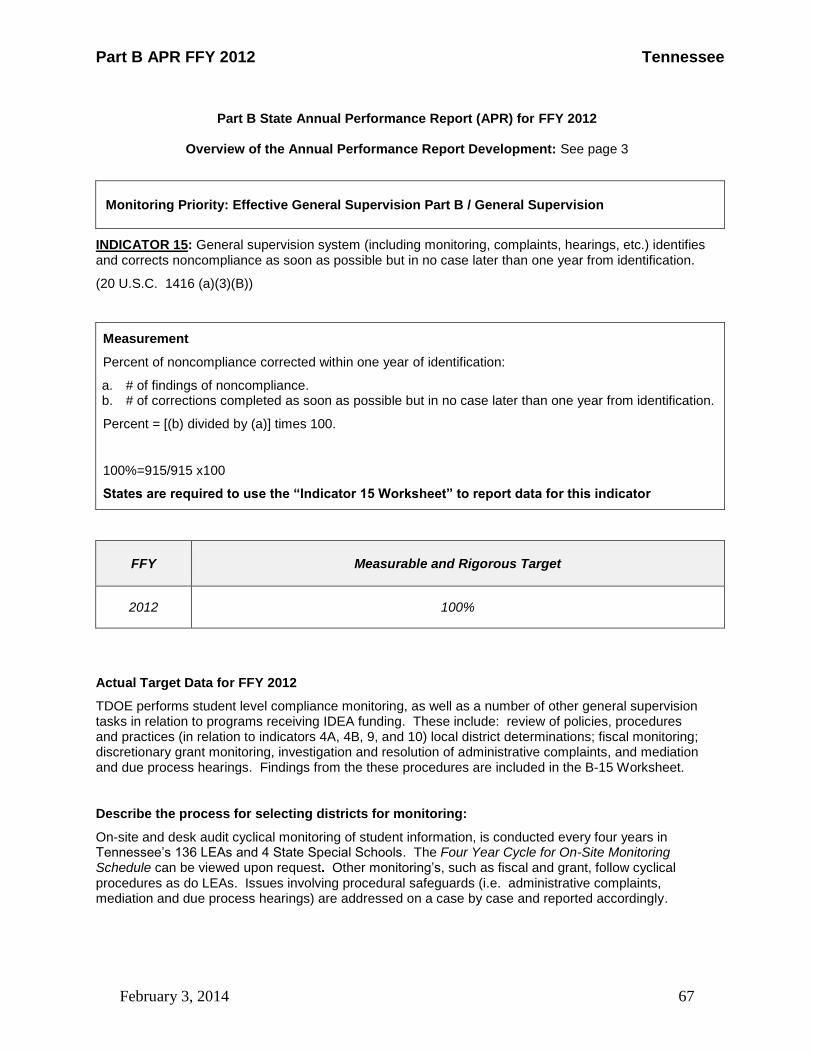
Part B APR FFY 2012 Tennessee
February 3, 2014 67
Part B State Annual Performance Report (APR) for FFY 2012
Overview of the Annual Performance Report Development: See page 3
Monitoring Priority: Effective General Supervision Part B / General Supervision
INDICATOR 15: General supervision system (including monitoring, complaints, hearings, etc.) identifies and corrects noncompliance as soon as possible but in no case later than one year from identification.
(20 U.S.C. 1416 (a)(3)(B))
Measurement
Percent of noncompliance corrected within one year of identification:
a. # of findings of noncompliance. b. # of corrections completed as soon as possible but in no case later than one year from identification.
Percent = [(b) divided by (a)] times 100.
100%=915/915 x100
States are required to use the “Indicator 15 Worksheet” to report data for this indicator
FFY Measurable and Rigorous Target
2012 100%
Actual Target Data for FFY 2012
TDOE performs student level compliance monitoring, as well as a number of other general supervision tasks in relation to programs receiving IDEA funding. These include: review of policies, procedures and practices (in relation to indicators 4A, 4B, 9, and 10) local district determinations; fiscal monitoring; discretionary grant monitoring, investigation and resolution of administrative complaints, and mediation and due process hearings. Findings from the these procedures are included in the B-15 Worksheet.
Describe the process for selecting districts for monitoring:
On-site and desk audit cyclical monitoring of student information, is conducted every four years in Tennessee’s 136 LEAs and 4 State Special Schools. The Four Year Cycle for On-Site Monitoring Schedule can be viewed upon request. Other monitoring’s, such as fiscal and grant, follow cyclical procedures as do LEAs. Issues involving procedural safeguards (i.e. administrative complaints, mediation and due process hearings) are addressed on a case by case and reported accordingly.

Part B APR FFY 2012 Tennessee
February 3, 2014 68
Discussion of Improvement Activities Completed and Explanation of Progress or Slippage that Occurred for FFY 2012
The target of 100% compliance has been met. The percent of FFY 2011 noncompliance corrected and verified within one year was 100.00%.
Improvement Activities (See Appendix I)
Timely Correction of FFY 2011 Findings of Noncompliance (corrected within one year from identification of the noncompliance)
1. Number of findings of noncompliance the State made during FFY 2011 (the period from July 1, 2011 through June 30, 2012) (Sum of Column a on the Indicator B15 Worksheet)
915
2. Number of findings the State verified as timely corrected (corrected within one year from the date of notification to the LEA of the finding) (Sum of Column b on the Indicator B15 Worksheet)
915
3. Number of findings not verified as corrected within one year [(1) minus (2)] 0
FFY 2011 Findings of Noncompliance Not Timely Corrected (corrected more than one year from identification of the noncompliance and/or Not Corrected) NOT APPLICABLE
4. Number of FFY 2011 findings not timely corrected (same as the number from (3) above)
0
5. Number of FFY 2011 findings the State has verified as corrected beyond the one-year timeline (“subsequent correction”)
0
6. Number of FFY 2011 findings not yet verified as corrected [(4) minus (5)] 0
Verification of Correction of FFY 2011 for findings of noncompliance identified in FFT 2011 (either timely or subsequent): Prong 1 The FFY 2011 TDOE onsite compliance monitoring included a 4-year cyclical file review of randomly selected files with 35 school districts included in this review. Through the onsite file review process, TDOE monitored IEP files and recorded all instances of student-level noncompliance. All individual noncompliance was reported to the LEA. A district level summary report was provided to each LEA with an item-level analysis for the number of items found to be compliant and noncompliant. The provision of this report to the LEA began the 365 day timeline for the 100% correction of student level noncompliance. This report also set the requirement and timeline for LEAs to engage in improvement activities. Districts were instructed to correct all student level noncompliance found and record the date of the correction in the WBMS, unless the child was no longer within the jurisdiction of the LEA. Then TDOE compliance monitors, utilizing the WBMS, confirmed that each individual case of noncompliance was corrected. As part of this correction process monitors documented student level corrections through the TDOE student level special education data system used throughout the State. Prong 2 To assure correct implementation of the specific regulatory requirements TDOE compliance monitors subsequently reviewed additional data (i.e. student files) through a desk top review utilizing the statewide student level data system. All additional data reviewed had to be 100% correct before the LEA was issued a closing letter.
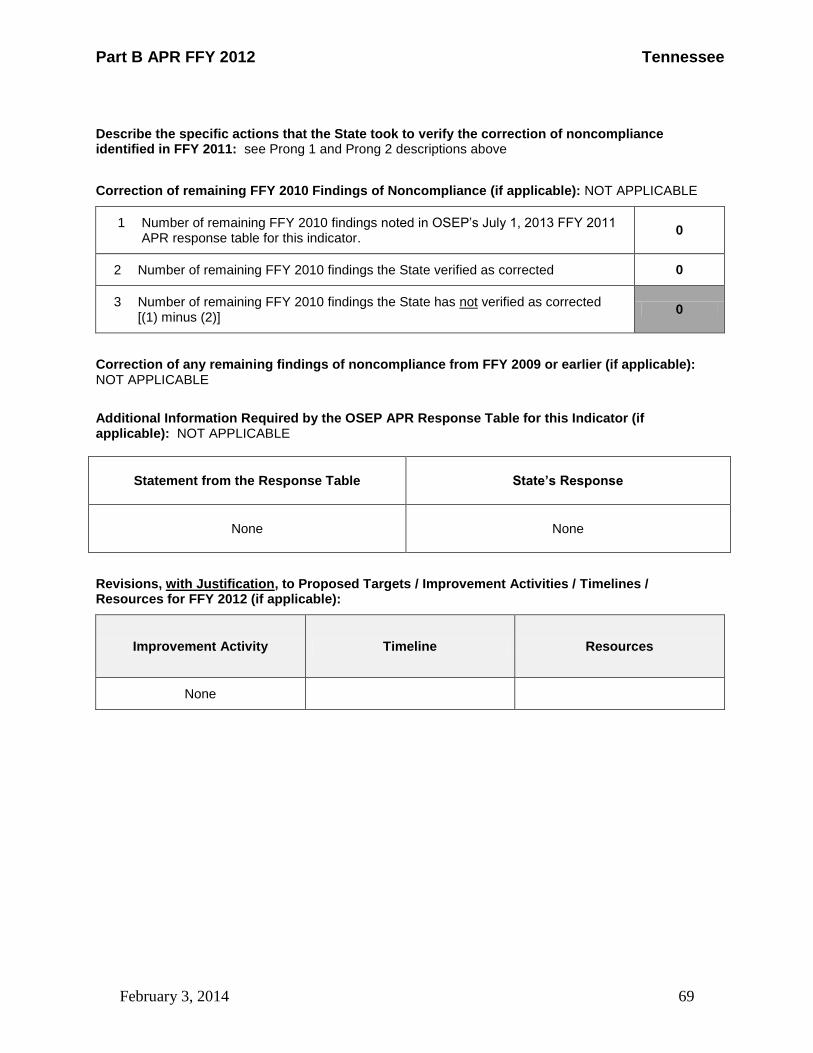
Part B APR FFY 2012 Tennessee
February 3, 2014 69
Describe the specific actions that the State took to verify the correction of noncompliance identified in FFY 2011: see Prong 1 and Prong 2 descriptions above
Correction of remaining FFY 2010 Findings of Noncompliance (if applicable): NOT APPLICABLE
1 Number of remaining FFY 2010 findings noted in OSEP’s July 1, 2013 FFY 2011 APR response table for this indicator.
0
2 Number of remaining FFY 2010 findings the State verified as corrected 0
3 Number of remaining FFY 2010 findings the State has not verified as corrected [(1) minus (2)]
0
Correction of any remaining findings of noncompliance from FFY 2009 or earlier (if applicable): NOT APPLICABLE
Additional Information Required by the OSEP APR Response Table for this Indicator (if applicable): NOT APPLICABLE
Statement from the Response Table State’s Response
None None
Revisions, with Justification, to Proposed Targets / Improvement Activities / Timelines / Resources for FFY 2012 (if applicable):
Improvement Activity Timeline Resources
None
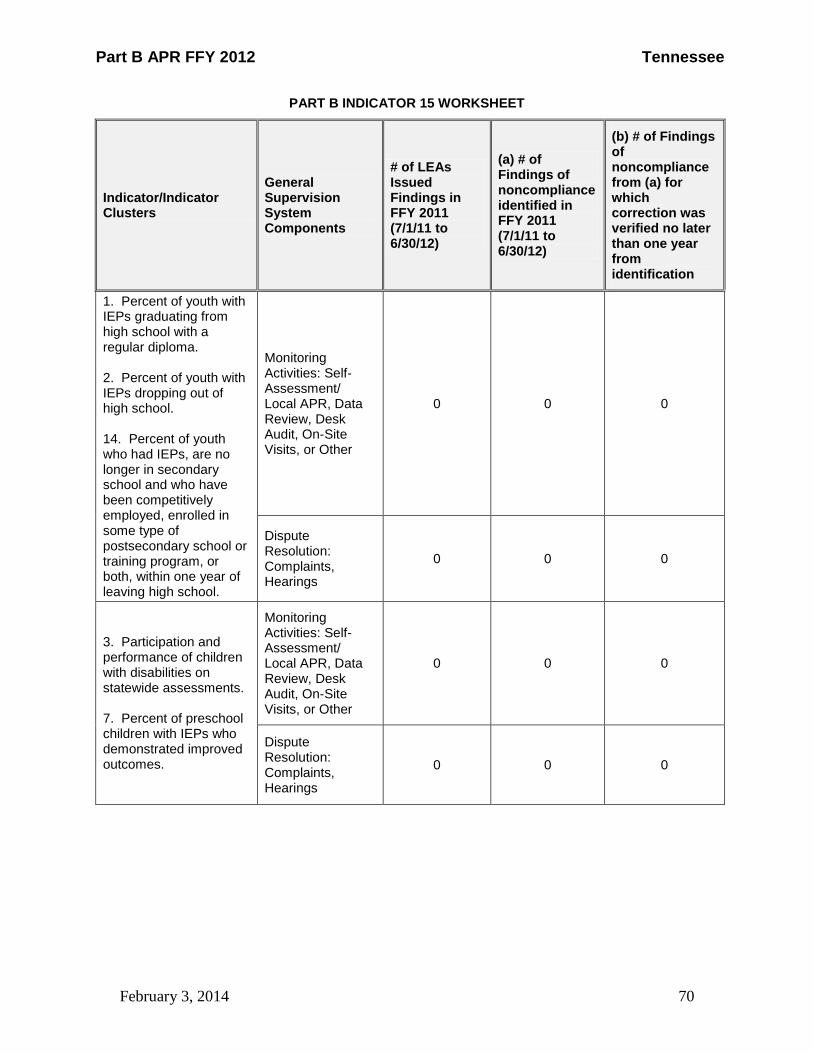
Part B APR FFY 2012 Tennessee
February 3, 2014 70
PART B INDICATOR 15 WORKSHEET
Indicator/Indicator Clusters
General Supervision System Components
# of LEAs Issued Findings in FFY 2011 (7/1/11 to 6/30/12)
(a) # of Findings of noncompliance identified in FFY 2011 (7/1/11 to 6/30/12)
(b) # of Findings of noncompliance from (a) for which correction was verified no later than one year from identification
1. Percent of youth with IEPs graduating from high school with a regular diploma. 2. Percent of youth with IEPs dropping out of high school. 14. Percent of youth who had IEPs, are no longer in secondary school and who have been competitively employed, enrolled in some type of postsecondary school or training program, or both, within one year of leaving high school.
Monitoring Activities: Self-Assessment/ Local APR, Data Review, Desk Audit, On-Site Visits, or Other
0 0 0
Dispute Resolution: Complaints, Hearings
0 0 0
3. Participation and performance of children with disabilities on statewide assessments. 7. Percent of preschool children with IEPs who demonstrated improved outcomes.
Monitoring Activities: Self-Assessment/ Local APR, Data Review, Desk Audit, On-Site Visits, or Other
0 0 0
Dispute Resolution: Complaints, Hearings
0 0 0
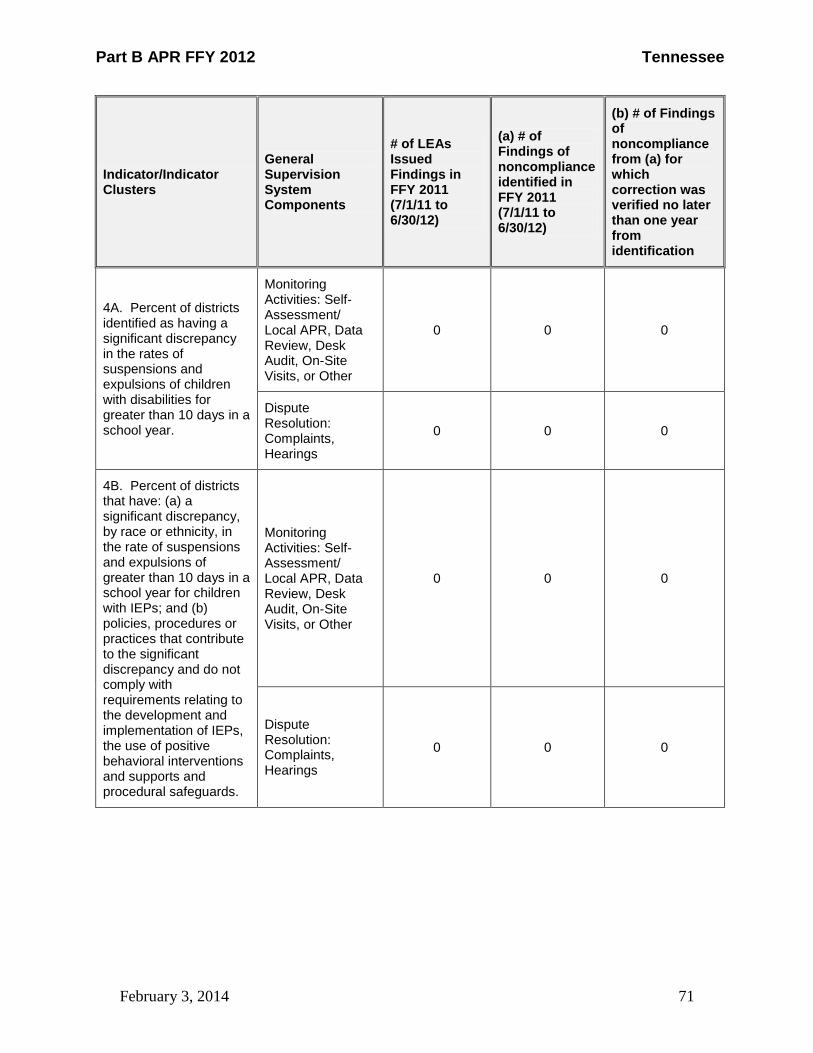
Part B APR FFY 2012 Tennessee
February 3, 2014 71
Indicator/Indicator Clusters
General Supervision System Components
# of LEAs Issued Findings in FFY 2011 (7/1/11 to 6/30/12)
(a) # of Findings of noncompliance identified in FFY 2011 (7/1/11 to 6/30/12)
(b) # of Findings of noncompliance from (a) for which correction was verified no later than one year from identification
4A. Percent of districts identified as having a significant discrepancy in the rates of suspensions and expulsions of children with disabilities for greater than 10 days in a school year.
Monitoring Activities: Self-Assessment/ Local APR, Data Review, Desk Audit, On-Site Visits, or Other
0 0 0
Dispute Resolution: Complaints, Hearings
0 0 0
4B. Percent of districts that have: (a) a significant discrepancy, by race or ethnicity, in the rate of suspensions and expulsions of greater than 10 days in a school year for children with IEPs; and (b) policies, procedures or practices that contribute to the significant discrepancy and do not comply with requirements relating to the development and implementation of IEPs, the use of positive behavioral interventions and supports and procedural safeguards.
Monitoring Activities: Self-Assessment/ Local APR, Data Review, Desk Audit, On-Site Visits, or Other
0 0 0
Dispute Resolution: Complaints, Hearings
0 0 0
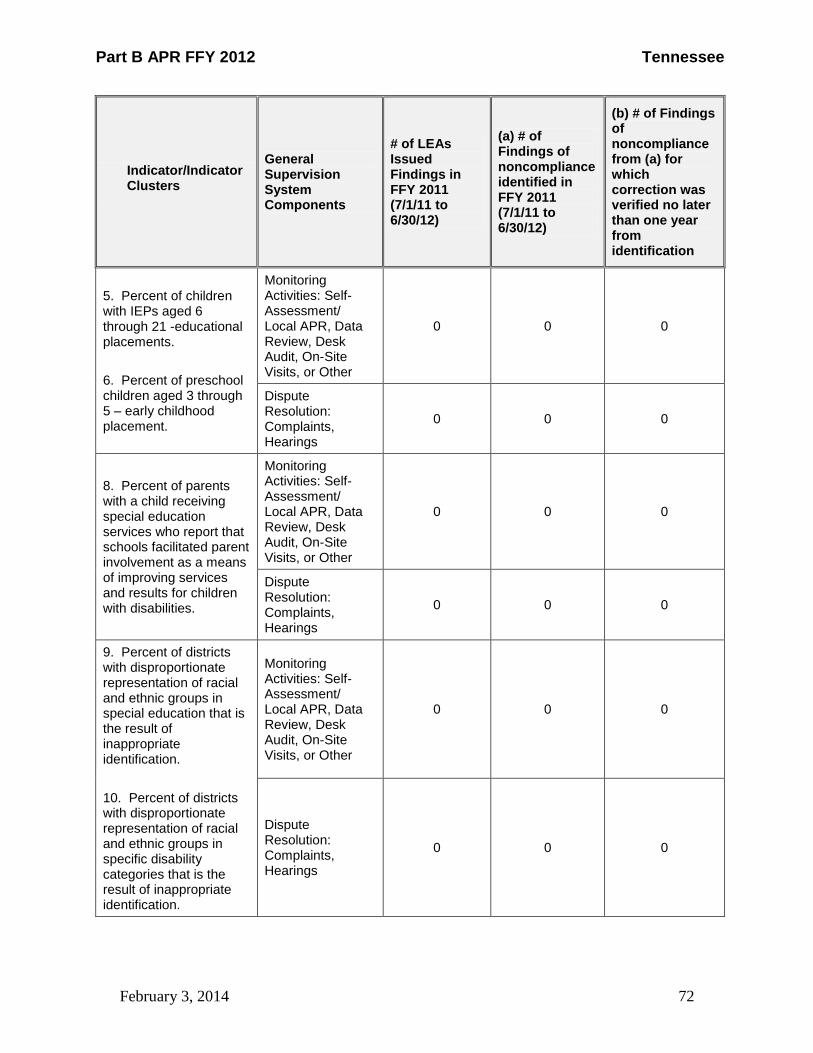
Part B APR FFY 2012 Tennessee
February 3, 2014 72
Indicator/Indicator Clusters
General Supervision System Components
# of LEAs Issued Findings in FFY 2011 (7/1/11 to 6/30/12)
(a) # of Findings of noncompliance identified in FFY 2011 (7/1/11 to 6/30/12)
(b) # of Findings of noncompliance from (a) for which correction was verified no later than one year from identification
5. Percent of children with IEPs aged 6 through 21 -educational placements.
6. Percent of preschool children aged 3 through 5 – early childhood placement.
Monitoring Activities: Self-Assessment/ Local APR, Data Review, Desk Audit, On-Site Visits, or Other
0 0 0
Dispute Resolution: Complaints, Hearings
0 0 0
8. Percent of parents with a child receiving special education services who report that schools facilitated parent involvement as a means of improving services and results for children with disabilities.
Monitoring Activities: Self-Assessment/ Local APR, Data Review, Desk Audit, On-Site Visits, or Other
0 0 0
Dispute Resolution: Complaints, Hearings
0 0 0
9. Percent of districts with disproportionate representation of racial and ethnic groups in special education that is the result of inappropriate identification.
10. Percent of districts with disproportionate representation of racial and ethnic groups in specific disability categories that is the result of inappropriate identification.
Monitoring Activities: Self-Assessment/ Local APR, Data Review, Desk Audit, On-Site Visits, or Other
0 0 0
Dispute Resolution: Complaints, Hearings
0 0 0
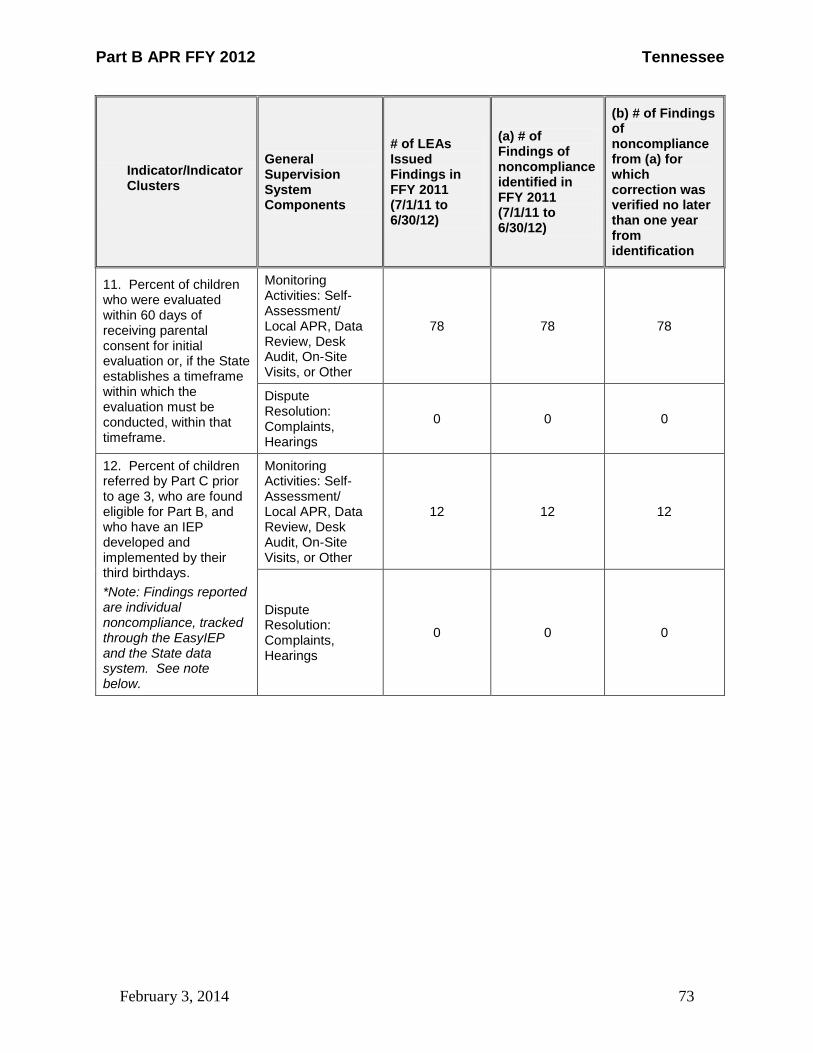
Part B APR FFY 2012 Tennessee
February 3, 2014 73
Indicator/Indicator Clusters
General Supervision System Components
# of LEAs Issued Findings in FFY 2011 (7/1/11 to 6/30/12)
(a) # of Findings of noncompliance identified in FFY 2011 (7/1/11 to 6/30/12)
(b) # of Findings of noncompliance from (a) for which correction was verified no later than one year from identification
11. Percent of children who were evaluated within 60 days of receiving parental consent for initial evaluation or, if the State establishes a timeframe within which the evaluation must be conducted, within that timeframe.
Monitoring Activities: Self-Assessment/ Local APR, Data Review, Desk Audit, On-Site Visits, or Other
78 78 78
Dispute Resolution: Complaints, Hearings
0 0 0
12. Percent of children referred by Part C prior to age 3, who are found eligible for Part B, and who have an IEP developed and implemented by their third birthdays.
*Note: Findings reported are individual noncompliance, tracked through the EasyIEP and the State data system. See note below.
Monitoring Activities: Self-Assessment/ Local APR, Data Review, Desk Audit, On-Site Visits, or Other
12 12 12
Dispute Resolution: Complaints, Hearings
0 0 0

Part B APR FFY 2012 Tennessee
February 3, 2014 74
Indicator/Indicator Clusters
General Supervision System Components
# of LEAs Issued Findings in FFY 2011 (7/1/11 to 6/30/12)
(a) # of Findings of noncompliance identified in FFY 2011 (7/1/11 to 6/30/12)
(b) # of Findings of noncompliance from (a) for which correction was verified no later than one year from identification
13. Percent of youth aged 16 and above with IEP that includes appropriate measurable postsecondary goals that are annually updated and based upon an age appropriate transition assessment, transition services, including courses of study, that will reasonably enable the student to meet those postsecondary goals, and annual IEP goals related to the student’s transition service needs.
Monitoring Activities: Self-Assessment/ Local APR, Data Review, Desk Audit, On-Site Visits, or Other
12 24 24
Dispute Resolution: Complaints, Hearings
0 0 0
Other areas of noncompliance:
IDEA Regulatory Findings – Student Records Review
Monitoring Activities: Self-Assessment/ Local APR, Data Review, Desk Audit, On-Site Visits, or Other
35 790 790
Dispute Resolution: Complaints, Hearings
0 0 0
Other areas of noncompliance:
IDEA Fiscal Monitoring
Monitoring Activities: Self-Assessment/ Local APR, Data Review, Desk Audit, On-Site Visits, or Other
5
11 11
Dispute Resolution: Complaints, Hearings
0 0 0
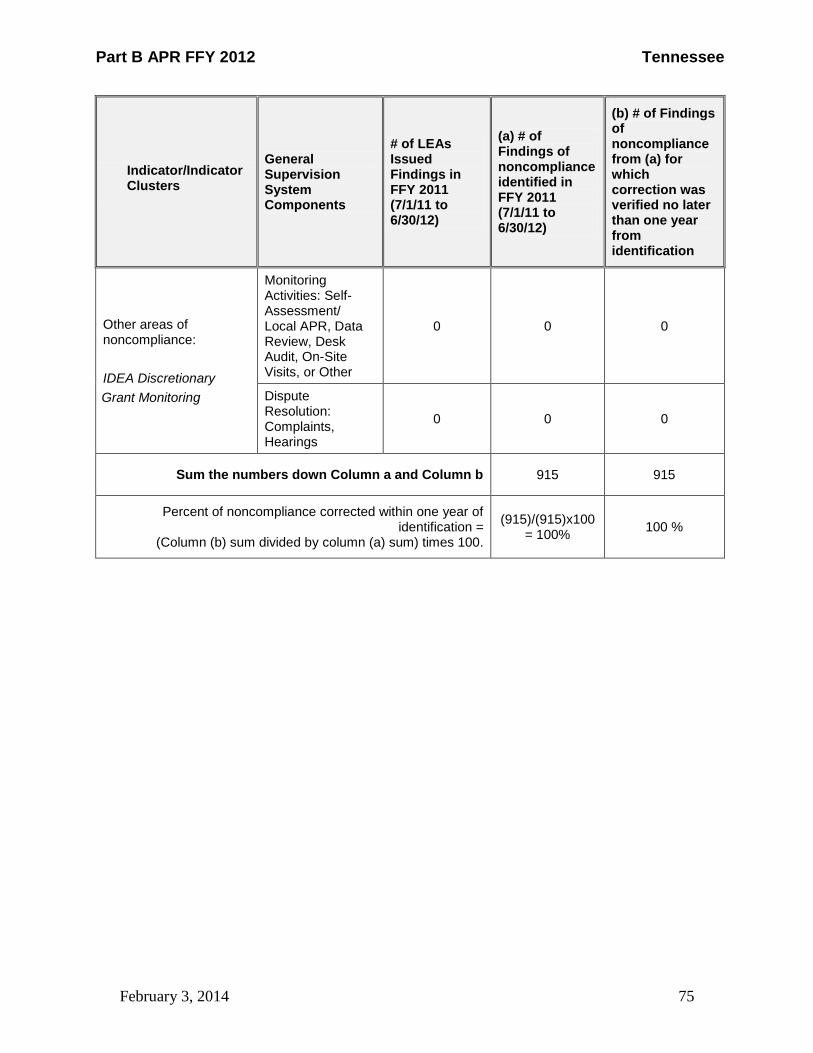
Part B APR FFY 2012 Tennessee
February 3, 2014 75
Indicator/Indicator Clusters
General Supervision System Components
# of LEAs Issued Findings in FFY 2011 (7/1/11 to 6/30/12)
(a) # of Findings of noncompliance identified in FFY 2011 (7/1/11 to 6/30/12)
(b) # of Findings of noncompliance from (a) for which correction was verified no later than one year from identification
Other areas of noncompliance:
IDEA Discretionary
Grant Monitoring
Monitoring Activities: Self-Assessment/ Local APR, Data Review, Desk Audit, On-Site Visits, or Other
0 0 0
Dispute Resolution: Complaints, Hearings
0 0 0
Sum the numbers down Column a and Column b 915 915
Percent of noncompliance corrected within one year of identification =
(Column (b) sum divided by column (a) sum) times 100.
(915)/(915)x100 = 100%
100 %
Part B APR FFY 2012 Tennessee
February 3, 2014 76
NO LONGER REQUIRED as of FFY 2011
Part B State Annual Performance Report (APR) for FFY 2012
Overview of the Annual Performance Report Development: See page 3
Monitoring Priority: Effective General Supervision Part B / General Supervision
INDICATOR 16: Percent of signed written complaints with reports issued that were resolved within 60-day timeline or a timeline extended for exceptional circumstances with respect to a particular complaint, or because the parent (or individual or organization) and the public agency agree to extend the time to engage in mediation or other alternative means of dispute resolution, if available in the State.
(20 U.S.C. 1416(a)(3)(B))
Measurement: Percent = [(1.1(b) + 1.1(c)) divided by 1.1] times 100.
FFY Measurable and Rigorous Target
2012 100% of signed written administrative complaints will be resolved within required timelines.
Actual Target Data for FFY 2011
Discussion of Improvement Activities Completed and Explanation of Progress or Slippage that Occurred for FFY 2011
Improvement Activities Discussion of Improvement Activities
completed and progress or slippage that occurred for FFY 2012
Revisions, with Justification, to Proposed Targets / Improvement Activities / Timelines / Resources for FFY 2012
Activities Timeline Resources
NONE

Part B APR FFY 2012 Tennessee
February 3, 2014 77
NO LONGER REQUIRED as of FFY 2011
Part B State Annual Performance Report (APR) for FFY 2012
Overview of the Annual Performance Report Development: See page 3
Monitoring Priority: Effective General Supervision Part B / General Supervision
INDICATOR 17: Percent of adjudicated due process hearing requests that were adjudicated within the 45-day timeline or a timeline that is properly extended by the hearing officer at the request of either party or in the case of an expedited hearing, within the required timelines.
(20 U.S.C. 1416(a)(3)(B))
Measurement: Percent = [(3.2(a) + 3.2(b)) divided by 3.2] times 100.
FFY Measurable and Rigorous Target
2012 100% of due process hearings will have written decision within the required timelines.
Actual Target Data for FFY 2012
Improvement Activities Discussion of Improvement Activities
completed and progress or slippage that occurred for FFY 2011
Revisions, with Justification, to Proposed Targets / Improvement Activities / Timelines / Resources for FFY 2012
Activities Timeline Resources
None

Part B APR FFY 2012 Tennessee
February 3, 2014 83
Part B State Annual Performance Report (APR) for FFY 2012
Overview of the Annual Performance Report Development: See page 3
Monitoring Priority: Effective General Supervision Part B / General Supervision
INDICATOR 18: Percent of hearing requests that went to resolution sessions that were resolved through resolution session settlement agreements.
(20 U.S.C. 1416(a)(3)(B))
Measurement: Percent = (3.1(a) divided by 3.1) times 100.
FFY Measurable and Rigorous Target
FFY 2012
8% of hearing requests that go to resolution sessions will be resolved through resolution session settlement agreements.
Actual Target Data for FFY12:
37 resolution sessions were conducted with 21 resulting in signed written agreements.
57% of hearing requests that went to resolution sessions resulted in signed written agreements. Target was met. 57%=[21 divided by 37] times 100.
Discussion of Improvement Activities and progress or slippage that occurred: Target met ,.
Improvement Activities: (See Appendix I)
Revisions, with Justification, to Proposed Targets / Improvement Activities / Timelines / Resources for FFY 2012 (if applicable):
Activities Timeline Resources
None

Part B APR FFY 2012 Tennessee
February 3, 2014 84
Part B State Annual Performance Report (APR) for FFY 2012
Overview of the Annual Performance Report Development: See page 3
Monitoring Priority: Effective General Supervision Part B / General Supervision
INDICATOR 19: Percent of mediations held that resulted in mediation agreements.
(20 U.S.C. 1416(a)(3)(B))
Measurement:
Percent = [(2.1(a)(i) + 2.1(b)(i)) divided by 2.1] times 100.
FFY Measurable and Rigorous Target
FFY 2012 67.5% of mediations will reach agreement within any applicable timelines
Actual Target Data for FFY 2012:
33 mediation requests were received by the division. Of the18 mediations not related to due process hearing requests,15 resulted in agreements. Of the 8 mediations related to due process hearing requests, 7 resulted in agreements. 7 mediations were either pending or not conducted.
85% of mediations reached agreement within applicable timelines (22 agreements divided by 26 mediations held). Target was met. 85%=[15 + 7 divided by 26] times 100. Discussion of Improvement Activities and progress or slippage that occurred for FFY 2012 Target met.
Improvement Activities: (See Appendix I)
Revisions, with Justification, to Proposed Targets / Improvement Activities / Timelines / Resources for FFY 2012 (if applicable):
Activities Timeline Resources
None
As per OSEP Memo 13-6, TDOE has elected to have OSEP complete the Indicator 20 Rubric and provide results to the State.
Part B APR FFY 2012 Tennessee
February 3, 2014 85
Part B State Annual Performance Report (APR) for FFY 2012
Overview of the Annual Performance Report Development: See page 3
Monitoring Priority: Effective General Supervision Part B / General Supervision
Indicator 20: State reported data (618 and State Performance Plan and Annual Performance Report) are timely and accurate.
(20 U.S.C. 1416(a)(3)(B))
Measurement:
State reported data, including 618 data, State Performance Plan, and Annual Performance Reports, are:
a. Submitted on or before due dates (February 1 for child count, including race and ethnicity; placement; November 1 for exiting, discipline, personnel and dispute resolution; and February 1 for Annual Performance Reports and assessment); and
b. Accurate, including covering the correct year and following the correct measurement.
FFY Measurable and Rigorous Target
2012 State reported data are 100% timely and accurate.
Actual Target Data for FFY 2012
618 Data Reports (timeliness)
OSEP Tables 1, 2, 3, 4, 5, 6 and 7 submitted as Education Data Exchange Network (EDEN/EDFacts) files C002, C003, C004, C005, C006, C007, C009, C070, C088, C089, C093, C099, C112, C143, C144, and C146 were submitted to DAC/OSEP on time.
Annual Performance Report (timeliness)
The Annual Performance Report was submitted on February 3, 2014, within allowable timelines.
618 Data Reports (accuracy)
Accurate data is ensured through these processes:
Part B APR FFY 2012 Tennessee
February 3, 2014 86
(a) student-level data is collected through the statewide special education data system that is integrated with Tennessee’s statewide student information system and includes State assigned unique student identifiers;
(b) student-level data entry occurs during the process of writing each student’s Individualized Education Plan (IEP) in all Tennessee LEAs and is reviewed by IEP team members for all students with disabilities in the State;
(c) all key student demographic data, and data for all federal reports, is controlled by the State through data entry validation tables which enforce consistent data entry by all LEAs; and
(d) TDOE provides direct technical assistance to LEAs regarding data entry and data quality control through secure email messaging within the State data system, conference calls, and face-to-face meetings.
The instructions provided for each report table are carefully followed to generate all 618 federal data reports. TDOE reviews all data tables using the edit checks provided in the technical assistance documentation available on the IDEA Data website.
Annual Performance Report (accuracy)
The standards set out for reporting state activities were met as required with the exception of indicator 6. (See SPP for further explanation.)
Discussion of Improvement Activities Completed and Explanation of Progress or Slippage that occurred for FFY 2012
Improvement Activities Discussion of Improvement Activities completed and progress or slippage that occurred for FFY 2012
All indicator data requirements met with 100% accuracy. No improvement activities included.
Revisions, with Justification, to Proposed Targets / Improvement Activities / Timelines / Resources for FFY 2012
Activities Timeline Resources
None
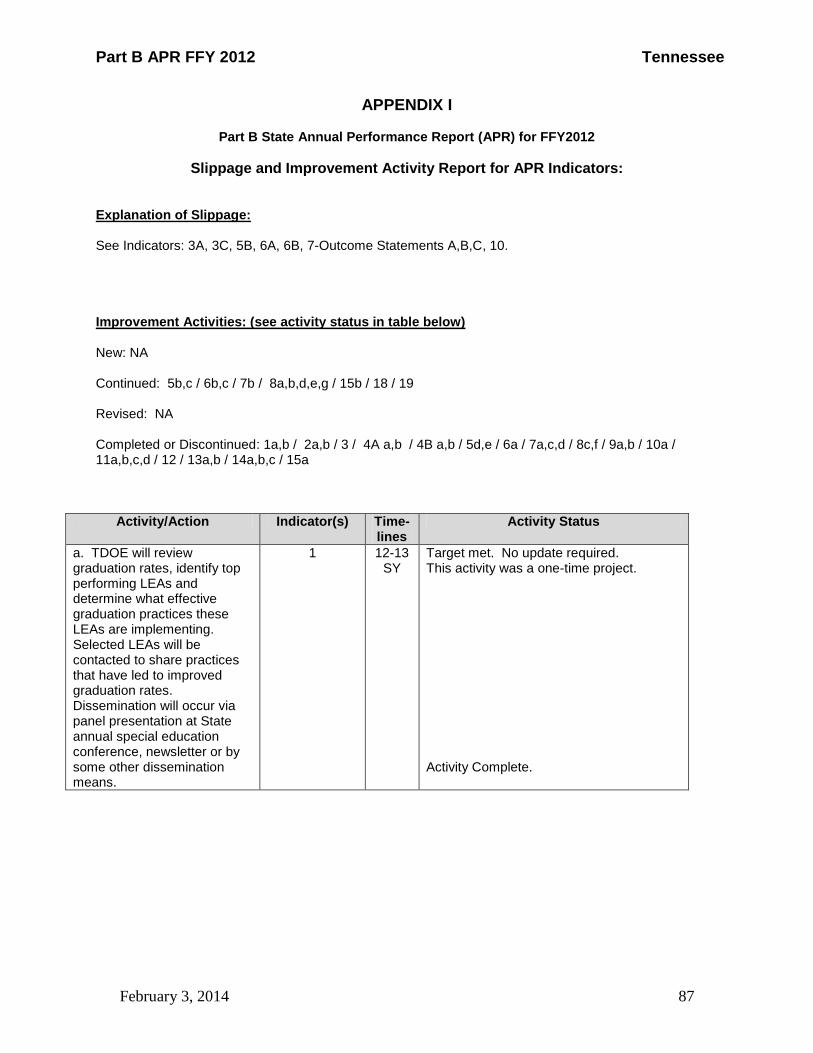
Part B APR FFY 2012 Tennessee
February 3, 2014 87
APPENDIX I
Part B State Annual Performance Report (APR) for FFY2012
Slippage and Improvement Activity Report for APR Indicators: Explanation of Slippage: See Indicators: 3A, 3C, 5B, 6A, 6B, 7-Outcome Statements A,B,C, 10. Improvement Activities: (see activity status in table below) New: NA Continued: 5b,c / 6b,c / 7b / 8a,b,d,e,g / 15b / 18 / 19 Revised: NA Completed or Discontinued: 1a,b / 2a,b / 3 / 4A a,b / 4B a,b / 5d,e / 6a / 7a,c,d / 8c,f / 9a,b / 10a / 11a,b,c,d / 12 / 13a,b / 14a,b,c / 15a
Activity/Action Indicator(s) Time-lines
Activity Status
a. TDOE will review graduation rates, identify top performing LEAs and determine what effective graduation practices these LEAs are implementing. Selected LEAs will be contacted to share practices that have led to improved graduation rates. Dissemination will occur via panel presentation at State annual special education conference, newsletter or by some other dissemination means.
1 12-13 SY
Target met. No update required. This activity was a one-time project. Activity Complete.
Part B APR FFY 2012 Tennessee
February 3, 2014 88
b. In an effort to improve graduation rates in the future, TDOE Transition staff will complete a review of the graduation rate/dropout prevention improvement activities chosen by each of the other states and territories in the United States. The most widely used practices will be shared with LEA Special Education Supervisors.
1,2 12-13 SY
Target met. No update required This activity was a one-time project. Activity complete.
a. The Early Warning Data System (EWDS) provides an “early warning” about students who may be at risk of dropping out based on attendance, behavior and course completion data. TDOE will seek to determine its effectiveness through LEA use of the system and its effects on student progress.
2 12-13 SY
The EWDS was the project of another Division of the TDOE and as such progress or slippage in its implementation was difficult to ascertain. The system and its development are off schedule and only recently was a pilot conducted with selected districts.
Activity deemed ineffective for needs related to this indicator and is discontinued.
b. TDOE will invite each of the 10 LEAs with commendable graduation and dropout rates from FFY 2009-10 to present their practices to their peers at the Annual Special Education Conference.
2 12-13 SY
Target met. No update required This activity was a one-time project. Activity complete.

Part B APR FFY 2012 Tennessee
February 3, 2014 89
Initiate various pilots/trainings to improve student achievement/enhance gains as follows:
a. Select core coaches to serve as peer leaders in the implementation of Common Core State Standards (CCSS) b. Pilot implementation of CCSS for English/Language Arts (grades 3-12) in selected districts and Math “focus” standards (grades 3-8) for all districts, in preparation for full implementation in ‘13-‘14.
c. Provide ongoing online courses, model units, and lesson plan sharing
3 12-13 SY
a. Core Coaches:
• Receive extensive training for instruction in their grade level and content area (trainings conducted during weekends).
• Facilitate training for teachers in their regions during Summer 2013.
• Provide ongoing support in their schools and districts as peer leaders.
The dates below reflect the time commitments that the Core Coaches have
made to facilitate the work for the TN Department of Education. All Core
Coaches are expected to be available to attend trainings and facilitate sessions.
Core Coach Training Weekends (Nashville, TN) March 8-10, 2013 (ALL Coaches) April 13-14 (9-12 Math Only)
May 4-5, 2013 (ALL Coaches)
Prep Weeks (Nashville, TN & Regionally) Math - June 3-7, 2013 ELA &
Literacy - June 24-28, 2013
Training Dates (Regionally) Math - June 18-28, 2013 ELA & Literacy - July 9-25, 2013 (Note: You will not be expected to
work weekends during this time)
Follow Up Sessions (Nashville, TN)
October 26, 2013 February 22, 2014
b. & c. see http://tncore.org/
Activity complete
a. TDOE will provide grants to qualified LEAs to enable them to provide additional services to staff and students in an effort to prevent undue suspension/expulsion.
4A 12-13 SY
Target met. No update required. Activity complete.
Part B APR FFY 2012 Tennessee
February 3, 2014 90
b. Revise the process and instrumentation used to review policies, procedures, and practices.
4A 12-13 SY
Target met. No update required. However, TDOE chooses to provide the following update relative to this activity. The self-assessment was revised in order to attain more specific information and make more reliable decisions on the appropriateness of LEA disciplinary policies, procedures, and practices. The revised self-assessment includes more extensive review of individual behavior plans, accurate data entry, analysis of data trends, and protection of the rights of SWD specific to disciplinary actions taken when student behavior warrants such actions. Activity Complete.
a. Provide LEAs with “How to” information on the use of differentiated instruction at any level by disseminating information on accessing culturally-appropriate strategies for students with IEPs.
4B 12-13 SY
Target met. No update required. Activity Complete.
b. Revise the process and instrumentation used to review policies, procedures, and practices.
4B 12-13 SY
See 4A, second activity, above. Activity complete
a. LEAs receiving grants for inclusion/LRE improvement will receive a new data collection tool to be developed in 2012-13 for utilization in 2013-14. TDOE staff will review data collected, using the new tool, to determine if inclusion improvements are evident. LEAs with significant gains will be invited to share their practices. TDOE will then distribute these practices statewide.
5 12-13 SY
Target met. No update required. NOTE: in developing the data collection tool it was determined that any data collection on grants activity could not provide the improvement evidence that was anticipated. Discontinue activity.
Part B APR FFY 2012 Tennessee
February 3, 2014 91
b. TDOE will provide periodic progress updates on the newly established task force to address the statewide initiative for use of Responsive to Intervention (RTI) program as the primary tool for the identification of students in the category of Specific Learning Disability.
5 12-13 SY
Background: Subsequent to the 2004 reauthorization of IDEA, Tennessee amended its criteria for determining the eligibility of a student with a Specific Learning Disability to allow local education agencies to use either a discrepancy method or a method based on Response to Intervention (RTI). At that time, however, a consistent RTI model was not adopted throughout the State. Since that time, the following events have occurred:
Spring 2012, a Common Core Leadership Council (CCLC) had a discussion surrounding best instructional practice in reading and math. This discussion led to the need for a statewide RTI model to promote consistency and improved instruction. The CCLS developed a K-2 guideline for best instructional practices in reading and math.
Fall 2012, guidelines were released to districts and presented at the Tennessee Educational Leadership Conference (LEAD). Feedback was gathered from districts and the conversation around RTI in Tennessee continued throughout the fall. At this time, the TDOE searched for a partner organization with a strong research background to help with the development of reading and math training relative to Common Core State Standards and tiered, supplemental intervention.
January, 2013, an RTI Task-force with members from various leadership roles in Tennessee education was convened to discuss the possibility of a statewide RTI model. The group voted to proceed with a statewide plan and provided recommendations.
Around this same time, a call for educators to serve on a Reading/RTI Leadership Team went out to districts across the state. After a lengthy application and interview process, the team

Part B APR FFY 2012 Tennessee
February 3, 2014 92
was selected on January 23, 2013. The Reading/RTI Leadership Team met on February 1, 2013 to start researching and writing the Response to Instruction and Intervention Framework termed RTI².
In February 2013, a school psychologist RTI² task force was assembled to help develop and review content related to interventions and eligibility standards for students suspected of having a Specific Learning Disability.
RTII related activities/trainings provided through the end of the FFY2012 reporting period:
March 18-TN Organization of School Superintendents (TOSS) legislative conference March 19-Public hearings April 8-SWD Advisory Council meeting April 12-RTI planning session April 19-TN Association of Administrators of Special Education (TAASE) Board meeting April 20-Planning development May 7-10 RTI Road Show regionally May 29-Met with Metro for RTI² planning May 30-Met with Dickson county RTI² Planning May 30 p.m.-Met with Rutherford County Board of Ed.
June-teams continuously worked on and revised RTI² manual and planning for rollout
The newly developed TN RTII Manual and Implementation Guide may be found at: http://www.tnspdg.com/
Continue activity.
Part B APR FFY 2012 Tennessee
February 3, 2014 93
c. Standards Based IEPs TDOE will provide statewide trainings to LEAs on standards based IEPs to facilitate improved access to the general education curriculum and environment for students with disabilities.
5 12-13 SY
Target met. No update required. However, TDOE has chosen to change directions and plan and provide trainings on writing Instructionally Appropriate Individualized Education Plans.(IA IEPs) This endeavor should serve to better tie IEP goals to Common Core State Standards. A task force will be established in 2013-2014 to develop IA IEP examples and a guidance manual. Continue Activity.
d. In order to better define inclusive educational environments, TDOE is partnering with Lipscomb University for the 2012-13 school year to have three doctoral candidates conduct research on inclusive practices. Results will be reported in the next APR.
5 12-13 SY
Target met. No update required, however, TDOE wishes to provide the following status update: The overall purpose of this project was to provide additional research findings on how weekly hours of inclusion impact student achievement. To this end the following occurred: researchers examined models of inclusion in use in two school districts in Tennessee, gathered administrator and teacher perceptions of inclusion via interview and survey, and examined whether or not a relationship existed between the number of weekly hours third and fourth grade exceptional education students spent in an inclusive Reading/Language Arts class and their TCAP/TCAP MAAS scores. Researchers found a positive relationship between weekly hours of inclusion in Reading/Language Arts and TCAP/TCAP MAAS scaled scores. To view the entire study contact the TDOE APR Coordinator. Activity Complete.
e. TDOE will review targets with its stakeholder group, including representation from the TDOE RTI task force, to examine trends and address the differential between education environments data and actual targets.
5 12-13 SY
Target met. No update required. However, TDOE wishes to report that targets and their attainment were reviewed for the last four reporting periods. Results confirmed that targets are appropriate… at least through this reporting period. Activity complete.

Part B APR FFY 2012 Tennessee
February 3, 2014 94
a. The data collection application will be reviewed and analyzed to determine if accurate education environments data are being collected in the Part B data system (Easy IEP). If necessary, changes will be implemented.
6 The data collection application was analyzed in FFY 2012 and determined in need of being redesigned.
The data collection application in Easy IEP was reviewed through discussions with the Easy IEP vendor, Public Consulting Group (PCG), beginning in the fall of 2012. In March 2013, a focus group meeting with selected LEAs was held. At this meeting analysis and feedback from the focus group confirmed that the Indicator 6 data reported by Easy IEP for some individual districts did not match actual Indicator 6 data.
The Tennessee Department of Education began a significant modification to the data application for Indicator 6 data collection in winter/spring of 2013. The revised data collection process is based on the decision tree developed by the federally funded Early Childhood Technical Assistance Center (ECTA). The LEA focus group provided feedback about the initial proposed data collection process in March 2013.
619 staff continued working with the Easy IEP vendor during the summer of 2013. In late fall of 2013 PCG will deliver the accepted revisions to the application. The data collection process should be fully implemented in December 2013.
Activity complete.
b. Training presentations and training materials, (FAQs, how to code scenarios, embedded video training tutorials available through the statewide data system) will be created and provided to all LEAs to improve understanding and accuracy of data collection once data system changes are made.
6 The implementation of the new data collection system will begin in the FFY 2013. Training presentations of the proposed application changes were made to the LEA focus group in February 2013 and to LEA teachers, Special Education Supervisors, 619 coordinators and others in July 2013. A presentation PowerPoint will be sent to all Special Education Supervisors in September, 2013 and supervisors further informed of the changes via the Part B Special Education Director newsletter that is sent to all districts monthly. Additional resources were created and included a step-by-step guide to data entry, a questions and answers document, practice scenarios, decision tree, and data collection worksheet. These resources
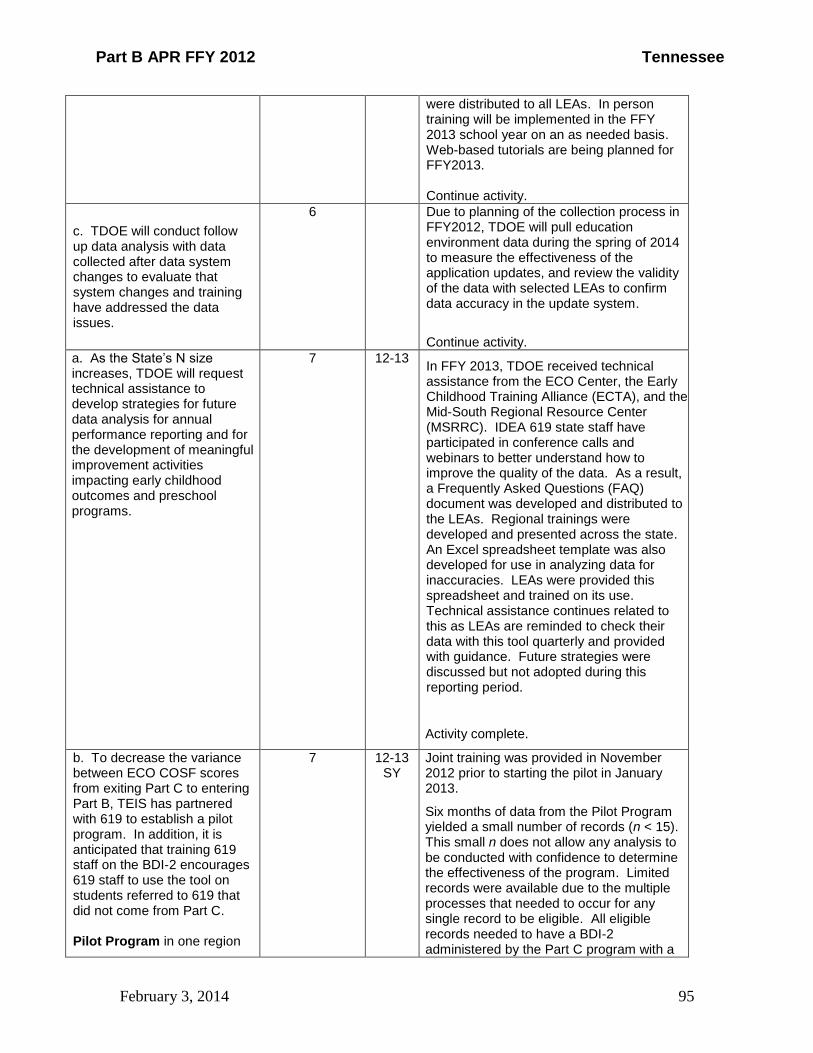
Part B APR FFY 2012 Tennessee
February 3, 2014 95
were distributed to all LEAs. In person training will be implemented in the FFY 2013 school year on an as needed basis. Web-based tutorials are being planned for FFY2013. Continue activity.
c. TDOE will conduct follow up data analysis with data collected after data system changes to evaluate that system changes and training have addressed the data issues.
6 Due to planning of the collection process in FFY2012, TDOE will pull education environment data during the spring of 2014 to measure the effectiveness of the application updates, and review the validity of the data with selected LEAs to confirm data accuracy in the update system.
Continue activity.
a. As the State’s N size increases, TDOE will request technical assistance to develop strategies for future data analysis for annual performance reporting and for the development of meaningful improvement activities impacting early childhood outcomes and preschool programs.
7 12-13 In FFY 2013, TDOE received technical assistance from the ECO Center, the Early Childhood Training Alliance (ECTA), and the Mid-South Regional Resource Center (MSRRC). IDEA 619 state staff have participated in conference calls and webinars to better understand how to improve the quality of the data. As a result, a Frequently Asked Questions (FAQ) document was developed and distributed to the LEAs. Regional trainings were developed and presented across the state. An Excel spreadsheet template was also developed for use in analyzing data for inaccuracies. LEAs were provided this spreadsheet and trained on its use. Technical assistance continues related to this as LEAs are reminded to check their data with this tool quarterly and provided with guidance. Future strategies were discussed but not adopted during this reporting period.
Activity complete.
b. To decrease the variance between ECO COSF scores from exiting Part C to entering Part B, TEIS has partnered with 619 to establish a pilot program. In addition, it is anticipated that training 619 staff on the BDI-2 encourages 619 staff to use the tool on students referred to 619 that did not come from Part C. Pilot Program in one region
7 12-13 SY
Joint training was provided in November 2012 prior to starting the pilot in January 2013.
Six months of data from the Pilot Program yielded a small number of records (n < 15). This small n does not allow any analysis to be conducted with confidence to determine the effectiveness of the program. Limited records were available due to the multiple processes that needed to occur for any single record to be eligible. All eligible records needed to have a BDI-2 administered by the Part C program with a
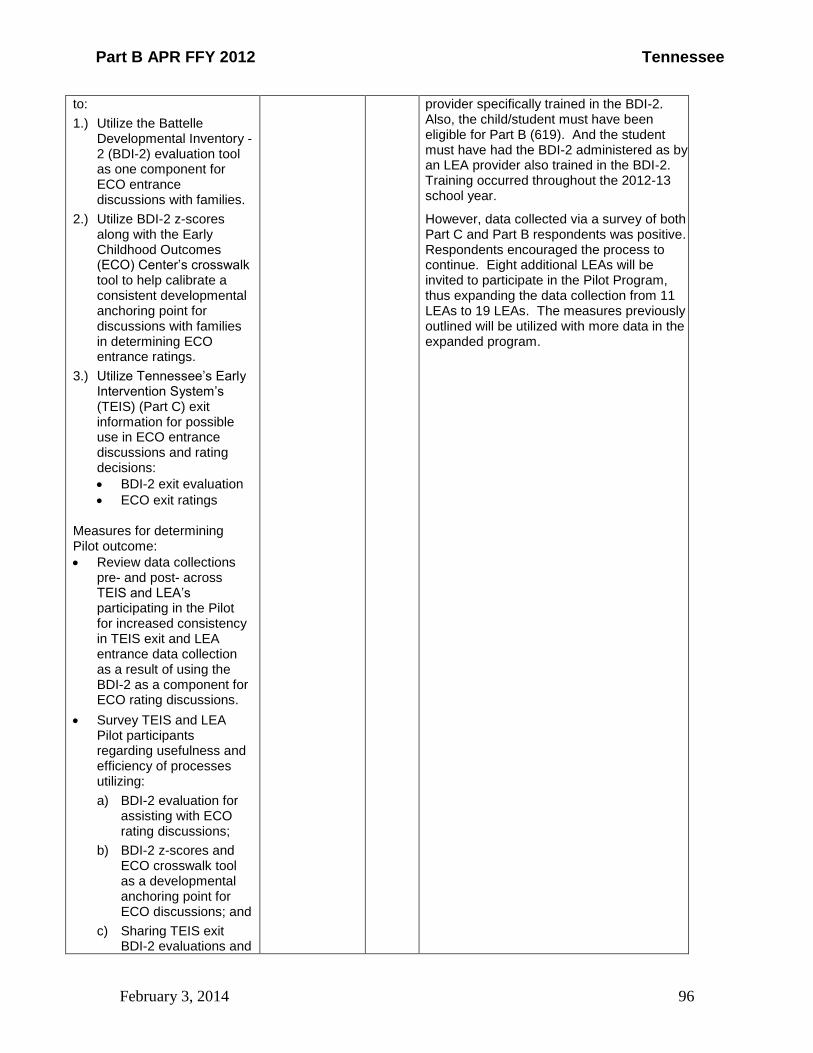
Part B APR FFY 2012 Tennessee
February 3, 2014 96
to:
1.) Utilize the Battelle Developmental Inventory -2 (BDI-2) evaluation tool as one component for ECO entrance discussions with families.
2.) Utilize BDI-2 z-scores along with the Early Childhood Outcomes (ECO) Center’s crosswalk tool to help calibrate a consistent developmental anchoring point for discussions with families in determining ECO entrance ratings.
3.) Utilize Tennessee’s Early Intervention System’s (TEIS) (Part C) exit information for possible use in ECO entrance discussions and rating decisions:
BDI-2 exit evaluation
ECO exit ratings Measures for determining Pilot outcome:
Review data collections pre- and post- across TEIS and LEA’s participating in the Pilot for increased consistency in TEIS exit and LEA entrance data collection as a result of using the BDI-2 as a component for ECO rating discussions.
Survey TEIS and LEA Pilot participants regarding usefulness and efficiency of processes utilizing:
a) BDI-2 evaluation for assisting with ECO rating discussions;
b) BDI-2 z-scores and ECO crosswalk tool as a developmental anchoring point for ECO discussions; and
c) Sharing TEIS exit BDI-2 evaluations and
provider specifically trained in the BDI-2. Also, the child/student must have been eligible for Part B (619). And the student must have had the BDI-2 administered as by an LEA provider also trained in the BDI-2. Training occurred throughout the 2012-13 school year.
However, data collected via a survey of both Part C and Part B respondents was positive. Respondents encouraged the process to continue. Eight additional LEAs will be invited to participate in the Pilot Program, thus expanding the data collection from 11 LEAs to 19 LEAs. The measures previously outlined will be utilized with more data in the expanded program.

Part B APR FFY 2012 Tennessee
February 3, 2014 97
ECO ratings as a possible resource for LEAs in ECO entrance data discussions.
Continue Activity
c. Develop and deliver joint statewide ECO training to TEIS and LEAs. Training development was informed by a statewide TEIS and LEA survey specific to ECO understanding and training needs along with a review of FFY 2010-2012 ECO data. Training will address:
Purpose of data collection (closing student achievement gap and early childhood school readiness)
Determining quality ECO ratings
ECO data collection procedures
7 12-13 SY
These full-day trainings were completed in February 2013 and March 2013.
ECO information was also presented at the state’s Special Education conference and the state’s Early Childhood Summit.
Activity complete.
d. Share twice yearly data report with LEAs statewide addressing probable data entry issues such as early/late entry dates, impossible outcome scores, missing exit data, etc.
7 12-13 SY
Data was shared with the LEAs in a variety of ways. The first semester ECO report was sent to the LEAs in December with detailed notes outlining the issues seen. An Excel spreadsheet incorporating these probable data entry issues was provided to the LEAs, and they were trained in its use at the regional ECO trainings in February 2013 and March 2013. ECO data were then placed into that spreadsheet template and shared with the LEAs in April. In May, a reminder was placed in a special education supervisors’ update that was sent from the department to all LEAs. That reminder included the blank spreadsheet template and the task analysis (instructions), and it reminded the LEAs to check their own data before June 30. LEAs are encouraged to utilize the spreadsheet template on an ongoing basis to verify their ECO data.
Activity complete.
a. Require LEAs to develop an improvement plan as needed based on survey results. This plan should facilitate increased parent involvement in educational
8 12-13 SY
For FFY 2012, LEAs were allowed to select their three least favorable response items on which to build their improvement plans. All LEAs submitted acceptable plans within required timelines.

Part B APR FFY 2012 Tennessee
February 3, 2014 98
programs for children and could include training, general information, home learning activities, etc. using a tool such as a newsletter.
Continue activity.
b. Partner with Tennessee Parent Information and Resource Center, STEP, Inc., which is the Tennessee PTI, in the development of improved statewide parental involvement activities/trainings, etc. This partnership to include customization of technical assistance and trainings for parents in selected LEAs based on actual survey results and the needs areas identified by those results.
8 12-13 SY
Some of the trainings planned by the TN Parent Training and Information (PTI) Center were based on review of district parent survey results. Several of the needs areas identified by survey results received additional emphasis during parent trainings. A summary of Center trainings is described below.
STEP, Inc., Tennessee’s Parent Training and Information Center, hosted several webinars of interest to families who have children and youth with disabilities in their school district. Webinars were archived and available for viewing on the STEP website, along with corresponding materials. Archive Index The Impact of Common Core State Standards for Students with Disabilities Instructionally Appropriate IEPs Response to Intervention (RTI²) Training: Families Guide to Implementation and New Guidelines for Identifying Specific Learning Disabilities Understanding the role of Vocational Rehabilitation in Transition from School to Work Creating a College-Going Culture in the Latino Community (Posted with Permission) Bullying Prevention: What Parents Can Do (handouts only) Assistive Technology Breakthroughs for Students with Disabilities Webinar Conservatorship and Special Needs Trusts
Continue Activity
c. The TDOE will review improvement plans and keep on file to determine if survey response rates and results have increased once the four year survey cycle has rotated back to these LEAs. This will be done on a yearly basis with the 3 largest LEAs.
8 12-13 SY
This activity determined to lack feasibility over the prescribed time period and was not implemented.
Discontinue Activity.
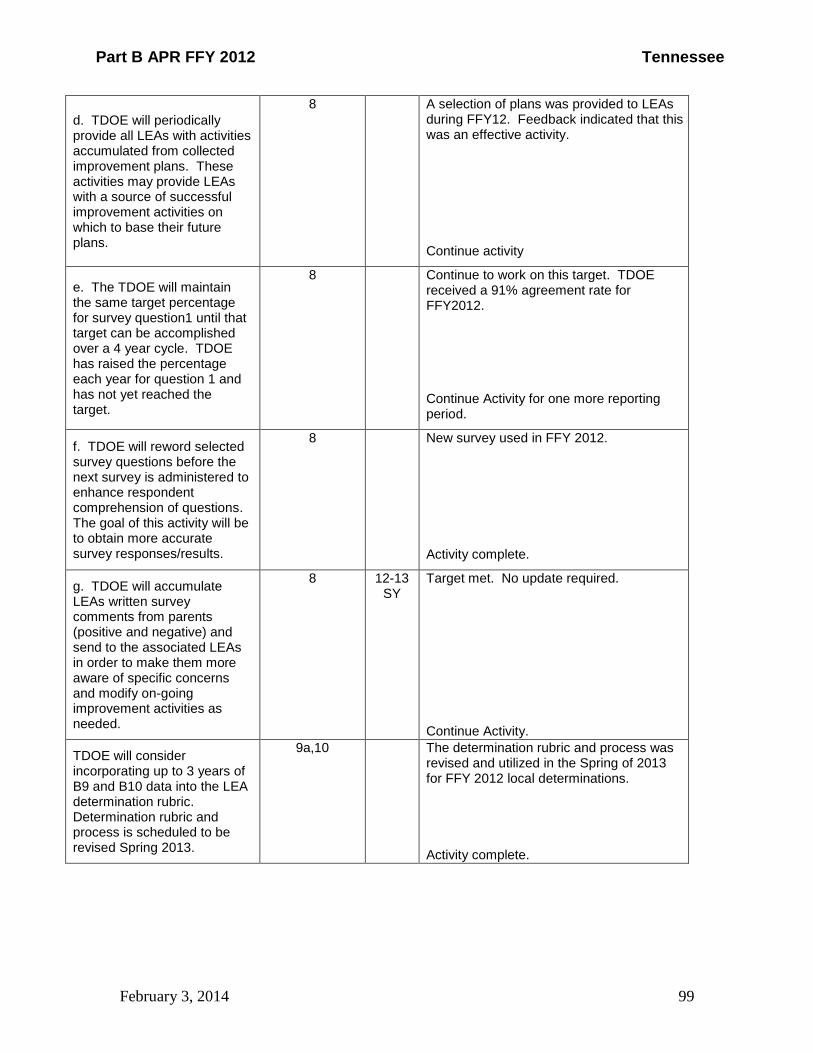
Part B APR FFY 2012 Tennessee
February 3, 2014 99
d. TDOE will periodically provide all LEAs with activities accumulated from collected improvement plans. These activities may provide LEAs with a source of successful improvement activities on which to base their future plans.
8 A selection of plans was provided to LEAs during FFY12. Feedback indicated that this was an effective activity.
Continue activity
e. The TDOE will maintain the same target percentage for survey question1 until that target can be accomplished over a 4 year cycle. TDOE has raised the percentage each year for question 1 and has not yet reached the target.
8 Continue to work on this target. TDOE received a 91% agreement rate for FFY2012.
Continue Activity for one more reporting period.
f. TDOE will reword selected survey questions before the next survey is administered to enhance respondent comprehension of questions. The goal of this activity will be to obtain more accurate survey responses/results.
8 New survey used in FFY 2012.
Activity complete.
g. TDOE will accumulate LEAs written survey comments from parents (positive and negative) and send to the associated LEAs in order to make them more aware of specific concerns and modify on-going improvement activities as needed.
8 12-13 SY
Target met. No update required. Continue Activity.
TDOE will consider incorporating up to 3 years of B9 and B10 data into the LEA determination rubric. Determination rubric and process is scheduled to be revised Spring 2013.
9a,10 The determination rubric and process was revised and utilized in the Spring of 2013 for FFY 2012 local determinations. Activity complete.
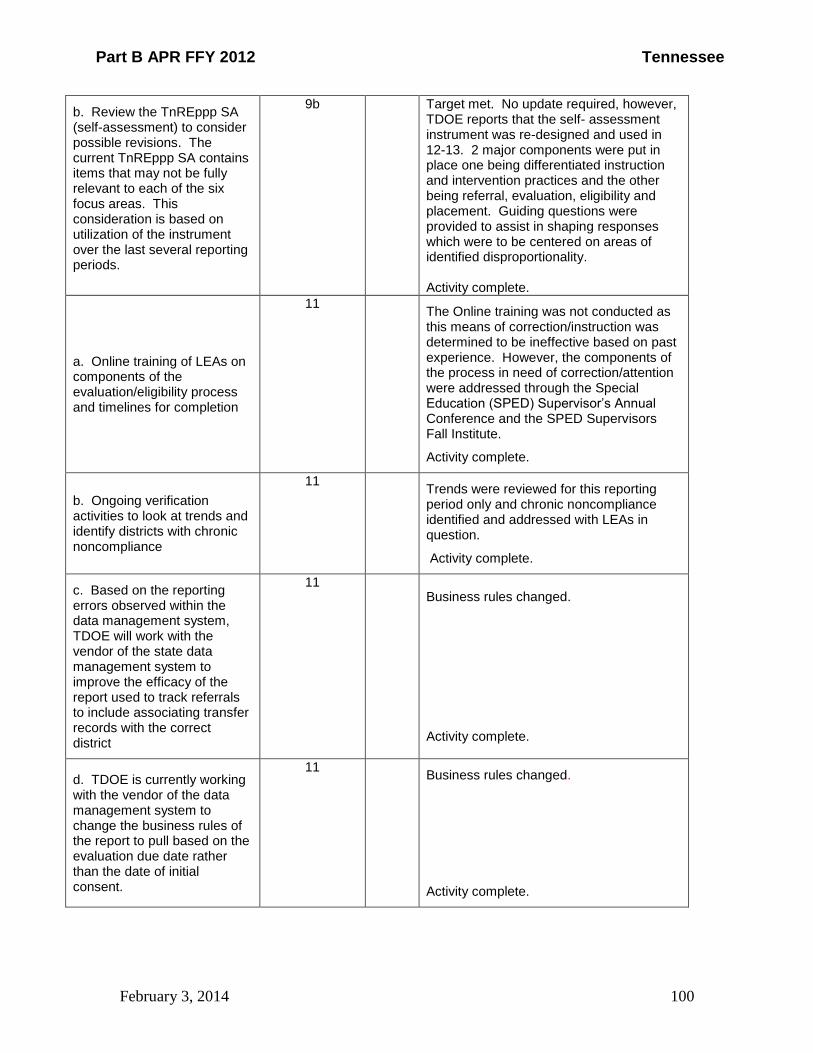
Part B APR FFY 2012 Tennessee
February 3, 2014 100
b. Review the TnREppp SA (self-assessment) to consider possible revisions. The current TnREppp SA contains items that may not be fully relevant to each of the six focus areas. This consideration is based on utilization of the instrument over the last several reporting periods.
9b Target met. No update required, however, TDOE reports that the self- assessment instrument was re-designed and used in 12-13. 2 major components were put in place one being differentiated instruction and intervention practices and the other being referral, evaluation, eligibility and placement. Guiding questions were provided to assist in shaping responses which were to be centered on areas of identified disproportionality. Activity complete.
a. Online training of LEAs on components of the evaluation/eligibility process and timelines for completion
11 The Online training was not conducted as this means of correction/instruction was determined to be ineffective based on past experience. However, the components of the process in need of correction/attention were addressed through the Special Education (SPED) Supervisor’s Annual Conference and the SPED Supervisors Fall Institute.
Activity complete.
b. Ongoing verification activities to look at trends and identify districts with chronic noncompliance
11 Trends were reviewed for this reporting period only and chronic noncompliance identified and addressed with LEAs in question.
Activity complete.
c. Based on the reporting errors observed within the data management system, TDOE will work with the vendor of the state data management system to improve the efficacy of the report used to track referrals to include associating transfer records with the correct district
11 Business rules changed.
Activity complete.
d. TDOE is currently working with the vendor of the data management system to change the business rules of the report to pull based on the evaluation due date rather than the date of initial consent.
11
Business rules changed.
Activity complete.
Part B APR FFY 2012 Tennessee
February 3, 2014 101
A state level Early Childhood Transition Frequently Asked Questions (FAQ) document will be developed to assist LEAs with regulations and procedures related to Part C to B transition. Aligning procedures and processes statewide improves compliance with early childhood transition requirements.
12 A state-level Early Childhood Transition
Frequently Asked Questions (FAQ)
document was developed to assist LEAs
with regulations and procedures related to
Part C to B transition and is available on
the state data collection system (i.e.
EasyIEP)
Activity complete.
a. TDOE submitted a proposal to the National Secondary Transition Technical Assistance Center (NSTTAC) for intensive technical assistance and was accepted. TDOE will build a work plan in conjunction with NSTTAC staff to enhance TN’s capacity to:
(a) implement and scale-up evidence-based practices to improve academic and functional achievement that prepare students with disabilities for college and the workforce;
(b) implement policies, procedures, and practices to facilitate students with disabilities participating in programs to prepare students for college and career readiness; and
(c) achieve 100% compliance with Annual Performance Reporting (APR) Part B Indicator.
13 TDOE’s proposal for intensive TA was accepted by NSTTAC.
a) Worked with Vanderbilt University and the TNWorks grant to develop a list of evidence based practices for TN. LEAs can utilize this list to self-assess their own programs for participation in evidence based practices b) The TDOE sponsored a mini-Capacity Building Institute in in March 2013, for all LEAs statewide. LEAs were provided indicator 1, 2, 13, and 14 data prior to attending the mini CBI. NSTTAC staff introduced the concept of data based decision making which is a cornerstone concept of capacity building. LEAs chose one transition goal to implement for the remainder of the 2012-13 school year. A more intensive CBI is planned for FFY2013. c) A slight improvement in compliance rate was made from FFY2011 to FFY2012; however 100% compliance was not attained.
Activities complete.
b. For children who are 15+ years of age, add an error message to Easy IEP to
13 The error message was added to the EasyIEP system at the beginning of the 12-13 SY. The number of errors
Part B APR FFY 2012 Tennessee
February 3, 2014 102
disallow finalizing an IEP prior to a Student Invitation being issued for the IEP team meeting.
decreased from 17 in FFY11 to 3 in FFY12.
This is now a part of standard operating procedure.
Activity complete.
a. In order to gather more in-depth information about students who are non-engaged, TDOE with assistance from the National Post Schools Outcome Center (NPSO) and the data analysis staff at East TN State University will analyze the TN Post-Secondary Survey to make changes that will allow TDOE to gather more specific data about the non-engaged population.
14
The survey and the NPSO reporting template were updated. They now include a section on determining if youth are really not engaged or they have just not met the OSEP criteria. This allowed a more accurate picture of youth who are really not engaged.
The survey reflected that the non-engaged population had dropped from 39% to 34%. There were an additional 84 youth who had tried postsecondary schooling or work but could not meet the OSEP criteria.
Activity complete. This procedure will be continued as a means of completing future surveys.
b. In order to gather more in-depth information about students who are non-responders, TDOE with assistance from the National Post Schools Outcome Center (NPSO) and the data analysis staff at East TN State University will analyze the TN Post-Secondary Survey to make changes that will allow TDOE to gather more specific data about the non-responders population.
14
Utilizing a template from NPSO which obtains more information from non- responders it was determined that the predominant cause of non-response was lack of accurate contact information.
Activity complete. This procedure will be continued as a means of completing future surveys.
Part B APR FFY 2012 Tennessee
February 3, 2014 103
c. Based on the Transition Summit post-conference responses, TDOE will target the distribution of marketing materials about community colleges, TN Technology Centers and financial aid to LEAs. One of the distribution points will be the Youth Readiness Training Days, a one-day event that will Get High School Students with Disabilities Thinking About Their Lives After Graduation
14
A staff member from the Developmental Disabilities Council completed one-day training in 3 LEAs (Fayette, Shelby, and Claiborne). The training consisted of self-advocacy, post-secondary education/training opportunities, and benefits planning. 74 students participated in 5 high schools.
82% of participants report that learned something at the workshop.
Post – training results reveal:
advocating for myself is very important to me” (52.9% of respondents)
I am mostly independent now but I want a little more ((57.4% of respondents)
I plan to contact:
Vocational Rehabilitation (43.6% of respondents)
Tennessee Career Centers (36.4% of respondents
Tennessee Technology Centers (25.5% of respondents
Social Security Administration (23.6% of respondents)
A college Office of Disability Services (21.8% of respondents)
Additionally, we are working with TN Works at Vanderbilt to develop one-page briefs on similar topics to be shared with teaching personnel and parents across the state. They will be posted on the TN Works website.
Activity complete. This will become part of our standard operating procedure.
a. Provide training to all LEAs to be monitored in the next school year on the requirements of the IEP through use of the Student File Review Protocol.
15 For FFY12 TDOE did not conduct training with LEAs to be monitored through on-site meetings. However, training was provided through on- line instruction with models and examples.
Due to planned changes in the monitoring process for FFY13, this activity will be discontinued.
Part B APR FFY 2012 Tennessee
February 3, 2014 104
b. TDOE will develop a monitoring tool that incorporates a combined IDEA and ESEA approach. The focus of the new tool/approach will also include student outcomes in addition to compliance.
15 The revised monitoring tool/procedures is still under development with work having been done by TDOE during the 2012-13 SY and will be continuing in to the 2013-14 SY. A pilot is planned for Spring ‘2014 and full implementation scheduled for the 2014-15 SY. The focus of the revised approach will be student outcomes as well as compliance. Continue Activity.
Encourage early resolution session as a timelier dispute resolution measure.
18 During initial case status conference telephone calls, administrative law judges encourage parties to participate in resolution sessions. Continue activity.
Provide training to special education administrative law judges.
19 Pursuant to Tennessee Code Annotated §49-10-606(b), the Administrative Office of the Courts provided annual training in special education law to administrative law judges. Continue activity.
None 20
Revisions, with Justification, to Proposed Targets / Improvement Activities / Timelines / Resources for FFY 2012 (if applicable): The state reviewed the effectiveness of all SPP/APR targets and improvement activities, including timelines and resources outlined in the State Performance Plan (SPP) and the Annual Performance Report (APR). No additional improvement activities were developed as a result of the review. TDOE will continue those activities listed as “continue” above.