ffy 2014 part c state performance plan (spp)/annual ... · ffy 2014 part c state performance plan...
TRANSCRIPT

NCPart C
FFY2014State Performance Plan /
Annual Performance Report
FFY 2014 Part C State Performance Plan (SPP)/Annual Performance Report (APR)
2/8/2016 Page 1 of 37

Introduction to the State Performance Plan (SPP)/Annual Performance Report (APR)
Attachments
Executive Summary:
File Name Uploaded By Uploaded Date
No APR attachments found.
General Supervision System:
The systems that are in place to ensure that IDEA Part C requirements are met, e.g., monitoring systems, dispute resolution systems.
The North Carolina Early Intervention Program’s (NC EI Program) general supervision system continues to function as previously described to OSEP. Specifically, our programcontinues to utilize components of the state’s web-based data system, self-assessment tool, and record review for monitoring purposes. Currently, the primary method for verifyingthe correction of noncompliance is through child record review. The components of annual self-assessment, identification of noncompliance, correction of noncompliance, focusedmonitoring, data verification and desk audits continue as described in previous annual performance reports.
All sixteen (16) of North Carolina’s Children’s Developmental Services Agencies (CDSAs) are required to complete annual child record review self-assessments. The EarlyIntervention Branch (EI Branch) collects self-assessment data at designated points and times each year for indicators 1, 7, 8a, 8b, and 8c. To continue to improve compliance intimeliness of services (Indicator 1), the EI Branch provides each CDSA with the names of all children enrolled in the program who had a new service added to their IndividualizeFamily Service Plan (IFSP), including both newly enrolled children and children already receiving services during a given month. To ensure compliance with the requirement thatevaluation/assessment and the development of initial IFSPs for eligible children occur within 45 days of referral (Indicator 7), the EI Branch provides the CDSAs with the names ofchildren referred to the program in a given month for whom an initial evaluation/assessment and initial IFSP were completed. These data are reviewed to ensure the timelines weremet. To maintain compliance with transition indicators (Indicator 8 sub-components), the EI Branch provides the CDSAs with the names of all children who should have had aTransition Planning Conference (TPC) as of a specific date. Data are then provided by the CDSAs and reviewed by the EI Branch to ensure that each child who is age 2 years 9months: 1) has a transition plan with steps and services in place; and 2) if a child was potentially eligible for preschool services that the Local Education Agency (LEA) and StateEducation Agency (SEA) were notified. Data are also submitted by each CDSA to the EI Branch to provide documentation of reasons for noncompliance and any other unique datarelated to specific children. Additionally, EI Branch staff conduct site visits to verify data submitted by the CDSAs.
When there is noncompliance, the CDSA receives written notification of a finding and is required to work with the EI Branch to develop a written corrective action plan (CAP) within30 days. Corrective Action Plans (CAPs) are required when there is noncompliance and must include: 1) strategies, 2) benchmarks to achieve compliance, and 3) clear evidenceof change. Reports are submitted to the EI Branch on an agreed upon schedule until noncompliance is corrected. Each CAP is developed to address the root cause of anysystemic noncompliance.
Consistent with OSEP Memorandum 09-02, the EI Branch ensures through its monitoring, that all individual instances of noncompliance are corrected as soon as possible, even iflate, unless the child is no longer enrolled or within the jurisdiction of the NC EI Program, and verifies through review of new or updated data that the CDSAs are correctlyimplementing the regulatory requirements underlying the noncompliance.
In addition to CAPs, the EI Branch assists with the development of improvement plans if CDSAs are demonstrating lower than expected performance on results indicators.Improvement plan strategies and activities are written by the CDSA either in partnership with or with direct guidance from the EI Branch.
Throughout the year, activities are completed by the EI Branch to verify the reliability, accuracy and timeliness of data reported by the CDSAs. Several methods for data verificationare utilized, such as error reports, routine data reports, data reports summarizing contract performance and on-site data verification visits. Additionally, point-in-time data areroutinely provided to CDSAs to ensure reliable, valid data for 616 and 618 data reporting.
Whenever parents have concerns or disagreements related to their children’s early intervention services, the director of the CDSA, or his/her designee, must immediately contactthe parent and attempt to resolve the concern or disagreement informally through discussion and negotiation. CDSAs may consult with the EI Branch, if necessary, during theseinformal negotiations with a parent. However, if an agreement cannot be reached, the parent must be advised of the availability of and the procedures for filing a formal statecomplaint or due process hearing request, as well as other alternative dispute resolution processes, including resolution meetings and mediation. Service Coordinators and otherservice providers also inform parents, upon intake and throughout enrollment in the NC EI Program, of the their rights and responsibilities under the IDEA as a parent. Additionally,an EI Branch consultant is assigned to coordinate all aspects of the NC EI Program’s dispute resolution processes.
FFY 2014 Part C State Performance Plan (SPP)/Annual Performance Report (APR)
2/8/2016 Page 2 of 37

Attachments
Attachments
File Name Uploaded By Uploaded Date
No APR attachments found.
Technical Assistance System:
The mechanisms that the State has in place to ensure the timely delivery of high quality, evidenced based technical assistance and support toearly intervention service (EIS) programs.
In many instances, opportunities to provide technical assistance arise from activities discussed as part of the General Supervision system (e.g. self-assessment, focusedmonitoring, and/or data verification). Technical assistance is often a component of the CAP for CDSAs with findings of noncompliance, or included as part of an improvement planwhere performance issues have been identified. The regional consultants provide technical assistance required by these plans and support the CDSAs to identify any additionaltraining and/or professional development needs.
In FFY 2014, the NC EI Program continued to provide intensive technical assistance to two CDSAs selected in FFY 2013 to pilot the process of integrating global child outcomesinto the Individualized Family Service Plan (IFSP) process. During this reporting period, efforts by the pilot sites were expanded to include the integration of global child outcomesinto the exit IFSP process. Results from a formative evaluation that had been completed in June 2014 were published during this period and disseminated to stakeholders acrossthe State. The findings suggested that agency readiness would be a key factor in determining the level of success to be achieved in future endeavors to expand global childoutcomes integration beyond the pilot sites to all 16 CDSAs within the State system. In October 2014, EI Branch consultants began individual site visits with each of the 16 CDSAsin order to assist them in assessing their readiness to begin to use global child outcomes in the development of IFSPs. This assessment of readiness focused on each CDSA’sinternal capacity to work as a team, and their ability and skill to engage families to gather and use functional information from the families and children they serve. Thesepreliminary TA efforts served to increase awareness of some of the important competencies that staff would need, as well as helped to identify the training and supports that mightbe needed. This year, the self-assessment process included a new related requirement that focused on gathering and documenting information about a child’s participation indaily activities and the development of functional child outcomes in the IFSP. As a result, the State has seen an increase in requests from local programs seeking TA support forgathering and using functional information for outcomes development and IFSP planning purposes. One final note, during Phase I of the SSIP, N.C. noted global child outcomesintegration as an important strategy for engaging parents and improving social/emotional outcomes for children. As such, the NC EI Branch has an implementation team that islooking more closely at agency readiness and preparation as precursors to successful implementation and sustainability as it plans for scaling up to state-wide expansion of globalchild outcomes into IFSP development during Phases II and III of the SSIP and beyond.
File Name Uploaded By Uploaded Date
No APR attachments found.
Professional Development System:
The mechanisms the State has in place to ensure that service providers are effectively providing services that improve results for infantsand toddlers with disabilities and their families.
The North Carolina EI Program has a certification process for early intervention service providers. This certification requirement applies to all early intervention servicecoordinators and providers of Special Instruction services. Supervisors of service coordinators also are encouraged to obtain and maintain certification as well. Continuingprofessional development of 10 contact hours (1.0 CEU) is required annually for all certificate holders. Contact hours/CEU credits must focus on infants and toddlers, with orwithout disabilities, and their families. The Certificate is obtained upon employment with a CDSA or once enrolled as a CDSA community-based provider, and Certification must bemaintained as a condition of employment.
CDSAs are responsible for ensuring that staff meet the continuing education requirement for Infant-Toddler certification, along with any other discipline-specific licensure orprofessional certification requirements. Service providers not employed at CDSAs (community-based direct service providers) are responsible for ensuring that their staff meetthese same requirements. Documentation of compliance with continuing education requirements is provided to the EI Branch by the CDSAs. Additionally, all CDSAs must provideannual documentation that all service providers have Infant-Toddler certification and have completed their continuing education requirements. Annual monitoring is conducted thatincludes on-site verification reviews to ensure that the data provided are accurate.
The NC EI Program encourages staff and providers to stay abreast of evidence based practices in early childhood intervention. To that end, a list of credible organizations andbusinesses that provide evidence-based trainings relevant to infants and toddlers, with or without disabilities, and their families is maintained, updated quarterly, and posted on theNC EI website (www.beearly.nc.gov). The EI Branch also develops and provides training opportunities as needs are identified.
CDSAs also periodically monitor their direct service providers through meetings, review of provider service notes and observations in natural environment settings. Thesemethods are used to assure services are being delivered as noted in the IFSP and to gather information on how effective the interventions are at improving results for infants andtoddlers and their families in the program. Targeted follow-up TA and training are given to providers, as needed, based on information gathered through observations and
FFY 2014 Part C State Performance Plan (SPP)/Annual Performance Report (APR)
2/8/2016 Page 3 of 37

Attachments
Attachments
Attachments
meetings.
To support the use of evidence based practices and ensure children and families receive high quality services, the NC EI Program has chosen to work on its ComprehensiveSystem of Personnel Development (CSPD) as one key improvement strategy for increasing social-emotional outcomes for children as part of our SSIP process. Beginning inPhase II and continuing into Phase III of the SSIP and beyond, the Professional Development Implementation Team will focus on examining the current system for professionaldevelopment in N.C. and explore strategies to enhance and expand it.
File Name Uploaded By Uploaded Date
No APR attachments found.
Stakeholder Involvement: apply this to all Part C results indicators
The mechanism for soliciting broad stakeholder input on targets in the SPP, including revisions to targets.
The NC EI Program continues to value and obtain broad input from several different stakeholder groups on a regular basis. The NC Interagency Coordinating Council (ICC) isthe primary advisory board, and was instrumental in developing the State Performance Plan (SPP) targets submitted to OSEP in February 2015. The ICC, CDSAs, providers,State Systemic Improvement Plan (SSIP) planning team members, and other stakeholders were provided with APR historical data trends over time, graphic representation ofoutcomes, analyses related to mean performance, and comparisons of the NC EI Program data to those of other states and territories. An online survey was also distributedbroadly to stakeholders to seek input on the proposed targets. This information allowed for discussion of the proposed targets and provided a mechanism for feedback fromstakeholders. For the current APR report, the ICC reviewed five years of APR data at a meeting in October 2015, and approved this final report in January 2016.
File Name Uploaded By Uploaded Date
No APR attachments found.
Reporting to the Public:
How and where the State reported to the public on the FFY 2012 performance of each EIS Program or Provider located in the State on thetargets in the SPP/APR as soon as practicable, but no later than 120 days following the State’s submission of its FFY 2012 APR, as requiredby 34 CFR §300.602(b)(1)(i)(A); and a description of where, on its Web site, a complete copy of the State’s SPP, including any revision if theState has revised the SPP that it submitted with its FFY 2012 APR in 2014, is available.
The NC EI Program disseminated the FFY 2013 SPP/APR to stakeholders through the local lead agencies and posted it on the Program’s website at: http://www.beearly.nc.gov/data/files/pdf/APRFY2013.pdf
CDSA specific APR Indicator data, including comparisons to the State target and State actual data, is posted on the Program’s website at: http://www.beearly.nc.gov/data/files/pdf/CDSA2013Data.pdf
File Name Uploaded By Uploaded Date
No APR attachments found.
Actions required in FFY 2013 response
None
FFY 2014 Part C State Performance Plan (SPP)/Annual Performance Report (APR)
2/8/2016 Page 4 of 37

Indicator 1: Timely provision of services
Baseline Data: 2005
Monitoring Priority: Early Intervention Services In Natural Environments
Compliance indicator: Percent of infants and toddlers with IFSPs who receive the early intervention services on their IFSPs in a timely manner.
(20 U.S.C. 1416(a)(3)(A) and 1442)
Historical Data
FFY 2004 2005 2006 2007 2008 2009 2010 2011 2012 2013
Target 100% 100% 100% 100% 100% 100% 100% 100%
Data 73.00% 92.00% 93.00% 97.21% 96.00% 98.68% 97.85% 98.29% 98.31%
Key: Gray – Data Prior to Baseline Yellow – Baseline Blue – Data Update
FFY 2014 - FFY 2018 Targets
FFY 2014 2015 2016 2017 2018
Target 100% 100% 100% 100% 100%
Key:
FFY 2014 SPP/APR Data
Number of infants and toddlers with IFSPswho receive the early intervention services
on their IFSPs in a timely manner
Total number of infants and toddlers withIFSPs
FFY 2013Data*
FFY 2014Target*
FFY 2014Data
1547 1697 98.31% 100% 98.11%
Number of documented delays attributable to exceptional family circumstances (this number will be added to the Number of infants andtoddlers with IFSPs who receive their early intervention services on their IFSPs in a timely manner)
118
What is the source of the data provided for this indicator?
State monitoring
State database
Describe the method used to select EIS programs for monitoring.
Compliance by the CDSAs in meeting the timely services (30-days) compliance indicator was determined via a self-assessment record review of all children who had servicesadded to their Individualized Family Service Plan (IFSP) in January 2015. The self-assessment record review included newly enrolled children and children already enrolled in theprogram. One thousand six hundred ninety-seven (1697) records of children were reviewed for timeliness of initial and subsequent service initiation. One thousand five hundredforty-seven (1547) children received their services in a timely manner. Seven percent (7%, n = 118) of children did not receive all of their services in a timely manner due todocumented exceptional family circumstances. Two percent (2%, n = 32) of 1697 children did not receive all of their services in a timely manner due to CDSA specific delays. Thereasons for the CDSA-specific delays included: “delays in providers initiating services”, “inadequate follow up”, “lack of appropriately qualified community-based providers”, and“other CDSA delays”.
FFY 2014 Part C State Performance Plan (SPP)/Annual Performance Report (APR)
2/8/2016 Page 5 of 37

Provide additional information about this indicator (optional)
A total of one thousand six hundred ninety-seven (1697) children with IFSPs were reviewed for this indicator. One thousand five hundred forty-seven (1547) of these childrenreceived their services in a timely manner. An additional one hundred eighteen (118) children did not receive their services in a timely manner due to documented exceptional familycircumstances. Therefore, services for 1665 children (1547 + 118) out of 1697 children (98.11%) were provided services on their IFSPs in a timely manner (within 30 days). Twopercent (2%, n=32) of children did not receive all of their services in a timely manner due to CDSA specific delays.
Actions required in FFY 2013 response
Responses to actions required in FFY 2013 response, not including correction of findings
Correction of Findings of Noncompliance Identified in FFY 2013
Findings of Noncompliance IdentifiedFindings of Noncompliance Verified
as Corrected Within One YearFindings of Noncompliance
Subsequently CorrectedFindings Not Yet Verified as Corrected
16 11 0 5
FFY 2013 Findings of Noncompliance Verified as Corrected
Describe how the State verified that the source of noncompliance is correctly implementing the regulatory requirements
The North Carolina EI Program continues to have a system to identify and correct noncompliance as soon as possible, but in no case more than one year from identification (i.e.,the date on which the NC EI Program provided written notification to the CDSA of the noncompliance). This corrective action process includes the EI Branch issuing findings fornoncompliance to specific CDSAs, which include the specific regulatory requirements that are not being correctly implemented. Each CDSA is required to use a root causeanalysis framework to drill down to identify the reasons for noncompliance. CDSAs develop corrective action plans (CAPs) with assistance from the EI Branch to identify the rootcauses of noncompliance. CDSAs are required to submit progress reports to the EI Branch on an approved schedule. The process used to determine correction of noncomplianceincludes: analysis of progress report information, verification of the correction of child-specific noncompliance, and review of updated subsequent data to verify that the timelyservices requirement is being implemented in accordance with the IDEA. The North Carolina EI Program continues to address how to sustain correction of noncompliance inspecific areas of the state and continually reviews local procedures and guidance for implementation to ensure timely provision of services.
Describe how the State verified that each individual case of noncompliance was corrected
There were nine (9) CDSAs with CAPs issued in FFY 2013. These CDSAs received intensive monitoring, TA and support from the EI Branch to correct the noncompliance withinone year of the finding being issued. EI Branch staff verified through record reviews that the CDSA: (1) is correctly implementing the specific regulatory requirements; and (2) hasinitiated services for each child, although late, unless the child is no longer within the jurisdiction of the NC EI Program.
FFY 2013 Findings Not Yet Verified as Corrected
Actions taken if noncompliance not corrected
Two CDSAs, with a total of five (5) findings, are in the process of correcting noncompliance beyond the one-year timeline. At the end of the one-year timeline, the EI Branch notifiedthe two CDSAs, in writing, of the continued noncompliance and asked them to revise their Corrective Action Plans (CAPs). Their Regional Consultants assisted the CDSAs indetermining the root causes of the continued noncompliance, as well as assisted them in revising their current CAPs to address ongoing regulatory noncompliance. The revisedCAPs helped identify and clarify key areas needing improvement and support. These areas included: leadership development, prioritizing staff vacancies, recruitment and retentionof both community-based service providers and CDSA staff, use of consultation with specialized therapists in other CDSAs, reducing provider limitations, strengthening personnelmanagement, using data to make programmatic decisions, increasing general staff accountability, and strengthening internal quality assurance processes. Intensive technicalassistance has been provided for service providers and CDSA staff to ensure procedures affecting timeliness of services are implemented with fidelity.
EI Branch staff will continue to verify through record reviews of updated subsequent data that the CDSAs: (1) are correctly implementing the specific regulatory requirements; and(2) have initiated services for each child, although late, unless the child is no longer within the jurisdiction of the NC EI Program. The process utilized to determine correction ofnoncompliance includes: analysis of progress report information, verification of the correction of child-specific noncompliance, and review of updated subsequent data verifyingthat the timely services requirement is being implemented in accordance with the requirements of IDEA. While current progress reports from the CDSAs reflect improvementrelated to the percent of children receiving services in a timely manner, further correction is still needed to ensure all regulatory requirements are met consistently. Evidence ofcorrection of noncompliance is expected by June 30, 2016.
FFY 2014 Part C State Performance Plan (SPP)/Annual Performance Report (APR)
2/8/2016 Page 6 of 37
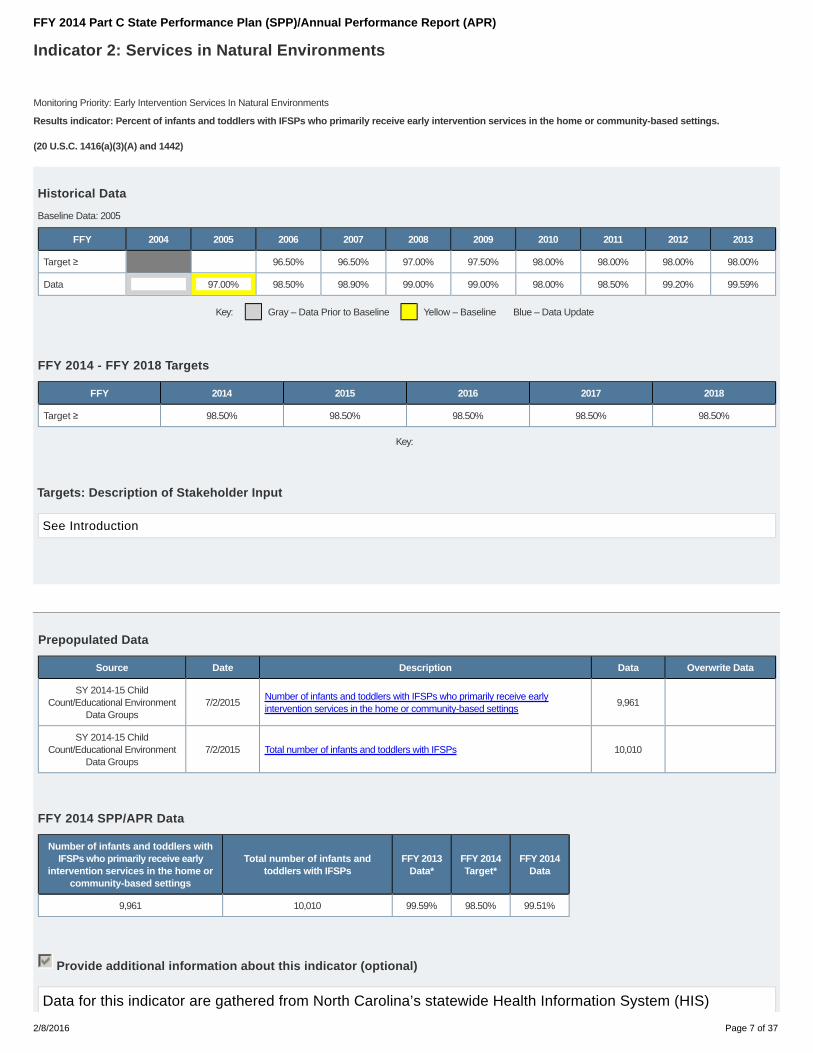
Indicator 2: Services in Natural Environments
Baseline Data: 2005
Monitoring Priority: Early Intervention Services In Natural Environments
Results indicator: Percent of infants and toddlers with IFSPs who primarily receive early intervention services in the home or community-based settings.
(20 U.S.C. 1416(a)(3)(A) and 1442)
Historical Data
FFY 2004 2005 2006 2007 2008 2009 2010 2011 2012 2013
Target ≥ 96.50% 96.50% 97.00% 97.50% 98.00% 98.00% 98.00% 98.00%
Data 97.00% 98.50% 98.90% 99.00% 99.00% 98.00% 98.50% 99.20% 99.59%
Key: Gray – Data Prior to Baseline Yellow – Baseline Blue – Data Update
FFY 2014 - FFY 2018 Targets
FFY 2014 2015 2016 2017 2018
Target ≥ 98.50% 98.50% 98.50% 98.50% 98.50%
Key:
Targets: Description of Stakeholder Input
See Introduction
Prepopulated Data
Source Date Description Data Overwrite Data
SY 2014-15 ChildCount/Educational Environment
Data Groups7/2/2015
Number of infants and toddlers with IFSPs who primarily receive earlyintervention services in the home or community-based settings
9,961
SY 2014-15 ChildCount/Educational Environment
Data Groups7/2/2015 Total number of infants and toddlers with IFSPs 10,010
FFY 2014 SPP/APR Data
Number of infants and toddlers withIFSPs who primarily receive early
intervention services in the home orcommunity-based settings
Total number of infants andtoddlers with IFSPs
FFY 2013Data*
FFY 2014Target*
FFY 2014Data
9,961 10,010 99.59% 98.50% 99.51%
Provide additional information about this indicator (optional)
Data for this indicator are gathered from North Carolina’s statewide Health Information System (HIS)
FFY 2014 Part C State Performance Plan (SPP)/Annual Performance Report (APR)
2/8/2016 Page 7 of 37

database utilizing the December 1, 2014 headcount. There were ten thousand ten (10,010) children in theNC EI Program’s December 1, 2014 headcount. Of these 10,010 children, forty-nine (0.49%, n=49) childrendid not receive early intervention services primarily in the home or community-based settings. The 99.51% ofchildren who did receive services in the home or community-based setting is well above the State’s target of98%..
Actions required in FFY 2013 response
Responses to actions required in FFY 2013 response
FFY 2014 Part C State Performance Plan (SPP)/Annual Performance Report (APR)
2/8/2016 Page 8 of 37

Indicator 3: Early Childhood Outcomes
Monitoring Priority: Early Intervention Services In Natural Environments
Results indicator: Percent of infants and toddlers with IFSPs who demonstrate improved:
Positive social-emotional skills (including social relationships);A.Acquisition and use of knowledge and skills (including early language/ communication); andB.Use of appropriate behaviors to meet their needs.C.
(20 U.S.C. 1416(a)(3)(A) and 1442)
FFY 2014 Part C State Performance Plan (SPP)/Annual Performance Report (APR)
2/8/2016 Page 9 of 37
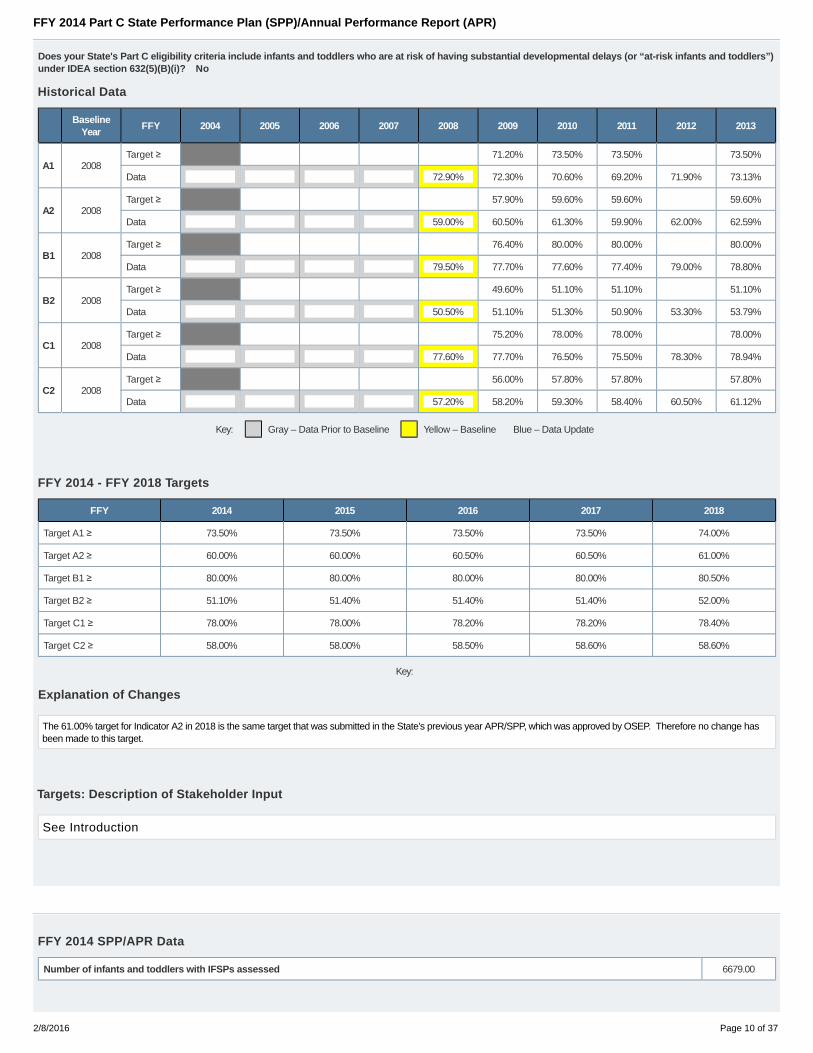
Does your State's Part C eligibility criteria include infants and toddlers who are at risk of having substantial developmental delays (or “at-risk infants and toddlers”)under IDEA section 632(5)(B)(i)? No
Historical Data
Baseline
YearFFY 2004 2005 2006 2007 2008 2009 2010 2011 2012 2013
A1 2008Target ≥ 71.20% 73.50% 73.50% 73.50%
Data 72.90% 72.30% 70.60% 69.20% 71.90% 73.13%
A2 2008Target ≥ 57.90% 59.60% 59.60% 59.60%
Data 59.00% 60.50% 61.30% 59.90% 62.00% 62.59%
B1 2008Target ≥ 76.40% 80.00% 80.00% 80.00%
Data 79.50% 77.70% 77.60% 77.40% 79.00% 78.80%
B2 2008Target ≥ 49.60% 51.10% 51.10% 51.10%
Data 50.50% 51.10% 51.30% 50.90% 53.30% 53.79%
C1 2008Target ≥ 75.20% 78.00% 78.00% 78.00%
Data 77.60% 77.70% 76.50% 75.50% 78.30% 78.94%
C2 2008Target ≥ 56.00% 57.80% 57.80% 57.80%
Data 57.20% 58.20% 59.30% 58.40% 60.50% 61.12%
Key: Gray – Data Prior to Baseline Yellow – Baseline Blue – Data Update
FFY 2014 - FFY 2018 Targets
FFY 2014 2015 2016 2017 2018
Target A1 ≥ 73.50% 73.50% 73.50% 73.50% 74.00%
Target A2 ≥ 60.00% 60.00% 60.50% 60.50% 61.00%
Target B1 ≥ 80.00% 80.00% 80.00% 80.00% 80.50%
Target B2 ≥ 51.10% 51.40% 51.40% 51.40% 52.00%
Target C1 ≥ 78.00% 78.00% 78.20% 78.20% 78.40%
Target C2 ≥ 58.00% 58.00% 58.50% 58.60% 58.60%
Key:
Explanation of Changes
The 61.00% target for Indicator A2 in 2018 is the same target that was submitted in the State's previous year APR/SPP, which was approved by OSEP. Therefore no change hasbeen made to this target.
Targets: Description of Stakeholder Input
See Introduction
FFY 2014 SPP/APR Data
Number of infants and toddlers with IFSPs assessed 6679.00
FFY 2014 Part C State Performance Plan (SPP)/Annual Performance Report (APR)
2/8/2016 Page 10 of 37
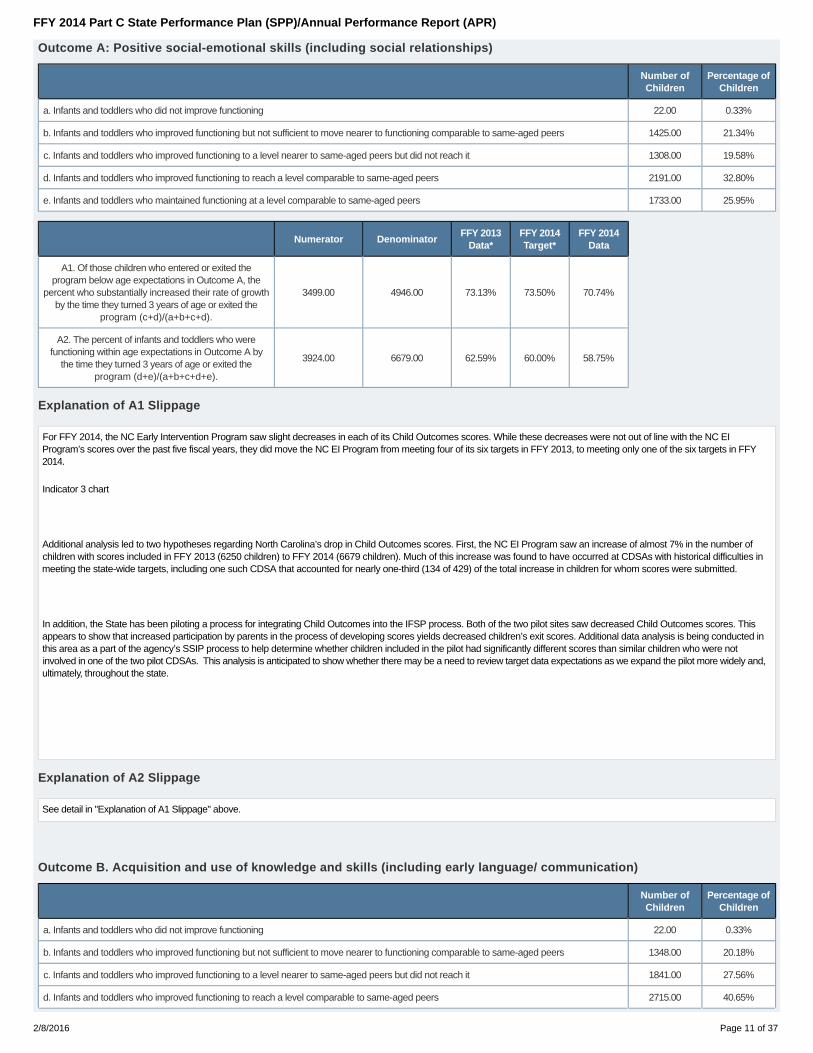
Outcome A: Positive social-emotional skills (including social relationships)
Number ofChildren
Percentage ofChildren
a. Infants and toddlers who did not improve functioning 22.00 0.33%
b. Infants and toddlers who improved functioning but not sufficient to move nearer to functioning comparable to same-aged peers 1425.00 21.34%
c. Infants and toddlers who improved functioning to a level nearer to same-aged peers but did not reach it 1308.00 19.58%
d. Infants and toddlers who improved functioning to reach a level comparable to same-aged peers 2191.00 32.80%
e. Infants and toddlers who maintained functioning at a level comparable to same-aged peers 1733.00 25.95%
Numerator DenominatorFFY 2013
Data*FFY 2014Target*
FFY 2014Data
A1. Of those children who entered or exited theprogram below age expectations in Outcome A, the
percent who substantially increased their rate of growthby the time they turned 3 years of age or exited the
program (c+d)/(a+b+c+d).
3499.00 4946.00 73.13% 73.50% 70.74%
A2. The percent of infants and toddlers who werefunctioning within age expectations in Outcome A by
the time they turned 3 years of age or exited theprogram (d+e)/(a+b+c+d+e).
3924.00 6679.00 62.59% 60.00% 58.75%
Explanation of A1 Slippage
For FFY 2014, the NC Early Intervention Program saw slight decreases in each of its Child Outcomes scores. While these decreases were not out of line with the NC EIProgram’s scores over the past five fiscal years, they did move the NC EI Program from meeting four of its six targets in FFY 2013, to meeting only one of the six targets in FFY2014.
Indicator 3 chart
Additional analysis led to two hypotheses regarding North Carolina’s drop in Child Outcomes scores. First, the NC EI Program saw an increase of almost 7% in the number ofchildren with scores included in FFY 2013 (6250 children) to FFY 2014 (6679 children). Much of this increase was found to have occurred at CDSAs with historical difficulties inmeeting the state-wide targets, including one such CDSA that accounted for nearly one-third (134 of 429) of the total increase in children for whom scores were submitted.
In addition, the State has been piloting a process for integrating Child Outcomes into the IFSP process. Both of the two pilot sites saw decreased Child Outcomes scores. Thisappears to show that increased participation by parents in the process of developing scores yields decreased children’s exit scores. Additional data analysis is being conducted inthis area as a part of the agency’s SSIP process to help determine whether children included in the pilot had significantly different scores than similar children who were notinvolved in one of the two pilot CDSAs. This analysis is anticipated to show whether there may be a need to review target data expectations as we expand the pilot more widely and,ultimately, throughout the state.
Explanation of A2 Slippage
See detail in "Explanation of A1 Slippage" above.
Outcome B. Acquisition and use of knowledge and skills (including early language/ communication)
Number ofChildren
Percentage ofChildren
a. Infants and toddlers who did not improve functioning 22.00 0.33%
b. Infants and toddlers who improved functioning but not sufficient to move nearer to functioning comparable to same-aged peers 1348.00 20.18%
c. Infants and toddlers who improved functioning to a level nearer to same-aged peers but did not reach it 1841.00 27.56%
d. Infants and toddlers who improved functioning to reach a level comparable to same-aged peers 2715.00 40.65%
FFY 2014 Part C State Performance Plan (SPP)/Annual Performance Report (APR)
2/8/2016 Page 11 of 37
Number ofChildren
Percentage ofChildren
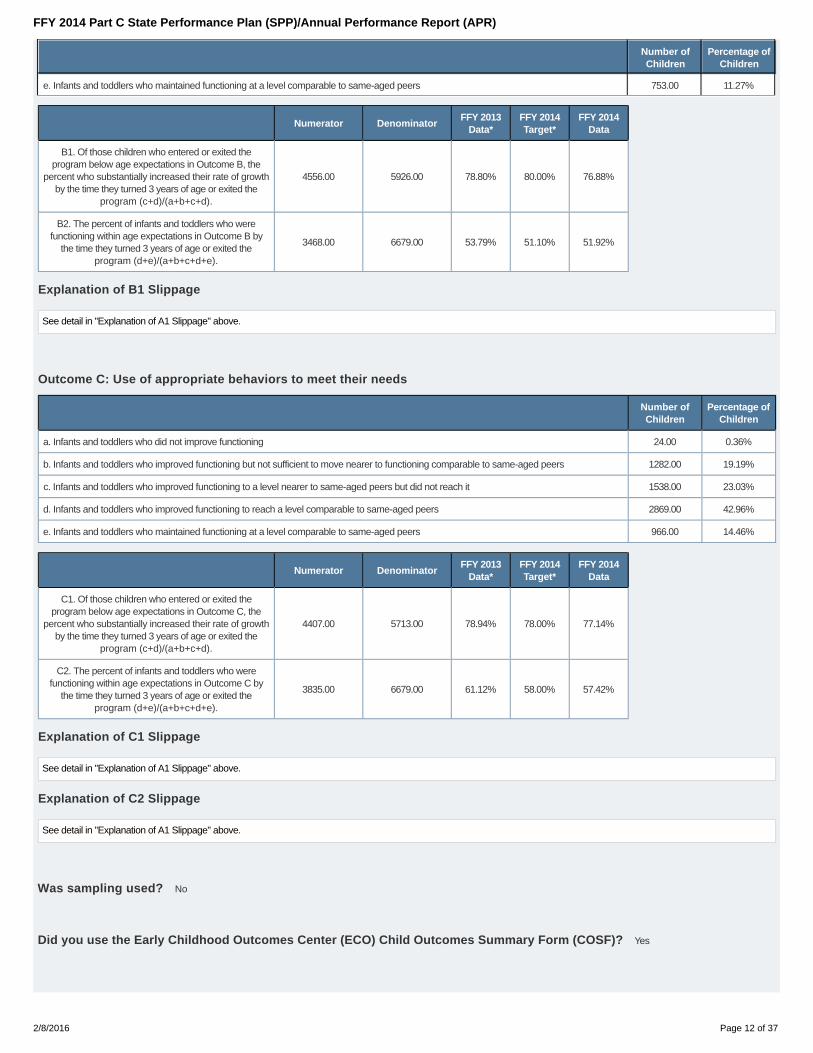
e. Infants and toddlers who maintained functioning at a level comparable to same-aged peers 753.00 11.27%
Numerator DenominatorFFY 2013
Data*FFY 2014Target*
FFY 2014Data
B1. Of those children who entered or exited theprogram below age expectations in Outcome B, the
percent who substantially increased their rate of growthby the time they turned 3 years of age or exited the
program (c+d)/(a+b+c+d).
4556.00 5926.00 78.80% 80.00% 76.88%
B2. The percent of infants and toddlers who werefunctioning within age expectations in Outcome B by
the time they turned 3 years of age or exited theprogram (d+e)/(a+b+c+d+e).
3468.00 6679.00 53.79% 51.10% 51.92%
Explanation of B1 Slippage
See detail in "Explanation of A1 Slippage" above.
Outcome C: Use of appropriate behaviors to meet their needs
Number ofChildren
Percentage ofChildren
a. Infants and toddlers who did not improve functioning 24.00 0.36%
b. Infants and toddlers who improved functioning but not sufficient to move nearer to functioning comparable to same-aged peers 1282.00 19.19%
c. Infants and toddlers who improved functioning to a level nearer to same-aged peers but did not reach it 1538.00 23.03%
d. Infants and toddlers who improved functioning to reach a level comparable to same-aged peers 2869.00 42.96%
e. Infants and toddlers who maintained functioning at a level comparable to same-aged peers 966.00 14.46%
Numerator DenominatorFFY 2013
Data*FFY 2014Target*
FFY 2014Data
C1. Of those children who entered or exited theprogram below age expectations in Outcome C, the
percent who substantially increased their rate of growthby the time they turned 3 years of age or exited the
program (c+d)/(a+b+c+d).
4407.00 5713.00 78.94% 78.00% 77.14%
C2. The percent of infants and toddlers who werefunctioning within age expectations in Outcome C by
the time they turned 3 years of age or exited theprogram (d+e)/(a+b+c+d+e).
3835.00 6679.00 61.12% 58.00% 57.42%
Explanation of C1 Slippage
See detail in "Explanation of A1 Slippage" above.
Explanation of C2 Slippage
See detail in "Explanation of A1 Slippage" above.
Was sampling used? No
Did you use the Early Childhood Outcomes Center (ECO) Child Outcomes Summary Form (COSF)? Yes
FFY 2014 Part C State Performance Plan (SPP)/Annual Performance Report (APR)
2/8/2016 Page 12 of 37
Actions required in FFY 2013 response
None
Responses to actions required in FFY 2013 response
FFY 2014 Part C State Performance Plan (SPP)/Annual Performance Report (APR)
2/8/2016 Page 13 of 37
Indicator 4: Family Involvement
Monitoring Priority: Early Intervention Services In Natural Environments
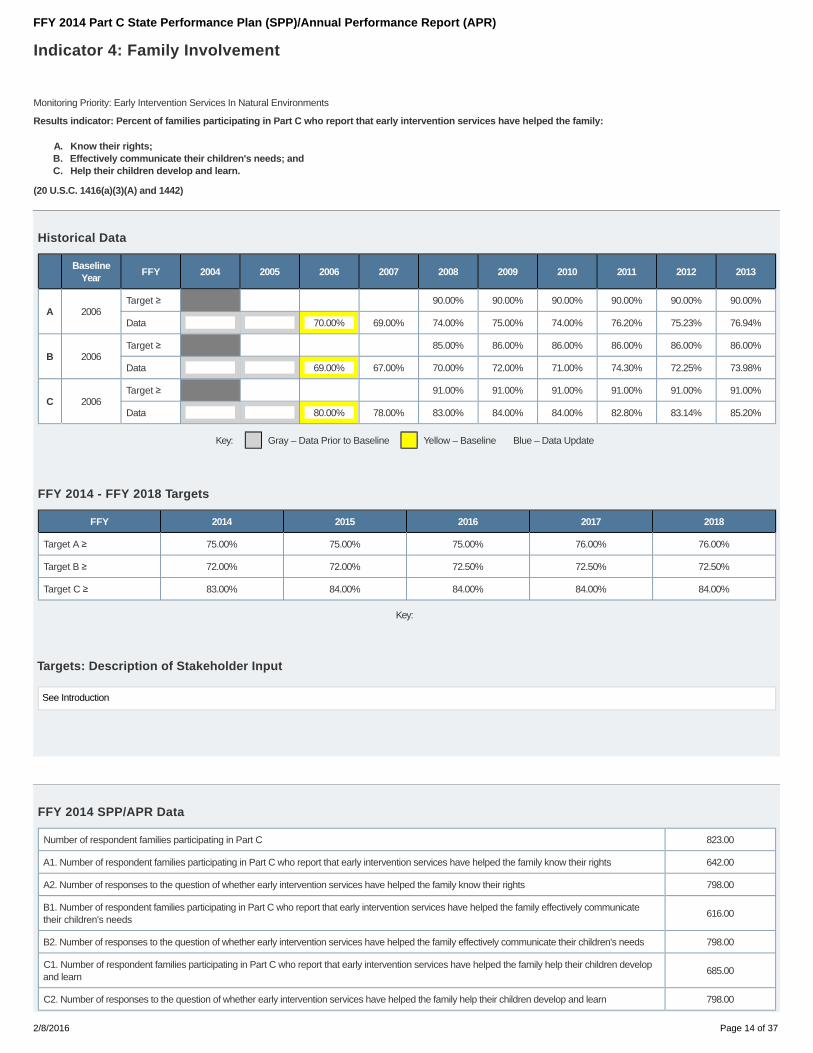
Results indicator: Percent of families participating in Part C who report that early intervention services have helped the family:
Know their rights;A.Effectively communicate their children's needs; andB.Help their children develop and learn.C.
(20 U.S.C. 1416(a)(3)(A) and 1442)
Historical Data
Baseline
YearFFY 2004 2005 2006 2007 2008 2009 2010 2011 2012 2013
A 2006Target ≥ 90.00% 90.00% 90.00% 90.00% 90.00% 90.00%
Data 70.00% 69.00% 74.00% 75.00% 74.00% 76.20% 75.23% 76.94%
B 2006Target ≥ 85.00% 86.00% 86.00% 86.00% 86.00% 86.00%
Data 69.00% 67.00% 70.00% 72.00% 71.00% 74.30% 72.25% 73.98%
C 2006Target ≥ 91.00% 91.00% 91.00% 91.00% 91.00% 91.00%
Data 80.00% 78.00% 83.00% 84.00% 84.00% 82.80% 83.14% 85.20%
Key: Gray – Data Prior to Baseline Yellow – Baseline Blue – Data Update
FFY 2014 - FFY 2018 Targets
FFY 2014 2015 2016 2017 2018
Target A ≥ 75.00% 75.00% 75.00% 76.00% 76.00%
Target B ≥ 72.00% 72.00% 72.50% 72.50% 72.50%
Target C ≥ 83.00% 84.00% 84.00% 84.00% 84.00%
Key:
Targets: Description of Stakeholder Input
See Introduction
FFY 2014 SPP/APR Data
Number of respondent families participating in Part C 823.00
A1. Number of respondent families participating in Part C who report that early intervention services have helped the family know their rights 642.00
A2. Number of responses to the question of whether early intervention services have helped the family know their rights 798.00
B1. Number of respondent families participating in Part C who report that early intervention services have helped the family effectively communicatetheir children's needs
616.00
B2. Number of responses to the question of whether early intervention services have helped the family effectively communicate their children's needs 798.00
C1. Number of respondent families participating in Part C who report that early intervention services have helped the family help their children developand learn
685.00
C2. Number of responses to the question of whether early intervention services have helped the family help their children develop and learn 798.00
FFY 2014 Part C State Performance Plan (SPP)/Annual Performance Report (APR)
2/8/2016 Page 14 of 37
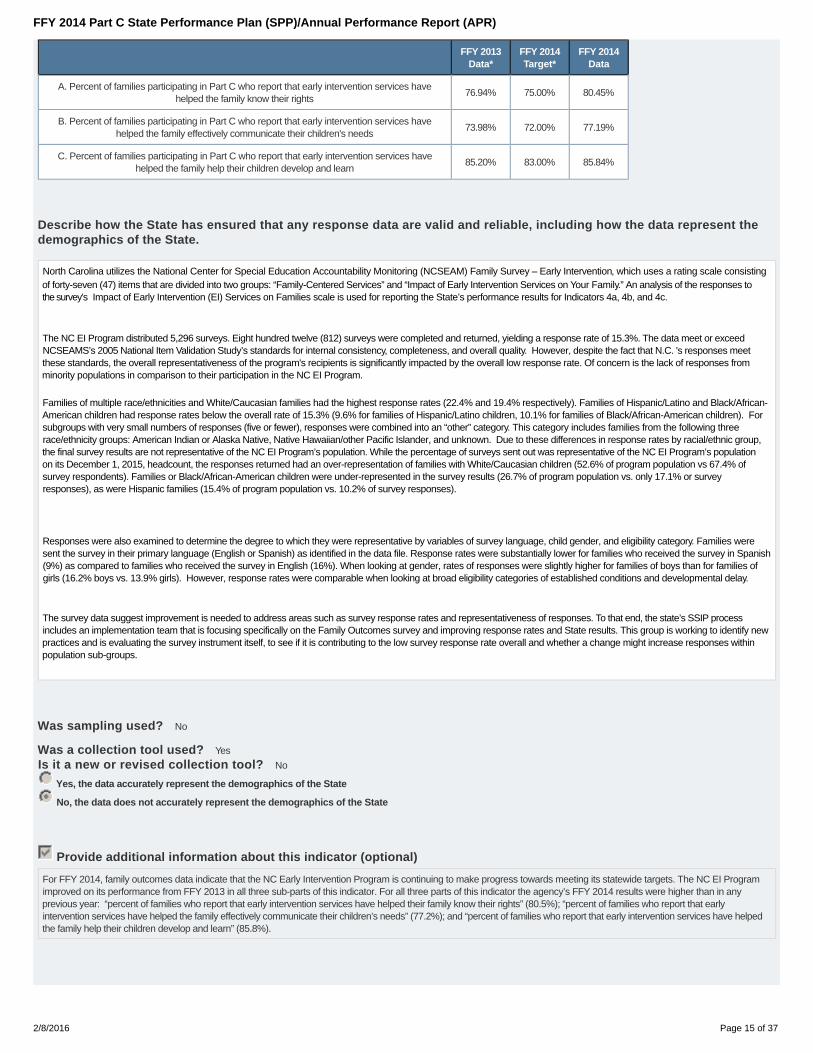
FFY 2013Data*
FFY 2014Target*
FFY 2014Data
A. Percent of families participating in Part C who report that early intervention services havehelped the family know their rights
76.94% 75.00% 80.45%
B. Percent of families participating in Part C who report that early intervention services havehelped the family effectively communicate their children's needs
73.98% 72.00% 77.19%
C. Percent of families participating in Part C who report that early intervention services havehelped the family help their children develop and learn
85.20% 83.00% 85.84%
Describe how the State has ensured that any response data are valid and reliable, including how the data represent thedemographics of the State.
North Carolina utilizes the National Center for Special Education Accountability Monitoring (NCSEAM) Family Survey – Early Intervention, which uses a rating scale consistingof forty-seven (47) items that are divided into two groups: “Family-Centered Services” and “Impact of Early Intervention Services on Your Family.” An analysis of the responses tothe survey’s Impact of Early Intervention (EI) Services on Families scale is used for reporting the State’s performance results for Indicators 4a, 4b, and 4c.
The NC EI Program distributed 5,296 surveys. Eight hundred twelve (812) surveys were completed and returned, yielding a response rate of 15.3%. The data meet or exceedNCSEAMS’s 2005 National Item Validation Study’s standards for internal consistency, completeness, and overall quality. However, despite the fact that N.C. 's responses meetthese standards, the overall representativeness of the program's recipients is significantly impacted by the overall low response rate. Of concern is the lack of responses fromminority populations in comparison to their participation in the NC EI Program.
Families of multiple race/ethnicities and White/Caucasian families had the highest response rates (22.4% and 19.4% respectively). Families of Hispanic/Latino and Black/African-American children had response rates below the overall rate of 15.3% (9.6% for families of Hispanic/Latino children, 10.1% for families of Black/African-American children). Forsubgroups with very small numbers of responses (five or fewer), responses were combined into an “other” category. This category includes families from the following threerace/ethnicity groups: American Indian or Alaska Native, Native Hawaiian/other Pacific Islander, and unknown. Due to these differences in response rates by racial/ethnic group,the final survey results are not representative of the NC EI Program’s population. While the percentage of surveys sent out was representative of the NC EI Program’s populationon its December 1, 2015, headcount, the responses returned had an over-representation of families with White/Caucasian children (52.6% of program population vs 67.4% ofsurvey respondents). Families or Black/African-American children were under-represented in the survey results (26.7% of program population vs. only 17.1% or surveyresponses), as were Hispanic families (15.4% of program population vs. 10.2% of survey responses).
Responses were also examined to determine the degree to which they were representative by variables of survey language, child gender, and eligibility category. Families weresent the survey in their primary language (English or Spanish) as identified in the data file. Response rates were substantially lower for families who received the survey in Spanish(9%) as compared to families who received the survey in English (16%). When looking at gender, rates of responses were slightly higher for families of boys than for families ofgirls (16.2% boys vs. 13.9% girls). However, response rates were comparable when looking at broad eligibility categories of established conditions and developmental delay.
The survey data suggest improvement is needed to address areas such as survey response rates and representativeness of responses. To that end, the state’s SSIP processincludes an implementation team that is focusing specifically on the Family Outcomes survey and improving response rates and State results. This group is working to identify newpractices and is evaluating the survey instrument itself, to see if it is contributing to the low survey response rate overall and whether a change might increase responses withinpopulation sub-groups.
Was sampling used? No
Was a collection tool used? Yes
Is it a new or revised collection tool? No
Yes, the data accurately represent the demographics of the State
No, the data does not accurately represent the demographics of the State
Provide additional information about this indicator (optional)
For FFY 2014, family outcomes data indicate that the NC Early Intervention Program is continuing to make progress towards meeting its statewide targets. The NC EI Programimproved on its performance from FFY 2013 in all three sub-parts of this indicator. For all three parts of this indicator the agency’s FFY 2014 results were higher than in anyprevious year: “percent of families who report that early intervention services have helped their family know their rights” (80.5%); “percent of families who report that earlyintervention services have helped the family effectively communicate their children’s needs” (77.2%); and “percent of families who report that early intervention services have helpedthe family help their children develop and learn” (85.8%).
FFY 2014 Part C State Performance Plan (SPP)/Annual Performance Report (APR)
2/8/2016 Page 15 of 37
Actions required in FFY 2013 response
Responses to actions required in FFY 2013 response, not including correction of findings
FFY 2014 Part C State Performance Plan (SPP)/Annual Performance Report (APR)
2/8/2016 Page 16 of 37

Indicator 5: Child Find (Birth to One)
Baseline Data: 2005
Monitoring Priority: Effective General Supervision Part C / Child Find
Results indicator: Percent of infants and toddlers birth to 1 with IFSPs compared to national data.
(20 U.S.C. 1416(a)(3)(B) and 1442)
Historical Data
FFY 2004 2005 2006 2007 2008 2009 2010 2011 2012 2013
Target ≥ 1.00% 1.10% 1.10% 1.10% 1.10% 1.10% 1.10% 1.10%
Data 0.78% 0.84% 0.89% 0.95% 1.04% 1.01% 1.12% 1.19% 1.21%
Key: Gray – Data Prior to Baseline Yellow – Baseline Blue – Data Update
FFY 2014 - FFY 2018 Targets
FFY 2014 2015 2016 2017 2018
Target ≥ 1.10% 1.10% 1.15% 1.15% 1.15%
Key:
Targets: Description of Stakeholder Input
See Introduction
Prepopulated Data
Source Date Description Data Overwrite Data
SY 2014-15 ChildCount/Educational Environment
Data Groups7/2/2015 Number of infants and toddlers birth to 1 with IFSPs 1,358 null
U.S. Census Annual StateResident Population Estimates
April 1, 2010 to July 1, 20134/3/2014 Population of infants and toddlers birth to 1 119,904 null
FFY 2014 SPP/APR Data
Number of infants and toddlers birth to 1with IFSPs
Population of infants andtoddlers birth to 1
FFY 2013Data*
FFY 2014Target*
FFY 2014Data
1,358 119,904 1.21% 1.10% 1.13%
Provide additional information about this indicator (optional)
In FFY 2014, North Carolina had 1.13% (1358 of 119,904) children ages birth to one with IFSPs. For the past four (4) federal fiscal years, North Carolina has met its target forpercentage of children age birth-to-one served. The State saw a .07 percentage point decrease from FFY 2013 (1.21%) to FFY 2014 (1.13%). While FFY 2014 data is not out ofline with the NC EI Program’s historical data for the past several years, this slight decrease may indicate the need for the NC EI Program to pay additional attention to child findefforts for this age group.
FFY 2014 Part C State Performance Plan (SPP)/Annual Performance Report (APR)
2/8/2016 Page 17 of 37
Notably, this slight decrease shows that the NC EI Program’s data is back in line with the national average for this indicator after the State had exceeded the national average forthe first time in FFY 2013.
Actions required in FFY 2013 response
Responses to actions required in FFY 2013 response
FFY 2014 Part C State Performance Plan (SPP)/Annual Performance Report (APR)
2/8/2016 Page 18 of 37
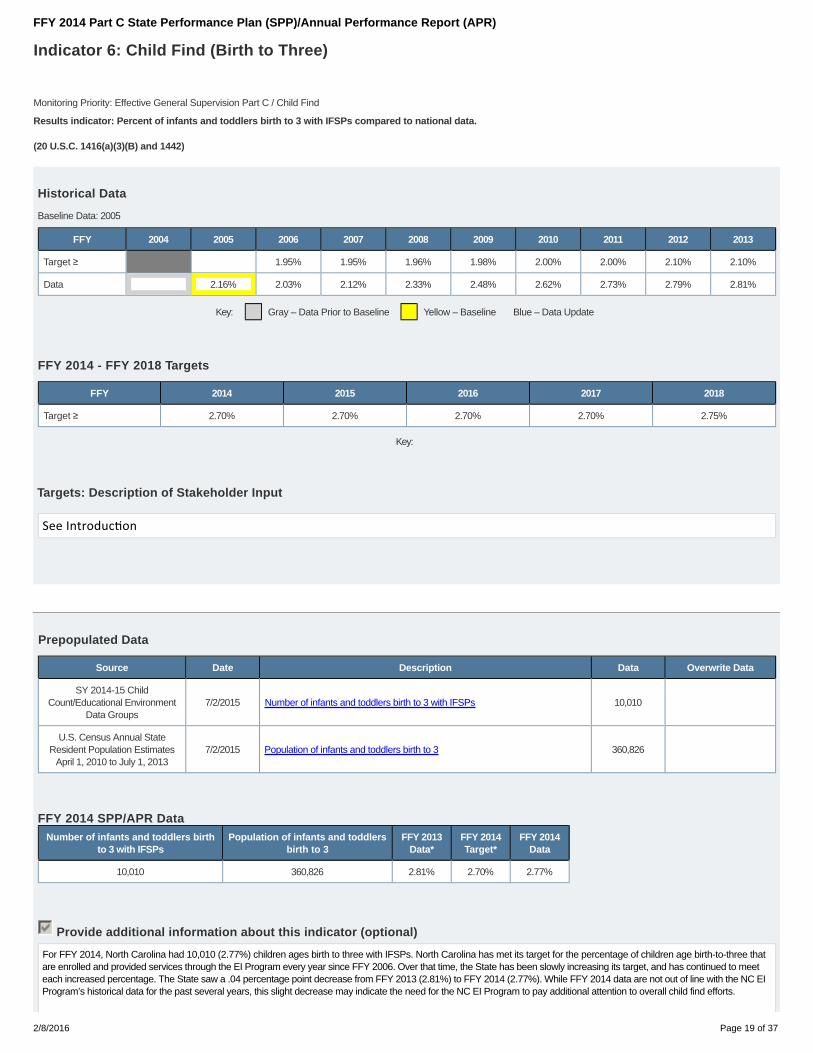
Indicator 6: Child Find (Birth to Three)
Baseline Data: 2005
Monitoring Priority: Effective General Supervision Part C / Child Find
Results indicator: Percent of infants and toddlers birth to 3 with IFSPs compared to national data.
(20 U.S.C. 1416(a)(3)(B) and 1442)
Historical Data
FFY 2004 2005 2006 2007 2008 2009 2010 2011 2012 2013
Target ≥ 1.95% 1.95% 1.96% 1.98% 2.00% 2.00% 2.10% 2.10%
Data 2.16% 2.03% 2.12% 2.33% 2.48% 2.62% 2.73% 2.79% 2.81%
Key: Gray – Data Prior to Baseline Yellow – Baseline Blue – Data Update
FFY 2014 - FFY 2018 Targets
FFY 2014 2015 2016 2017 2018
Target ≥ 2.70% 2.70% 2.70% 2.70% 2.75%
Key:
Targets: Description of Stakeholder Input
See Introduc on
Prepopulated Data
Source Date Description Data Overwrite Data
SY 2014-15 ChildCount/Educational Environment
Data Groups7/2/2015 Number of infants and toddlers birth to 3 with IFSPs 10,010
U.S. Census Annual StateResident Population Estimates
April 1, 2010 to July 1, 20137/2/2015 Population of infants and toddlers birth to 3 360,826
FFY 2014 SPP/APR DataNumber of infants and toddlers birth
to 3 with IFSPsPopulation of infants and toddlers
birth to 3FFY 2013
Data*FFY 2014Target*
FFY 2014Data
10,010 360,826 2.81% 2.70% 2.77%
Provide additional information about this indicator (optional)
For FFY 2014, North Carolina had 10,010 (2.77%) children ages birth to three with IFSPs. North Carolina has met its target for the percentage of children age birth-to-three thatare enrolled and provided services through the EI Program every year since FFY 2006. Over that time, the State has been slowly increasing its target, and has continued to meeteach increased percentage. The State saw a .04 percentage point decrease from FFY 2013 (2.81%) to FFY 2014 (2.77%). While FFY 2014 data are not out of line with the NC EIProgram’s historical data for the past several years, this slight decrease may indicate the need for the NC EI Program to pay additional attention to overall child find efforts.
FFY 2014 Part C State Performance Plan (SPP)/Annual Performance Report (APR)
2/8/2016 Page 19 of 37
In FFY 2013, a decrease in the national average for this indicator brought the State in line with the national average for the first time. Though the decrease in N.C.’s data from FFY2013 to FFY 2014 is small (.04), the national average increased in FFY 2014 to 2.95%, which is more in line with previous years’ national averages. As such, this national increasepushed N.C. below the national average, which is more in line with pre-2013 data.
Actions required in FFY 2013 response
Responses to actions required in FFY 2013 response
FFY 2014 Part C State Performance Plan (SPP)/Annual Performance Report (APR)
2/8/2016 Page 20 of 37
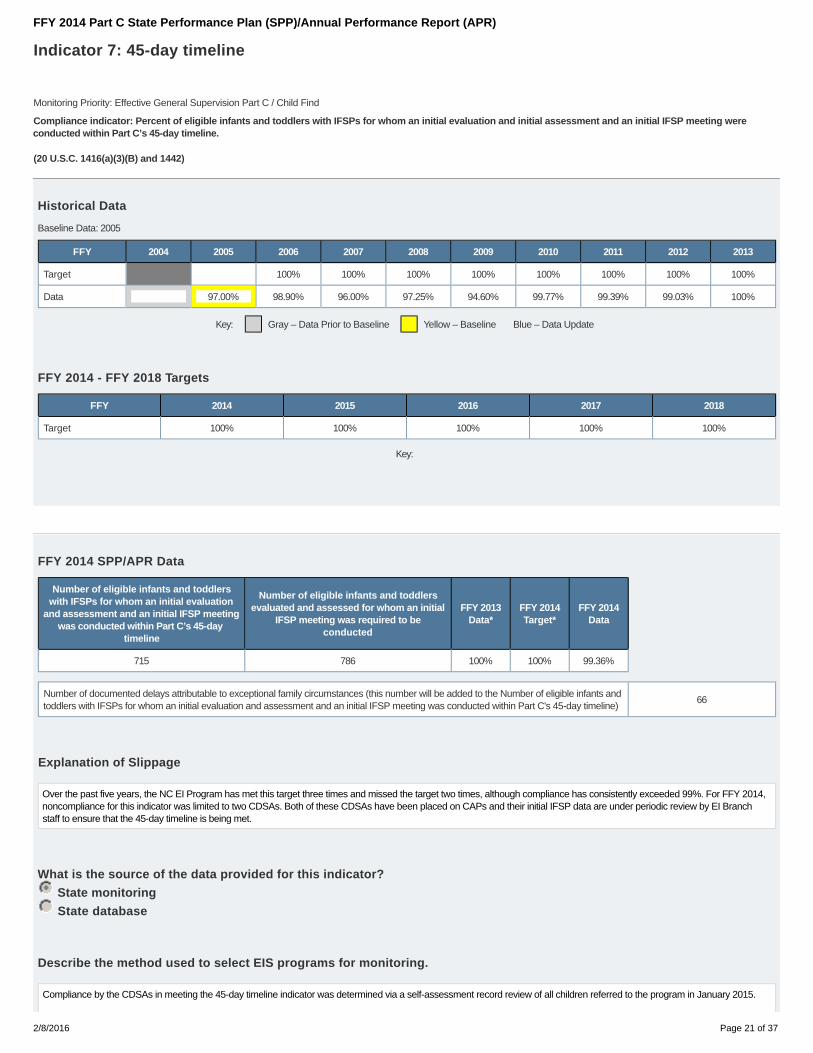
Indicator 7: 45-day timeline
Baseline Data: 2005
Monitoring Priority: Effective General Supervision Part C / Child Find
Compliance indicator: Percent of eligible infants and toddlers with IFSPs for whom an initial evaluation and initial assessment and an initial IFSP meeting wereconducted within Part C’s 45-day timeline.
(20 U.S.C. 1416(a)(3)(B) and 1442)
Historical Data
FFY 2004 2005 2006 2007 2008 2009 2010 2011 2012 2013
Target 100% 100% 100% 100% 100% 100% 100% 100%
Data 97.00% 98.90% 96.00% 97.25% 94.60% 99.77% 99.39% 99.03% 100%
Key: Gray – Data Prior to Baseline Yellow – Baseline Blue – Data Update
FFY 2014 - FFY 2018 Targets
FFY 2014 2015 2016 2017 2018
Target 100% 100% 100% 100% 100%
Key:
FFY 2014 SPP/APR Data
Number of eligible infants and toddlerswith IFSPs for whom an initial evaluation
and assessment and an initial IFSP meetingwas conducted within Part C’s 45-day
timeline
Number of eligible infants and toddlersevaluated and assessed for whom an initial
IFSP meeting was required to beconducted
FFY 2013Data*
FFY 2014Target*
FFY 2014Data
715 786 100% 100% 99.36%
Number of documented delays attributable to exceptional family circumstances (this number will be added to the Number of eligible infants andtoddlers with IFSPs for whom an initial evaluation and assessment and an initial IFSP meeting was conducted within Part C's 45-day timeline)
66
Explanation of Slippage
Over the past five years, the NC EI Program has met this target three times and missed the target two times, although compliance has consistently exceeded 99%. For FFY 2014,noncompliance for this indicator was limited to two CDSAs. Both of these CDSAs have been placed on CAPs and their initial IFSP data are under periodic review by EI Branchstaff to ensure that the 45-day timeline is being met.
What is the source of the data provided for this indicator?
State monitoring
State database
Describe the method used to select EIS programs for monitoring.
Compliance by the CDSAs in meeting the 45-day timeline indicator was determined via a self-assessment record review of all children referred to the program in January 2015.
FFY 2014 Part C State Performance Plan (SPP)/Annual Performance Report (APR)
2/8/2016 Page 21 of 37

The EI Branch provided each CDSA with a list of children (extracted from the state’s database) who were referred during January 2015, for whom IFSPs were due in February andMarch of 2015. The record review process is used to determine compliance or noncompliance, including accounting for untimely evaluations, assessments, and initial IFSPmeetings, and the specific reasons for delays.
Provide the time period in which the data were collected (e.g., September through December, fourth quarter, selectionfrom the full reporting period).
Describe how the data accurately reflect data for infants and toddlers with IFSPs for the full reporting period.
Provide additional information about this indicator (optional)
Data on seven hundred eighty-six (786) children were examined to verify whether North Carolina achieved 100% compliance for this indicator. Seven hundred fifteen (715) childrenreceived an IFSP within 45 days of referral. An additional sixty-six (66) children did not receive an IFSP in a timely manner due to documented exceptional family circumstances.Therefore, 781 (715 + 66) out of 786 children (99.36%) had evaluation/assessment and an initial IFSP meeting within the requisite 45-day timeline for indicator. Five children(<1%) received evaluation/assessment and an IFSP after the 45-day timeline lapsed, due to CDSA-specific delays.
Actions required in FFY 2013 response
Responses to actions required in FFY 2013 response, not including correction of findings
Correction of Findings of Noncompliance Identified in FFY 2013
Findings of Noncompliance IdentifiedFindings of Noncompliance Verified
as Corrected Within One YearFindings of Noncompliance
Subsequently CorrectedFindings Not Yet Verified as Corrected
0 0 0 0
FFY 2014 Part C State Performance Plan (SPP)/Annual Performance Report (APR)
2/8/2016 Page 22 of 37

Indicator 8A: Early Childhood Transition
Baseline Data: 2005
Monitoring Priority: Effective General Supervision Part C / Effective Transition
Compliance indicator: The percentage of toddlers with disabilities exiting Part C with timely transition planning for whom the Lead Agency has:
Developed an IFSP with transition steps and services at least 90 days, and at the discretion of all parties, not more than nine months, prior to the toddler’sthird birthday;
A.
Notified (consistent with any opt-out policy adopted by the State) the SEA and the LEA where the toddler resides at least 90 days prior to the toddler’s thirdbirthday for toddlers potentially eligible for Part B preschool services; and
B.
Conducted the transition conference held with the approval of the family at least 90 days, and at the discretion of all parties, not more than nine months,prior to the toddler’s third birthday for toddlers potentially eligible for Part B preschool services.
C.
(20 U.S.C. 1416(a)(3)(B) and 1442)
Historical Data
FFY 2004 2005 2006 2007 2008 2009 2010 2011 2012 2013
Target 100% 100% 100% 100% 100% 100% 100% 100%
Data 90.00% 99.26% 96.00% 99.50% 99.80% 100% 100% 99.83% 100%
Key: Gray – Data Prior to Baseline Yellow – Baseline
FFY 2014 - FFY 2018 Targets
FFY 2014 2015 2016 2017 2018
Target 100% 100% 100% 100% 100%
FFY 2014 SPP/APR Data
Explanation of Alternate Data
North Carolina uses its monitoring process for this indicator rather than reviewing data for all children who exited Part C during the year. See description of monitoring processbelow.
Data include only those toddlers with disabilities exiting Part C with timely transition planning for whom the Lead Agencyhas developed an IFSP with transition steps and services at least 90 days, and at the discretion of all parties, not morethan nine months, prior to the toddler’s third birthday.
Yes
No
Number of children exiting Part C whohave an IFSP with transition steps and
servicesNumber of toddlers with disabilities exiting
Part CFFY 2013
Data*FFY 2014Target*
FFY 2014Data
522 525 100% 100% 99.62%
Number of documented delays attributable to exceptional family circumstances (this number will be added to the Number of children exitingPart C who have an IFSP with transition steps and services)
1
FFY 2014 Part C State Performance Plan (SPP)/Annual Performance Report (APR)
2/8/2016 Page 23 of 37

Explanation of Slippage
Over the past five years, the NC EI Program has met this target three times and missed the target two times, although compliance exceeded 99%. For FFY 2014, noncompliancefor this indicator was limited to a single CDSA. That CDSA is working under a corrective action plan and its transition data are under periodic review by EI Branch staff to ensurethat transition plan requirements are being met.
What is the source of the data provided for this indicator?
State monitoring
State database
Describe the method used to select EIS programs for monitoring.
Data for IFSPs with transition steps and services are collected via a self-assessment process. CDSAs were provided a list of records for all children who were 2 years, 9 monthsof age in January 2015, and should have had a transition plan with steps developed, notification to the LEA/SEA, and a transition-planning conference by January 2015 to review aspart of the self-assessment process.
Reasons for noncompliance were collected when noncompliance was identified.
Provide additional information about this indicator (optional)
Data on five hundred twenty-five (525) children were examined to verify compliance with the transition plan timeline requirement. Five hundred twenty-two (522) children receivedan IFSP with transition steps and services in a timely manner. One (1) additional child did not receive a transition plan in a timely manner due to documented exceptional familycircumstances. Therefore, 523 of 525 children (99.62%) were in compliance with the transition plan timeline measured by this indicator. Less than one percent (<1%, n = 2) ofchildren did not receive a timely transition plan due to CDSA-specific delays.
Actions required in FFY 2013 response
Responses to actions required in FFY 2013 response, not including correction of findings
Correction of Findings of Noncompliance Identified in FFY 2013
Findings of Noncompliance IdentifiedFindings of Noncompliance Verified
as Corrected Within One YearFindings of Noncompliance
Subsequently CorrectedFindings Not Yet Verified as Corrected
0 0 0 0
FFY 2014 Part C State Performance Plan (SPP)/Annual Performance Report (APR)
2/8/2016 Page 24 of 37

Indicator 8B: Early Childhood Transition
Baseline Data: 2005
Monitoring Priority: Effective General Supervision Part C / Effective Transition
Compliance indicator: The percentage of toddlers with disabilities exiting Part C with timely transition planning for whom the Lead Agency has:
Developed an IFSP with transition steps and services at least 90 days, and at the discretion of all parties, not more than nine months, prior to the toddler’sthird birthday;
A.
Notified (consistent with any opt-out policy adopted by the State) the SEA and the LEA where the toddler resides at least 90 days prior to the toddler’s thirdbirthday for toddlers potentially eligible for Part B preschool services; and
B.
Conducted the transition conference held with the approval of the family at least 90 days, and at the discretion of all parties, not more than nine months,prior to the toddler’s third birthday for toddlers potentially eligible for Part B preschool services.
C.
(20 U.S.C. 1416(a)(3)(B) and 1442)
Historical Data
FFY 2004 2005 2006 2007 2008 2009 2010 2011 2012 2013
Target 100% 100% 100% 100% 100% 100% 100% 100%
Data 88.00% 96.00% 98.00% 99.54% 99.50% 99.80% 99.83% 99.83% 100%
Key: Gray – Data Prior to Baseline Yellow – Baseline
FFY 2014 - FFY 2018 Targets
FFY 2014 2015 2016 2017 2018
Target 100% 100% 100% 100% 100%
FFY 2014 SPP/APR Data
Explanation of Alternate Data
North Carolina uses its monitoring process for this indicator rather than reviewing data for all children who exited Part C during the year. See description of N.C.'s monitoringprocess below.
Data include notification to both the SEA and LEA
Yes
No
Number of toddlers with disabilities exitingPart C where notification to the SEA and
LEA occurred at least 90 days prior to theirthird birthday for toddlers potentiallyeligible for Part B preschool services
Number of toddlers with disabilities exitingPart C who were potentially eligible for Part
BFFY 2013
Data*FFY 2014Target*
FFY 2014Data
584 586 100% 100% 99.66%
Number of parents who opted out (this number will be subtracted from the number of toddlers with disabilities exiting Part C who werepotentially eligible for Part B when calculating the FFY 2014 Data)
0
Explanation of Slippage
FFY 2014 Part C State Performance Plan (SPP)/Annual Performance Report (APR)
2/8/2016 Page 25 of 37

Over the past five years, the NC EI Program has met this target only one time, in FFY 2013, though compliance in most years has been higher than 99%. For FFY 2014,noncompliance (0.34%) for this indicator was limited to a single CDSA. That CDSA is working under a Corrective Action Plan and its transition data are under periodic review byEI Branch staff to ensure that LEA and SEA notification timeline requirements are being met.
Describe the method used to collect these data
Data for IFSPs with transition steps and services are collected via a self-assessment process. CDSAs were provided a list of records for all children who were 2 years, 9 monthsof age in January 2015, and should have had a transition plan with steps developed, notification to the LEA/SEA, and a transition-planning conference by January 2015 to review aspart of the self-assessment process.
Do you have a written opt-out policy? No
What is the source of the data provided for this indicator?
State monitoring
State database
Describe the method used to select EIS programs for monitoring.
Data for IFSPs with transition steps and services are collected via a self-assessment process. CDSAs were provided a list of records for all children who were 2 years, 9 monthsof age in January 2015, and should have had a transition plan with steps developed, notification to the LEA/SEA, and a transition-planning conference by January 2015 to review aspart of the self-assessment process.
Provide additional information about this indicator (optional)
Data on five hundred eighty-six (586) children were reviewed to verify compliance with the SEA/LEA notification timeline requirement. Five hundred eighty-four (584) children’srecords that were reviewed had LEA/SEA notifications completed in a timely manner, for a compliance rate of 99.66%. Less than one percent (<1%, n = 2) of children did notreceive a timely transition plan due to CDSA-specific delays.
Actions required in FFY 2013 response
Responses to actions required in FFY 2013 response, not including correction of findings
Correction of Findings of Noncompliance Identified in FFY 2013
Findings of Noncompliance IdentifiedFindings of Noncompliance Verified
as Corrected Within One YearFindings of Noncompliance
Subsequently CorrectedFindings Not Yet Verified as Corrected
0 0 0 0
FFY 2014 Part C State Performance Plan (SPP)/Annual Performance Report (APR)
2/8/2016 Page 26 of 37

Indicator 8C: Early Childhood Transition
Baseline Data: 2005
Monitoring Priority: Effective General Supervision Part C / Effective Transition
Compliance indicator: The percentage of toddlers with disabilities exiting Part C with timely transition planning for whom the Lead Agency has:
Developed an IFSP with transition steps and services at least 90 days, and at the discretion of all parties, not more than nine months, prior to the toddler’sthird birthday;
A.
Notified (consistent with any opt-out policy adopted by the State) the SEA and the LEA where the toddler resides at least 90 days prior to the toddler’s thirdbirthday for toddlers potentially eligible for Part B preschool services; and
B.
Conducted the transition conference held with the approval of the family at least 90 days, and at the discretion of all parties, not more than nine months,prior to the toddler’s third birthday for toddlers potentially eligible for Part B preschool services.
C.
(20 U.S.C. 1416(a)(3)(B) and 1442)
Historical Data
FFY 2004 2005 2006 2007 2008 2009 2010 2011 2012 2013
Target 100% 100% 100% 100% 100% 100% 100% 100%
Data 81.00% 99.26% 96.00% 98.09% 97.20% 95.20% 98.78% 99.12% 98.87%
Key: Gray – Data Prior to Baseline Yellow – Baseline
FFY 2014 - FFY 2018 Targets
FFY 2014 2015 2016 2017 2018
Target 100% 100% 100% 100% 100%
FFY 2014 SPP/APR Data
Explanation of Alternate Data
North Carolina uses its monitoring process for this indicator rather than reviewing data for all children who exited Part C during the year. See description of monitoring processbelow
Data reflect only those toddlers for whom the Lead Agency has conducted the transition conference held with the approvalof the family at least 90 days, and at the discretion of all parties, not more than nine months, prior to the toddler’s thirdbirthday for toddlers potentially eligible for Part B preschool services
Yes
No
Please explain
Number of toddlers with disabilities exitingPart C where the transition conference
occurred at least 90 days, and at thediscretion of all parties at least ninemonths prior to the toddler’s third
birthday for toddlers potentially eligible forPart B
Number of toddlers with disabilities exitingPart C who were potentially eligible for Part
BFFY 2013
Data*FFY 2014Target*
FFY 2014Data
FFY 2014 Part C State Performance Plan (SPP)/Annual Performance Report (APR)
2/8/2016 Page 27 of 37
Number of toddlers with disabilities exitingPart C where the transition conference
occurred at least 90 days, and at thediscretion of all parties at least nine
months prior to the toddler’s third birthdayfor toddlers potentially eligible for Part B
Number of toddlers with disabilities exitingPart C who were potentially eligible for Part
BFFY 2013
Data*FFY 2014Target*
FFY 2014Data
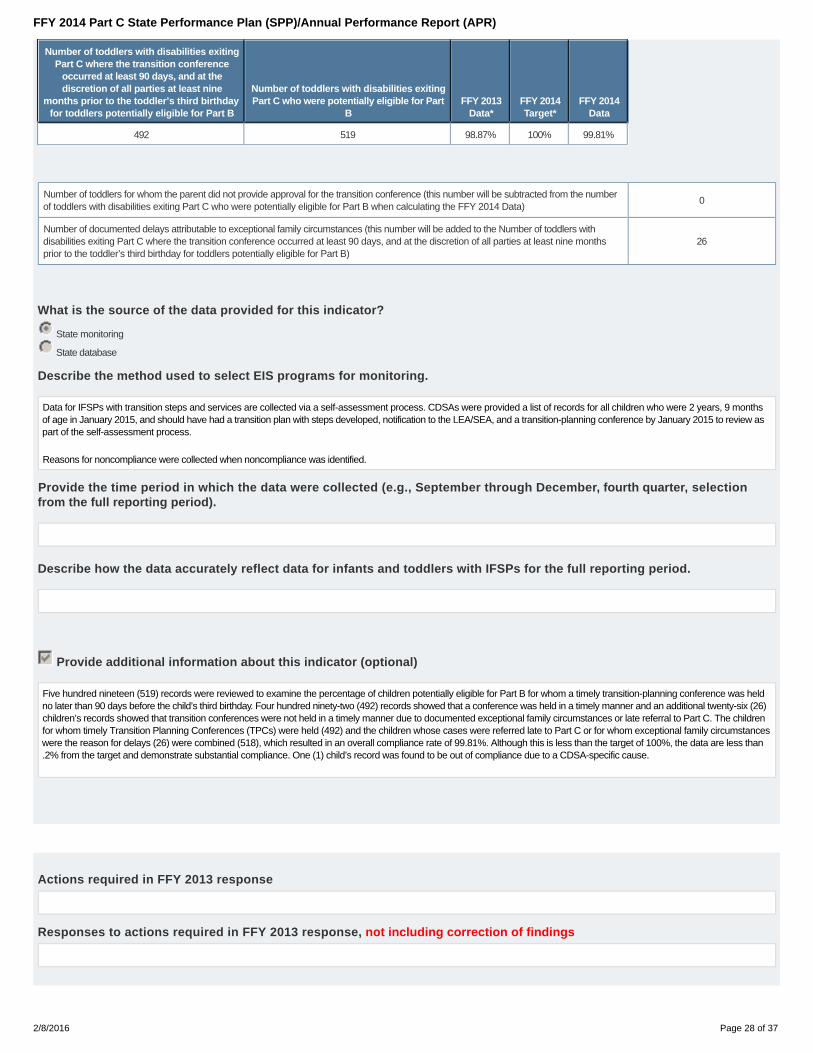
492 519 98.87% 100% 99.81%
Number of toddlers for whom the parent did not provide approval for the transition conference (this number will be subtracted from the numberof toddlers with disabilities exiting Part C who were potentially eligible for Part B when calculating the FFY 2014 Data)
0
Number of documented delays attributable to exceptional family circumstances (this number will be added to the Number of toddlers withdisabilities exiting Part C where the transition conference occurred at least 90 days, and at the discretion of all parties at least nine monthsprior to the toddler’s third birthday for toddlers potentially eligible for Part B)
26
What is the source of the data provided for this indicator?
State monitoring
State database
Describe the method used to select EIS programs for monitoring.
Data for IFSPs with transition steps and services are collected via a self-assessment process. CDSAs were provided a list of records for all children who were 2 years, 9 monthsof age in January 2015, and should have had a transition plan with steps developed, notification to the LEA/SEA, and a transition-planning conference by January 2015 to review aspart of the self-assessment process.
Reasons for noncompliance were collected when noncompliance was identified.
Provide the time period in which the data were collected (e.g., September through December, fourth quarter, selectionfrom the full reporting period).
Describe how the data accurately reflect data for infants and toddlers with IFSPs for the full reporting period.
Provide additional information about this indicator (optional)
Five hundred nineteen (519) records were reviewed to examine the percentage of children potentially eligible for Part B for whom a timely transition-planning conference was heldno later than 90 days before the child’s third birthday. Four hundred ninety-two (492) records showed that a conference was held in a timely manner and an additional twenty-six (26)children’s records showed that transition conferences were not held in a timely manner due to documented exceptional family circumstances or late referral to Part C. The childrenfor whom timely Transition Planning Conferences (TPCs) were held (492) and the children whose cases were referred late to Part C or for whom exceptional family circumstanceswere the reason for delays (26) were combined (518), which resulted in an overall compliance rate of 99.81%. Although this is less than the target of 100%, the data are less than.2% from the target and demonstrate substantial compliance. One (1) child’s record was found to be out of compliance due to a CDSA-specific cause.
Actions required in FFY 2013 response
Responses to actions required in FFY 2013 response, not including correction of findings
FFY 2014 Part C State Performance Plan (SPP)/Annual Performance Report (APR)
2/8/2016 Page 28 of 37
Correction of Findings of Noncompliance Identified in FFY 2013
Findings of Noncompliance IdentifiedFindings of Noncompliance Verified
as Corrected Within One YearFindings of Noncompliance
Subsequently CorrectedFindings Not Yet Verified as Corrected
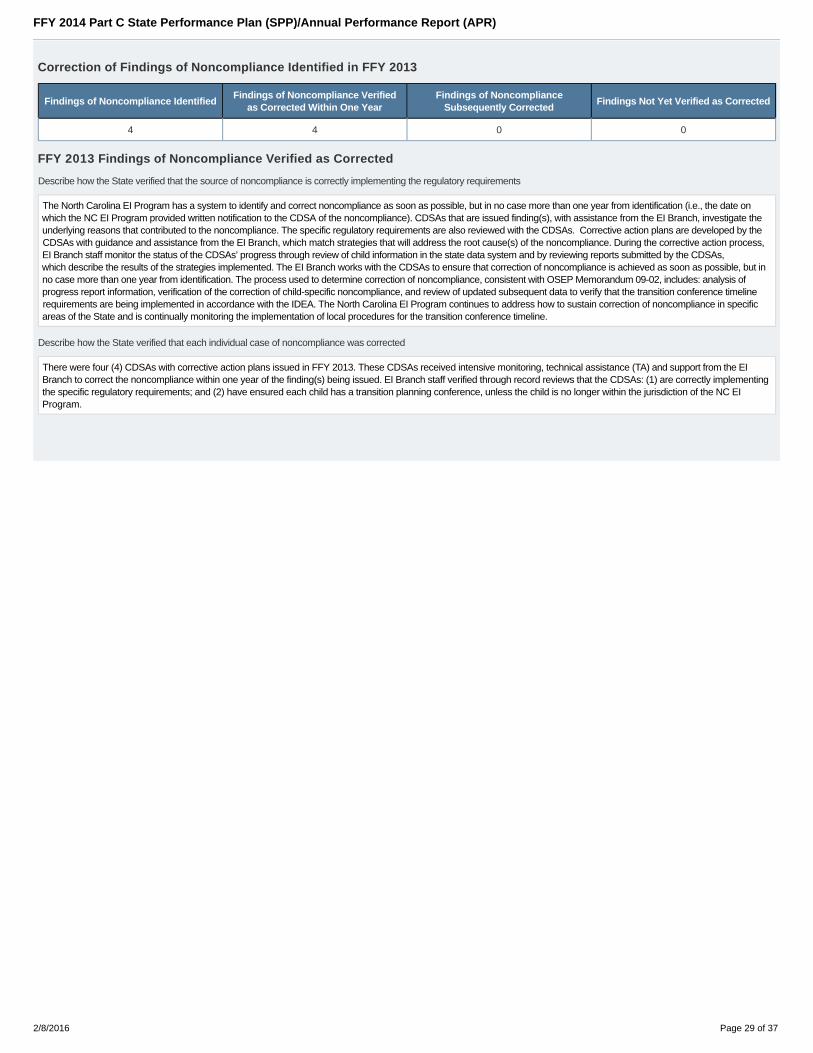
4 4 0 0
FFY 2013 Findings of Noncompliance Verified as Corrected
Describe how the State verified that the source of noncompliance is correctly implementing the regulatory requirements
The North Carolina EI Program has a system to identify and correct noncompliance as soon as possible, but in no case more than one year from identification (i.e., the date onwhich the NC EI Program provided written notification to the CDSA of the noncompliance). CDSAs that are issued finding(s), with assistance from the EI Branch, investigate theunderlying reasons that contributed to the noncompliance. The specific regulatory requirements are also reviewed with the CDSAs. Corrective action plans are developed by theCDSAs with guidance and assistance from the EI Branch, which match strategies that will address the root cause(s) of the noncompliance. During the corrective action process,EI Branch staff monitor the status of the CDSAs’ progress through review of child information in the state data system and by reviewing reports submitted by the CDSAs,which describe the results of the strategies implemented. The EI Branch works with the CDSAs to ensure that correction of noncompliance is achieved as soon as possible, but inno case more than one year from identification. The process used to determine correction of noncompliance, consistent with OSEP Memorandum 09-02, includes: analysis ofprogress report information, verification of the correction of child-specific noncompliance, and review of updated subsequent data to verify that the transition conference timelinerequirements are being implemented in accordance with the IDEA. The North Carolina EI Program continues to address how to sustain correction of noncompliance in specificareas of the State and is continually monitoring the implementation of local procedures for the transition conference timeline.
Describe how the State verified that each individual case of noncompliance was corrected
There were four (4) CDSAs with corrective action plans issued in FFY 2013. These CDSAs received intensive monitoring, technical assistance (TA) and support from the EIBranch to correct the noncompliance within one year of the finding(s) being issued. EI Branch staff verified through record reviews that the CDSAs: (1) are correctly implementingthe specific regulatory requirements; and (2) have ensured each child has a transition planning conference, unless the child is no longer within the jurisdiction of the NC EIProgram.
FFY 2014 Part C State Performance Plan (SPP)/Annual Performance Report (APR)
2/8/2016 Page 29 of 37

Indicator 9: Resolution Sessions
Baseline Data:
Monitoring Priority: Effective General Supervision Part C / General Supervision
Results indicator: Percent of hearing requests that went to resolution sessions that were resolved through resolution session settlement agreements (applicable ifPart B due process procedures are adopted).
(20 U.S.C. 1416(a)(3)(B) and 1442)
Historical Data
FFY 2004 2005 2006 2007 2008 2009 2010 2011 2012 2013
Target ≥
Data
Key: Gray – Data Prior to Baseline Yellow – Baseline Blue – Data Update
FFY 2014 - FFY 2018 Targets
FFY 2014 2015 2016 2017 2018
Target ≥
Key:
Targets: Description of Stakeholder Input - Please see the Stakeholder Involvement section of the introduction.
Enter additional information about stakeholder involvement
Prepopulated Data
Source Date Description Data Overwrite Data
SY 2014-15 EMAPS IDEA PartC Dispute Resolution Survey;
Section C: Due ProcessComplaints
11/5/2015 3.1(a) Number resolution sessions resolved through settlement agreements NA null
SY 2014-15 EMAPS IDEA PartC Dispute Resolution Survey;
Section C: Due ProcessComplaints
11/5/2015 3.1 Number of resolution sessions NA null
FFY 2014 SPP/APR Data3.1(a) Number resolution sessions
resolved through settlementagreements
3.1 Number of resolution sessionsFFY 2013
Data*FFY 2014 Target*
FFY 2014Data
NA NA NA
FFY 2014 Part C State Performance Plan (SPP)/Annual Performance Report (APR)
2/8/2016 Page 30 of 37
Actions required in FFY 2013 response
None
FFY 2014 Part C State Performance Plan (SPP)/Annual Performance Report (APR)
2/8/2016 Page 31 of 37
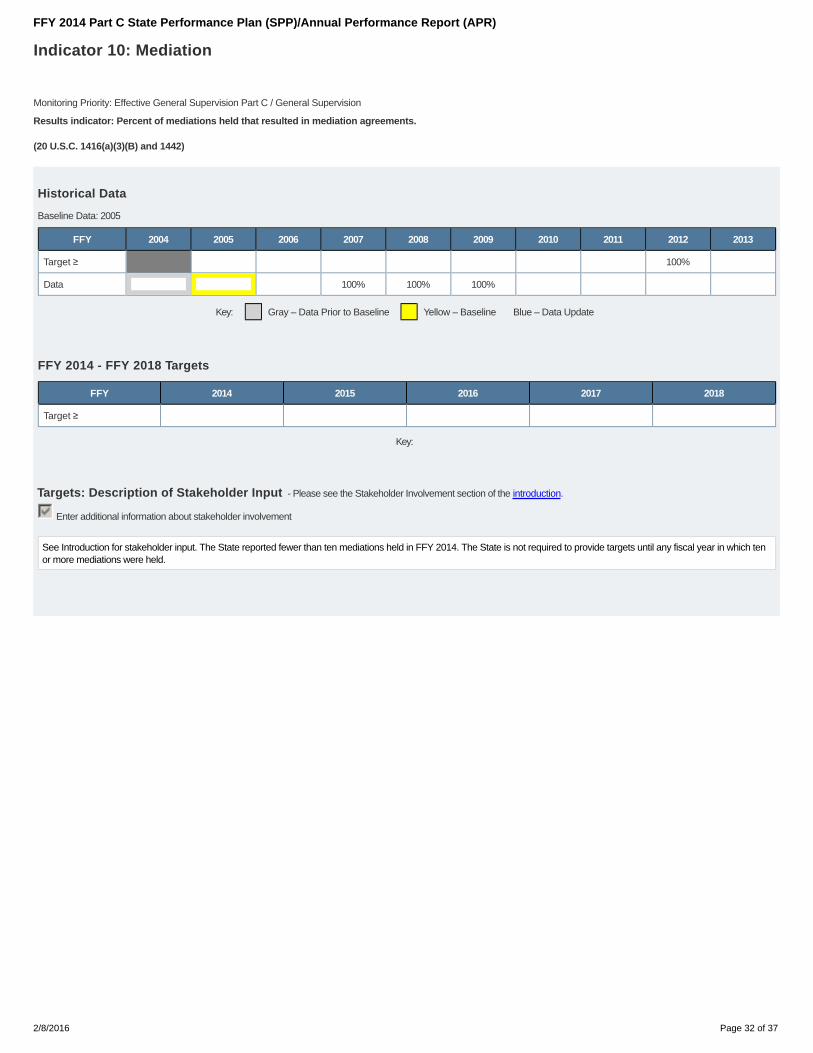
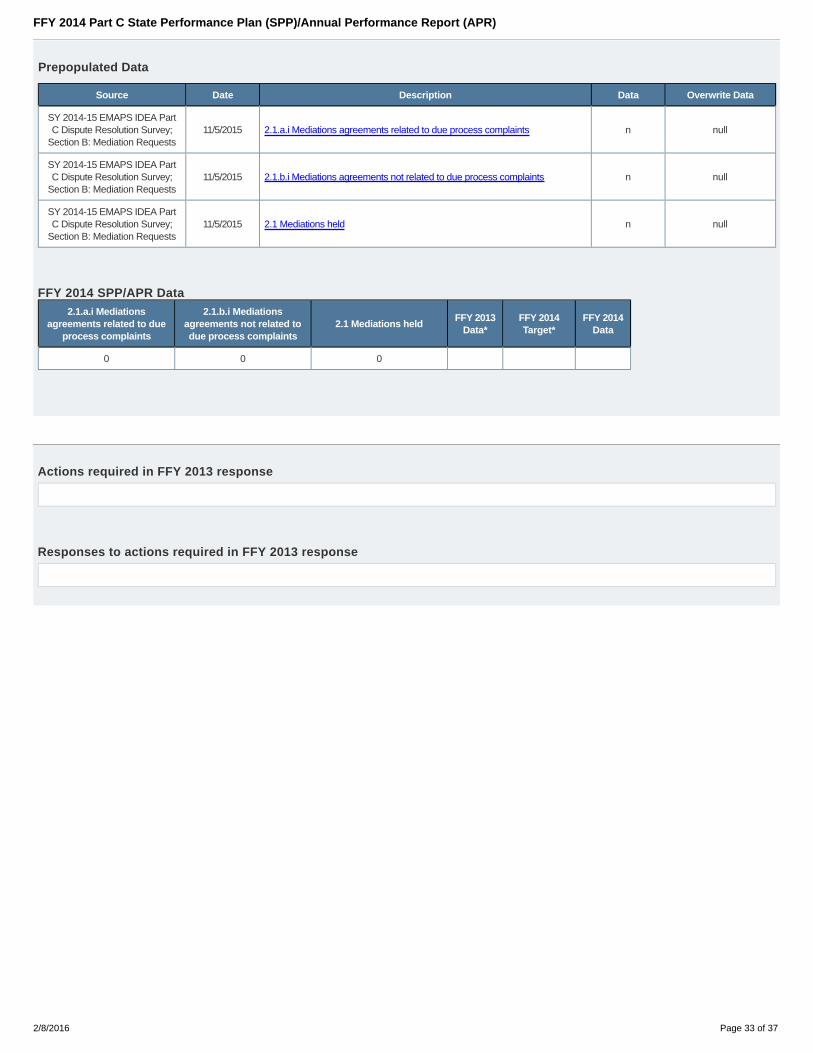
Indicator 10: Mediation
Baseline Data: 2005
Monitoring Priority: Effective General Supervision Part C / General Supervision
Results indicator: Percent of mediations held that resulted in mediation agreements.
(20 U.S.C. 1416(a)(3)(B) and 1442)
Historical Data
FFY 2004 2005 2006 2007 2008 2009 2010 2011 2012 2013
Target ≥ 100%
Data 100% 100% 100%
Key: Gray – Data Prior to Baseline Yellow – Baseline Blue – Data Update
FFY 2014 - FFY 2018 Targets
FFY 2014 2015 2016 2017 2018
Target ≥
Key:
Targets: Description of Stakeholder Input - Please see the Stakeholder Involvement section of the introduction.
Enter additional information about stakeholder involvement
See Introduction for stakeholder input. The State reported fewer than ten mediations held in FFY 2014. The State is not required to provide targets until any fiscal year in which tenor more mediations were held.
FFY 2014 Part C State Performance Plan (SPP)/Annual Performance Report (APR)
2/8/2016 Page 32 of 37
Prepopulated Data
Source Date Description Data Overwrite Data
SY 2014-15 EMAPS IDEA PartC Dispute Resolution Survey;
Section B: Mediation Requests11/5/2015 2.1.a.i Mediations agreements related to due process complaints n null
SY 2014-15 EMAPS IDEA PartC Dispute Resolution Survey;
Section B: Mediation Requests11/5/2015 2.1.b.i Mediations agreements not related to due process complaints n null
SY 2014-15 EMAPS IDEA PartC Dispute Resolution Survey;
Section B: Mediation Requests11/5/2015 2.1 Mediations held n null
FFY 2014 SPP/APR Data2.1.a.i Mediations
agreements related to dueprocess complaints
2.1.b.i Mediationsagreements not related todue process complaints
2.1 Mediations heldFFY 2013
Data*FFY 2014Target*
FFY 2014Data
0 0 0
Actions required in FFY 2013 response
Responses to actions required in FFY 2013 response
FFY 2014 Part C State Performance Plan (SPP)/Annual Performance Report (APR)
2/8/2016 Page 33 of 37

Indicator 11: State Systemic Improvement Plan
Baseline Data: 2013
Monitoring Priority: General Supervision
Results indicator: The State’s SPP/APR includes a State Systemic Improvement Plan (SSIP) that meets the requirements set forth for this indicator.
Reported Data
FFY 2013 2014
Target 65.67%
Data 65.67%
Key: Gray – Data Prior to Baseline Yellow – Baseline
Blue – Data Update
FFY 2015 - FFY 2018 Targets
FFY 2015 2016 2017 2018
Target 66.84% 66.84% 66.84% 68.29%
Key:
Targets: Description of Stakeholder Input
SSIP targets were shared with both the Core SSIP Stakeholder Group and internal stakeholders via an online surveydistributed in March 2015. Respondents were asked whether they agreed with the overall and yearly targets, or if they feltthey were too high or too low. Respondents that did not agree were asked to suggest an alternative target percentage. TheCore SSIP Stakeholder group also provided feedback on the targets during a meeting in March 2015. Stakeholders weremixed in their opinions about the targets; with some feeling they may be too low for the entire State, while others thoughtthat they were realistic. The SSIP Planning Team explained that although the overall State target may appear low (0.9%increase), the SSIP targets for the subset of six CDSAs (2.62% increase) was fairly aggressive. The stakeholders also hadquestions about the impact of the SSIP on the entire state, but were reassured that the improvement strategies proposedfor implementation in Phase II would be piloted in the subset of CDSAs with the goal of eventual expansion to all sixteenlocal lead agencies.
Overview
FFY 2014 Part C State Performance Plan (SPP)/Annual Performance Report (APR)
2/8/2016 Page 34 of 37

Data Analysis
A description of how the State identified and analyzed key data, including data from SPP/APR indicators, 618 data collections, and other available data as applicable, to: (1) select theState-identified Measurable Result(s) for Infants and Toddlers with Disabilities and their Families, and (2) identify root causes contributing to low performance. The description mustinclude information about how the data were disaggregated by multiple variables (e.g., EIS program and/or EIS provider, geographic region, race/ethnicity, socioeconomic status,gender, etc.) As part of its data analysis, the State should also consider compliance data and whether those data present potential barriers to improvement. In addition, if the Stateidentifies any concerns about the quality of the data, the description must include how the State will address these concerns. Finally, if additional data are needed, the descriptionshould include the methods and timelines to collect and analyze the additional data.
Analysis of State Infrastructure to Support Improvement and Build Capacity
A description of how the State analyzed the capacity of its current infrastructure to support improvement and build capacity in EIS programs and/or EIS providers to implement, scaleup, and sustain the use of evidence-based practices to improve results for infants and toddlers with disabilities and their families. State systems that make up its infrastructureinclude, at a minimum: governance, fiscal, quality standards, professional development, data, technical assistance, and accountability/monitoring. The description must includecurrent strengths of the systems, the extent the systems are coordinated, and areas for improvement of functioning within and across the systems. The State must also identify currentState-level improvement plans and other early learning initiatives, such as Race to the Top-Early Learning Challenge and the Home Visiting program and describe the extent thatthese new initiatives are aligned, and how they are, or could be, integrated with, the SSIP. Finally, the State should identify representatives (e.g., offices, agencies, positions,individuals, and other stakeholders) that were involved in developing Phase I of the SSIP and that will be involved in developing and implementing Phase II of the SSIP.
State-identified Measurable Result(s) for Infants and Toddlers with Disabilities and Their FamiliesA statement of the result(s) the State intends to achieve through the implementation of the SSIP. The State-identified Measurable Result(s) for Infants and Toddlers with Disabilitiesand their Families must be aligned to an SPP/APR indicator or a component of an SPP/APR indicator. The State-identified Measurable Result(s) for Infants and Toddlers withDisabilities and their Families must be clearly based on the Data and State Infrastructure Analyses and must be a child- or family-level outcome in contrast to a process outcome.The State may select a single result (e.g., increase the rate of growth in infants and toddlers demonstrating positive social-emotional skills) or a cluster of related results (e.g.,increase the percentage reported under child outcome B under Indicator 3 of the SPP/APR (knowledge and skills) and increase the percentage trend reported for families underIndicator 4 (helping their child develop and learn)).
Statement
Description
Selection of Coherent Improvement Strategies
An explanation of how the improvement strategies were selected, and why they are sound, logical and aligned, and will lead to a measurable improvement in the State-identifiedMeasurable Result(s) for Infants and Toddlers with Disabilities and their Families. The improvement strategies should include the strategies, identified through the Data and StateInfrastructure Analyses, that are needed to improve the State infrastructure and to support EIS program and/or EIS provider implementation of evidence-based practices to improvethe State-identified result(s) for infants and toddlers with disabilities and their families. The State must describe how implementation of the improvement strategies will addressidentified root causes for low performance and ultimately build EIS program and/or EIS provider capacity to achieve the State-identified Measurable Result(s) for Infants and Toddlerswith Disabilities and their Families.
FFY 2014 Part C State Performance Plan (SPP)/Annual Performance Report (APR)
2/8/2016 Page 35 of 37

Theory of Action
A graphic illustration that shows the rationale of how implementing the coherent set of improvement strategies selected will increase the State’s capacity to lead meaningful changein EIS programs and/or EIS providers, and achieve improvement in the State-identified Measurable Result(s) for Infants and Toddlers with Disabilities and their Families.
Submitted Theory of Action: No Theory of Action Submitted
Provide a description of the provided graphic illustration (optional)
FFY 2014 Part C State Performance Plan (SPP)/Annual Performance Report (APR)
2/8/2016 Page 36 of 37

Certify and Submit your SPP/APR
Name: Jill Singer
Title: Early Intervention Branch Head
Email: [email protected]
Phone: 919-707-5535
I certify that I am the Director of the State's Lead Agency under Part C of the IDEA, or his or her designee, and that the State's submissionof its IDEA Part C State Performance Plan/Annual Performance Report is accurate.
Selected: Lead Agency Director
Name and title of the individual certifying the accuracy of the State's submission of its IDEA Part C State Performance Plan/AnnualPerformance Report.
IntroductionIndicator 1Indicator 2Indicator 3Indicator 4Indicator 5Indicator 6Indicator 7Indicator 8Indicator 8AIndicator 8BIndicator 8CIndicator 9Indicator 10Indicator 11
FFY 2014 Part C State Performance Plan (SPP)/Annual Performance Report (APR)
2/8/2016 Page 37 of 37