annual investor conference 2016 - · pdf filecompleted two cross border inter-connectivity...
TRANSCRIPT

28th June 2016, Mumbai
ANNUAL INVESTOR CONFERENCE 2016

KEC INTERNATIONAL
A 1.3 BILLION DOLLAR GLOBAL INFRASTRUCTURE EPC MAJOR
Power T & D Cables Railways Water Water

GLOBAL WORKFORCE
5,600+ employees
Diverse nationalities
BUSINESS PORTFOLIO
Power T & D,
Cables,
Railways,
Water and
Solar EPC
Overview
GLOBAL PRESENCE
Spread across 6 continents
Footprints in 61+
Countries
Currently operating in 30+ countries
~51% sales from outside India
EPC MAJOR
An Indian multinational Infra EPC
major
Flagship company of the RPG group
Over 7 decades of experience
Presently executing 100+ projects
3
GLOBAL SOURCING
Material
Working capital funding
Equipment
Manpower
MULTI-LOCATIONAL
MANUFACTURING
8 Manufacturing facilities across India, Brazil and
Mexico
Manufactures Towers, Cables, Poles and Hardware

4
Financials
Significant profitability improvement – Q4 EBITDA margin highest in last 19 quarters
Order intake growth in challenging environment and low commodity prices
Significant reduction in interest cost
SAE Turnaround with positive PBT
Business expansion
Expansion of Sub-station business internationally
Strategic expansion into :
Saudi underground cabling market
220kV Cable supply
Solar business ramps up
Railway: participated in tenders of ~Rs 3,000 Crs in last 6 months
Key Updates – FY16 (1/2)

Business excellence
Continued focus on operational excellence- increase in number of projects delivered ahead of schedule.
Completed two cross border inter-connectivity projects
400kV Double Circuit Twin Indo-Bangladesh line five months ahead of schedule Indo-Nepal cross border 400kV Double circuit line with 220 kV bay extensions
Execution excellence in GIS :
Executed a landmark 765/400 kV GIS Substation in Thiruvalam, Tamil Nadu Built and energized Asia’s largest 400kV GIS substation at Kishanganj
Pioneered the use of Covered Conductor Technology in Bengaluru
Three prestigious awards from PGCIL
Best Transmission Line Contractor (large),
‘Safety’ award for institutionalizing best safety practices in KEC
Recognition for admirable ‘overall performance demonstrated’.
5
Key Updates – FY16 (2/2)

Growth in India T&D
Intra-state connectivity investment increasing
Changing SEB order sizes : Large ticket tenders being floated
Focus on timely delivery: preference for larger players amongst SEBs
High end products becoming more prevalent – GIS / HVDC lines
Significant ordering from Green Energy corridor projects
Strengthening global presence
Focus on Far East - large generation capacity and grid expansion plans
SAARC offers a huge opportunity
Widening our base in MENA region (Egypt, UAE, Jordan etc.)
Capturing potential in Africa - interconnection projects
SAE : Positive momentum
Current order book providing visibility for next 18 months
Strong pipeline in Mexico
Emerging North American replacement demand
T&D: Encouraging Growth Outlook
6

Potential
Overall capital outlay to Rs 1.21 lakh Crs for FY17
Opportunity for KEC in excess of Rs 10,000 Crs in FY17
Structural improvement in Railway bidding system & execution
Tender values have reached Rs 500+ Crs
Number of tenders are increasing
Time frame reduction in award of contracts & projects execution
Order Book
Current order book of close to Rs 800 Crs, additionally L1 position of ~Rs 500 Cr
7
Railway: Encouraging Outlook

Government plans to add 20 GW of Solar capacity in FY17 as against 5GW in FY16
What a Developer wants :
Speed of execution and mobilisation
Credible EPC partner – enabling financial closure
Better supply chain control – structures, inverters, transformers, cables etc.
KEC well poised to capture the Solar EPC opportunity
33 KV HT Panel Switchyard Structure Solar Modules
Solar: Large Opportunity
8

• Expansion of Substations & Underground Cabling business
• Strengthen presence in SAARC & Southeast Asia
• Grow EPC presence in the Americas
• Increase pole business at SAE Mexico
• Strengthen foothold in Indian market
• Target growth opportunities outside India by leveraging KEC’s strong global presence in T&D
• Continue to acquire/ build pre-qualifications
ESTABLISHED BUSINESS
POWER TRANSMISSION
EMERGING BUSINESSES
RAILWAYS & SOLAR
Strategy
9

CEAT
MAKING MOBILITY SAFER AND SMARTER. EVERYDAY.
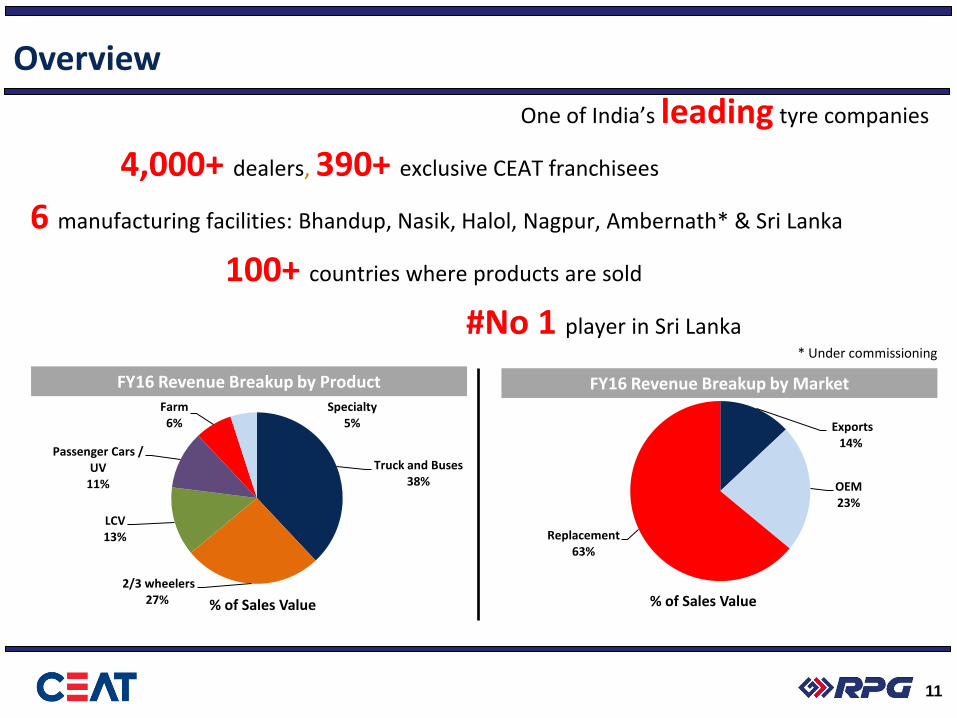
Overview
One of India’s leading tyre companies
4,000+ dealers, 390+ exclusive CEAT franchisees
6 manufacturing facilities: Bhandup, Nasik, Halol, Nagpur, Ambernath* & Sri Lanka
100+ countries where products are sold
#No 1 player in Sri Lanka
Truck and Buses 38%
2/3 wheelers 27%
LCV 13%
Passenger Cars / UV
11%
Farm 6%
Specialty 5%
% of Sales Value
Exports 14%
OEM 23%
Replacement 63%
% of Sales Value
FY16 Revenue Breakup by Product FY16 Revenue Breakup by Market
11
* Under commissioning

12
Financials
Gross margins have expanded from 38.1% to 44.2%
EBITDA rose by 21% YoY to Rs. 822 crs (14.5%)
Significant reduction in interest cost
PAT for FY16 stood at Rs 446 Crs, a growth of 41%
Debt / equity has come down to 0.3 from 0.5 and our rating has been upgraded to AA –
Business
Growth of over 20% in PCR and 2 wheeler segment
Strategic expansion in :
Halol Phase II for Passenger cars & Utility Vehicles – 120 MT for Rs 650 Crs
Nagpur for 2/3 Wheelers – 120 MT for Rs 420 Crs
Entry into a new niche – Off Highway Tyres segment
Recipient of prestigious five-star rating from the British Safety Council for Halol Plant
Key Updates

Strategy
Two wheelers
Passenger cars & Utility vehicles
Profitable growth
Differentiated Products 1
Strong Brand 2
Extensive Distribution 3
Deep OEM Partnerships 4
World Class R&D 5
Expanding Global Reach 6
13
Off Highway Tyres
Emerging markets
Domestic Market
International Market
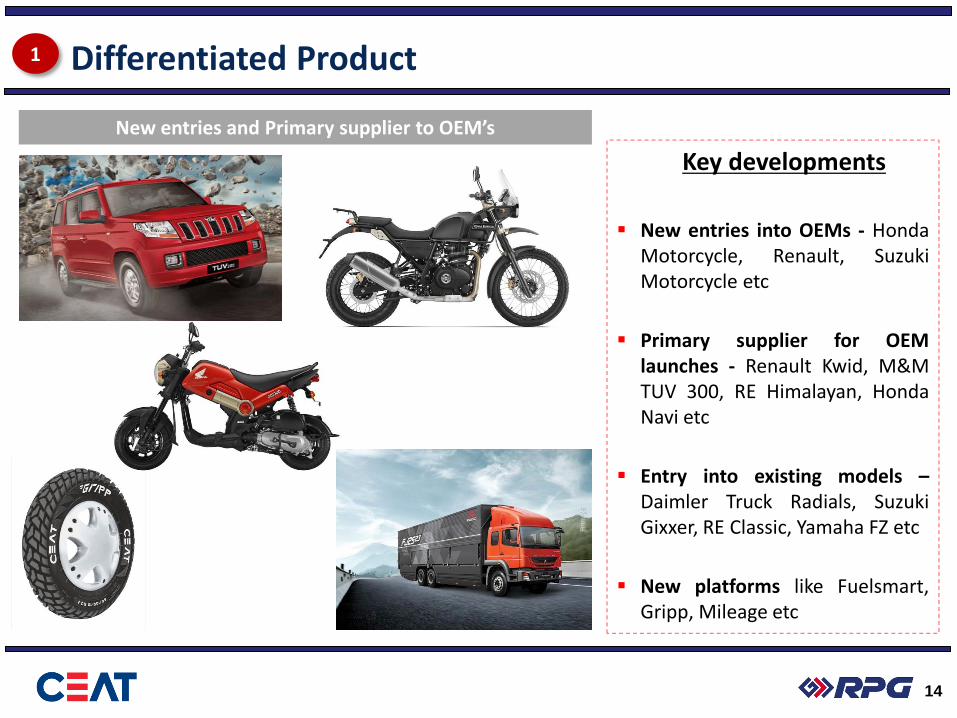
Differentiated Product 1
Key developments
New entries into OEMs - Honda
Motorcycle, Renault, Suzuki Motorcycle etc
Primary supplier for OEM launches - Renault Kwid, M&M TUV 300, RE Himalayan, Honda Navi etc
Entry into existing models – Daimler Truck Radials, Suzuki Gixxer, RE Classic, Yamaha FZ etc
New platforms like Fuelsmart, Gripp, Mileage etc
New entries and Primary supplier to OEM’s
14

Strong Brand 2
CEAT Tubeless
Bike Tyre
Campaign
IPL Strategic Timeout Partner
15
CEAT SUV Tyres
Campaign -
“Our Grip Your
Stories”
Bat Endorsement
Deal

Extensive Distribution 3
Distribution Network Shoppe Shop in Shop (SIS)
4,000+ dealers
390+ CEAT Franchisees (Shoppes + Hubs)
270+ two-wheeler distributors
Developed Multi Brand Outlet / Shop in Shop
model over last 2 years
Over 290 outlets so far
Multi Brand Outlet (MBO)
102
176
219
FY12 FY15 FY16
212
464
586
FY12 FY15 FY16
District Coverage No. of CEAT Shoppes
16

17
Deep OEM Partnerships 4

18
World Class R&D 5
State of the art R&D facility at Halol plant
R&D focussed on development of breakthrough products, alternate materials,
green tyres, smart tyres
Partnerships with global institutes
Increased allocation towards R&D

19
Expanding Global Reach 6
Sri Lanka: Leadership position with 50+% market share
Bangladesh: Planned manufacturing facility
Focused product and distribution strategy for select clusters
ASEAN
Cluster East Africa
Cluster LATAM
Cluster
West Africa
Cluster
Middle East
Cluster
Europe Cluster
US Cluster
Emerging markets
Key Export Clusters

Passenger Segment Trends R
eve
nu
e
363
525 639
899
1,246
1,483
FY 11 FY 12 FY13 FY 14 FY 15 FY 16
2/3 wheelers (Rs Cr)
146
284
376
476
561 619
FY 11 FY 12 FY13 FY 14 FY 15 FY 16
PC / UV (Rs Cr)
Nagpur plant commissioned in March 2016; Capacity of 120 MT/day by Q2 FY18
Halol Phase II plant commissioned in September 2015; Capacity of 120 MT/day by Q1 FY18
Expanding
Capacities
20

21
Off Highway Tyres
Status Update
Greenfield OHT (Off Highway Tyres) radial plant in Ambernath
Investing Rs 330 Crs for a Phase 1 capacity of 40 MT/day which will be further
ramped up to 100 MT/day
Production will commence by Q4 FY17

Strategic Focus Areas – Continued Momentum
Strategic Focus Areas (Passenger Segment, Specialty
Exports & Emerging Markets)
CAGR of 27%
4.3x growth from Rs.570
to Rs. 2,450 crs
Substantial contribution towards increasing profitability
Market share growing
% of Sales value
Strategic
Focus Areas
Others
Note : # 50% of CEAT Sri Lanka sales are considered
Sales (Rs Cr)
311 658 680 EBITDA (Rs Cr) 822
2,850 5,508 5,705 5,681
20%
32% 39%
43%
80%
68% 61%
57%
FY 10 FY14 FY15 FY16
22

ZENSAR TECHNOLOGIES ASSURING YOUR RETURN ON DIGITAL
Power T & D Cables Railways Water Water

24
Overview
USD 453 Mn Revenue
USD 47 Mn Profit After Tax
5.4% FY16 Y-o-Y growth
9.4% FY16 Y-o-Y growth
12.5% Revenue CAGR over
the past 5 years
10.1% PAT CAGR over the
past 5 years
29 Global Locations
USD 67 Mn EBITDA
5.1% FY16 Y-o-Y growth
11.0% EBITDA CAGR over
the past 5 years
Traditional to Transformational
8200+ Associates

25
Revenue Performance
Grew 8.5% Y-o-Y in constant currency (CC) terms led by 14.3% growth in Applications business
Top 20 accounts account for 55% against 51% last year
Large deal wins across all key geographies
Profitability & EPS Performance
All profitability parameters showed improvement on a Year-on-Year basis
Profit After Tax grew by 9.4%, Operating profit grew 5.1%
Diluted EPS grew 15.7%
Digital Performance
Digital now accounts for 27% of Zensar revenues, led by strong growth in Digital Commerce
Digital and Digital Commerce recorded a growth of 25%+ over last year
Key Updates – FY16 (1/2)
26
Key Territory Performance
Africa grew 30% Y-o-Y in constant currency (CC)
Europe grew 10% Y-o-Y in CC
US grew by 7% and we continue to see increased customer traction led by Digital conversations
Key Verticals Performance
Retail continues to grow strongly on the back of commerce and digital revenues and grew 27% in USD terms
BFSI had moderate growth due to loss of a key account and the continuing slide of the ZAR
Manufacturing was impacted by large project ramp downs and the delay in start of a few projects
Onsite-Offshore portfolio
Onsite offshore mix has improved from 66:34 to 64:36
Managed Services as a component of total revenue continue to improve now at 51% against 47% last year
Key Updates – FY16 (2/2)

27
Multi-year Managed Services Deal with UK’s largest department store retailer
Sole system integrator across SFDC and other 3rd part systems for Great Britain’s leading purchaser of energy generated by the independent sector
Multimillion dollar with a leading US kids products retailer to build and install their Ecommerce site
Zensar’s first Oracle Commerce Cloud deal with Latin America’s leading Speciality retailer and financial services company
Multi-year business transformation program with a Global inter-governmental organisation to enhance and reengineer its ERP & BI applications
Large Deal Wins in FY16

28
Analyst Recognition
Among eighteen featured in the EverestPEAK Matrix for Digital Services.
Zensar’s customers rank Zensar high on Buyer Satisfaction.
Among the top fourteen technology service providers for Property and Casualty
Insurers – Novarica Market Navigator
One of twelve Global SIs – IoT Capabilities Offered by Systems Integrators in the Manufacturing Sector – IoT is at the intersection of Digital and Manufacturing in Zensar.
One of twenty leading global System Integrators that are equipped to provide the next
generation of Oracle’s digital technologies - The New Breed Of Oracle Services Partner
One of twenty - Magic Quadrant for Data Center Outsourcing & Infrastructure Services,
North America. Zensar is now a one-stop-shop for all infrastructure services.

29
Zensar is focused on Return on Digital for our customers enabled by
Digital Agility, Digital Cross-over of Business & IT Processes,
& Stability of Core systems
30
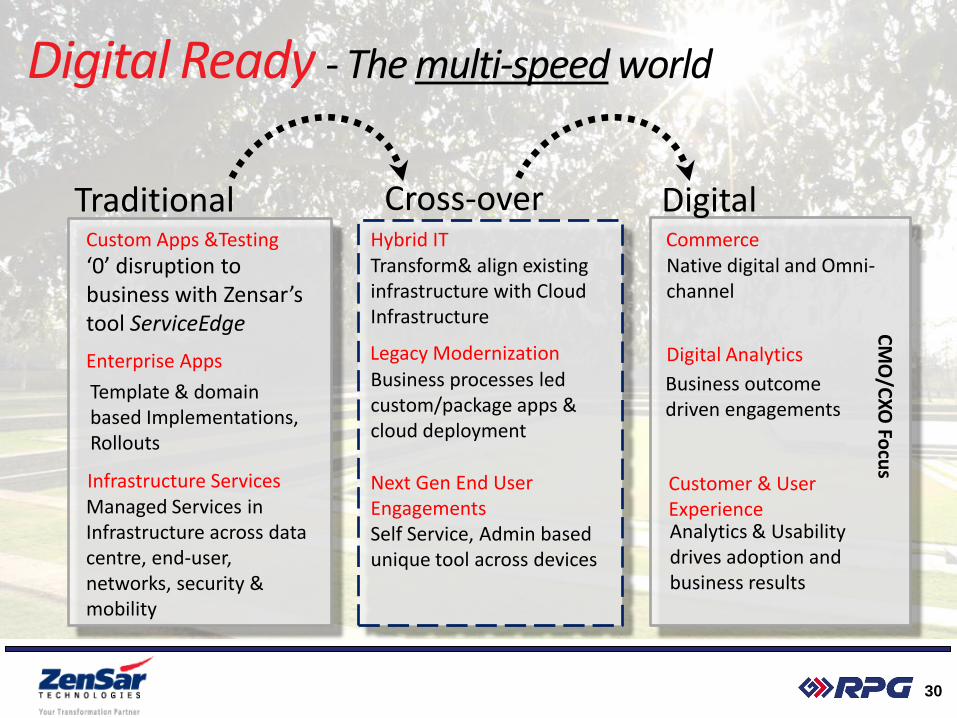
Digital Ready - The multi-speed world
Enterprise Apps
Custom Apps &Testing
Infrastructure Services
Traditional Cross-over
Digital Analytics
Commerce
Customer & User Experience
Digital
Template & domain based Implementations, Rollouts
Native digital and Omni-channel
Analytics & Usability drives adoption and business results
Managed Services in Infrastructure across data centre, end-user, networks, security & mobility
Business outcome driven engagements
‘0’ disruption to business with Zensar’s tool ServiceEdge
Legacy Modernization
Hybrid IT
Next Gen End User Engagements Self Service, Admin based unique tool across devices
Business processes led custom/package apps & cloud deployment
Transform& align existing infrastructure with Cloud Infrastructure
CM
O/C
XO
Focu
s

31
Strategy
Core Businesses with Excellence
Growth Accelerators
Focus Regions: US, UK,
South Africa
Focus Industries:
Manufacturing, Retail, BFSI
Client Assurance
High quality delivery to
clients
Operational excellence
Zensar Digital™
Zensar Commerce™
IMS and Cloud
Large Deals
Strategic Relationships
Mergers and
Acquisitions
Market and Growth Aligned
Dedicated Hunting & Farming
Enhanced focus on all large accounts

32
Our Growth Engines
Zensar Digital To grow to 30% of Revenues in 12 months 20% of Revenues from Digital Commerce Balance from Other Digital and Cross-Over
services Largest Oracle Commerce practice in the
world Analytics focus on CX and Shopfloor & IOT
IMS Cloud To grow to 20% of Zensar Revenues in
3 years Hybrid IT and RIM to drive all growth Zensar’s cutting edge Automation IP
key differentiator
Strategic Deals Focus on Deal sizes of 10+ M TCV Zensar’s differentiation is its
Automation frameworks Multi-service focus
Digital led
Oracle 33% of Zensar’s revenues from the
Oracle Ecosystem Oracle Platinum partner Complete Portfolio of Services Big Bet on Oracle Cloud SaaS and
PaaS solutions

33
Superscaling Farm
65 High Potential Accounts with an average relationship age of 6 years
Zensar rated highly in Delivery in all these accounts
Multiple Vectors at play where Zensar is ideally positioned to grow
Core Services Automation based AMS and IM Application cloud migration with Zensar’s differentiated capability
in SaaS and PaaS
Disintermediation through Commerce Commerce to scale Online B2C business for retail and Insurance B2B commerce to help scale Manufacturing accounts Digital CX solutions to stitch the entire Customer experience together
Outcome based models Integration of Application – Infra – Business Process to help
Zensar scale these accounts through out-come models
Other Investments
Three-in-a-box
Client Partner Model
Client Specific IP

34
To Summarize: Zensar is…
Partner of choice for some of the world’s most successful enterprises
Committed to create direct business impact for our customers
Flexible & nimble - ‘Large enough to deliver, small enough to care’
Digital ready, Enabling digital enterprise of the future through ‘Return on Digital’
Large Deals Ready

RPG LIFE SCIENCES
RPG
Life Sciences

36
Overview
Global Formulations
API
Biotech
Domestic Formulations
Rs.25 crs Revenue
Manufacturing unit in Ankleshwar
2 APIs in Oncology
Divesture process in final stage
Rs. 50 crs Revenue EUGMP approved unit in
Ankleshwar Immuno-suppressant focus Europe, Canada, ROW as main
markets
Rs. 25 crs Revenue
TGA approved unit in Thane
Mostly legacy APIs for captive use
Rs. 175 crs Revenue Field force of 500 people Strengths in Nephorlogy, Oncology Strong products in anti-diarrhoeal, antacid, iron-
vitamin in general prescription products
3 Manufacturing Units
DSIR approved R&D ~1150 Employees
Rs. 275 crs Revenue 34% Exports
Rs. 11.5 crs PAT

Financials
Turnaround year for RPG Life Sciences
Revenue growth of 18% vs 8% average for the last 5 years
PAT of 11.5 crs vs 1 cr last year
Business portfolio
Streamlining of portfolio initiated with sell-off of Biotech business
Domestic formulations business growth of 17% vs 12% industry growh
International formulations growth of 56% with renewed focus and thrust
Outsourcing of API products/ technology started with contracts with USFDA approved sites
Management team significantly strengthened with deep domain expertise
37
Key Updates – FY16 (1/2)

Domestic formulation business
Amongst fastest growing pharma companies; rank improved from 73 to 68
MinMin, a focus brand, has grown at 90% and moved to 12th position in iron-vitamin supplement category
Continues to maintain #1 position in transplant-dialysis segment
Global formulation business
Formulations unit at Ankleshwar secured EUGMP approval
New facilities of hard gel and low RH commissioned in Ankleshwar
API unit secured TGA approval
New long term customers secured for Azothioprine
First CRAMS project involving development of Nicorandil on track
38
Key Updates – FY16 (2/2)

FY 15 FY 16 275
Revenue (Rs Crs) 233 23.5
EBIDTA (Rs Crs) 14.2 8.6%
EBIDTA (%) 6.1% 11.6
PAT (Rs Crs) 1.0 4%
PAT (%) 0.4% 7.0
EPS 0.6
39
FY16 : A turnaround year

0
10
20
30
40
Ap
r'1
5
May
'15
Jun
'15
Jul'1
5
Au
g'1
5
Sep
'15
Oct
'15
No
v'1
5
De
c'1
5
Jan
'16
Feb
'16
Mar
'16
Ap
r'1
6
Amongst fastest growing companies
Industry
RPGLS
40
Domestic Formulations : Strong growth momentum
Focus Brands
Minmin (Iron-Vitamin)
Tricaine (Antacid)
Azoran (Transplant)
RPO (Haematopoietic)
New Products
Minmin PB (Platelet)
Tricaine AR (Antacid)
1000 Para (Pain)
%

0
10
20
30
40
50
FY 11 FY 12 FY 13 FY 14 FY 15 FY 16
56% growth
Revenue (Rs cr)
41
Global Formulations : Breakthrough performance
Customer Approvals
Apotex (Canada)
Teva (Europe)
Tillomed (UK)
Aqvida (Europe)
Medac (Germany)
Regulatory Approvals
EUGMP (Formulation)
TGA (API)
New Product Lines Hard Gel
Low RH

Strategy
Global Formulations
API
Domestic Formulations
Focus on API molecules for Global Formulation
Own technology; outsource manufacturing to USFDA approved sites
New products/ extensions in chosen therapeutic areas
Launch of cosmeto-dermatology product line with prescription focus
Continuous field-force productivy enhancement through training, digital, etc.
Immediate term focus on ROW markets
Readiness of formulations unit for USFDA approval
Partners for new products and marketing for regulated markets
42

Y O U T H A N K