annual global climate and catastrophe report global climate and catastrophe report 4 exhibit 1: top...
TRANSCRIPT
Annual Global Climate and Catastrophe ReportImpact Forecasting—2010

ContentsExecutive Summary—2010’s Top Catastrophes 3
2010 Climate Review 72010 Atlantic Hurricane Season Review 92010 Eastern Pacific Hurricane Season Review 102010 Western Pacific Typhoon Season Review 112010 Indian Ocean and Southern Pacific Cyclone Season Review 122010 United States Tornado Season Review 132010 United States Brushfire Season Review 14
2011 Climate and Atlantic Hurricane Forecasts 15Temperature and Precipitation Outlook: January – March 2011 16Temperature and Precipitation Outlook: March – May 2011 17Historical Atlantic Hurricane Season Predictions 182011 Atlantic Hurricane Season Outlooks 20
2010 Monthly Catastrophe Review 21United States 21Remainder of North America (Canada, Mexico, Bermuda, Caribbean Islands) 35South America 43Europe 48Africa 56Asia 60Oceania (Australia, New Guinea, New Zealand, Micronesia, Guam, Northern Mariana Islands) 77
Appendix: Tropical System Frequency Correlations 84Western Pacific Ocean Basin (ENSO) 84Eastern Pacific Ocean Basin (ENSO) 85Atlantic Ocean Basin (ENSO) 86
Aon Benfield: Impact Forecasting
3
Executive Summary — 2010’s Top Catastrophes
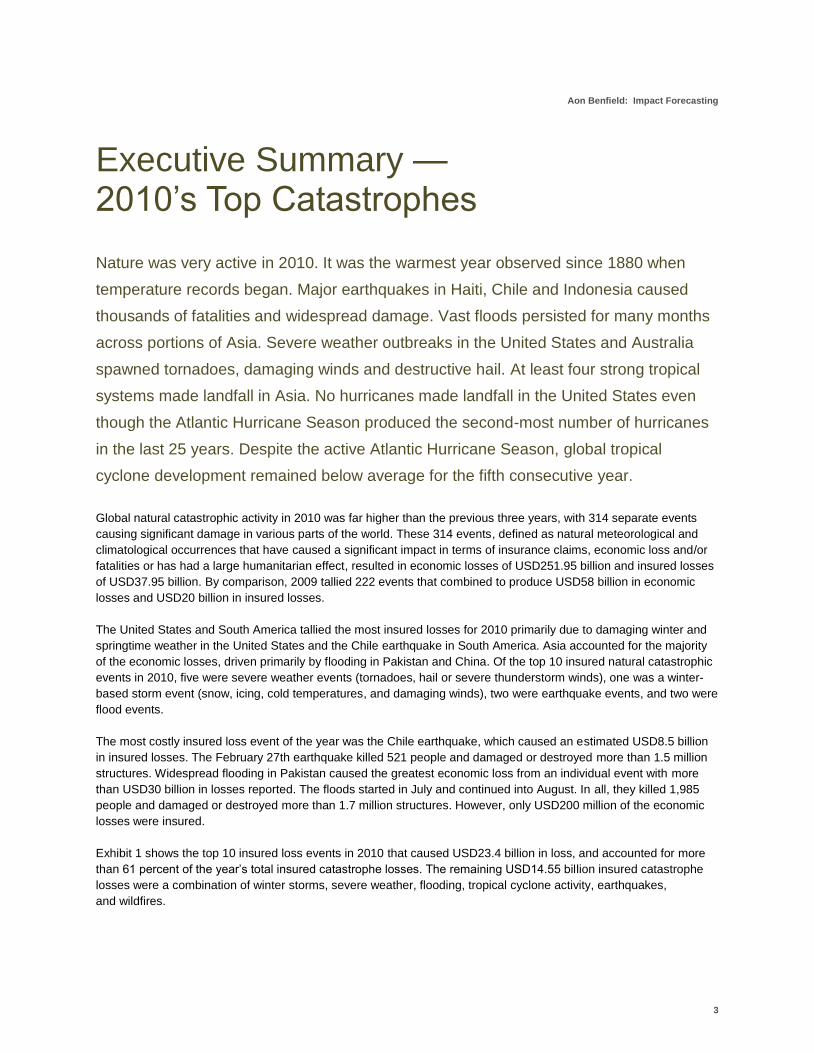
Nature was very active in 2010. It was the warmest year observed since 1880 when
temperature records began. Major earthquakes in Haiti, Chile and Indonesia caused
thousands of fatalities and widespread damage. Vast floods persisted for many months
across portions of Asia. Severe weather outbreaks in the United States and Australia
spawned tornadoes, damaging winds and destructive hail. At least four strong tropical
systems made landfall in Asia. No hurricanes made landfall in the United States even
though the Atlantic Hurricane Season produced the second-most number of hurricanes
in the last 25 years. Despite the active Atlantic Hurricane Season, global tropical
cyclone development remained below average for the fifth consecutive year.
Global natural catastrophic activity in 2010 was far higher than the previous three years, with 314 separate events
causing significant damage in various parts of the world. These 314 events, defined as natural meteorological and
climatological occurrences that have caused a significant impact in terms of insurance claims, economic loss and/or
fatalities or has had a large humanitarian effect, resulted in economic losses of USD251.95 billion and insured losses
of USD37.95 billion. By comparison, 2009 tallied 222 events that combined to produce USD58 billion in economic
losses and USD20 billion in insured losses.
The United States and South America tallied the most insured losses for 2010 primarily due to damaging winter and
springtime weather in the United States and the Chile earthquake in South America. Asia accounted for the majority
of the economic losses, driven primarily by flooding in Pakistan and China. Of the top 10 insured natural catastrophic
events in 2010, five were severe weather events (tornadoes, hail or severe thunderstorm winds), one was a winter-
based storm event (snow, icing, cold temperatures, and damaging winds), two were earthquake events, and two were
flood events.
The most costly insured loss event of the year was the Chile earthquake, which caused an estimated USD8.5 billion
in insured losses. The February 27th earthquake killed 521 people and damaged or destroyed more than 1.5 million
structures. Widespread flooding in Pakistan caused the greatest economic loss from an individual event with more
than USD30 billion in losses reported. The floods started in July and continued into August. In all, they killed 1,985
people and damaged or destroyed more than 1.7 million structures. However, only USD200 million of the economic
losses were insured.
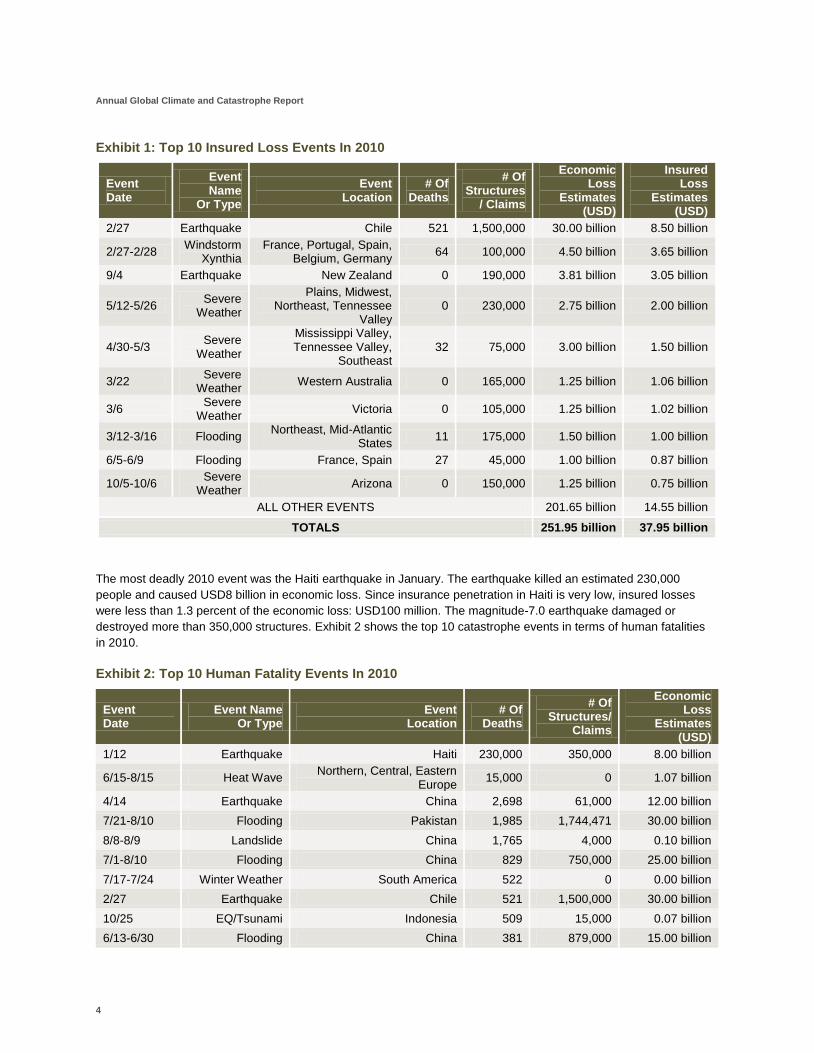
Exhibit 1 shows the top 10 insured loss events in 2010 that caused USD23.4 billion in loss, and accounted for more
than 61 percent of the year’s total insured catastrophe losses. The remaining USD14.55 billion insured catastrophe
losses were a combination of winter storms, severe weather, flooding, tropical cyclone activity, earthquakes,
and wildfires.
Annual Global Climate and Catastrophe Report
4
Exhibit 1: Top 10 Insured Loss Events In 2010
Event Date
Event Name
Or Type
Event Location
# Of Deaths
# Of Structures
/ Claims
Economic Loss
Estimates (USD)
Insured Loss
Estimates (USD)
2/27 Earthquake Chile 521 1,500,000 30.00 billion 8.50 billion
2/27-2/28 Windstorm
Xynthia France, Portugal, Spain,
Belgium, Germany 64 100,000 4.50 billion 3.65 billion
9/4 Earthquake New Zealand 0 190,000 3.81 billion 3.05 billion
5/12-5/26 Severe
Weather
Plains, Midwest, Northeast, Tennessee
Valley 0 230,000 2.75 billion 2.00 billion
4/30-5/3 Severe
Weather
Mississippi Valley, Tennessee Valley,
Southeast 32 75,000 3.00 billion 1.50 billion
3/22 Severe
Weather Western Australia 0 165,000 1.25 billion 1.06 billion
3/6 Severe
Weather Victoria 0 105,000 1.25 billion 1.02 billion
3/12-3/16 Flooding Northeast, Mid-Atlantic
States 11 175,000 1.50 billion 1.00 billion
6/5-6/9 Flooding France, Spain 27 45,000 1.00 billion 0.87 billion
10/5-10/6 Severe
Weather Arizona 0 150,000 1.25 billion 0.75 billion
ALL OTHER EVENTS 201.65 billion 14.55 billion
TOTALS 251.95 billion 37.95 billion
The most deadly 2010 event was the Haiti earthquake in January. The earthquake killed an estimated 230,000
people and caused USD8 billion in economic loss. Since insurance penetration in Haiti is very low, insured losses
were less than 1.3 percent of the economic loss: USD100 million. The magnitude-7.0 earthquake damaged or
destroyed more than 350,000 structures. Exhibit 2 shows the top 10 catastrophe events in terms of human fatalities
in 2010.
Exhibit 2: Top 10 Human Fatality Events In 2010
Event Date
Event Name Or Type
Event Location
# Of Deaths
# Of Structures/
Claims
Economic Loss
Estimates (USD)
1/12 Earthquake Haiti 230,000 350,000 8.00 billion
6/15-8/15 Heat Wave Northern, Central, Eastern
Europe 15,000 0 1.07 billion
4/14 Earthquake China 2,698 61,000 12.00 billion
7/21-8/10 Flooding Pakistan 1,985 1,744,471 30.00 billion
8/8-8/9 Landslide China 1,765 4,000 0.10 billion
7/1-8/10 Flooding China 829 750,000 25.00 billion
7/17-7/24 Winter Weather South America 522 0 0.00 billion
2/27 Earthquake Chile 521 1,500,000 30.00 billion
10/25 EQ/Tsunami Indonesia 509 15,000 0.07 billion
6/13-6/30 Flooding China 381 879,000 15.00 billion
Aon Benfield: Impact Forecasting
5
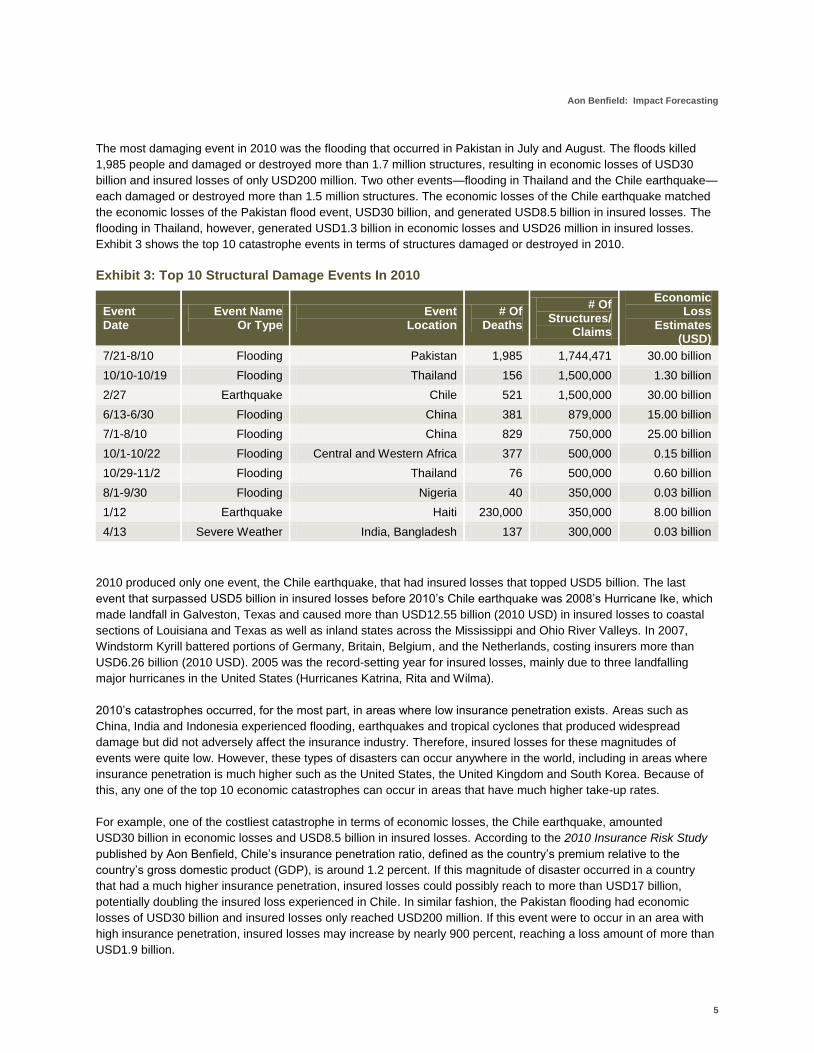
The most damaging event in 2010 was the flooding that occurred in Pakistan in July and August. The floods killed
1,985 people and damaged or destroyed more than 1.7 million structures, resulting in economic losses of USD30
billion and insured losses of only USD200 million. Two other events—flooding in Thailand and the Chile earthquake—
each damaged or destroyed more than 1.5 million structures. The economic losses of the Chile earthquake matched
the economic losses of the Pakistan flood event, USD30 billion, and generated USD8.5 billion in insured losses. The
flooding in Thailand, however, generated USD1.3 billion in economic losses and USD26 million in insured losses.
Exhibit 3 shows the top 10 catastrophe events in terms of structures damaged or destroyed in 2010.
Exhibit 3: Top 10 Structural Damage Events In 2010
Event Date
Event Name Or Type
Event Location
# Of Deaths
# Of Structures/
Claims
Economic Loss
Estimates (USD)
7/21-8/10 Flooding Pakistan 1,985 1,744,471 30.00 billion
10/10-10/19 Flooding Thailand 156 1,500,000 1.30 billion
2/27 Earthquake Chile 521 1,500,000 30.00 billion
6/13-6/30 Flooding China 381 879,000 15.00 billion
7/1-8/10 Flooding China 829 750,000 25.00 billion
10/1-10/22 Flooding Central and Western Africa 377 500,000 0.15 billion
10/29-11/2 Flooding Thailand 76 500,000 0.60 billion
8/1-9/30 Flooding Nigeria 40 350,000 0.03 billion
1/12 Earthquake Haiti 230,000 350,000 8.00 billion
4/13 Severe Weather India, Bangladesh 137 300,000 0.03 billion
2010 produced only one event, the Chile earthquake, that had insured losses that topped USD5 billion. The last
event that surpassed USD5 billion in insured losses before 2010’s Chile earthquake was 2008’s Hurricane Ike, which
made landfall in Galveston, Texas and caused more than USD12.55 billion (2010 USD) in insured losses to coastal
sections of Louisiana and Texas as well as inland states across the Mississippi and Ohio River Valleys. In 2007,
Windstorm Kyrill battered portions of Germany, Britain, Belgium, and the Netherlands, costing insurers more than
USD6.26 billion (2010 USD). 2005 was the record-setting year for insured losses, mainly due to three landfalling
major hurricanes in the United States (Hurricanes Katrina, Rita and Wilma).
2010’s catastrophes occurred, for the most part, in areas where low insurance penetration exists. Areas such as
China, India and Indonesia experienced flooding, earthquakes and tropical cyclones that produced widespread
damage but did not adversely affect the insurance industry. Therefore, insured losses for these magnitudes of
events were quite low. However, these types of disasters can occur anywhere in the world, including in areas where
insurance penetration is much higher such as the United States, the United Kingdom and South Korea. Because of
this, any one of the top 10 economic catastrophes can occur in areas that have much higher take-up rates.
For example, one of the costliest catastrophe in terms of economic losses, the Chile earthquake, amounted
USD30 billion in economic losses and USD8.5 billion in insured losses. According to the 2010 Insurance Risk Study
published by Aon Benfield, Chile’s insurance penetration ratio, defined as the country’s premium relative to the
country’s gross domestic product (GDP), is around 1.2 percent. If this magnitude of disaster occurred in a country
that had a much higher insurance penetration, insured losses could possibly reach to more than USD17 billion,
potentially doubling the insured loss experienced in Chile. In similar fashion, the Pakistan flooding had economic
losses of USD30 billion and insured losses only reached USD200 million. If this event were to occur in an area with
high insurance penetration, insured losses may increase by nearly 900 percent, reaching a loss amount of more than
USD1.9 billion.
Annual Global Climate and Catastrophe Report
6
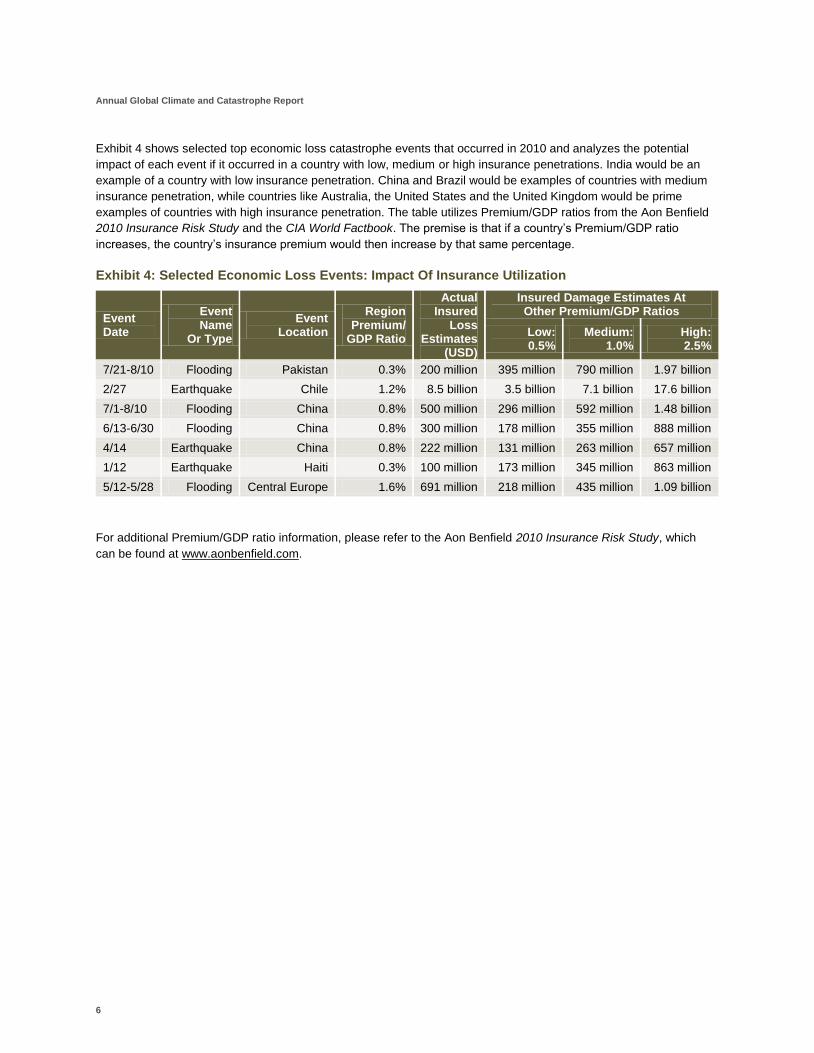
Exhibit 4 shows selected top economic loss catastrophe events that occurred in 2010 and analyzes the potential
impact of each event if it occurred in a country with low, medium or high insurance penetrations. India would be an
example of a country with low insurance penetration. China and Brazil would be examples of countries with medium
insurance penetration, while countries like Australia, the United States and the United Kingdom would be prime
examples of countries with high insurance penetration. The table utilizes Premium/GDP ratios from the Aon Benfield
2010 Insurance Risk Study and the CIA World Factbook. The premise is that if a country’s Premium/GDP ratio
increases, the country’s insurance premium would then increase by that same percentage.
Exhibit 4: Selected Economic Loss Events: Impact Of Insurance Utilization
Event Date
Event Name
Or Type
Event Location
Region Premium/
GDP Ratio
Actual Insured
Loss Estimates
(USD)
Insured Damage Estimates At Other Premium/GDP Ratios
Low: 0.5%
Medium: 1.0%
High: 2.5%
7/21-8/10 Flooding Pakistan 0.3% 200 million 395 million 790 million 1.97 billion
2/27 Earthquake Chile 1.2% 8.5 billion 3.5 billion 7.1 billion 17.6 billion
7/1-8/10 Flooding China 0.8% 500 million 296 million 592 million 1.48 billion
6/13-6/30 Flooding China 0.8% 300 million 178 million 355 million 888 million
4/14 Earthquake China 0.8% 222 million 131 million 263 million 657 million
1/12 Earthquake Haiti 0.3% 100 million 173 million 345 million 863 million
5/12-5/28 Flooding Central Europe 1.6% 691 million 218 million 435 million 1.09 billion
For additional Premium/GDP ratio information, please refer to the Aon Benfield 2010 Insurance Risk Study, which
can be found at www.aonbenfield.com.
Aon Benfield: Impact Forecasting
7
2010 Climate Review
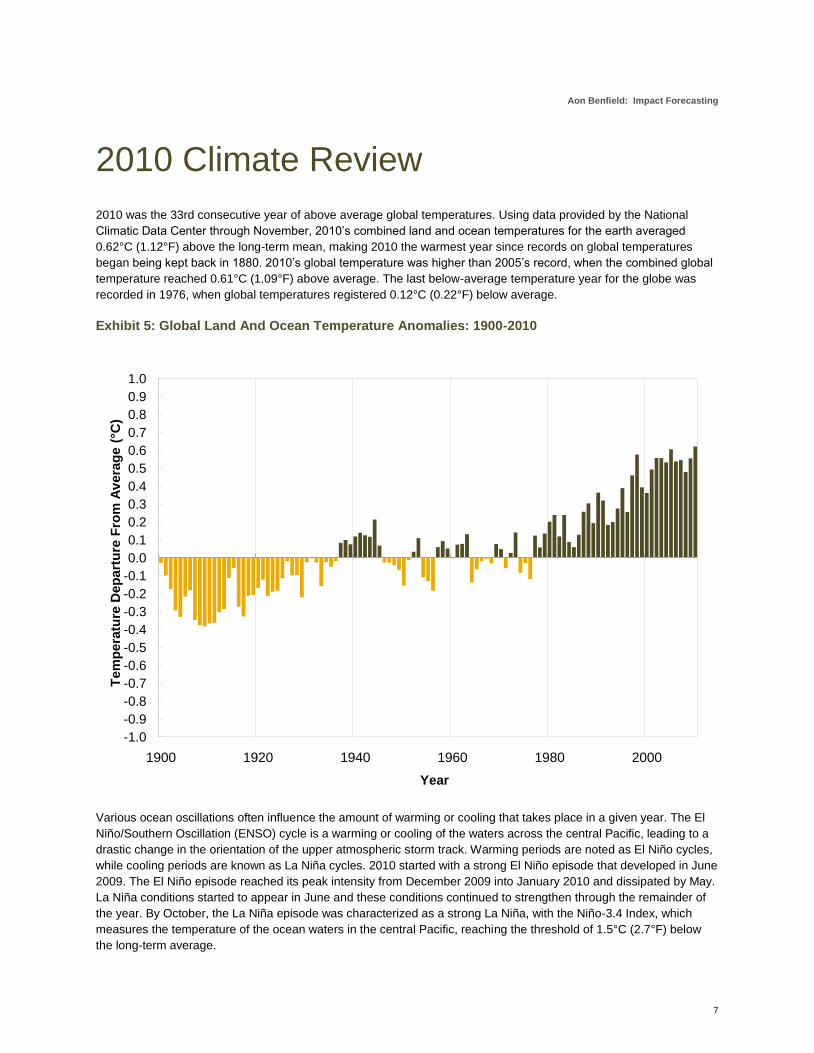
2010 was the 33rd consecutive year of above average global temperatures. Using data provided by the National
Climatic Data Center through November, 2010’s combined land and ocean temperatures for the earth averaged
0.62°C (1.12°F) above the long-term mean, making 2010 the warmest year since records on global temperatures
began being kept back in 1880. 2010’s global temperature was higher than 2005’s record, when the combined global
temperature reached 0.61°C (1.09°F) above average. The last below-average temperature year for the globe was
recorded in 1976, when global temperatures registered 0.12°C (0.22°F) below average.
Exhibit 5: Global Land And Ocean Temperature Anomalies: 1900-2010
Various ocean oscillations often influence the amount of warming or cooling that takes place in a given year. The El
Niño/Southern Oscillation (ENSO) cycle is a warming or cooling of the waters across the central Pacific, leading to a
drastic change in the orientation of the upper atmospheric storm track. Warming periods are noted as El Niño cycles,
while cooling periods are known as La Niña cycles. 2010 started with a strong El Niño episode that developed in June
2009. The El Niño episode reached its peak intensity from December 2009 into January 2010 and dissipated by May.
La Niña conditions started to appear in June and these conditions continued to strengthen through the remainder of
the year. By October, the La Niña episode was characterized as a strong La Niña, with the Niño-3.4 Index, which
measures the temperature of the ocean waters in the central Pacific, reaching the threshold of 1.5°C (2.7°F) below
the long-term average.
-1.0
-0.9
-0.8
-0.7
-0.6
-0.5
-0.4
-0.3
-0.2
-0.1
0.0
0.1
0.2
0.3
0.4
0.5
0.6
0.7
0.8
0.9
1.0
1900 1920 1940 1960 1980 2000
Tem
pe
ratu
re D
ep
art
ure
Fro
m A
vera
ge
(°C
)
Year
Annual Global Climate and Catastrophe Report
8
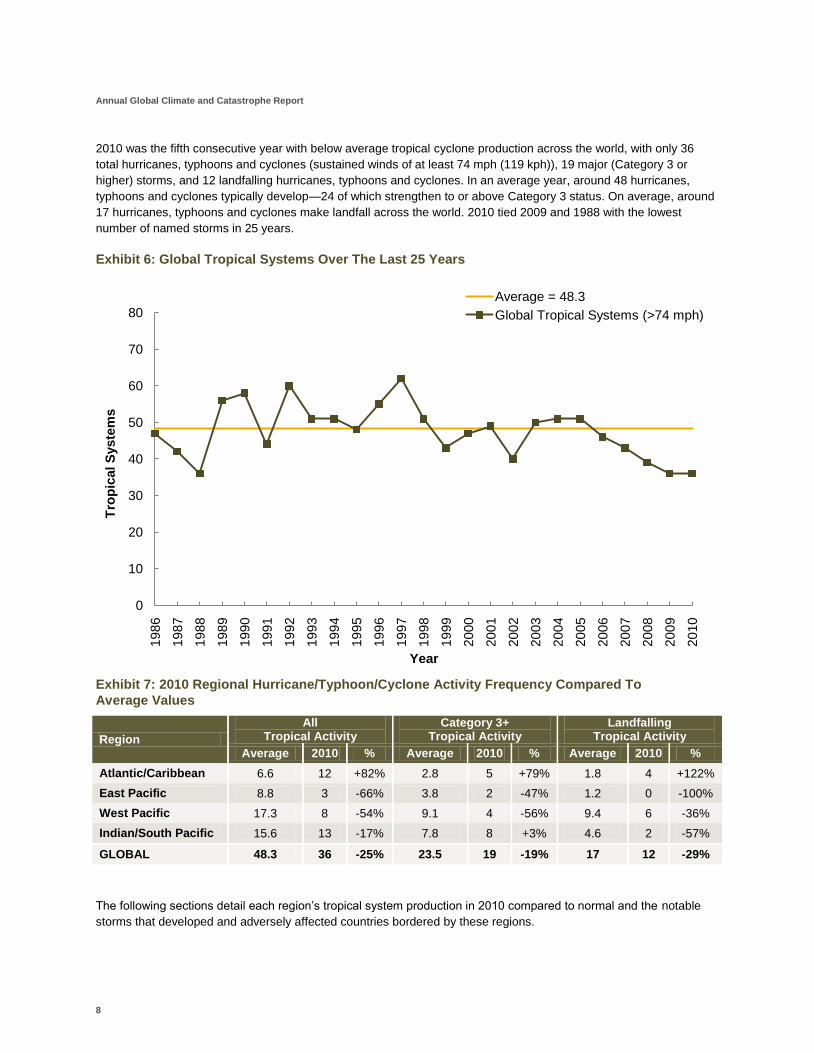
2010 was the fifth consecutive year with below average tropical cyclone production across the world, with only 36
total hurricanes, typhoons and cyclones (sustained winds of at least 74 mph (119 kph)), 19 major (Category 3 or
higher) storms, and 12 landfalling hurricanes, typhoons and cyclones. In an average year, around 48 hurricanes,
typhoons and cyclones typically develop—24 of which strengthen to or above Category 3 status. On average, around
17 hurricanes, typhoons and cyclones make landfall across the world. 2010 tied 2009 and 1988 with the lowest
number of named storms in 25 years.
Exhibit 6: Global Tropical Systems Over The Last 25 Years
Exhibit 7: 2010 Regional Hurricane/Typhoon/Cyclone Activity Frequency Compared To
Average Values
Region
All Tropical Activity
Category 3+ Tropical Activity
Landfalling Tropical Activity
Average 2010 % Average 2010 % Average 2010 %
Atlantic/Caribbean 6.6 12 +82% 2.8 5 +79% 1.8 4 +122%
East Pacific 8.8 3 -66% 3.8 2 -47% 1.2 0 -100%
West Pacific 17.3 8 -54% 9.1 4 -56% 9.4 6 -36%
Indian/South Pacific 15.6 13 -17% 7.8 8 +3% 4.6 2 -57%
GLOBAL 48.3 36 -25% 23.5 19 -19% 17 12 -29%
The following sections detail each region’s tropical system production in 2010 compared to normal and the notable
storms that developed and adversely affected countries bordered by these regions.
0
10
20
30
40
50
60
70
80
1986
1987
1988
1989
1990
1991
1992
1993
1994
1995
1996
1997
1998
1999
2000
2001
2002
2003
2004
2005
2006
2007
2008
2009
2010
Tro
pic
al S
yste
ms
Year
Average = 48.3
Global Tropical Systems (>74 mph)
Aon Benfield: Impact Forecasting
9
2010 Atlantic Hurricane Season Review
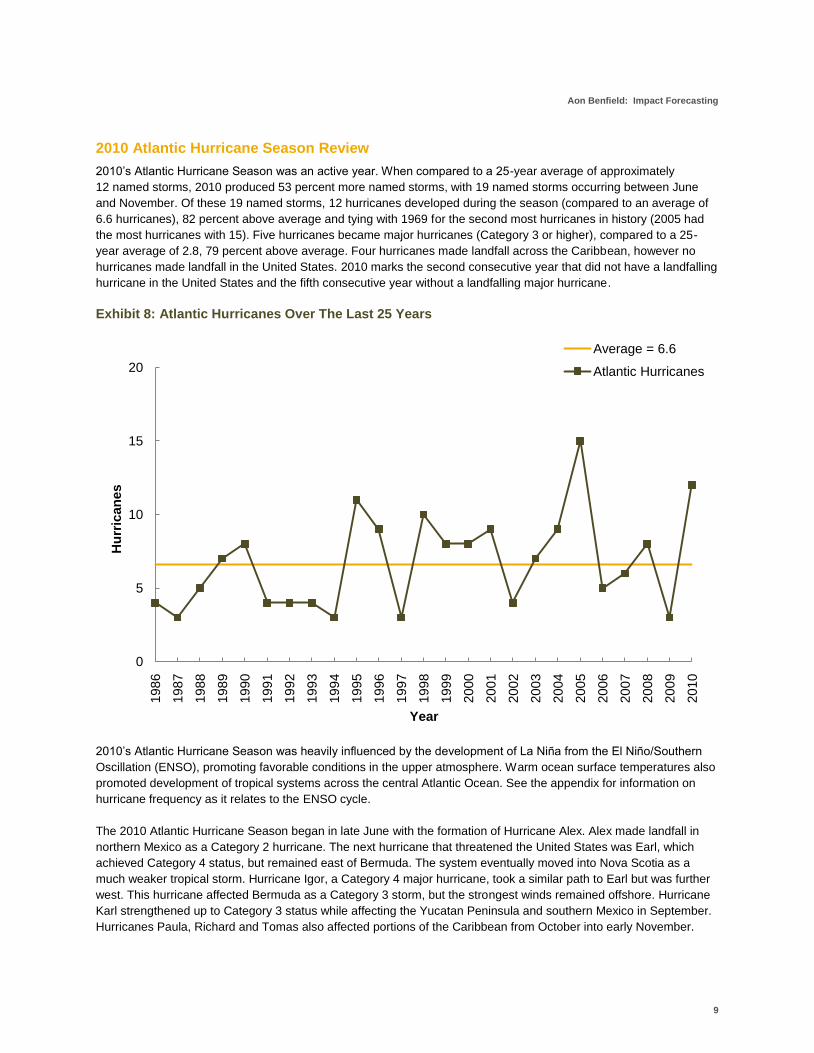
2010’s Atlantic Hurricane Season was an active year. When compared to a 25-year average of approximately
12 named storms, 2010 produced 53 percent more named storms, with 19 named storms occurring between June
and November. Of these 19 named storms, 12 hurricanes developed during the season (compared to an average of
6.6 hurricanes), 82 percent above average and tying with 1969 for the second most hurricanes in history (2005 had
the most hurricanes with 15). Five hurricanes became major hurricanes (Category 3 or higher), compared to a 25-
year average of 2.8, 79 percent above average. Four hurricanes made landfall across the Caribbean, however no
hurricanes made landfall in the United States. 2010 marks the second consecutive year that did not have a landfalling
hurricane in the United States and the fifth consecutive year without a landfalling major hurricane.
Exhibit 8: Atlantic Hurricanes Over The Last 25 Years
2010’s Atlantic Hurricane Season was heavily influenced by the development of La Niña from the El Niño/Southern
Oscillation (ENSO), promoting favorable conditions in the upper atmosphere. Warm ocean surface temperatures also
promoted development of tropical systems across the central Atlantic Ocean. See the appendix for information on
hurricane frequency as it relates to the ENSO cycle.
The 2010 Atlantic Hurricane Season began in late June with the formation of Hurricane Alex. Alex made landfall in
northern Mexico as a Category 2 hurricane. The next hurricane that threatened the United States was Earl, which
achieved Category 4 status, but remained east of Bermuda. The system eventually moved into Nova Scotia as a
much weaker tropical storm. Hurricane Igor, a Category 4 major hurricane, took a similar path to Earl but was further
west. This hurricane affected Bermuda as a Category 3 storm, but the strongest winds remained offshore. Hurricane
Karl strengthened up to Category 3 status while affecting the Yucatan Peninsula and southern Mexico in September.
Hurricanes Paula, Richard and Tomas also affected portions of the Caribbean from October into early November.
0
5
10
15
20
1986
1987
1988
1989
1990
1991
1992
1993
1994
1995
1996
1997
1998
1999
2000
2001
2002
2003
2004
2005
2006
2007
2008
2009
2010
Hu
rric
an
es
Year
Average = 6.6
Atlantic Hurricanes
Annual Global Climate and Catastrophe Report
10
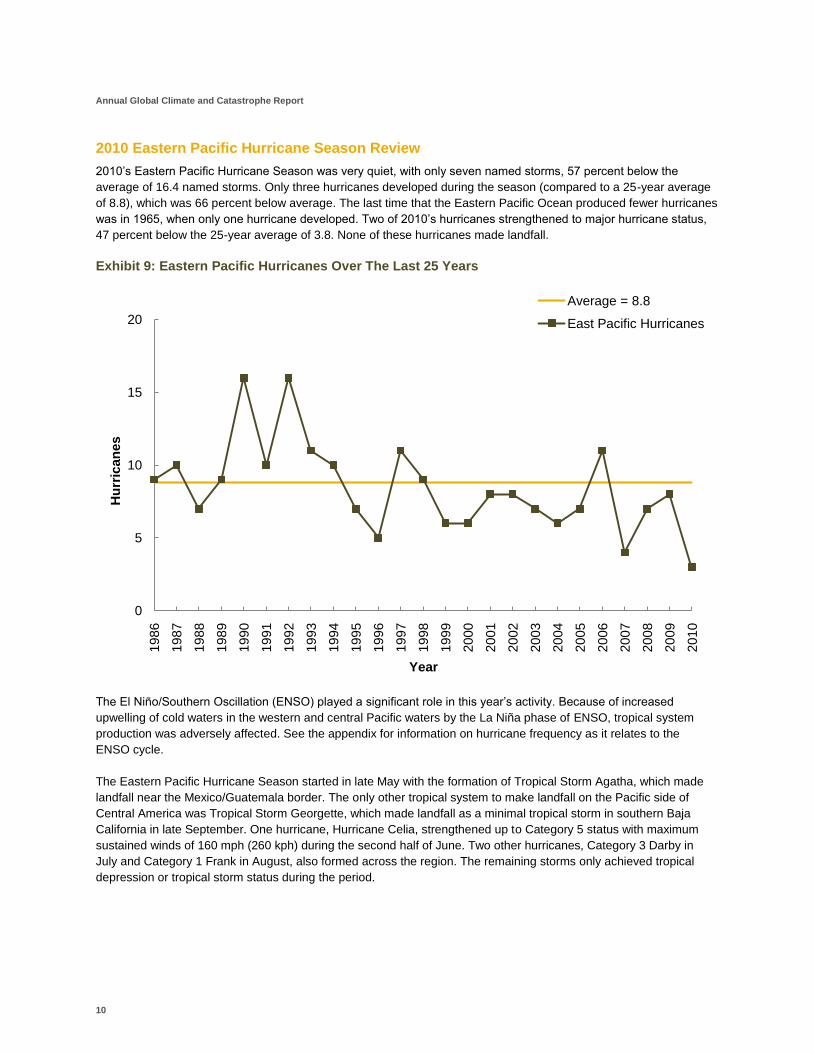
2010 Eastern Pacific Hurricane Season Review
2010’s Eastern Pacific Hurricane Season was very quiet, with only seven named storms, 57 percent below the
average of 16.4 named storms. Only three hurricanes developed during the season (compared to a 25-year average
of 8.8), which was 66 percent below average. The last time that the Eastern Pacific Ocean produced fewer hurricanes
was in 1965, when only one hurricane developed. Two of 2010’s hurricanes strengthened to major hurricane status,
47 percent below the 25-year average of 3.8. None of these hurricanes made landfall.
Exhibit 9: Eastern Pacific Hurricanes Over The Last 25 Years
The El Niño/Southern Oscillation (ENSO) played a significant role in this year’s activity. Because of increased
upwelling of cold waters in the western and central Pacific waters by the La Niña phase of ENSO, tropical system
production was adversely affected. See the appendix for information on hurricane frequency as it relates to the
ENSO cycle.
The Eastern Pacific Hurricane Season started in late May with the formation of Tropical Storm Agatha, which made
landfall near the Mexico/Guatemala border. The only other tropical system to make landfall on the Pacific side of
Central America was Tropical Storm Georgette, which made landfall as a minimal tropical storm in southern Baja
California in late September. One hurricane, Hurricane Celia, strengthened up to Category 5 status with maximum
sustained winds of 160 mph (260 kph) during the second half of June. Two other hurricanes, Category 3 Darby in
July and Category 1 Frank in August, also formed across the region. The remaining storms only achieved tropical
depression or tropical storm status during the period.
0
5
10
15
20
1986
1987
1988
1989
1990
1991
1992
1993
1994
1995
1996
1997
1998
1999
2000
2001
2002
2003
2004
2005
2006
2007
2008
2009
2010
Hu
rric
an
es
Year
Average = 8.8
East Pacific Hurricanes
Aon Benfield: Impact Forecasting
11
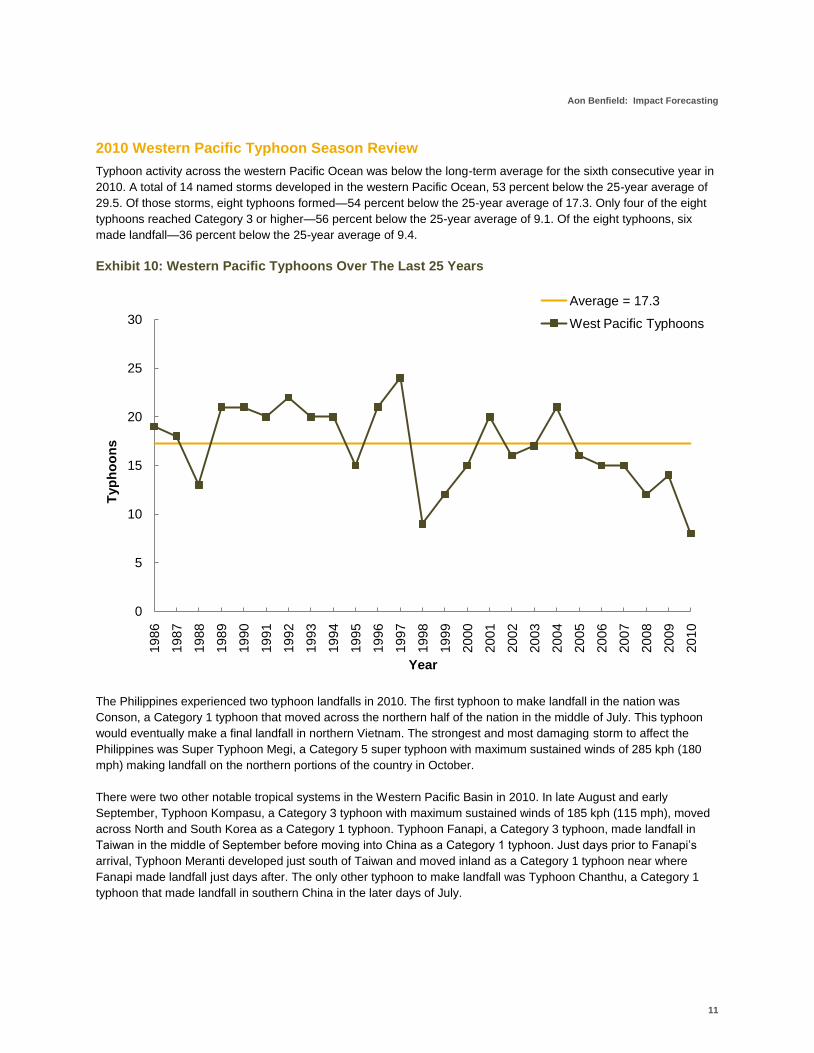
2010 Western Pacific Typhoon Season Review
Typhoon activity across the western Pacific Ocean was below the long-term average for the sixth consecutive year in
2010. A total of 14 named storms developed in the western Pacific Ocean, 53 percent below the 25-year average of
29.5. Of those storms, eight typhoons formed—54 percent below the 25-year average of 17.3. Only four of the eight
typhoons reached Category 3 or higher—56 percent below the 25-year average of 9.1. Of the eight typhoons, six
made landfall—36 percent below the 25-year average of 9.4.
Exhibit 10: Western Pacific Typhoons Over The Last 25 Years
The Philippines experienced two typhoon landfalls in 2010. The first typhoon to make landfall in the nation was
Conson, a Category 1 typhoon that moved across the northern half of the nation in the middle of July. This typhoon
would eventually make a final landfall in northern Vietnam. The strongest and most damaging storm to affect the
Philippines was Super Typhoon Megi, a Category 5 super typhoon with maximum sustained winds of 285 kph (180
mph) making landfall on the northern portions of the country in October.
There were two other notable tropical systems in the Western Pacific Basin in 2010. In late August and early
September, Typhoon Kompasu, a Category 3 typhoon with maximum sustained winds of 185 kph (115 mph), moved
across North and South Korea as a Category 1 typhoon. Typhoon Fanapi, a Category 3 typhoon, made landfall in
Taiwan in the middle of September before moving into China as a Category 1 typhoon. Just days prior to Fanapi’s
arrival, Typhoon Meranti developed just south of Taiwan and moved inland as a Category 1 typhoon near where
Fanapi made landfall just days after. The only other typhoon to make landfall was Typhoon Chanthu, a Category 1
typhoon that made landfall in southern China in the later days of July.
0
5
10
15
20
25
30
1986
1987
1988
1989
1990
1991
1992
1993
1994
1995
1996
1997
1998
1999
2000
2001
2002
2003
2004
2005
2006
2007
2008
2009
2010
Typ
ho
on
s
Year
Average = 17.3
West Pacific Typhoons

Annual Global Climate and Catastrophe Report
12
2010 Indian Ocean and Southern Pacific Cyclone Season Review
For the third consecutive year, the Indian Ocean and the southern Pacific Ocean saw below average tropical system
activity. A total of 23 named storms developed in the region, 31 percent below the 25-year average of 33.3. Of those
storms, 13 cyclones formed—17 percent below the 25-year average of 15.6. Eight of these cyclones reached
Category 3 or higher—near the 25-year average of 7.8. Of the cyclones, only two made landfall—57 percent below
the 25-year average of 4.6.
Exhibit 11: Indian Ocean & South Pacific Cyclones Over The Last 25 Years
A total of three tropical systems made landfall in Australia in 2010. Tropical Storm Olga made landfall with 95 kph (60
mph) winds in late January. The storm lingered across the northern portions of Queensland and the northeastern
sections of the Northern Territory as a tropical storm before weakening. The system moved into the Gulf of
Carpentaria and strengthened into a tropical storm again before dissipating. In March, Cyclone Ului became a
Category 5 cyclone with maximum sustained winds of 260 kph (160 mph) as it moved westward south of the
Solomon Islands. Ului made landfall in northeastern Queensland as a weakening tropical storm on March 20th.
Tropical Storm Paul hugged the Northern Territory coastline during the final days of March with a peak intensity
reaching 110 kph (70 mph) before quickly dissipating after making landfall.
Two notable tropical systems affected the Indian Ocean Basin in 2010. Cyclone Phet achieved maximum wind
speeds of 230 kph (145 mph) before weakening to a Category 3 cyclone as it made landfall on Oman on June 3rd.
The system weakened and made a final landfall in Pakistan on the 6th. Cyclone Giri developed very quickly and
moved into Myanmar as a Category 4 cyclone with maximum sustained winds of 250 kph (150 mph). Within 24 hours
of making landfall, the system had dissipated.
0
5
10
15
20
25
30
1986
1987
1988
1989
1990
1991
1992
1993
1994
1995
1996
1997
1998
1999
2000
2001
2002
2003
2004
2005
2006
2007
2008
2009
2010
Cyclo
nes
Year
Average = 15.6
Indian Ocean & South Pacific Cyclones
Aon Benfield: Impact Forecasting
13
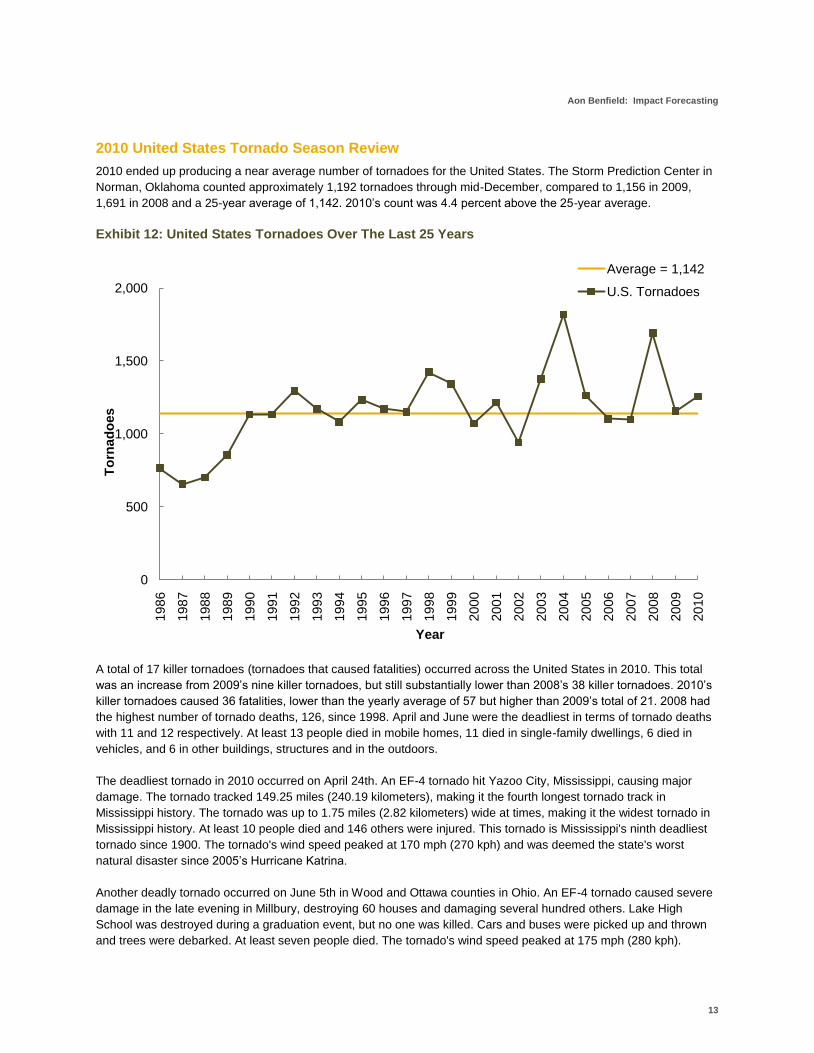
2010 United States Tornado Season Review
2010 ended up producing a near average number of tornadoes for the United States. The Storm Prediction Center in
Norman, Oklahoma counted approximately 1,192 tornadoes through mid-December, compared to 1,156 in 2009,
1,691 in 2008 and a 25-year average of 1,142. 2010’s count was 4.4 percent above the 25-year average.
Exhibit 12: United States Tornadoes Over The Last 25 Years
A total of 17 killer tornadoes (tornadoes that caused fatalities) occurred across the United States in 2010. This total
was an increase from 2009’s nine killer tornadoes, but still substantially lower than 2008’s 38 killer tornadoes. 2010’s
killer tornadoes caused 36 fatalities, lower than the yearly average of 57 but higher than 2009’s total of 21. 2008 had
the highest number of tornado deaths, 126, since 1998. April and June were the deadliest in terms of tornado deaths
with 11 and 12 respectively. At least 13 people died in mobile homes, 11 died in single-family dwellings, 6 died in
vehicles, and 6 in other buildings, structures and in the outdoors.
The deadliest tornado in 2010 occurred on April 24th. An EF-4 tornado hit Yazoo City, Mississippi, causing major
damage. The tornado tracked 149.25 miles (240.19 kilometers), making it the fourth longest tornado track in
Mississippi history. The tornado was up to 1.75 miles (2.82 kilometers) wide at times, making it the widest tornado in
Mississippi history. At least 10 people died and 146 others were injured. This tornado is Mississippi's ninth deadliest
tornado since 1900. The tornado's wind speed peaked at 170 mph (270 kph) and was deemed the state's worst
natural disaster since 2005’s Hurricane Katrina.
Another deadly tornado occurred on June 5th in Wood and Ottawa counties in Ohio. An EF-4 tornado caused severe
damage in the late evening in Millbury, destroying 60 houses and damaging several hundred others. Lake High
School was destroyed during a graduation event, but no one was killed. Cars and buses were picked up and thrown
and trees were debarked. At least seven people died. The tornado's wind speed peaked at 175 mph (280 kph).
0
500
1,000
1,500
2,000
1986
1987
1988
1989
1990
1991
1992
1993
1994
1995
1996
1997
1998
1999
2000
2001
2002
2003
2004
2005
2006
2007
2008
2009
2010
To
rnad
oes
Year
Average = 1,142
U.S. Tornadoes
Annual Global Climate and Catastrophe Report
14
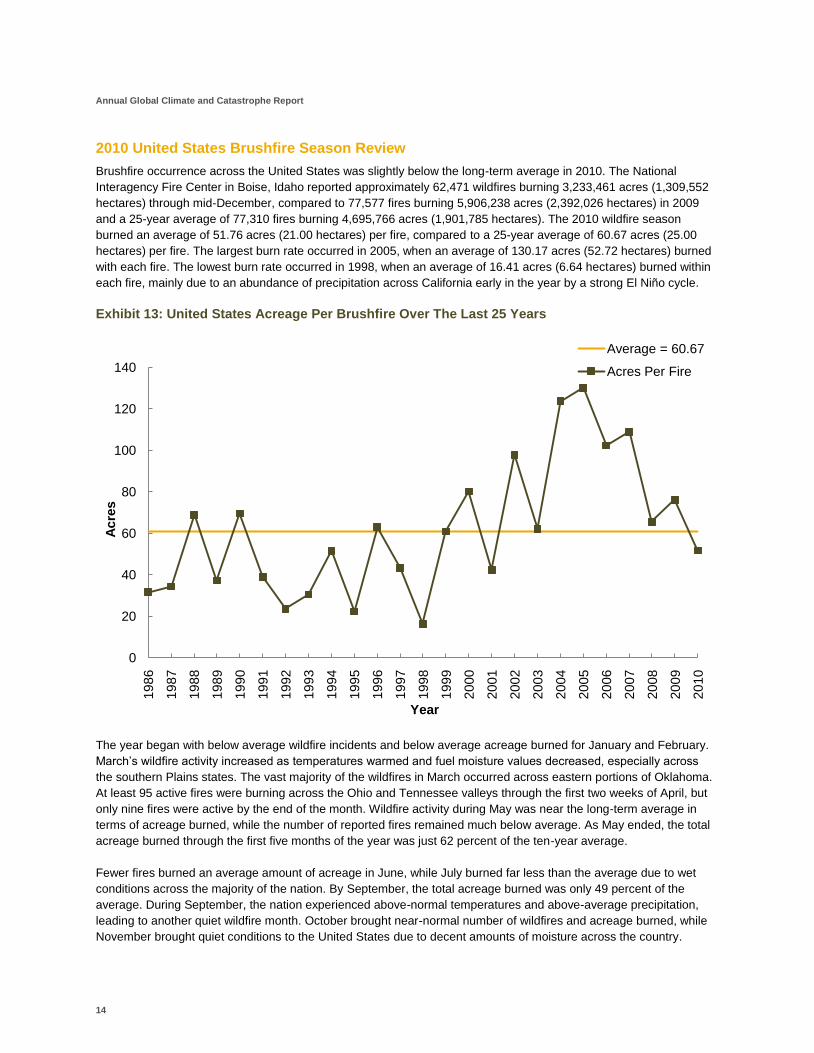
2010 United States Brushfire Season Review
Brushfire occurrence across the United States was slightly below the long-term average in 2010. The National
Interagency Fire Center in Boise, Idaho reported approximately 62,471 wildfires burning 3,233,461 acres (1,309,552
hectares) through mid-December, compared to 77,577 fires burning 5,906,238 acres (2,392,026 hectares) in 2009
and a 25-year average of 77,310 fires burning 4,695,766 acres (1,901,785 hectares). The 2010 wildfire season
burned an average of 51.76 acres (21.00 hectares) per fire, compared to a 25-year average of 60.67 acres (25.00
hectares) per fire. The largest burn rate occurred in 2005, when an average of 130.17 acres (52.72 hectares) burned
with each fire. The lowest burn rate occurred in 1998, when an average of 16.41 acres (6.64 hectares) burned within
each fire, mainly due to an abundance of precipitation across California early in the year by a strong El Niño cycle.
Exhibit 13: United States Acreage Per Brushfire Over The Last 25 Years
The year began with below average wildfire incidents and below average acreage burned for January and February.
March’s wildfire activity increased as temperatures warmed and fuel moisture values decreased, especially across
the southern Plains states. The vast majority of the wildfires in March occurred across eastern portions of Oklahoma.
At least 95 active fires were burning across the Ohio and Tennessee valleys through the first two weeks of April, but
only nine fires were active by the end of the month. Wildfire activity during May was near the long-term average in
terms of acreage burned, while the number of reported fires remained much below average. As May ended, the total
acreage burned through the first five months of the year was just 62 percent of the ten-year average.
Fewer fires burned an average amount of acreage in June, while July burned far less than the average due to wet
conditions across the majority of the nation. By September, the total acreage burned was only 49 percent of the
average. During September, the nation experienced above-normal temperatures and above-average precipitation,
leading to another quiet wildfire month. October brought near-normal number of wildfires and acreage burned, while
November brought quiet conditions to the United States due to decent amounts of moisture across the country.
0
20
40
60
80
100
120
140
19
86
19
87
19
88
19
89
1990
19
91
19
92
19
93
19
94
19
95
19
96
19
97
19
98
19
99
20
00
20
01
2002
20
03
20
04
20
05
20
06
20
07
20
08
20
09
20
10
Acre
s
Year
Average = 60.67
Acres Per Fire
Aon Benfield: Impact Forecasting
15
2011 Climate and Atlantic Hurricane Forecasts
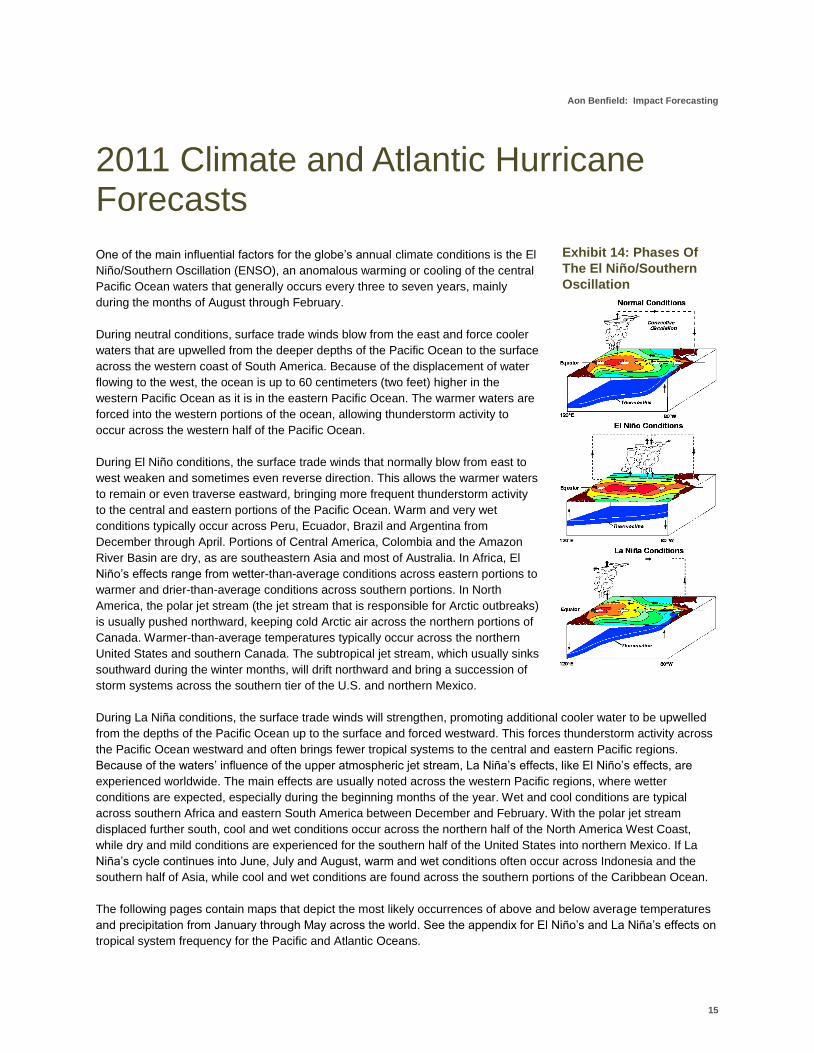
One of the main influential factors for the globe’s annual climate conditions is the El
Niño/Southern Oscillation (ENSO), an anomalous warming or cooling of the central
Pacific Ocean waters that generally occurs every three to seven years, mainly
during the months of August through February.
During neutral conditions, surface trade winds blow from the east and force cooler
waters that are upwelled from the deeper depths of the Pacific Ocean to the surface
across the western coast of South America. Because of the displacement of water
flowing to the west, the ocean is up to 60 centimeters (two feet) higher in the
western Pacific Ocean as it is in the eastern Pacific Ocean. The warmer waters are
forced into the western portions of the ocean, allowing thunderstorm activity to
occur across the western half of the Pacific Ocean.
During El Niño conditions, the surface trade winds that normally blow from east to
west weaken and sometimes even reverse direction. This allows the warmer waters
to remain or even traverse eastward, bringing more frequent thunderstorm activity
to the central and eastern portions of the Pacific Ocean. Warm and very wet
conditions typically occur across Peru, Ecuador, Brazil and Argentina from
December through April. Portions of Central America, Colombia and the Amazon
River Basin are dry, as are southeastern Asia and most of Australia. In Africa, El
Niño’s effects range from wetter-than-average conditions across eastern portions to
warmer and drier-than-average conditions across southern portions. In North
America, the polar jet stream (the jet stream that is responsible for Arctic outbreaks)
is usually pushed northward, keeping cold Arctic air across the northern portions of
Canada. Warmer-than-average temperatures typically occur across the northern
United States and southern Canada. The subtropical jet stream, which usually sinks
southward during the winter months, will drift northward and bring a succession of
storm systems across the southern tier of the U.S. and northern Mexico.
During La Niña conditions, the surface trade winds will strengthen, promoting additional cooler water to be upwelled
from the depths of the Pacific Ocean up to the surface and forced westward. This forces thunderstorm activity across
the Pacific Ocean westward and often brings fewer tropical systems to the central and eastern Pacific regions.
Because of the waters’ influence of the upper atmospheric jet stream, La Niña’s effects, like El Niño’s effects, are
experienced worldwide. The main effects are usually noted across the western Pacific regions, where wetter
conditions are expected, especially during the beginning months of the year. Wet and cool conditions are typical
across southern Africa and eastern South America between December and February. With the polar jet stream
displaced further south, cool and wet conditions occur across the northern half of the North America West Coast,
while dry and mild conditions are experienced for the southern half of the United States into northern Mexico. If La
Niña’s cycle continues into June, July and August, warm and wet conditions often occur across Indonesia and the
southern half of Asia, while cool and wet conditions are found across the southern portions of the Caribbean Ocean.
The following pages contain maps that depict the most likely occurrences of above and below average temperatures
and precipitation from January through May across the world. See the appendix for El Niño’s and La Niña’s effects on
tropical system frequency for the Pacific and Atlantic Oceans.
Exhibit 14: Phases Of
The El Niño/Southern
Oscillation
Annual Global Climate and Catastrophe Report
16
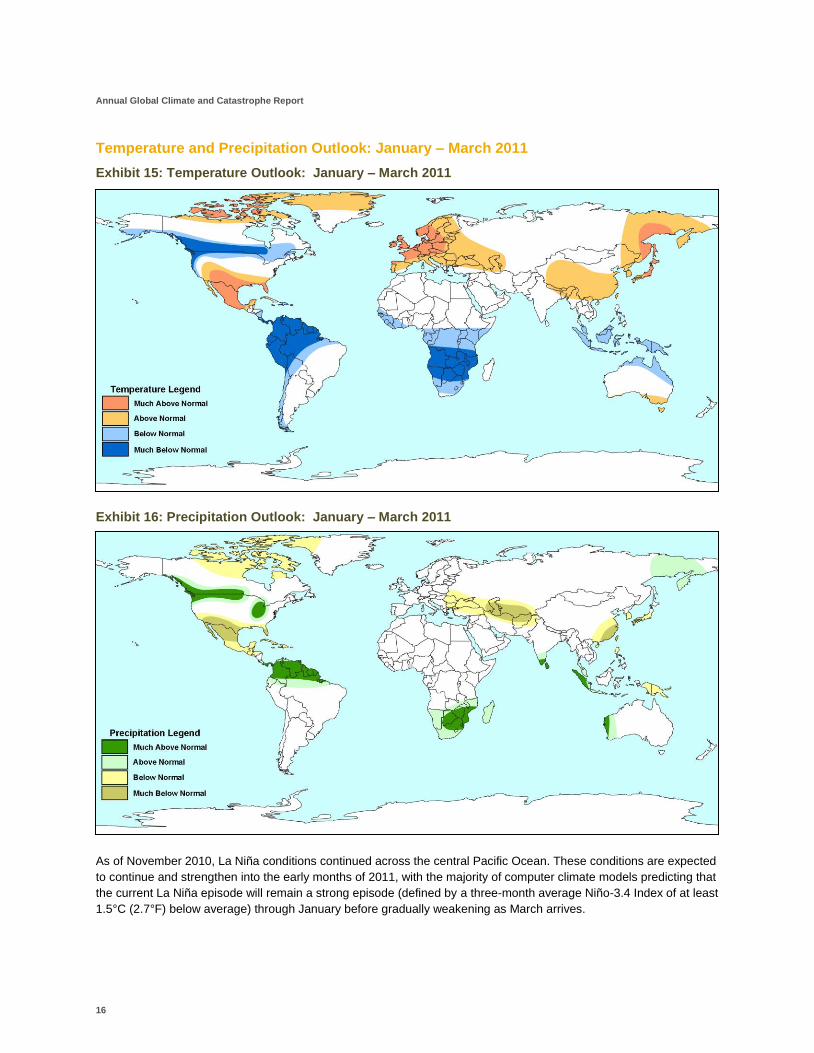
Temperature and Precipitation Outlook: January – March 2011
Exhibit 15: Temperature Outlook: January – March 2011
Exhibit 16: Precipitation Outlook: January – March 2011
As of November 2010, La Niña conditions continued across the central Pacific Ocean. These conditions are expected
to continue and strengthen into the early months of 2011, with the majority of computer climate models predicting that
the current La Niña episode will remain a strong episode (defined by a three-month average Niño-3.4 Index of at least
1.5°C (2.7°F) below average) through January before gradually weakening as March arrives.
Aon Benfield: Impact Forecasting
17
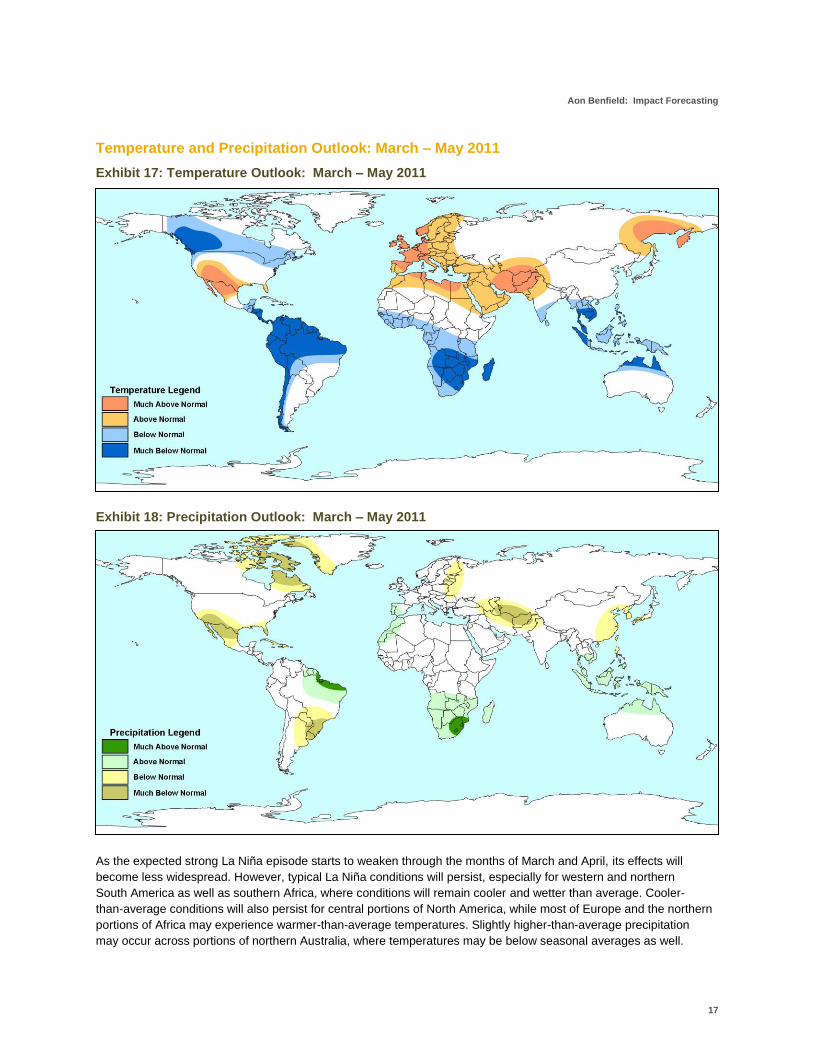
Temperature and Precipitation Outlook: March – May 2011
Exhibit 17: Temperature Outlook: March – May 2011
Exhibit 18: Precipitation Outlook: March – May 2011
As the expected strong La Niña episode starts to weaken through the months of March and April, its effects will
become less widespread. However, typical La Niña conditions will persist, especially for western and northern
South America as well as southern Africa, where conditions will remain cooler and wetter than average. Cooler-
than-average conditions will also persist for central portions of North America, while most of Europe and the northern
portions of Africa may experience warmer-than-average temperatures. Slightly higher-than-average precipitation
may occur across portions of northern Australia, where temperatures may be below seasonal averages as well.

Annual Global Climate and Catastrophe Report
18
Historical Atlantic Hurricane Season Predictions
Abundant media attention has been given to various organizations across the world that issue hurricane season
predictions for the Atlantic and Caribbean Oceans. These organizations utilize meteorological and climatic data
obtained, in some instances, up to six months in advance to determine how active or inactive the Atlantic Hurricane
Season will be in the following year. Several different professional entities issue these forecasts, ranging from
governmental agencies to universities to private companies. The three organizations that consistently make their
forecasts public are:
Colorado State University (CSU), a forecast group sponsored by Colorado State University and private companies led by Dr. Philip Klotzbach and Dr. William Gray
The National Oceanic and Atmospheric Administration (NOAA), the United States’ official governmental climatological and meteorological office
Tropical Storm Risk (TSR), an Aon Benfield-sponsored forecast group based in London, England led by Professor Mark Saunders and Dr. Adam Lea
Some of these entities disclose in detail the parameters being used to derive these forecasts, while others cite
general factors for the reasoning of their predictions. CSU and TSR provide specific numbers for each year’s
forecasts, while NOAA provides a range of values.
The forecasts for the last five years made between the period of May 1st and June 10th along with the actual total
number of named storms, hurricanes and major hurricanes are shown in the following tables. The May/June forecast
was chosen due to the availability of forecasts from each organization. Additionally, a five-year cumulative forecast is
shown to emphasize that long-term forecasting may yield more information on general frequency shifts than short-
term forecasting.
Exhibit 19: 2010 Forecast
May/June Atlantic Hurricane Season Forecast
Forecast Parameter 25-Year Average
CSU NOAA TSR Season
Total
Named Storms 12.4 18 14-23 18 19
Hurricanes 6.6 10 8-14 10 12
Major Hurricanes 2.8 5 3-7 4 5
Exhibit 20: 2009 Forecast
May/June Atlantic Hurricane Season Forecast
Forecast Parameter 25-Year Average
CSU NOAA TSR Season
Total
Named Storms 12.4 11 9-14 11 9
Hurricanes 6.6 5 4-7 5 3
Major Hurricanes 2.8 2 1-3 2 2

Aon Benfield: Impact Forecasting
19
Exhibit 21: 2008 Forecast
May/June Atlantic Hurricane Season Forecast
Forecast Parameter 25-Year Average
CSU NOAA TSR Season
Total
Named Storms 12.4 15 12-16 14 16
Hurricanes 6.6 8 6-9 8 8
Major Hurricanes 2.8 4 2-5 3 5
Exhibit 22: 2007 Forecast
May/June Atlantic Hurricane Season Forecast
Forecast Parameter 25-Year Average
CSU NOAA TSR Season
Total
Named Storms 12.4 17 13-17 16 15
Hurricanes 6.6 9 7-10 9 6
Major Hurricanes 2.8 5 3-5 4 2
Exhibit 23: 2006 Forecast
May/June Atlantic Hurricane Season Forecast
Forecast Parameter 25-Year Average
CSU NOAA TSR Season
Total
Named Storms 12.4 17 13-16 14 9
Hurricanes 6.6 9 8-10 8 4
Major Hurricanes 2.8 5 4-6 3 2
Exhibit 24: 5-Year Cumulative Forecast
May/June Atlantic Hurricane Season Forecast
Forecast Parameter 25-Year Average
CSU NOAA TSR Season
Total
Named Storms 62 78 61-86 73 68
Hurricanes 33 41 33-50 40 33
Major Hurricanes 14 21 13-26 16 16
Annual Global Climate and Catastrophe Report
20
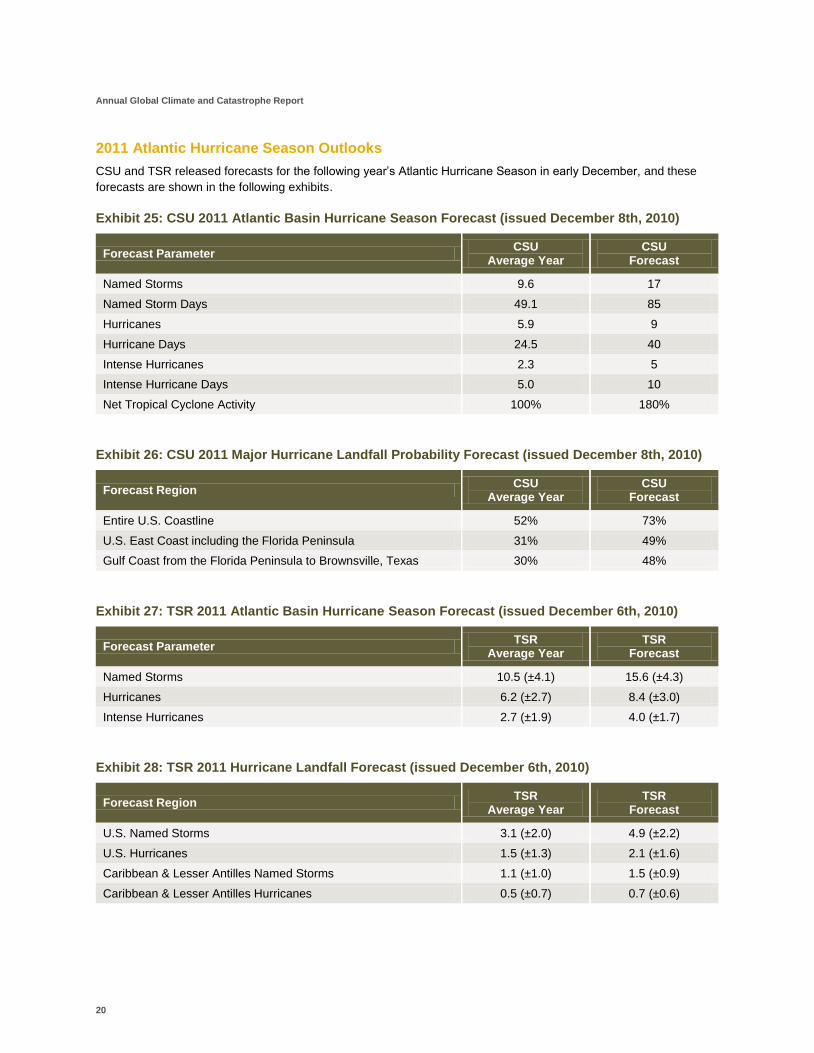
2011 Atlantic Hurricane Season Outlooks
CSU and TSR released forecasts for the following year’s Atlantic Hurricane Season in early December, and these
forecasts are shown in the following exhibits.
Exhibit 25: CSU 2011 Atlantic Basin Hurricane Season Forecast (issued December 8th, 2010)
Forecast Parameter CSU
Average Year CSU
Forecast
Named Storms 9.6 17
Named Storm Days 49.1 85
Hurricanes 5.9 9
Hurricane Days 24.5 40
Intense Hurricanes 2.3 5
Intense Hurricane Days 5.0 10
Net Tropical Cyclone Activity 100% 180%
Exhibit 26: CSU 2011 Major Hurricane Landfall Probability Forecast (issued December 8th, 2010)
Forecast Region CSU
Average Year CSU
Forecast
Entire U.S. Coastline 52% 73%
U.S. East Coast including the Florida Peninsula 31% 49%
Gulf Coast from the Florida Peninsula to Brownsville, Texas 30% 48%
Exhibit 27: TSR 2011 Atlantic Basin Hurricane Season Forecast (issued December 6th, 2010)
Forecast Parameter TSR
Average Year TSR
Forecast
Named Storms 10.5 (±4.1) 15.6 (±4.3)
Hurricanes 6.2 (±2.7) 8.4 (±3.0)
Intense Hurricanes 2.7 (±1.9) 4.0 (±1.7)
Exhibit 28: TSR 2011 Hurricane Landfall Forecast (issued December 6th, 2010)
Forecast Region TSR
Average Year TSR
Forecast
U.S. Named Storms 3.1 (±2.0) 4.9 (±2.2)
U.S. Hurricanes 1.5 (±1.3) 2.1 (±1.6)
Caribbean & Lesser Antilles Named Storms 1.1 (±1.0) 1.5 (±0.9)
Caribbean & Lesser Antilles Hurricanes 0.5 (±0.7) 0.7 (±0.6)
Aon Benfield: Impact Forecasting
21
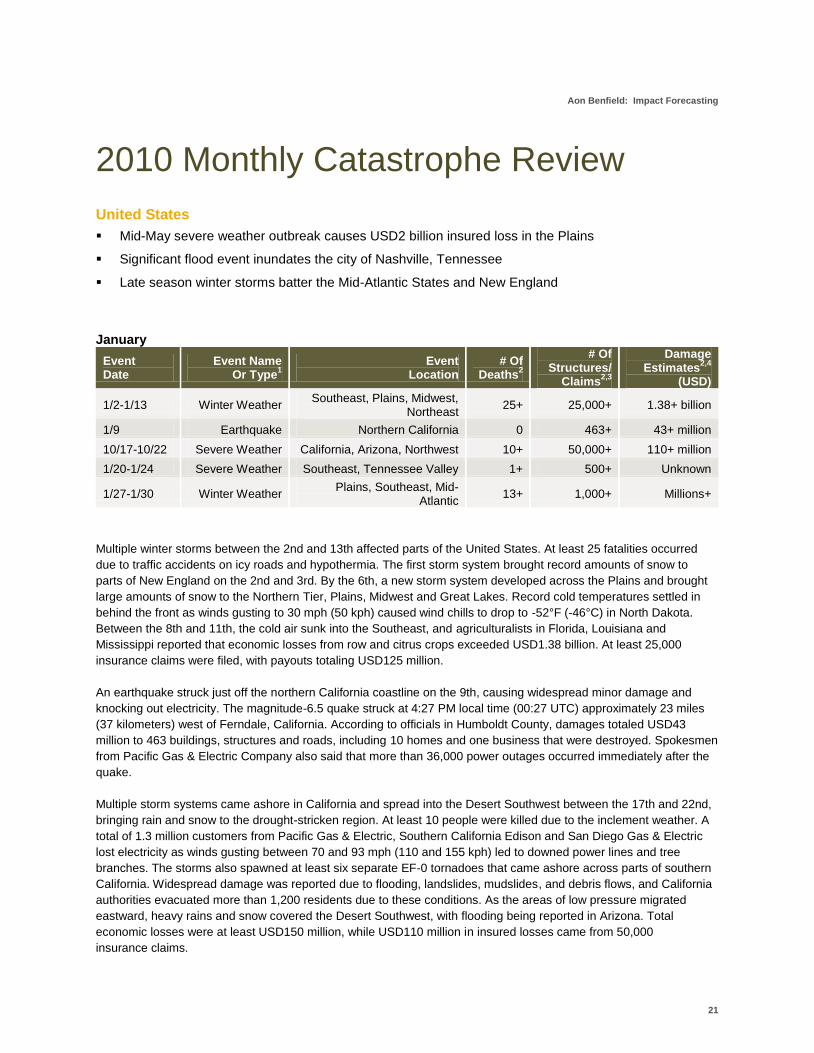
2010 Monthly Catastrophe Review
United States
Mid-May severe weather outbreak causes USD2 billion insured loss in the Plains
Significant flood event inundates the city of Nashville, Tennessee
Late season winter storms batter the Mid-Atlantic States and New England
January
Event Date
Event Name Or Type
1
Event Location
# Of Deaths
2
# Of Structures/
Claims2,3
Damage Estimates
2,4
(USD)
1/2-1/13 Winter Weather Southeast, Plains, Midwest,
Northeast 25+ 25,000+ 1.38+ billion
1/9 Earthquake Northern California 0 463+ 43+ million
10/17-10/22 Severe Weather California, Arizona, Northwest 10+ 50,000+ 110+ million
1/20-1/24 Severe Weather Southeast, Tennessee Valley 1+ 500+ Unknown
1/27-1/30 Winter Weather Plains, Southeast, Mid-
Atlantic 13+ 1,000+ Millions+
Multiple winter storms between the 2nd and 13th affected parts of the United States. At least 25 fatalities occurred
due to traffic accidents on icy roads and hypothermia. The first storm system brought record amounts of snow to
parts of New England on the 2nd and 3rd. By the 6th, a new storm system developed across the Plains and brought
large amounts of snow to the Northern Tier, Plains, Midwest and Great Lakes. Record cold temperatures settled in
behind the front as winds gusting to 30 mph (50 kph) caused wind chills to drop to -52°F (-46°C) in North Dakota.
Between the 8th and 11th, the cold air sunk into the Southeast, and agriculturalists in Florida, Louisiana and
Mississippi reported that economic losses from row and citrus crops exceeded USD1.38 billion. At least 25,000
insurance claims were filed, with payouts totaling USD125 million.
An earthquake struck just off the northern California coastline on the 9th, causing widespread minor damage and
knocking out electricity. The magnitude-6.5 quake struck at 4:27 PM local time (00:27 UTC) approximately 23 miles
(37 kilometers) west of Ferndale, California. According to officials in Humboldt County, damages totaled USD43
million to 463 buildings, structures and roads, including 10 homes and one business that were destroyed. Spokesmen
from Pacific Gas & Electric Company also said that more than 36,000 power outages occurred immediately after the
quake.
Multiple storm systems came ashore in California and spread into the Desert Southwest between the 17th and 22nd,
bringing rain and snow to the drought-stricken region. At least 10 people were killed due to the inclement weather. A
total of 1.3 million customers from Pacific Gas & Electric, Southern California Edison and San Diego Gas & Electric
lost electricity as winds gusting between 70 and 93 mph (110 and 155 kph) led to downed power lines and tree
branches. The storms also spawned at least six separate EF-0 tornadoes that came ashore across parts of southern
California. Widespread damage was reported due to flooding, landslides, mudslides, and debris flows, and California
authorities evacuated more than 1,200 residents due to these conditions. As the areas of low pressure migrated
eastward, heavy rains and snow covered the Desert Southwest, with flooding being reported in Arizona. Total
economic losses were at least USD150 million, while USD110 million in insured losses came from 50,000
insurance claims.
Annual Global Climate and Catastrophe Report
22
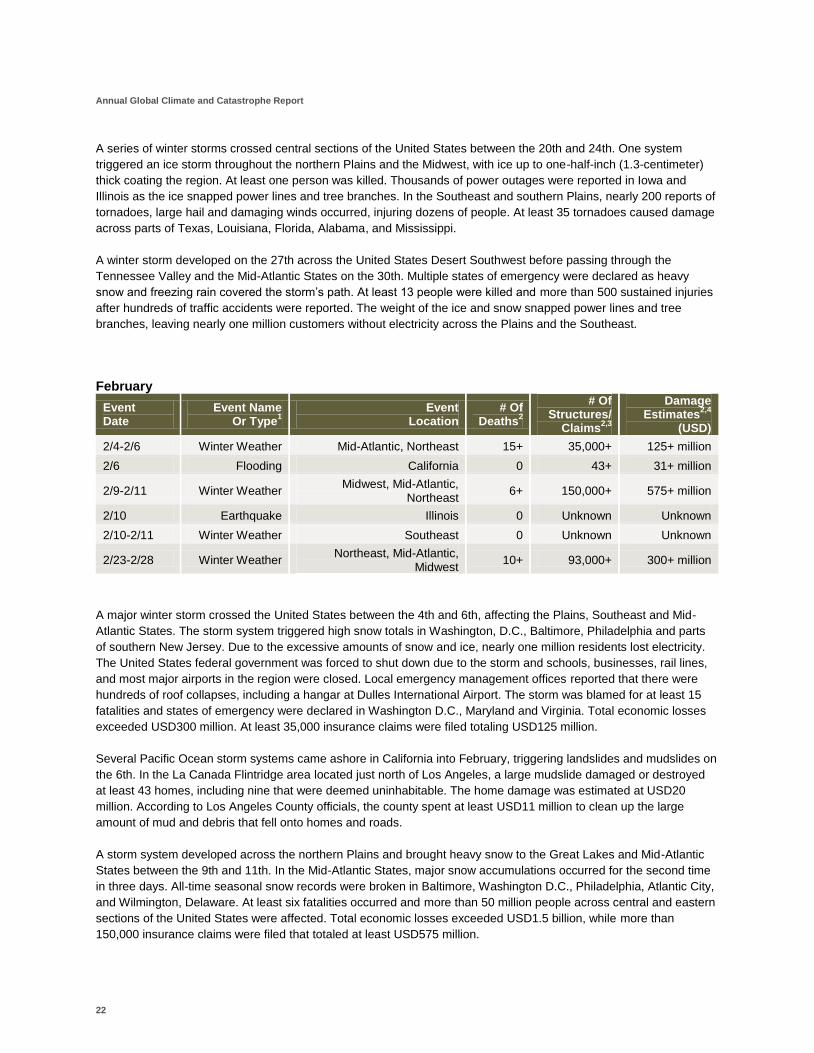
A series of winter storms crossed central sections of the United States between the 20th and 24th. One system
triggered an ice storm throughout the northern Plains and the Midwest, with ice up to one-half-inch (1.3-centimeter)
thick coating the region. At least one person was killed. Thousands of power outages were reported in Iowa and
Illinois as the ice snapped power lines and tree branches. In the Southeast and southern Plains, nearly 200 reports of
tornadoes, large hail and damaging winds occurred, injuring dozens of people. At least 35 tornadoes caused damage
across parts of Texas, Louisiana, Florida, Alabama, and Mississippi.
A winter storm developed on the 27th across the United States Desert Southwest before passing through the
Tennessee Valley and the Mid-Atlantic States on the 30th. Multiple states of emergency were declared as heavy
snow and freezing rain covered the storm’s path. At least 13 people were killed and more than 500 sustained injuries
after hundreds of traffic accidents were reported. The weight of the ice and snow snapped power lines and tree
branches, leaving nearly one million customers without electricity across the Plains and the Southeast.
February
Event Date
Event Name Or Type
1
Event Location
# Of Deaths
2
# Of Structures/
Claims2,3
Damage Estimates
2,4
(USD)
2/4-2/6 Winter Weather Mid-Atlantic, Northeast 15+ 35,000+ 125+ million
2/6 Flooding California 0 43+ 31+ million
2/9-2/11 Winter Weather Midwest, Mid-Atlantic,
Northeast 6+ 150,000+ 575+ million
2/10 Earthquake Illinois 0 Unknown Unknown
2/10-2/11 Winter Weather Southeast 0 Unknown Unknown
2/23-2/28 Winter Weather Northeast, Mid-Atlantic,
Midwest 10+ 93,000+ 300+ million
A major winter storm crossed the United States between the 4th and 6th, affecting the Plains, Southeast and Mid-
Atlantic States. The storm system triggered high snow totals in Washington, D.C., Baltimore, Philadelphia and parts
of southern New Jersey. Due to the excessive amounts of snow and ice, nearly one million residents lost electricity.
The United States federal government was forced to shut down due to the storm and schools, businesses, rail lines,
and most major airports in the region were closed. Local emergency management offices reported that there were
hundreds of roof collapses, including a hangar at Dulles International Airport. The storm was blamed for at least 15
fatalities and states of emergency were declared in Washington D.C., Maryland and Virginia. Total economic losses
exceeded USD300 million. At least 35,000 insurance claims were filed totaling USD125 million.
Several Pacific Ocean storm systems came ashore in California into February, triggering landslides and mudslides on
the 6th. In the La Canada Flintridge area located just north of Los Angeles, a large mudslide damaged or destroyed
at least 43 homes, including nine that were deemed uninhabitable. The home damage was estimated at USD20
million. According to Los Angeles County officials, the county spent at least USD11 million to clean up the large
amount of mud and debris that fell onto homes and roads.
A storm system developed across the northern Plains and brought heavy snow to the Great Lakes and Mid-Atlantic
States between the 9th and 11th. In the Mid-Atlantic States, major snow accumulations occurred for the second time
in three days. All-time seasonal snow records were broken in Baltimore, Washington D.C., Philadelphia, Atlantic City,
and Wilmington, Delaware. At least six fatalities occurred and more than 50 million people across central and eastern
sections of the United States were affected. Total economic losses exceeded USD1.5 billion, while more than
150,000 insurance claims were filed that totaled at least USD575 million.
Aon Benfield: Impact Forecasting
23
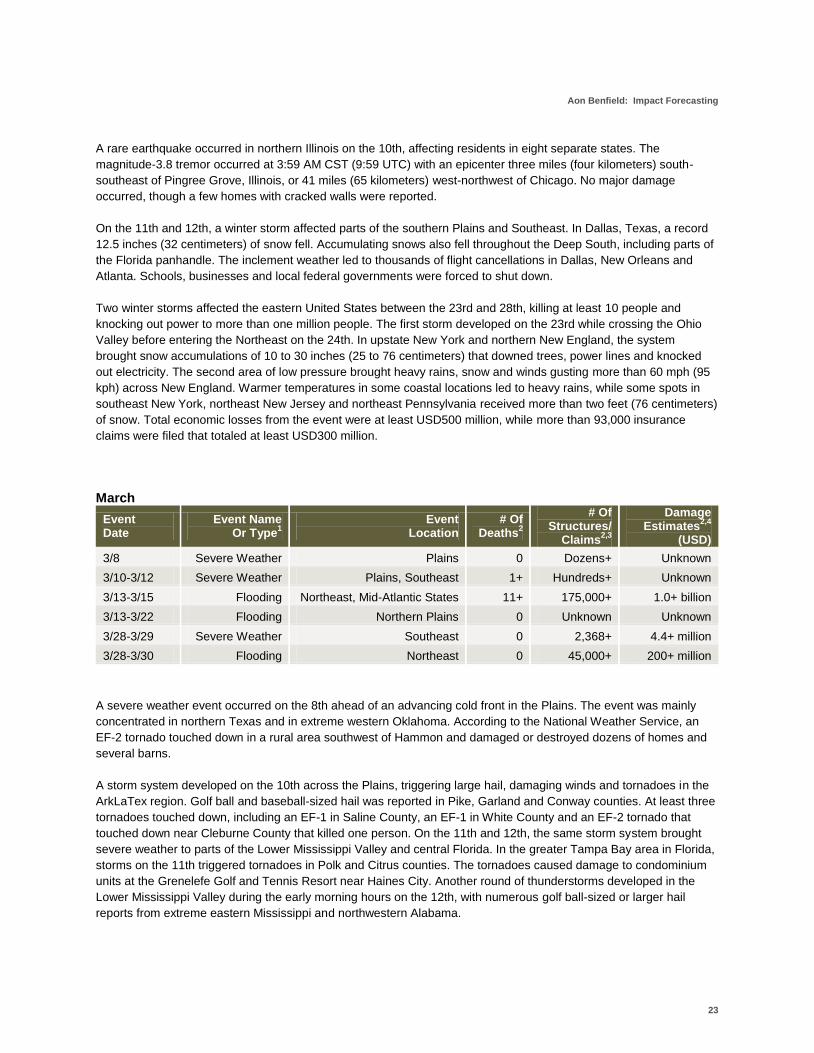
A rare earthquake occurred in northern Illinois on the 10th, affecting residents in eight separate states. The
magnitude-3.8 tremor occurred at 3:59 AM CST (9:59 UTC) with an epicenter three miles (four kilometers) south-
southeast of Pingree Grove, Illinois, or 41 miles (65 kilometers) west-northwest of Chicago. No major damage
occurred, though a few homes with cracked walls were reported.
On the 11th and 12th, a winter storm affected parts of the southern Plains and Southeast. In Dallas, Texas, a record
12.5 inches (32 centimeters) of snow fell. Accumulating snows also fell throughout the Deep South, including parts of
the Florida panhandle. The inclement weather led to thousands of flight cancellations in Dallas, New Orleans and
Atlanta. Schools, businesses and local federal governments were forced to shut down.
Two winter storms affected the eastern United States between the 23rd and 28th, killing at least 10 people and
knocking out power to more than one million people. The first storm developed on the 23rd while crossing the Ohio
Valley before entering the Northeast on the 24th. In upstate New York and northern New England, the system
brought snow accumulations of 10 to 30 inches (25 to 76 centimeters) that downed trees, power lines and knocked
out electricity. The second area of low pressure brought heavy rains, snow and winds gusting more than 60 mph (95
kph) across New England. Warmer temperatures in some coastal locations led to heavy rains, while some spots in
southeast New York, northeast New Jersey and northeast Pennsylvania received more than two feet (76 centimeters)
of snow. Total economic losses from the event were at least USD500 million, while more than 93,000 insurance
claims were filed that totaled at least USD300 million.
March
Event Date
Event Name Or Type
1
Event Location
# Of Deaths
2
# Of Structures/
Claims2,3
Damage Estimates
2,4
(USD)
3/8 Severe Weather Plains 0 Dozens+ Unknown
3/10-3/12 Severe Weather Plains, Southeast 1+ Hundreds+ Unknown
3/13-3/15 Flooding Northeast, Mid-Atlantic States 11+ 175,000+ 1.0+ billion
3/13-3/22 Flooding Northern Plains 0 Unknown Unknown
3/28-3/29 Severe Weather Southeast 0 2,368+ 4.4+ million
3/28-3/30 Flooding Northeast 0 45,000+ 200+ million
A severe weather event occurred on the 8th ahead of an advancing cold front in the Plains. The event was mainly
concentrated in northern Texas and in extreme western Oklahoma. According to the National Weather Service, an
EF-2 tornado touched down in a rural area southwest of Hammon and damaged or destroyed dozens of homes and
several barns.
A storm system developed on the 10th across the Plains, triggering large hail, damaging winds and tornadoes in the
ArkLaTex region. Golf ball and baseball-sized hail was reported in Pike, Garland and Conway counties. At least three
tornadoes touched down, including an EF-1 in Saline County, an EF-1 in White County and an EF-2 tornado that
touched down near Cleburne County that killed one person. On the 11th and 12th, the same storm system brought
severe weather to parts of the Lower Mississippi Valley and central Florida. In the greater Tampa Bay area in Florida,
storms on the 11th triggered tornadoes in Polk and Citrus counties. The tornadoes caused damage to condominium
units at the Grenelefe Golf and Tennis Resort near Haines City. Another round of thunderstorms developed in the
Lower Mississippi Valley during the early morning hours on the 12th, with numerous golf ball-sized or larger hail
reports from extreme eastern Mississippi and northwestern Alabama.
Annual Global Climate and Catastrophe Report
24
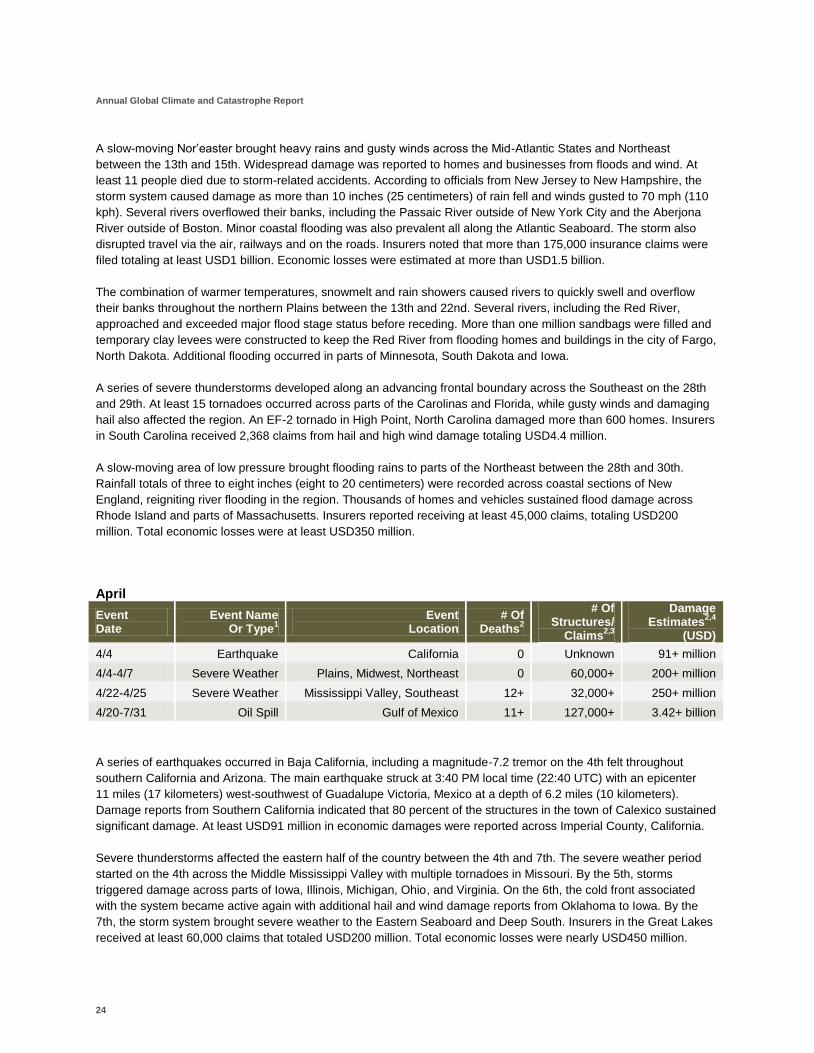
A slow-moving Nor’easter brought heavy rains and gusty winds across the Mid-Atlantic States and Northeast
between the 13th and 15th. Widespread damage was reported to homes and businesses from floods and wind. At
least 11 people died due to storm-related accidents. According to officials from New Jersey to New Hampshire, the
storm system caused damage as more than 10 inches (25 centimeters) of rain fell and winds gusted to 70 mph (110
kph). Several rivers overflowed their banks, including the Passaic River outside of New York City and the Aberjona
River outside of Boston. Minor coastal flooding was also prevalent all along the Atlantic Seaboard. The storm also
disrupted travel via the air, railways and on the roads. Insurers noted that more than 175,000 insurance claims were
filed totaling at least USD1 billion. Economic losses were estimated at more than USD1.5 billion.
The combination of warmer temperatures, snowmelt and rain showers caused rivers to quickly swell and overflow
their banks throughout the northern Plains between the 13th and 22nd. Several rivers, including the Red River,
approached and exceeded major flood stage status before receding. More than one million sandbags were filled and
temporary clay levees were constructed to keep the Red River from flooding homes and buildings in the city of Fargo,
North Dakota. Additional flooding occurred in parts of Minnesota, South Dakota and Iowa.
A series of severe thunderstorms developed along an advancing frontal boundary across the Southeast on the 28th
and 29th. At least 15 tornadoes occurred across parts of the Carolinas and Florida, while gusty winds and damaging
hail also affected the region. An EF-2 tornado in High Point, North Carolina damaged more than 600 homes. Insurers
in South Carolina received 2,368 claims from hail and high wind damage totaling USD4.4 million.
A slow-moving area of low pressure brought flooding rains to parts of the Northeast between the 28th and 30th.
Rainfall totals of three to eight inches (eight to 20 centimeters) were recorded across coastal sections of New
England, reigniting river flooding in the region. Thousands of homes and vehicles sustained flood damage across
Rhode Island and parts of Massachusetts. Insurers reported receiving at least 45,000 claims, totaling USD200
million. Total economic losses were at least USD350 million.
April
Event Date
Event Name Or Type
1
Event Location
# Of Deaths
2
# Of Structures/
Claims2,3
Damage Estimates
2,4
(USD)
4/4 Earthquake California 0 Unknown 91+ million
4/4-4/7 Severe Weather Plains, Midwest, Northeast 0 60,000+ 200+ million
4/22-4/25 Severe Weather Mississippi Valley, Southeast 12+ 32,000+ 250+ million
4/20-7/31 Oil Spill Gulf of Mexico 11+ 127,000+ 3.42+ billion
A series of earthquakes occurred in Baja California, including a magnitude-7.2 tremor on the 4th felt throughout
southern California and Arizona. The main earthquake struck at 3:40 PM local time (22:40 UTC) with an epicenter
11 miles (17 kilometers) west-southwest of Guadalupe Victoria, Mexico at a depth of 6.2 miles (10 kilometers).
Damage reports from Southern California indicated that 80 percent of the structures in the town of Calexico sustained
significant damage. At least USD91 million in economic damages were reported across Imperial County, California.
Severe thunderstorms affected the eastern half of the country between the 4th and 7th. The severe weather period
started on the 4th across the Middle Mississippi Valley with multiple tornadoes in Missouri. By the 5th, storms
triggered damage across parts of Iowa, Illinois, Michigan, Ohio, and Virginia. On the 6th, the cold front associated
with the system became active again with additional hail and wind damage reports from Oklahoma to Iowa. By the
7th, the storm system brought severe weather to the Eastern Seaboard and Deep South. Insurers in the Great Lakes
received at least 60,000 claims that totaled USD200 million. Total economic losses were nearly USD450 million.

Aon Benfield: Impact Forecasting
25
A severe weather and tornado outbreak triggered tornadoes, damaging winds and large hail across parts of the
Mississippi and Tennessee Valleys, Rockies, Plains and Southeast between the 22nd and 25th. At least 12 people
were killed and more than 100 were injured as tornadoes touched down in a dozen states. 10 people were killed in
Mississippi when an EF-4 tornado developed just west of Tallulah, Louisiana and traversed 149 miles (240
kilometers) east-northeastward across Mississippi on the 24th. As the storms further advanced through the
Southeast, more damage occurred, especially in South Carolina. According to insurers, at least 32,000 claims were
filed totaling more than USD250 million. Total economic losses were at least USD500 million.
An April 20th explosion on an offshore oil drilling rig left at least 11 people dead and caused a massive oil spill across
the north-central Gulf of Mexico. An estimated 4.3 million barrels (180 million gallons) of oil spilled into the Gulf of
Mexico between April and July before the well was capped. Oil washed ashore all along the Gulf Coast, as the fishing
and tourism industries were significantly impacted. At least 127,000 insurance claims were processed in the months
that followed, with payouts exceeding USD3.42 billion.
May
Event Date
Event Name Or Type
1
Event Location
# Of Deaths
2
# Of Structures/
Claims2,3
Damage Estimates
2,4
(USD)
4/30-5/3 Severe Weather Mississippi Valley, Tennessee
Valley, Southeast 32+ 75,000+ 1.5+ billion
5/7-5/8 Severe Weather Ohio Valley, Northeast 0 17,500+ 75+ million
5/10 Severe Weather Oklahoma, Kansas 5+ 72,500+ 600+ million
5/12-5/16 Severe Weather Plains, Midwest, Northeast,
Tennessee Valley 0 230,000+ 2+ billion
5/22-5/26 Severe Weather Plains, Midwest, Northeast 0 65,000+ 400+ million
Severe thunderstorms triggered tornadoes, damaging winds, large hail, and extensive flooding across parts of the
Mississippi and Tennessee Valleys between April 30th and the 3rd. At least 32 people were killed and dozens of
others were injured. On April 30th, tornadoes left damage across parts of Arkansas, Missouri, Kentucky, Tennessee,
and Wisconsin. Between May 1st and 2nd, additional tornadoes occurred in the Mississippi and Tennessee Valleys.
The primary focus of the event was in central and western Tennessee, as excessive rains caused massive flooding.
Floodwaters between 2 and 15 feet (0.6 to 4.5 meters) caused significant damage to homes and businesses across
the state. In Nashville, floodwaters ravaged large sections of the downtown area and caused significant damage
exceeding USD2 billion in the city alone. Additional flooding occurred throughout Mississippi and Kentucky. Total
economic losses from both the severe weather and flooding surpassed USD3 billion. Insurers recorded more than
75,000 flood and severe weather claims, and industry estimates suggested that insured losses topped USD1.5 billion.
A strong storm system passed through parts of Ohio, New Jersey, Pennsylvania, and New York on the 7th and 8th.
According to the Storm Prediction Center, at least one tornado touched down and more than 100 reports of damaging
winds and large hail occurred. Total economic losses were listed at nearly USD200 million, while more than 17,500
claims were filed to insurers with losses totaling at least USD75 million.
A tornado outbreak occurred across southern Kansas, and central and eastern Oklahoma on the 10th, killing at least
five people and causing damage near Oklahoma City. At least 42 tornadoes touched down, with two that reached EF-
4 intensity and six that reached EF-3 intensity. Softball-sized hail and damaging winds were also reported with many
of the supercell thunderstorms. Total economic losses were estimated at USD1 billion, and various insurers reported
that more than 72,500 claims were filed totaling at least USD600 million.
Annual Global Climate and Catastrophe Report
26
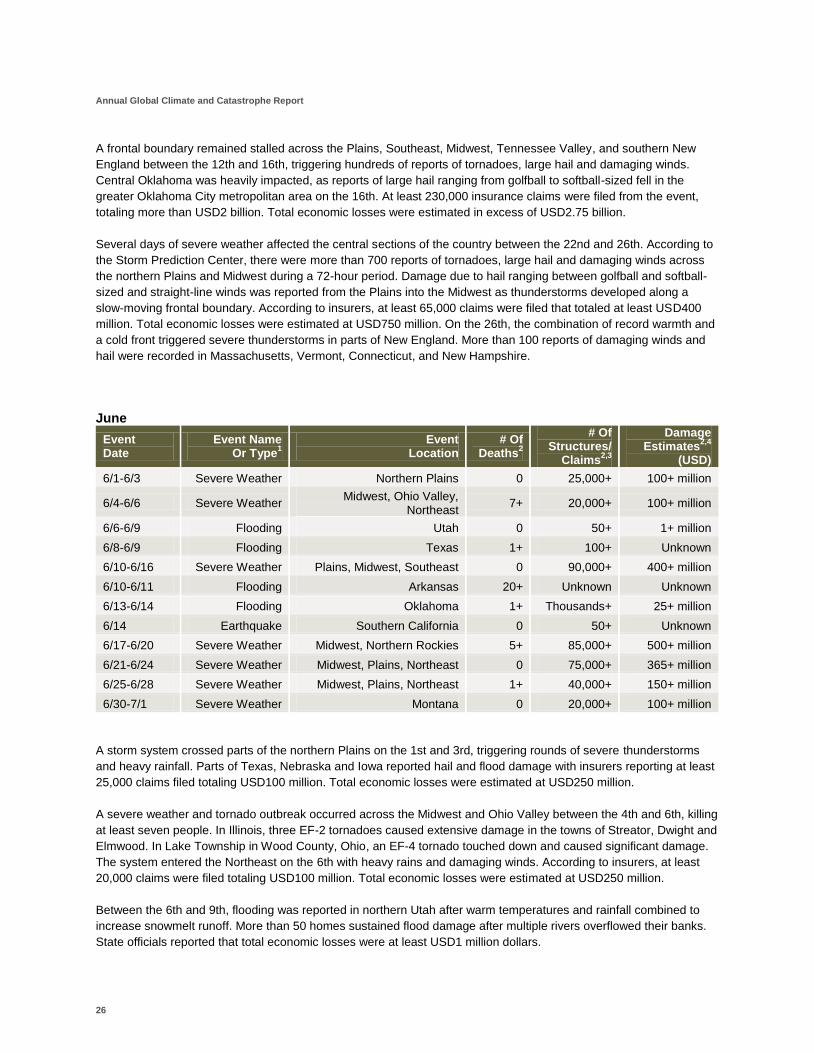
A frontal boundary remained stalled across the Plains, Southeast, Midwest, Tennessee Valley, and southern New
England between the 12th and 16th, triggering hundreds of reports of tornadoes, large hail and damaging winds.
Central Oklahoma was heavily impacted, as reports of large hail ranging from golfball to softball-sized fell in the
greater Oklahoma City metropolitan area on the 16th. At least 230,000 insurance claims were filed from the event,
totaling more than USD2 billion. Total economic losses were estimated in excess of USD2.75 billion.
Several days of severe weather affected the central sections of the country between the 22nd and 26th. According to
the Storm Prediction Center, there were more than 700 reports of tornadoes, large hail and damaging winds across
the northern Plains and Midwest during a 72-hour period. Damage due to hail ranging between golfball and softball-
sized and straight-line winds was reported from the Plains into the Midwest as thunderstorms developed along a
slow-moving frontal boundary. According to insurers, at least 65,000 claims were filed that totaled at least USD400
million. Total economic losses were estimated at USD750 million. On the 26th, the combination of record warmth and
a cold front triggered severe thunderstorms in parts of New England. More than 100 reports of damaging winds and
hail were recorded in Massachusetts, Vermont, Connecticut, and New Hampshire.
June
Event Date
Event Name Or Type
1
Event Location
# Of Deaths
2
# Of Structures/
Claims2,3
Damage Estimates
2,4
(USD)
6/1-6/3 Severe Weather Northern Plains 0 25,000+ 100+ million
6/4-6/6 Severe Weather Midwest, Ohio Valley,
Northeast 7+ 20,000+ 100+ million
6/6-6/9 Flooding Utah 0 50+ 1+ million
6/8-6/9 Flooding Texas 1+ 100+ Unknown
6/10-6/16 Severe Weather Plains, Midwest, Southeast 0 90,000+ 400+ million
6/10-6/11 Flooding Arkansas 20+ Unknown Unknown
6/13-6/14 Flooding Oklahoma 1+ Thousands+ 25+ million
6/14 Earthquake Southern California 0 50+ Unknown
6/17-6/20 Severe Weather Midwest, Northern Rockies 5+ 85,000+ 500+ million
6/21-6/24 Severe Weather Midwest, Plains, Northeast 0 75,000+ 365+ million
6/25-6/28 Severe Weather Midwest, Plains, Northeast 1+ 40,000+ 150+ million
6/30-7/1 Severe Weather Montana 0 20,000+ 100+ million
A storm system crossed parts of the northern Plains on the 1st and 3rd, triggering rounds of severe thunderstorms
and heavy rainfall. Parts of Texas, Nebraska and Iowa reported hail and flood damage with insurers reporting at least
25,000 claims filed totaling USD100 million. Total economic losses were estimated at USD250 million.
A severe weather and tornado outbreak occurred across the Midwest and Ohio Valley between the 4th and 6th, killing
at least seven people. In Illinois, three EF-2 tornadoes caused extensive damage in the towns of Streator, Dwight and
Elmwood. In Lake Township in Wood County, Ohio, an EF-4 tornado touched down and caused significant damage.
The system entered the Northeast on the 6th with heavy rains and damaging winds. According to insurers, at least
20,000 claims were filed totaling USD100 million. Total economic losses were estimated at USD250 million.
Between the 6th and 9th, flooding was reported in northern Utah after warm temperatures and rainfall combined to
increase snowmelt runoff. More than 50 homes sustained flood damage after multiple rivers overflowed their banks.
State officials reported that total economic losses were at least USD1 million dollars.
Aon Benfield: Impact Forecasting
27
A slow-moving storm system brought excessive rains across the greater San Antonio, Texas metropolitan area on the
8th and 9th, leaving at least one person dead. The heaviest rains were recorded across Comal and Guadalupe
counties as flood damage occurred to homes in the Rivercrest neighborhood in the New Braunfels region. Additional
business damage was also reported in the Gruene and Seguin areas.
Torrential rains led to flash flooding and the rapid rise of the Caddo and Little Missouri rivers in Arkansas on the 10th
and 11th. At least 20 people were killed and dozens more were injured in Caddo Gap at the Albert Pike Recreation
Area within the Ouachita National Forest. All of the fatalities occurred after fast-moving floodwaters raged through a
campsite area.
Several rounds of showers and thunderstorms along a stationary frontal boundary affected parts of the Plains,
Midwest and Southeast between the 10th and 16th. There were no fatalities, though damage occurred throughout
each region from tornadoes, damaging winds and large hail. Total economic losses were estimated at USD600
million, with insurers receiving more than 90,000 claims with payouts totaling at least USD400 million.
Heavy rains fell across parts of Oklahoma on the 13th and 14th, triggering widespread flash flooding throughout the
greater Oklahoma City metropolitan area. At least one person was killed and 136 others were injured after being
swept up in floodwaters. According to regional officials, the situation was deemed a 100-year storm event for
Oklahoma City. The majority of the damage was a result of localized flash flooding. In the downtown area, nearly
every building in the state capitol complex sustained flood damage. Additional damage was reported in the nearby
town of Edmund, and the transportation infrastructure sustained damage throughout central Oklahoma. Total
economic losses were in excess of USD25 million.
A magnitude-5.7 earthquake rattled southern California on the 14th with an epicenter five miles (eight kilometers)
east-southeast of Ocotillo, California. Residents throughout the region as far as San Diego reported shaking during
the main tremor, though damage reports were minimal. Approximately 50 homes and businesses sustained minor
damage, primarily due to fallen indoor objects.
A strong storm system spawned tornadoes, damaging winds and hail between the 17th and 20th across the Midwest
and Great Lakes, killing at least five people and injuring dozens more. In Minnesota on the 17th, significant tornado
damage was reported in the towns of Wadena, Almora and Mentor as dozens of tornadoes, including at least three
EF-4 twisters, touched down in association with a squall line along an advancing cold front. Additional damage was
reported as the line swept through parts of Iowa and Wisconsin. On the 18th and 19th, another significant severe
weather event occurred across the Midwest and Great Lakes. Two separate intense lines of thunderstorms moved
through Iowa, northern Illinois, southern Wisconsin, Indiana, and Michigan that caused widespread damage. On the
20th, another round of severe weather erupted in the northern Rockies, where an EF-2 tornado struck Billings,
Montana and caused significant damage to homes, businesses, an arena, and a casino. Total economic losses were
listed at USD600 million, with insurers receiving more than 85,000 claims with payouts totaling at least USD500
million.
Multiple areas of low pressure along a stationary front spawned severe weather across the Plains, Midwest, Great
Lakes, and western New England between the 21st and 24th. On the 21st, severe thunderstorms stretching from the
Plains through the Ohio Valley caused widespread damage. Insurers in Wisconsin processed at least 1,000 claims
from one tornado in southern parts of the state. On the 22nd, new clusters of severe thunderstorms spawned
tornadoes, large hail and straight-line wind damage from the Plains to southern New England. By the afternoon hours
on the 23rd, the city of Chicago dealt with winds gusting to 75 mph (125 kph) and flooding rains. As the main squall
line advanced through Illinois, Indiana, Michigan, and Ohio, additional damage reports came into local emergency
management offices. By the 24th, the storm system entered the Northeast as extremely gusty winds, including a gust
of 78 mph (125 kph), were recorded, while golfball-sized hail fell in parts of Queens, New York. In Bridgeport,
Connecticut, injuries were reported after a tornado caused heavy damage to several areas of the city. Total economic
losses were USD500 million, with insurers processing more than 75,000 claims totaling at least USD365 million.

Annual Global Climate and Catastrophe Report
28
Rounds of severe weather continued to inundate parts of the United States between the 25th and 28th, leaving at
least one person dead and dozens of others injured across the Plains and the Midwest. On the 25th, tornadoes
touched down in parts of Nebraska, Iowa and Minnesota. On the 26th, additional severe thunderstorms caused golf
ball-sized hail and high wind damage throughout the Plains and Midwest. On the 27th, tornado touchdowns were
recorded in Wisconsin, Michigan, Ohio, Pennsylvania, and New York, with southwest Michigan sustaining the
majority of the damage. At least one person was killed in St. Clair County as an EF-1 tornado destroyed dozens of
motor homes and vehicles. On the 28th, two tornadoes caused damage in the state of New York. Total economic
losses were estimated at USD225 million, with insurers receiving more than 40,000 claims totaling at least
USD150 million.
Clusters of severe thunderstorms brought golfball and baseball-sized hail on the 30th and July 1st to the Gallatin
Valley area of Montana. The city of Bozeman was severely impacted as thousands of homes and businesses
sustained damage from the storms. Total economic losses were estimated at USD175 million, with insurers receiving
more than 20,000 claims with payouts totaling at least USD100 million.
July
Event Date
Event Name Or Type
1
Event Location
# Of Deaths
2
# Of Structures/
Claims2,3
Damage Estimates
2,4
(USD)
7/1-7/10 Flooding Texas 0 2,000+ 40+ million
7/4-7/7 Heat Wave Northeast, Midwest,
Southeast 10+ Unknown Unknown
7/7 Earthquake Southern California 0 Dozens+ Unknown
7/10 Flooding Massachusetts 0 1,000+ 10+ million
7/10-7/16 Severe Weather Plains, Midwest, Southeast,
New England 0 Hundreds+ Millions+
7/17-7/18 Severe Weather Plains, Midwest, Southeast,
New England 2+ 25,000+ 250+ million
7/20-7/25 Severe Weather Plains, Midwest, Southeast,
New England 7+ 110,000+ 1+ billion
7/26 Severe Weather Montana 2+ Dozens+ Unknown
7/26-7/31 Wildfires Southern California 0 87+ 25+ million
Heavy rains following Hurricane Alex and additional precipitation from Tropical Depression Two caused flooding
along the Texas/Mexico border between the 1st and 10th. The Rio Grande River swelled and prompted evacuations
from Laredo to Brownsville. At least 2,000 homes, businesses and structures along the Rio Grande River sustained
damage and loss estimates were listed at USD40 million.
Four consecutive days of record-setting temperatures affected the eastern United States between the 4th and 7th,
killing at least 10 people. According to local National Weather Service offices, temperatures approached and
exceeded 100°F (37.7°C), prompting heat advisories in cities such as New York, Philadelphia, Baltimore,
and Charlotte.
A moderate earthquake rattled southern portions of California on the 7th, with no injuries or fatalities reported. The
magnitude-5.4 tremor struck at 4:53 PM local time (23:53 UTC) with an epicenter 15 miles (20 kilometers) north-
northwest of Borrego Springs, California at a depth of 8.7 miles (14 kilometers). The temblor was felt in San Diego
and Los Angeles, though no major damage occurred. In Borrego Springs and nearby Palm Springs, the earthquake
caused only minor cracks in façades.
Aon Benfield: Impact Forecasting
29
A torrential rainstorm on the 10th affected the greater Boston metropolitan area. According to the Boston National
Weather Service office, heavy rains caused rapid run-off, as floodwaters of up to 12 feet (3.6 meters) were reported
in tunnels and low overpasses. Damage occurred to vehicles, homes and an electrical substation. Total economic
losses were listed at more than USD10 million.
Severe thunderstorms affected the Plains, Midwest, Southeast, and New England along three separate slow-moving
frontal boundaries between the 10th and 16th. No fatalities were reported, though several storm-related injuries did
occur. Damage from the storm systems was caused by tornadoes, large hail and gusty winds. Total economic losses
from the week-long series of severe weather across the eastern United States were estimated in the tens of millions
of dollars (USD).
Multiple rounds of severe weather impacted the eastern two-thirds of the United States between the 17th and 18th,
leaving two people dead. On the 17th, severe weather occurred in the Midwest and Plains as softball-sized hail and
high winds affected parts of Minnesota and Iowa. Torrential rainfall along the front in Kentucky caused significant
damage in Pike County. On the 18th, additional severe weather brought damage to parts of Minnesota. Total
economic losses were listed at USD250 million, while insurers reported receiving at least 25,000 claims with payouts
totaling more than USD125 million.
Severe weather from the Rockies to New England was reported between the 20th and 25th. On the 22nd, significant
flooding caused USD28 million in damages to Milwaukee, Wisconsin. By the 23rd, clusters of thunderstorms crossed
Chicago, Illinois and left widespread river and flash flood damage. On the 24th the focus shifted to northeast Iowa,
where heavy rainfall led to the rapid rise of the Maquoketa River. The record crest caused a near-total failure of the
Lake Delhi dam with thousands of homes, businesses and a sewage treatment plant being damaged in the town of
Monticello. By the 25th, the severe weather shifted into the Mid-Atlantic States and New England. In Bronx County,
New York, a tornado struck the Riverdale area, while additional storms further south in the greater Washington, D.C.
metropolitan region led to structural damage and power outages. At least five people were killed. Total economic
losses were approximately USD1 billion, while insurers processed at least 110,000 claims with payouts totaling more
than USD600 million.
A rare tornado touched down in extreme northeastern Montana on the 26th. The twister destroyed several farms in
Sheridan County and killed at least two people.
Several wildfires broke out across southern portions of California between the 26th and 31st, including two in Kern
County and one in Los Angeles County. The most damaging wildfire, known as the West Fire, began on the 27th in
the Old West Ranch community. The blaze destroyed at least 64 homes and structures. The second fire in Kern
County, the Bull Fire, was ignited on the 26th in Sequoia National Forest. The blaze destroyed 14 homes and
structures in the Kernville area before being contained. On the 29th and 30th, the Crown Fire in Los Angeles County
destroyed at least nine homes and structures. Total insured losses were a combined USD23.4 million (including
USD10.2 million for the Bull Fire, USD6.7 million for the Crown Fire and USD6.5 million for the West Fire), with
economic losses listed at USD25 million.
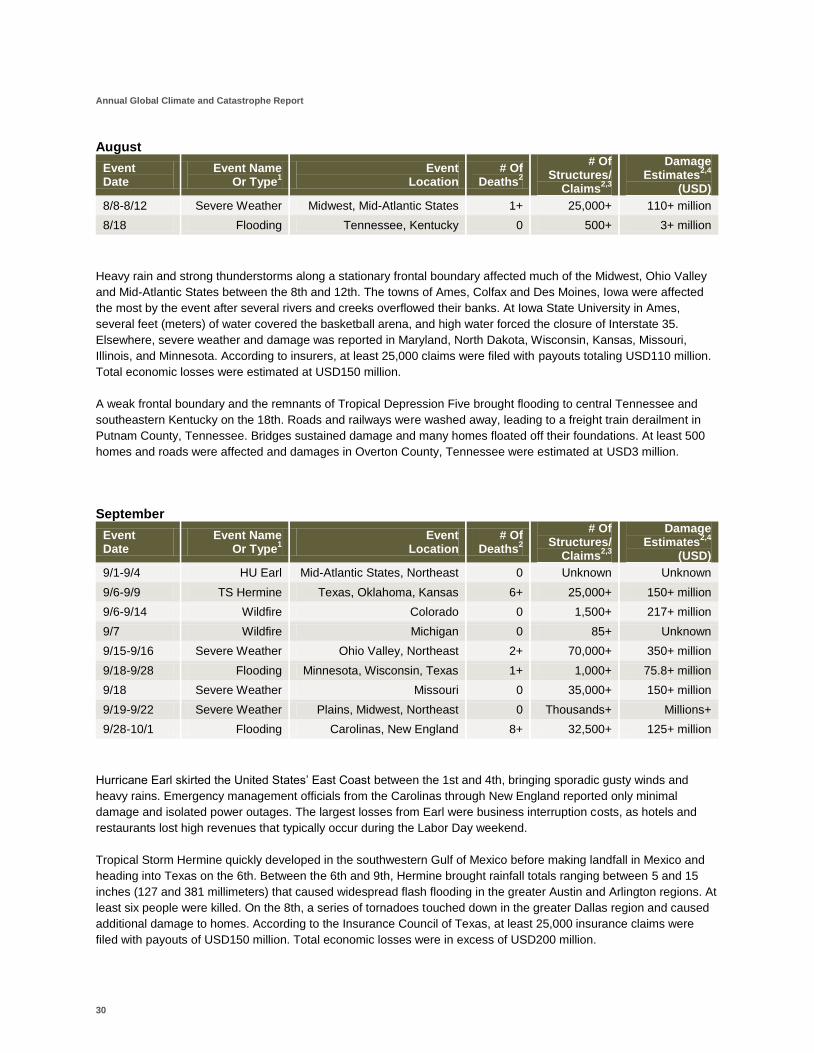
Annual Global Climate and Catastrophe Report
30
August
Event Date
Event Name Or Type
1
Event Location
# Of Deaths
2
# Of Structures/
Claims2,3
Damage Estimates
2,4
(USD)
8/8-8/12 Severe Weather Midwest, Mid-Atlantic States 1+ 25,000+ 110+ million
8/18 Flooding Tennessee, Kentucky 0 500+ 3+ million
Heavy rain and strong thunderstorms along a stationary frontal boundary affected much of the Midwest, Ohio Valley
and Mid-Atlantic States between the 8th and 12th. The towns of Ames, Colfax and Des Moines, Iowa were affected
the most by the event after several rivers and creeks overflowed their banks. At Iowa State University in Ames,
several feet (meters) of water covered the basketball arena, and high water forced the closure of Interstate 35.
Elsewhere, severe weather and damage was reported in Maryland, North Dakota, Wisconsin, Kansas, Missouri,
Illinois, and Minnesota. According to insurers, at least 25,000 claims were filed with payouts totaling USD110 million.
Total economic losses were estimated at USD150 million.
A weak frontal boundary and the remnants of Tropical Depression Five brought flooding to central Tennessee and
southeastern Kentucky on the 18th. Roads and railways were washed away, leading to a freight train derailment in
Putnam County, Tennessee. Bridges sustained damage and many homes floated off their foundations. At least 500
homes and roads were affected and damages in Overton County, Tennessee were estimated at USD3 million.
September
Event Date
Event Name Or Type
1
Event Location
# Of Deaths
2
# Of Structures/
Claims2,3
Damage Estimates
2,4
(USD)
9/1-9/4 HU Earl Mid-Atlantic States, Northeast 0 Unknown Unknown
9/6-9/9 TS Hermine Texas, Oklahoma, Kansas 6+ 25,000+ 150+ million
9/6-9/14 Wildfire Colorado 0 1,500+ 217+ million
9/7 Wildfire Michigan 0 85+ Unknown
9/15-9/16 Severe Weather Ohio Valley, Northeast 2+ 70,000+ 350+ million
9/18-9/28 Flooding Minnesota, Wisconsin, Texas 1+ 1,000+ 75.8+ million
9/18 Severe Weather Missouri 0 35,000+ 150+ million
9/19-9/22 Severe Weather Plains, Midwest, Northeast 0 Thousands+ Millions+
9/28-10/1 Flooding Carolinas, New England 8+ 32,500+ 125+ million
Hurricane Earl skirted the United States’ East Coast between the 1st and 4th, bringing sporadic gusty winds and
heavy rains. Emergency management officials from the Carolinas through New England reported only minimal
damage and isolated power outages. The largest losses from Earl were business interruption costs, as hotels and
restaurants lost high revenues that typically occur during the Labor Day weekend.
Tropical Storm Hermine quickly developed in the southwestern Gulf of Mexico before making landfall in Mexico and
heading into Texas on the 6th. Between the 6th and 9th, Hermine brought rainfall totals ranging between 5 and 15
inches (127 and 381 millimeters) that caused widespread flash flooding in the greater Austin and Arlington regions. At
least six people were killed. On the 8th, a series of tornadoes touched down in the greater Dallas region and caused
additional damage to homes. According to the Insurance Council of Texas, at least 25,000 insurance claims were
filed with payouts of USD150 million. Total economic losses were in excess of USD200 million.
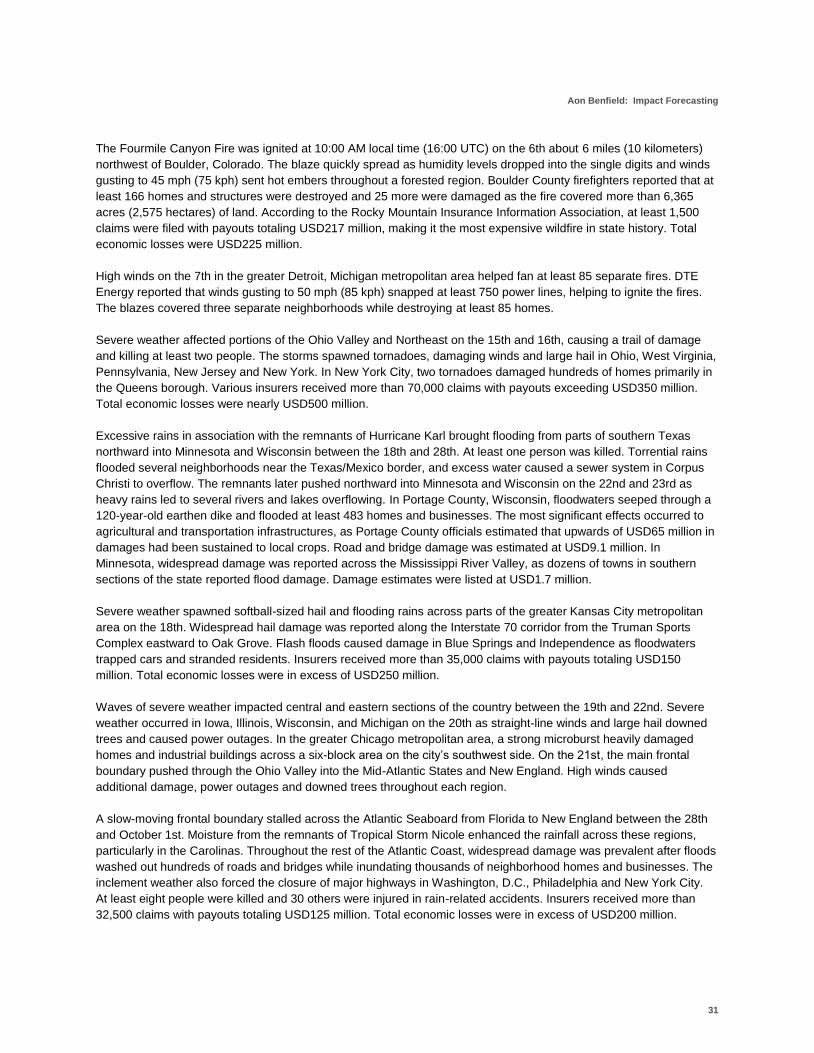
Aon Benfield: Impact Forecasting
31
The Fourmile Canyon Fire was ignited at 10:00 AM local time (16:00 UTC) on the 6th about 6 miles (10 kilometers)
northwest of Boulder, Colorado. The blaze quickly spread as humidity levels dropped into the single digits and winds
gusting to 45 mph (75 kph) sent hot embers throughout a forested region. Boulder County firefighters reported that at
least 166 homes and structures were destroyed and 25 more were damaged as the fire covered more than 6,365
acres (2,575 hectares) of land. According to the Rocky Mountain Insurance Information Association, at least 1,500
claims were filed with payouts totaling USD217 million, making it the most expensive wildfire in state history. Total
economic losses were USD225 million.
High winds on the 7th in the greater Detroit, Michigan metropolitan area helped fan at least 85 separate fires. DTE
Energy reported that winds gusting to 50 mph (85 kph) snapped at least 750 power lines, helping to ignite the fires.
The blazes covered three separate neighborhoods while destroying at least 85 homes.
Severe weather affected portions of the Ohio Valley and Northeast on the 15th and 16th, causing a trail of damage
and killing at least two people. The storms spawned tornadoes, damaging winds and large hail in Ohio, West Virginia,
Pennsylvania, New Jersey and New York. In New York City, two tornadoes damaged hundreds of homes primarily in
the Queens borough. Various insurers received more than 70,000 claims with payouts exceeding USD350 million.
Total economic losses were nearly USD500 million.
Excessive rains in association with the remnants of Hurricane Karl brought flooding from parts of southern Texas
northward into Minnesota and Wisconsin between the 18th and 28th. At least one person was killed. Torrential rains
flooded several neighborhoods near the Texas/Mexico border, and excess water caused a sewer system in Corpus
Christi to overflow. The remnants later pushed northward into Minnesota and Wisconsin on the 22nd and 23rd as
heavy rains led to several rivers and lakes overflowing. In Portage County, Wisconsin, floodwaters seeped through a
120-year-old earthen dike and flooded at least 483 homes and businesses. The most significant effects occurred to
agricultural and transportation infrastructures, as Portage County officials estimated that upwards of USD65 million in
damages had been sustained to local crops. Road and bridge damage was estimated at USD9.1 million. In
Minnesota, widespread damage was reported across the Mississippi River Valley, as dozens of towns in southern
sections of the state reported flood damage. Damage estimates were listed at USD1.7 million.
Severe weather spawned softball-sized hail and flooding rains across parts of the greater Kansas City metropolitan
area on the 18th. Widespread hail damage was reported along the Interstate 70 corridor from the Truman Sports
Complex eastward to Oak Grove. Flash floods caused damage in Blue Springs and Independence as floodwaters
trapped cars and stranded residents. Insurers received more than 35,000 claims with payouts totaling USD150
million. Total economic losses were in excess of USD250 million.
Waves of severe weather impacted central and eastern sections of the country between the 19th and 22nd. Severe
weather occurred in Iowa, Illinois, Wisconsin, and Michigan on the 20th as straight-line winds and large hail downed
trees and caused power outages. In the greater Chicago metropolitan area, a strong microburst heavily damaged
homes and industrial buildings across a six-block area on the city’s southwest side. On the 21st, the main frontal
boundary pushed through the Ohio Valley into the Mid-Atlantic States and New England. High winds caused
additional damage, power outages and downed trees throughout each region.
A slow-moving frontal boundary stalled across the Atlantic Seaboard from Florida to New England between the 28th
and October 1st. Moisture from the remnants of Tropical Storm Nicole enhanced the rainfall across these regions,
particularly in the Carolinas. Throughout the rest of the Atlantic Coast, widespread damage was prevalent after floods
washed out hundreds of roads and bridges while inundating thousands of neighborhood homes and businesses. The
inclement weather also forced the closure of major highways in Washington, D.C., Philadelphia and New York City.
At least eight people were killed and 30 others were injured in rain-related accidents. Insurers received more than
32,500 claims with payouts totaling USD125 million. Total economic losses were in excess of USD200 million.
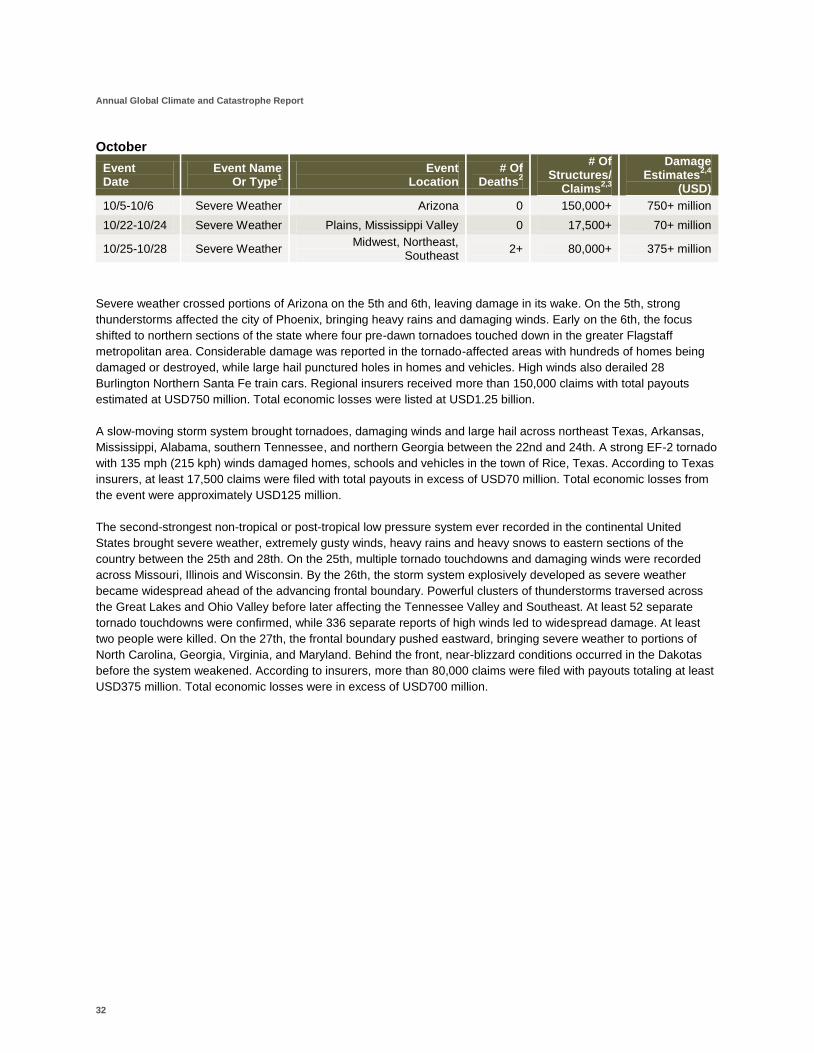
Annual Global Climate and Catastrophe Report
32
October
Event Date
Event Name Or Type
1
Event Location
# Of Deaths
2
# Of Structures/
Claims2,3
Damage Estimates
2,4
(USD)
10/5-10/6 Severe Weather Arizona 0 150,000+ 750+ million
10/22-10/24 Severe Weather Plains, Mississippi Valley 0 17,500+ 70+ million
10/25-10/28 Severe Weather Midwest, Northeast,
Southeast 2+ 80,000+ 375+ million
Severe weather crossed portions of Arizona on the 5th and 6th, leaving damage in its wake. On the 5th, strong
thunderstorms affected the city of Phoenix, bringing heavy rains and damaging winds. Early on the 6th, the focus
shifted to northern sections of the state where four pre-dawn tornadoes touched down in the greater Flagstaff
metropolitan area. Considerable damage was reported in the tornado-affected areas with hundreds of homes being
damaged or destroyed, while large hail punctured holes in homes and vehicles. High winds also derailed 28
Burlington Northern Santa Fe train cars. Regional insurers received more than 150,000 claims with total payouts
estimated at USD750 million. Total economic losses were listed at USD1.25 billion.
A slow-moving storm system brought tornadoes, damaging winds and large hail across northeast Texas, Arkansas,
Mississippi, Alabama, southern Tennessee, and northern Georgia between the 22nd and 24th. A strong EF-2 tornado
with 135 mph (215 kph) winds damaged homes, schools and vehicles in the town of Rice, Texas. According to Texas
insurers, at least 17,500 claims were filed with total payouts in excess of USD70 million. Total economic losses from
the event were approximately USD125 million.
The second-strongest non-tropical or post-tropical low pressure system ever recorded in the continental United
States brought severe weather, extremely gusty winds, heavy rains and heavy snows to eastern sections of the
country between the 25th and 28th. On the 25th, multiple tornado touchdowns and damaging winds were recorded
across Missouri, Illinois and Wisconsin. By the 26th, the storm system explosively developed as severe weather
became widespread ahead of the advancing frontal boundary. Powerful clusters of thunderstorms traversed across
the Great Lakes and Ohio Valley before later affecting the Tennessee Valley and Southeast. At least 52 separate
tornado touchdowns were confirmed, while 336 separate reports of high winds led to widespread damage. At least
two people were killed. On the 27th, the frontal boundary pushed eastward, bringing severe weather to portions of
North Carolina, Georgia, Virginia, and Maryland. Behind the front, near-blizzard conditions occurred in the Dakotas
before the system weakened. According to insurers, more than 80,000 claims were filed with payouts totaling at least
USD375 million. Total economic losses were in excess of USD700 million.
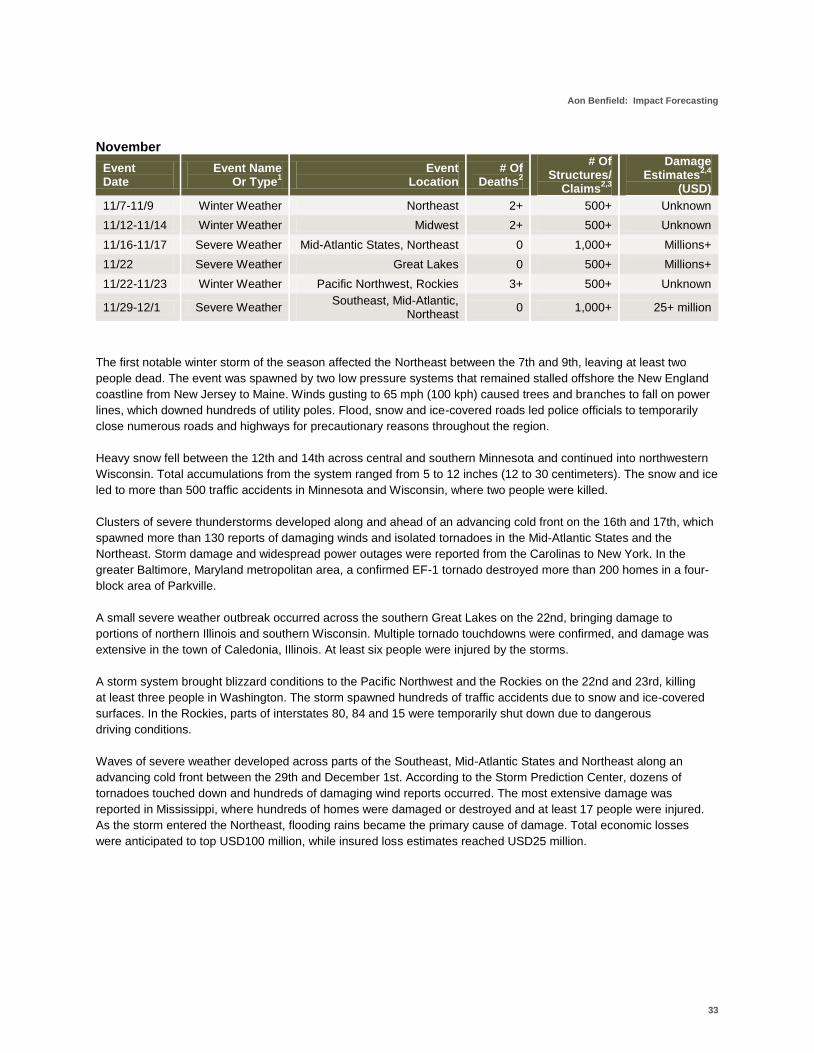
Aon Benfield: Impact Forecasting
33
November
Event Date
Event Name Or Type
1
Event Location
# Of Deaths
2
# Of Structures/
Claims2,3
Damage Estimates
2,4
(USD)
11/7-11/9 Winter Weather Northeast 2+ 500+ Unknown
11/12-11/14 Winter Weather Midwest 2+ 500+ Unknown
11/16-11/17 Severe Weather Mid-Atlantic States, Northeast 0 1,000+ Millions+
11/22 Severe Weather Great Lakes 0 500+ Millions+
11/22-11/23 Winter Weather Pacific Northwest, Rockies 3+ 500+ Unknown
11/29-12/1 Severe Weather Southeast, Mid-Atlantic,
Northeast 0 1,000+ 25+ million
The first notable winter storm of the season affected the Northeast between the 7th and 9th, leaving at least two
people dead. The event was spawned by two low pressure systems that remained stalled offshore the New England
coastline from New Jersey to Maine. Winds gusting to 65 mph (100 kph) caused trees and branches to fall on power
lines, which downed hundreds of utility poles. Flood, snow and ice-covered roads led police officials to temporarily
close numerous roads and highways for precautionary reasons throughout the region.
Heavy snow fell between the 12th and 14th across central and southern Minnesota and continued into northwestern
Wisconsin. Total accumulations from the system ranged from 5 to 12 inches (12 to 30 centimeters). The snow and ice
led to more than 500 traffic accidents in Minnesota and Wisconsin, where two people were killed.
Clusters of severe thunderstorms developed along and ahead of an advancing cold front on the 16th and 17th, which
spawned more than 130 reports of damaging winds and isolated tornadoes in the Mid-Atlantic States and the
Northeast. Storm damage and widespread power outages were reported from the Carolinas to New York. In the
greater Baltimore, Maryland metropolitan area, a confirmed EF-1 tornado destroyed more than 200 homes in a four-
block area of Parkville.
A small severe weather outbreak occurred across the southern Great Lakes on the 22nd, bringing damage to
portions of northern Illinois and southern Wisconsin. Multiple tornado touchdowns were confirmed, and damage was
extensive in the town of Caledonia, Illinois. At least six people were injured by the storms.
A storm system brought blizzard conditions to the Pacific Northwest and the Rockies on the 22nd and 23rd, killing
at least three people in Washington. The storm spawned hundreds of traffic accidents due to snow and ice-covered
surfaces. In the Rockies, parts of interstates 80, 84 and 15 were temporarily shut down due to dangerous
driving conditions.
Waves of severe weather developed across parts of the Southeast, Mid-Atlantic States and Northeast along an
advancing cold front between the 29th and December 1st. According to the Storm Prediction Center, dozens of
tornadoes touched down and hundreds of damaging wind reports occurred. The most extensive damage was
reported in Mississippi, where hundreds of homes were damaged or destroyed and at least 17 people were injured.
As the storm entered the Northeast, flooding rains became the primary cause of damage. Total economic losses
were anticipated to top USD100 million, while insured loss estimates reached USD25 million.

Annual Global Climate and Catastrophe Report
34
December
Event Date
Event Name Or Type
1
Event Location
# Of Deaths
2
# Of Structures/
Claims2,3
Damage Estimates
2,4
(USD)
12/4-12/9 Winter Weather Great Lakes, New England,
Southeast 0 Hundreds+ Unknown
12/10-12/13 Winter Weather Midwest, Ohio Valley,
Northeast 4+ Hundreds+ Unknown
12/10-12/12 Flooding Pacific Northwest 0 Hundreds+ Unknown
Persistent rounds of heavy snow fell across parts of the Great Lakes and New England between the 4th and 9th,
causing damage, hundreds of traffic accidents and power outages. Parts of upstate New York received nearly five
feet (152 centimeters) of lake effect snow, while lesser amounts were reported along lakes Ontario and Erie. The
same storm system also brought record cold across parts of the Southeast, which threatened citrus crops in Florida.
A powerful winter storm swept across the northern U.S. between the 10th and the 13th, bringing heavy snow, rain,
extremely gusty winds and arctic air to the Midwest, Ohio Valley and the Northeast. At least four people died in storm
related accidents as ice and snow led to travel chaos. Major airports in Chicago, Minneapolis, Detroit, and Cleveland
reported thousands of flight cancellations, while several major interstates were temporarily shut down due to
dangerous driving conditions. Widespread damage was reported throughout the affected states, including in
Minneapolis, Minnesota, where the roof collapsed at the downtown professional football stadium.
An active jet stream brought record rains and snow to the Pacific Northwest between the 10th and the 12th. The
precipitation forced dozens of rivers to swell and overflow their banks, flooding hundreds of homes and roads.
Snohomish County in the state of Washington sustained the worst affects from the precipitation. Additional damage
occurred from landslides across valleys and in some residential and urban areas. The slides also stalled rail
transportation (including Burlington Northern Santa Fe and Amtrak service) after mud covered tracks.
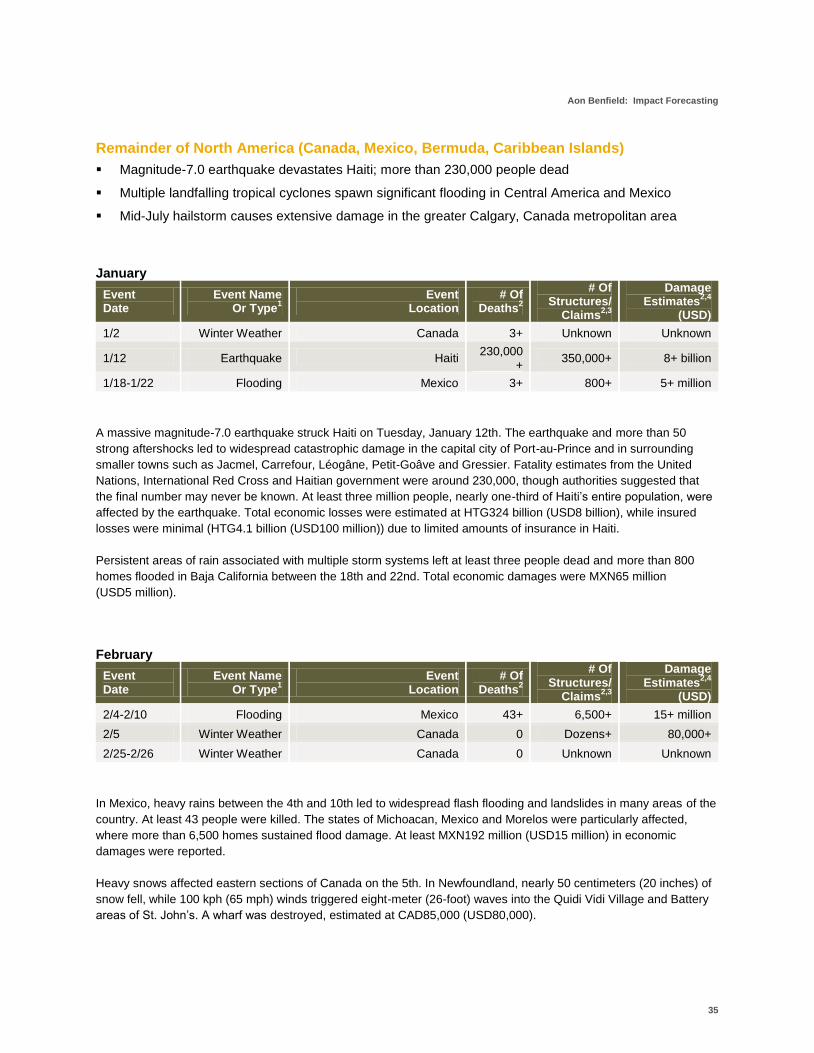
Aon Benfield: Impact Forecasting
35
Remainder of North America (Canada, Mexico, Bermuda, Caribbean Islands)
Magnitude-7.0 earthquake devastates Haiti; more than 230,000 people dead
Multiple landfalling tropical cyclones spawn significant flooding in Central America and Mexico
Mid-July hailstorm causes extensive damage in the greater Calgary, Canada metropolitan area
January
Event Date
Event Name Or Type
1
Event Location
# Of Deaths
2
# Of Structures/
Claims2,3
Damage Estimates
2,4
(USD)
1/2 Winter Weather Canada 3+ Unknown Unknown
1/12 Earthquake Haiti 230,000
+ 350,000+ 8+ billion
1/18-1/22 Flooding Mexico 3+ 800+ 5+ million
A massive magnitude-7.0 earthquake struck Haiti on Tuesday, January 12th. The earthquake and more than 50
strong aftershocks led to widespread catastrophic damage in the capital city of Port-au-Prince and in surrounding
smaller towns such as Jacmel, Carrefour, Léogâne, Petit-Goâve and Gressier. Fatality estimates from the United
Nations, International Red Cross and Haitian government were around 230,000, though authorities suggested that
the final number may never be known. At least three million people, nearly one-third of Haiti’s entire population, were
affected by the earthquake. Total economic losses were estimated at HTG324 billion (USD8 billion), while insured
losses were minimal (HTG4.1 billion (USD100 million)) due to limited amounts of insurance in Haiti.
Persistent areas of rain associated with multiple storm systems left at least three people dead and more than 800
homes flooded in Baja California between the 18th and 22nd. Total economic damages were MXN65 million
(USD5 million).
February
Event Date
Event Name Or Type
1
Event Location
# Of Deaths
2
# Of Structures/
Claims2,3
Damage Estimates
2,4
(USD)
2/4-2/10 Flooding Mexico 43+ 6,500+ 15+ million
2/5 Winter Weather Canada 0 Dozens+ 80,000+
2/25-2/26 Winter Weather Canada 0 Unknown Unknown
In Mexico, heavy rains between the 4th and 10th led to widespread flash flooding and landslides in many areas of the
country. At least 43 people were killed. The states of Michoacan, Mexico and Morelos were particularly affected,
where more than 6,500 homes sustained flood damage. At least MXN192 million (USD15 million) in economic
damages were reported.
Heavy snows affected eastern sections of Canada on the 5th. In Newfoundland, nearly 50 centimeters (20 inches) of
snow fell, while 100 kph (65 mph) winds triggered eight-meter (26-foot) waves into the Quidi Vidi Village and Battery
areas of St. John’s. A wharf was destroyed, estimated at CAD85,000 (USD80,000).
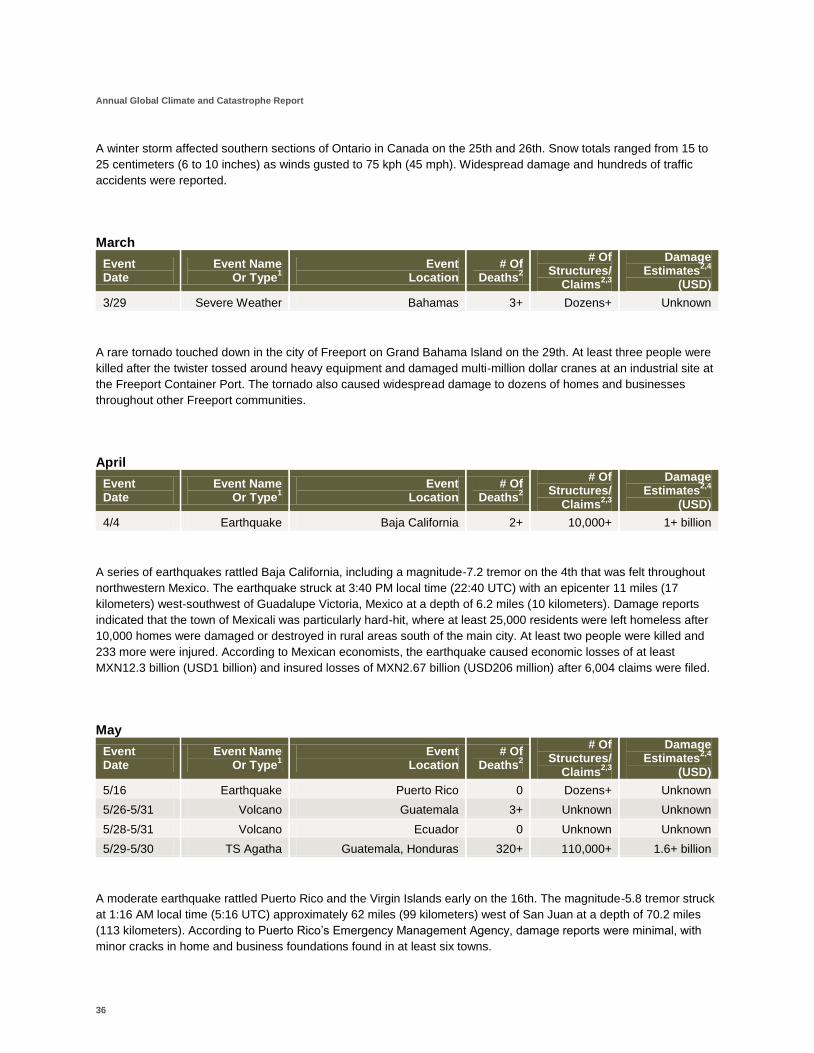
Annual Global Climate and Catastrophe Report
36
A winter storm affected southern sections of Ontario in Canada on the 25th and 26th. Snow totals ranged from 15 to
25 centimeters (6 to 10 inches) as winds gusted to 75 kph (45 mph). Widespread damage and hundreds of traffic
accidents were reported.
March
Event Date
Event Name Or Type
1
Event Location
# Of Deaths
2
# Of Structures/
Claims2,3
Damage Estimates
2,4
(USD)
3/29 Severe Weather Bahamas 3+ Dozens+ Unknown
A rare tornado touched down in the city of Freeport on Grand Bahama Island on the 29th. At least three people were
killed after the twister tossed around heavy equipment and damaged multi-million dollar cranes at an industrial site at
the Freeport Container Port. The tornado also caused widespread damage to dozens of homes and businesses
throughout other Freeport communities.
April
Event Date
Event Name Or Type
1
Event Location
# Of Deaths
2
# Of Structures/
Claims2,3
Damage Estimates
2,4
(USD)
4/4 Earthquake Baja California 2+ 10,000+ 1+ billion
A series of earthquakes rattled Baja California, including a magnitude-7.2 tremor on the 4th that was felt throughout
northwestern Mexico. The earthquake struck at 3:40 PM local time (22:40 UTC) with an epicenter 11 miles (17
kilometers) west-southwest of Guadalupe Victoria, Mexico at a depth of 6.2 miles (10 kilometers). Damage reports
indicated that the town of Mexicali was particularly hard-hit, where at least 25,000 residents were left homeless after
10,000 homes were damaged or destroyed in rural areas south of the main city. At least two people were killed and
233 more were injured. According to Mexican economists, the earthquake caused economic losses of at least
MXN12.3 billion (USD1 billion) and insured losses of MXN2.67 billion (USD206 million) after 6,004 claims were filed.
May
Event Date
Event Name Or Type
1
Event Location
# Of Deaths
2
# Of Structures/
Claims2,3
Damage Estimates
2,4
(USD)
5/16 Earthquake Puerto Rico 0 Dozens+ Unknown
5/26-5/31 Volcano Guatemala 3+ Unknown Unknown
5/28-5/31 Volcano Ecuador 0 Unknown Unknown
5/29-5/30 TS Agatha Guatemala, Honduras 320+ 110,000+ 1.6+ billion
A moderate earthquake rattled Puerto Rico and the Virgin Islands early on the 16th. The magnitude-5.8 tremor struck
at 1:16 AM local time (5:16 UTC) approximately 62 miles (99 kilometers) west of San Juan at a depth of 70.2 miles
(113 kilometers). According to Puerto Rico’s Emergency Management Agency, damage reports were minimal, with
minor cracks in home and business foundations found in at least six towns.
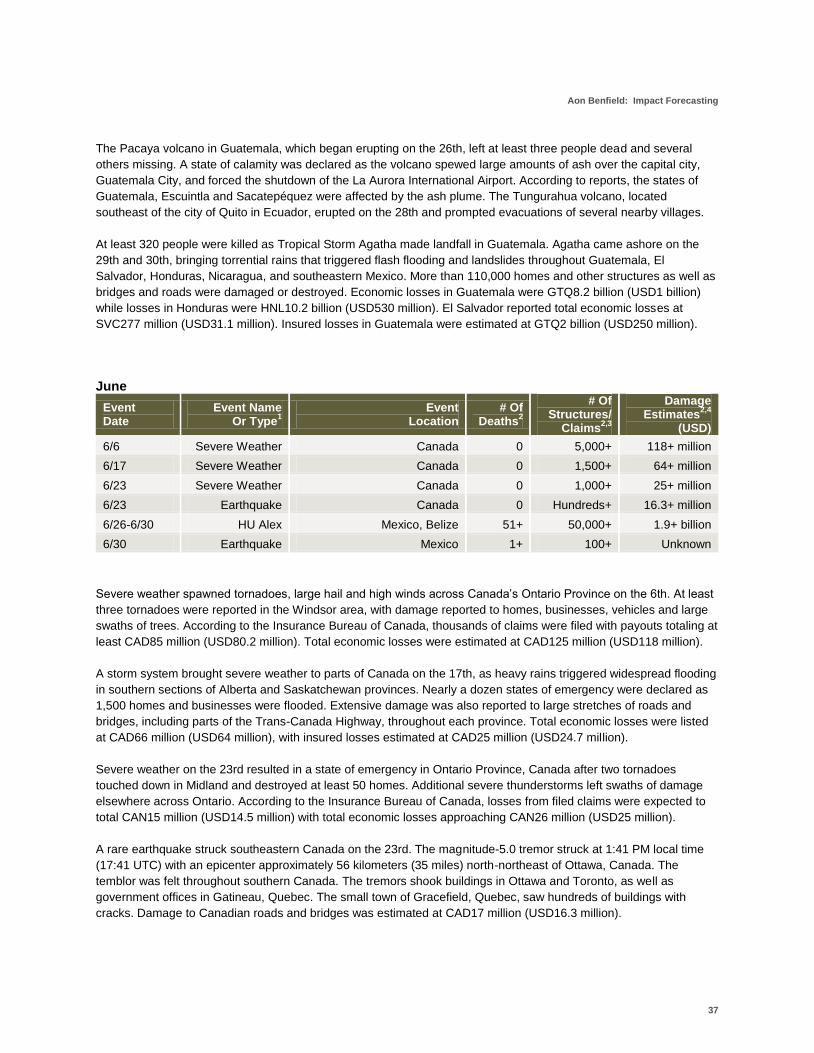
Aon Benfield: Impact Forecasting
37
The Pacaya volcano in Guatemala, which began erupting on the 26th, left at least three people dead and several
others missing. A state of calamity was declared as the volcano spewed large amounts of ash over the capital city,
Guatemala City, and forced the shutdown of the La Aurora International Airport. According to reports, the states of
Guatemala, Escuintla and Sacatepéquez were affected by the ash plume. The Tungurahua volcano, located
southeast of the city of Quito in Ecuador, erupted on the 28th and prompted evacuations of several nearby villages.
At least 320 people were killed as Tropical Storm Agatha made landfall in Guatemala. Agatha came ashore on the
29th and 30th, bringing torrential rains that triggered flash flooding and landslides throughout Guatemala, El
Salvador, Honduras, Nicaragua, and southeastern Mexico. More than 110,000 homes and other structures as well as
bridges and roads were damaged or destroyed. Economic losses in Guatemala were GTQ8.2 billion (USD1 billion)
while losses in Honduras were HNL10.2 billion (USD530 million). El Salvador reported total economic losses at
SVC277 million (USD31.1 million). Insured losses in Guatemala were estimated at GTQ2 billion (USD250 million).
June
Event Date
Event Name Or Type
1
Event Location
# Of Deaths
2
# Of Structures/
Claims2,3
Damage Estimates
2,4
(USD)
6/6 Severe Weather Canada 0 5,000+ 118+ million
6/17 Severe Weather Canada 0 1,500+ 64+ million
6/23 Severe Weather Canada 0 1,000+ 25+ million
6/23 Earthquake Canada 0 Hundreds+ 16.3+ million
6/26-6/30 HU Alex Mexico, Belize 51+ 50,000+ 1.9+ billion
6/30 Earthquake Mexico 1+ 100+ Unknown
Severe weather spawned tornadoes, large hail and high winds across Canada’s Ontario Province on the 6th. At least
three tornadoes were reported in the Windsor area, with damage reported to homes, businesses, vehicles and large
swaths of trees. According to the Insurance Bureau of Canada, thousands of claims were filed with payouts totaling at
least CAD85 million (USD80.2 million). Total economic losses were estimated at CAD125 million (USD118 million).
A storm system brought severe weather to parts of Canada on the 17th, as heavy rains triggered widespread flooding
in southern sections of Alberta and Saskatchewan provinces. Nearly a dozen states of emergency were declared as
1,500 homes and businesses were flooded. Extensive damage was also reported to large stretches of roads and
bridges, including parts of the Trans-Canada Highway, throughout each province. Total economic losses were listed
at CAD66 million (USD64 million), with insured losses estimated at CAD25 million (USD24.7 million).
Severe weather on the 23rd resulted in a state of emergency in Ontario Province, Canada after two tornadoes
touched down in Midland and destroyed at least 50 homes. Additional severe thunderstorms left swaths of damage
elsewhere across Ontario. According to the Insurance Bureau of Canada, losses from filed claims were expected to
total CAN15 million (USD14.5 million) with total economic losses approaching CAN26 million (USD25 million).
A rare earthquake struck southeastern Canada on the 23rd. The magnitude-5.0 tremor struck at 1:41 PM local time
(17:41 UTC) with an epicenter approximately 56 kilometers (35 miles) north-northeast of Ottawa, Canada. The
temblor was felt throughout southern Canada. The tremors shook buildings in Ottawa and Toronto, as well as
government offices in Gatineau, Quebec. The small town of Gracefield, Quebec, saw hundreds of buildings with
cracks. Damage to Canadian roads and bridges was estimated at CAD17 million (USD16.3 million).
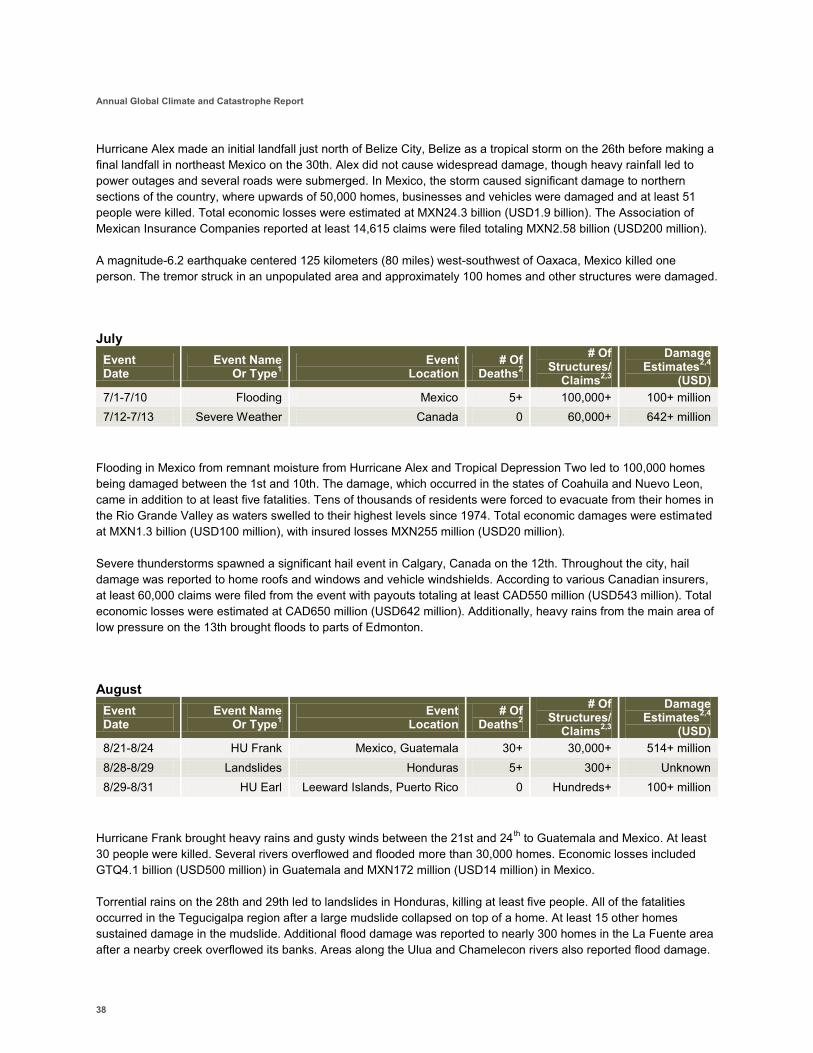
Annual Global Climate and Catastrophe Report
38
Hurricane Alex made an initial landfall just north of Belize City, Belize as a tropical storm on the 26th before making a final landfall in northeast Mexico on the 30th. Alex did not cause widespread damage, though heavy rainfall led to power outages and several roads were submerged. In Mexico, the storm caused significant damage to northern sections of the country, where upwards of 50,000 homes, businesses and vehicles were damaged and at least 51 people were killed. Total economic losses were estimated at MXN24.3 billion (USD1.9 billion). The Association of Mexican Insurance Companies reported at least 14,615 claims were filed totaling MXN2.58 billion (USD200 million).
A magnitude-6.2 earthquake centered 125 kilometers (80 miles) west-southwest of Oaxaca, Mexico killed one person. The tremor struck in an unpopulated area and approximately 100 homes and other structures were damaged.
July Event Date
Event Name Or Type1
Event Location
# Of Deaths2
# Of Structures/
Claims2,3
Damage Estimates2,4
(USD) 7/1-7/10 Flooding Mexico 5+ 100,000+ 100+ million 7/12-7/13 Severe Weather Canada 0 60,000+ 642+ million
Flooding in Mexico from remnant moisture from Hurricane Alex and Tropical Depression Two led to 100,000 homes being damaged between the 1st and 10th. The damage, which occurred in the states of Coahuila and Nuevo Leon, came in addition to at least five fatalities. Tens of thousands of residents were forced to evacuate from their homes in the Rio Grande Valley as waters swelled to their highest levels since 1974. Total economic damages were estimated at MXN1.3 billion (USD100 million), with insured losses MXN255 million (USD20 million).
Severe thunderstorms spawned a significant hail event in Calgary, Canada on the 12th. Throughout the city, hail damage was reported to home roofs and windows and vehicle windshields. According to various Canadian insurers, at least 60,000 claims were filed from the event with payouts totaling at least CAD550 million (USD543 million). Total economic losses were estimated at CAD650 million (USD642 million). Additionally, heavy rains from the main area of low pressure on the 13th brought floods to parts of Edmonton.
August Event Date
Event Name Or Type1
Event Location
# Of Deaths2
# Of Structures/
Claims2,3
Damage Estimates2,4
(USD) 8/21-8/24 HU Frank Mexico, Guatemala 30+ 30,000+ 514+ million 8/28-8/29 Landslides Honduras 5+ 300+ Unknown 8/29-8/31 HU Earl Leeward Islands, Puerto Rico 0 Hundreds+ 100+ million
Hurricane Frank brought heavy rains and gusty winds between the 21st and 24th to Guatemala and Mexico. At least 30 people were killed. Several rivers overflowed and flooded more than 30,000 homes. Economic losses included GTQ4.1 billion (USD500 million) in Guatemala and MXN172 million (USD14 million) in Mexico.
Torrential rains on the 28th and 29th led to landslides in Honduras, killing at least five people. All of the fatalities occurred in the Tegucigalpa region after a large mudslide collapsed on top of a home. At least 15 other homes sustained damage in the mudslide. Additional flood damage was reported to nearly 300 homes in the La Fuente area after a nearby creek overflowed its banks. Areas along the Ulua and Chamelecon rivers also reported flood damage.
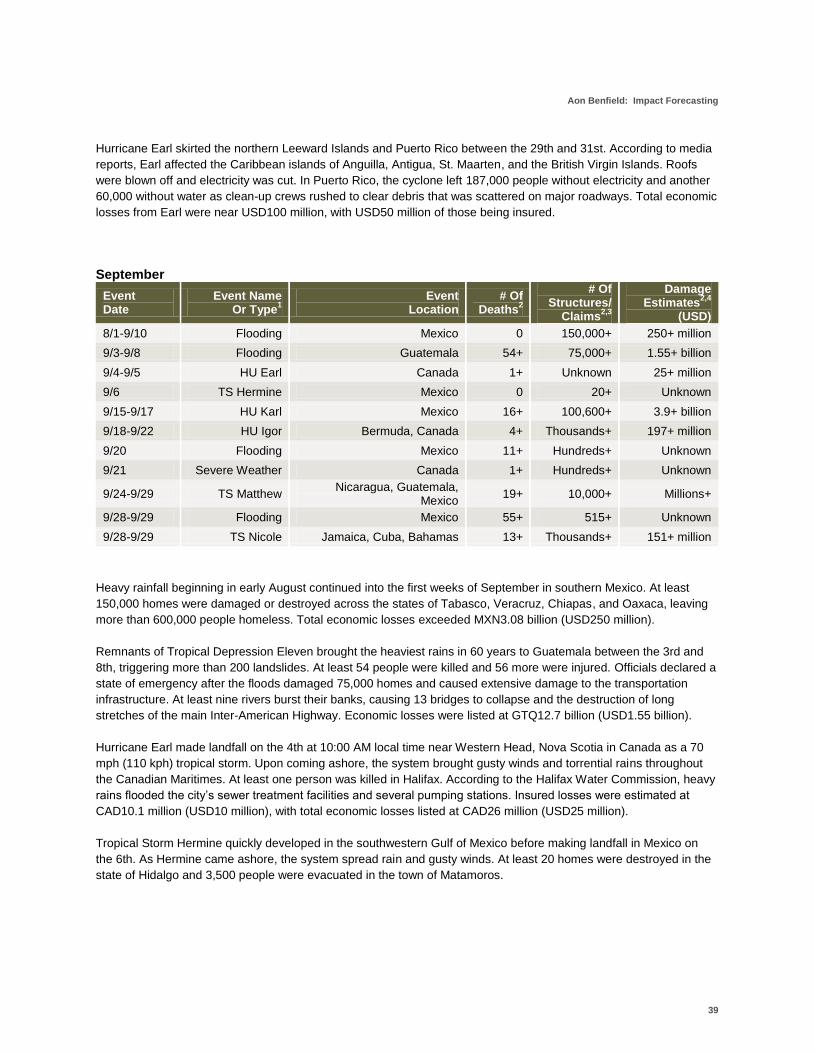
Aon Benfield: Impact Forecasting
39
Hurricane Earl skirted the northern Leeward Islands and Puerto Rico between the 29th and 31st. According to media
reports, Earl affected the Caribbean islands of Anguilla, Antigua, St. Maarten, and the British Virgin Islands. Roofs
were blown off and electricity was cut. In Puerto Rico, the cyclone left 187,000 people without electricity and another
60,000 without water as clean-up crews rushed to clear debris that was scattered on major roadways. Total economic
losses from Earl were near USD100 million, with USD50 million of those being insured.
September
Event Date
Event Name Or Type
1
Event Location
# Of Deaths
2
# Of Structures/
Claims2,3
Damage Estimates
2,4
(USD)
8/1-9/10 Flooding Mexico 0 150,000+ 250+ million
9/3-9/8 Flooding Guatemala 54+ 75,000+ 1.55+ billion
9/4-9/5 HU Earl Canada 1+ Unknown 25+ million
9/6 TS Hermine Mexico 0 20+ Unknown
9/15-9/17 HU Karl Mexico 16+ 100,600+ 3.9+ billion
9/18-9/22 HU Igor Bermuda, Canada 4+ Thousands+ 197+ million
9/20 Flooding Mexico 11+ Hundreds+ Unknown
9/21 Severe Weather Canada 1+ Hundreds+ Unknown
9/24-9/29 TS Matthew Nicaragua, Guatemala,
Mexico 19+ 10,000+ Millions+
9/28-9/29 Flooding Mexico 55+ 515+ Unknown
9/28-9/29 TS Nicole Jamaica, Cuba, Bahamas 13+ Thousands+ 151+ million
Heavy rainfall beginning in early August continued into the first weeks of September in southern Mexico. At least
150,000 homes were damaged or destroyed across the states of Tabasco, Veracruz, Chiapas, and Oaxaca, leaving
more than 600,000 people homeless. Total economic losses exceeded MXN3.08 billion (USD250 million).
Remnants of Tropical Depression Eleven brought the heaviest rains in 60 years to Guatemala between the 3rd and
8th, triggering more than 200 landslides. At least 54 people were killed and 56 more were injured. Officials declared a
state of emergency after the floods damaged 75,000 homes and caused extensive damage to the transportation
infrastructure. At least nine rivers burst their banks, causing 13 bridges to collapse and the destruction of long
stretches of the main Inter-American Highway. Economic losses were listed at GTQ12.7 billion (USD1.55 billion).
Hurricane Earl made landfall on the 4th at 10:00 AM local time near Western Head, Nova Scotia in Canada as a 70
mph (110 kph) tropical storm. Upon coming ashore, the system brought gusty winds and torrential rains throughout
the Canadian Maritimes. At least one person was killed in Halifax. According to the Halifax Water Commission, heavy
rains flooded the city’s sewer treatment facilities and several pumping stations. Insured losses were estimated at
CAD10.1 million (USD10 million), with total economic losses listed at CAD26 million (USD25 million).
Tropical Storm Hermine quickly developed in the southwestern Gulf of Mexico before making landfall in Mexico on
the 6th. As Hermine came ashore, the system spread rain and gusty winds. At least 20 homes were destroyed in the
state of Hidalgo and 3,500 people were evacuated in the town of Matamoros.
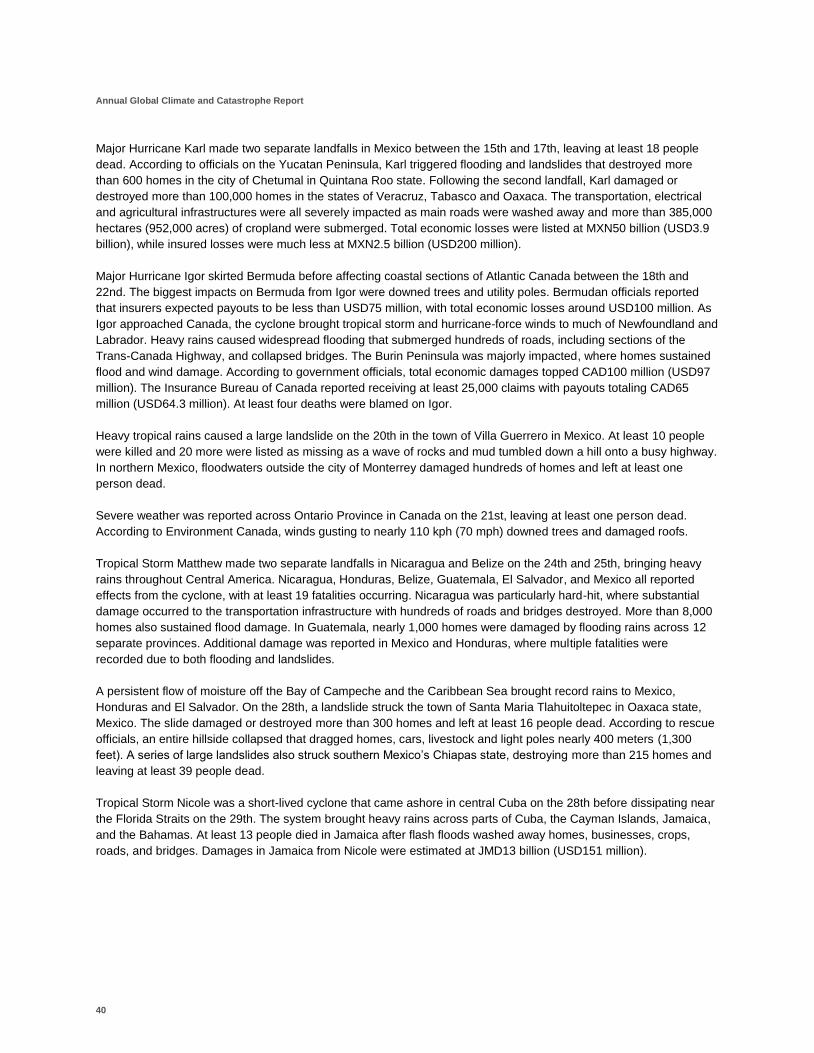
Annual Global Climate and Catastrophe Report
40
Major Hurricane Karl made two separate landfalls in Mexico between the 15th and 17th, leaving at least 18 people
dead. According to officials on the Yucatan Peninsula, Karl triggered flooding and landslides that destroyed more
than 600 homes in the city of Chetumal in Quintana Roo state. Following the second landfall, Karl damaged or
destroyed more than 100,000 homes in the states of Veracruz, Tabasco and Oaxaca. The transportation, electrical
and agricultural infrastructures were all severely impacted as main roads were washed away and more than 385,000
hectares (952,000 acres) of cropland were submerged. Total economic losses were listed at MXN50 billion (USD3.9
billion), while insured losses were much less at MXN2.5 billion (USD200 million).
Major Hurricane Igor skirted Bermuda before affecting coastal sections of Atlantic Canada between the 18th and
22nd. The biggest impacts on Bermuda from Igor were downed trees and utility poles. Bermudan officials reported
that insurers expected payouts to be less than USD75 million, with total economic losses around USD100 million. As
Igor approached Canada, the cyclone brought tropical storm and hurricane-force winds to much of Newfoundland and
Labrador. Heavy rains caused widespread flooding that submerged hundreds of roads, including sections of the
Trans-Canada Highway, and collapsed bridges. The Burin Peninsula was majorly impacted, where homes sustained
flood and wind damage. According to government officials, total economic damages topped CAD100 million (USD97
million). The Insurance Bureau of Canada reported receiving at least 25,000 claims with payouts totaling CAD65
million (USD64.3 million). At least four deaths were blamed on Igor.
Heavy tropical rains caused a large landslide on the 20th in the town of Villa Guerrero in Mexico. At least 10 people
were killed and 20 more were listed as missing as a wave of rocks and mud tumbled down a hill onto a busy highway.
In northern Mexico, floodwaters outside the city of Monterrey damaged hundreds of homes and left at least one
person dead.
Severe weather was reported across Ontario Province in Canada on the 21st, leaving at least one person dead.
According to Environment Canada, winds gusting to nearly 110 kph (70 mph) downed trees and damaged roofs.
Tropical Storm Matthew made two separate landfalls in Nicaragua and Belize on the 24th and 25th, bringing heavy
rains throughout Central America. Nicaragua, Honduras, Belize, Guatemala, El Salvador, and Mexico all reported
effects from the cyclone, with at least 19 fatalities occurring. Nicaragua was particularly hard-hit, where substantial
damage occurred to the transportation infrastructure with hundreds of roads and bridges destroyed. More than 8,000
homes also sustained flood damage. In Guatemala, nearly 1,000 homes were damaged by flooding rains across 12
separate provinces. Additional damage was reported in Mexico and Honduras, where multiple fatalities were
recorded due to both flooding and landslides.
A persistent flow of moisture off the Bay of Campeche and the Caribbean Sea brought record rains to Mexico,
Honduras and El Salvador. On the 28th, a landslide struck the town of Santa Maria Tlahuitoltepec in Oaxaca state,
Mexico. The slide damaged or destroyed more than 300 homes and left at least 16 people dead. According to rescue
officials, an entire hillside collapsed that dragged homes, cars, livestock and light poles nearly 400 meters (1,300
feet). A series of large landslides also struck southern Mexico’s Chiapas state, destroying more than 215 homes and
leaving at least 39 people dead.
Tropical Storm Nicole was a short-lived cyclone that came ashore in central Cuba on the 28th before dissipating near
the Florida Straits on the 29th. The system brought heavy rains across parts of Cuba, the Cayman Islands, Jamaica,
and the Bahamas. At least 13 people died in Jamaica after flash floods washed away homes, businesses, crops,
roads, and bridges. Damages in Jamaica from Nicole were estimated at JMD13 billion (USD151 million).
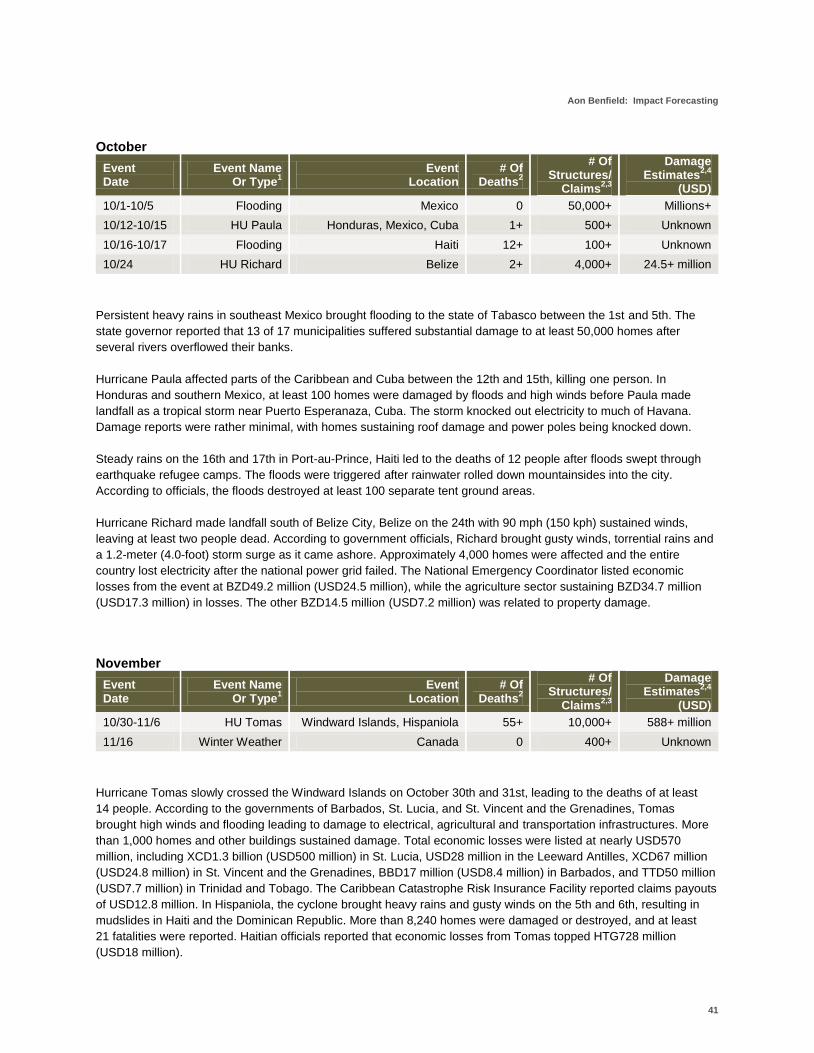
Aon Benfield: Impact Forecasting
41
October
Event Date
Event Name Or Type
1
Event Location
# Of Deaths
2
# Of Structures/
Claims2,3
Damage Estimates
2,4
(USD)
10/1-10/5 Flooding Mexico 0 50,000+ Millions+
10/12-10/15 HU Paula Honduras, Mexico, Cuba 1+ 500+ Unknown
10/16-10/17 Flooding Haiti 12+ 100+ Unknown
10/24 HU Richard Belize 2+ 4,000+ 24.5+ million
Persistent heavy rains in southeast Mexico brought flooding to the state of Tabasco between the 1st and 5th. The
state governor reported that 13 of 17 municipalities suffered substantial damage to at least 50,000 homes after
several rivers overflowed their banks.
Hurricane Paula affected parts of the Caribbean and Cuba between the 12th and 15th, killing one person. In
Honduras and southern Mexico, at least 100 homes were damaged by floods and high winds before Paula made
landfall as a tropical storm near Puerto Esperanaza, Cuba. The storm knocked out electricity to much of Havana.
Damage reports were rather minimal, with homes sustaining roof damage and power poles being knocked down.
Steady rains on the 16th and 17th in Port-au-Prince, Haiti led to the deaths of 12 people after floods swept through
earthquake refugee camps. The floods were triggered after rainwater rolled down mountainsides into the city.
According to officials, the floods destroyed at least 100 separate tent ground areas.
Hurricane Richard made landfall south of Belize City, Belize on the 24th with 90 mph (150 kph) sustained winds,
leaving at least two people dead. According to government officials, Richard brought gusty winds, torrential rains and
a 1.2-meter (4.0-foot) storm surge as it came ashore. Approximately 4,000 homes were affected and the entire
country lost electricity after the national power grid failed. The National Emergency Coordinator listed economic
losses from the event at BZD49.2 million (USD24.5 million), while the agriculture sector sustaining BZD34.7 million
(USD17.3 million) in losses. The other BZD14.5 million (USD7.2 million) was related to property damage.
November
Event Date
Event Name Or Type
1
Event Location
# Of Deaths
2
# Of Structures/
Claims2,3
Damage Estimates
2,4
(USD)
10/30-11/6 HU Tomas Windward Islands, Hispaniola 55+ 10,000+ 588+ million
11/16 Winter Weather Canada 0 400+ Unknown
Hurricane Tomas slowly crossed the Windward Islands on October 30th and 31st, leading to the deaths of at least
14 people. According to the governments of Barbados, St. Lucia, and St. Vincent and the Grenadines, Tomas
brought high winds and flooding leading to damage to electrical, agricultural and transportation infrastructures. More
than 1,000 homes and other buildings sustained damage. Total economic losses were listed at nearly USD570
million, including XCD1.3 billion (USD500 million) in St. Lucia, USD28 million in the Leeward Antilles, XCD67 million
(USD24.8 million) in St. Vincent and the Grenadines, BBD17 million (USD8.4 million) in Barbados, and TTD50 million
(USD7.7 million) in Trinidad and Tobago. The Caribbean Catastrophe Risk Insurance Facility reported claims payouts
of USD12.8 million. In Hispaniola, the cyclone brought heavy rains and gusty winds on the 5th and 6th, resulting in
mudslides in Haiti and the Dominican Republic. More than 8,240 homes were damaged or destroyed, and at least
21 fatalities were reported. Haitian officials reported that economic losses from Tomas topped HTG728 million
(USD18 million).
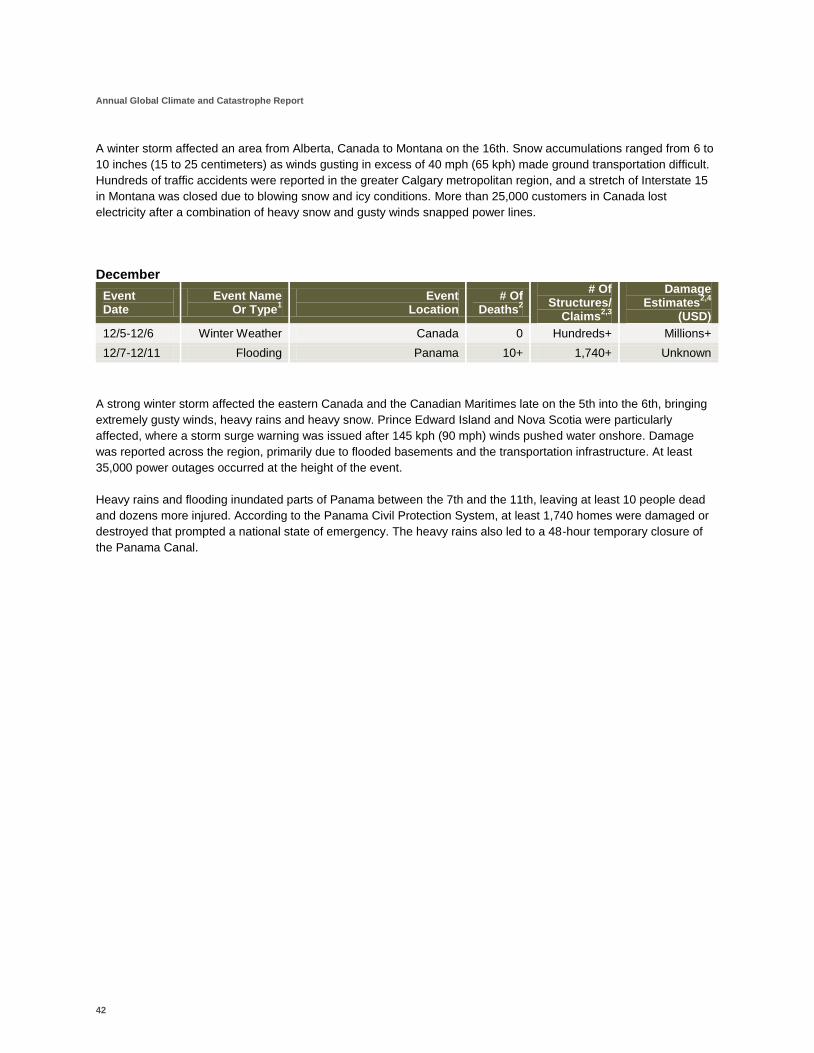
Annual Global Climate and Catastrophe Report
42
A winter storm affected an area from Alberta, Canada to Montana on the 16th. Snow accumulations ranged from 6 to
10 inches (15 to 25 centimeters) as winds gusting in excess of 40 mph (65 kph) made ground transportation difficult.
Hundreds of traffic accidents were reported in the greater Calgary metropolitan region, and a stretch of Interstate 15
in Montana was closed due to blowing snow and icy conditions. More than 25,000 customers in Canada lost
electricity after a combination of heavy snow and gusty winds snapped power lines.
December
Event Date
Event Name Or Type
1
Event Location
# Of Deaths
2
# Of Structures/
Claims2,3
Damage Estimates
2,4
(USD)
12/5-12/6 Winter Weather Canada 0 Hundreds+ Millions+
12/7-12/11 Flooding Panama 10+ 1,740+ Unknown
A strong winter storm affected the eastern Canada and the Canadian Maritimes late on the 5th into the 6th, bringing
extremely gusty winds, heavy rains and heavy snow. Prince Edward Island and Nova Scotia were particularly
affected, where a storm surge warning was issued after 145 kph (90 mph) winds pushed water onshore. Damage
was reported across the region, primarily due to flooded basements and the transportation infrastructure. At least
35,000 power outages occurred at the height of the event.
Heavy rains and flooding inundated parts of Panama between the 7th and the 11th, leaving at least 10 people dead
and dozens more injured. According to the Panama Civil Protection System, at least 1,740 homes were damaged or
destroyed that prompted a national state of emergency. The heavy rains also led to a 48-hour temporary closure of
the Panama Canal.
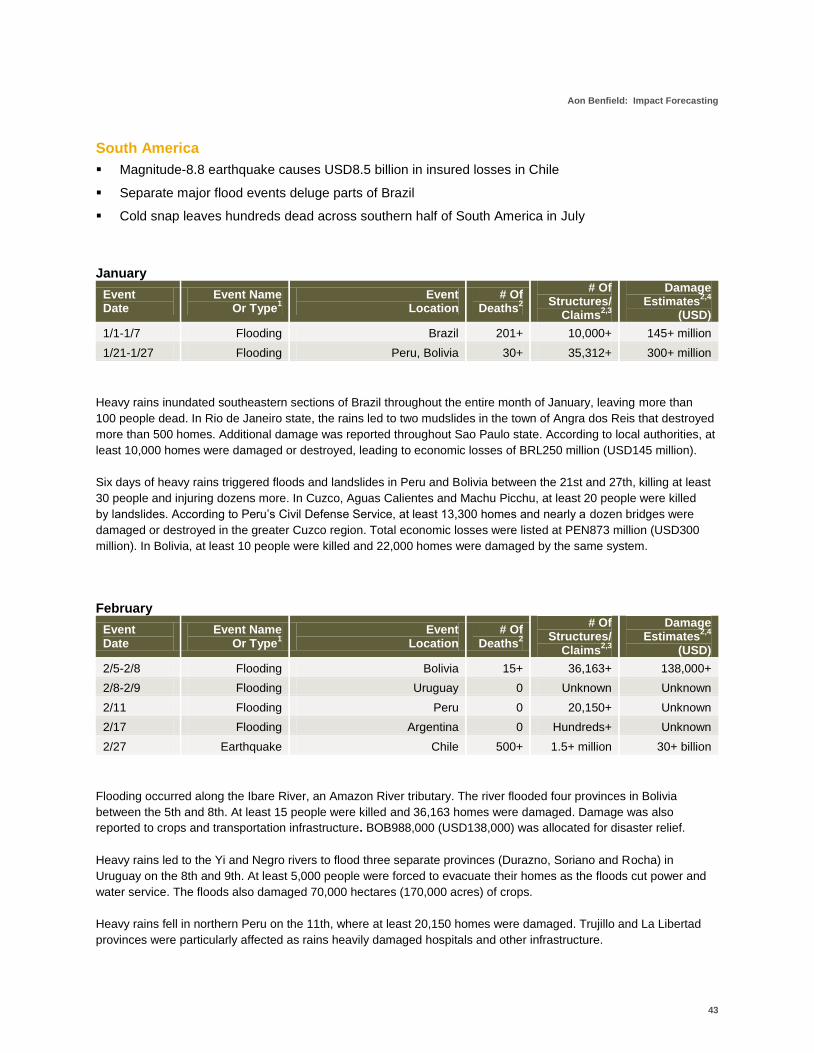
Aon Benfield: Impact Forecasting
43
South America
Magnitude-8.8 earthquake causes USD8.5 billion in insured losses in Chile
Separate major flood events deluge parts of Brazil
Cold snap leaves hundreds dead across southern half of South America in July
January
Event Date
Event Name Or Type
1
Event Location
# Of Deaths
2
# Of Structures/
Claims2,3
Damage Estimates
2,4
(USD)
1/1-1/7 Flooding Brazil 201+ 10,000+ 145+ million
1/21-1/27 Flooding Peru, Bolivia 30+ 35,312+ 300+ million
Heavy rains inundated southeastern sections of Brazil throughout the entire month of January, leaving more than
100 people dead. In Rio de Janeiro state, the rains led to two mudslides in the town of Angra dos Reis that destroyed
more than 500 homes. Additional damage was reported throughout Sao Paulo state. According to local authorities, at
least 10,000 homes were damaged or destroyed, leading to economic losses of BRL250 million (USD145 million).
Six days of heavy rains triggered floods and landslides in Peru and Bolivia between the 21st and 27th, killing at least
30 people and injuring dozens more. In Cuzco, Aguas Calientes and Machu Picchu, at least 20 people were killed
by landslides. According to Peru’s Civil Defense Service, at least 13,300 homes and nearly a dozen bridges were
damaged or destroyed in the greater Cuzco region. Total economic losses were listed at PEN873 million (USD300
million). In Bolivia, at least 10 people were killed and 22,000 homes were damaged by the same system.
February
Event Date
Event Name Or Type
1
Event Location
# Of Deaths
2
# Of Structures/
Claims2,3
Damage Estimates
2,4
(USD)
2/5-2/8 Flooding Bolivia 15+ 36,163+ 138,000+
2/8-2/9 Flooding Uruguay 0 Unknown Unknown
2/11 Flooding Peru 0 20,150+ Unknown
2/17 Flooding Argentina 0 Hundreds+ Unknown
2/27 Earthquake Chile 500+ 1.5+ million 30+ billion
Flooding occurred along the Ibare River, an Amazon River tributary. The river flooded four provinces in Bolivia
between the 5th and 8th. At least 15 people were killed and 36,163 homes were damaged. Damage was also
reported to crops and transportation infrastructure. BOB988,000 (USD138,000) was allocated for disaster relief.
Heavy rains led to the Yi and Negro rivers to flood three separate provinces (Durazno, Soriano and Rocha) in
Uruguay on the 8th and 9th. At least 5,000 people were forced to evacuate their homes as the floods cut power and
water service. The floods also damaged 70,000 hectares (170,000 acres) of crops.
Heavy rains fell in northern Peru on the 11th, where at least 20,150 homes were damaged. Trujillo and La Libertad
provinces were particularly affected as rains heavily damaged hospitals and other infrastructure.
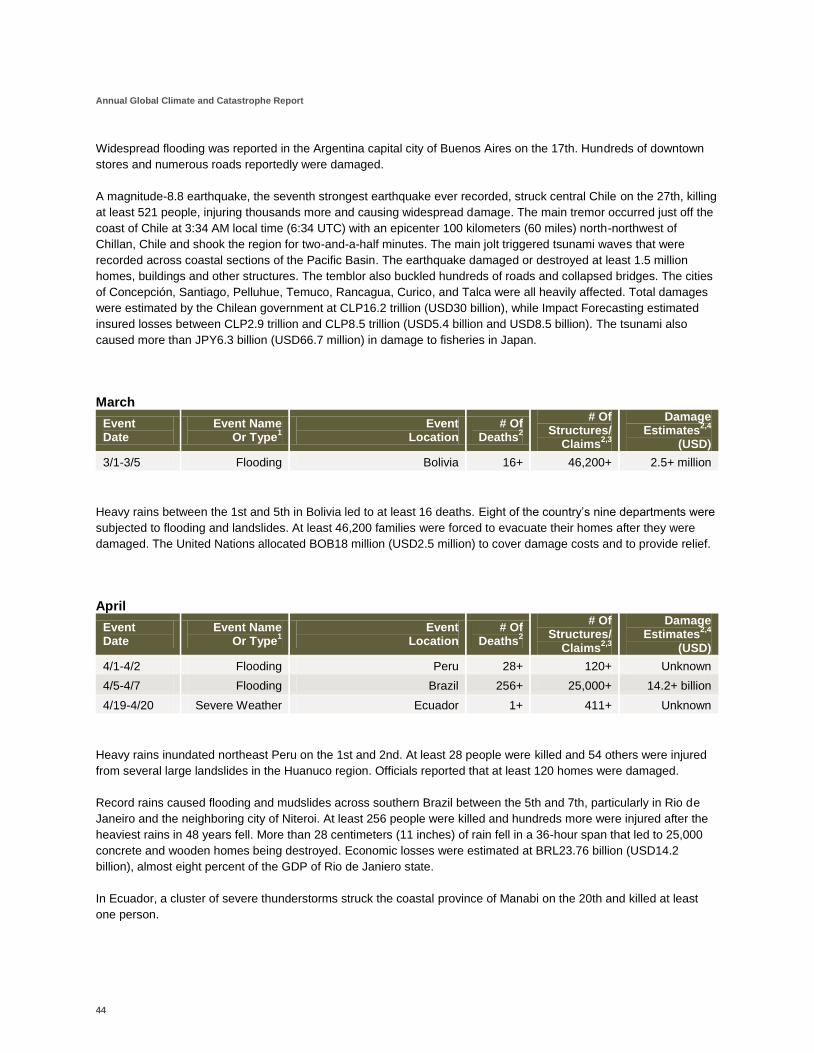
Annual Global Climate and Catastrophe Report
44
Widespread flooding was reported in the Argentina capital city of Buenos Aires on the 17th. Hundreds of downtown
stores and numerous roads reportedly were damaged.
A magnitude-8.8 earthquake, the seventh strongest earthquake ever recorded, struck central Chile on the 27th, killing
at least 521 people, injuring thousands more and causing widespread damage. The main tremor occurred just off the
coast of Chile at 3:34 AM local time (6:34 UTC) with an epicenter 100 kilometers (60 miles) north-northwest of
Chillan, Chile and shook the region for two-and-a-half minutes. The main jolt triggered tsunami waves that were
recorded across coastal sections of the Pacific Basin. The earthquake damaged or destroyed at least 1.5 million
homes, buildings and other structures. The temblor also buckled hundreds of roads and collapsed bridges. The cities
of Concepción, Santiago, Pelluhue, Temuco, Rancagua, Curico, and Talca were all heavily affected. Total damages
were estimated by the Chilean government at CLP16.2 trillion (USD30 billion), while Impact Forecasting estimated
insured losses between CLP2.9 trillion and CLP8.5 trillion (USD5.4 billion and USD8.5 billion). The tsunami also
caused more than JPY6.3 billion (USD66.7 million) in damage to fisheries in Japan.
March
Event Date
Event Name Or Type
1
Event Location
# Of Deaths
2
# Of Structures/
Claims2,3
Damage Estimates
2,4
(USD)
3/1-3/5 Flooding Bolivia 16+ 46,200+ 2.5+ million
Heavy rains between the 1st and 5th in Bolivia led to at least 16 deaths. Eight of the country’s nine departments were
subjected to flooding and landslides. At least 46,200 families were forced to evacuate their homes after they were
damaged. The United Nations allocated BOB18 million (USD2.5 million) to cover damage costs and to provide relief.
April
Event Date
Event Name Or Type
1
Event Location
# Of Deaths
2
# Of Structures/
Claims2,3
Damage Estimates
2,4
(USD)
4/1-4/2 Flooding Peru 28+ 120+ Unknown
4/5-4/7 Flooding Brazil 256+ 25,000+ 14.2+ billion
4/19-4/20 Severe Weather Ecuador 1+ 411+ Unknown
Heavy rains inundated northeast Peru on the 1st and 2nd. At least 28 people were killed and 54 others were injured
from several large landslides in the Huanuco region. Officials reported that at least 120 homes were damaged.
Record rains caused flooding and mudslides across southern Brazil between the 5th and 7th, particularly in Rio de
Janeiro and the neighboring city of Niteroi. At least 256 people were killed and hundreds more were injured after the
heaviest rains in 48 years fell. More than 28 centimeters (11 inches) of rain fell in a 36-hour span that led to 25,000
concrete and wooden homes being destroyed. Economic losses were estimated at BRL23.76 billion (USD14.2
billion), almost eight percent of the GDP of Rio de Janiero state.
In Ecuador, a cluster of severe thunderstorms struck the coastal province of Manabi on the 20th and killed at least
one person.
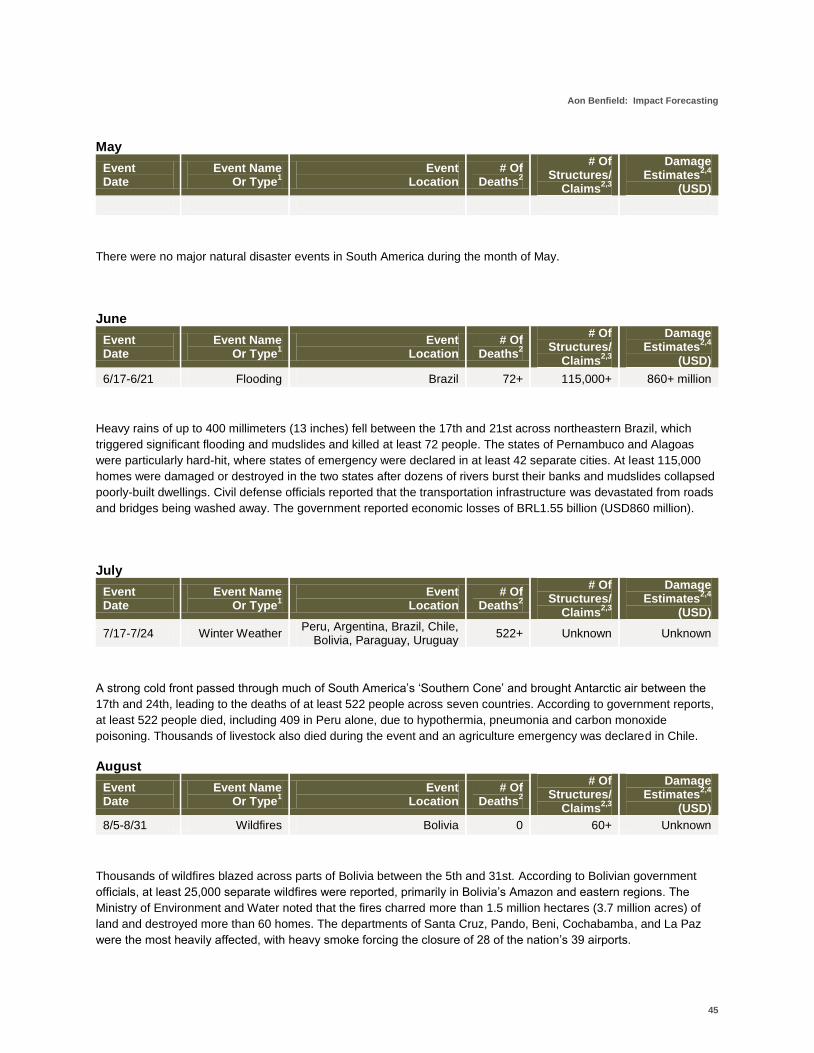
Aon Benfield: Impact Forecasting
45
May
Event Date
Event Name Or Type
1
Event Location
# Of Deaths
2
# Of Structures/
Claims2,3
Damage Estimates
2,4
(USD)
There were no major natural disaster events in South America during the month of May.
June
Event Date
Event Name Or Type
1
Event Location
# Of Deaths
2
# Of Structures/
Claims2,3
Damage Estimates
2,4
(USD)
6/17-6/21 Flooding Brazil 72+ 115,000+ 860+ million
Heavy rains of up to 400 millimeters (13 inches) fell between the 17th and 21st across northeastern Brazil, which
triggered significant flooding and mudslides and killed at least 72 people. The states of Pernambuco and Alagoas
were particularly hard-hit, where states of emergency were declared in at least 42 separate cities. At least 115,000
homes were damaged or destroyed in the two states after dozens of rivers burst their banks and mudslides collapsed
poorly-built dwellings. Civil defense officials reported that the transportation infrastructure was devastated from roads
and bridges being washed away. The government reported economic losses of BRL1.55 billion (USD860 million).
July
Event Date
Event Name Or Type
1
Event Location
# Of Deaths
2
# Of Structures/
Claims2,3
Damage Estimates
2,4
(USD)
7/17-7/24 Winter Weather Peru, Argentina, Brazil, Chile,
Bolivia, Paraguay, Uruguay 522+ Unknown Unknown
A strong cold front passed through much of South America’s ‘Southern Cone’ and brought Antarctic air between the
17th and 24th, leading to the deaths of at least 522 people across seven countries. According to government reports,
at least 522 people died, including 409 in Peru alone, due to hypothermia, pneumonia and carbon monoxide
poisoning. Thousands of livestock also died during the event and an agriculture emergency was declared in Chile.
August
Event Date
Event Name Or Type
1
Event Location
# Of Deaths
2
# Of Structures/
Claims2,3
Damage Estimates
2,4
(USD)
8/5-8/31 Wildfires Bolivia 0 60+ Unknown
Thousands of wildfires blazed across parts of Bolivia between the 5th and 31st. According to Bolivian government
officials, at least 25,000 separate wildfires were reported, primarily in Bolivia’s Amazon and eastern regions. The
Ministry of Environment and Water noted that the fires charred more than 1.5 million hectares (3.7 million acres) of
land and destroyed more than 60 homes. The departments of Santa Cruz, Pando, Beni, Cochabamba, and La Paz
were the most heavily affected, with heavy smoke forcing the closure of 28 of the nation’s 39 airports.
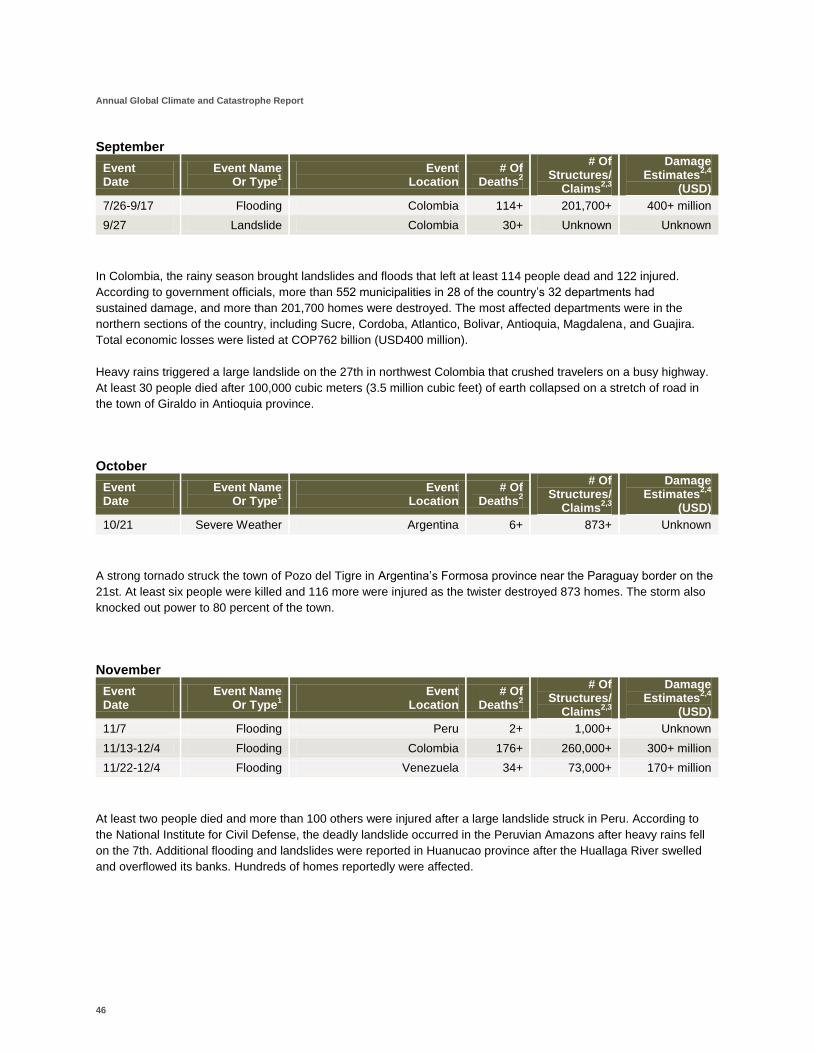
Annual Global Climate and Catastrophe Report
46
September
Event Date
Event Name Or Type
1
Event Location
# Of Deaths
2
# Of Structures/
Claims2,3
Damage Estimates
2,4
(USD)
7/26-9/17 Flooding Colombia 114+ 201,700+ 400+ million
9/27 Landslide Colombia 30+ Unknown Unknown
In Colombia, the rainy season brought landslides and floods that left at least 114 people dead and 122 injured.
According to government officials, more than 552 municipalities in 28 of the country’s 32 departments had
sustained damage, and more than 201,700 homes were destroyed. The most affected departments were in the
northern sections of the country, including Sucre, Cordoba, Atlantico, Bolivar, Antioquia, Magdalena, and Guajira.
Total economic losses were listed at COP762 billion (USD400 million).
Heavy rains triggered a large landslide on the 27th in northwest Colombia that crushed travelers on a busy highway.
At least 30 people died after 100,000 cubic meters (3.5 million cubic feet) of earth collapsed on a stretch of road in
the town of Giraldo in Antioquia province.
October
Event Date
Event Name Or Type
1
Event Location
# Of Deaths
2
# Of Structures/
Claims2,3
Damage Estimates
2,4
(USD)
10/21 Severe Weather Argentina 6+ 873+ Unknown
A strong tornado struck the town of Pozo del Tigre in Argentina’s Formosa province near the Paraguay border on the
21st. At least six people were killed and 116 more were injured as the twister destroyed 873 homes. The storm also
knocked out power to 80 percent of the town.
November
Event Date
Event Name Or Type
1
Event Location
# Of Deaths
2
# Of Structures/
Claims2,3
Damage Estimates
2,4
(USD)
11/7 Flooding Peru 2+ 1,000+ Unknown
11/13-12/4 Flooding Colombia 176+ 260,000+ 300+ million
11/22-12/4 Flooding Venezuela 34+ 73,000+ 170+ million
At least two people died and more than 100 others were injured after a large landslide struck in Peru. According to
the National Institute for Civil Defense, the deadly landslide occurred in the Peruvian Amazons after heavy rains fell
on the 7th. Additional flooding and landslides were reported in Huanucao province after the Huallaga River swelled
and overflowed its banks. Hundreds of homes reportedly were affected.
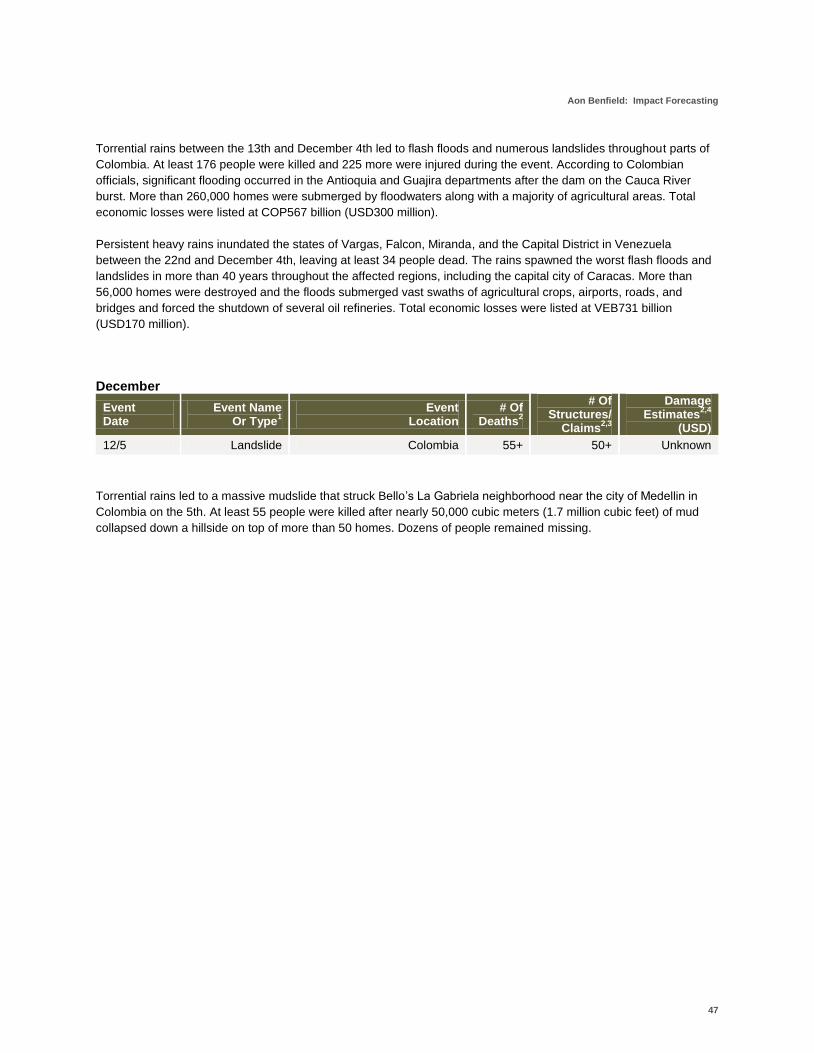
Aon Benfield: Impact Forecasting
47
Torrential rains between the 13th and December 4th led to flash floods and numerous landslides throughout parts of
Colombia. At least 176 people were killed and 225 more were injured during the event. According to Colombian
officials, significant flooding occurred in the Antioquia and Guajira departments after the dam on the Cauca River
burst. More than 260,000 homes were submerged by floodwaters along with a majority of agricultural areas. Total
economic losses were listed at COP567 billion (USD300 million).
Persistent heavy rains inundated the states of Vargas, Falcon, Miranda, and the Capital District in Venezuela
between the 22nd and December 4th, leaving at least 34 people dead. The rains spawned the worst flash floods and
landslides in more than 40 years throughout the affected regions, including the capital city of Caracas. More than
56,000 homes were destroyed and the floods submerged vast swaths of agricultural crops, airports, roads, and
bridges and forced the shutdown of several oil refineries. Total economic losses were listed at VEB731 billion
(USD170 million).
December
Event Date
Event Name Or Type
1
Event Location
# Of Deaths
2
# Of Structures/
Claims2,3
Damage Estimates
2,4
(USD)
12/5 Landslide Colombia 55+ 50+ Unknown
Torrential rains led to a massive mudslide that struck Bello’s La Gabriela neighborhood near the city of Medellin in
Colombia on the 5th. At least 55 people were killed after nearly 50,000 cubic meters (1.7 million cubic feet) of mud
collapsed down a hillside on top of more than 50 homes. Dozens of people remained missing.

Annual Global Climate and Catastrophe Report
48
Europe
Windstorm Xynthia caused billions in damage (USD) to western and central Europe
Multiple flood events inundate Central Europe
An extended heat wave and large wildfire outbreak affect Russia
January
Event Date
Event Name Or Type
1
Event Location
# Of Deaths
2
# Of Structures/
Claims2,3
Damage Estimates
2,4
(USD)
1/1-1/31 Winter Weather UK, Central Europe, Northern
Europe 314+ 1,100+ 4.63+ billion
1/1-1/15 Flooding Albania, Bosnia, Croatia 0 2,489+ 50+ million
A prolonged weather pattern brought extreme cold and snow throughout parts of the United Kingdom, Norway,
Denmark, Germany, France, and Switzerland during January. In the United Kingdom, storms dumped around
19 inches (48 centimeters) of snow across the region. At least 29 people were killed in Britain from the longest cold
stretch since 1981. The Center for Economics and Business Research estimated that economic losses topped
GBP1 billion (USD1.6 billion) in the United Kingdom alone. The coldest temperatures since 1987 were recorded in
Scandinavia. In northern Denmark, heavy snows stalled travel, while bitter cold in Germany left at least nine people
dead in the eastern state of Saxony-Anhalt. Economic losses from the cold in Germany were estimated at nearly
EUR2 billion (USD3 billion). In central Switzerland, at least seven people were killed after an avalanche occurred in
the Swiss Alps. The cold was responsible for the deaths of at least 202 people in Poland, 52 in Romania, 13 in
Russia, 5 in Bulgaria, 4 in Belgium, 4 in the Czech Republic, 3 in the Netherlands, and 2 in Turkey. Total insured
losses from the event were listed at EUR359 million (USD475 million).
The storm systems that brought extreme cold and winter weather to northern and central Europe between the 1st and
15th had triggered flooding rains throughout Albania, Bosnia and Croatia. In northwest Albania, at least 2,489 homes
sustained flood damage along with nearly 10,500 acres (4.249 hectares) of farmland. In central Croatia, widespread
torrential rains and flooding caused an artificial lake to overflow in Kosinj Valley. Damage totals were estimated at
EUR36.8 million (USD49.7 million).
February
Event Date
Event Name Or Type
1
Event Location
# Of Deaths
2
# Of Structures/
Claims2,3
Damage Estimates
2,4
(USD)
2/1-2/2 Flooding Canary Islands 1+ Hundreds+ Unknown
2/1-2/12 Winter Weather Austria 15+ Unknown Unknown
2/13-2/17 Flooding Southern Europe 4+ Hundreds+ 9.6+ million
2/20 Flooding Madeira 43+ 560+ 1.89+ billion
2/23-2/24 Flooding Spain 2+ 400+ Unknown
2/27-2/28 Windstorm
Xynthia France, Portugal, Spain,
Belgium, Germany 62+ 100,000+ 4.5+ billion
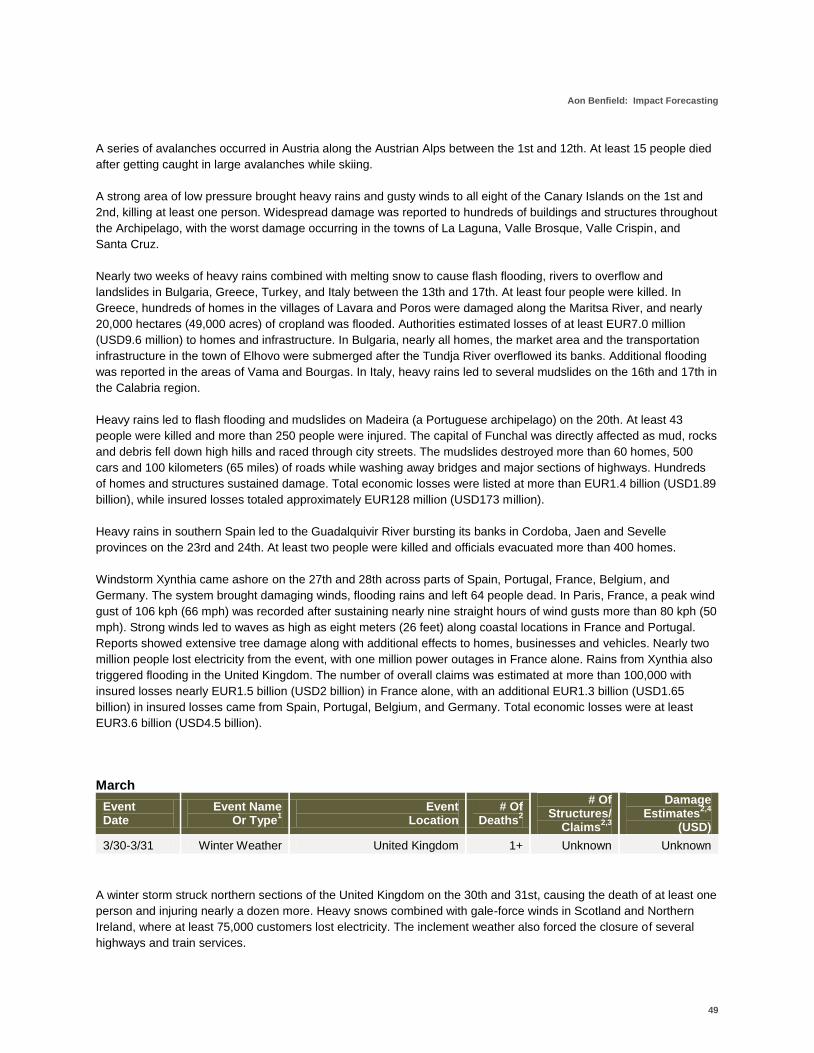
Aon Benfield: Impact Forecasting
49
A series of avalanches occurred in Austria along the Austrian Alps between the 1st and 12th. At least 15 people died
after getting caught in large avalanches while skiing.
A strong area of low pressure brought heavy rains and gusty winds to all eight of the Canary Islands on the 1st and
2nd, killing at least one person. Widespread damage was reported to hundreds of buildings and structures throughout
the Archipelago, with the worst damage occurring in the towns of La Laguna, Valle Brosque, Valle Crispin, and
Santa Cruz.
Nearly two weeks of heavy rains combined with melting snow to cause flash flooding, rivers to overflow and
landslides in Bulgaria, Greece, Turkey, and Italy between the 13th and 17th. At least four people were killed. In
Greece, hundreds of homes in the villages of Lavara and Poros were damaged along the Maritsa River, and nearly
20,000 hectares (49,000 acres) of cropland was flooded. Authorities estimated losses of at least EUR7.0 million
(USD9.6 million) to homes and infrastructure. In Bulgaria, nearly all homes, the market area and the transportation
infrastructure in the town of Elhovo were submerged after the Tundja River overflowed its banks. Additional flooding
was reported in the areas of Vama and Bourgas. In Italy, heavy rains led to several mudslides on the 16th and 17th in
the Calabria region.
Heavy rains led to flash flooding and mudslides on Madeira (a Portuguese archipelago) on the 20th. At least 43
people were killed and more than 250 people were injured. The capital of Funchal was directly affected as mud, rocks
and debris fell down high hills and raced through city streets. The mudslides destroyed more than 60 homes, 500
cars and 100 kilometers (65 miles) of roads while washing away bridges and major sections of highways. Hundreds
of homes and structures sustained damage. Total economic losses were listed at more than EUR1.4 billion (USD1.89
billion), while insured losses totaled approximately EUR128 million (USD173 million).
Heavy rains in southern Spain led to the Guadalquivir River bursting its banks in Cordoba, Jaen and Sevelle
provinces on the 23rd and 24th. At least two people were killed and officials evacuated more than 400 homes.
Windstorm Xynthia came ashore on the 27th and 28th across parts of Spain, Portugal, France, Belgium, and
Germany. The system brought damaging winds, flooding rains and left 64 people dead. In Paris, France, a peak wind
gust of 106 kph (66 mph) was recorded after sustaining nearly nine straight hours of wind gusts more than 80 kph (50
mph). Strong winds led to waves as high as eight meters (26 feet) along coastal locations in France and Portugal.
Reports showed extensive tree damage along with additional effects to homes, businesses and vehicles. Nearly two
million people lost electricity from the event, with one million power outages in France alone. Rains from Xynthia also
triggered flooding in the United Kingdom. The number of overall claims was estimated at more than 100,000 with
insured losses nearly EUR1.5 billion (USD2 billion) in France alone, with an additional EUR1.3 billion (USD1.65
billion) in insured losses came from Spain, Portugal, Belgium, and Germany. Total economic losses were at least
EUR3.6 billion (USD4.5 billion).
March
Event Date
Event Name Or Type
1
Event Location
# Of Deaths
2
# Of Structures/
Claims2,3
Damage Estimates
2,4
(USD)
3/30-3/31 Winter Weather United Kingdom 1+ Unknown Unknown
A winter storm struck northern sections of the United Kingdom on the 30th and 31st, causing the death of at least one
person and injuring nearly a dozen more. Heavy snows combined with gale-force winds in Scotland and Northern
Ireland, where at least 75,000 customers lost electricity. The inclement weather also forced the closure of several
highways and train services.
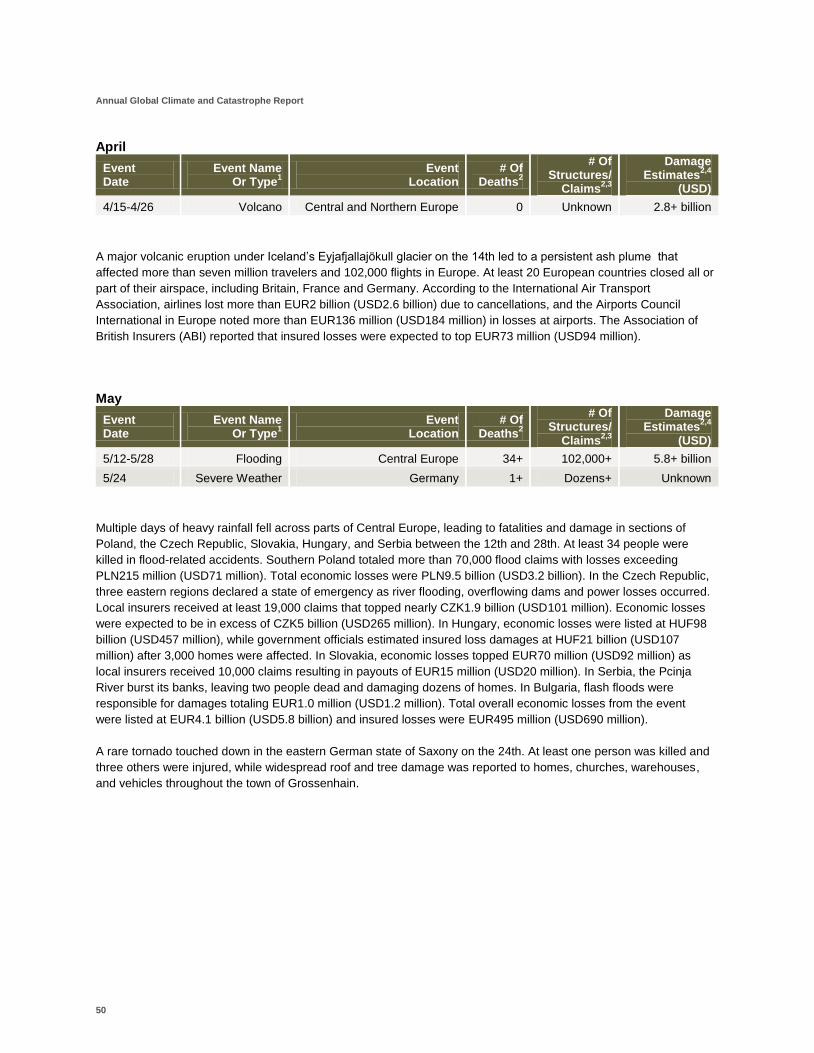
Annual Global Climate and Catastrophe Report
50
April
Event Date
Event Name Or Type
1
Event Location
# Of Deaths
2
# Of Structures/
Claims2,3
Damage Estimates
2,4
(USD)
4/15-4/26 Volcano Central and Northern Europe 0 Unknown 2.8+ billion
A major volcanic eruption under Iceland’s Eyjafjallajökull glacier on the 14th led to a persistent ash plume that
affected more than seven million travelers and 102,000 flights in Europe. At least 20 European countries closed all or
part of their airspace, including Britain, France and Germany. According to the International Air Transport
Association, airlines lost more than EUR2 billion (USD2.6 billion) due to cancellations, and the Airports Council
International in Europe noted more than EUR136 million (USD184 million) in losses at airports. The Association of
British Insurers (ABI) reported that insured losses were expected to top EUR73 million (USD94 million).
May
Event Date
Event Name Or Type
1
Event Location
# Of Deaths
2
# Of Structures/
Claims2,3
Damage Estimates
2,4
(USD)
5/12-5/28 Flooding Central Europe 34+ 102,000+ 5.8+ billion
5/24 Severe Weather Germany 1+ Dozens+ Unknown
Multiple days of heavy rainfall fell across parts of Central Europe, leading to fatalities and damage in sections of
Poland, the Czech Republic, Slovakia, Hungary, and Serbia between the 12th and 28th. At least 34 people were
killed in flood-related accidents. Southern Poland totaled more than 70,000 flood claims with losses exceeding
PLN215 million (USD71 million). Total economic losses were PLN9.5 billion (USD3.2 billion). In the Czech Republic,
three eastern regions declared a state of emergency as river flooding, overflowing dams and power losses occurred.
Local insurers received at least 19,000 claims that topped nearly CZK1.9 billion (USD101 million). Economic losses
were expected to be in excess of CZK5 billion (USD265 million). In Hungary, economic losses were listed at HUF98
billion (USD457 million), while government officials estimated insured loss damages at HUF21 billion (USD107
million) after 3,000 homes were affected. In Slovakia, economic losses topped EUR70 million (USD92 million) as
local insurers received 10,000 claims resulting in payouts of EUR15 million (USD20 million). In Serbia, the Pcinja
River burst its banks, leaving two people dead and damaging dozens of homes. In Bulgaria, flash floods were
responsible for damages totaling EUR1.0 million (USD1.2 million). Total overall economic losses from the event
were listed at EUR4.1 billion (USD5.8 billion) and insured losses were EUR495 million (USD690 million).
A rare tornado touched down in the eastern German state of Saxony on the 24th. At least one person was killed and
three others were injured, while widespread roof and tree damage was reported to homes, churches, warehouses,
and vehicles throughout the town of Grossenhain.
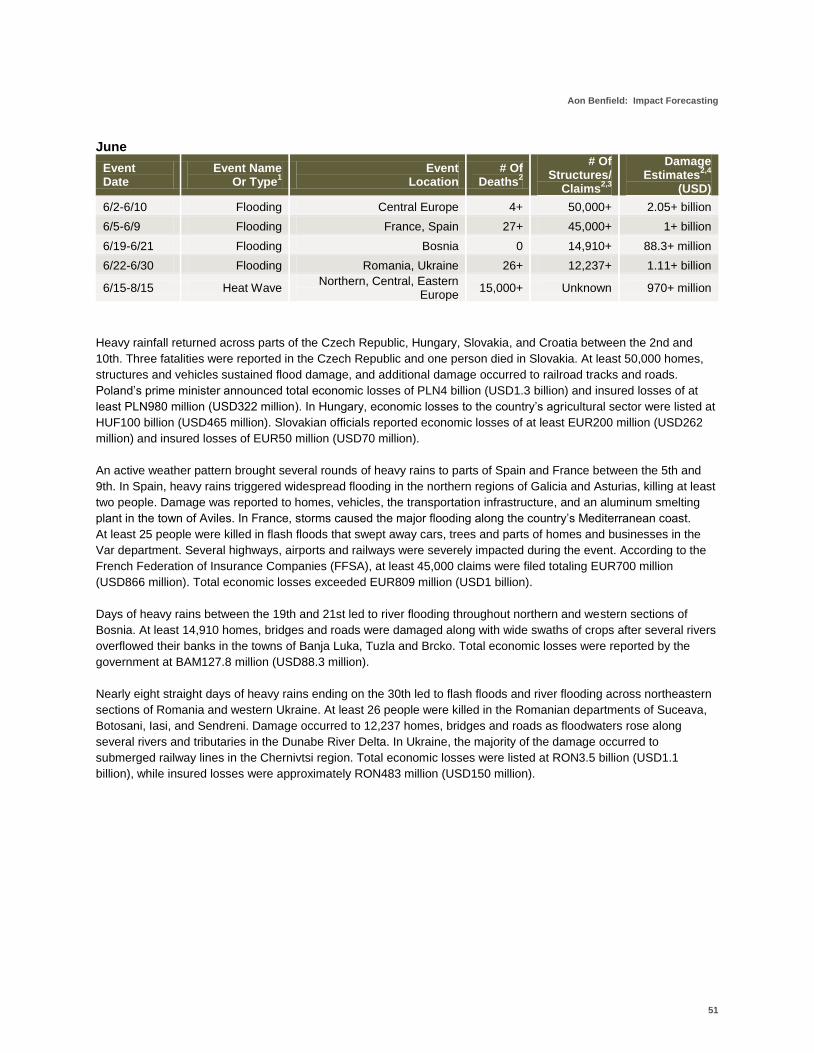
Aon Benfield: Impact Forecasting
51
June
Event Date
Event Name Or Type
1
Event Location
# Of Deaths
2
# Of Structures/
Claims2,3
Damage Estimates
2,4
(USD)
6/2-6/10 Flooding Central Europe 4+ 50,000+ 2.05+ billion
6/5-6/9 Flooding France, Spain 27+ 45,000+ 1+ billion
6/19-6/21 Flooding Bosnia 0 14,910+ 88.3+ million
6/22-6/30 Flooding Romania, Ukraine 26+ 12,237+ 1.11+ billion
6/15-8/15 Heat Wave Northern, Central, Eastern
Europe 15,000+ Unknown 970+ million
Heavy rainfall returned across parts of the Czech Republic, Hungary, Slovakia, and Croatia between the 2nd and
10th. Three fatalities were reported in the Czech Republic and one person died in Slovakia. At least 50,000 homes,
structures and vehicles sustained flood damage, and additional damage occurred to railroad tracks and roads.
Poland’s prime minister announced total economic losses of PLN4 billion (USD1.3 billion) and insured losses of at
least PLN980 million (USD322 million). In Hungary, economic losses to the country’s agricultural sector were listed at
HUF100 billion (USD465 million). Slovakian officials reported economic losses of at least EUR200 million (USD262
million) and insured losses of EUR50 million (USD70 million).
An active weather pattern brought several rounds of heavy rains to parts of Spain and France between the 5th and
9th. In Spain, heavy rains triggered widespread flooding in the northern regions of Galicia and Asturias, killing at least
two people. Damage was reported to homes, vehicles, the transportation infrastructure, and an aluminum smelting
plant in the town of Aviles. In France, storms caused the major flooding along the country’s Mediterranean coast.
At least 25 people were killed in flash floods that swept away cars, trees and parts of homes and businesses in the
Var department. Several highways, airports and railways were severely impacted during the event. According to the
French Federation of Insurance Companies (FFSA), at least 45,000 claims were filed totaling EUR700 million
(USD866 million). Total economic losses exceeded EUR809 million (USD1 billion).
Days of heavy rains between the 19th and 21st led to river flooding throughout northern and western sections of
Bosnia. At least 14,910 homes, bridges and roads were damaged along with wide swaths of crops after several rivers
overflowed their banks in the towns of Banja Luka, Tuzla and Brcko. Total economic losses were reported by the
government at BAM127.8 million (USD88.3 million).
Nearly eight straight days of heavy rains ending on the 30th led to flash floods and river flooding across northeastern
sections of Romania and western Ukraine. At least 26 people were killed in the Romanian departments of Suceava,
Botosani, Iasi, and Sendreni. Damage occurred to 12,237 homes, bridges and roads as floodwaters rose along
several rivers and tributaries in the Dunabe River Delta. In Ukraine, the majority of the damage occurred to
submerged railway lines in the Chernivtsi region. Total economic losses were listed at RON3.5 billion (USD1.1
billion), while insured losses were approximately RON483 million (USD150 million).
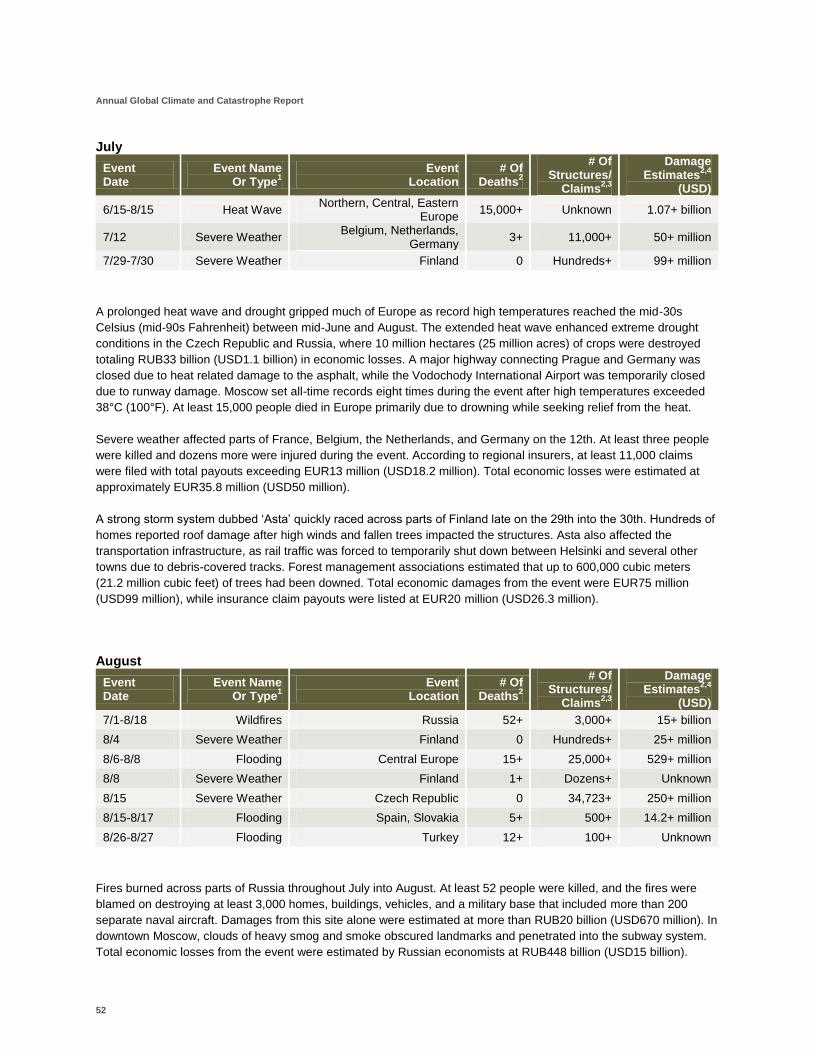
Annual Global Climate and Catastrophe Report
52
July
Event Date
Event Name Or Type
1
Event Location
# Of Deaths
2
# Of Structures/
Claims2,3
Damage Estimates
2,4
(USD)
6/15-8/15 Heat Wave Northern, Central, Eastern
Europe 15,000+ Unknown 1.07+ billion
7/12 Severe Weather Belgium, Netherlands,
Germany 3+ 11,000+ 50+ million
7/29-7/30 Severe Weather Finland 0 Hundreds+ 99+ million
A prolonged heat wave and drought gripped much of Europe as record high temperatures reached the mid-30s
Celsius (mid-90s Fahrenheit) between mid-June and August. The extended heat wave enhanced extreme drought
conditions in the Czech Republic and Russia, where 10 million hectares (25 million acres) of crops were destroyed
totaling RUB33 billion (USD1.1 billion) in economic losses. A major highway connecting Prague and Germany was
closed due to heat related damage to the asphalt, while the Vodochody International Airport was temporarily closed
due to runway damage. Moscow set all-time records eight times during the event after high temperatures exceeded
38°C (100°F). At least 15,000 people died in Europe primarily due to drowning while seeking relief from the heat.
Severe weather affected parts of France, Belgium, the Netherlands, and Germany on the 12th. At least three people
were killed and dozens more were injured during the event. According to regional insurers, at least 11,000 claims
were filed with total payouts exceeding EUR13 million (USD18.2 million). Total economic losses were estimated at
approximately EUR35.8 million (USD50 million).
A strong storm system dubbed ‘Asta’ quickly raced across parts of Finland late on the 29th into the 30th. Hundreds of
homes reported roof damage after high winds and fallen trees impacted the structures. Asta also affected the
transportation infrastructure, as rail traffic was forced to temporarily shut down between Helsinki and several other
towns due to debris-covered tracks. Forest management associations estimated that up to 600,000 cubic meters
(21.2 million cubic feet) of trees had been downed. Total economic damages from the event were EUR75 million
(USD99 million), while insurance claim payouts were listed at EUR20 million (USD26.3 million).
August
Event Date
Event Name Or Type
1
Event Location
# Of Deaths
2
# Of Structures/
Claims2,3
Damage Estimates
2,4
(USD)
7/1-8/18 Wildfires Russia 52+ 3,000+ 15+ billion
8/4 Severe Weather Finland 0 Hundreds+ 25+ million
8/6-8/8 Flooding Central Europe 15+ 25,000+ 529+ million
8/8 Severe Weather Finland 1+ Dozens+ Unknown
8/15 Severe Weather Czech Republic 0 34,723+ 250+ million
8/15-8/17 Flooding Spain, Slovakia 5+ 500+ 14.2+ million
8/26-8/27 Flooding Turkey 12+ 100+ Unknown
Fires burned across parts of Russia throughout July into August. At least 52 people were killed, and the fires were
blamed on destroying at least 3,000 homes, buildings, vehicles, and a military base that included more than 200
separate naval aircraft. Damages from this site alone were estimated at more than RUB20 billion (USD670 million). In
downtown Moscow, clouds of heavy smog and smoke obscured landmarks and penetrated into the subway system.
Total economic losses from the event were estimated by Russian economists at RUB448 billion (USD15 billion).
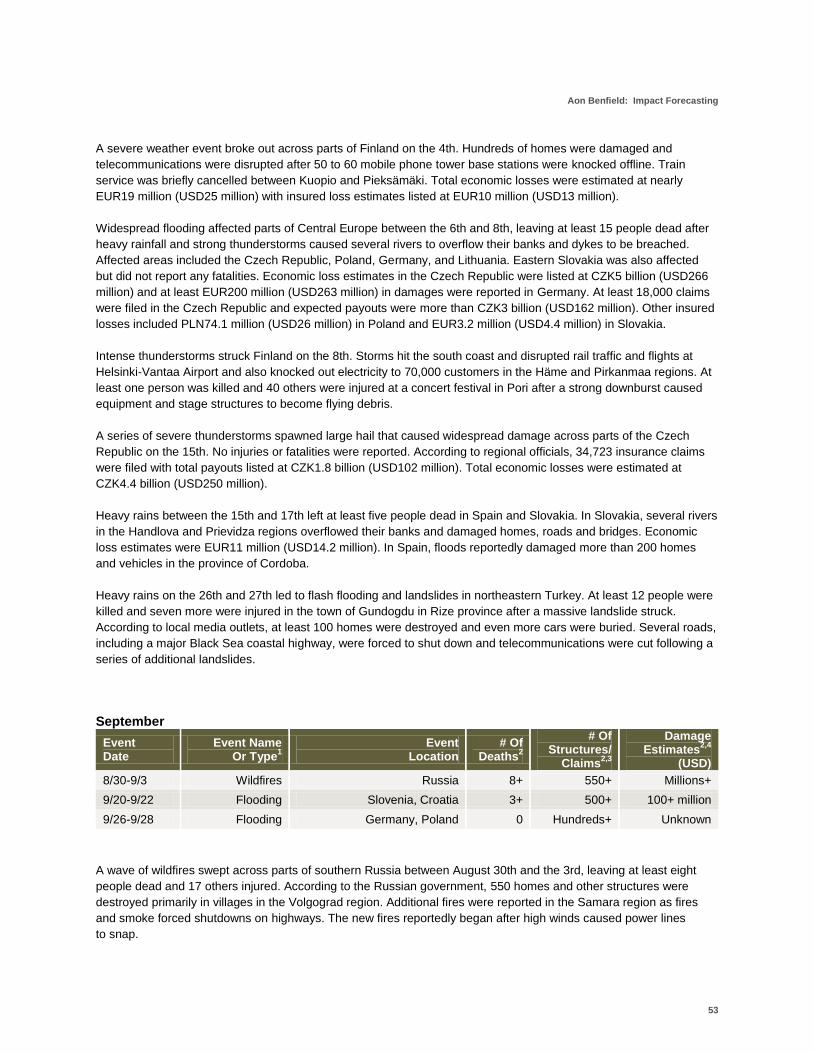
Aon Benfield: Impact Forecasting
53
A severe weather event broke out across parts of Finland on the 4th. Hundreds of homes were damaged and
telecommunications were disrupted after 50 to 60 mobile phone tower base stations were knocked offline. Train
service was briefly cancelled between Kuopio and Pieksämäki. Total economic losses were estimated at nearly
EUR19 million (USD25 million) with insured loss estimates listed at EUR10 million (USD13 million).
Widespread flooding affected parts of Central Europe between the 6th and 8th, leaving at least 15 people dead after
heavy rainfall and strong thunderstorms caused several rivers to overflow their banks and dykes to be breached.
Affected areas included the Czech Republic, Poland, Germany, and Lithuania. Eastern Slovakia was also affected
but did not report any fatalities. Economic loss estimates in the Czech Republic were listed at CZK5 billion (USD266
million) and at least EUR200 million (USD263 million) in damages were reported in Germany. At least 18,000 claims
were filed in the Czech Republic and expected payouts were more than CZK3 billion (USD162 million). Other insured
losses included PLN74.1 million (USD26 million) in Poland and EUR3.2 million (USD4.4 million) in Slovakia.
Intense thunderstorms struck Finland on the 8th. Storms hit the south coast and disrupted rail traffic and flights at
Helsinki-Vantaa Airport and also knocked out electricity to 70,000 customers in the Häme and Pirkanmaa regions. At
least one person was killed and 40 others were injured at a concert festival in Pori after a strong downburst caused
equipment and stage structures to become flying debris.
A series of severe thunderstorms spawned large hail that caused widespread damage across parts of the Czech
Republic on the 15th. No injuries or fatalities were reported. According to regional officials, 34,723 insurance claims
were filed with total payouts listed at CZK1.8 billion (USD102 million). Total economic losses were estimated at
CZK4.4 billion (USD250 million).
Heavy rains between the 15th and 17th left at least five people dead in Spain and Slovakia. In Slovakia, several rivers
in the Handlova and Prievidza regions overflowed their banks and damaged homes, roads and bridges. Economic
loss estimates were EUR11 million (USD14.2 million). In Spain, floods reportedly damaged more than 200 homes
and vehicles in the province of Cordoba.
Heavy rains on the 26th and 27th led to flash flooding and landslides in northeastern Turkey. At least 12 people were
killed and seven more were injured in the town of Gundogdu in Rize province after a massive landslide struck.
According to local media outlets, at least 100 homes were destroyed and even more cars were buried. Several roads,
including a major Black Sea coastal highway, were forced to shut down and telecommunications were cut following a
series of additional landslides.
September
Event Date
Event Name Or Type
1
Event Location
# Of Deaths
2
# Of Structures/
Claims2,3
Damage Estimates
2,4
(USD)
8/30-9/3 Wildfires Russia 8+ 550+ Millions+
9/20-9/22 Flooding Slovenia, Croatia 3+ 500+ 100+ million
9/26-9/28 Flooding Germany, Poland 0 Hundreds+ Unknown
A wave of wildfires swept across parts of southern Russia between August 30th and the 3rd, leaving at least eight
people dead and 17 others injured. According to the Russian government, 550 homes and other structures were
destroyed primarily in villages in the Volgograd region. Additional fires were reported in the Samara region as fires
and smoke forced shutdowns on highways. The new fires reportedly began after high winds caused power lines
to snap.
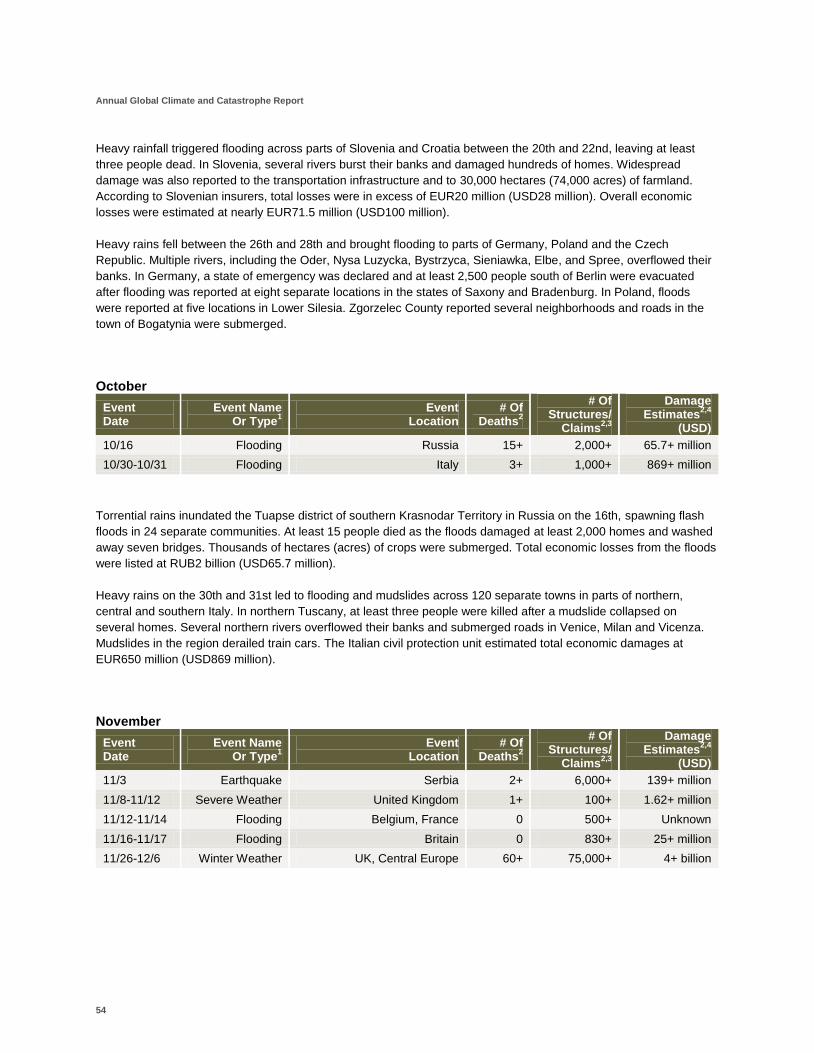
Annual Global Climate and Catastrophe Report
54
Heavy rainfall triggered flooding across parts of Slovenia and Croatia between the 20th and 22nd, leaving at least
three people dead. In Slovenia, several rivers burst their banks and damaged hundreds of homes. Widespread
damage was also reported to the transportation infrastructure and to 30,000 hectares (74,000 acres) of farmland.
According to Slovenian insurers, total losses were in excess of EUR20 million (USD28 million). Overall economic
losses were estimated at nearly EUR71.5 million (USD100 million).
Heavy rains fell between the 26th and 28th and brought flooding to parts of Germany, Poland and the Czech
Republic. Multiple rivers, including the Oder, Nysa Luzycka, Bystrzyca, Sieniawka, Elbe, and Spree, overflowed their
banks. In Germany, a state of emergency was declared and at least 2,500 people south of Berlin were evacuated
after flooding was reported at eight separate locations in the states of Saxony and Bradenburg. In Poland, floods
were reported at five locations in Lower Silesia. Zgorzelec County reported several neighborhoods and roads in the
town of Bogatynia were submerged.
October
Event Date
Event Name Or Type
1
Event Location
# Of Deaths
2
# Of Structures/
Claims2,3
Damage Estimates
2,4
(USD)
10/16 Flooding Russia 15+ 2,000+ 65.7+ million
10/30-10/31 Flooding Italy 3+ 1,000+ 869+ million
Torrential rains inundated the Tuapse district of southern Krasnodar Territory in Russia on the 16th, spawning flash
floods in 24 separate communities. At least 15 people died as the floods damaged at least 2,000 homes and washed
away seven bridges. Thousands of hectares (acres) of crops were submerged. Total economic losses from the floods
were listed at RUB2 billion (USD65.7 million).
Heavy rains on the 30th and 31st led to flooding and mudslides across 120 separate towns in parts of northern,
central and southern Italy. In northern Tuscany, at least three people were killed after a mudslide collapsed on
several homes. Several northern rivers overflowed their banks and submerged roads in Venice, Milan and Vicenza.
Mudslides in the region derailed train cars. The Italian civil protection unit estimated total economic damages at
EUR650 million (USD869 million).
November
Event Date
Event Name Or Type
1
Event Location
# Of Deaths
2
# Of Structures/
Claims2,3
Damage Estimates
2,4
(USD)
11/3 Earthquake Serbia 2+ 6,000+ 139+ million
11/8-11/12 Severe Weather United Kingdom 1+ 100+ 1.62+ million
11/12-11/14 Flooding Belgium, France 0 500+ Unknown
11/16-11/17 Flooding Britain 0 830+ 25+ million
11/26-12/6 Winter Weather UK, Central Europe 60+ 75,000+ 4+ billion

Aon Benfield: Impact Forecasting
55
A moderate earthquake struck Serbia on the 3rd, killing at least two people and injuring 100 others. The USGS-
registered magnitude-5.3 tremor struck at 1:56 AM local time (00:56 UTC) with an epicenter 40 kilometers (25 miles)
southwest of Kragujevac, Serbia. The majority of the damage came from the village of Vitanovac, where up to 70
percent of the homes in the village sustained significant damage. In the city of Kraljevo, the majority of the damage
was inflicted upon mostly older buildings such as the local hospital, the town hall, schools, and military facilities.
Assessments determined that more than 6,000 homes and other structures were damaged, and estimates suggested
economic losses in excess of RSD11.3 billion (USD139 million).
A series of storm systems brought heavy rains and gusty winds to parts of Britain, Wales, the Midlands, and England
between the 8th and 12th. According to the Environment Agency, up to 60 homes in Emsworth, Hampshire and on
the Isle of Wight were partially submerged by floodwaters. Floods also caused several sections of main roads to be
temporarily closed on the 9th. Winds gusting to 130 kph (80 mph) and heavy rains brought additional flood and wind
damage to the United Kingdom on the 11th and 12th. At least one person was killed after being struck by a falling
tree branch. Total economic losses were in excess of GBP1 million (USD1.6 million).
Heavy rains between the 12th and 14th in parts of France and Belgium spawned flooding that left at least five people
dead. The excessive rains caused rivers to overflow and mudslides to occur. Western and central Belgium sustained
the worst effects from the event, with Belgian officials declaring the floods the worst in 50 years. Hundreds of homes
and businesses were flooded, and rail traffic was suspended due to debris covering tracks.
Torrential rains beginning late on the 16th into early on the 17th inundated Britain’s Cornwall region, which quickly
caused rivers to swell and overwhelm drains and culverts. British officials reported that the floods had damaged 830
homes, businesses, schools, and bridges throughout the region. Both floods and landslides forced several main road
closures and halted all rain service in and out of Cornwall. According to the Association of British Insurers, insured
losses were GBP10 million (USD15.5 million). Total economic losses exceeded GBP16 million (USD25 million).
An extended period of winter weather engulfed much of the United Kingdom and Central Europe between the 26th
and December 1st, leaving at least 60 people dead. The wintry weather affected parts of the U.K., Germany, Poland,
France, Italy, Russia, Albania, Spain, Norway, Denmark, Portugal, the Czech Republic, and the Balkans with heavy
snow, flooding, gusty winds and sub-freezing temperatures. Transportation via ground and air was significantly
impacted throughout Europe as several main airports, highways and railways were temporarily closed. Heavy snows
also left major damage to tens of thousands of homes and businesses in western and central Europe. In the Balkans,
severe floods submerged at least 15,000 homes. Total economic losses from the event were estimated by British
officials in excess of GBP1.9 billion (USD3 billion), with additional losses of USD1 billion in Germany and Switzerland.
Preliminary insured losses across Europe were projected to exceed EUR262 million (USD350 million).
December
Event Date
Event Name Or Type
1
Event Location
# Of Deaths
2
# Of Structures/
Claims2,3
Damage Estimates
2,4
(USD)
11/26-12/7 Flooding Balkans, Croatia 3+ 30,000+ 451+ million
Parts of the Balkans saw continued flooding after rains in association with last week’s winter weather in central and
western Europe caused the worst flooding in 104 years. At least three people were killed. The widespread nature of
the floods across the Drina River delta region prompted officials in Albania, Bosnia, Serbia, and Montenegro to
declare states of emergency. Upwards of 35,000 homes were damaged during the event. According to officials in the
region, total economic losses (primarily damage to property and infrastructure) was listed at EUR340 million (USD451
million). Preliminary insured loss estimates suggested totals to approach EUR76 million (USD100 million).

Annual Global Climate and Catastrophe Report
56
Africa
Above-normal seasonal rains spawn significant flooding in parts of central and eastern Africa
Tropical Storm Hubert leaves dozens dead in Madagascar
January severe thunderstorms cause damage in Egypt
January
Event Date
Event Name Or Type
1
Event Location
# Of Deaths
2
# Of Structures/
Claims2,3
Damage Estimates
2,4
(USD)
1/1-1/15 Flooding Kenya 35+ 30,000+ 57+ million
1/17-1/18 Flooding Egypt 15+ 1,856+ 36.2+ million
Two consecutive weeks of heavy rains led to the drowning deaths of at least 35 people in Kenya during the start of
the year. According to Kenyan government officials, at least 70,000 people were affected by flash floods that
inundated seven separate regions of the country. Nearly 30,000 homes, schools, hospitals, and bridges were
destroyed and 6,000 livestock died after multiple rivers, including the Nzoia and Ngare Narok, burst their banks. Total
damages to the agricultural and transportation infrastructures were estimated at KES4.5 billion (USD57 million).
Heavy rains flooded parts of the Middle East on the 17th and 18th. In Egypt, at least 15 people were killed in the Sinai
Peninsula and in Aswan as severe thunderstorms damaged at least 1,856 buildings and the electrical infrastructure.
Total economic losses were estimated at EGP200 million (USD36.2 million).
February
Event Date
Event Name Or Type
1
Event Location
# Of Deaths
2
# Of Structures/
Claims2,3
Damage Estimates
2,4
(USD)
2/16 Flooding South Africa 4+ Hundreds+ 5.3+ million
2/22 Flooding Zambia 9+ 1,000+ Unknown
A torrential downpour in KwaZulu-Natal Province on the 16th led to hundreds of homes sustaining damage after flash
floods struck. Gusty winds combining with the rains also led to roofs blowing off. Damage to homes, crops and
infrastructure were estimated at ZAR40 million (USD5.3 million). At least four people were killed and 24 people
sustained injuries.
Days of heavy rains caused a cliff to collapse on the Lake Tanganyika coast on the 22nd. At least nine people were
killed. Officials from the Zambia National Service noted that at least 1,000 homes were damaged or destroyed.
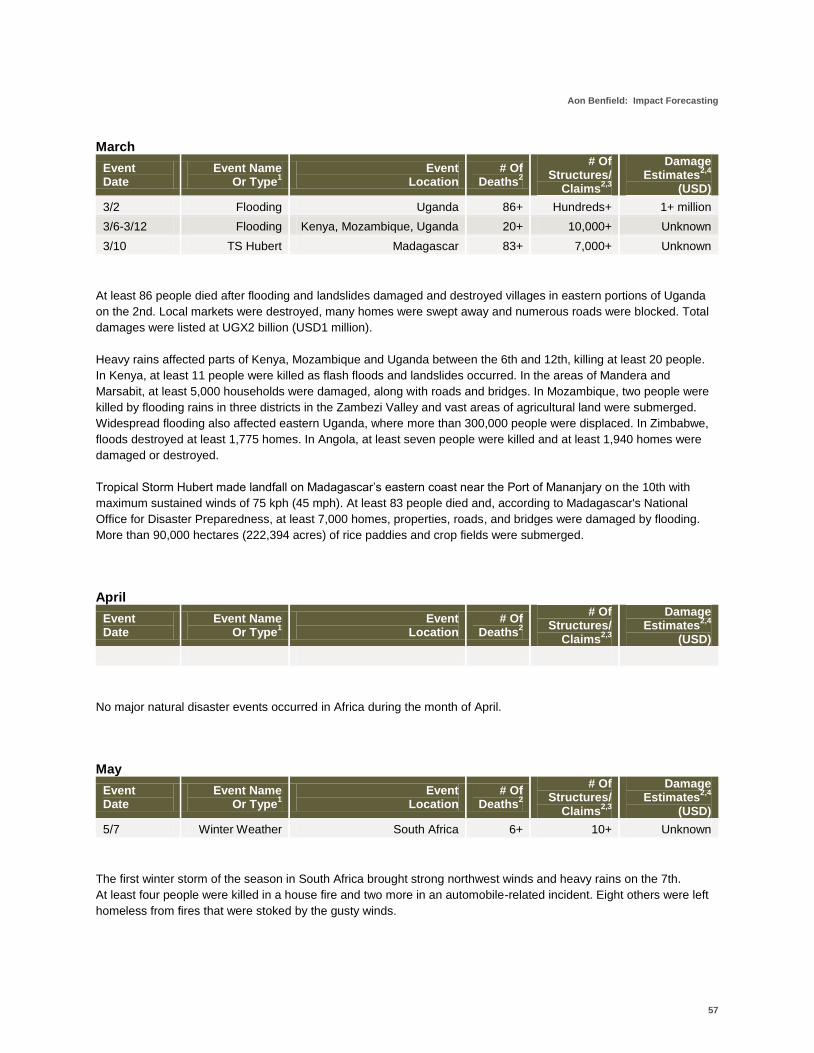
Aon Benfield: Impact Forecasting
57
March
Event Date
Event Name Or Type
1
Event Location
# Of Deaths
2
# Of Structures/
Claims2,3
Damage Estimates
2,4
(USD)
3/2 Flooding Uganda 86+ Hundreds+ 1+ million
3/6-3/12 Flooding Kenya, Mozambique, Uganda 20+ 10,000+ Unknown
3/10 TS Hubert Madagascar 83+ 7,000+ Unknown
At least 86 people died after flooding and landslides damaged and destroyed villages in eastern portions of Uganda
on the 2nd. Local markets were destroyed, many homes were swept away and numerous roads were blocked. Total
damages were listed at UGX2 billion (USD1 million).
Heavy rains affected parts of Kenya, Mozambique and Uganda between the 6th and 12th, killing at least 20 people.
In Kenya, at least 11 people were killed as flash floods and landslides occurred. In the areas of Mandera and
Marsabit, at least 5,000 households were damaged, along with roads and bridges. In Mozambique, two people were
killed by flooding rains in three districts in the Zambezi Valley and vast areas of agricultural land were submerged.
Widespread flooding also affected eastern Uganda, where more than 300,000 people were displaced. In Zimbabwe,
floods destroyed at least 1,775 homes. In Angola, at least seven people were killed and at least 1,940 homes were
damaged or destroyed.
Tropical Storm Hubert made landfall on Madagascar’s eastern coast near the Port of Mananjary on the 10th with
maximum sustained winds of 75 kph (45 mph). At least 83 people died and, according to Madagascar's National
Office for Disaster Preparedness, at least 7,000 homes, properties, roads, and bridges were damaged by flooding.
More than 90,000 hectares (222,394 acres) of rice paddies and crop fields were submerged.
April
Event Date
Event Name Or Type
1
Event Location
# Of Deaths
2
# Of Structures/
Claims2,3
Damage Estimates
2,4
(USD)
No major natural disaster events occurred in Africa during the month of April.
May
Event Date
Event Name Or Type
1
Event Location
# Of Deaths
2
# Of Structures/
Claims2,3
Damage Estimates
2,4
(USD)
5/7 Winter Weather South Africa 6+ 10+ Unknown
The first winter storm of the season in South Africa brought strong northwest winds and heavy rains on the 7th.
At least four people were killed in a house fire and two more in an automobile-related incident. Eight others were left
homeless from fires that were stoked by the gusty winds.
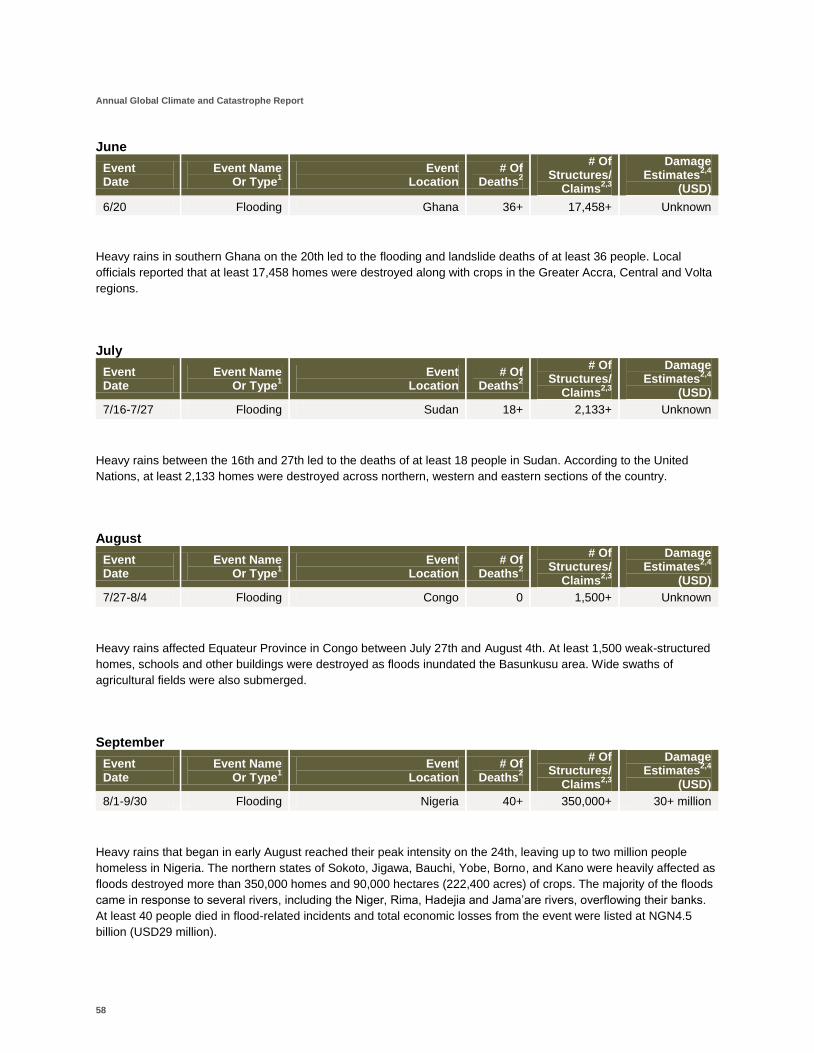
Annual Global Climate and Catastrophe Report
58
June
Event Date
Event Name Or Type
1
Event Location
# Of Deaths
2
# Of Structures/
Claims2,3
Damage Estimates
2,4
(USD)
6/20 Flooding Ghana 36+ 17,458+ Unknown
Heavy rains in southern Ghana on the 20th led to the flooding and landslide deaths of at least 36 people. Local
officials reported that at least 17,458 homes were destroyed along with crops in the Greater Accra, Central and Volta
regions.
July
Event Date
Event Name Or Type
1
Event Location
# Of Deaths
2
# Of Structures/
Claims2,3
Damage Estimates
2,4
(USD)
7/16-7/27 Flooding Sudan 18+ 2,133+ Unknown
Heavy rains between the 16th and 27th led to the deaths of at least 18 people in Sudan. According to the United
Nations, at least 2,133 homes were destroyed across northern, western and eastern sections of the country.
August
Event Date
Event Name Or Type
1
Event Location
# Of Deaths
2
# Of Structures/
Claims2,3
Damage Estimates
2,4
(USD)
7/27-8/4 Flooding Congo 0 1,500+ Unknown
Heavy rains affected Equateur Province in Congo between July 27th and August 4th. At least 1,500 weak-structured
homes, schools and other buildings were destroyed as floods inundated the Basunkusu area. Wide swaths of
agricultural fields were also submerged.
September
Event Date
Event Name Or Type
1
Event Location
# Of Deaths
2
# Of Structures/
Claims2,3
Damage Estimates
2,4
(USD)
8/1-9/30 Flooding Nigeria 40+ 350,000+ 30+ million
Heavy rains that began in early August reached their peak intensity on the 24th, leaving up to two million people
homeless in Nigeria. The northern states of Sokoto, Jigawa, Bauchi, Yobe, Borno, and Kano were heavily affected as
floods destroyed more than 350,000 homes and 90,000 hectares (222,400 acres) of crops. The majority of the floods
came in response to several rivers, including the Niger, Rima, Hadejia and Jama’are rivers, overflowing their banks.
At least 40 people died in flood-related incidents and total economic losses from the event were listed at NGN4.5
billion (USD29 million).

Aon Benfield: Impact Forecasting
59
October
Event Date
Event Name Or Type
1
Event Location
# Of Deaths
2
# Of Structures/
Claims2,3
Damage Estimates
2,4
(USD)
10/1-10/22 Flooding Central and Western Africa 377+ 1.5+ million 150+ million
Significant rains lasting throughout the month of October led to extensive flooding across central and western Africa.
According to a United Nations report, at least 377 people died and more than 1.5 million others were affected.
Fatalities were reported in Nigeria (118), Ghana (52), Sudan (50), Benin (43), Chad (24), Mauritania (21), Burkina
Faso (16), Cameroon (13) and Gambia (12). Local governments throughout central and western Africa reported
widespread extensive damage to transportation, electrical and agricultural infrastructures. Overall combined
economic losses from Africa were listed at USD150 million.
November
Event Date
Event Name Or Type
1
Event Location
# Of Deaths
2
# Of Structures/
Claims2,3
Damage Estimates
2,4
(USD)
11/30 Flooding Morocco 34+ 25,000+ 29.2+ million
Torrential rains on the 30th in Morocco spawned floods that led to the drowning deaths of at least 34 people.
Widespread flood damage was reported throughout towns surrounding the capital city of Rabat after 180 millimeters
(seven inches) of rain fell in only a few hours. The floods damaged tens of thousands of homes and businesses,
caused major disruptions in communication lines and submerged major highways, railways and the main airport.
Total economic losses were listed at MAD250 million (USD29.2 million).
December
Event Date
Event Name Or Type
1
Event Location
# Of Deaths
2
# Of Structures/
Claims2,3
Damage Estimates
2,4
(USD)
No major natural disaster events occurred in Africa during the month of December.
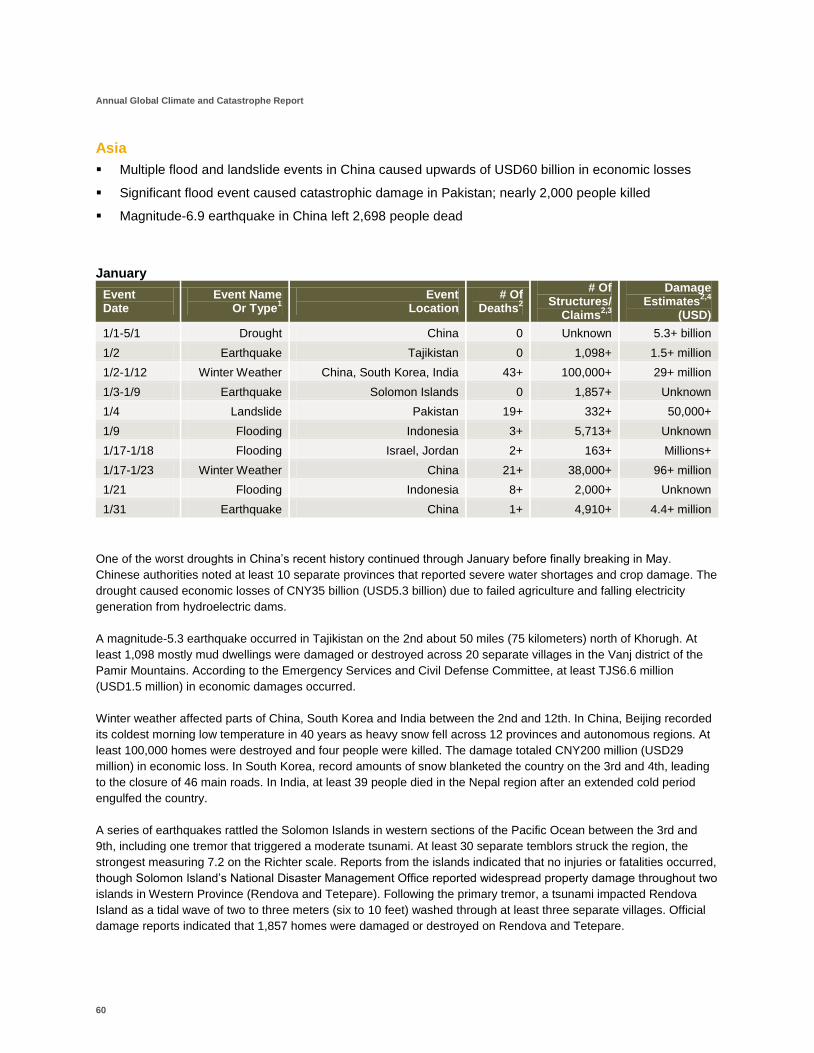
Annual Global Climate and Catastrophe Report
60
Asia
Multiple flood and landslide events in China caused upwards of USD60 billion in economic losses
Significant flood event caused catastrophic damage in Pakistan; nearly 2,000 people killed
Magnitude-6.9 earthquake in China left 2,698 people dead
January
Event Date
Event Name Or Type
1
Event Location
# Of Deaths
2
# Of Structures/
Claims2,3
Damage Estimates
2,4
(USD)
1/1-5/1 Drought China 0 Unknown 5.3+ billion
1/2 Earthquake Tajikistan 0 1,098+ 1.5+ million
1/2-1/12 Winter Weather China, South Korea, India 43+ 100,000+ 29+ million
1/3-1/9 Earthquake Solomon Islands 0 1,857+ Unknown
1/4 Landslide Pakistan 19+ 332+ 50,000+
1/9 Flooding Indonesia 3+ 5,713+ Unknown
1/17-1/18 Flooding Israel, Jordan 2+ 163+ Millions+
1/17-1/23 Winter Weather China 21+ 38,000+ 96+ million
1/21 Flooding Indonesia 8+ 2,000+ Unknown
1/31 Earthquake China 1+ 4,910+ 4.4+ million
One of the worst droughts in China’s recent history continued through January before finally breaking in May.
Chinese authorities noted at least 10 separate provinces that reported severe water shortages and crop damage. The
drought caused economic losses of CNY35 billion (USD5.3 billion) due to failed agriculture and falling electricity
generation from hydroelectric dams.
A magnitude-5.3 earthquake occurred in Tajikistan on the 2nd about 50 miles (75 kilometers) north of Khorugh. At
least 1,098 mostly mud dwellings were damaged or destroyed across 20 separate villages in the Vanj district of the
Pamir Mountains. According to the Emergency Services and Civil Defense Committee, at least TJS6.6 million
(USD1.5 million) in economic damages occurred.
Winter weather affected parts of China, South Korea and India between the 2nd and 12th. In China, Beijing recorded
its coldest morning low temperature in 40 years as heavy snow fell across 12 provinces and autonomous regions. At
least 100,000 homes were destroyed and four people were killed. The damage totaled CNY200 million (USD29
million) in economic loss. In South Korea, record amounts of snow blanketed the country on the 3rd and 4th, leading
to the closure of 46 main roads. In India, at least 39 people died in the Nepal region after an extended cold period
engulfed the country.
A series of earthquakes rattled the Solomon Islands in western sections of the Pacific Ocean between the 3rd and
9th, including one tremor that triggered a moderate tsunami. At least 30 separate temblors struck the region, the
strongest measuring 7.2 on the Richter scale. Reports from the islands indicated that no injuries or fatalities occurred,
though Solomon Island’s National Disaster Management Office reported widespread property damage throughout two
islands in Western Province (Rendova and Tetepare). Following the primary tremor, a tsunami impacted Rendova
Island as a tidal wave of two to three meters (six to 10 feet) washed through at least three separate villages. Official
damage reports indicated that 1,857 homes were damaged or destroyed on Rendova and Tetepare.

Aon Benfield: Impact Forecasting
61
Heavy rains triggered a series of landslides in Pakistan on the 4th, killing at least 19 people. The landslides damaged
or destroyed 332 homes in Hunza Valley of Gilgit Baltistan Province. Debris from the damaged homes eventually
clogged the Hunza River and led to additional coastal flooding. Local agencies donated PKR4.3 million (USD50,000)
for relief efforts.
Heavy rains killed at least nine people in Indonesia on the 9th. The monsoonal rains triggered floods that left at least
5,713 homes damaged or destroyed in Pasuruan, East Java.
In Israel and Jordan, rains on the 17th and 18th flooded at least 163 homes in the Gaza Strip as two people drowned.
According to regional officials, some parts of the Gaza Strip sustained floodwaters at upwards of three meters (ten
feet). Local farmers reported millions of dollars (USD) in damage to crops and equipment.
Heavy snow and extreme cold covered northwest sections of China between the 17th and 23rd, primarily in Xinjiang
Province and Mongolia. At least 21 people were killed, 1,304 others were injured and more than 38,000 homes were
damaged or destroyed. Officials from the Regional Civil Affairs Department reported that economic losses and relief
costs were CNY650 million (USD96 million).
Monsoonal rains led to the deaths of at least eight people in Indonesia on the 21st. The rains, which caused the
Rante Limbong River to burst its banks in Sulawesi Province, damaged at least 2,000 homes throughout five
separate villages. The floods cut off access to roads and shut down telecommunications.
A magnitude-5.1 earthquake struck China’s Sichuan Province on the 31st, killing at least one person and injuring 13
more people. The tremor damaged or destroyed 4,910 homes across eight separate townships in the province. Total
economic losses were estimated at CNY30 million (USD4.4 million).
February
Event Date
Event Name Or Type
1
Event Location
# Of Deaths
2
# Of Structures/
Claims2,3
Damage Estimates
2,4
(USD)
2/5 Winter Weather Iran 8+ 10+ Unknown
2/8-2/11 Winter Weather India 21+ Unknown Unknown
2/9 Winter Weather Afghanistan 204+ 3,800+ Unknown
2/13-2/19 Flooding Indonesia 0 2,469+ 215+ million
2/18 Winter Weather Pakistan 116+ 652+ Unknown
2/25 Winter Weather China 7+ Unknown Unknown
2/25 Earthquake China 0 3,172+ 882,000+
2/28-3/1 Winter Weather China 0 5,883+ 274+ million
At least eight people were killed and 49 people were injured after an avalanche struck the popular ski resorts of
Shemshak and Dizin in the northern sections of Iran on the 5th.
In India, three consecutive days of heavy snow fell between the 8th and 11th, which resulted in multiple avalanches
that killed at least 21 soldiers and injured 83 others at an army post in Kashmir.
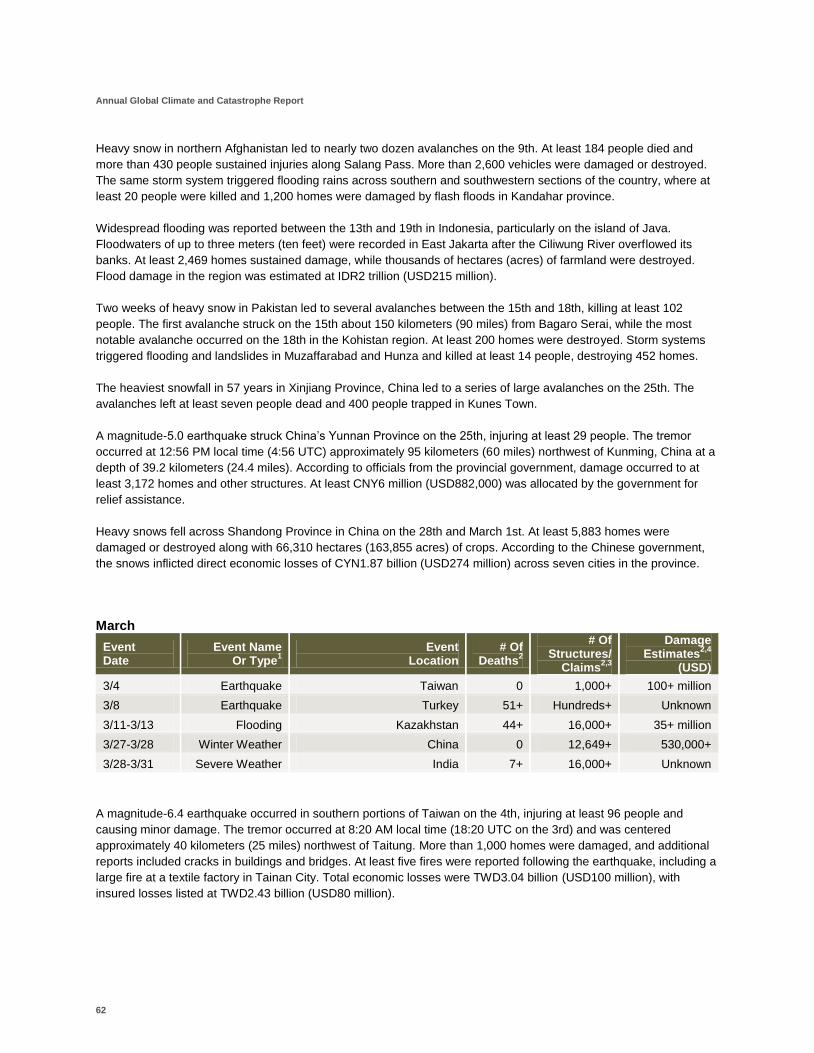
Annual Global Climate and Catastrophe Report
62
Heavy snow in northern Afghanistan led to nearly two dozen avalanches on the 9th. At least 184 people died and
more than 430 people sustained injuries along Salang Pass. More than 2,600 vehicles were damaged or destroyed.
The same storm system triggered flooding rains across southern and southwestern sections of the country, where at
least 20 people were killed and 1,200 homes were damaged by flash floods in Kandahar province.
Widespread flooding was reported between the 13th and 19th in Indonesia, particularly on the island of Java.
Floodwaters of up to three meters (ten feet) were recorded in East Jakarta after the Ciliwung River overflowed its
banks. At least 2,469 homes sustained damage, while thousands of hectares (acres) of farmland were destroyed.
Flood damage in the region was estimated at IDR2 trillion (USD215 million).
Two weeks of heavy snow in Pakistan led to several avalanches between the 15th and 18th, killing at least 102
people. The first avalanche struck on the 15th about 150 kilometers (90 miles) from Bagaro Serai, while the most
notable avalanche occurred on the 18th in the Kohistan region. At least 200 homes were destroyed. Storm systems
triggered flooding and landslides in Muzaffarabad and Hunza and killed at least 14 people, destroying 452 homes.
The heaviest snowfall in 57 years in Xinjiang Province, China led to a series of large avalanches on the 25th. The
avalanches left at least seven people dead and 400 people trapped in Kunes Town.
A magnitude-5.0 earthquake struck China’s Yunnan Province on the 25th, injuring at least 29 people. The tremor
occurred at 12:56 PM local time (4:56 UTC) approximately 95 kilometers (60 miles) northwest of Kunming, China at a
depth of 39.2 kilometers (24.4 miles). According to officials from the provincial government, damage occurred to at
least 3,172 homes and other structures. At least CNY6 million (USD882,000) was allocated by the government for
relief assistance.
Heavy snows fell across Shandong Province in China on the 28th and March 1st. At least 5,883 homes were
damaged or destroyed along with 66,310 hectares (163,855 acres) of crops. According to the Chinese government,
the snows inflicted direct economic losses of CYN1.87 billion (USD274 million) across seven cities in the province.
March
Event Date
Event Name Or Type
1
Event Location
# Of Deaths
2
# Of Structures/
Claims2,3
Damage Estimates
2,4
(USD)
3/4 Earthquake Taiwan 0 1,000+ 100+ million
3/8 Earthquake Turkey 51+ Hundreds+ Unknown
3/11-3/13 Flooding Kazakhstan 44+ 16,000+ 35+ million
3/27-3/28 Winter Weather China 0 12,649+ 530,000+
3/28-3/31 Severe Weather India 7+ 16,000+ Unknown
A magnitude-6.4 earthquake occurred in southern portions of Taiwan on the 4th, injuring at least 96 people and
causing minor damage. The tremor occurred at 8:20 AM local time (18:20 UTC on the 3rd) and was centered
approximately 40 kilometers (25 miles) northwest of Taitung. More than 1,000 homes were damaged, and additional
reports included cracks in buildings and bridges. At least five fires were reported following the earthquake, including a
large fire at a textile factory in Tainan City. Total economic losses were TWD3.04 billion (USD100 million), with
insured losses listed at TWD2.43 billion (USD80 million).
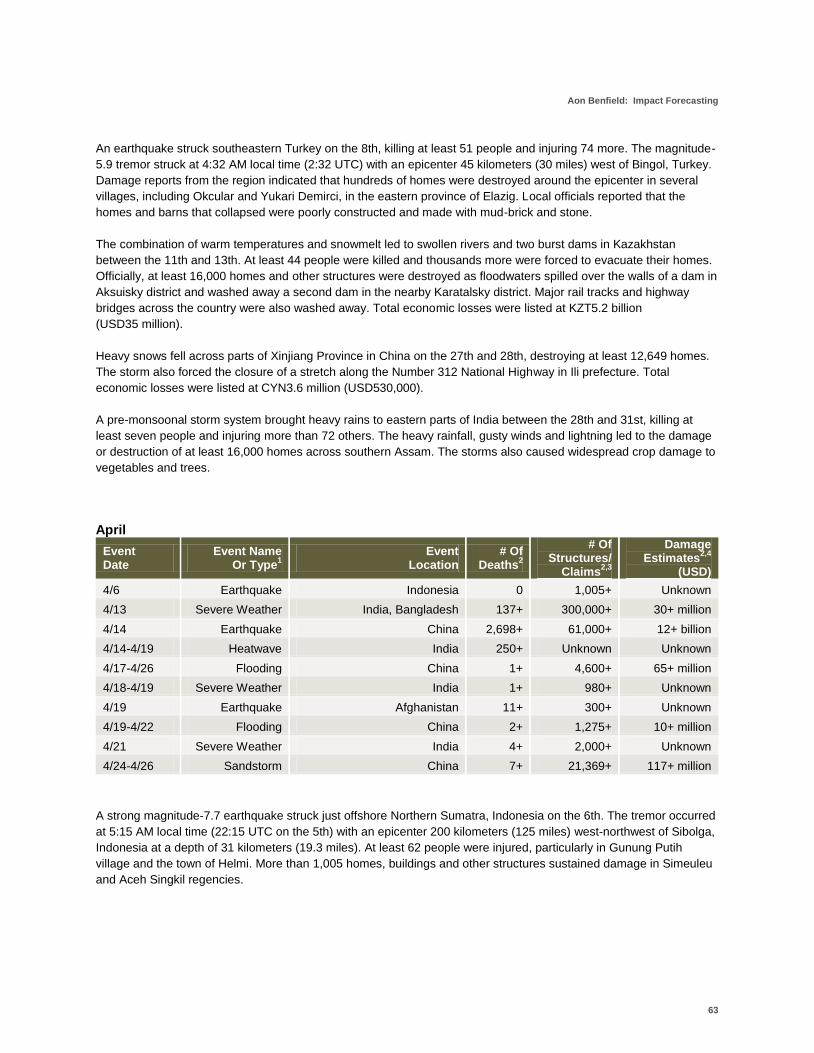
Aon Benfield: Impact Forecasting
63
An earthquake struck southeastern Turkey on the 8th, killing at least 51 people and injuring 74 more. The magnitude-
5.9 tremor struck at 4:32 AM local time (2:32 UTC) with an epicenter 45 kilometers (30 miles) west of Bingol, Turkey.
Damage reports from the region indicated that hundreds of homes were destroyed around the epicenter in several
villages, including Okcular and Yukari Demirci, in the eastern province of Elazig. Local officials reported that the
homes and barns that collapsed were poorly constructed and made with mud-brick and stone.
The combination of warm temperatures and snowmelt led to swollen rivers and two burst dams in Kazakhstan
between the 11th and 13th. At least 44 people were killed and thousands more were forced to evacuate their homes.
Officially, at least 16,000 homes and other structures were destroyed as floodwaters spilled over the walls of a dam in
Aksuisky district and washed away a second dam in the nearby Karatalsky district. Major rail tracks and highway
bridges across the country were also washed away. Total economic losses were listed at KZT5.2 billion
(USD35 million).
Heavy snows fell across parts of Xinjiang Province in China on the 27th and 28th, destroying at least 12,649 homes.
The storm also forced the closure of a stretch along the Number 312 National Highway in Ili prefecture. Total
economic losses were listed at CYN3.6 million (USD530,000).
A pre-monsoonal storm system brought heavy rains to eastern parts of India between the 28th and 31st, killing at
least seven people and injuring more than 72 others. The heavy rainfall, gusty winds and lightning led to the damage
or destruction of at least 16,000 homes across southern Assam. The storms also caused widespread crop damage to
vegetables and trees.
April
Event Date
Event Name Or Type
1
Event Location
# Of Deaths
2
# Of Structures/
Claims2,3
Damage Estimates
2,4
(USD)
4/6 Earthquake Indonesia 0 1,005+ Unknown
4/13 Severe Weather India, Bangladesh 137+ 300,000+ 30+ million
4/14 Earthquake China 2,698+ 61,000+ 12+ billion
4/14-4/19 Heatwave India 250+ Unknown Unknown
4/17-4/26 Flooding China 1+ 4,600+ 65+ million
4/18-4/19 Severe Weather India 1+ 980+ Unknown
4/19 Earthquake Afghanistan 11+ 300+ Unknown
4/19-4/22 Flooding China 2+ 1,275+ 10+ million
4/21 Severe Weather India 4+ 2,000+ Unknown
4/24-4/26 Sandstorm China 7+ 21,369+ 117+ million
A strong magnitude-7.7 earthquake struck just offshore Northern Sumatra, Indonesia on the 6th. The tremor occurred
at 5:15 AM local time (22:15 UTC on the 5th) with an epicenter 200 kilometers (125 miles) west-northwest of Sibolga,
Indonesia at a depth of 31 kilometers (19.3 miles). At least 62 people were injured, particularly in Gunung Putih
village and the town of Helmi. More than 1,005 homes, buildings and other structures sustained damage in Simeuleu
and Aceh Singkil regencies.

Annual Global Climate and Catastrophe Report
64
Severe thunderstorms ripped through eastern India and Bangladesh on the 13th, killing at least 137 people and
injuring more than 200 others. The storms damaged or destroyed at least 300,000 poorly constructed homes in
India’s West Bengal, Bihar and Assam states and also in parts of Bangladesh. At least one million people were left
homeless, and records indicate that this may be the greatest number of people ever left homeless by a severe
thunderstorm in world history. Total economic losses were listed by the regional governments at INR1.3 billion
(USD30 million).
A strong earthquake and subsequent aftershocks struck China’s Qinghai Province at 7:49 AM local time on the 14th
(23:49 UTC on the 13th), killing at least 2,698 people and injuring more than 12,135. The main tremor was measured
at magnitude-6.9 and was centered 375 kilometers (235 miles) south-southeast of Golmud, China at a depth of 10
kilometers (6.2 miles). According to government reports, the earthquake toppled or damaged at least 61,000 houses,
temples and schools. Several infrastructures were severely impacted as power poles were downed, roads and
airports were damaged and communication lines were cut. According to Chinese officials, total economic losses were
CYN80 billion (USD12 billion), while insured losses were estimated at CNY1.48 billion (USD222 million).
An extreme heat wave affected parts of India between the 14th and 19th, leading to the deaths of at least 250 people.
In Uttar Pradesh, hundreds of hectares (acres) of wheat crops were destroyed by fires driven by the extreme heat.
Heavy rainfall in central China between the 17th and 26th led flash flooding and the death of one person in Hunan
Province. The extended period of rains caused the Xiangjiang River to burst its banks and flood 304 townships
across 27 counties. At least 4,600 homes were destroyed along with 39,970 hectares (98,768 acres) of crops. The
direct economic loss was listed at CNY446 million (USD65 million).
Heavy rains in southern China between the 19th and 22nd led to the deaths of at least two people. The local Civil
Affairs Bureau reported that 1,275 homes had been destroyed due to flooding and that economic losses were CNY68
million (USD10 million).
Severe weather affected the Bishnupur, Thoubal and Chandel districts in Manipur state in India on the 18th and 19th.
At least one person was killed and five others were injured as several thunderstorms damaged at least 980 homes
and buildings.
A magnitude-5.4 earthquake struck central Afghanistan at 12:58 AM local time on the 19th (20:28 UTC on the 18th).
The tremor was centered 190 kilometers (115 miles) northwest of Kabul. Officials from the National Disaster
Management Office reported that at least 11 people were killed and 34 were injured. The earthquake primarily
affected Samangan Province, where three districts reported more than 300 homes destroyed.
On the 21st, a cluster of severe thunderstorms struck western and southern sections of Tripura state in India. At least
four people were killed as more than 2,000 homes were damaged.
Gusty winds triggered a fierce sandstorm in parts of China between the 24th and 26th, killing at least seven people
and injuring dozens more. In Gansu Province, more than 1,369 homes were severely damaged as sand-carrying
winds gusted to more than 100 kph (65 mph). At least 206,800 hectares (511,000 acres) of crops were damaged in
the province and reports indicated that a wind-driven fire damaged 14,000 vegetable greenhouses. Economic losses
from the event were estimated at CNY800 million (USD117 million).
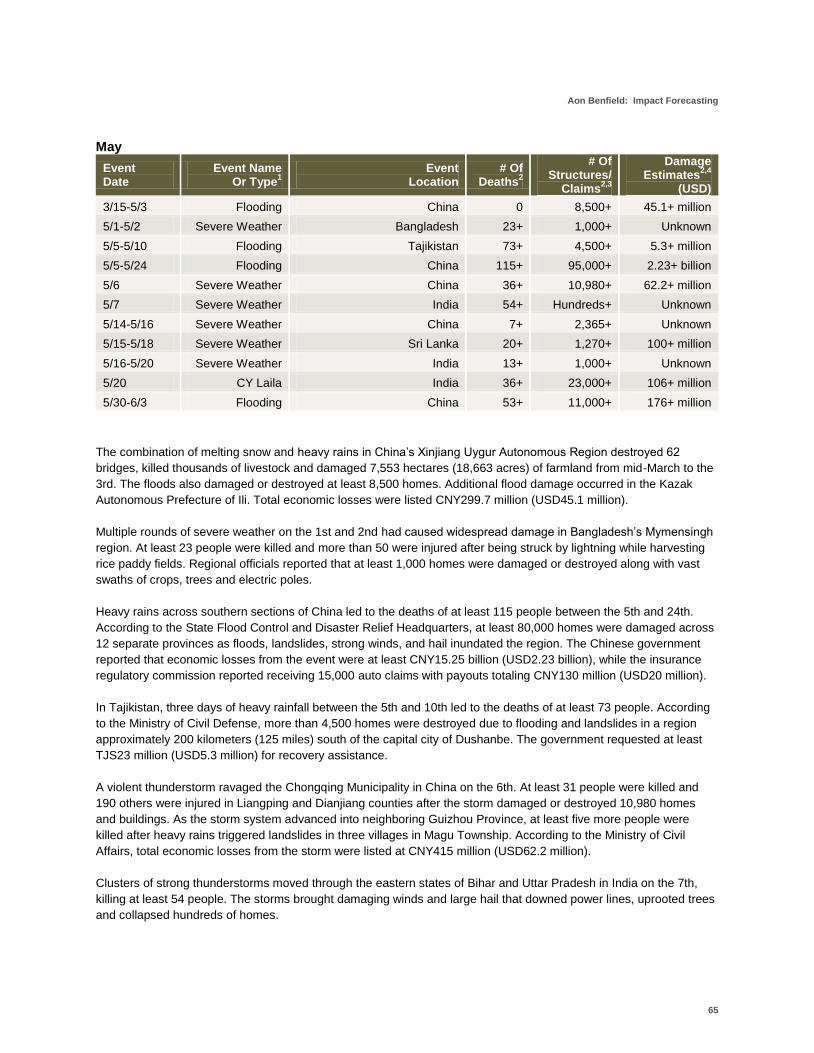
Aon Benfield: Impact Forecasting
65
May
Event Date
Event Name Or Type
1
Event Location
# Of Deaths
2
# Of Structures/
Claims2,3
Damage Estimates
2,4
(USD)
3/15-5/3 Flooding China 0 8,500+ 45.1+ million
5/1-5/2 Severe Weather Bangladesh 23+ 1,000+ Unknown
5/5-5/10 Flooding Tajikistan 73+ 4,500+ 5.3+ million
5/5-5/24 Flooding China 115+ 95,000+ 2.23+ billion
5/6 Severe Weather China 36+ 10,980+ 62.2+ million
5/7 Severe Weather India 54+ Hundreds+ Unknown
5/14-5/16 Severe Weather China 7+ 2,365+ Unknown
5/15-5/18 Severe Weather Sri Lanka 20+ 1,270+ 100+ million
5/16-5/20 Severe Weather India 13+ 1,000+ Unknown
5/20 CY Laila India 36+ 23,000+ 106+ million
5/30-6/3 Flooding China 53+ 11,000+ 176+ million
The combination of melting snow and heavy rains in China’s Xinjiang Uygur Autonomous Region destroyed 62
bridges, killed thousands of livestock and damaged 7,553 hectares (18,663 acres) of farmland from mid-March to the
3rd. The floods also damaged or destroyed at least 8,500 homes. Additional flood damage occurred in the Kazak
Autonomous Prefecture of Ili. Total economic losses were listed CNY299.7 million (USD45.1 million).
Multiple rounds of severe weather on the 1st and 2nd had caused widespread damage in Bangladesh’s Mymensingh
region. At least 23 people were killed and more than 50 were injured after being struck by lightning while harvesting
rice paddy fields. Regional officials reported that at least 1,000 homes were damaged or destroyed along with vast
swaths of crops, trees and electric poles.
Heavy rains across southern sections of China led to the deaths of at least 115 people between the 5th and 24th.
According to the State Flood Control and Disaster Relief Headquarters, at least 80,000 homes were damaged across
12 separate provinces as floods, landslides, strong winds, and hail inundated the region. The Chinese government
reported that economic losses from the event were at least CNY15.25 billion (USD2.23 billion), while the insurance
regulatory commission reported receiving 15,000 auto claims with payouts totaling CNY130 million (USD20 million).
In Tajikistan, three days of heavy rainfall between the 5th and 10th led to the deaths of at least 73 people. According
to the Ministry of Civil Defense, more than 4,500 homes were destroyed due to flooding and landslides in a region
approximately 200 kilometers (125 miles) south of the capital city of Dushanbe. The government requested at least
TJS23 million (USD5.3 million) for recovery assistance.
A violent thunderstorm ravaged the Chongqing Municipality in China on the 6th. At least 31 people were killed and
190 others were injured in Liangping and Dianjiang counties after the storm damaged or destroyed 10,980 homes
and buildings. As the storm system advanced into neighboring Guizhou Province, at least five more people were
killed after heavy rains triggered landslides in three villages in Magu Township. According to the Ministry of Civil
Affairs, total economic losses from the storm were listed at CNY415 million (USD62.2 million).
Clusters of strong thunderstorms moved through the eastern states of Bihar and Uttar Pradesh in India on the 7th,
killing at least 54 people. The storms brought damaging winds and large hail that downed power lines, uprooted trees
and collapsed hundreds of homes.
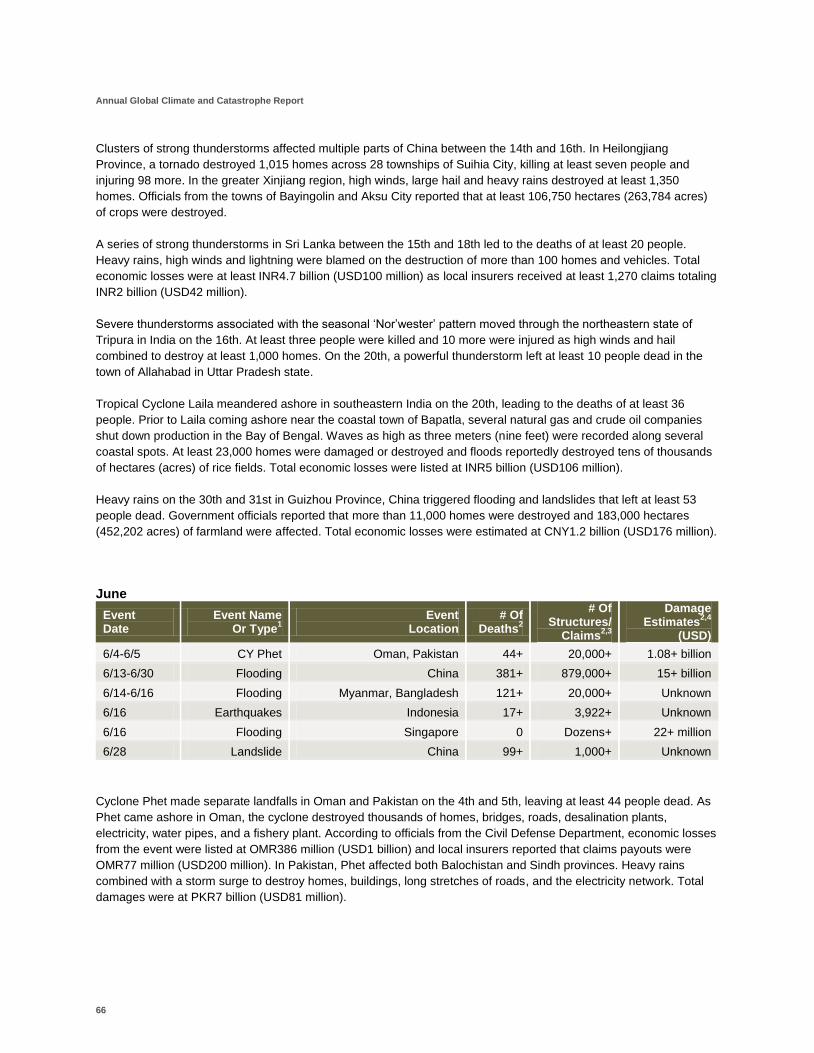
Annual Global Climate and Catastrophe Report
66
Clusters of strong thunderstorms affected multiple parts of China between the 14th and 16th. In Heilongjiang
Province, a tornado destroyed 1,015 homes across 28 townships of Suihia City, killing at least seven people and
injuring 98 more. In the greater Xinjiang region, high winds, large hail and heavy rains destroyed at least 1,350
homes. Officials from the towns of Bayingolin and Aksu City reported that at least 106,750 hectares (263,784 acres)
of crops were destroyed.
A series of strong thunderstorms in Sri Lanka between the 15th and 18th led to the deaths of at least 20 people.
Heavy rains, high winds and lightning were blamed on the destruction of more than 100 homes and vehicles. Total
economic losses were at least INR4.7 billion (USD100 million) as local insurers received at least 1,270 claims totaling
INR2 billion (USD42 million).
Severe thunderstorms associated with the seasonal ‘Nor’wester’ pattern moved through the northeastern state of
Tripura in India on the 16th. At least three people were killed and 10 more were injured as high winds and hail
combined to destroy at least 1,000 homes. On the 20th, a powerful thunderstorm left at least 10 people dead in the
town of Allahabad in Uttar Pradesh state.
Tropical Cyclone Laila meandered ashore in southeastern India on the 20th, leading to the deaths of at least 36
people. Prior to Laila coming ashore near the coastal town of Bapatla, several natural gas and crude oil companies
shut down production in the Bay of Bengal. Waves as high as three meters (nine feet) were recorded along several
coastal spots. At least 23,000 homes were damaged or destroyed and floods reportedly destroyed tens of thousands
of hectares (acres) of rice fields. Total economic losses were listed at INR5 billion (USD106 million).
Heavy rains on the 30th and 31st in Guizhou Province, China triggered flooding and landslides that left at least 53
people dead. Government officials reported that more than 11,000 homes were destroyed and 183,000 hectares
(452,202 acres) of farmland were affected. Total economic losses were estimated at CNY1.2 billion (USD176 million).
June
Event Date
Event Name Or Type
1
Event Location
# Of Deaths
2
# Of Structures/
Claims2,3
Damage Estimates
2,4
(USD)
6/4-6/5 CY Phet Oman, Pakistan 44+ 20,000+ 1.08+ billion
6/13-6/30 Flooding China 381+ 879,000+ 15+ billion
6/14-6/16 Flooding Myanmar, Bangladesh 121+ 20,000+ Unknown
6/16 Earthquakes Indonesia 17+ 3,922+ Unknown
6/16 Flooding Singapore 0 Dozens+ 22+ million
6/28 Landslide China 99+ 1,000+ Unknown
Cyclone Phet made separate landfalls in Oman and Pakistan on the 4th and 5th, leaving at least 44 people dead. As
Phet came ashore in Oman, the cyclone destroyed thousands of homes, bridges, roads, desalination plants,
electricity, water pipes, and a fishery plant. According to officials from the Civil Defense Department, economic losses
from the event were listed at OMR386 million (USD1 billion) and local insurers reported that claims payouts were
OMR77 million (USD200 million). In Pakistan, Phet affected both Balochistan and Sindh provinces. Heavy rains
combined with a storm surge to destroy homes, buildings, long stretches of roads, and the electricity network. Total
damages were at PKR7 billion (USD81 million).
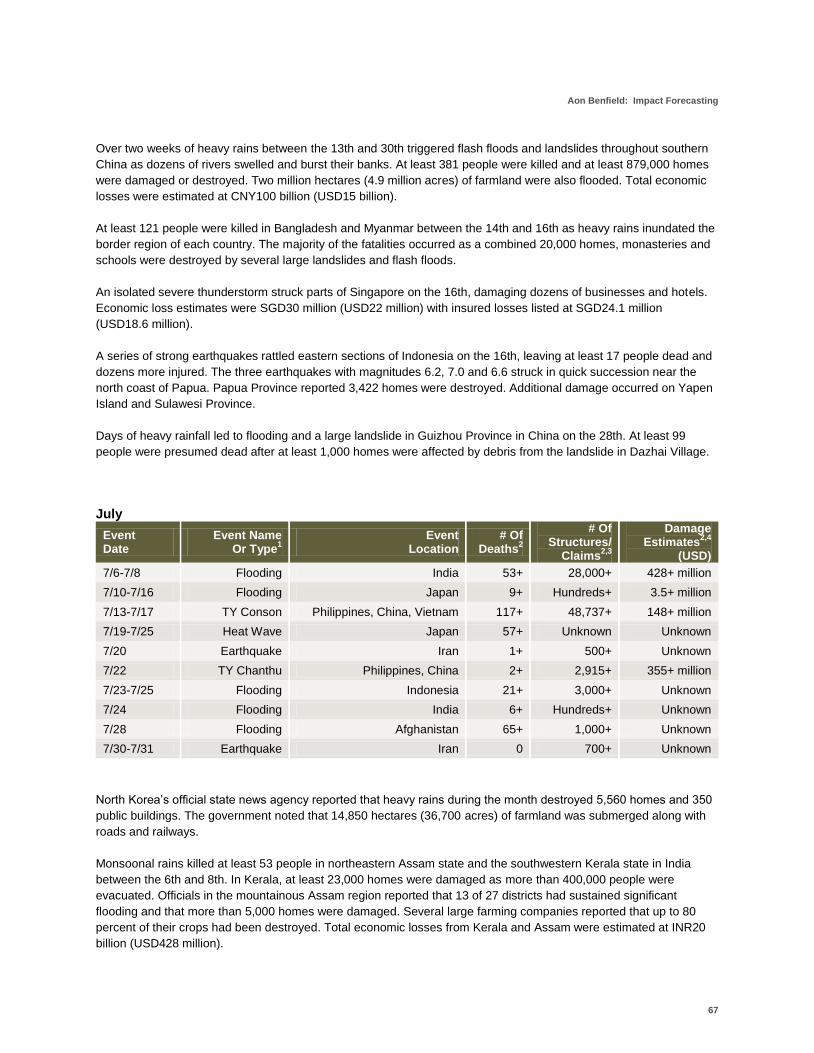
Aon Benfield: Impact Forecasting
67
Over two weeks of heavy rains between the 13th and 30th triggered flash floods and landslides throughout southern
China as dozens of rivers swelled and burst their banks. At least 381 people were killed and at least 879,000 homes
were damaged or destroyed. Two million hectares (4.9 million acres) of farmland were also flooded. Total economic
losses were estimated at CNY100 billion (USD15 billion).
At least 121 people were killed in Bangladesh and Myanmar between the 14th and 16th as heavy rains inundated the
border region of each country. The majority of the fatalities occurred as a combined 20,000 homes, monasteries and
schools were destroyed by several large landslides and flash floods.
An isolated severe thunderstorm struck parts of Singapore on the 16th, damaging dozens of businesses and hotels.
Economic loss estimates were SGD30 million (USD22 million) with insured losses listed at SGD24.1 million
(USD18.6 million).
A series of strong earthquakes rattled eastern sections of Indonesia on the 16th, leaving at least 17 people dead and
dozens more injured. The three earthquakes with magnitudes 6.2, 7.0 and 6.6 struck in quick succession near the
north coast of Papua. Papua Province reported 3,422 homes were destroyed. Additional damage occurred on Yapen
Island and Sulawesi Province.
Days of heavy rainfall led to flooding and a large landslide in Guizhou Province in China on the 28th. At least 99
people were presumed dead after at least 1,000 homes were affected by debris from the landslide in Dazhai Village.
July
Event Date
Event Name Or Type
1
Event Location
# Of Deaths
2
# Of Structures/
Claims2,3
Damage Estimates
2,4
(USD)
7/6-7/8 Flooding India 53+ 28,000+ 428+ million
7/10-7/16 Flooding Japan 9+ Hundreds+ 3.5+ million
7/13-7/17 TY Conson Philippines, China, Vietnam 117+ 48,737+ 148+ million
7/19-7/25 Heat Wave Japan 57+ Unknown Unknown
7/20 Earthquake Iran 1+ 500+ Unknown
7/22 TY Chanthu Philippines, China 2+ 2,915+ 355+ million
7/23-7/25 Flooding Indonesia 21+ 3,000+ Unknown
7/24 Flooding India 6+ Hundreds+ Unknown
7/28 Flooding Afghanistan 65+ 1,000+ Unknown
7/30-7/31 Earthquake Iran 0 700+ Unknown
North Korea’s official state news agency reported that heavy rains during the month destroyed 5,560 homes and 350
public buildings. The government noted that 14,850 hectares (36,700 acres) of farmland was submerged along with
roads and railways.
Monsoonal rains killed at least 53 people in northeastern Assam state and the southwestern Kerala state in India
between the 6th and 8th. In Kerala, at least 23,000 homes were damaged as more than 400,000 people were
evacuated. Officials in the mountainous Assam region reported that 13 of 27 districts had sustained significant
flooding and that more than 5,000 homes were damaged. Several large farming companies reported that up to 80
percent of their crops had been destroyed. Total economic losses from Kerala and Assam were estimated at INR20
billion (USD428 million).
Annual Global Climate and Catastrophe Report
68
Heavy rains in central, western and southern Japan led to the deaths of at least nine people between the 10th and
16th. Reports from Japan indicated that both floodwaters and landslides led to damage to hundreds of homes,
businesses and vehicles. Widespread damage to farmlands was also reported. Economic losses were listed at
JPY300 million (USD3.5 million).
Typhoon Conson became the first landfalling cyclone of the 2010 West Pacific Hurricane Season. Conson officially
made its first landfall on the 13th in southern Luzon province in the Philippines. According to the Philippines’ National
Disaster Coordinating Council, Conson killed at least 104 people and damaged or destroyed at least 46,650 homes.
The transportation and agricultural infrastructures were also affected. Economic losses were estimated at PHP378
million (USD8.1 million). Conson skirted southern China’s Hainan Island on the 16th, destroying at least 544 homes,
killing two people and causing economic losses of CNY500 million (USD73.8 million). The cyclone made a final
landfall in Vietnam just south of Hanoi on the 17th, killing at least 11 peope and damaging more than 1,500 homes
and other structures. Total economic losses were estimated at VND1.3 billion (USD66 million).
A week of extreme heat engulfed much of Japan between the 19th and 25th, leaving at least 57 people dead and
nearly 10,000 hospitalized. According to Japanese meteorologists, temperatures reached at least 35°C (95°F) across
more than 90 percent of countrywide observation points.
An earthquake struck southern sections of Iran on the 20th, leaving at least one person dead and dozens more
injured. The magnitude-5.8 tremor struck at 11:08 PM local time (19:38 UTC) with an epicenter approximately 90
kilometers (55 miles) south-southwest of Lar, Iran. According to reports from Iran’s state-run media, the majority of
the damage was confined to Fars Province in the town of Lamerd, where 50 to 70 percent of all residences had been
destroyed in four separate villages.
Typhoon Chanthu made landfall in China’s Guangdong Province on the 22nd. Chanthu was responsible for the
deaths of at least two people and the displacement of 1.36 million throughout southern China. At least 2,915 homes
were destroyed and total economic losses were CNY2.4 billion (USD355 million).
Landslides and floods killed at least 21 people in the Indonesian provinces of Maluku and South Kalimantan between
the 23rd and 25th. At least 3,000 homes were destroyed.
Monsoonal rains on the 24th in northern India led to six fatalities and widespread damage to the agricultural and
transportation infrastructures.
At least 65 people were killed in Afghanistan’s Kapisa and Laghman provinces on the 28th as nearly 1,000 homes
were washed away. Crops were also severely damaged in the region.
Two earthquakes struck Iran on the 30th and 31st with magnitudes 5.6 and 5.3. The first tremor struck at 5:20 PM
local time (13:50 UTC) with an epicenter near Torbat-Heydarieh. The second temblor struck on the 31st at 10:22 AM
local time (6:52 UTC) with an epicenter 95 kilometers (60 miles) south-southwest of Kerman. The earthquakes
reportedly flattened at least 700 mud and brick homes in several rural villages and caused widespread
communication disruptions. More than 275 people sustained injuries.
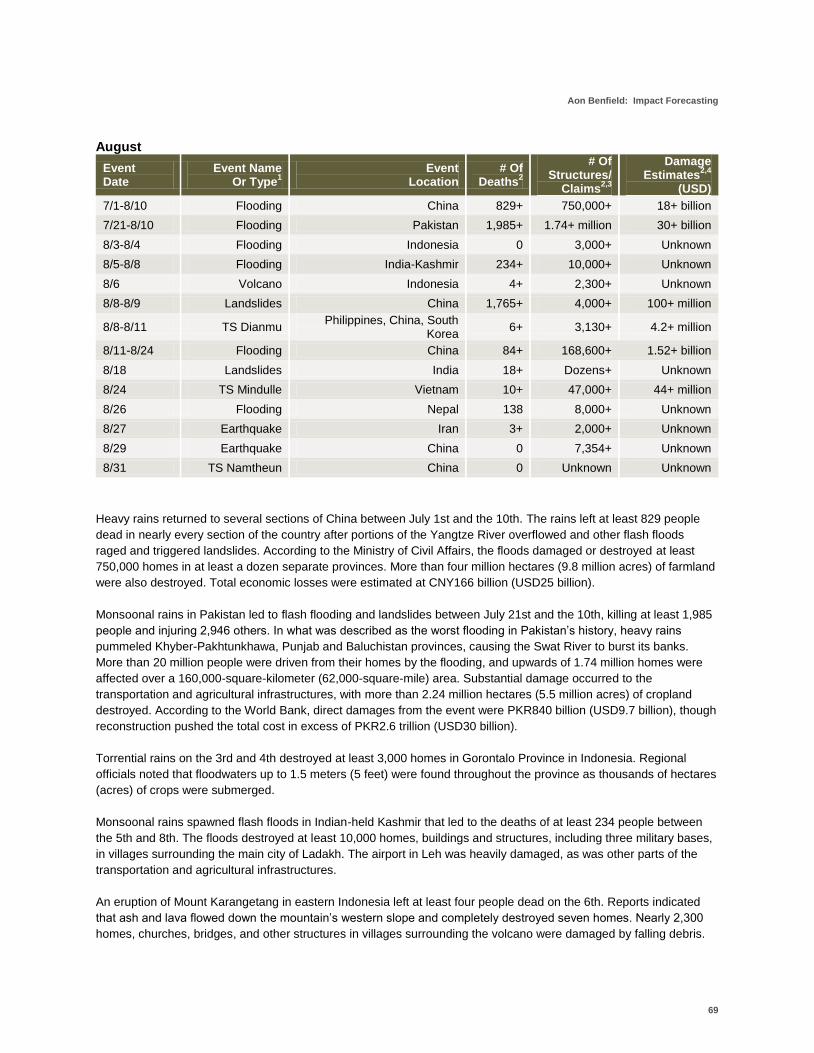
Aon Benfield: Impact Forecasting
69
August
Event Date
Event Name Or Type
1
Event Location
# Of Deaths
2
# Of Structures/
Claims2,3
Damage Estimates
2,4
(USD)
7/1-8/10 Flooding China 829+ 750,000+ 18+ billion
7/21-8/10 Flooding Pakistan 1,985+ 1.74+ million 30+ billion
8/3-8/4 Flooding Indonesia 0 3,000+ Unknown
8/5-8/8 Flooding India-Kashmir 234+ 10,000+ Unknown
8/6 Volcano Indonesia 4+ 2,300+ Unknown
8/8-8/9 Landslides China 1,765+ 4,000+ 100+ million
8/8-8/11 TS Dianmu Philippines, China, South
Korea 6+ 3,130+ 4.2+ million
8/11-8/24 Flooding China 84+ 168,600+ 1.52+ billion
8/18 Landslides India 18+ Dozens+ Unknown
8/24 TS Mindulle Vietnam 10+ 47,000+ 44+ million
8/26 Flooding Nepal 138 8,000+ Unknown
8/27 Earthquake Iran 3+ 2,000+ Unknown
8/29 Earthquake China 0 7,354+ Unknown
8/31 TS Namtheun China 0 Unknown Unknown
Heavy rains returned to several sections of China between July 1st and the 10th. The rains left at least 829 people
dead in nearly every section of the country after portions of the Yangtze River overflowed and other flash floods
raged and triggered landslides. According to the Ministry of Civil Affairs, the floods damaged or destroyed at least
750,000 homes in at least a dozen separate provinces. More than four million hectares (9.8 million acres) of farmland
were also destroyed. Total economic losses were estimated at CNY166 billion (USD25 billion).
Monsoonal rains in Pakistan led to flash flooding and landslides between July 21st and the 10th, killing at least 1,985
people and injuring 2,946 others. In what was described as the worst flooding in Pakistan’s history, heavy rains
pummeled Khyber-Pakhtunkhawa, Punjab and Baluchistan provinces, causing the Swat River to burst its banks.
More than 20 million people were driven from their homes by the flooding, and upwards of 1.74 million homes were
affected over a 160,000-square-kilometer (62,000-square-mile) area. Substantial damage occurred to the
transportation and agricultural infrastructures, with more than 2.24 million hectares (5.5 million acres) of cropland
destroyed. According to the World Bank, direct damages from the event were PKR840 billion (USD9.7 billion), though
reconstruction pushed the total cost in excess of PKR2.6 trillion (USD30 billion).
Torrential rains on the 3rd and 4th destroyed at least 3,000 homes in Gorontalo Province in Indonesia. Regional
officials noted that floodwaters up to 1.5 meters (5 feet) were found throughout the province as thousands of hectares
(acres) of crops were submerged.
Monsoonal rains spawned flash floods in Indian-held Kashmir that led to the deaths of at least 234 people between
the 5th and 8th. The floods destroyed at least 10,000 homes, buildings and structures, including three military bases,
in villages surrounding the main city of Ladakh. The airport in Leh was heavily damaged, as was other parts of the
transportation and agricultural infrastructures.
An eruption of Mount Karangetang in eastern Indonesia left at least four people dead on the 6th. Reports indicated
that ash and lava flowed down the mountain’s western slope and completely destroyed seven homes. Nearly 2,300
homes, churches, bridges, and other structures in villages surrounding the volcano were damaged by falling debris.
Annual Global Climate and Catastrophe Report
70
A series of massive landslides on the 8th and 9th in northwest China’s Gansu Province left at least 1,765 people
dead and 2,000 injured. The landslides occurred in Zhouqu County and destroyed at least 4,000 homes. Total
economic losses were listed at CNY664 million (USD100 million), while insured losses were CNY26.2 million
(USD3.94 million).
Tropical Storm Dianmu developed on the 8th and crossed the Philippines before making a final landfall in South
Korea on the 11th. At least six people were killed. After skirting the Philippines, Dianmu headed northward across the
East China Sea and affected coastal sections of China, destroying at least 3,130 homes and more than 159,000
hectares (393,000 acres) of farmland. On the 11th, Dianmu made its only landfall along South Korea’s southern
coastline as high winds and floods caused property and infrastructure damage. Total economic losses were
USD4.2 million.
Torrential rains fell across parts of Gansu, Sichuan, Shaanxi, and Yunnan provinces in China between the 11th and
24th. At least 84 people were killed and 302 were injured as the rains triggered flash flooding and landslides.
According to government officials, more than 168,600 homes were damaged, 115,000 hectares (284,000 acres) of
crops were submerged and economic losses were estimated at CNY10.2 billion (USD1.52 billion).
Heavy rains triggered a large mudslide in northern India on the 18th. At least 18 children were killed after the slide
destroyed a school building in the village of Sumgarh in Uttrakhand state.
Tropical Storm Mindulle developed and made landfall in Vietnam on the 24th, killing at least 10 people and injuring 64
others. According to Vietnam’s Central Committee for Flood and Storm Control, Mindulle came ashore near the city of
Vinh and caused damage to homes, schools, hospitals, fishing vessels, and crops. The government reported that
47,000 homes were destroyed and that 64,000 hectares (158,000 acres) of rice crops had been submerged. The
majority of the damage and fatalities occurred in Thanh Hoa, Quang Tri and Nghe An provinces. Economic losses
were estimated at VND850 billion (USD44 million).
At least 8,000 homes were flooded in the Jhapa district in eastern Nepal after heavy rains on the 26th caused the
Lohandra River to breach several embankments. The villages of Itahara and Baradanga were the most seriously
affected with 138 people killed.
A magnitude-5.7 earthquake struck northern Iran on the 27th, killing at least three people and injuring more than 40
others. The tremor struck at 10:53 PM local time (19:23 UTC) with an epicenter 105 kilometers (65 miles) east of
Semnan, Iran. According to Iranian state-run media, at least 2,000 homes sustained damage in Semnan Province.
A magnitude-5.0 earthquake struck southwest China on the 29th, leaving at least 14 people injured. The tremor
struck at 8:53 AM local time (00:53 UTC) with an epicenter 145 kilometers (90 miles) east-northeast of Panzhihua,
China. The jolt was felt right along the Yunnan/Sichuan province border. Most of the damage occurred in Qiaojia
County in Yunnan Province, where at least 7,354 homes were destroyed.
Tropical Storm Namtheun, a small tropical system with 65 kph (40 mph) winds, came ashore in Hui’an County, Fujian
Province, China at 11:50 PM local time on the 31st. The storm brought periods of heavy rainfall, but only minimal
damage was reported.
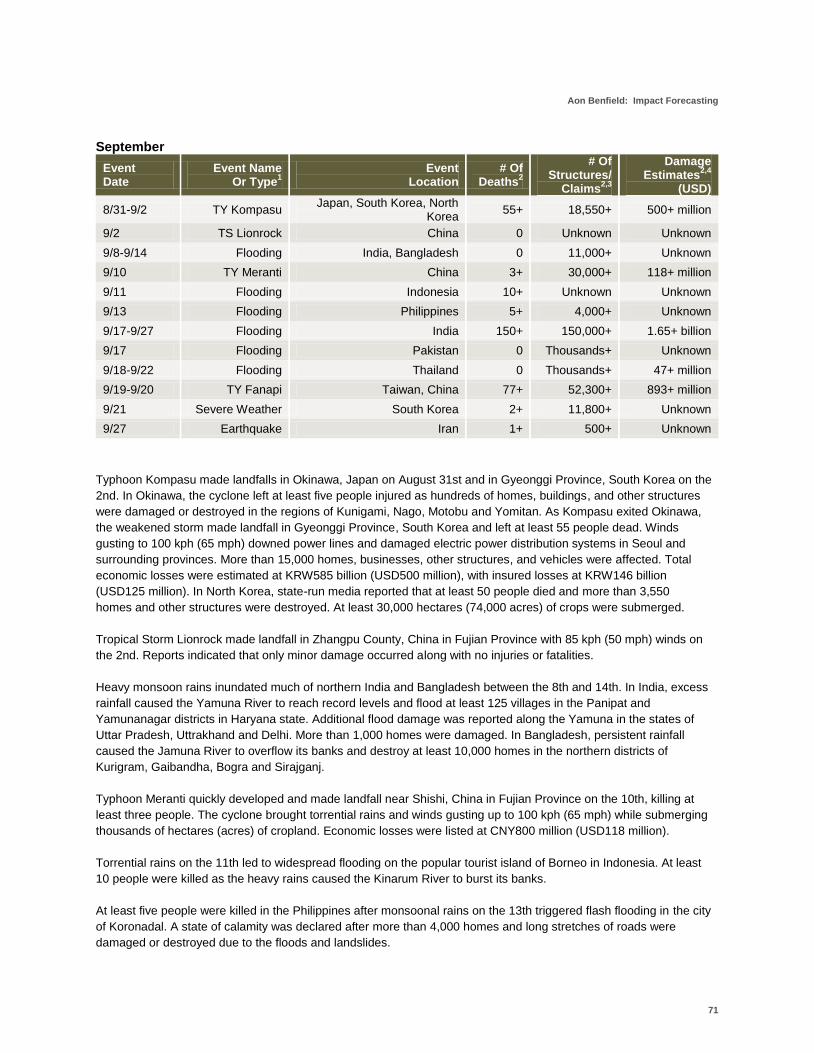
Aon Benfield: Impact Forecasting
71
September
Event Date
Event Name Or Type
1
Event Location
# Of Deaths
2
# Of Structures/
Claims2,3
Damage Estimates
2,4
(USD)
8/31-9/2 TY Kompasu Japan, South Korea, North
Korea 55+ 18,550+ 500+ million
9/2 TS Lionrock China 0 Unknown Unknown
9/8-9/14 Flooding India, Bangladesh 0 11,000+ Unknown
9/10 TY Meranti China 3+ 30,000+ 118+ million
9/11 Flooding Indonesia 10+ Unknown Unknown
9/13 Flooding Philippines 5+ 4,000+ Unknown
9/17-9/27 Flooding India 150+ 150,000+ 1.65+ billion
9/17 Flooding Pakistan 0 Thousands+ Unknown
9/18-9/22 Flooding Thailand 0 Thousands+ 47+ million
9/19-9/20 TY Fanapi Taiwan, China 77+ 52,300+ 893+ million
9/21 Severe Weather South Korea 2+ 11,800+ Unknown
9/27 Earthquake Iran 1+ 500+ Unknown
Typhoon Kompasu made landfalls in Okinawa, Japan on August 31st and in Gyeonggi Province, South Korea on the
2nd. In Okinawa, the cyclone left at least five people injured as hundreds of homes, buildings, and other structures
were damaged or destroyed in the regions of Kunigami, Nago, Motobu and Yomitan. As Kompasu exited Okinawa,
the weakened storm made landfall in Gyeonggi Province, South Korea and left at least 55 people dead. Winds
gusting to 100 kph (65 mph) downed power lines and damaged electric power distribution systems in Seoul and
surrounding provinces. More than 15,000 homes, businesses, other structures, and vehicles were affected. Total
economic losses were estimated at KRW585 billion (USD500 million), with insured losses at KRW146 billion
(USD125 million). In North Korea, state-run media reported that at least 50 people died and more than 3,550
homes and other structures were destroyed. At least 30,000 hectares (74,000 acres) of crops were submerged.
Tropical Storm Lionrock made landfall in Zhangpu County, China in Fujian Province with 85 kph (50 mph) winds on
the 2nd. Reports indicated that only minor damage occurred along with no injuries or fatalities.
Heavy monsoon rains inundated much of northern India and Bangladesh between the 8th and 14th. In India, excess
rainfall caused the Yamuna River to reach record levels and flood at least 125 villages in the Panipat and
Yamunanagar districts in Haryana state. Additional flood damage was reported along the Yamuna in the states of
Uttar Pradesh, Uttrakhand and Delhi. More than 1,000 homes were damaged. In Bangladesh, persistent rainfall
caused the Jamuna River to overflow its banks and destroy at least 10,000 homes in the northern districts of
Kurigram, Gaibandha, Bogra and Sirajganj.
Typhoon Meranti quickly developed and made landfall near Shishi, China in Fujian Province on the 10th, killing at
least three people. The cyclone brought torrential rains and winds gusting up to 100 kph (65 mph) while submerging
thousands of hectares (acres) of cropland. Economic losses were listed at CNY800 million (USD118 million).
Torrential rains on the 11th led to widespread flooding on the popular tourist island of Borneo in Indonesia. At least
10 people were killed as the heavy rains caused the Kinarum River to burst its banks.
At least five people were killed in the Philippines after monsoonal rains on the 13th triggered flash flooding in the city
of Koronadal. A state of calamity was declared after more than 4,000 homes and long stretches of roads were
damaged or destroyed due to the floods and landslides.
Annual Global Climate and Catastrophe Report
72
Monsoonal rains between the 17th and 27th in northern India led to the deaths of more than 150 people. The most
affected states were Uttar Pradesh, Bihar and Uttarakhand after heavy rains forced several Himalayan rivers,
including the Gandhak and Ganges, to burst their banks at multiple locations. The rains affected more than three
million people, damaged nearly 150,000 homes and submerged more than 500,000 hectares (1.2 million acres) of
cropland. The transportation infrastructure sustained major effects as train routes were suspended and long stretches
of the Delhi-Dehradun-Rishikesh Highway were submerged. Total economic losses were listed at INR75 billion
(USD1.65 billion).
Heavy monsoonal rains continued to affect southern Sindh Province in Pakistan as Lake Manchar overflowed its
banks on the 17th. The floods left at least 100,000 people displaced from their homes and destroyed a wide swath
of crops.
Several sections of Thailand endured heavy monsoonal rains between the 18th and 22nd. According to the Ministry
of Agriculture and Cooperatives, at least 210,000 people were affected by floods that also destroyed more than
304,000 hectares (751,000 acres) of crops. Total economic losses were estimated at THB1.43 billion
(USD47 million).
Typhoon Fanapi made landfalls in Taiwan and China on the 19th and 20th. Fanapi made an initial landfall in Hualien
County, Taiwan on the 19th with 195 kph (120 mph) winds. At least two people were killed as the cyclone caused
extensive flooding and landslides throughout the country. The Economics Ministry reported that total damages from
Fanapi were estimated at TWD5 billion (USD158 million). A weakened Fanapi made a second and final landfall in
Fujian Province, China on the 20th. The cyclone spread heavy rains throughout southeast China, causing extensive
flooding and landslides. Officials in Guangdong Province reported that more than 50,000 homes were damaged or
destroyed along with 66,400 hectares (164,000 acres) of crops. At least 75 people died. Total economic losses from
Fanapi in China were estimated at CYN5 billion (USD735 million).
A strong thunderstorm on the 21st in South Korea caused flash floods in parts of Seoul. The National Emergency
Management Agency reported that 11,800 homes as well as numerous roads and subway lines sustained damage.
At least two people were swept away by a swollen river in Gangwon Province.
A USGS-measured magnitude-5.5 earthquake struck southern sections of Iran on the 27th, killing at least one person
and injuring 32 others. The tremor struck at 2:52 PM local time (11:22 UTC) with an epicenter near Kazerun, Iran.
According to Iranian officials, widespread damage occurred to 30 percent of all buildings in four separate villages
across the southern provinces of Fars and Bushehr.

Aon Benfield: Impact Forecasting
73
October
Event Date
Event Name Or Type
1
Event Location
# Of Deaths
2
# Of Structures/
Claims2,3
Damage Estimates
2,4
(USD)
9/30-10/6 Flooding China 1+ 50,000+ 1.37+ billion
10/1-10/6 Flooding Indonesia 173+ 25,000+ 78.4+ million
10/2-10/7 Flooding Vietnam 64+ 70,000+ 138+ million
10/10-10/25 Flooding Thailand 179+ 1.5+ million 1.3+ billion
10/10-10/20 Flooding Cambodia 8+ 50,000+ 70+ million
10/12 Flooding Indonesia 11+ 8,000+ Unknown
10/14-10/18 Flooding Vietnam 75+ 280,000+ 150+ million
10/15-10/17 Flooding China 0 50,000+ 232+ million
10/17-10/23 STY Megi Philippines, China, Taiwan 51+ 150,000+ 695+ million
10/20-10/21 Flooding Japan 2+ 2,000+ Unknown
10/22 CY Giri Myanmar 27+ 70,000+ Unknown
10/25 EQ/Tsunami Indonesia 509+ 15,000+ 65.1+ million
10/25 Volcano Indonesia 324+ 30,000+ 628+ million
10/30-10/31 Flooding Vietnam 13+ 50,000+ 20+ million
Heavy rains from Tropical Depression Fourteen and other tropical moisture impacted southern sections of China
between September 30th and the 6th. Up to 2.7 million people were affected on the island province of Hainan as
floods damaged or destroyed more than 50,000 homes and other structures. The floods also submerged 166,700
hectares (412,000 acres) of crops. Total economic losses were listed at CNY91 billion (USD1.37 billion), with insured
losses CNY166 million (USD25 million).
Monsoon rains brought flooding and landslides to eastern Indonesia’s West Papua province between the 1st and 6th.
According to the National Disaster Management Agency, at least 173 people died and 957 more were injured during
the event. Severe damage to the electrical and transportation infrastructures made communication difficult as power
lines fell, bridges collapsed and the local airport was non-operational. Reports noted that 25,000 homes and other
structures had been damaged. Total economic losses were IDR700 billion (USD78.4 million).
Monsoonal moisture combined with Tropical Depression Fourteen brought heavy rainfall between the 2nd and 7th in
Vietnam. According to the Vietnamese government, at least 64 people died in the provinces of Ha Tinh, Quang Binh,
Nghe An, Thua Thien-Hue and Quang Tri. Reports indicated that at least 70,000 homes were destroyed by floods
and landslides and that the transportation infrastructure was severely impacted. Total economic losses were listed at
VND2.75 trillion (USD138 million).
The worst flooding in decades affected 29 provinces in Thailand between the 10th and 25th. At least 179 people were
killed, and 1.5 million homes, structures and farms were submerged. According to the Department of Disaster
Prevention and Mitigation, 647,497 hectares (1.6 million acres) of crops were damaged and the transportation
infrastructure had several main roads and railways washed away or submerged. Floods also affected the capital city
of Bangkok after the Chao Phraya River overflowed its banks. Total economic losses from the event were estimated
at THB38.8 billion (USD1.3 billion).
Annual Global Climate and Catastrophe Report
74
Heavy monsoonal rains that fell between the 10th and 20th in Cambodia led to the deaths of at least eight people.
The National Committee for Disaster Management reported that 50,000 homes were destroyed in 13 provinces, and
significant damage occurred to roads, bridges and irrigation systems. Reports noted that 10,000 hectares (24,700
acres) of rice fields were submerged. Total economic losses from the floods were estimated at KHR299 billion
(USD70 million).
The Indonesian provinces of West Papua and Central Sulawesi saw continued monsoon rains that prompted
additional flooding and landslides on the 12th. At least 11 people were killed and 18 more were injured. Officials
reported that 8,000 homes were destroyed.
A second major flood event in October affected central sections of Vietnam between the 14th and 18th, with 321
communities across the provinces of Ha Tinh, Nghe An and Quang Binh sustaining the most significant damage. At
least 75 people died and 18 more were injured. According to the Vietnamese government, more than 280,000 homes
were submerged. The floods caused significant damage to the transportation infrastructure, as a section of the main
national highway and parts of the North-South railway system were destroyed. Floodwaters destroyed 56,000
hectares (138,000 acres) of rice fields. Total economic losses were listed at VND3 trillion (USD150 million).
Heavy monsoon rains fell between the 15th and 17th in China, inundating at least 200 villages on the island province
of Hainan. According to regional officials, floods led to more than 50,000 homes, businesses and other structures
sustaining damage. No injuries or fatalities occurred. The Ministry of Civil Affairs reported that total economic losses
from the event stood at CNY1.52 billion (USD232 million).
Super Typhoon Megi made two separate landfalls in the Philippines and China between the 17th and 23rd. As Megi
came ashore in the Philippines as a Category 5 storm, it brought winds gusting in excess of 325 kph (200 mph) and
torrential rains. The hardest-hit municipalities were Maconacon, Palanan and Divilican along coastal Isabela province.
At least 36 people died, 42 more were injured and the storm damaged or destroyed 148,222 homes. According to the
National Disaster Coordinating Council (NDCC), Megi left substantial damage to the agricultural, electrical and
transportation infrastructures with total damages listed at PHP12.01 billion (USD281 million). As Megi made landfall
in China on the 23rd, the cyclone destroyed thousands of homes and 36,050 hectares (89,081 acres) of crops. Total
economic losses were listed at CNY2.8 billion (USD412 million). In Taiwan, at least 15 people died and agricultural
losses were listed at TWD67.7 million (USD2.2 million).
The combination of a stalled cold front and moisture from Typhoon Megi brought a record 647 millimeters (25.88
inches) of rain in a 24-hour period to the southern Japanese island chain of Amami on the 20th and 21st. Flash
flooding, overflowing rivers and landslides led to two deaths and more than 2,000 homes, businesses and
vehicles damaged.
Cyclone Giri made landfall in Rakhine state in Myanmar as a borderline Category 4/5 storm on the 22nd. According to
limited data released by the Myanmar government, at least 27 people were killed. Giri damaged or destroyed more
than 70,000 homes, monasteries, schools and government buildings and severely impacted the transportation,
electrical and telecommunications infrastructures.
A powerful USGS-registered magnitude-7.7 earthquake rocked western Indonesia on the 25th, triggering a large
tsunami that left 509 people dead and 454 injured. The main tremor struck at 9:42 PM local time (14:42 UTC) with an
offshore epicenter 240 kilometers (150 miles) west of Bengkulu, Indonesia at a depth of 20.6 kilometers (12.8 miles).
As damage assessments began in the remote Mentawai Islands, officials discovered that a tsunami estimated in
excess of three meters (ten feet) completely washed away several villages. Water from the tsunami reportedly
reached 600 meters (1,968 feet) inland, and damage reports indicated catastrophic effects occurred to nearly every
infrastructure type. More than 15,000 mostly wooden and bamboo homes were destroyed along with businesses,
roads, bridges, railways, and crops. Total economic losses were listed at IDR595 billion (USD65.1 million).
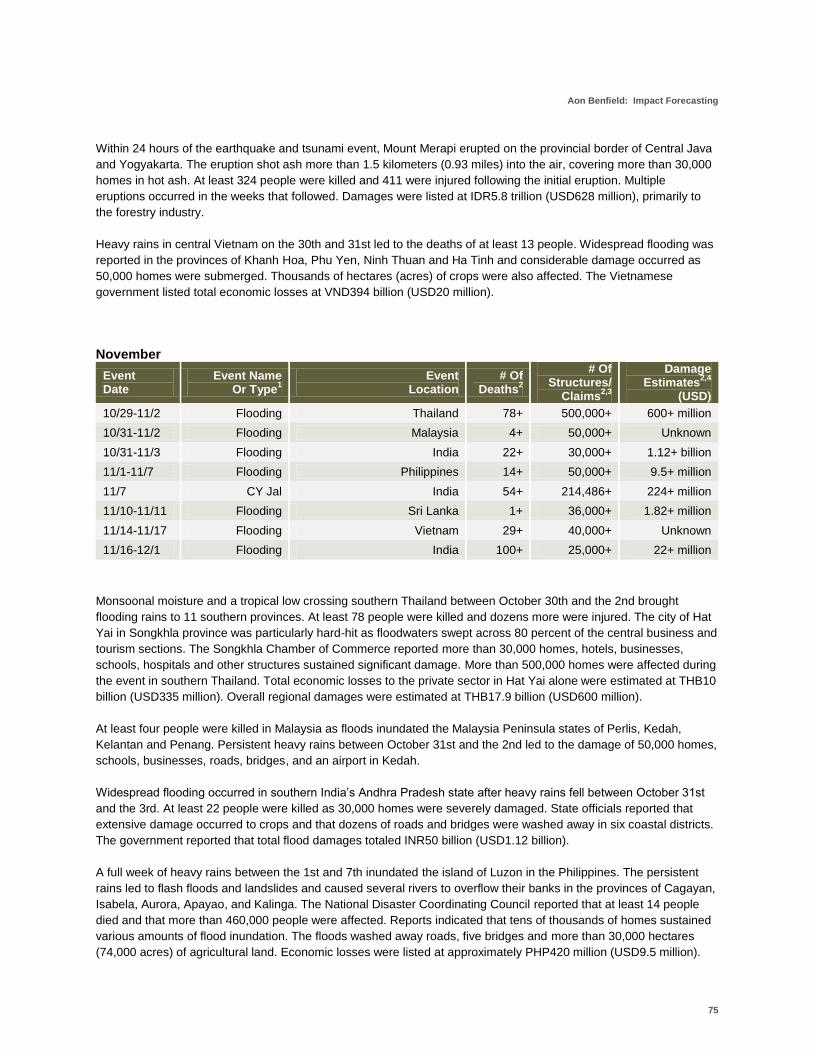
Aon Benfield: Impact Forecasting
75
Within 24 hours of the earthquake and tsunami event, Mount Merapi erupted on the provincial border of Central Java
and Yogyakarta. The eruption shot ash more than 1.5 kilometers (0.93 miles) into the air, covering more than 30,000
homes in hot ash. At least 324 people were killed and 411 were injured following the initial eruption. Multiple
eruptions occurred in the weeks that followed. Damages were listed at IDR5.8 trillion (USD628 million), primarily to
the forestry industry.
Heavy rains in central Vietnam on the 30th and 31st led to the deaths of at least 13 people. Widespread flooding was
reported in the provinces of Khanh Hoa, Phu Yen, Ninh Thuan and Ha Tinh and considerable damage occurred as
50,000 homes were submerged. Thousands of hectares (acres) of crops were also affected. The Vietnamese
government listed total economic losses at VND394 billion (USD20 million).
November
Event Date
Event Name Or Type
1
Event Location
# Of Deaths
2
# Of Structures/
Claims2,3
Damage Estimates
2,4
(USD)
10/29-11/2 Flooding Thailand 78+ 500,000+ 600+ million
10/31-11/2 Flooding Malaysia 4+ 50,000+ Unknown
10/31-11/3 Flooding India 22+ 30,000+ 1.12+ billion
11/1-11/7 Flooding Philippines 14+ 50,000+ 9.5+ million
11/7 CY Jal India 54+ 214,486+ 224+ million
11/10-11/11 Flooding Sri Lanka 1+ 36,000+ 1.82+ million
11/14-11/17 Flooding Vietnam 29+ 40,000+ Unknown
11/16-12/1 Flooding India 100+ 25,000+ 22+ million
Monsoonal moisture and a tropical low crossing southern Thailand between October 30th and the 2nd brought
flooding rains to 11 southern provinces. At least 78 people were killed and dozens more were injured. The city of Hat
Yai in Songkhla province was particularly hard-hit as floodwaters swept across 80 percent of the central business and
tourism sections. The Songkhla Chamber of Commerce reported more than 30,000 homes, hotels, businesses,
schools, hospitals and other structures sustained significant damage. More than 500,000 homes were affected during
the event in southern Thailand. Total economic losses to the private sector in Hat Yai alone were estimated at THB10
billion (USD335 million). Overall regional damages were estimated at THB17.9 billion (USD600 million).
At least four people were killed in Malaysia as floods inundated the Malaysia Peninsula states of Perlis, Kedah,
Kelantan and Penang. Persistent heavy rains between October 31st and the 2nd led to the damage of 50,000 homes,
schools, businesses, roads, bridges, and an airport in Kedah.
Widespread flooding occurred in southern India’s Andhra Pradesh state after heavy rains fell between October 31st
and the 3rd. At least 22 people were killed as 30,000 homes were severely damaged. State officials reported that
extensive damage occurred to crops and that dozens of roads and bridges were washed away in six coastal districts.
The government reported that total flood damages totaled INR50 billion (USD1.12 billion).
A full week of heavy rains between the 1st and 7th inundated the island of Luzon in the Philippines. The persistent
rains led to flash floods and landslides and caused several rivers to overflow their banks in the provinces of Cagayan,
Isabela, Aurora, Apayao, and Kalinga. The National Disaster Coordinating Council reported that at least 14 people
died and that more than 460,000 people were affected. Reports indicated that tens of thousands of homes sustained
various amounts of flood inundation. The floods washed away roads, five bridges and more than 30,000 hectares
(74,000 acres) of agricultural land. Economic losses were listed at approximately PHP420 million (USD9.5 million).

Annual Global Climate and Catastrophe Report
76
Cyclone Jal made landfall just north of Chennai, India on the 7th as a weakened tropical storm. According to Indian
officials, Jal left significant impacts to the districts of Visakhapatnam, Nellore and Prakasam in Andhra Pradesh state.
At least 214,486 homes were submerged, nearly 2,500 kilometers (1,553 miles) of roads were washed away and
more than 350,000 hectares (864,868 acres) of agricultural land were flooded. Jal left 54 people dead and caused
economic losses of INR10 billion (USD224 million).
Monsoonal rains inundated the Sri Lanka capital city of Colombo on the 10th and 11th. Floodwaters up to 1.22
meters (four feet) in depth inundated the country’s Parliament chambers, at least 36,000 homes, schools and other
structures. One person was killed and total economic losses were listed at LKR202 million (USD1.82 million).
Heavy rains fell between the 14th and 17th that brought renewed flooding to central Vietnam. According to the
Vietnamese Central Steering Committee for Flood and Storm Prevention, at least 29 people died and 10 others were
injured after floods and landslides affected the provinces of Thua Thien-Hue, Quang Tri, Quang Nam and Quang
Ngai. More than 40,000 homes were submerged along with 14,000 hectares (35,000 acres) of agricultural land and
156 kilometers (97 miles) of roads.
Torrential rains between the 16th and December 1st led to the deaths of at least 100 people in southern India’s Tamil
Nadu state. Flash floods destroyed tens of thousands of homes, buildings and other structures, with the main effects
reported in the districts of Thanjavur, Nagapattinam, Cuddalore, and Tiruvarur. Total economic losses from the event
were listed at INR1 billion (USD22 million).
December
Event Date
Event Name Or Type
1
Event Location
# Of Deaths
2
# Of Structures/
Claims2,3
Damage Estimates
2,4
(USD)
12/2-12/5 Wildfire Israel 42+ 250+ 551+ million
12/5 Wildfire China 22+ Unknown Unknown
12/5-12/7 Flooding Sri Lanka 2+ 2,300+ 1+ million
12/5-12/7 Flooding Philippines 0 6,600+ Unknown
The biggest forest fire in Israeli history started on the 2nd, killing 42 people and injuring 25 more. According to
government officials, the blaze destroyed 5,058 hectares (12,500 acres) of land in the Carmel Forest region.
Firefighters say that the fire initially broke out near the Druze village of Usfiya and quickly spread due to high winds
and an abundance of thick, dry brush. More than 250 homes were destroyed in the regions of Nir Etzion, Ein Hod, Ein
Hawd, and Yemin Orde. Total economic losses damage to property, roads and forestry from the event were listed at
NIS2 billion (USD551 million), with insured losses anticipated to approach NIS363 million (USD100 million).
A wildfire quickly raged out of control in a valley in China’s Daofu County in Sichuan Province on the 5th, killing at
least 22 people and injuring four more. According to Chinese officials, high winds fanned the flames. Firefighters
could not drive fire engines into the hilly grassland and were forced to use hand extinguishers to battle the blaze.
Heavy rains inundated much of Sri Lanka between the 5th and 7th, killing two people. More than 94,000 people were
displaced and 2,300 homes were destroyed. Economic losses could exceed LKR111 million (USD1 million).
Floods inundated southern sections of the Philippines between the 5th and 7th. According to government officials,
Zamboanga del Norte Province was hard-hit, particularly in the towns of Dipolog and Iligan where more than 6,600
homes were damaged or destroyed.
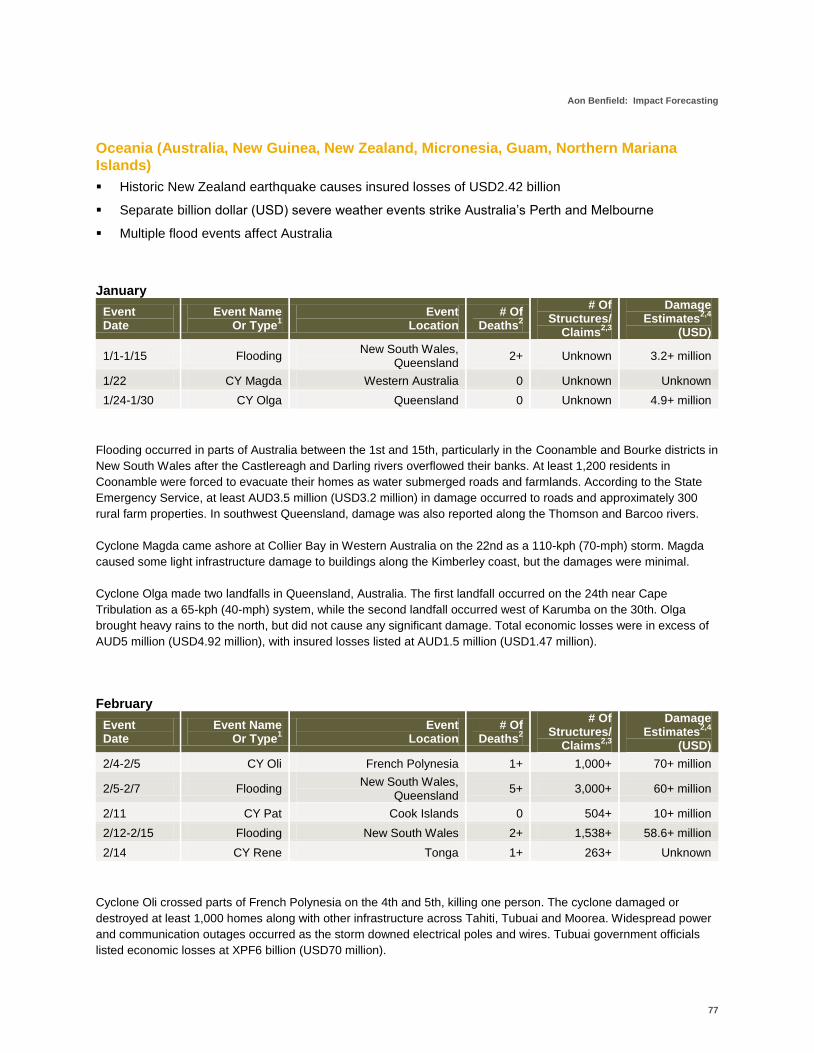
Aon Benfield: Impact Forecasting
77
Oceania (Australia, New Guinea, New Zealand, Micronesia, Guam, Northern Mariana
Islands)
Historic New Zealand earthquake causes insured losses of USD2.42 billion
Separate billion dollar (USD) severe weather events strike Australia’s Perth and Melbourne
Multiple flood events affect Australia
January
Event Date
Event Name Or Type
1
Event Location
# Of Deaths
2
# Of Structures/
Claims2,3
Damage Estimates
2,4
(USD)
1/1-1/15 Flooding New South Wales,
Queensland 2+ Unknown 3.2+ million
1/22 CY Magda Western Australia 0 Unknown Unknown
1/24-1/30 CY Olga Queensland 0 Unknown 4.9+ million
Flooding occurred in parts of Australia between the 1st and 15th, particularly in the Coonamble and Bourke districts in
New South Wales after the Castlereagh and Darling rivers overflowed their banks. At least 1,200 residents in
Coonamble were forced to evacuate their homes as water submerged roads and farmlands. According to the State
Emergency Service, at least AUD3.5 million (USD3.2 million) in damage occurred to roads and approximately 300
rural farm properties. In southwest Queensland, damage was also reported along the Thomson and Barcoo rivers.
Cyclone Magda came ashore at Collier Bay in Western Australia on the 22nd as a 110-kph (70-mph) storm. Magda
caused some light infrastructure damage to buildings along the Kimberley coast, but the damages were minimal.
Cyclone Olga made two landfalls in Queensland, Australia. The first landfall occurred on the 24th near Cape
Tribulation as a 65-kph (40-mph) system, while the second landfall occurred west of Karumba on the 30th. Olga
brought heavy rains to the north, but did not cause any significant damage. Total economic losses were in excess of
AUD5 million (USD4.92 million), with insured losses listed at AUD1.5 million (USD1.47 million).
February
Event Date
Event Name Or Type
1
Event Location
# Of Deaths
2
# Of Structures/
Claims2,3
Damage Estimates
2,4
(USD)
2/4-2/5 CY Oli French Polynesia 1+ 1,000+ 70+ million
2/5-2/7 Flooding New South Wales,
Queensland 5+ 3,000+ 60+ million
2/11 CY Pat Cook Islands 0 504+ 10+ million
2/12-2/15 Flooding New South Wales 2+ 1,538+ 58.6+ million
2/14 CY Rene Tonga 1+ 263+ Unknown
Cyclone Oli crossed parts of French Polynesia on the 4th and 5th, killing one person. The cyclone damaged or
destroyed at least 1,000 homes along with other infrastructure across Tahiti, Tubuai and Moorea. Widespread power
and communication outages occurred as the storm downed electrical poles and wires. Tubuai government officials
listed economic losses at XPF6 billion (USD70 million).

Annual Global Climate and Catastrophe Report
78
At least five people were killed in Queensland and New South Wales after a series of storms struck between the 5th
and 7th. The suburbs of Carrara on the Gold Coast, the Brisbane suburbs in Queensland and areas around Sydney
in New South Wales were affected. At least 3,000 homes sustained flood damage, with claims indicating damage
consisting of leaking roofs, water-damaged carpeting and home fixtures as well as damage to vehicles. Total
economic losses were AUD61.3 million (USD60 million), with insured losses listed at AUD52 million
(USD50.8 million).
Cyclone Pat affected the Cook Islands on the 11th, causing damage to homes and infrastructure. The eye of the
cyclone crossed the island of Aitutaki at approximately 3:00 AM local time (13:00 UTC) on the 11th, bringing heavy
rains and winds gusting to 185 kph (115 mph). According to island authorities, nearly 80 percent of all houses
sustained structural damage. Additional minor damage was reported to the airport, hospital, the port and most major
buildings on Aitutaki. Local farmers reported widespread damage as well. Economic losses were listed at NZD14
million (USD10 million).
Heavy rains and gusty winds across the greater Sydney region in New South Wales occurred between the 12th and
15th. At least two traffic fatalities occurred. Officials at the State Emergency Service received 1,538 damage calls
from the suburbs of Hornsby, Turramurra, Pymble, Liverpool and Fairfield. The Insurance Council of Australia
reported that 1,200 claims were filed that totaled AUD48 million (USD46.9 million). Economic were listed at AUD60
million (USD58.6 million).
Cyclone Rene affected northern and central sections of the Tongan archipelago on the 14th, killing one person.
Winds gusted to 160 kph (100 mph) as Rene crossed the region, including the islands of Vavau and Tongatapu.
According to Tonga’s National Disaster Office, widespread damage was reported to 263 homes and buildings.
Debris knocked out electricity and damaged crops.
March
Event Date
Event Name Or Type
1
Event Location
# Of Deaths
2
# Of Structures/
Claims2,3
Damage Estimates
2,4
(USD)
3/1-3/3 Flooding Queensland 0 7,500+ 100+ million
3/6 Severe Weather Victoria 0 105,000+ 1.25+ billion
3/12 Severe Weather New Zealand 1+ 500+ 5+ million
3/13-3/16 TC Tomas Fiji 2+ 4,000+ 39.4+ million
3/15-3/21 TC Ului Solomon Islands, Queensland 0 812+ 75+ million
3/22 Severe Weather Western Australia 0 165,000+ 1.25+ billion
Heavy rains leading to flash flooding affected portions of Queensland and New South Wales between the 1st and 3rd.
According to the New South Wales State Emergency Service, an estimated AUD6 million (USD5.5 million) in
damages occurred to more than 650 kilometers (404 miles) of Queensland’s roadway network. In Queensland,
several rivers reported their highest levels in decades in the towns of Theodore, Dirranbandi, Charleville, Roma, and
St. George. The Insurance Council of Australia deemed the event a catastrophe, as more than 7,500 insurance
claims were filed that amounted to AUD65 million (USD63.5 million), while economic losses totaled AUD102 million
(USD100 million).

Aon Benfield: Impact Forecasting
79
A series of severe thunderstorms crossed the Australian state of Victoria on the 6th, bringing large hail, high winds,
lightning, and flooding across the greater Melbourne area. Hailstones the size of tennis balls and winds gusted to
nearly 100 kph (65 mph) at several locations were reported in the Melbourne suburbs of Taylors Lakes and Ferntree
Gully. No fatalities were reported. The Victoria State Emergency Service noted that the large hailstones punctured
holes in roofs and windows of homes and vehicles while flash floods submerged streets. The Victoria State
Emergency Service noted that this was the largest hailstorm event in Melbourne’s recorded history. According to the
Insurance Council of Australia, at least 105,000 insurance claims were filed, totaling AUD1.04 billion (USD1.02
billion). Total losses were listed in excess of AUD1.5 billion (USD1.25 billion).
A severe thunderstorm struck the greater Wellington area in New Zealand on the 12th, killing at least one person.
High winds caused widespread damage as roofs were lifted by a weak tornado at St. Bernard’s College and Samuel
Marsden College. The winds damaged more than 500 homes after trees fell on top of domiciles. According to the
New Zealand Insurance Council, insured losses topped NZD1.2 million (USD900,000). Total economic losses were
listed at NZD6.5 million (USD5 million).
Tropical Cyclone Tomas skirted the Fiji Islands on the 15th and 16th, killing at least two people and causing
widespread damage. According to Fijian governmental officials and personnel from the National Disaster
Management Office, the northern Lau and Lomaiviti island groups and the island of Vanua Levu both reported that
houses were destroyed, trees uprooted and roads blocked. Forecasters at Fiji’s Tropical Cyclone Center reported
storm surges up to seven meters (23 feet) in some spots on the Lau Island group. Reports indicated that at least
4,000 homes were destroyed. Nearly every home on Cikobia Island was damaged and up to 50 percent of all
buildings on the Lau Island group sustained some damage. Total damages were estimated at FJD73.3 million
(USD39.4 million).
Tropical Cyclone Ului affected the Solomon Islands and parts of Queensland in Australia between the 15th and 21st.
On the Solomon Islands, Ului affected the provinces of Isabel, Malaita, Guadalcanal, Temotu, Makira, Uluawa,
Rennel, and Bellona with strong winds, rough seas, storm surge and heavy rains. In Queensland, Australia, Ului
made its lone official landfall at approximately 1:00 AM on the 21st near Airlie Beach. Limited structural damage was
reported in the communities of Mackay, Finch Hatton, Whitsundays, and Midge Point. Sugar cane producers in
Proserpine estimated that the industry lost approximately AUD20 million (USD18 million) from the cyclone.
Total economic losses were AUD77 million (USD75 million), with total insured losses listed at AUD60 million
(USD58.6 million).
A cluster of severe thunderstorms struck the greater Perth metropolitan area in Australia on the 22nd, causing
widespread extensive damage. No fatalities were reported, though dozens of residents sustained minor injuries from
falling hailstones and debris. The storm brought winds gusting up to 120 kph (75 mph) and tennis ball-sized hail.
Damage was reported to homes, schools, apartment complexes, businesses and at King’s Park. The storm delayed
trains and flights and caused major crop damage in the Carabooda-west Gingin area. The Insurance Council of
Australia received more than 165,000 insurance claims that totaled AUD1.08 billion (USD1.06 billion), making this
event the most costly natural disaster in Western Australia’s recorded history. Total economic losses were estimated
in excess of AUD1.5 billion (USD1.25 billion).

Annual Global Climate and Catastrophe Report
80
April
Event Date
Event Name Or Type
1
Event Location
# Of Deaths
2
# Of Structures/
Claims2,3
Damage Estimates
2,4
(USD)
4/20 Earthquake Western Australia 0 100+ 4.6+ million
A magnitude-5.2 earthquake struck at 8:17 AM on the 20th (00:17 UTC) with an epicenter 30 kilometers (20 miles)
northeast of the town of Kalgoorlie in Western Australia at a depth of 10 kilometers (6.2 miles). The majority of the
damage was confined to a 16-block section in Kalgoorlie-Boulder, where at least 80 buildings, including businesses
and hotels, in a historic district sustained structural damage. The local government allocated AUD5 million (USD4.6
million) to restore damaged heritage-listed buiildings. Several schools also sustained minor damage. Mining
companies estimated that ‘millions’ of dollars (USD) in lost revenue and costs had occurred.
May
Event Date
Event Name Or Type
1
Event Location
# Of Deaths
2
# Of Structures/
Claims2,3
Damage Estimates
2,4
(USD)
5/24-5/27 Flooding New Zealand 0 500+ 7.5+ million
Flooding rains between the 24th and 27th in New Zealand left damage across both the North and South islands.
Some of the most affected regions were Canterbury and Otago after several rivers, including the Taieri, Shag,
Kakanui, Waianakarua, overflowed their banks and flooded at least 500 homes and businesses. According to the
New Zealand Insurance Coucil, total insured losses exceeded NZD4.5 million (USD3.3 million). Total economic
losses were listed at NZD9.8 million (USD7.5 million).
June
Event Date
Event Name Or Type
1
Event Location
# Of Deaths
2
# Of Structures/
Claims2,3
Damage Estimates
2,4
(USD)
6/1 Flooding New Zealand 0 500+ 10+ million
6/3-6/4 Severe Weather New South Wales 0 392+ 1.04+ million
Thunderstorms spawned flooding across New Zealand’s North Island on the 1st. Damage was reported to more than
500 homes, businesses and vehicles across the Bay of Plenty region, including the towns of Mt. Roskill, One Tree
Hill, Epsom, Mt. Wellington, Papatoetoe, and Pakuranga. Floodwaters also forced the closure of roads and bridges
after excess water caused portions to be washed away. According to the New Zealand Insurance Council, insured
losses topped NZD9 million (USD6.6 million). Economic losses were listed at NZD13.1 million (USD10 million)
Severe thunderstorms spawned tornadoes along the northern coast town of Lennox Head and in Sydney in New
South Wales on the 3rd and 4th. One tornado in Lennox Head swept through a neighborhood with 150 kph (90 mph)
winds, causing 110 damage incidents that included 12 destroyed homes. A natural disaster was declared as damage
estimates neared AUD1.25 million (USD1.04 million). In New South Wales’ Hunter district on the 3rd, at least 162
damage requests came in from other thunderstorms. On the 4th, another weak tornado touched down in the eastern
suburbs of Syndey. More than 120 calls for assistance were received due to roof damage and fallen tree debris.

Aon Benfield: Impact Forecasting
81
July
Event Date
Event Name Or Type
1
Event Location
# Of Deaths
2
# Of Structures/
Claims2,3
Damage Estimates
2,4
(USD)
There were no major natural disaster events in Oceania during the month of July.
August
Event Date
Event Name Or Type
1
Event Location
# Of Deaths
2
# Of Structures/
Claims2,3
Damage Estimates
2,4
(USD)
8/10-8/12 Severe Weather Victoria 0 434+ Unknown
In Australia, an area of low pressure intensified while exiting New South Wales and entering Victoria between the
10th and 12th. Severe thunderstorms brought winds gusting to 139 kph (85 mph), heavy rainfall and an isolated
tornado that struck the town of Moama on the Victoria/New South Wales border. Flood damage was reported in a
Port Fairy caravan park after the Moyne River overflowed its banks, while additional floods occurred in Colac and
Camperdown. According to the Victoria State Emergency Service, at least 434 calls for assistance were received.
The most-affected areas were Warrnambool, Port Fairy, Camperdown, Cobden, Ballarat, Ararat, and Bendingo.
September
Event Date
Event Name Or Type
1
Event Location
# Of Deaths
2
# Of Structures/
Claims2,3
Damage Estimates
2,4
(USD)
9/4 Earthquake New Zealand 0 190,000+ 3.81+ billion
9/4-9/8 Flooding Australia 0 4,500+ 20.4+ million
9/18-9/23 Severe Weather New Zealand 0 Hundreds+ 37+ million
A USGS-measured magnitude-7.0 earthquake struck New Zealand on the 4th, causing extensive damage across the
city of Christchurch and in nearby towns. The main tremor struck at 4:35 AM on the 4th local time (16:35 UTC on the
3rd) with an epicenter 50 kilometers (30 miles) west-northwest of Christchurch at a depth of five kilometers (3.1
miles). More than 300 aftershocks rattled the region in the hours and days that followed. There were no fatalities,
though at least 100 people sustained injuries. According to government officials, Christchurch’s surrounding towns of
Canterbury, Sumner and Avonside were particularly affected along with the districts of Selwyn, Timaru and
Waimakariri. The New Zealand Earthquake Commission received 190,000 residential property damage claims, with
estimated payouts of NZD4 billion (USD3.05 billion). Total economic losses were NZD5 billion (USD3.81 billion).
Heavy rains triggered flash flooding across parts of Victoria on the 4th and 5th while Sydney, Canberra and South
Australia were hit with gale-force winds. According to Victoria’s State Emergency Service , more than 4,500 requests
for assistance were received. Additional rainfall fell and gale-force winds struck between the 6th and 8th, further
enhancing flood threats along swollen rivers across much of eastern Australia. The Insurance Council of Australia
deemed the event a catastrophe as insured losses exceeded AUD15 million (USD13.7 million) in Victoria. Total
economic losses were listed at AUD20.4 million (USD20 million).
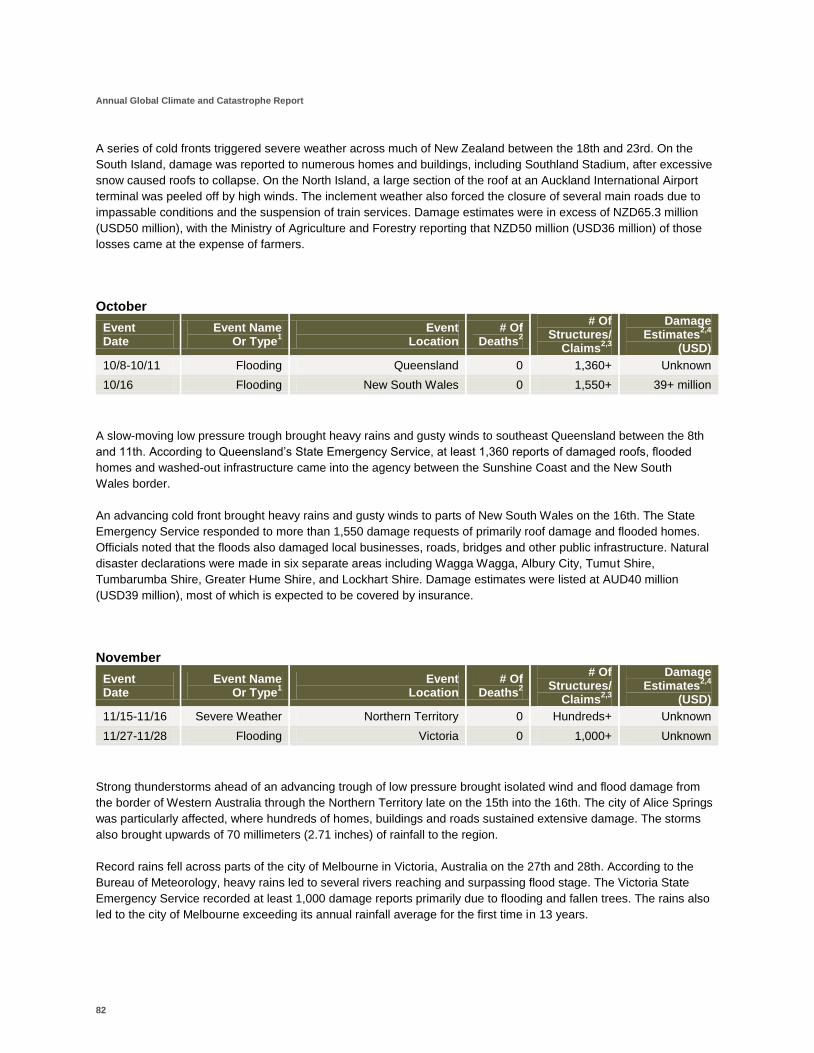
Annual Global Climate and Catastrophe Report
82
A series of cold fronts triggered severe weather across much of New Zealand between the 18th and 23rd. On the
South Island, damage was reported to numerous homes and buildings, including Southland Stadium, after excessive
snow caused roofs to collapse. On the North Island, a large section of the roof at an Auckland International Airport
terminal was peeled off by high winds. The inclement weather also forced the closure of several main roads due to
impassable conditions and the suspension of train services. Damage estimates were in excess of NZD65.3 million
(USD50 million), with the Ministry of Agriculture and Forestry reporting that NZD50 million (USD36 million) of those
losses came at the expense of farmers.
October
Event Date
Event Name Or Type
1
Event Location
# Of Deaths
2
# Of Structures/
Claims2,3
Damage Estimates
2,4
(USD)
10/8-10/11 Flooding Queensland 0 1,360+ Unknown
10/16 Flooding New South Wales 0 1,550+ 39+ million
A slow-moving low pressure trough brought heavy rains and gusty winds to southeast Queensland between the 8th
and 11th. According to Queensland’s State Emergency Service, at least 1,360 reports of damaged roofs, flooded
homes and washed-out infrastructure came into the agency between the Sunshine Coast and the New South
Wales border.
An advancing cold front brought heavy rains and gusty winds to parts of New South Wales on the 16th. The State
Emergency Service responded to more than 1,550 damage requests of primarily roof damage and flooded homes.
Officials noted that the floods also damaged local businesses, roads, bridges and other public infrastructure. Natural
disaster declarations were made in six separate areas including Wagga Wagga, Albury City, Tumut Shire,
Tumbarumba Shire, Greater Hume Shire, and Lockhart Shire. Damage estimates were listed at AUD40 million
(USD39 million), most of which is expected to be covered by insurance.
November
Event Date
Event Name Or Type
1
Event Location
# Of Deaths
2
# Of Structures/
Claims2,3
Damage Estimates
2,4
(USD)
11/15-11/16 Severe Weather Northern Territory 0 Hundreds+ Unknown
11/27-11/28 Flooding Victoria 0 1,000+ Unknown
Strong thunderstorms ahead of an advancing trough of low pressure brought isolated wind and flood damage from
the border of Western Australia through the Northern Territory late on the 15th into the 16th. The city of Alice Springs
was particularly affected, where hundreds of homes, buildings and roads sustained extensive damage. The storms
also brought upwards of 70 millimeters (2.71 inches) of rainfall to the region.
Record rains fell across parts of the city of Melbourne in Victoria, Australia on the 27th and 28th. According to the
Bureau of Meteorology, heavy rains led to several rivers reaching and surpassing flood stage. The Victoria State
Emergency Service recorded at least 1,000 damage reports primarily due to flooding and fallen trees. The rains also
led to the city of Melbourne exceeding its annual rainfall average for the first time in 13 years.
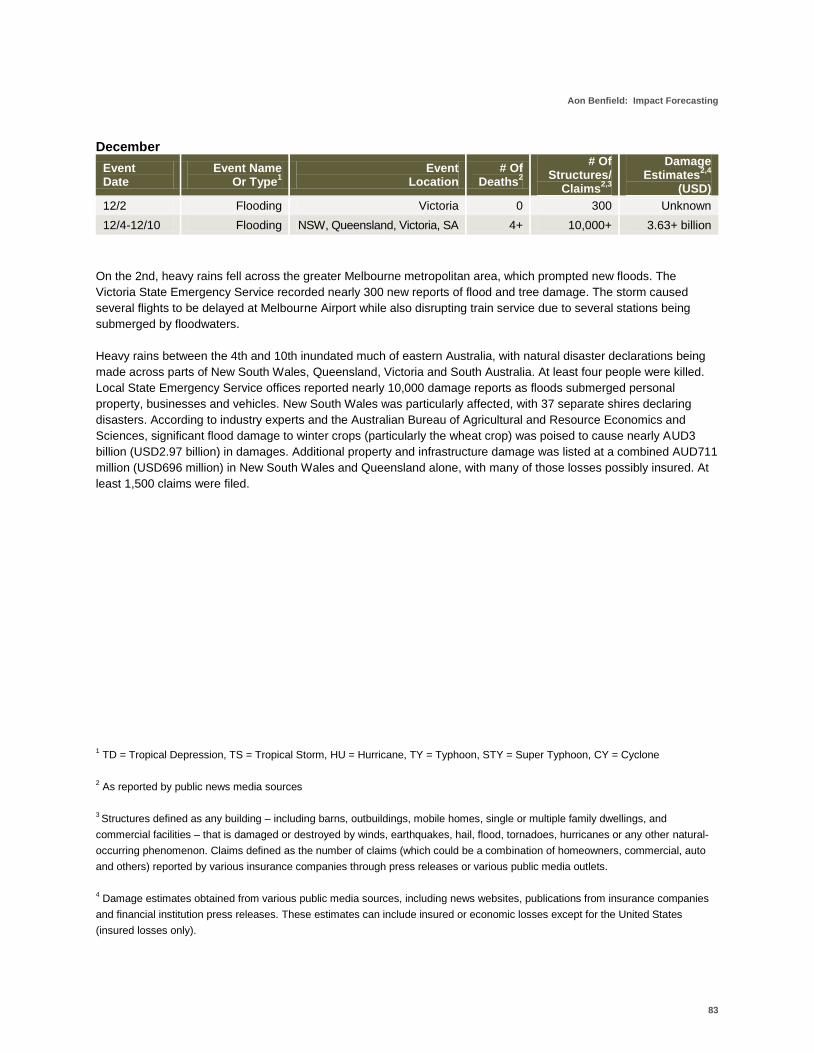
Aon Benfield: Impact Forecasting
83
December
Event Date
Event Name Or Type
1
Event Location
# Of Deaths
2
# Of Structures/
Claims2,3
Damage Estimates
2,4
(USD)
12/2 Flooding Victoria 0 300 Unknown
12/4-12/10 Flooding NSW, Queensland, Victoria, SA 4+ 10,000+ 3.63+ billion
On the 2nd, heavy rains fell across the greater Melbourne metropolitan area, which prompted new floods. The
Victoria State Emergency Service recorded nearly 300 new reports of flood and tree damage. The storm caused
several flights to be delayed at Melbourne Airport while also disrupting train service due to several stations being
submerged by floodwaters.
Heavy rains between the 4th and 10th inundated much of eastern Australia, with natural disaster declarations being
made across parts of New South Wales, Queensland, Victoria and South Australia. At least four people were killed.
Local State Emergency Service offices reported nearly 10,000 damage reports as floods submerged personal
property, businesses and vehicles. New South Wales was particularly affected, with 37 separate shires declaring
disasters. According to industry experts and the Australian Bureau of Agricultural and Resource Economics and
Sciences, significant flood damage to winter crops (particularly the wheat crop) was poised to cause nearly AUD3
billion (USD2.97 billion) in damages. Additional property and infrastructure damage was listed at a combined AUD711
million (USD696 million) in New South Wales and Queensland alone, with many of those losses possibly insured. At
least 1,500 claims were filed.
1 TD = Tropical Depression, TS = Tropical Storm, HU = Hurricane, TY = Typhoon, STY = Super Typhoon, CY = Cyclone
2 As reported by public news media sources
3 Structures defined as any building – including barns, outbuildings, mobile homes, single or multiple family dwellings, and
commercial facilities – that is damaged or destroyed by winds, earthquakes, hail, flood, tornadoes, hurricanes or any other natural-
occurring phenomenon. Claims defined as the number of claims (which could be a combination of homeowners, commercial, auto
and others) reported by various insurance companies through press releases or various public media outlets.
4 Damage estimates obtained from various public media sources, including news websites, publications from insurance companies
and financial institution press releases. These estimates can include insured or economic losses except for the United States
(insured losses only).

Annual Global Climate and Catastrophe Report
84
Appendix: Tropical System Frequency Correlations
The following shows how the El Niño/Southern Oscillation (ENSO) affects tropical system production in Northern
Hemisphere tropical basins using historical National Hurricane Center and Joint Typhoon Warning Center data.
Western Pacific Ocean Basin (ENSO)
Exhibit 29: 25-Year Western Pacific Typhoon Frequency By ENSO Phase
DURING EL NIÑO PHASES:
Overall typhoon frequency is slightly above average
Category 3 (sustained winds of at least 111 mph (179 kph)) typhoon frequency is near average
Landfalling typhoon frequency is slightly below average
DURING LA NIÑA PHASES:
Overall typhoon frequency is below average
Category 3 (sustained winds of at least 111 mph (179 kph)) typhoon frequency is below average
Landfalling typhoon frequency is below average
DURING NEUTRAL PHASES:
Overall typhoon frequency is slightly above average
Category 3 (sustained winds of at least 111 mph (179 kph)) typhoon frequency is above average
Landfalling typhoon frequency is above average
0.0
2.0
4.0
6.0
8.0
10.0
12.0
14.0
16.0
18.0
20.0
Typhoon Frequency Category 3+ Typhoon Frequency
Landfalling Typhoon Frequency
Typ
ho
on
s P
er
Year
Cool (La Niña)
Neutral
Warm (El Niño)
25-Year Average
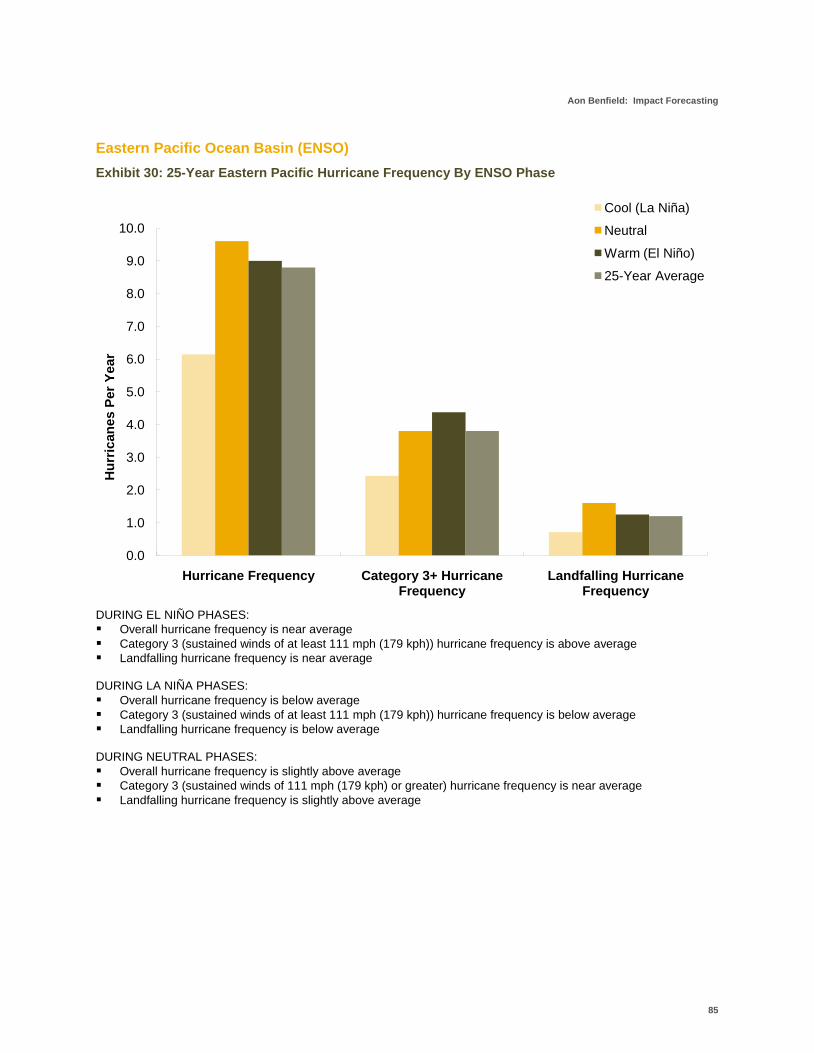
Aon Benfield: Impact Forecasting
85
Eastern Pacific Ocean Basin (ENSO)
Exhibit 30: 25-Year Eastern Pacific Hurricane Frequency By ENSO Phase
DURING EL NIÑO PHASES:
Overall hurricane frequency is near average
Category 3 (sustained winds of at least 111 mph (179 kph)) hurricane frequency is above average
Landfalling hurricane frequency is near average DURING LA NIÑA PHASES:
Overall hurricane frequency is below average
Category 3 (sustained winds of at least 111 mph (179 kph)) hurricane frequency is below average
Landfalling hurricane frequency is below average DURING NEUTRAL PHASES:
Overall hurricane frequency is slightly above average
Category 3 (sustained winds of 111 mph (179 kph) or greater) hurricane frequency is near average
Landfalling hurricane frequency is slightly above average
0.0
1.0
2.0
3.0
4.0
5.0
6.0
7.0
8.0
9.0
10.0
Hurricane Frequency Category 3+ Hurricane Frequency
Landfalling Hurricane Frequency
Hu
rric
an
es P
er
Year
Cool (La Niña)
Neutral
Warm (El Niño)
25-Year Average
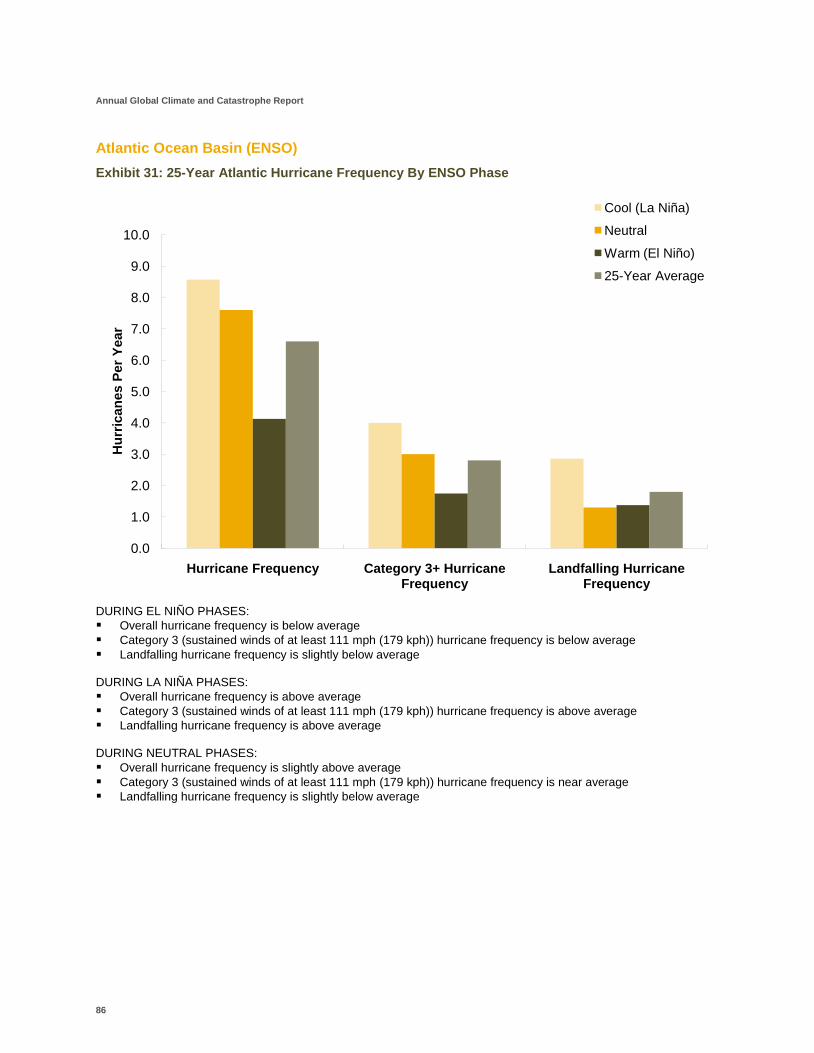
Annual Global Climate and Catastrophe Report
86
Atlantic Ocean Basin (ENSO)
Exhibit 31: 25-Year Atlantic Hurricane Frequency By ENSO Phase
DURING EL NIÑO PHASES:
Overall hurricane frequency is below average
Category 3 (sustained winds of at least 111 mph (179 kph)) hurricane frequency is below average
Landfalling hurricane frequency is slightly below average DURING LA NIÑA PHASES:
Overall hurricane frequency is above average
Category 3 (sustained winds of at least 111 mph (179 kph)) hurricane frequency is above average
Landfalling hurricane frequency is above average DURING NEUTRAL PHASES:
Overall hurricane frequency is slightly above average
Category 3 (sustained winds of at least 111 mph (179 kph)) hurricane frequency is near average
Landfalling hurricane frequency is slightly below average
0.0
1.0
2.0
3.0
4.0
5.0
6.0
7.0
8.0
9.0
10.0
Hurricane Frequency Category 3+ Hurricane Frequency
Landfalling Hurricane Frequency
Hu
rric
an
es P
er
Year
Cool (La Niña)
Neutral
Warm (El Niño)
25-Year Average

©Aon Limited trading as Aon Benfield (for itself and on behalf of each subsidiary company of Aon Corporation) (“Aon Benfield”) reserves all rights to the content of this report (“Report”). This Report is for distribution to Aon Benfield and the organisation to which it was originally delivered only. Copies may be made by that organisation for its own internal purposes but this Report may not be distributed in whole or in part to any third party without both (i) the prior written consent of Aon Benfield and (ii) the third party having first signed a “recipient of report” letter in a form acceptable to Aon Benfield. Aon Benfield cannot accept any liability to any third party to whom this Report is disclosed, whether disclosed in compliance with the preceding sentence of otherwise.
To the extent this Report expresses any recommendation or assessment on any aspect of risk, the recipient acknowledges that any such recommendation or assessment is an expression of Aon Benfield’s opinion only, and is not a statement of fact. Any decision to rely on any such recommendation or assessment of risk is entirely the responsibility of the recipient. Aon Benfield will not in any event be responsible for any losses that may be incurred by any party as a result of any reliance placed on any such opinion. The recipient acknowledges that this Report does not replace the need for the recipient to undertake its own assessment.
The recipient acknowledges that in preparing this Report Aon Benfield may have based analysis on data provided by the recipient and/or from third party sources. This data may have been subjected to mathematical and/or empirical analysis and modelling. Aon Benfield has not verified, and accepts no responsibility for, the accuracy or completeness of any such data. In addition, the recipient acknowledges that any form of mathematical and/or empirical analysis and modelling (including that used in the preparation of this Report) may produce results which differ from actual events or losses.
The Aon Benfield analysis has been undertaken from the perspective of a reinsurance broker. Consequently this Report does not constitute an opinion of reserving levels or accounting treatment. This Report does not constitute any form of legal, accounting, taxation, regulatory or actuarial advice.
About Impact ForecastingImpact Forecasting LLC is a catastrophe model development center of excellence within Aon Benfield whose seismologists, meteorologists,
hydrologists, engineers, mathematicians, GIS experts, finance, risk management and insurance professionals analyze the financial implications of
natural and man-made catastrophes around the world. Impact Forecasting’s experts develop software tools and models that help clients understand
underlying risks from hurricanes, tornadoes, earthquakes, floods, wildfires and terrorist attacks on property, casualty and crop insurers and
reinsurers. Impact Forecasting is the only catastrophe model development firm integrated into a reinsurance intermediary. To find out more about
Impact Forecasting® LLC, visit www.impactforecasting.com.
About Aon BenfieldAs the industry leader in treaty, facultative and capital markets, Aon Benfield is redefining the role of the reinsurance intermediary and capital
advisor. Through our unmatched talent and industry-leading proprietary tools and products, we help our clients to redefine success. Aon Benfield
offers unbiased capital advice and customized access to more reinsurance and capital markets than anyone else. As a trusted advocate, we provide
local reach to the world’s markets, an unparalleled investment in innovative analytics, including catastrophe management, actuarial, and rating
agency advisory, and the right professionals to advise clients in making the optimal capital choice for their business. With an international network
of more than 80 offices in 50 countries, our worldwide client base is able to access the broadest portfolio of integrated capital solutions and
services. Learn more at aonbenfield.com.

200 E. Randolph Street, Chicago, Illinois 60601 t: +1 312 381 5300 | f: +1 312 381 0160 | aonbenfield.com
Copyright Aon Benfield Inc. 2010 | #3979 – 12/2010