annual general meeting 2012 - asx · 2012. 11. 29. · 2012 29 november 2012 for personal use only....
TRANSCRIPT

Annual General Meeting
2012 29 November 2012
For
per
sona
l use
onl
y
2
Disclaimer
The material in this presentation has been prepared by SEEK Limited ABN 46 080 075 314
("SEEK") and is general background information about SEEK’s activities current as at the date
of this presentation. The information is given in summary form and does not purport to be
complete. In particular you are cautioned not to place undue reliance on any forward looking
statements regarding our belief, intent or expectations with respect to SEEK’s businesses,
market conditions and/or results of operations, as although due care has been used in the
preparation of such statements, actual results may vary in a material manner.
Information in this presentation, including forecast financial information, should not be
considered as advice or a recommendation to investors or potential investors in relation to
holding, purchasing or selling securities. Before acting on any information you should consider
the appropriateness of the information having regard to these matters, any relevant offer
document and in particular, you should seek independent financial advice.
Non-IFRS Financial Information
SEEK’s results are reported under International Financial Reporting Standards (IFRS). This
presentation also includes certain non-IFRS measures including, “normalised”, “pro forma”
and “look-through”. These measures are used internally by management to assess the
performance of our business, our associates and Joint Ventures, make decisions on the
allocation of our resources and assess operational management. Non-IFRS measures have
not been subject to audit or review.
For
per
sona
l use
onl
y
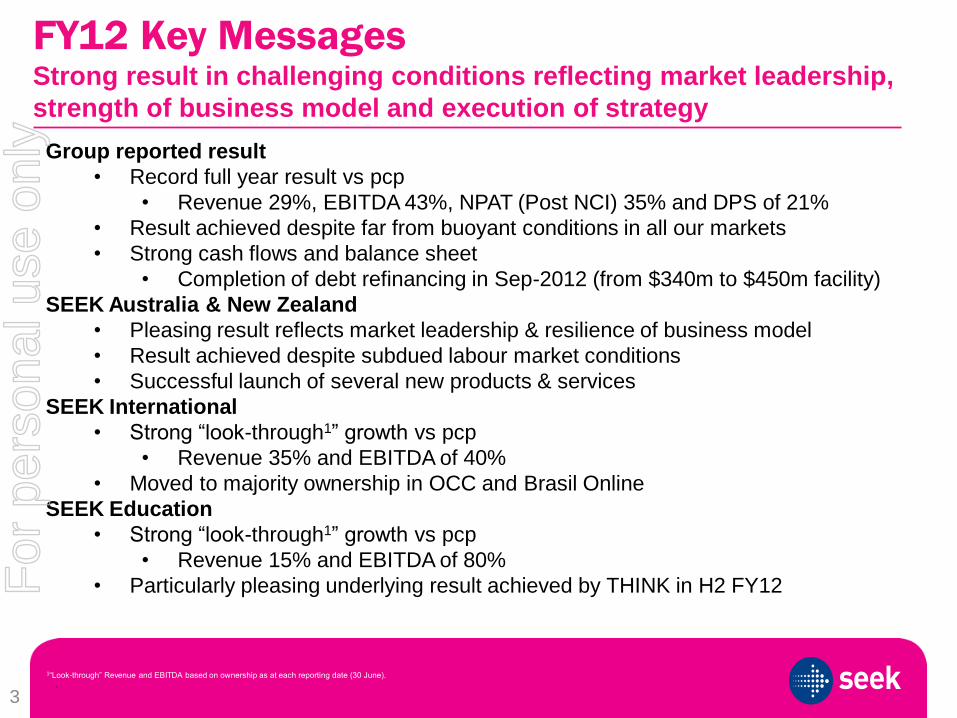
FY12 Key Messages Strong result in challenging conditions reflecting market leadership,
strength of business model and execution of strategy
3
Group reported result
• Record full year result vs pcp
• Revenue 29%, EBITDA 43%, NPAT (Post NCI) 35% and DPS of 21%
• Result achieved despite far from buoyant conditions in all our markets
• Strong cash flows and balance sheet
• Completion of debt refinancing in Sep-2012 (from $340m to $450m facility)
SEEK Australia & New Zealand
• Pleasing result reflects market leadership & resilience of business model
• Result achieved despite subdued labour market conditions
• Successful launch of several new products & services
SEEK International
• Strong “look-through1” growth vs pcp
• Revenue 35% and EBITDA of 40%
• Moved to majority ownership in OCC and Brasil Online
SEEK Education
• Strong “look-through1” growth vs pcp
• Revenue 15% and EBITDA of 80%
• Particularly pleasing underlying result achieved by THINK in H2 FY12
1“Look-through” Revenue and EBITDA based on ownership as at each reporting date (30 June).
.
For
per
sona
l use
onl
y

Record full year results achieved in FY12...
4
Group Headline Performance Key Financial Highlights
Growth
FY12 FY11 $m %
Revenue1442.3 343.1 99.2 29%
Reported EBITDA 193.6 135.6 58.0 43%
Reported EBITDA (%) 44% 40%
Reported NPAT (Post NCI) 131.7 97.7 34.0 35%
Basic EPS (cents) 39.1 29.0 10.1 35%
Dividend per share2 (cps) 17.3 14.3 3.0 21%
A$m• Reported EPS growth of 35%
• Total FY12 dividends of 17.3 cents per share
representing growth of 21%
• SEEK has maintained its dividend payout ratio at
50% of Cash NPAT2
• Third consecutive year of delivering +20%
growth in fully franked dividends
• Generating strong cash flows
• Operating cash flows +31% on pcp
• FY12 EBITDA to cash flow conversion 103%
• SEEK’s International & Education3 investments
have zero debt and a “look-through” cash
balance of ~A$107.6m
Growth
FY12 FY11 cents %
H1 - Interim Dividend 8.3 6.8 1.5 22%
H2 - Final Dividend 9.0 7.5 1.5 20%
cents per share
1 Excludes interest income 2 Dividends paid out of Cash NPAT defined as: NPAT (Post NCI) (Reported) – Associates NPAT +/- Non Cash Items + Associate Dividends 3 Education investments relate to SEEK’s 50% investment in IDP and Swinburne Online
For
per
sona
l use
onl
y

5
... which is a continuation of SEEK’s track record of
consistent growth over a long period
Operating Revenue CAGR of 35.2%
Reported EBITDA CAGR of 38.4%
Reported NPAT (Post NCI) CAGR of 32.6%
$39.7m
$69.6m
$106.2m
$157.0m
$210.2m$208.8m
$280.9m
$343.1m
$442.3m
FY04 FY05 FY06 FY07 FY08 FY09 FY10 FY11 FY12
$14.4m
$29.5m
$49.0m
$80.3m
$109.8m
$97.8m
$117.4m
$135.6m
$193.6m
FY04 FY05 FY06 FY07 FY08 FY09 FY10 FY11 FY12
$13.8m$19.3m
$34.1m
$55.5m
$76.3m
$55.3m
$89.5m
$97.7m
$131.7m
FY04 FY05 FY06 FY07 FY08 FY09 FY10 FY11 FY12
Key Insights
• 3rd consecutive year of record Revenue, EBITDA and NPAT
• Resilient earnings through challenging conditions
• Total Shareholder returns1 of ~248% since IPO vs ASX 200 of ~54%
1 Total shareholder returns included dividends and share price appreciation from 19 April 2005 to 26 November 2012
For
per
sona
l use
onl
y

6
$39.7m $63.5m$95.2m
$140.2m$190.0m $170.9m $172.7m
$224.0m $247.8m
$6.1m$11.1m
$59.9m
$100.2m$169.0m
$207.8m
$205.3m
$235.8m
$6.0m
$14.2m
$59.6m
$73.8m
$128.3m
$173.8m
FY04 FY05 FY06 FY07 FY08 FY09 FY10 FY11 FY12
$5.2m$28.4m
$44.2m
$76.9m
$106.7m$90.9m $93.4m
$133.5m$152.1m
$1.0m$3.1m
$12.3m
$18.8m$28.8m
$39.7m
$18.4m
$33.0m
-
-
-
($3.2m) ($6.7m) ($8.5m)
$9.2m
$35.7m
$49.8m
FY04 FY05 FY06 FY07 FY08 FY09 FY10 FY11 FY12
“Look-through” 1 Revenue FY04 –FY12 CAGR of 42.0%
“Look-through” 1 EBITDA FY04 –FY12 CAGR of 61.0%
$39.7m
$69.6m
$106.3m
$206.1m
$304.4m
$399.4m
$454.3m
$557.7m
$657.4m
$5.2m
$29.4m
$47.3m
$86.0m
$118.8m $111.1m
$142.3m
$187.5m
$235.0m
EBITDA CAGR (%) Period
SEEK Domestic 52.5% FY04 - FY12
SEEK Education 65.0% FY05 - FY12
SEEK International2 132.7% FY10 - FY12
SEEK Group 61.0% FY04 - FY12
Revenue CAGR (%) Period
SEEK Domestic 25.7% FY04 - FY12
SEEK Education 68.6% FY05 - FY12
SEEK International2 96.1% FY07 - FY12
SEEK Group 42.0% FY04 - FY12
1“Look-through” Revenue and EBITDA based on ownership as at each reporting date (30 June). 2 SEEK International ”look-through” Revenue CAGR has been calculated over the period FY07 to FY12 as FY07 was the first period in which SEEK International “look-through” Revenue was recognised. SEEK
International “look-through” EBITDA CAGR has been calculated over the period FY10 to FY12 as FY10 is the first period in which a positive “look-through” EBITDA was recognised
Execution of strategy has led to FY12 “look-through” result
of Revenue ~A$657m & EBITDA ~A$235m
For
per
sona
l use
onl
y

SEEK
Domestic
7
For
per
sona
l use
onl
y

$63.5m
$95.2m
$140.2m
$190.0m
$170.9m $172.7m
$224.0m
$247.8m
$28.4m
$44.2m
$76.9m
$106.7m
$90.9m$93.4m
$133.5m
$152.1m
FY05 FY06 FY07 FY08 FY09 FY10 FY11 FY12
Revenue EBITDA
8
SEEK Australia & New Zealand achieved a solid
result in a challenging macro environment SEEK Domestic Financials Key Insights
Revenue growth of 11% (FY12 v FY11)
• Revenue growth attributable to volume of 1% & yield of
10%
• Solid result despite far from buoyant conditions
• In subdued conditions, SEEK has generated strong
revenue & earnings growth from FY09 to FY12
EBITDA growth of 14% (FY12 v FY11)
• EBITDA margins increased from 60% to 61%
• Continued strong cost control in FY12
Operational Improvements
• Strong growth in prominence products
• Price increase of 5% implemented in FY13
Competitive Landscape
• Clear market leader in AU with 70%+ market share of ads,
visits and total time on site2
• Tighter competitive environment in NZ
• SEEK remains #1 in market share of job ads & total
time on site2
• To date, LinkedIn has had very limited impact on SEEK’s
key jobseeker or job ad metrics
Growth
FY12 FY11 $m %
Revenue 247.8 224.0 23.8 11%
EBITDA 152.1 133.5 18.6 14%
EBITDA (%) 61% 60%
A$m
Historical Results v AU U/E Rate1
4.2% 4.9% 5.5% 5.1% 5.2% 5.2% 5.0% 4.5%
1 Australia’s average unemployment rate for the year ended 30 June 2 Source: Jul-12, Nielsen Net Ratings, SEEK Count of Websites
For
per
sona
l use
onl
y
9
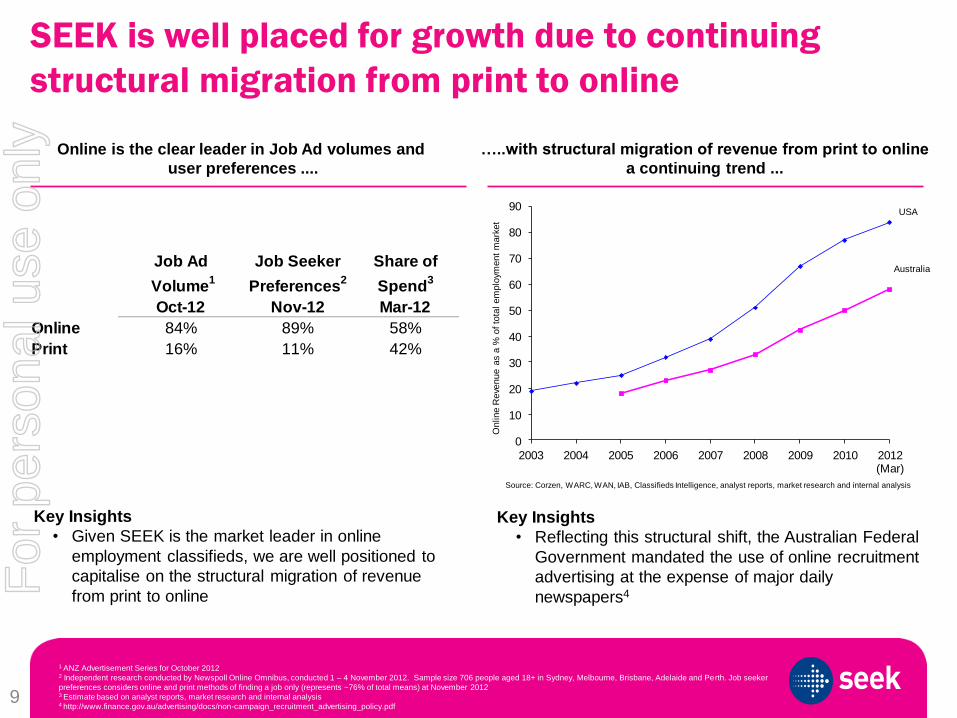
Online is the clear leader in Job Ad volumes and
user preferences .... …..with structural migration of revenue from print to online
a continuing trend ...
0
10
20
30
40
50
60
70
80
90
2003 2004 2005 2006 2007 2008 2009 2010 2012 (Mar)
Online R
eve
nue a
s a
% o
f to
tal em
plo
yment
mark
et
Source: Corzen, WARC, WAN, IAB, Classifieds Intelligence, analyst reports, market research and internal analysis
USA
Australia
Key Insights
• Given SEEK is the market leader in online
employment classifieds, we are well positioned to
capitalise on the structural migration of revenue
from print to online
Job Ad
Volume1
Job Seeker
Preferences2
Share of
Spend3
Oct-12 Nov-12 Mar-12
Online 84% 89% 58%
Print 16% 11% 42%
Key Insights
• Reflecting this structural shift, the Australian Federal
Government mandated the use of online recruitment
advertising at the expense of major daily
newspapers4
SEEK is well placed for growth due to continuing
structural migration from print to online
1 ANZ Advertisement Series for October 2012 2 Independent research conducted by Newspoll Online Omnibus, conducted 1 – 4 November 2012. Sample size 706 people aged 18+ in Sydney, Melbourne, Brisbane, Adelaide and Perth. Job seeker
preferences considers online and print methods of finding a job only (represents ~76% of total means) at November 2012 3 Estimate based on analyst reports, market research and internal analysis
4 http://www.finance.gov.au/advertising/docs/non-campaign_recruitment_advertising_policy.pdf
For
per
sona
l use
onl
y

10
1900s-1999
Print Job Ads
2012 into the Future... “Opportunity Matching”
2000
Online Job Ads
In 2000 SEEK
transformed
job advertising
In 2012 SEEK is
helping transform
candidate
sourcing
...assist recruiters &
corporates by matching job
opportunities to job seekers
Leadership = all job ads
& all candidates
Leadership = key
source of placed
candidates Key Insights
• By looking at all channels that source candidates, the market opportunity for SEEK is larger than previous
addressable market of only job ads
• Currently, job ads account for <30% of placed candidates
• SEEK to utilise its core assets & invest in new products & services to be the key source of placed candidates
SEEK has changed the way people find jobs, and will
do so again
For
per
sona
l use
onl
y
11
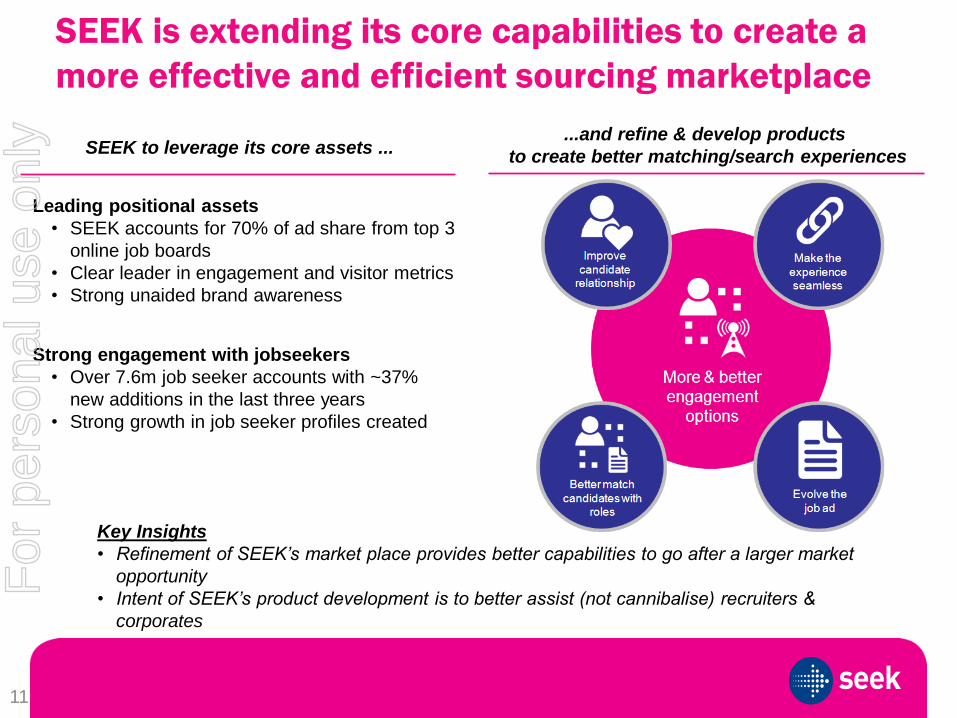
...and refine & develop products
to create better matching/search experiences SEEK to leverage its core assets ...
Leading positional assets
• SEEK accounts for 70% of ad share from top 3
online job boards
• Clear leader in engagement and visitor metrics
• Strong unaided brand awareness
Strong engagement with jobseekers
• Over 7.6m job seeker accounts with ~37%
new additions in the last three years
• Strong growth in job seeker profiles created
SEEK is extending its core capabilities to create a
more effective and efficient sourcing marketplace
Key Insights
• Refinement of SEEK’s market place provides better capabilities to go after a larger market
opportunity
• Intent of SEEK’s product development is to better assist (not cannibalise) recruiters &
corporates
For
per
sona
l use
onl
y

12
For All Job Seekers: Where did you find your last job?
For All Recruiters & Corporates: Where did you source
your last candidate?
SEEK’s role is to assist with the matching &
communication of job opportunities to job seekers
If we execute on our strategy, the answer to the
questions below will be “SEEK”
For
per
sona
l use
onl
y
13
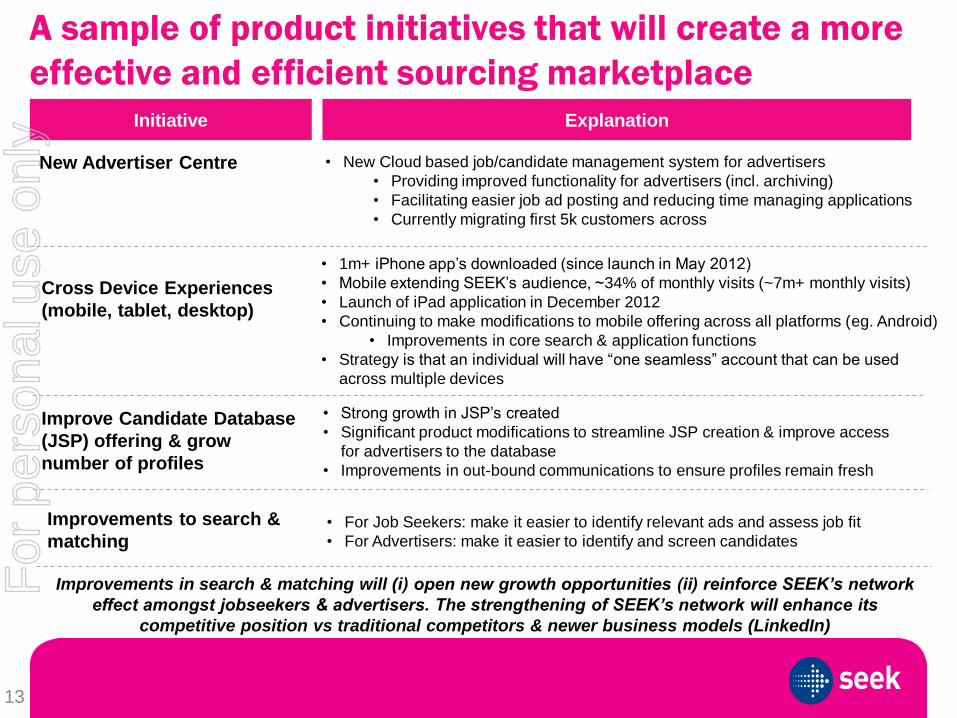
New Advertiser Centre • New Cloud based job/candidate management system for advertisers
• Providing improved functionality for advertisers (incl. archiving)
• Facilitating easier job ad posting and reducing time managing applications
• Currently migrating first 5k customers across
Initiative Explanation
Cross Device Experiences
(mobile, tablet, desktop)
• 1m+ iPhone app’s downloaded (since launch in May 2012)
• Mobile extending SEEK’s audience, ~34% of monthly visits (~7m+ monthly visits)
• Launch of iPad application in December 2012
• Continuing to make modifications to mobile offering across all platforms (eg. Android)
• Improvements in core search & application functions
• Strategy is that an individual will have “one seamless” account that can be used
across multiple devices
Improve Candidate Database
(JSP) offering & grow
number of profiles
• Strong growth in JSP’s created
• Significant product modifications to streamline JSP creation & improve access
for advertisers to the database
• Improvements in out-bound communications to ensure profiles remain fresh
Improvements to search &
matching • For Job Seekers: make it easier to identify relevant ads and assess job fit
• For Advertisers: make it easier to identify and screen candidates
Improvements in search & matching will (i) open new growth opportunities (ii) reinforce SEEK’s network
effect amongst jobseekers & advertisers. The strengthening of SEEK’s network will enhance its
competitive position vs traditional competitors & newer business models (LinkedIn)
A sample of product initiatives that will create a more
effective and efficient sourcing marketplace
For
per
sona
l use
onl
y

SEEK
International
14
For
per
sona
l use
onl
y
15
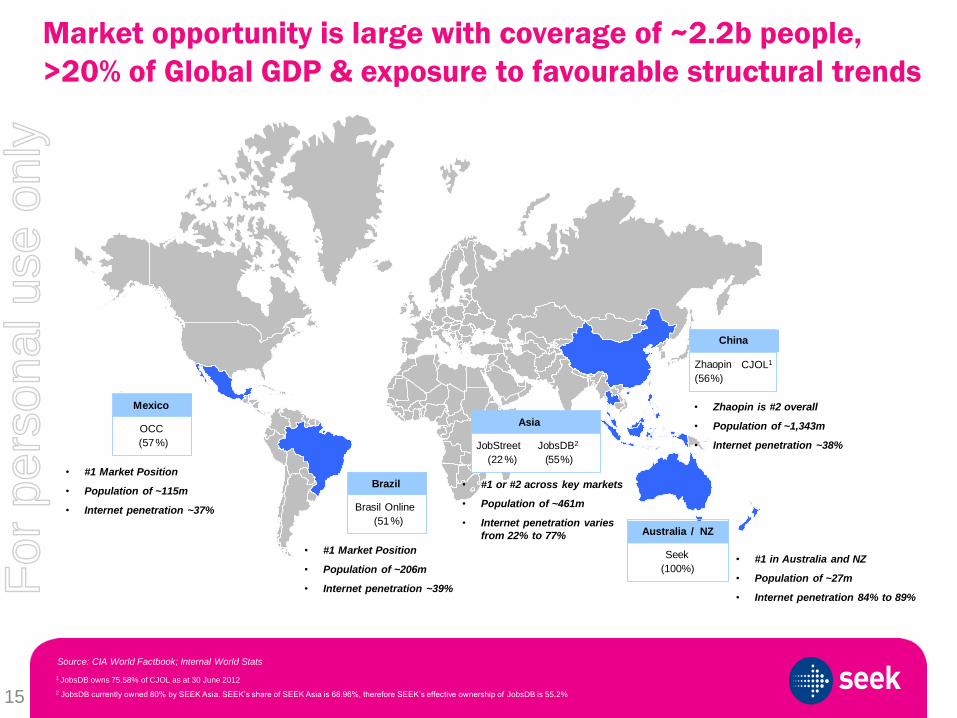
Mexico
OCC
( 57 %)
Brazil
Brasil Online
( 51 %)
Asia
JobStreet JobsDB2
( 22 %) ( 55 %)
Australia / NZ
Seek
(100%)
China
Zhaopin
( 56 %)
CJOL1
• #1 Market Position
• Population of ~115m
• Internet penetration ~37%
• #1 or #2 across key markets
• Population of ~461m
• Internet penetration varies
from 22% to 77%
• #1 Market Position
• Population of ~206m
• Internet penetration ~39%
• Zhaopin is #2 overall
• Population of ~1,343m
• Internet penetration ~38%
• #1 in Australia and NZ
• Population of ~27m
• Internet penetration 84% to 89%
1 JobsDB owns 75.58% of CJOL as at 30 June 2012
2 JobsDB currently owned 80% by SEEK Asia. SEEK’s share of SEEK Asia is 68.96%, therefore SEEK’s effective ownership of JobsDB is 55.2%
Source: CIA World Factbook; Internal World Stats
Market opportunity is large with coverage of ~2.2b people,
>20% of Global GDP & exposure to favourable structural trends
For
per
sona
l use
onl
y
16
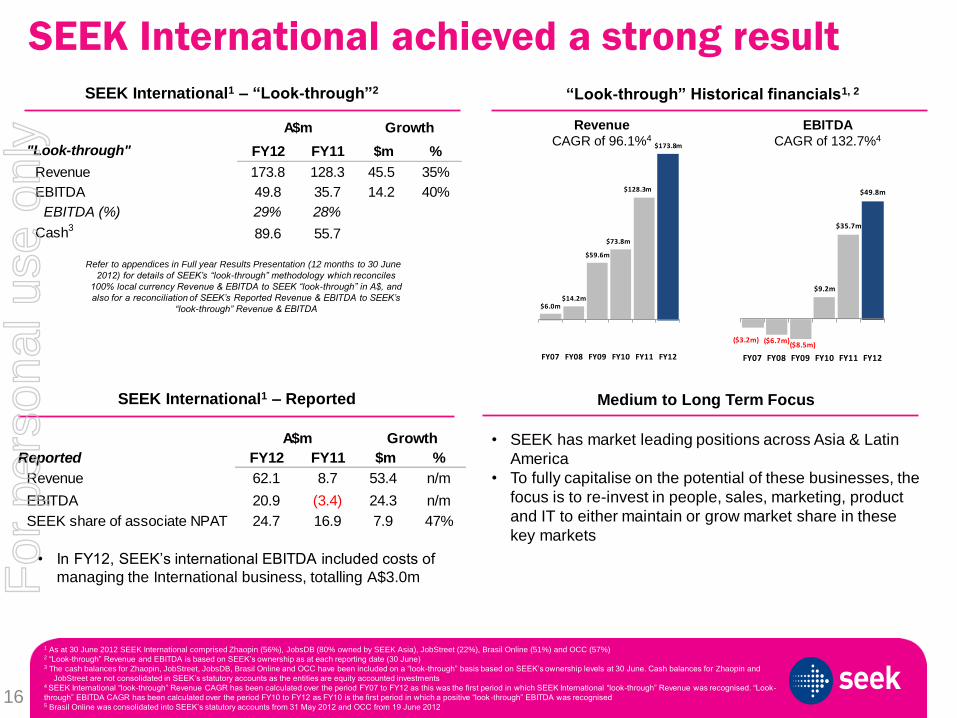
($3.2m) ($6.7m)($8.5m)
$9.2m
$35.7m
$49.8m
FY07 FY08 FY09 FY10 FY11 FY12
$6.0m$14.2m
$59.6m
$73.8m
$128.3m
$173.8m
FY07 FY08 FY09 FY10 FY11 FY12
SEEK International1 – “Look-through”2 “Look-through” Historical financials1, 2
Refer to appendices in Full year Results Presentation (12 months to 30 June
2012) for details of SEEK’s “look-through” methodology which reconciles
100% local currency Revenue & EBITDA to SEEK “look-through” in A$, and
also for a reconciliation of SEEK’s Reported Revenue & EBITDA to SEEK’s
“look-through” Revenue & EBITDA
Revenue
CAGR of 96.1%4
EBITDA
CAGR of 132.7%4
SEEK International1 – Reported Medium to Long Term Focus
• SEEK has market leading positions across Asia & Latin
America
• To fully capitalise on the potential of these businesses, the
focus is to re-invest in people, sales, marketing, product
and IT to either maintain or grow market share in these
key markets
A$m Growth
Reported FY12 FY11 $m %
Revenue 62.1 8.7 53.4 n/m
EBITDA 20.9 (3.4) 24.3 n/m
SEEK share of associate NPAT 24.7 16.9 7.9 47%
A$m Growth
"Look-through" FY12 FY11 $m %
Revenue 173.8 128.3 45.5 35%
EBITDA 49.8 35.7 14.2 40%
EBITDA (%) 29% 28%
Cash389.6 55.7
• In FY12, SEEK’s international EBITDA included costs of
managing the International business, totalling A$3.0m
SEEK International achieved a strong result
1 As at 30 June 2012 SEEK International comprised Zhaopin (56%), JobsDB (80% owned by SEEK Asia), JobStreet (22%), Brasil Online (51%) and OCC (57%) 2 “Look-through” Revenue and EBITDA is based on SEEK’s ownership as at each reporting date (30 June) 3 The cash balances for Zhaopin, JobStreet, JobsDB, Brasil Online and OCC have been included on a “look-through” basis based on SEEK’s ownership levels at 30 June. Cash balances for Zhaopin and
JobStreet are not consolidated in SEEK’s statutory accounts as the entities are equity accounted investments 4 SEEK International “look-through” Revenue CAGR has been calculated over the period FY07 to FY12 as this was the first period in which SEEK International “look-through” Revenue was recognised. “Look-
through” EBITDA CAGR has been calculated over the period FY10 to FY12 as FY10 is the first period in which a positive “look -through” EBITDA was recognised 5 Brasil Online was consolidated into SEEK’s statutory accounts from 31 May 2012 and OCC from 19 June 2012
For
per
sona
l use
onl
y

17
• In FY12, achieved revenue growth of 28%1 & SEEK share of NPAT of A$16.5m
• Zhaopin is well capitalised with cash of RMB 617.8m or ~A$95m (FY12)
• Operational Update: Well positioned on key metrics and continuing to close
the gap with number one player
56.7% Ownership Interest
55.2%2 Ownership Interest
22% Ownership Interest
• In FY12, achieved revenue growth of 9%1 & EBITDA growth of 23%1
• JobsDB is well capitalised with cash of HK 225.8 or ~A$28m (FY12)
• Operational Update: Focusing on continued investment in people,
marketing & sales to build a scalable business for long-term growth
• In FY12, achieved revenue growth of 18%1 & SEEK share of NPAT of A$2.8m
• Continues to pay dividends with SEEK’s share for FY13 YTD ~A$0.7m
• Operational Update: Revenue growth remained solid in Sept 2012 Qtr, up
15% on pcp whilst maintaining strong margins
1 100% basis in local currency 2 JobsDB currently owned 80% by SEEK Asia. SEEK’s share of SEEK Asia is 68.96%, therefore SEEK’s effective ownership of JobsDB is 55.2%
SEEK has a strong presence across Asia F
or p
erso
nal u
se o
nly

18
• On 31 May 2012, SEEK increased its ownership interest from 30% to 51%
• In FY12, achieved revenue growth of 14%1 & SEEK share of NPAT was
A$4.7m
• Operational Update: Achieving pleasing results whilst continuing to invest
in transitioning the business model to better serve both employer (CV
search) & jobseeker pays segments 51% Ownership Interest
56.7% Ownership Interest
• On 19 June 2012, SEEK increased its ownership interest from 41% to
57%
• In FY12, achieved revenue growth of 15%1 & SEEK share of NPAT was
A$0.8m despite the transition to a new ad usage model
• Operational Update: Pleasing customer transition from ‘unlimited
subscription’ to ‘ad usage2’ model
1 100% basis in local currency 2 Previously the “unlimited subscription” advertisers would typically purchase a 3 month contract where they could advertise an unlimited number of jobs. Under the “ad usage pack model” advertisers buy
ad packs based on a set number of ads with typically a ~12 month expiration period. Ad plan transition in FY13 impacts the accounting revenue profile due to a longer period of amortisation than the previous
model
SEEK moved to controlling positions in its Latin
America businesses
For
per
sona
l use
onl
y

SEEK
Education
19
For
per
sona
l use
onl
y

20
SEEK Education1 – “Look-through”2 “Look-through” Historical financials 1, 2
Refer to appendices in Full year Results Presentation (12 months to 30 June
2012) for details of SEEK’s “look-through” methodology which reconciles
100% local currency Revenue & EBITDA to SEEK “look-through” in A$, and
also for a reconciliation of SEEK’s Reported Revenue & EBITDA to SEEK’s
“look-through” Revenue & EBITDA
$6.1m$11.3m
$59.9m
$100.2m
$169.0m
$207.8m $205.3m
$235.8m
FY05 FY06 FY07 FY08 FY09 FY10 FY11 FY12
$1.4M$3.1M
$12.3M
$18.8M
$28.8M
$39.7M
$18.4M
$33.0M
FY05 FY06 FY07 FY08 FY09 FY10 FY11 FY12
Revenue
CAGR of 68.6%
EBITDA
CAGR of 57.1%
Growth
Reported FY12 FY11 $m %
Revenue 132.4 110.3 22.1 20%
EBITDA 20.5 5.5 15.0 270%
SEEK Share of associate NPAT3 6.1 7.7 (1.6) (20%)
A$m
A$m Growth
"Look-through" FY12 FY11 $m %
Revenue 235.8 205.3 30.5 15%
EBITDA 33.0 18.4 14.7 80%
EBITDA (%) 14% 9%
SEEK Education1 – Reported
• SEEK share of associate NPAT declined in FY12 as a
result of losses in Swinburne JV’s start-up phase
Completion of THINK transaction
1 As at 30 June 2012 SEEK Education comprised SEEK Learning (100%), THINK (100%), IDP (50%) and Swinburne Online (50%) 2 “Look-through” Revenue and EBITDA is based on SEEK’s ownership as at each reporting date (30 June) . Refer appendices in Full Year Results Presentation for further details of SEEK’s “look-through”
methodology. The Revenue and EBITDA for IDP & Swinburne Online have been included on a “look-through” basis at SEEK’s 50% ownership level. However, for SEEK’s statutory accounts, IDP & Swinburne
Online do not form part of SEEK’s Consolidated Revenue & EBITDA. 3 SEEK share of associate NPAT includes IDP and Swinburne Online
SEEK Education performed well in FY12
• Laureate Education, Inc (Laureate) acquired a 20%
(minority shareholding) stake in THINK in August 2012
• Acquisition price based on an implied 100% Enterprise
Value of A$75m
• Continuation of SEEK’s preferred model of investing in
high quality education businesses alongside strategic
partners
For
per
sona
l use
onl
y
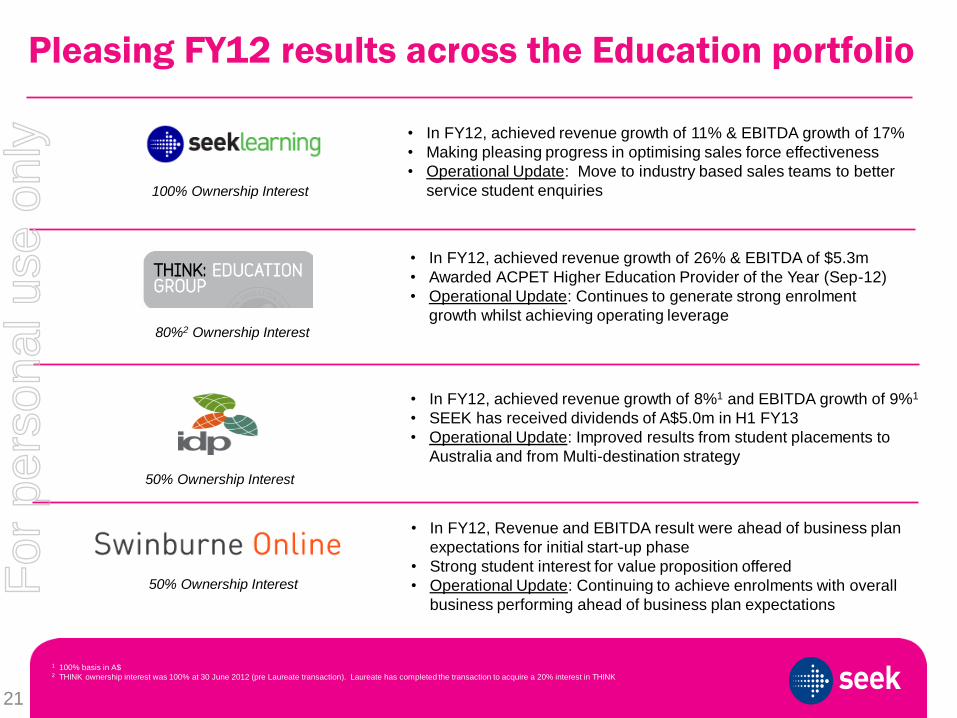
21
• In FY12, achieved revenue growth of 11% & EBITDA growth of 17%
• Making pleasing progress in optimising sales force effectiveness
• Operational Update: Move to industry based sales teams to better
service student enquiries 100% Ownership Interest
80%2 Ownership Interest
50% Ownership Interest
• In FY12, achieved revenue growth of 26% & EBITDA of $5.3m
• Awarded ACPET Higher Education Provider of the Year (Sep-12)
• Operational Update: Continues to generate strong enrolment
growth whilst achieving operating leverage
• In FY12, achieved revenue growth of 8%1 and EBITDA growth of 9%1
• SEEK has received dividends of A$5.0m in H1 FY13
• Operational Update: Improved results from student placements to
Australia and from Multi-destination strategy
50% Ownership Interest
• In FY12, Revenue and EBITDA result were ahead of business plan
expectations for initial start-up phase
• Strong student interest for value proposition offered
• Operational Update: Continuing to achieve enrolments with overall
business performing ahead of business plan expectations
Pleasing FY12 results across the Education portfolio
1 100% basis in A$ 2 THINK ownership interest was 100% at 30 June 2012 (pre Laureate transaction). Laureate has completed the transaction to acquire a 20% interest in THINK
For
per
sona
l use
onl
y

Trading
Update
22
For
per
sona
l use
onl
y
23
SEEK International
SEEK
Domestic
SEEK GROUP
SEEK
Education
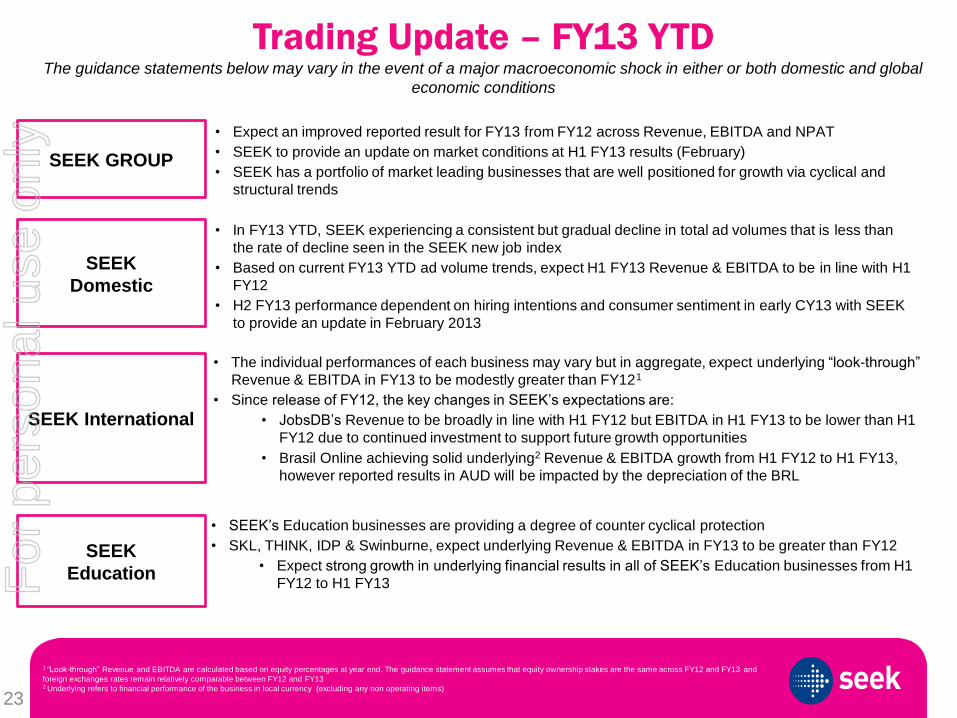
• Expect an improved reported result for FY13 from FY12 across Revenue, EBITDA and NPAT
• SEEK to provide an update on market conditions at H1 FY13 results (February)
• SEEK has a portfolio of market leading businesses that are well positioned for growth via cyclical and
structural trends
• In FY13 YTD, SEEK experiencing a consistent but gradual decline in total ad volumes that is less than
the rate of decline seen in the SEEK new job index
• Based on current FY13 YTD ad volume trends, expect H1 FY13 Revenue & EBITDA to be in line with H1
FY12
• H2 FY13 performance dependent on hiring intentions and consumer sentiment in early CY13 with SEEK
to provide an update in February 2013
• The individual performances of each business may vary but in aggregate, expect underlying “look-through”
Revenue & EBITDA in FY13 to be modestly greater than FY121
• Since release of FY12, the key changes in SEEK’s expectations are:
• JobsDB’s Revenue to be broadly in line with H1 FY12 but EBITDA in H1 FY13 to be lower than H1
FY12 due to continued investment to support future growth opportunities
• Brasil Online achieving solid underlying2 Revenue & EBITDA growth from H1 FY12 to H1 FY13,
however reported results in AUD will be impacted by the depreciation of the BRL
• SEEK’s Education businesses are providing a degree of counter cyclical protection
• SKL, THINK, IDP & Swinburne, expect underlying Revenue & EBITDA in FY13 to be greater than FY12
• Expect strong growth in underlying financial results in all of SEEK’s Education businesses from H1
FY12 to H1 FY13
Trading Update – FY13 YTD The guidance statements below may vary in the event of a major macroeconomic shock in either or both domestic and global
economic conditions
1 “Look-through” Revenue and EBITDA are calculated based on equity percentages at year end. The guidance statement assumes that equity ownership stakes are the same across FY12 and FY13 and
foreign exchanges rates remain relatively comparable between FY12 and FY13 2 Underlying refers to financial performance of the business in local currency (excluding any non operating items)
For
per
sona
l use
onl
y

24
For
per
sona
l use
onl
y

For
per
sona
l use
onl
y