annual fund report · 2020-04-14 · cio message 2| income annual fund report for the financial...
TRANSCRIPT
ANNUAL FUND REPORTFOR THE FINANCIAL YEAR AS OF31 DECEMBER 2019
Contents
CIO Message 2
Fund Changes for the financial year
as of 31 December 2019 3
Summary of Fund Performance
as of 31 December 2019 4
Core Funds Global Bond Fund 5
Global Equity Fund 10
Singapore Bond Fund 15
Singapore Equity Fund 19
Managed Funds Asia Managed Fund 23
Global Managed Fund (Balanced) 28
Global Managed Fund (Conservative) 35
Global Managed Fund (Growth) 42
Singapore Managed Fund 49
Target Maturity Funds AIM Now Fund 54
AIM 2025 Fund 58
AIM 2035 Fund 62
AIM 2045 Fund 66
Specialised Funds Money Market Fund 70
Thematic Funds Asian Bond Fund 74
Asian Income Fund 81
Global Income Fund 86
Global Technology Fund 91
Multi-Asset Premium Fund 95
Prime Fund 100
Takaful Fund 105
Financial Statements Capital and Income Account 109
Statement of Financial Position 112
Notes to the Financial Statements 114

CIO Message
2| Income Annual Fund Report
for the financial year as of 31 December 2019
1st March 2020
Dear Policyholder
In 2019, the fear of recession gripped the markets as global manufacturing contracted and the United States (US) yield curve
inverted amidst escalating China-US tension, Brexit and uncertainties in Hong Kong. The US Federal Reserve (Fed) cut interest
rates three times in 2019 to calm the markets and reduce the recession risk. On the back of China and US reaching a limited
trade deal, the latest economic data is pointing to global economies showing some signs of improvement, averting concerns of
a global recession in the near term. Given the turnaround in the initial negative market sentiment together with the Fed’s
accommodative monetary policy which provided ample liquidity to the global markets, 2019 delivered a relatively strong
performance, reversing the loss experienced in 2018.
The global economy, in 2020, is likely to grow slowly with muted inflation. Manufacturing and business investments are likely to
recover, with services and consumer spending staying robust. We also foresee loose monetary policy to carry over to 2020. Phase
One of the China-US trade deal could help stabilise manufacturing/business investments. However, we are keeping vigilant about
potential trade friction, COVID-19 outbreak, and geopolitical uncertainty that could arise again. As such, global markets are
expected to be positive although it is unlikely to be as bullish as 2019. For Income, we will continue to keep our investment
portfolio diversified in this market environment and focus on delivering long-term investment returns.
Amidst market volatility, I am glad to share that our Investment-Linked Policy (ILP) sub-funds continue to perform well in the
market as 67% of our 21 ILP sub-funds were ranked in the first and second quartile of their Morningstar categories in full year
2019. Besides that, our ILP sub-funds were also represented in the Lipper Leader categories. This included the Global Managed
Fund (Growth) and Global Managed Fund (Balanced), which are the only ILP sub-funds in the CPF Investment Scheme that
received “Lipper Leader” rating across all four metrics namely, “Consistent Return”, “Preservation”, “Expense” and “Total Return”
in fourth quarter 2019. Furthermore, the Singapore Bond Fund, Global Bond Fund, Asia Managed Fund, Takaful Fund and Global
Managed Fund (Conservative) also achieved “Lipper Leader” status in three out of the four categories in the same review.
The latest Annual Fund Report for the financial period ended 31 December 2019 can be downloaded at
https://www.income.com.sg/fund/factsheet/2019Dec.pdf. You may also access your ILP statement via me@income, our online
customer portal at www.income.com.sg.
To request for a copy of the Fund Report, please call our Customer Service Hotline at 67881122/67881777 or email us at
Kate Chiew
Chief Investment Officer

Fund Changes for the financial year
as of 31 December 2019
Income Annual Fund Report
for the financial year as of 31 December 2019
3|
Revised Risk Classification for AIM 2035
AIM 2035 is a target maturity multi-asset portfolio that invests in a broad range of assets including fixed income, equities and
alternatives to deliver consistent returns over a market cycle. The allocation between the asset classes will become more
conservative as the portfolio approaches its maturity date. To reflect the reduced volatility of the portfolio, the CPF Risk
Classification of AIM 2035 has been revised from Higher Risk – Broadly Diversified to Medium to High Risk – Broadly Diversified
and the expense ratio cap of the revised classification will apply to AIM 2035.
This update is for your information only as AIM 2035 continues to be included under CPF Investment Scheme (CPFIS). No further
action is required on your part to remain invested in AIM 2035.

Summary of Fund Performance
as of 31 December 2019
Income Annual Fund Report
for the financial year as of 31 December 2019
4|
*Annualised Returns
Notes:
1. The Global Managed Funds are invested in our Core Funds in the following ratios:
Balanced: Singapore Equity (10%), Global Equity (40%), Singapore Bond (15%) and Global Bond (35%).
Conservative: Singapore Equity (5%), Global Equity (25%), Singapore Bond (20%) and Global Bond (50%).
Growth: Singapore Equity (15%), Global Equity (55%), Singapore Bond (10%) and Global Bond (20%).
2. The returns are calculated on a bid-to-bid basis, in Singapore Dollar terms. All dividends are re-invested.
Fees and charges payable through premium deduction or units cancellation are excluded from the calculation.
3. Past performance of the sub-fund is not indicative of future performance. Annualised Returns are not
guaranteed as the value of the units may rise or fall as the performance of the sub-fund changes.
1 year 3 years* 5 years*
10 years* Since
Inception*
Core Funds
Global Bond Fund 9.34% 3.68% 2.56% 3.73% 3.29%
Global Equity Fund 28.29% 11.89% 9.72% 8.58% 5.47%
Singapore Bond Fund 5.94% 4.64% 3.69% 3.62% 3.55%
Singapore Equity Fund 9.57% 7.18% 2.44% 3.52% 7.65%
Managed Funds
Asia Managed Fund 16.00% 11.63% 8.44% 7.59% 6.12%
Global Managed Fund
(Balanced) 16.28% 7.68% 5.82% 5.79% 5.71%
Global Managed Fund
(Conservative) 13.14% 6.12% 4.65% 4.90% 4.76%
Global Managed Fund
(Growth) 19.28% 9.05% 6.83% 6.48% 6.42%
Singapore Managed Fund 8.66% 6.09% 3.01% 3.26% 5.52%
Target Maturity Funds
AIM Now Fund 8.61% 4.48% 3.35% 3.22% 3.21%
AIM 2025 Fund 12.24% 6.28% 4.73% 4.76% 5.00%
AIM 2035 Fund 16.22% 8.22% 6.16% 5.77% 6.18%
AIM 2045 Fund 17.39% 8.47% 6.33% 5.96% 6.32%
Specialised Funds
Money Market Fund 1.78% 1.48% 1.30% 0.86% 1.14%
Thematic Funds
Asian Bond Fund 10.39% 3.94% N.A. N.A. 3.31%
Asian Income Fund 10.56% 4.81% 4.03% N.A. 4.77%
Global Income Fund 11.32% 3.19% N.A. N.A. 1.80%
Global Technology Fund 36.58% 19.12% 16.26% 14.86% -0.48%
Multi-Asset Premium Fund 16.24% N.A. N.A. N.A. 2.09%
Prime Fund 8.58% 7.14% 4.87% 4.40% 8.31%
Takaful Fund 31.13% 13.13% 11.22% 10.80% 3.22%
Income Annual Fund Report
for the financial year as of 31 December 2019 5|
Global Bond Fund
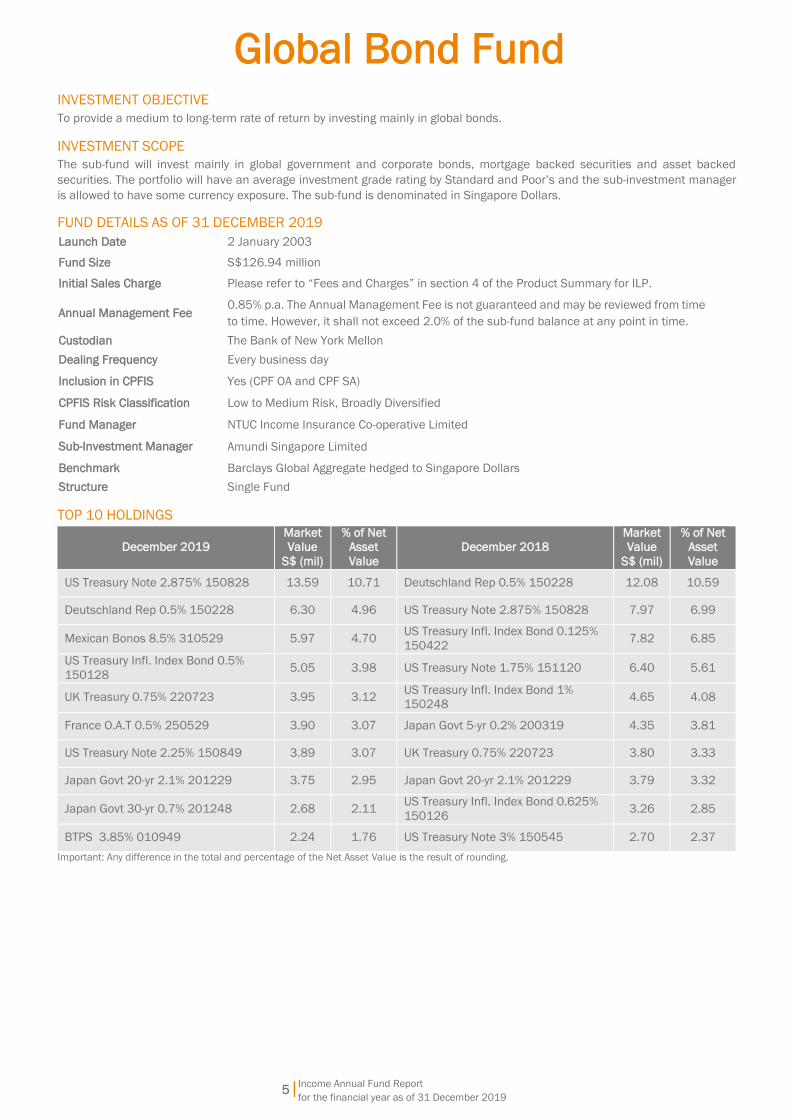
INVESTMENT OBJECTIVE
To provide a medium to long-term rate of return by investing mainly in global bonds.
INVESTMENT SCOPE
The sub-fund will invest mainly in global government and corporate bonds, mortgage backed securities and asset backed
securities. The portfolio will have an average investment grade rating by Standard and Poor’s and the sub-investment manager
is allowed to have some currency exposure. The sub-fund is denominated in Singapore Dollars.
FUND DETAILS AS OF 31 DECEMBER 2019
Launch Date 2 January 2003
Fund Size S$126.94 million
Initial Sales Charge Please refer to “Fees and Charges” in section 4 of the Product Summary for ILP.
Annual Management Fee 0.85% p.a. The Annual Management Fee is not guaranteed and may be reviewed from time
to time. However, it shall not exceed 2.0% of the sub-fund balance at any point in time.
Custodian The Bank of New York Mellon
Dealing Frequency Every business day
Inclusion in CPFIS Yes (CPF OA and CPF SA)
CPFIS Risk Classification Low to Medium Risk, Broadly Diversified
Fund Manager NTUC Income Insurance Co-operative Limited
Sub-Investment Manager Amundi Singapore Limited
Benchmark Barclays Global Aggregate hedged to Singapore Dollars
Structure Single Fund
TOP 10 HOLDINGS
December 2019
Market
Value
S$ (mil)
% of Net
Asset
Value
December 2018
Market
Value
S$ (mil)
% of Net
Asset
Value
US Treasury Note 2.875% 150828 13.59 10.71 Deutschland Rep 0.5% 150228 12.08 10.59
Deutschland Rep 0.5% 150228 6.30 4.96 US Treasury Note 2.875% 150828 7.97 6.99
Mexican Bonos 8.5% 310529 5.97 4.70 US Treasury Infl. Index Bond 0.125%
150422 7.82 6.85
US Treasury Infl. Index Bond 0.5%
150128 5.05 3.98 US Treasury Note 1.75% 151120 6.40 5.61
UK Treasury 0.75% 220723 3.95 3.12 US Treasury Infl. Index Bond 1%
150248 4.65 4.08
France O.A.T 0.5% 250529 3.90 3.07 Japan Govt 5-yr 0.2% 200319 4.35 3.81
US Treasury Note 2.25% 150849 3.89 3.07 UK Treasury 0.75% 220723 3.80 3.33
Japan Govt 20-yr 2.1% 201229 3.75 2.95 Japan Govt 20-yr 2.1% 201229 3.79 3.32
Japan Govt 30-yr 0.7% 201248 2.68 2.11 US Treasury Infl. Index Bond 0.625%
150126 3.26 2.85
BTPS 3.85% 010949 2.24 1.76 US Treasury Note 3% 150545 2.70 2.37
Important: Any difference in the total and percentage of the Net Asset Value is the result of rounding.

Income Annual Fund Report
for the financial year as of 31 December 2019 6|
Global Bond Fund
FUND MANAGER
NTUC Income Insurance Co-operative Limited is the
Investment Manager of the sub-fund. Amundi Singapore
Limited is the Sub-Investment Manager of the sub-fund.
NTUC Income Insurance Co-operative Limited (Income)
Income was established in 1970 to make essential
insurance accessible to all Singaporeans. Today, Income is
the leading composite insurer in Singapore offering life,
health and general insurance. Our wide network of financial
advisers and partners provide value-added financial advisory
that complements today’s digital-first landscape, offering
insurance products and services that serve the protection,
savings and investment needs of customers at different
stages and across all segments of society.
As of 31 December 2019, Income had S$40.45 billion in
assets under management. Our financial strength and
diversified investment portfolio are reflected by our strong
credit ratings and predicated on our core investment
philosophy of value, prudence and discipline.
Amundi Singapore Limited
Amundi Singapore Limited is a wholly-owned subsidiary of
Amundi Asset Management. It was established in Singapore
in 1989 as a business hub for Amundi’s group operations in
South East Asia. Amundi Singapore Limited is licensed and
regulated by the Monetary Authority of Singapore and has
been managing collective investment schemes and/or
discretionary funds since 1989. It is also one of Amundi’s
group investment centres responsible for Asian investment
management. Amundi manages €1.65 trillion euros of
assets as of 31 December 2019.
FUND PERFORMANCE VS BENCHMARK 1-month 3-month 6-month 1-year
Global
Bond Fund 0.23% -0.40% 3.09% 9.34%
Benchmark -0.23% -0.58% 1.91% 7.66%
3-year
annualised
5-year
annualised
10-year
annualised
Since
inception annualised
Global Bond Fund
3.68% 2.56% 3.73% 3.29%
Benchmark 3.77% 3.53% 4.07% 3.81%
90
110
130
150
170
190
210
Jan-03 Sep-04 May-06 Jan-08 Sep-09 May-11 Jan-13 Sep-14 May-16 Jan-18 Sep-19
Cumulative Performance Since Inception
Fund Benchmark
IndexedPerformance
Dec-19
The returns are calculated using bid-to-bid prices, in Singapore Dollar
terms, with dividends and distributions reinvested. Past performance is
not necessarily indicative of future performance. Fees & charges
payable through deduction of premium or cancellation of units are
excluded from this calculation.
Volatility
3-year (annualised)
Global Bond Fund 2.44%
Calculated using bid-bid prices in Singapore Dollar terms, with dividends
and distributions reinvested.
MARKET REVIEW
Market Review The first half of 2019 saw economic data gradually get
weaker, prompting central banks to turn more dovish. The
European Central Bank (ECB) announcing new measures to
stimulate growth in Europe with a new round of targeted
longer-term refinancing operations (TLTROs), bank loans
intended for purchase of European sovereign and corporate
bonds. Trade negotiations between the US and China,
climaxed as President Trump’s administration threatened to
raise import taxes on US$200bn worth of Chinese imports to
the US from 10% to 25%, with the potential for taxes to be
levied on a further US$300bn worth of imports. China
threatened to retaliate by raising tariffs on US$60bn of
imported US goods. Developed markets government bonds
have seen strong performance in the first semester as yields
have fallen sharply in less hawkish central bank expectations.
Since June, financial markets experienced volatility triggered
by trade tensions, poor macro data and heightened political
risk. We saw further evidence of a global slowdown, notably
in Germany and China. Political uncertainties soared, with no
further clarity on the terms of the Brexit, political instability
in Italy after the dissolution of the government and rising
tensions in Hong Kong. On the other hand, main Central
Banks continued their shift toward a more accommodative
monetary policy and in some places rates were cut. The ECB
delivered a meaningful package of aggressive easing
measures to support the inflation outlook, while the US
Federal Reserve (Fed) cut rates and set its rate strategy to
be updated on a meeting-by-meeting basis.
In the UK, the Brexit deadline of 31st October was extended
to the end of January after ongoing disagreements within and
across parties on the withdrawal agreement, and Prime
Minister Johnson called for an election to be held in
December. The December election gave the conservative
party a large majority which should help to push through
Brexit deals with less resistance from the opposition. US and
China relations improved as they agreed on a so called
“phase-one” trade deal which suspends the imposition of
about US$160bn of tariffs on Chinese imports into the US.
In the US, the House of Representatives voted to impeach
President Trump on two charges however with the
Republicans controlling the Senate, it is unlikely that this will
affect Mr. Trump’s presidency. The main developed markets
central bank policy change came from the Swedish Riksbank
which was the first to enter negative rate territory and the
first to exit as they raised rates from -0.25% to 0.00%.
Further afield, the quarter saw widespread social and
political unrest in Argentina, Bolivia and Chile as protests
took place against a widening wealth gap between the
richest and the average population in addition to disputed
elections.

Income Annual Fund Report
for the financial year as of 31 December 2019 7|
Global Bond Fund
Market Outlook
For 2020 we currently see five key themes that could have
significant impact on the markets. We see fiscal and
monetary easing across developed markets which could
provide a welcome tailwind that with tactical opportunities.
The global assessment of trade dynamics is impacting areas
and countries differently, with some emerging markets
possibly benefitting as trade that would have gone to China
becomes diverted to other countries. We expect China to
decelerate but to manage the slower growth by addressing
productivity growth, while avoiding a credit bubble burst.
There is some spill over from manufacturing to services, but
US consumers will remain sufficiently resilient in 2020 due
to healthier household balance sheet. Global earnings per
share growth is expected in the lower single digit space.
Currency dynamics and spreads are the main areas to
monitor, as the materialisation of downside risk might be
sudden and impactful in a world washed by government and
corporate debt. With a good balance of positives and risks
expected to materialise in 2020, the ability and flexibility to
quickly allocate risk across a wide spectrum of assets to
where it will reap the largest rewards remains critical.
We are currently overall underweight duration, particularly on
the shorter end of the curve. Geographically, we are
underweight duration in the Eurozone and Japan whilst being
overweight USD-denominated duration. We remain
overweight investment grade corporate bonds as they still
offer a decent pick-up over government bonds, we also hold
selective allocations to emerging markets bonds. Within
currencies, we are underweight the USD with an overweight
allocation to the EUR which stands to grow on improved
growth expectations. In addition, we hold overweight
allocations to select high yielding emerging markets
currencies like the MXN, TRY and RUB. We are underweight
the USD which we view as being fully priced in.
RISKS
Income’s ILP sub-funds are intended for long-term
investment, it is not suited for any short-term speculation.
You should not expect to obtain any short-term gains from
investing in Income’s ILP sub-funds. It is important that your
investment suits your risk appetite. You may wish to consult
your financial adviser before investing in any ILP sub-fund.
You should be aware that past performance is not indicative
of future performance. The value of the units may rise or fall
as the performance of the sub-fund changes.
More information on the risks of the sub-fund can be found
in the Fund Summary and Product Highlights Sheet.
EXPENSE AND TURNOVER RATIO
Expense ratio Turnover ratio
As of 31
December 2019 0.87% 93.47%
As of 31
December 2018 0.88% 65.14%
Expense ratio does not include (where applicable) charges for insurance
coverage, brokerage and other transaction costs, performance fee,
foreign exchange gains or losses, front or back end loads arising from
the purchase or sale of collective investment schemes and tax deducted
at source or arising out of income received.
ASSET ALLOCATION AS OF 31 DECEMBER 2019
Market Value
S$ (mil)
% of Net Asset
Value
Corporate Bonds 39.75 31.31
Government Bonds 72.25 56.92
Cash & Others 14.94 11.77
Total 126.94 100.00
COUNTRY ALLOCATION AS OF 31 DECEMBER 2019
Market Value
S$ (mil)
% of Net Asset
Value
Belgium 2.04 1.60
Britain 7.66 6.04
Canada 2.84 2.23
Egypt 1.23 0.97
France 10.45 8.23
Germany 6.30 4.96
Italy 5.04 3.97
Japan 7.89 6.22
Luxembourg 0.65 0.51
Mexico 6.42 5.06
Netherlands 2.55 2.01
Poland 1.52 1.20
Portugal 2.20 1.73
Saudi Arabia 2.28 1.80
Singapore 0.97 0.76
Spain 5.11 4.03
United States 43.06 33.92
Others 3.79 2.99
Cash & Others 14.94 11.77
Total 126.94 100.00
SECTOR ALLOCATION AS OF 31 DECEMBER 2019
Market Value
S$ (mil)
% of Net Asset
Value
Communications 7.31 5.75
Consumer, Cyclical 1.03 0.81
Consumer, Non-
cyclical 1.79 1.41
Energy 0.45 0.36
Financial 21.65 17.06
Government 74.91 59.01
Industrial 1.55 1.22
Technology 1.10 0.87
Utilities 2.21 1.74
Cash & Others 14.94 11.77
Total 126.94 100.00
Income Annual Fund Report
for the financial year as of 31 December 2019 8|
Global Bond Fund
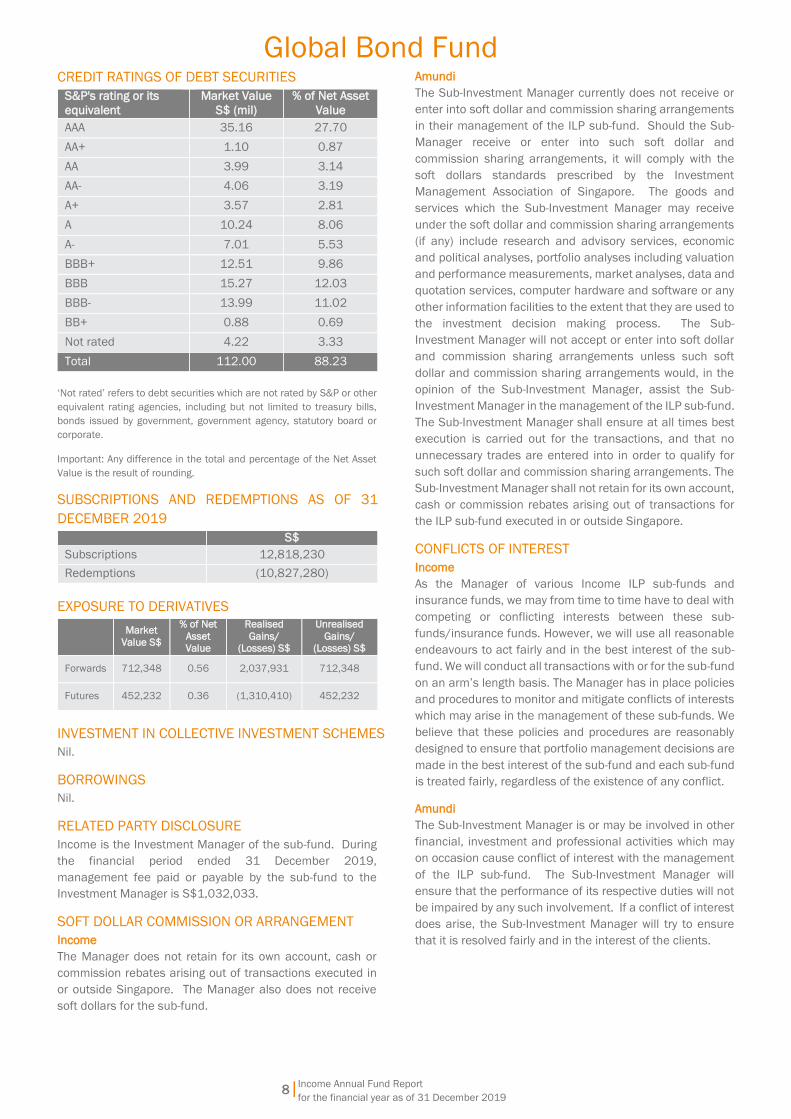
CREDIT RATINGS OF DEBT SECURITIES
S&P's rating or its
equivalent
Market Value
S$ (mil)
% of Net Asset
Value
AAA 35.16 27.70
AA+ 1.10 0.87
AA 3.99 3.14
AA- 4.06 3.19
A+ 3.57 2.81
A 10.24 8.06
A- 7.01 5.53
BBB+ 12.51 9.86
BBB 15.27 12.03
BBB- 13.99 11.02
BB+ 0.88 0.69
Not rated 4.22 3.33
Total 112.00 88.23
‘Not rated’ refers to debt securities which are not rated by S&P or other
equivalent rating agencies, including but not limited to treasury bills,
bonds issued by government, government agency, statutory board or
corporate.
Important: Any difference in the total and percentage of the Net Asset
Value is the result of rounding.
SUBSCRIPTIONS AND REDEMPTIONS AS OF 31
DECEMBER 2019
S$
Subscriptions 12,818,230
Redemptions (10,827,280)
EXPOSURE TO DERIVATIVES
Market
Value S$
% of Net
Asset
Value
Realised
Gains/
(Losses) S$
Unrealised
Gains/
(Losses) S$
Forwards 712,348 0.56 2,037,931 712,348
Futures 452,232 0.36 (1,310,410) 452,232
INVESTMENT IN COLLECTIVE INVESTMENT SCHEMES
Nil.
BORROWINGS
Nil.
RELATED PARTY DISCLOSURE
Income is the Investment Manager of the sub-fund. During
the financial period ended 31 December 2019,
management fee paid or payable by the sub-fund to the
Investment Manager is S$1,032,033.
SOFT DOLLAR COMMISSION OR ARRANGEMENT
Income
The Manager does not retain for its own account, cash or
commission rebates arising out of transactions executed in
or outside Singapore. The Manager also does not receive
soft dollars for the sub-fund.
Amundi
The Sub-Investment Manager currently does not receive or
enter into soft dollar and commission sharing arrangements
in their management of the ILP sub-fund. Should the Sub-
Manager receive or enter into such soft dollar and
commission sharing arrangements, it will comply with the
soft dollars standards prescribed by the Investment
Management Association of Singapore. The goods and
services which the Sub-Investment Manager may receive
under the soft dollar and commission sharing arrangements
(if any) include research and advisory services, economic
and political analyses, portfolio analyses including valuation
and performance measurements, market analyses, data and
quotation services, computer hardware and software or any
other information facilities to the extent that they are used to
the investment decision making process. The Sub-
Investment Manager will not accept or enter into soft dollar
and commission sharing arrangements unless such soft
dollar and commission sharing arrangements would, in the
opinion of the Sub-Investment Manager, assist the Sub-
Investment Manager in the management of the ILP sub-fund.
The Sub-Investment Manager shall ensure at all times best
execution is carried out for the transactions, and that no
unnecessary trades are entered into in order to qualify for
such soft dollar and commission sharing arrangements. The
Sub-Investment Manager shall not retain for its own account,
cash or commission rebates arising out of transactions for
the ILP sub-fund executed in or outside Singapore.
CONFLICTS OF INTEREST
Income
As the Manager of various Income ILP sub-funds and
insurance funds, we may from time to time have to deal with
competing or conflicting interests between these sub-
funds/insurance funds. However, we will use all reasonable
endeavours to act fairly and in the best interest of the sub-
fund. We will conduct all transactions with or for the sub-fund
on an arm’s length basis. The Manager has in place policies
and procedures to monitor and mitigate conflicts of interests
which may arise in the management of these sub-funds. We
believe that these policies and procedures are reasonably
designed to ensure that portfolio management decisions are
made in the best interest of the sub-fund and each sub-fund
is treated fairly, regardless of the existence of any conflict.
Amundi The Sub-Investment Manager is or may be involved in other
financial, investment and professional activities which may
on occasion cause conflict of interest with the management
of the ILP sub-fund. The Sub-Investment Manager will
ensure that the performance of its respective duties will not
be impaired by any such involvement. If a conflict of interest
does arise, the Sub-Investment Manager will try to ensure
that it is resolved fairly and in the interest of the clients.

Income Annual Fund Report
for the financial year as of 31 December 2019 9|
Global Bond Fund
OTHER PARTIES
The auditor of this sub-fund is KPMG LLP. Please note that
financial results ending 31 December of each year will be
audited.
MATERIAL INFORMATION
Nil.
Global Equity Fund
Income Annual Fund Report
for the financial year as of 31 December 2019
10|
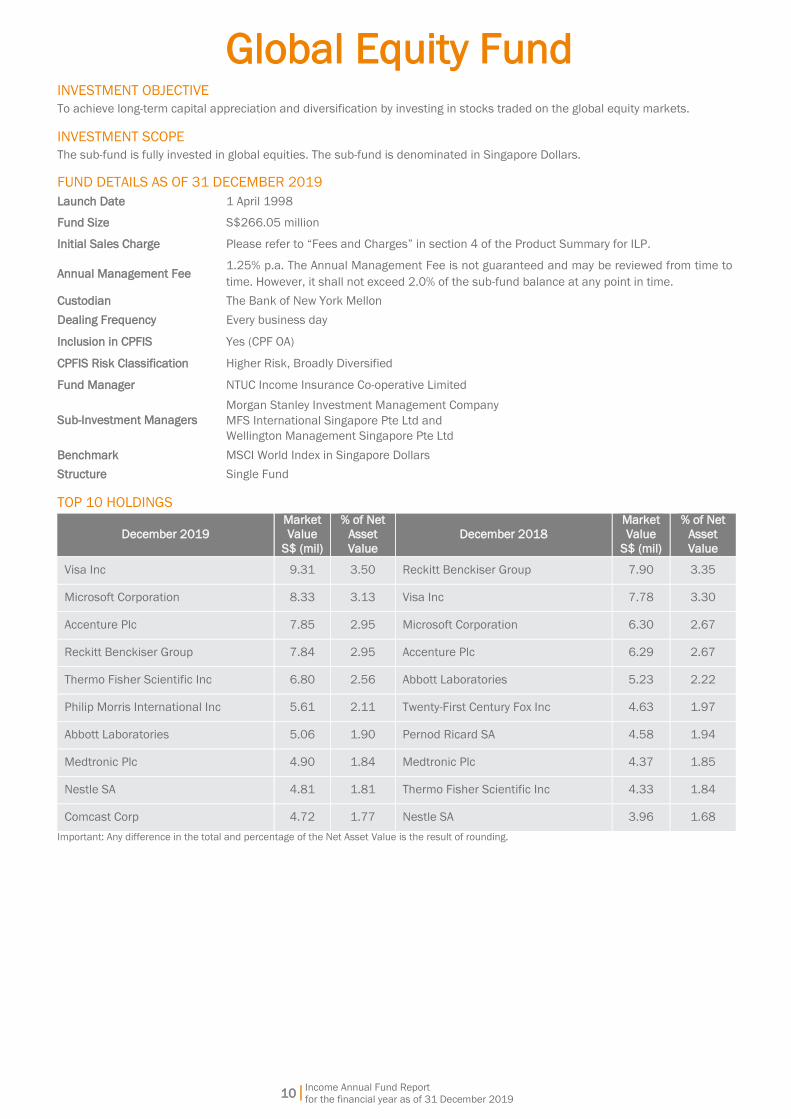
INVESTMENT OBJECTIVE
To achieve long-term capital appreciation and diversification by investing in stocks traded on the global equity markets.
INVESTMENT SCOPE
The sub-fund is fully invested in global equities. The sub-fund is denominated in Singapore Dollars.
FUND DETAILS AS OF 31 DECEMBER 2019
Launch Date 1 April 1998
Fund Size S$266.05 million
Initial Sales Charge Please refer to “Fees and Charges” in section 4 of the Product Summary for ILP.
Annual Management Fee 1.25% p.a. The Annual Management Fee is not guaranteed and may be reviewed from time to
time. However, it shall not exceed 2.0% of the sub-fund balance at any point in time.
Custodian The Bank of New York Mellon
Dealing Frequency Every business day
Inclusion in CPFIS Yes (CPF OA)
CPFIS Risk Classification Higher Risk, Broadly Diversified
Fund Manager NTUC Income Insurance Co-operative Limited
Sub-Investment Managers
Morgan Stanley Investment Management Company
MFS International Singapore Pte Ltd and
Wellington Management Singapore Pte Ltd
Benchmark MSCI World Index in Singapore Dollars
Structure Single Fund
TOP 10 HOLDINGS
December 2019
Market
Value
S$ (mil)
% of Net
Asset
Value
December 2018
Market
Value
S$ (mil)
% of Net
Asset
Value
Visa Inc 9.31 3.50 Reckitt Benckiser Group 7.90 3.35
Microsoft Corporation 8.33 3.13 Visa Inc 7.78 3.30
Accenture Plc 7.85 2.95 Microsoft Corporation 6.30 2.67
Reckitt Benckiser Group 7.84 2.95 Accenture Plc 6.29 2.67
Thermo Fisher Scientific Inc 6.80 2.56 Abbott Laboratories 5.23 2.22
Philip Morris International Inc 5.61 2.11 Twenty-First Century Fox Inc 4.63 1.97
Abbott Laboratories 5.06 1.90 Pernod Ricard SA 4.58 1.94
Medtronic Plc 4.90 1.84 Medtronic Plc 4.37 1.85
Nestle SA 4.81 1.81 Thermo Fisher Scientific Inc 4.33 1.84
Comcast Corp 4.72 1.77 Nestle SA 3.96 1.68
Important: Any difference in the total and percentage of the Net Asset Value is the result of rounding.
Income Annual Fund Report
for the financial year as of 31 December 2019
11|
Global Equity Fund
FUND MANAGER
NTUC Income Insurance Co-operative Limited is the
Investment Manager of the sub-fund. Morgan Stanley
Investment Management Company, MFS International
Singapore Pte Ltd, and Wellington Management Singapore
Pte Ltd are the Sub-Investment Managers of the sub-fund.
NTUC Income Insurance Co-operative Limited (Income)
Income was established in 1970 to make essential
insurance accessible to all Singaporeans. Today, Income is
the leading composite insurer in Singapore offering life,
health and general insurance. Our wide network of financial
advisers and partners provide value-added financial advisory
that complements today’s digital-first landscape, offering
insurance products and services that serve the protection,
savings and investment needs of customers at different
stages and across all segments of society.
As of 31 December 2019, Income had S$40.45 billion in
assets under management. Our financial strength and
diversified investment portfolio are reflected by our strong
credit ratings and predicated on our core investment
philosophy of value, prudence and discipline.
Morgan Stanley Investment Management Company (MSIM)
MSIM was established in 1975 as a subsidiary of Morgan
Stanley Group Inc. As of December 31, 2019, MSIM employs
711 investment professionals worldwide in 23 countries and
offers its clients personalised attention, the intelligence and
creativity of some of the brightest professionals in the
industry and access to the global resources of Morgan
Stanley. As of December 31, 2019, MSIM managed US$552
billion in assets for its clients.
MFS International Singapore Pte Ltd^
MFS International Singapore Pte Ltd is incorporated in
Singapore and is authorised under a capital market service
license with the Monetary Authority of Singapore to provide
fund management services. MFS has been managing pooled
vehicles/investment funds and/or discretionary funds in
Singapore since 1997. MFS Investment Management
(parent company of MFS International Singapore Pte Ltd)
was founded in 1924. Asset under management totalled
US$526 billion as of 31 December 2019. MFS believes in
active bottom-up research aimed at consistently identifying
high-quality investments by focusing on companies that have
potential to generate above-average and sustainable
earnings. MFS has a global network of research analysts and
portfolio managers based in Boston, Toronto, Mexico City,
London, Tokyo, Hong Kong, Singapore and Sydney.
^Prior to November 2013, MFS was operating as a branch of MFS
International limited and was an exempted fund manager under the
Singaporean regulatory regime.
Wellington Management Singapore Pte Ltd (WMS)*
WMS is an affiliate of Wellington Management Company LLP
(WMS, Wellington Management Company LLP and the other
affiliates of Wellington Management Company LLP are
collectively referred to as WMC). With US$1.1 trillion in
assets under management, WMC serves as an investment
adviser to over 2,200 clients located in more than 60
countries, as of 31 December 2019. WMC’s singular focus is
investments — from global equities and fixed income to
currencies and commodities. WMC describes themselves as
a community of teams that create solutions designed to
respond to specific client needs. WMC’s most distinctive
strength is their proprietary, independent research, which is
shared across all areas of the organisation and used only for
managing clients' portfolios. Tracing its roots to the founding
of Wellington Fund in 1928, the firm has offices in Boston,
Massachusetts; Chicago, Illinois; Radnor, Pennsylvania; San
Francisco, California; Toronto, Canada; Beijing; Frankfurt;
Hong Kong; London; Singapore; Sydney; Tokyo; Luxembourg
and Zurich.
*With effect from 29 April 2016, WMS has replaced Trust Company of
the West (TCW) Asset Management Company as the Sub-Investment
Manager of the Global Technology Fund.
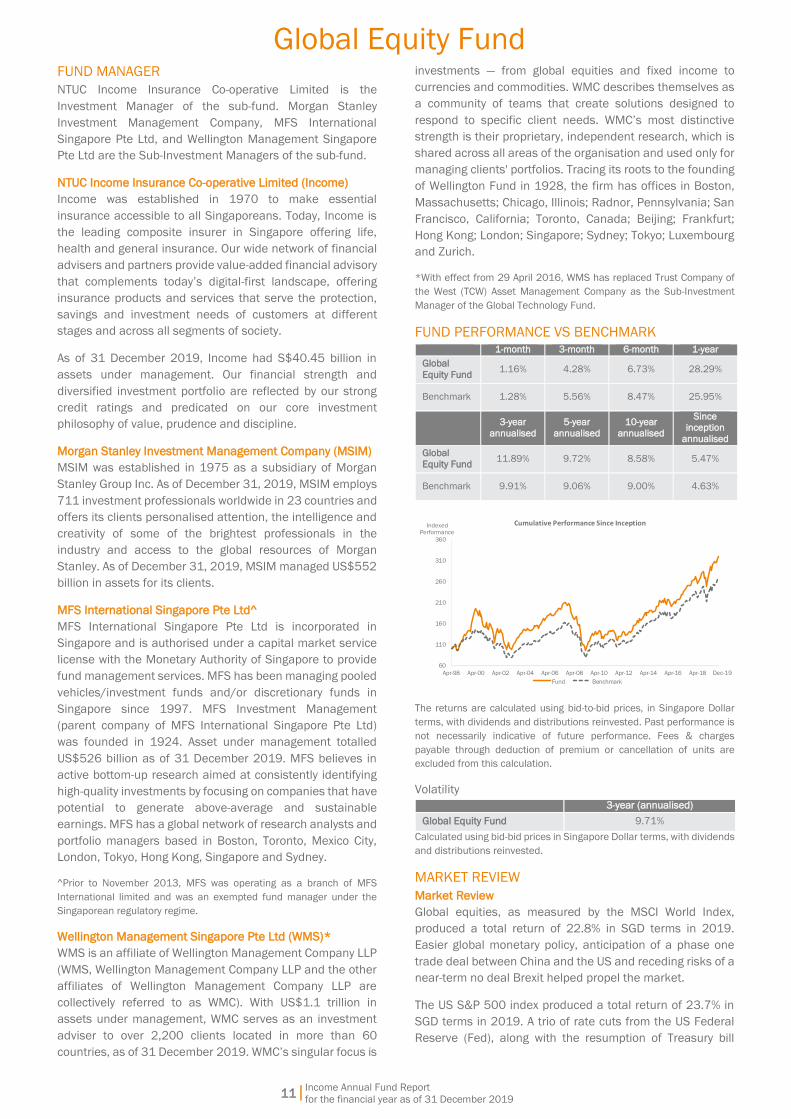
FUND PERFORMANCE VS BENCHMARK
1-month 3-month 6-month 1-year
Global
Equity Fund 1.16% 4.28% 6.73% 28.29%
Benchmark 1.28% 5.56% 8.47% 25.95%
3-year
annualised
5-year
annualised
10-year
annualised
Since inception
annualised
Global
Equity Fund 11.89% 9.72% 8.58% 5.47%
Benchmark 9.91% 9.06% 9.00% 4.63%
60
110
160
210
260
310
360
Apr-98 Apr-00 Apr-02 Apr-04 Apr-06 Apr-08 Apr-10 Apr-12 Apr-14 Apr-16 Apr-18
Cumulative Performance Since Inception
Fund Benchmark
IndexedPerformance
Dec-19
The returns are calculated using bid-to-bid prices, in Singapore Dollar
terms, with dividends and distributions reinvested. Past performance is
not necessarily indicative of future performance. Fees & charges
payable through deduction of premium or cancellation of units are
excluded from this calculation.
Volatility
3-year (annualised)
Global Equity Fund 9.71%
Calculated using bid-bid prices in Singapore Dollar terms, with dividends
and distributions reinvested.
MARKET REVIEW
Market Review
Global equities, as measured by the MSCI World Index,
produced a total return of 22.8% in SGD terms in 2019.
Easier global monetary policy, anticipation of a phase one
trade deal between China and the US and receding risks of a
near-term no deal Brexit helped propel the market.
The US S&P 500 index produced a total return of 23.7% in
SGD terms in 2019. A trio of rate cuts from the US Federal
Reserve (Fed), along with the resumption of Treasury bill
Income Annual Fund Report
for the financial year as of 31 December 2019
12|
Global Equity Fund
purchases by the Fed to pump additional reserves into
money markets were supportive from a monetary policy
perspective while easing geopolitical and trade tensions
contributed to the year's strong performance.
European stocks, as measured by the STOXX Europe 50
Index, returned 25% in SGD terms in 2019. Fading fears of a
no deal Brexit, anticipation of a US-China trade agreement
and additional monetary policy accommodation from the
European Central Bank (ECB) underpinned performance.
In Japan, the Nikkei Composite Index produced a total return
of 17.5% in SGD terms in 2019, supported by easing trade
tensions and accommodative global monetary policy.
Emerging markets (EM), as measured by the MSCI EM Index
produced a total return of 14% in SGD terms during the first
half of 2019 as a global shift toward easier monetary policy
and anticipation of a partial trade deal between the US and
China helped buoy markets.
Market Outlook
Corporate earnings remained weak through the first three
quarters of the year, but expectations of a better 2020
outlook pushed global equity prices higher during the third
quarter, with equities in the US logging their strongest
performance since 2013. Margins remain elevated, although
they have begun to recede as sales growth slowed
throughout the year. Energy and materials earnings growth
was negative for the third quarter while utilities and
consumer discretionary logged strong earnings growth.
Trade friction, which weighed heavily on corporate
confidence and business spending throughout the year,
subsided somewhat in December after the US House of
Representatives approved the US-Mexico-Canada
Agreement, and a phase one US-China trade deal was
announced. A dovish turn by central banks in the US, Europe
and many EMs, reduced Brexit uncertainty, and signs of
China’s economy stabilising all supported equity markets.
United States: Despite recording three consecutive quarters
of slightly negative earnings growth, US equities have been
strong performers as earnings multiples have expanded.
Three quarter-point interest rate cuts by the Fed between
July and October, designed to sustain the economic
expansion in the face of a global slowdown caused mainly by
the trade dispute between the US and China, helped improve
market sentiment, as did some recent data that suggest the
pace of the global slowdown may have troughed. However,
sentiment may be overly optimistic given slowing sales
growth, deteriorating earnings and rich valuations. The better
data and improved sentiment has allowed the Fed to shift to
a more neutral policy posture that suggests that a deeper
deterioration in the pace of economic growth or a sustained
rise in inflation will be needed to trigger further adjustments
to monetary policy. Investors will keep a close watch on US
capital spending data as a barometer of geopolitical
uncertainty. The ongoing US–China trade dispute and Brexit
uncertainty prompted a downdraft in business confidence as
managements took a wait-and-see approach to new
spending initiatives until worries are resolved. Improved
capital spending would be further evidence that the
economic cycle has additional room to run. While a phase
one trade agreement has been reached between the US and
China, average tariff rates remain elevated compared with
recent decades and could erode US corporate profit margins,
which until recently had been running at near-record levels.
Creeping wage pressures amid historically tight labor
markets will be a potential further headwind to margins. A
softening in the foreign exchange value of the US dollar late
in 2019 could be a tailwind, as overseas earnings are
repatriated. Perceived lower risks of recession have resulted
in a steepening of the US yield curve, which now trades at its
steepest level in over a year after long-term yields spent
much of 2019 inverted below short-term yields.
Europe: European equities performed strongly in 2019,
though they modestly trailed their US peers. The conclusion
of a phase one trade deal between the US and China,
decreasing Brexit uncertainty and aggressive monetary
easing by the ECB created a benign equity backdrop late in
the year. Recent signs of a bottoming in global
manufacturing have helped lift European shares, as have
fading geopolitical concerns. Renewed hopes for a smooth
Brexit have helped mitigate uncertainty in the near term, but
a short negotiating window in which to work out a free trade
agreement between the European Union (EU) and the UK
could become a concern as 2020 progresses. Political risks
appear to be easing in Italy and Greece, with pro-EU
coalitions taking power in 2019. Germany should benefit
from diminishing trade headwinds. An improving macro
backdrop and dissipating global tail risks argue for an
earnings rebound in 2020 following 2019 earnings
recession, though a persistently stronger euro could prove a
headwind.
Japan: Japanese equities underperformed their developed
market peers in 2019 as Japan’s export-heavy economy was
hampered by slower global economic and trade growth. In
addition to being a bystander to the US–China trade dispute,
Japan finds itself embroiled in a trade clash of its own with
neighboring South Korea. While many global central banks
have taken steps to loosen monetary policy in an attempt to
buffer a global slowdown, the Bank of Japan (BoJ) has little
room to maneuver owing to already negative policy rates and
subzero JGB rates through the 10-year part of the curve.
Japan’s economy is in the midst of absorbing a hike in the
country’s consumption tax from 8% to 10%. Past sales tax
hikes have proven to be significant drags on economic
growth. Japan’s government adopted a supplemental budget
in order to cushion the negative economic impacts of the
hike. Continued corporate governance reform, a cornerstone
of Abenomics, is a bright spot from a macroeconomic
perspective, though the pace of change remains incremental.
Emerging Markets: Amid fading trade tensions, signs of
stabilisation in the global manufacturing sector and
accommodative global monetary bank policy, EM equities
outperformed their developed market peers in the final
quarter of 2019 but significantly underperformed over the
calendar year, making the asset class one of the few pockets
of value in a world of generally very expensive financial
assets. Trailing 12-month earnings trade in line with long-

Income Annual Fund Report
for the financial year as of 31 December 2019
13|
Global Equity Fund
term averages while by the same metric most developed
markets are quite richly valued. In addition to a phase one
US-China trade agreement, the US-Mexico-Canada
Agreement, which should be ratified by the US Senate in early
2020, is a bright spot for equities. Amid the US–China trade
war, Mexico has been a winner, gaining market share as
multinationals seek to divert production away from China.
Similarly, a number of Asian nations have benefited from
trade diversion from China, including Vietnam, Malaysia and
Singapore. In India, growth is expected to rebound in 2020,
supported by the effects of monetary policy easing and
structural reforms such as a reduction in corporate tax rates.
Structurally, as a percentage of market capitalisation, a
growing share of “new economy” sectors, such as technology,
telecom and consumer discretionary, is supportive of the
asset class as EM countries move up the global value chain.
The growth of consumer oriented sectors catering to an
emerging middle class is a further structural tailwind.
RISKS
Income’s ILP sub-funds are intended for long-term
investment, it is not suited for any short-term speculation.
You should not expect to obtain any short-term gains from
investing in Income’s ILP sub-funds. It is important that your
investment suits your risk appetite. You may wish to consult
your financial adviser before investing in any ILP sub-fund.
You should be aware that past performance is not indicative
of future performance. The value of the units may rise or fall
as the performance of the sub-fund changes.
More information on the risks of the sub-fund can be found
in the Fund Summary and Product Highlights Sheet.
EXPENSE AND TURNOVER RATIO Expense ratio Turnover ratio
As of 31
December 2019 1.27% 25.43%
As of 31
December 2018 1.28% 47.01%
Expense ratio does not include (where applicable) charges for insurance
coverage, brokerage and other transaction costs, performance fee,
foreign exchange gains or losses, front or back end loads arising from
the purchase or sale of collective investment schemes and tax deducted
at source or arising out of income received.
ASSET ALLOCATION AS OF 31 DECEMBER 2019
Market Value
S$ (mil)
% of Net Asset
Value
Equities 264.26 99.33
Cash & Others 1.79 0.67
Total 266.05 100.00
COUNTRY ALLOCATION AS OF 31 DECEMBER 2019
Market Value
S$ (mil)
% of Net Asset
Value
France 20.73 7.79
Germany 12.52 4.70
Hong Kong 3.01 1.13
Japan 3.70 1.39
Netherlands 7.63 2.87
Spain 2.19 0.82
Sweden 2.80 1.06
Switzerland 13.41 5.04
United Kingdom 18.22 6.85
United States 173.51 65.22
Others 6.54 2.46
Cash & Others 1.79 0.67
Total 266.05 100.00
SECTOR ALLOCATION AS OF 31 DECEMBER 2019
Market Value
S$ (mil)
% of Net Asset
Value
Basic Materials 9.02 3.40
Communications 19.00 7.14
Consumer, Cyclical 17.59 6.61
Consumer, Non-
cyclical 115.37 43.36
Energy 0.76 0.28
Financial 32.71 12.30
Industrial 31.08 11.68
Technology 38.73 14.56
Cash & Others 1.79 0.67
Total 266.05 100.00
Important: Any difference in the total and percentage of the Net Asset
Value is the result of rounding.
CREDIT RATINGS OF DEBT SECURITIES
Nil.
SUBSCRIPTIONS AND REDEMPTIONS AS OF 31
DECEMBER 2019
S$
Subscriptions 5,253,165
Redemptions (38,638,765)
EXPOSURE TO DERIVATIVES
Market
Value S$
% of Net
Asset
Value
Realised
Gains/
(Losses) S$
Unrealised
Gains/
(Losses) S$
Forwards 61 <0.01 8,614 61
INVESTMENT IN COLLECTIVE INVESTMENT SCHEMES
December 2019
Market
Value
S$ (mil)
% of Net
Asset
Value
American Tower Corp 0.75 0.28

Income Annual Fund Report
for the financial year as of 31 December 2019
14|
Global Equity Fund
BORROWINGS
Nil.
RELATED PARTY DISCLOSURE
Income is the Investment Manager of the sub-fund. During
the financial period ended 31 December 2019, management
fee paid or payable by the sub-fund to the Investment
Manager is S$3,245,617.
SOFT DOLLAR COMMISSION OR ARRANGEMENT
Income
The Manager does not retain for its own account, cash or
commission rebates arising out of transactions executed in
or outside Singapore. The Manager also does not receive soft
dollars for the sub-fund.
Morgan Stanley
Research received by MSIM Limited from 3 January 2018
(other than research that qualifies as a minor monetary
benefit) will be paid for out of its own resources. MSIM must
take all sufficient steps to obtain the best possible result for
its Clients when placing orders as part of MSIM’s portfolio
management service in compliance with its contractual or
agency obligation to act in accordance with the best interests
of the Client taking into account the Relevant Factors (as
defined below).
When effecting transactions for its Clients, MSIM takes into
consideration a number of factors (together referred to as
“Relevant Factors”) including, but not limited to:
price/spread
cost of execution
speed and likelihood of execution
order size
nature of the order
broker or counterparty selection
availability of liquidity
likelihood of settlement
market impact of the transaction
MSIM’s operational costs
any other considerations that MSIM deems relevant
to the transaction
Wellington
The Managers did not retain for its own account cash or
commission rebates arising out of transactions executed in
or outside Singapore. Soft dollar commission/ arrangement
has been received/ entered into by the Sub-Investment
Manager in respect of the ILP. The soft dollar commission/
arrangement relates essentially to research services used for
and in support of the investment process. The Sub-
Investment Manager did not accept or enter into soft dollar
commission/ arrangement unless such commission/
arrangement would reasonably assist the Sub-Investment
Manager in the management of the ILP and the trades were
executed on a best execution basis. The Sub-Investment
Manager took all reasonable steps to obtain the best
possible result of the ILP, taking into account the following
execution factors, including but not limited to, price, costs,
speed, likelihood of execution and settlement, size, nature or
any other consideration relevant to the execution of a trade
or transaction, and there was no churning of trades.
MFS International
MFS will pay for external research for all accounts
beginning January 3, 2018. NTUC Income's portfolios
which are managed by MFS are under the scope of MiFID
where execution only rates are paid for the trades. There
are no soft dollars associated with the trades.
CONFLICTS OF INTEREST
The Manager and Sub-Investment Managers may from
time to time have to deal with competing or conflicting
interests between these sub-funds. However, the Manager
and Sub-Investment Managers will use all reasonable
endeavours to act fairly and in the best interest of the sub-
fund. We will conduct all transactions with or for the sub-
fund on an arm’s length basis. The Manager and Sub-
Investment Managers have in place policies and
procedures to monitor and mitigate conflicts of interests
which may arise in the management of these sub-funds.
We believe that these policies and procedures are
reasonably designed to ensure that portfolio management
decisions are made in the best interest of the sub-fund and
each sub-fund is treated fairly, regardless of the existence
of any conflict.
OTHER PARTIES
The auditor of this sub-fund is KPMG LLP. Please note that
financial results ending 31 December of each year will be
audited.
MATERIAL INFORMATION
Nil.
15|
Singapore Bond Fund
Income Annual Fund Report
for the financial year as of 31 December 2019
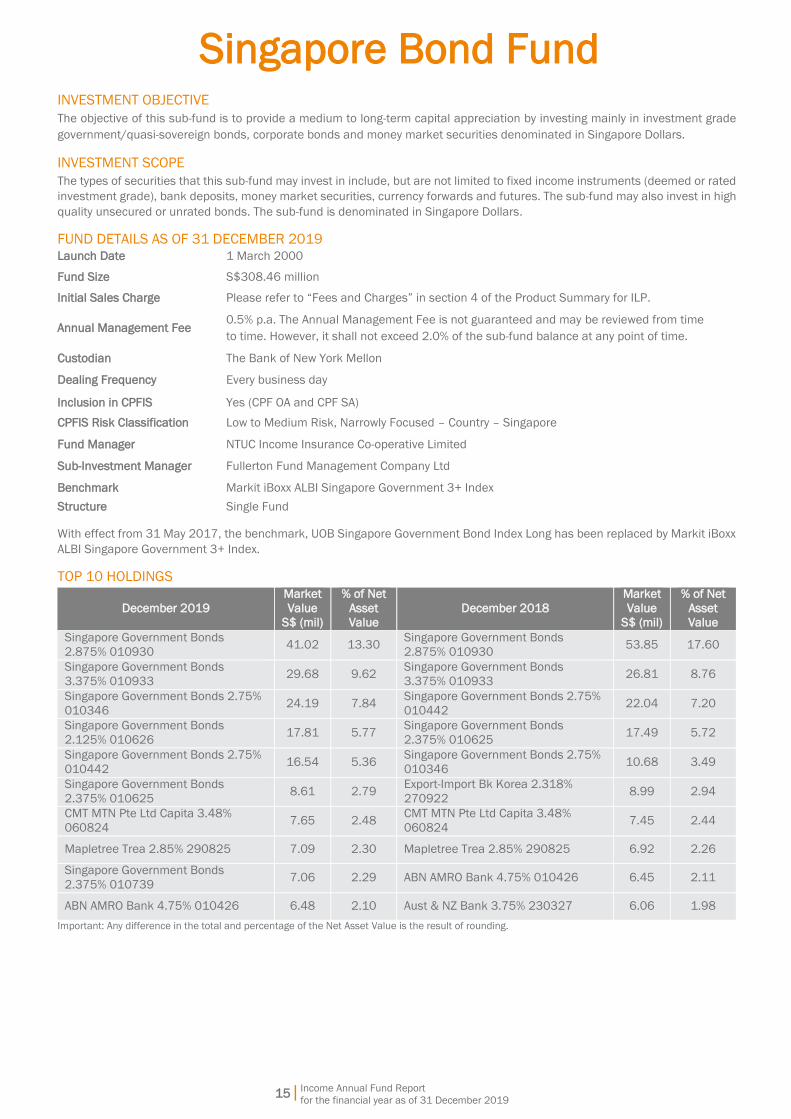
INVESTMENT OBJECTIVE
The objective of this sub-fund is to provide a medium to long-term capital appreciation by investing mainly in investment grade
government/quasi-sovereign bonds, corporate bonds and money market securities denominated in Singapore Dollars.
INVESTMENT SCOPE
The types of securities that this sub-fund may invest in include, but are not limited to fixed income instruments (deemed or rated
investment grade), bank deposits, money market securities, currency forwards and futures. The sub-fund may also invest in high
quality unsecured or unrated bonds. The sub-fund is denominated in Singapore Dollars.
FUND DETAILS AS OF 31 DECEMBER 2019 Launch Date 1 March 2000
Fund Size S$308.46 million
Initial Sales Charge Please refer to “Fees and Charges” in section 4 of the Product Summary for ILP.
Annual Management Fee 0.5% p.a. The Annual Management Fee is not guaranteed and may be reviewed from time
to time. However, it shall not exceed 2.0% of the sub-fund balance at any point of time.
Custodian The Bank of New York Mellon
Dealing Frequency Every business day
Inclusion in CPFIS Yes (CPF OA and CPF SA)
CPFIS Risk Classification Low to Medium Risk, Narrowly Focused – Country – Singapore
Fund Manager NTUC Income Insurance Co-operative Limited
Sub-Investment Manager Fullerton Fund Management Company Ltd
Benchmark Markit iBoxx ALBI Singapore Government 3+ Index
Structure Single Fund
With effect from 31 May 2017, the benchmark, UOB Singapore Government Bond Index Long has been replaced by Markit iBoxx
ALBI Singapore Government 3+ Index.
TOP 10 HOLDINGS
December 2019
Market
Value
S$ (mil)
% of Net
Asset
Value
December 2018
Market
Value
S$ (mil)
% of Net
Asset
Value
Singapore Government Bonds
2.875% 010930 41.02 13.30
Singapore Government Bonds
2.875% 010930 53.85 17.60
Singapore Government Bonds
3.375% 010933 29.68 9.62
Singapore Government Bonds
3.375% 010933 26.81 8.76
Singapore Government Bonds 2.75%
010346 24.19 7.84
Singapore Government Bonds 2.75%
010442 22.04 7.20
Singapore Government Bonds
2.125% 010626 17.81 5.77
Singapore Government Bonds
2.375% 010625 17.49 5.72
Singapore Government Bonds 2.75%
010442 16.54 5.36
Singapore Government Bonds 2.75%
010346 10.68 3.49
Singapore Government Bonds
2.375% 010625 8.61 2.79
Export-Import Bk Korea 2.318%
270922 8.99 2.94
CMT MTN Pte Ltd Capita 3.48%
060824 7.65 2.48
CMT MTN Pte Ltd Capita 3.48%
060824 7.45 2.44
Mapletree Trea 2.85% 290825 7.09 2.30 Mapletree Trea 2.85% 290825 6.92 2.26
Singapore Government Bonds
2.375% 010739 7.06 2.29 ABN AMRO Bank 4.75% 010426 6.45 2.11
ABN AMRO Bank 4.75% 010426 6.48 2.10 Aust & NZ Bank 3.75% 230327 6.06 1.98
Important: Any difference in the total and percentage of the Net Asset Value is the result of rounding.

Singapore Bond Fund
Income Annual Fund Report
for the financial year as of 31 December 2019
16|
FUND MANAGER
NTUC Income Insurance Co-operative Limited is the
Investment Manager of the sub-fund. Fullerton Fund
Management Company Ltd is the Sub-Investment Manager
of the sub-fund.
NTUC Income Insurance Co-operative Limited (Income)
Income was established in 1970 to make essential
insurance accessible to all Singaporeans. Today, Income is
the leading composite insurer in Singapore offering life,
health and general insurance. Our wide network of financial
advisers and partners provide value-added financial advisory
that complements today’s digital-first landscape, offering
insurance products and services that serve the protection,
savings and investment needs of customers at different
stages and across all segments of society.
As of 31 December 2019, Income had S$40.45 billion in
assets under management. Our financial strength and
diversified investment portfolio are reflected by our strong
credit ratings and predicated on our core investment
philosophy of value, prudence and discipline.
Fullerton Fund Management Company Ltd (Fullerton)
Fullerton Fund Management (“Fullerton”) is an Asia-based
investment specialist, with capabilities that span equities,
fixed income, multi-asset and alternatives, including private
equity. Prior to its establishment, Fullerton’s investment
team operated as the internal fund management division
within Temasek, a global investment company
headquartered in Singapore. The firm was incorporated in
Singapore in 2003 and is a subsidiary of Temasek Holdings
(“Temasek”). NTUC Income, a leading Singapore insurer,
became our minority shareholder in 2018. Fullerton provides
investment solutions for institutions such as government
agencies, pension plans, insurance companies,
endowments and sovereign wealth, as well as for private
wealth and the retail segment. With 16 years of experience
in Asian financial markets, Fullerton builds on its heritage to
provide clients with investment solutions that are long term,
research-based and conviction-led. Headquartered in
Singapore, Fullerton also has associated offices in Shanghai,
London, Tokyo and Brunei. Fullerton is licensed under the
Securities and Futures Act and regulated by the Monetary
Authority of Singapore. As of 31 December 2019, Fullerton
Fund Management’s assets under management was
S$54.48 billion.
FUND PERFORMANCE VS BENCHMARK
1-month 3-month 6-month 1-year
Singapore
Bond Fund 0.25% 0.76% 4.39% 5.94%
Benchmark 0.30% 0.65% 4.20% 5.27%
3-year
annualised
5-year
annualised
10-year
annualised
Since inception
annualised
Singapore
Bond Fund 4.64% 3.69% 3.62% 3.55%
Benchmark 4.41% 3.53% 3.52% 4.13%
90
110
130
150
170
190
210
230
Mar-00 Nov-01 Jul-03 Mar-05 Nov-06 Jul-08 Mar-10 Nov-11 Jul-13 Mar-15 Nov-16 Jul-18
Cumulative Performance Since Inception
Fund Benchmark
IndexedPerformance
Dec-19
Changes to benchmarks during the life of the sub-fund: Since inception
to 31 May 2017 - UOB Singapore Government Bond Index (Long).
With effect from 31 May 2017, the benchmark has been changed to
Markit iBoxx ALBI Singapore Government 3+ Index.
The returns are calculated using bid-to-bid prices, in Singapore Dollar
terms, with dividends and distributions reinvested. Past performance is
not necessarily indicative of future performance. Fees & charges
payable through deduction of premium or cancellation of units are
excluded from this calculation.
Volatility
3-year (annualised)
Singapore Bond Fund 2.85%
Calculated using bid-bid prices in Singapore Dollar terms, with dividends
and distributions reinvested.
MARKET REVIEW
Market Review
Global markets were roiled by political events in 2019,
including the protracted US-China trade war and Brexit
concerns, in addition to worries of a global growth slowdown.
Despite this, most financial markets, including Asian bond
markets, closed the year on a strong note as central banks
globally pledged monetary policy support and boosted fiscal
efforts. As the year comes to a close, financial markets were
further supported by a benign inflation backdrop, fading risk
of a hard Brexit, and the agreement of a Phase One trade
deal between the US and China in December.
Central banks across Asia have followed the US Federal
Reserve’s (Fed) dovish tilt in 2019, in aggressively lowering
borrowing costs as growth slows. Countries such as Thailand,
India, Indonesia, the Philippines, South Korea, and Malaysia
are among those that have front loaded easier monetary
policy in 2019 and the pace of cuts is likely to be more
modest from hereon. Importantly, fiscal policy in Asia
remained supportive, cushioning domestic demand and
offset the drag from the external sectors.
In Singapore, advance estimates showed that Singapore’s
economy grew by 0.8%yoy in 4Q2019, bringing the full year
gross domestic product (GDP) growth for 2019 to 0.7%yoy.
On the inflation front, consumer price index (CPI) inflation
inched up slightly to 0.6% est. for 2019, from 0.4% in 2018.
Core inflation is projected to ease to 1.1%. On the exports
front, Singapore’s non-oil domestic exports (NODX)
registered a growth of 2.4%yoy in December, marking an
encouraging end to a difficult year.
Singapore Bond Fund
Income Annual Fund Report
for the financial year as of 31 December 2019
17|
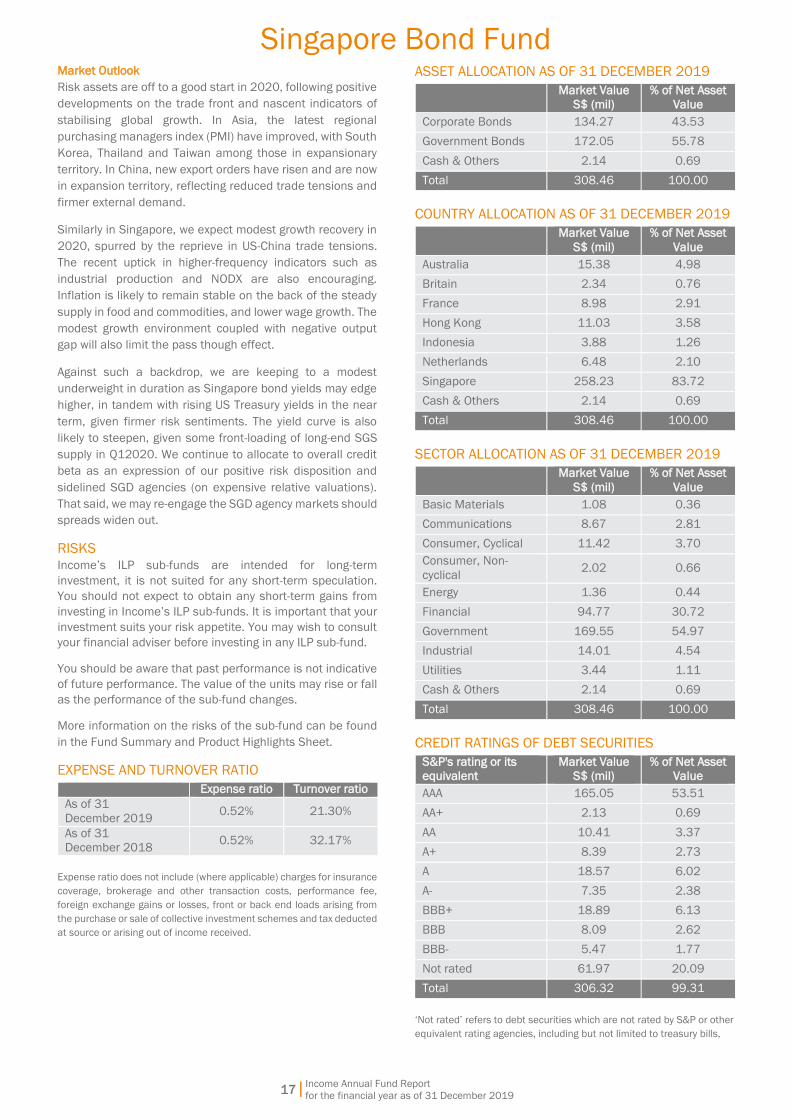
Market Outlook
Risk assets are off to a good start in 2020, following positive
developments on the trade front and nascent indicators of
stabilising global growth. In Asia, the latest regional
purchasing managers index (PMI) have improved, with South
Korea, Thailand and Taiwan among those in expansionary
territory. In China, new export orders have risen and are now
in expansion territory, reflecting reduced trade tensions and
firmer external demand.
Similarly in Singapore, we expect modest growth recovery in
2020, spurred by the reprieve in US-China trade tensions.
The recent uptick in higher-frequency indicators such as
industrial production and NODX are also encouraging.
Inflation is likely to remain stable on the back of the steady
supply in food and commodities, and lower wage growth. The
modest growth environment coupled with negative output
gap will also limit the pass though effect.
Against such a backdrop, we are keeping to a modest
underweight in duration as Singapore bond yields may edge
higher, in tandem with rising US Treasury yields in the near
term, given firmer risk sentiments. The yield curve is also
likely to steepen, given some front-loading of long-end SGS
supply in Q12020. We continue to allocate to overall credit
beta as an expression of our positive risk disposition and
sidelined SGD agencies (on expensive relative valuations).
That said, we may re-engage the SGD agency markets should
spreads widen out.
RISKS
Income’s ILP sub-funds are intended for long-term
investment, it is not suited for any short-term speculation.
You should not expect to obtain any short-term gains from
investing in Income’s ILP sub-funds. It is important that your
investment suits your risk appetite. You may wish to consult
your financial adviser before investing in any ILP sub-fund.
You should be aware that past performance is not indicative
of future performance. The value of the units may rise or fall
as the performance of the sub-fund changes.
More information on the risks of the sub-fund can be found
in the Fund Summary and Product Highlights Sheet.
EXPENSE AND TURNOVER RATIO
Expense ratio Turnover ratio
As of 31
December 2019 0.52% 21.30%
As of 31
December 2018 0.52% 32.17%
Expense ratio does not include (where applicable) charges for insurance
coverage, brokerage and other transaction costs, performance fee,
foreign exchange gains or losses, front or back end loads arising from
the purchase or sale of collective investment schemes and tax deducted
at source or arising out of income received.
ASSET ALLOCATION AS OF 31 DECEMBER 2019
Market Value
S$ (mil)
% of Net Asset
Value
Corporate Bonds 134.27 43.53
Government Bonds 172.05 55.78
Cash & Others 2.14 0.69
Total 308.46 100.00
COUNTRY ALLOCATION AS OF 31 DECEMBER 2019
Market Value
S$ (mil)
% of Net Asset
Value
Australia 15.38 4.98
Britain 2.34 0.76
France 8.98 2.91
Hong Kong 11.03 3.58
Indonesia 3.88 1.26
Netherlands 6.48 2.10
Singapore 258.23 83.72
Cash & Others 2.14 0.69
Total 308.46 100.00
SECTOR ALLOCATION AS OF 31 DECEMBER 2019
Market Value
S$ (mil)
% of Net Asset
Value
Basic Materials 1.08 0.36
Communications 8.67 2.81
Consumer, Cyclical 11.42 3.70
Consumer, Non-
cyclical 2.02 0.66
Energy 1.36 0.44
Financial 94.77 30.72
Government 169.55 54.97
Industrial 14.01 4.54
Utilities 3.44 1.11
Cash & Others 2.14 0.69
Total 308.46 100.00
CREDIT RATINGS OF DEBT SECURITIES
S&P's rating or its
equivalent
Market Value
S$ (mil)
% of Net Asset
Value
AAA 165.05 53.51
AA+ 2.13 0.69
AA 10.41 3.37
A+ 8.39 2.73
A 18.57 6.02
A- 7.35 2.38
BBB+ 18.89 6.13
BBB 8.09 2.62
BBB- 5.47 1.77
Not rated 61.97 20.09
Total 306.32 99.31
‘Not rated’ refers to debt securities which are not rated by S&P or other
equivalent rating agencies, including but not limited to treasury bills,
Singapore Bond Fund
Income Annual Fund Report
for the financial year as of 31 December 2019
18|
bonds issued by government, government agency, statutory board or
corporate.
Important: Any difference in the total and percentage of the Net Asset
Value is the result of rounding.
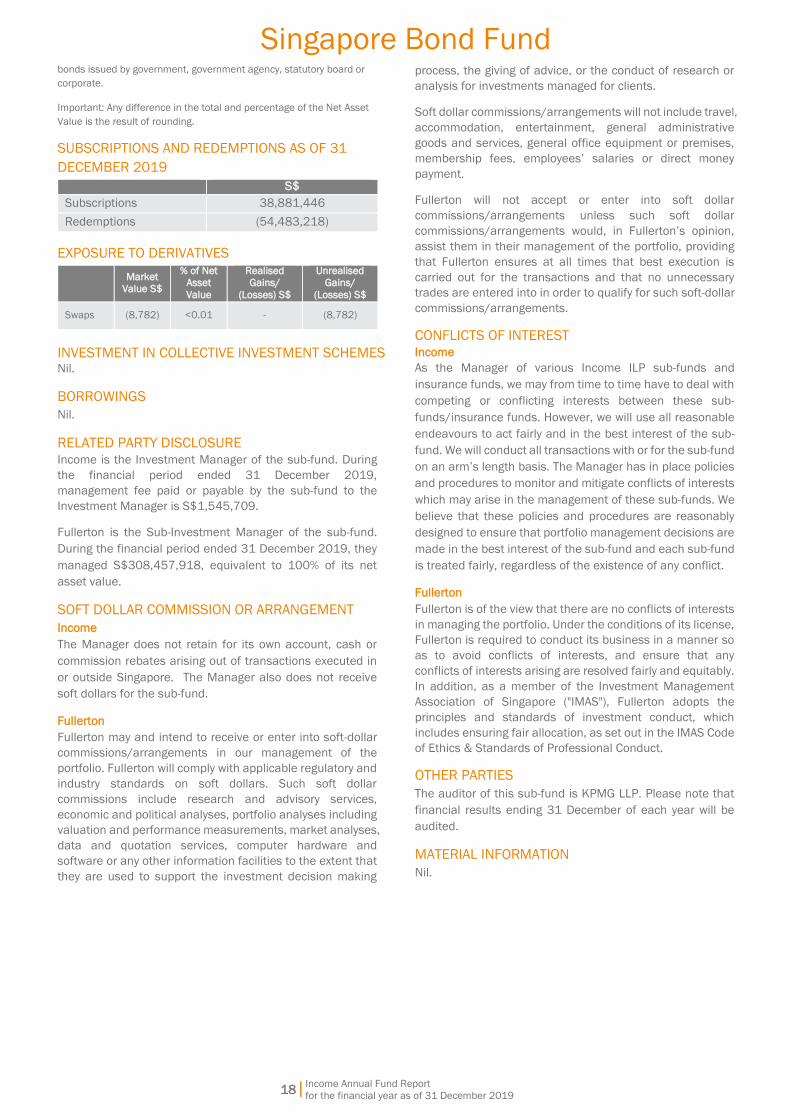
SUBSCRIPTIONS AND REDEMPTIONS AS OF 31
DECEMBER 2019
S$
Subscriptions 38,881,446
Redemptions (54,483,218)
EXPOSURE TO DERIVATIVES
Market
Value S$
% of Net
Asset
Value
Realised
Gains/
(Losses) S$
Unrealised
Gains/
(Losses) S$
Swaps (8,782) <0.01 - (8,782)
INVESTMENT IN COLLECTIVE INVESTMENT SCHEMES Nil.
BORROWINGS
Nil.
RELATED PARTY DISCLOSURE
Income is the Investment Manager of the sub-fund. During
the financial period ended 31 December 2019,
management fee paid or payable by the sub-fund to the
Investment Manager is S$1,545,709.
Fullerton is the Sub-Investment Manager of the sub-fund.
During the financial period ended 31 December 2019, they
managed S$308,457,918, equivalent to 100% of its net
asset value.
SOFT DOLLAR COMMISSION OR ARRANGEMENT
Income
The Manager does not retain for its own account, cash or
commission rebates arising out of transactions executed in
or outside Singapore. The Manager also does not receive
soft dollars for the sub-fund.
Fullerton
Fullerton may and intend to receive or enter into soft-dollar
commissions/arrangements in our management of the
portfolio. Fullerton will comply with applicable regulatory and
industry standards on soft dollars. Such soft dollar
commissions include research and advisory services,
economic and political analyses, portfolio analyses including
valuation and performance measurements, market analyses,
data and quotation services, computer hardware and
software or any other information facilities to the extent that
they are used to support the investment decision making
process, the giving of advice, or the conduct of research or
analysis for investments managed for clients.
Soft dollar commissions/arrangements will not include travel,
accommodation, entertainment, general administrative
goods and services, general office equipment or premises,
membership fees, employees’ salaries or direct money
payment.
Fullerton will not accept or enter into soft dollar
commissions/arrangements unless such soft dollar
commissions/arrangements would, in Fullerton’s opinion,
assist them in their management of the portfolio, providing
that Fullerton ensures at all times that best execution is
carried out for the transactions and that no unnecessary
trades are entered into in order to qualify for such soft-dollar
commissions/arrangements.
CONFLICTS OF INTEREST Income
As the Manager of various Income ILP sub-funds and
insurance funds, we may from time to time have to deal with
competing or conflicting interests between these sub-
funds/insurance funds. However, we will use all reasonable
endeavours to act fairly and in the best interest of the sub-
fund. We will conduct all transactions with or for the sub-fund
on an arm’s length basis. The Manager has in place policies
and procedures to monitor and mitigate conflicts of interests
which may arise in the management of these sub-funds. We
believe that these policies and procedures are reasonably
designed to ensure that portfolio management decisions are
made in the best interest of the sub-fund and each sub-fund
is treated fairly, regardless of the existence of any conflict.
Fullerton
Fullerton is of the view that there are no conflicts of interests
in managing the portfolio. Under the conditions of its license,
Fullerton is required to conduct its business in a manner so
as to avoid conflicts of interests, and ensure that any
conflicts of interests arising are resolved fairly and equitably.
In addition, as a member of the Investment Management
Association of Singapore ("IMAS"), Fullerton adopts the
principles and standards of investment conduct, which
includes ensuring fair allocation, as set out in the IMAS Code
of Ethics & Standards of Professional Conduct.
OTHER PARTIES
The auditor of this sub-fund is KPMG LLP. Please note that
financial results ending 31 December of each year will be
audited.
MATERIAL INFORMATION
Nil.
19|
Singapore Equity Fund
Income Annual Fund Report
for the financial year as of 31 December 2019
INVESTMENT OBJECTIVE
The objective of this sub-fund is to achieve long-term capital appreciation by investing in a portfolio of Singapore equities.
INVESTMENT SCOPE
This sub-fund is fully invested in Singapore Equities. The sub-fund is denominated in Singapore Dollars.
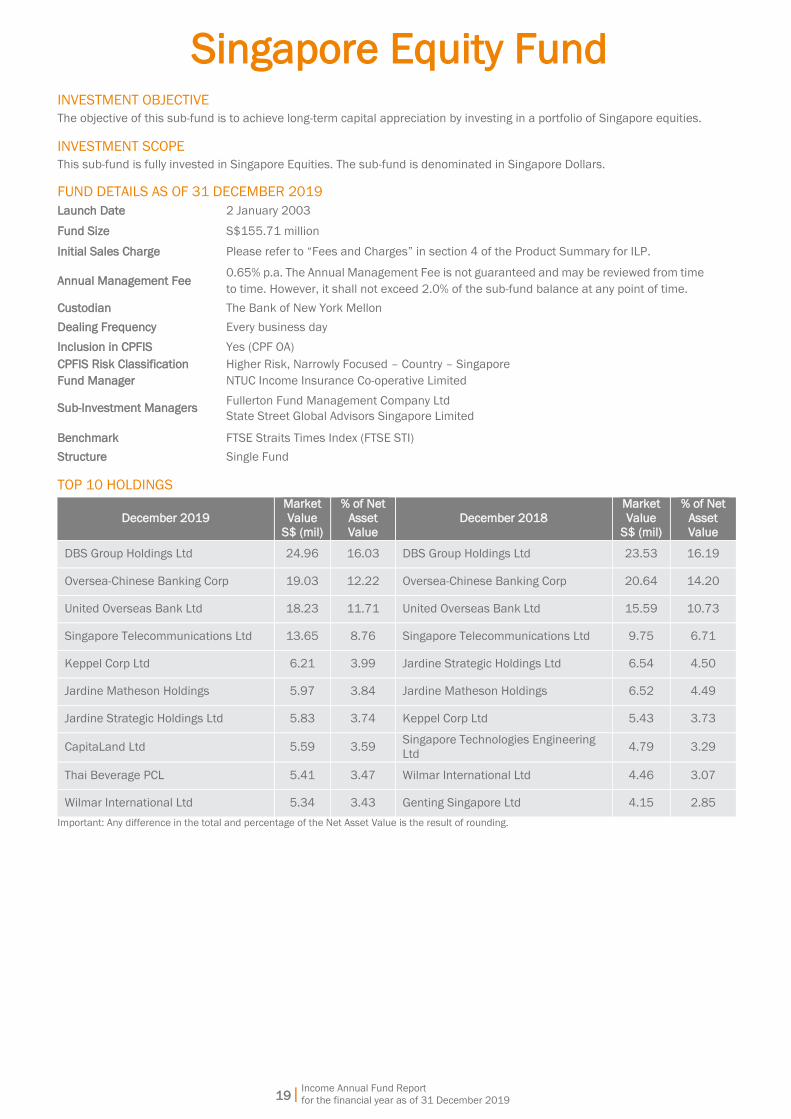
FUND DETAILS AS OF 31 DECEMBER 2019
Launch Date 2 January 2003
Fund Size S$155.71 million
Initial Sales Charge Please refer to “Fees and Charges” in section 4 of the Product Summary for ILP.
Annual Management Fee 0.65% p.a. The Annual Management Fee is not guaranteed and may be reviewed from time
to time. However, it shall not exceed 2.0% of the sub-fund balance at any point of time.
Custodian The Bank of New York Mellon
Dealing Frequency Every business day
Inclusion in CPFIS Yes (CPF OA)
CPFIS Risk Classification Higher Risk, Narrowly Focused – Country – Singapore
Fund Manager NTUC Income Insurance Co-operative Limited
Sub-Investment Managers Fullerton Fund Management Company Ltd
State Street Global Advisors Singapore Limited
Benchmark FTSE Straits Times Index (FTSE STI)
Structure Single Fund
TOP 10 HOLDINGS
December 2019
Market
Value
S$ (mil)
% of Net
Asset
Value
December 2018
Market
Value
S$ (mil)
% of Net
Asset
Value
DBS Group Holdings Ltd 24.96 16.03 DBS Group Holdings Ltd 23.53 16.19
Oversea-Chinese Banking Corp 19.03 12.22 Oversea-Chinese Banking Corp 20.64 14.20
United Overseas Bank Ltd 18.23 11.71 United Overseas Bank Ltd 15.59 10.73
Singapore Telecommunications Ltd 13.65 8.76 Singapore Telecommunications Ltd 9.75 6.71
Keppel Corp Ltd 6.21 3.99 Jardine Strategic Holdings Ltd 6.54 4.50
Jardine Matheson Holdings 5.97 3.84 Jardine Matheson Holdings 6.52 4.49
Jardine Strategic Holdings Ltd 5.83 3.74 Keppel Corp Ltd 5.43 3.73
CapitaLand Ltd 5.59 3.59 Singapore Technologies Engineering
Ltd 4.79 3.29
Thai Beverage PCL 5.41 3.47 Wilmar International Ltd 4.46 3.07
Wilmar International Ltd 5.34 3.43 Genting Singapore Ltd 4.15 2.85
Important: Any difference in the total and percentage of the Net Asset Value is the result of rounding.
Singapore Equity Fund
20| Income Annual Fund Report
for the financial year as of 31 December 2019
FUND MANAGER
NTUC Income Insurance Co-operative Limited is the
Investment Manager of the sub-fund. Fullerton Fund
Management Company Ltd and State Street Global Advisors
Singapore Limited are the Sub-Investment Managers of the
sub-fund.
NTUC Income Insurance Co-operative Limited (Income)
Income was established in 1970 to make essential
insurance accessible to all Singaporeans. Today, Income is
the leading composite insurer in Singapore offering life,
health and general insurance. Our wide network of financial
advisers and partners provide value-added financial advisory
that complements today’s digital-first landscape, offering
insurance products and services that serve the protection,
savings and investment needs of customers at different
stages and across all segments of society.
As of 31 December 2019, Income had S$40.45 billion in
assets under management. Our financial strength and
diversified investment portfolio are reflected by our strong
credit ratings and predicated on our core investment
philosophy of value, prudence and discipline.
Fullerton Fund Management Company Ltd (Fullerton)
Fullerton Fund Management (“Fullerton”) is an Asia-based
investment specialist, with capabilities that span equities,
fixed income, multi-asset and alternatives, including private
equity. Prior to its establishment, Fullerton’s investment
team operated as the internal fund management division
within Temasek, a global investment company
headquartered in Singapore. The firm was incorporated in
Singapore in 2003 and is a subsidiary of Temasek Holdings
(“Temasek”). NTUC Income, a leading Singapore insurer,
became our minority shareholder in 2018. Fullerton provides
investment solutions for institutions such as government
agencies, pension plans, insurance companies,
endowments and sovereign wealth, as well as for private
wealth and the retail segment. With 16 years of experience
in Asian financial markets, Fullerton builds on its heritage to
provide clients with investment solutions that are long term,
research-based and conviction-led. Headquartered in
Singapore, Fullerton also has associated offices in Shanghai,
London, Tokyo and Brunei. Fullerton is licensed under the
Securities and Futures Act and regulated by the Monetary
Authority of Singapore. As of 31 December 2019, Fullerton
Fund Management’s assets under management was
S$54.48 billion.
State Street Global Advisors Singapore Limited (SSGA)
For four decades, State Street Global Advisors has served
the world’s governments, institutions and financial advisors.
With a rigorous, risk-aware approach built on research,
analysis and market-tested experience, we build from a
breadth of active and index strategies to create cost-
effective solutions. As stewards, we help portfolio companies
see that what is fair for people and sustainable for the planet
can deliver long-term performance. And, as pioneers in index,
ETF, and ESG investing, we are always inventing new ways to
invest. As a result, we have become the world’s third largest
asset manager with nearly US$3.12 trillion* under our care.
*This figure is presented as of December 31, 2019 and includes
approximately $45 billion of assets with respect to SPDR products for
which State Street Global Advisors Funds Distributors, LLC (SSGA FD)
acts solely as the marketing agent. SSGA FD and State Street Global
Advisors are affiliated.
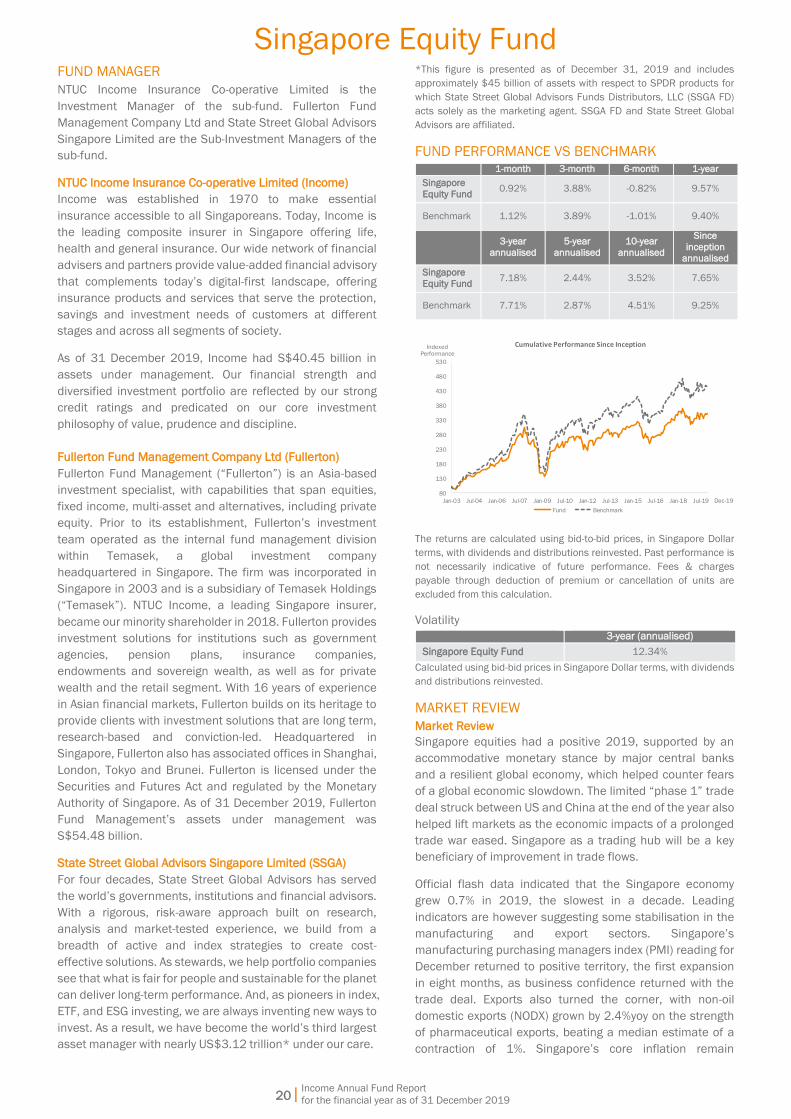
FUND PERFORMANCE VS BENCHMARK
1-month 3-month 6-month 1-year
Singapore
Equity Fund 0.92% 3.88% -0.82% 9.57%
Benchmark 1.12% 3.89% -1.01% 9.40%
3-year
annualised
5-year
annualised
10-year
annualised
Since
inception
annualised
Singapore
Equity Fund 7.18% 2.44% 3.52% 7.65%
Benchmark 7.71% 2.87% 4.51% 9.25%
80
130
180
230
280
330
380
430
480
530
Jan-03 Jul-04 Jan-06 Jul-07 Jan-09 Jul-10 Jan-12 Jul-13 Jan-15 Jul-16 Jan-18 Jul-19
Cumulative Performance Since Inception
Fund Benchmark
IndexedPerformance
Dec-19
The returns are calculated using bid-to-bid prices, in Singapore Dollar
terms, with dividends and distributions reinvested. Past performance is
not necessarily indicative of future performance. Fees & charges
payable through deduction of premium or cancellation of units are
excluded from this calculation.
Volatility
3-year (annualised)
Singapore Equity Fund 12.34%
Calculated using bid-bid prices in Singapore Dollar terms, with dividends
and distributions reinvested.
MARKET REVIEW
Market Review
Singapore equities had a positive 2019, supported by an
accommodative monetary stance by major central banks
and a resilient global economy, which helped counter fears
of a global economic slowdown. The limited “phase 1” trade
deal struck between US and China at the end of the year also
helped lift markets as the economic impacts of a prolonged
trade war eased. Singapore as a trading hub will be a key
beneficiary of improvement in trade flows.
Official flash data indicated that the Singapore economy
grew 0.7% in 2019, the slowest in a decade. Leading
indicators are however suggesting some stabilisation in the
manufacturing and export sectors. Singapore’s
manufacturing purchasing managers index (PMI) reading for
December returned to positive territory, the first expansion
in eight months, as business confidence returned with the
trade deal. Exports also turned the corner, with non-oil
domestic exports (NODX) grown by 2.4%yoy on the strength
of pharmaceutical exports, beating a median estimate of a
contraction of 1%. Singapore’s core inflation remain
Singapore Equity Fund
21| Income Annual Fund Report
for the financial year as of 31 December 2019
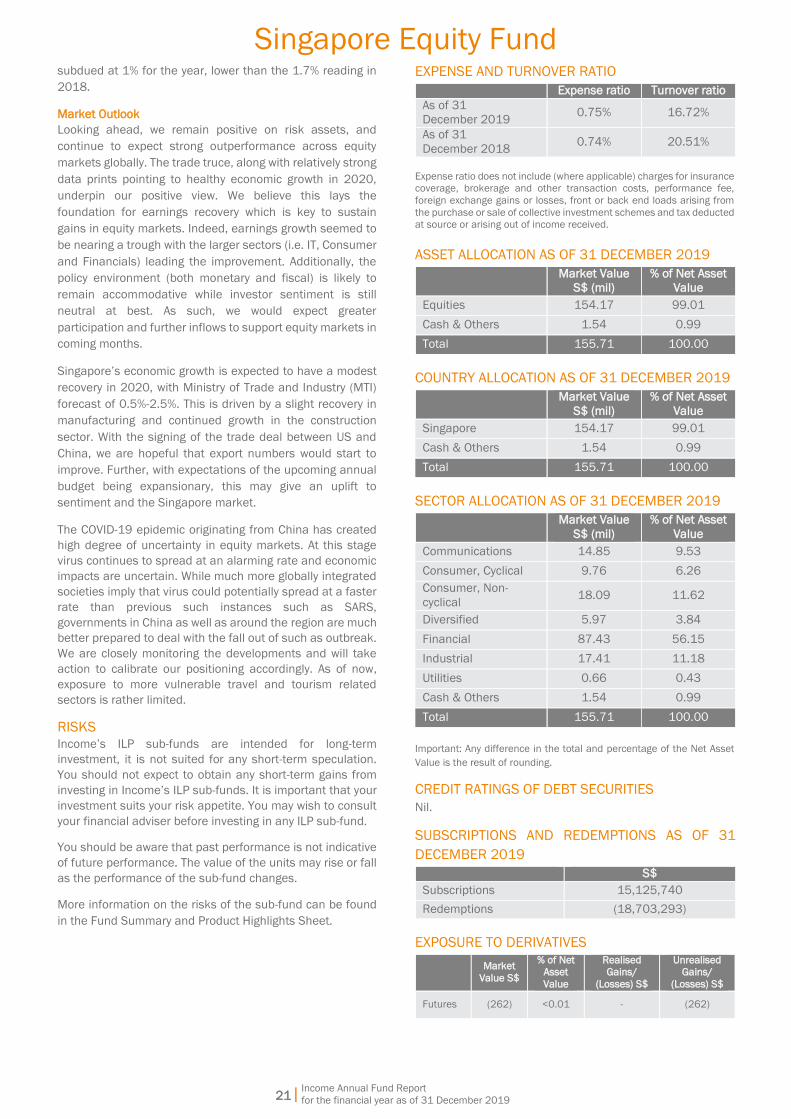
subdued at 1% for the year, lower than the 1.7% reading in
2018.
Market Outlook
Looking ahead, we remain positive on risk assets, and
continue to expect strong outperformance across equity
markets globally. The trade truce, along with relatively strong
data prints pointing to healthy economic growth in 2020,
underpin our positive view. We believe this lays the
foundation for earnings recovery which is key to sustain
gains in equity markets. Indeed, earnings growth seemed to
be nearing a trough with the larger sectors (i.e. IT, Consumer
and Financials) leading the improvement. Additionally, the
policy environment (both monetary and fiscal) is likely to
remain accommodative while investor sentiment is still
neutral at best. As such, we would expect greater
participation and further inflows to support equity markets in
coming months.
Singapore’s economic growth is expected to have a modest
recovery in 2020, with Ministry of Trade and Industry (MTI)
forecast of 0.5%-2.5%. This is driven by a slight recovery in
manufacturing and continued growth in the construction
sector. With the signing of the trade deal between US and
China, we are hopeful that export numbers would start to
improve. Further, with expectations of the upcoming annual
budget being expansionary, this may give an uplift to
sentiment and the Singapore market.
The COVID-19 epidemic originating from China has created
high degree of uncertainty in equity markets. At this stage
virus continues to spread at an alarming rate and economic
impacts are uncertain. While much more globally integrated
societies imply that virus could potentially spread at a faster
rate than previous such instances such as SARS,
governments in China as well as around the region are much
better prepared to deal with the fall out of such as outbreak.
We are closely monitoring the developments and will take
action to calibrate our positioning accordingly. As of now,
exposure to more vulnerable travel and tourism related
sectors is rather limited.
RISKS Income’s ILP sub-funds are intended for long-term
investment, it is not suited for any short-term speculation.
You should not expect to obtain any short-term gains from
investing in Income’s ILP sub-funds. It is important that your
investment suits your risk appetite. You may wish to consult
your financial adviser before investing in any ILP sub-fund.
You should be aware that past performance is not indicative
of future performance. The value of the units may rise or fall
as the performance of the sub-fund changes.
More information on the risks of the sub-fund can be found
in the Fund Summary and Product Highlights Sheet.
EXPENSE AND TURNOVER RATIO Expense ratio Turnover ratio
As of 31
December 2019 0.75% 16.72%
As of 31
December 2018 0.74% 20.51%
Expense ratio does not include (where applicable) charges for insurance
coverage, brokerage and other transaction costs, performance fee,
foreign exchange gains or losses, front or back end loads arising from
the purchase or sale of collective investment schemes and tax deducted
at source or arising out of income received.
ASSET ALLOCATION AS OF 31 DECEMBER 2019
Market Value
S$ (mil)
% of Net Asset
Value
Equities 154.17 99.01
Cash & Others 1.54 0.99
Total 155.71 100.00
COUNTRY ALLOCATION AS OF 31 DECEMBER 2019
Market Value
S$ (mil)
% of Net Asset
Value
Singapore 154.17 99.01
Cash & Others 1.54 0.99
Total 155.71 100.00
SECTOR ALLOCATION AS OF 31 DECEMBER 2019
Market Value
S$ (mil)
% of Net Asset
Value
Communications 14.85 9.53
Consumer, Cyclical 9.76 6.26
Consumer, Non-
cyclical 18.09 11.62
Diversified 5.97 3.84
Financial 87.43 56.15
Industrial 17.41 11.18
Utilities 0.66 0.43
Cash & Others 1.54 0.99
Total 155.71 100.00
Important: Any difference in the total and percentage of the Net Asset
Value is the result of rounding.
CREDIT RATINGS OF DEBT SECURITIES
Nil.
SUBSCRIPTIONS AND REDEMPTIONS AS OF 31
DECEMBER 2019
S$
Subscriptions 15,125,740
Redemptions (18,703,293)
EXPOSURE TO DERIVATIVES
Market
Value S$
% of Net
Asset
Value
Realised
Gains/
(Losses) S$
Unrealised
Gains/
(Losses) S$
Futures (262) <0.01 - (262)
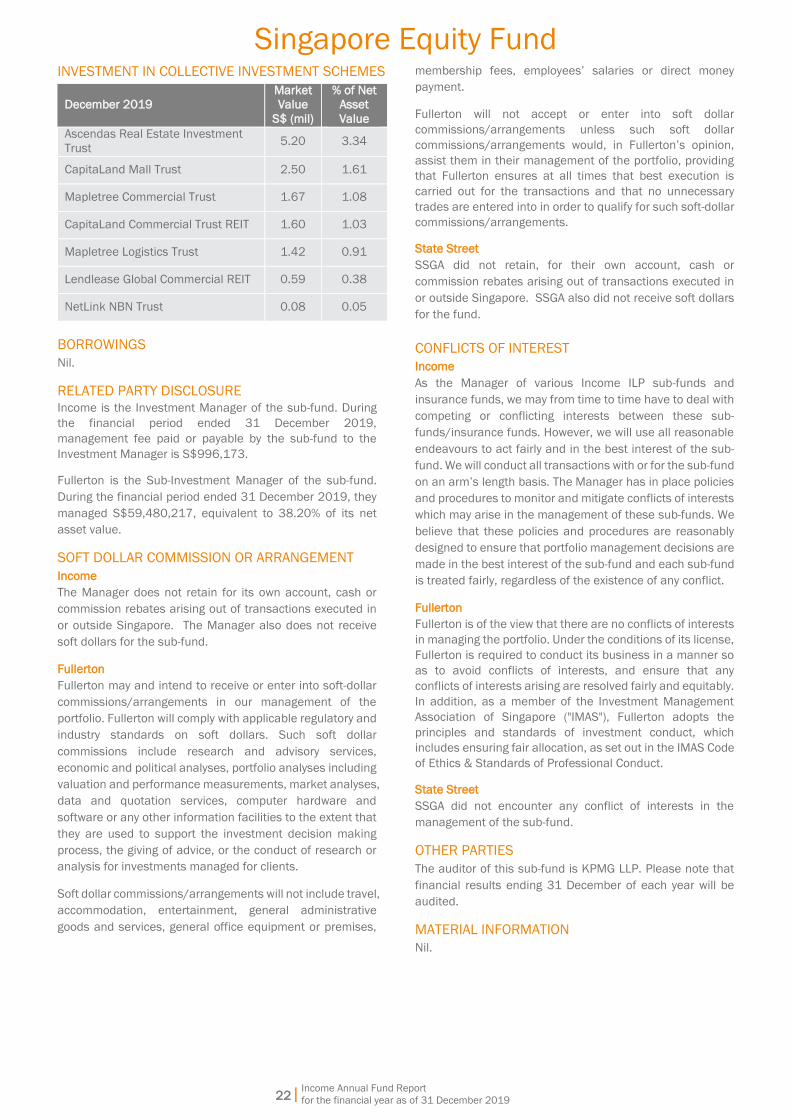
Singapore Equity Fund
22| Income Annual Fund Report
for the financial year as of 31 December 2019
INVESTMENT IN COLLECTIVE INVESTMENT SCHEMES
December 2019
Market
Value
S$ (mil)
% of Net
Asset
Value
Ascendas Real Estate Investment
Trust 5.20 3.34
CapitaLand Mall Trust 2.50 1.61
Mapletree Commercial Trust 1.67 1.08
CapitaLand Commercial Trust REIT 1.60 1.03
Mapletree Logistics Trust 1.42 0.91
Lendlease Global Commercial REIT 0.59 0.38
NetLink NBN Trust 0.08 0.05
BORROWINGS
Nil.
RELATED PARTY DISCLOSURE
Income is the Investment Manager of the sub-fund. During
the financial period ended 31 December 2019,
management fee paid or payable by the sub-fund to the
Investment Manager is S$996,173.
Fullerton is the Sub-Investment Manager of the sub-fund.
During the financial period ended 31 December 2019, they
managed S$59,480,217, equivalent to 38.20% of its net
asset value.
SOFT DOLLAR COMMISSION OR ARRANGEMENT
Income
The Manager does not retain for its own account, cash or
commission rebates arising out of transactions executed in
or outside Singapore. The Manager also does not receive
soft dollars for the sub-fund.
Fullerton
Fullerton may and intend to receive or enter into soft-dollar
commissions/arrangements in our management of the
portfolio. Fullerton will comply with applicable regulatory and
industry standards on soft dollars. Such soft dollar
commissions include research and advisory services,
economic and political analyses, portfolio analyses including
valuation and performance measurements, market analyses,
data and quotation services, computer hardware and
software or any other information facilities to the extent that
they are used to support the investment decision making
process, the giving of advice, or the conduct of research or
analysis for investments managed for clients.
Soft dollar commissions/arrangements will not include travel,
accommodation, entertainment, general administrative
goods and services, general office equipment or premises,
membership fees, employees’ salaries or direct money
payment.
Fullerton will not accept or enter into soft dollar
commissions/arrangements unless such soft dollar
commissions/arrangements would, in Fullerton’s opinion,
assist them in their management of the portfolio, providing
that Fullerton ensures at all times that best execution is
carried out for the transactions and that no unnecessary
trades are entered into in order to qualify for such soft-dollar
commissions/arrangements.
State Street
SSGA did not retain, for their own account, cash or
commission rebates arising out of transactions executed in
or outside Singapore. SSGA also did not receive soft dollars
for the fund.
CONFLICTS OF INTEREST
Income
As the Manager of various Income ILP sub-funds and
insurance funds, we may from time to time have to deal with
competing or conflicting interests between these sub-
funds/insurance funds. However, we will use all reasonable
endeavours to act fairly and in the best interest of the sub-
fund. We will conduct all transactions with or for the sub-fund
on an arm’s length basis. The Manager has in place policies
and procedures to monitor and mitigate conflicts of interests
which may arise in the management of these sub-funds. We
believe that these policies and procedures are reasonably
designed to ensure that portfolio management decisions are
made in the best interest of the sub-fund and each sub-fund
is treated fairly, regardless of the existence of any conflict.
Fullerton
Fullerton is of the view that there are no conflicts of interests
in managing the portfolio. Under the conditions of its license,
Fullerton is required to conduct its business in a manner so
as to avoid conflicts of interests, and ensure that any
conflicts of interests arising are resolved fairly and equitably.
In addition, as a member of the Investment Management
Association of Singapore ("IMAS"), Fullerton adopts the
principles and standards of investment conduct, which
includes ensuring fair allocation, as set out in the IMAS Code
of Ethics & Standards of Professional Conduct.
State Street
SSGA did not encounter any conflict of interests in the
management of the sub-fund.
OTHER PARTIES
The auditor of this sub-fund is KPMG LLP. Please note that
financial results ending 31 December of each year will be
audited.
MATERIAL INFORMATION
Nil.

23|
Asia Managed Fund
Income Annual Fund Report
for the financial year as of 31 December 2019
INVESTMENT OBJECTIVE
To achieve long-term capital appreciation by investing in stocks and fixed income securities in the region, including North Asian
and South-east Asian countries.
INVESTMENT SCOPE
The sub-fund will invest all or substantially all of its assets in the Singapore-domiciled Schroder Asian Growth Fund (managed by
Schroder Investment Management (Singapore) Ltd) in relation to the equity portion (70%) and Singapore Bond Fund (sub-
managed by Fullerton Fund Management Company Ltd) in relation to the fixed income portion (30%). Prior to 22 October 2010,
the investment scope was Singapore (39%), Hong Kong (18%) and Thailand (13%) stocks and Singapore Bonds (30%). The sub-
fund is denominated in Singapore Dollars.
FUND DETAILS AS OF 31 DECEMBER 2019
Launch Date 1 September 1995
Fund Size S$148.06 million
Initial Sales Charge Please refer to “Fees and Charges” in section 4 of the Product Summary for ILP.
Annual Management Fee 1.0% p.a. The Annual Management Fee is not guaranteed and may be reviewed from time
to time. However, it shall not exceed 2.0% of the sub-fund balance at any point of time.
Custodian The Bank of New York Mellon
Dealing Frequency Every business day
Inclusion in CPFIS Yes (CPF OA and CPF SA)
CPFIS Risk Classification Medium to High Risk, Narrowly Focused — Regional — Asia
Fund Manager NTUC Income Insurance Co-operative Limited
Benchmark 70% MSCI AC Asia ex-Japan Index in Singapore Dollars
30% Markit iBoxx ALBI Singapore Government 3+ Index
Structure Single Fund
With effect from 31 May 2017, one of the benchmark constituents, UOB Singapore Government Bond Index Long, has been
replaced by Markit iBoxx ALBI Singapore Government 3+ Index.
TOP 10 HOLDINGS Asia Managed Fund^
December 2019
Market
Value
S$ (mil)
% of Net
Asset
Value
December 2018
Market
Value
S$ (mil)
% of Net
Asset
Value
Schroder Asian Growth Fund 103.60 69.97 Schroder Asian Growth Fund 95.99 69.79
Singapore Bond Fund 44.58 30.11 Singapore Bond Fund 41.45 30.13
^Please refer to Singapore Bond Fund for the top 10 holdings.

24|
Asia Managed Fund
Income Annual Fund Report
for the financial year as of 31 December 2019
Schroder Asian Growth Fund^
December 2019
Market
Value
S$ (mil)
% of Net
Asset
Value
December 2018
Market
Value
S$ (mil)
% of Net
Asset
Value
Taiwan Semiconductor Manufacturing 135.61 8.50 Taiwan Semiconductor Manufacturing 91.33 6.67
Samsung Electronics 121.04 7.59 Samsung Electronics 86.92 6.35
Tencent Holdings 98.64 6.19 Tencent Holdings 78.19 5.71
Alibaba Group Holding 95.19 5.97 Alibaba Group Holding 64.82 4.74
AIA Group 70.47 4.42 AIA Group 56.49 4.13
HDFC Bank 60.55 3.80 HDFC Bank 49.50 3.62
ICICI Bank 49.44 3.10 Techtronic Industries 34.10 2.49
Techtronic Industries 48.08 3.02 China Pacific Insurance Group 32.34 2.36
China Pacific Insurance Group 38.83 2.43 ICICI Bank 31.33 2.29
New Oriental Education & Technology
Group Inc ADR 38.23 2.39 Oversea-Chinese Banking Corp 30.99 2.26
Important: Any difference in the total and percentage of the Net Asset Value is the result of rounding.
^Information extracted from the underlying Schroder Asian Growth Fund. Source: Schroder Investment Manager (Singapore) Ltd.
FUND MANAGER
NTUC Income Insurance Co-operative Limited is the Investment Manager of the sub-fund. The sub-fund invests significantly in
the Schroder Asian Growth Fund which is managed by Schroder Investment Management (Singapore) Ltd. The sub-fund also
invests in the Singapore Bond Fund which is managed by NTUC Income Insurance Co-operative Limited and sub-managed by
Fullerton Fund Management Company Ltd.
Further information on the Singapore Bond Fund can be found is the Product Highlights Sheet and Fund Summary on our website
www.income.com.sg/fund/coopprices.asp.
NTUC Income Insurance Co-operative Limited (Income) Income was established in 1970 to make essential insurance accessible to all Singaporeans. Today, Income is the leading
composite insurer in Singapore offering life, health and general insurance. Our wide network of financial advisers and partners
provide value-added financial advisory that complements today’s digital-first landscape, offering insurance products and services
that serve the protection, savings and investment needs of customers at different stages and across all segments of society.
As of 31 December 2019, Income had S$40.45 billion in assets under management. Our financial strength and diversified
investment portfolio are reflected by our strong credit ratings and predicated on our core investment philosophy of value,
prudence and discipline.
Fullerton Fund Management Company Ltd (Fullerton)
Fullerton Fund Management (“Fullerton”) is an Asia-based investment specialist, with capabilities that span equities, fixed income,
multi-asset and alternatives, including private equity. Prior to its establishment, Fullerton’s investment team operated as the
internal fund management division within Temasek, a global investment company headquartered in Singapore. The firm was
incorporated in Singapore in 2003 and is a subsidiary of Temasek Holdings (“Temasek”). NTUC Income, a leading Singapore
insurer, became our minority shareholder in 2018. Fullerton provides investment solutions for institutions such as government
agencies, pension plans, insurance companies, endowments and sovereign wealth, as well as for private wealth and the retail
segment. With 16 years of experience in Asian financial markets, Fullerton builds on its heritage to provide clients with investment
solutions that are long term, research-based and conviction-led. Headquartered in Singapore, Fullerton also has associated
offices in Shanghai, London, Tokyo and Brunei. Fullerton is licensed under the Securities and Futures Act and regulated by the
Monetary Authority of Singapore. As of 31 December 2019, Fullerton Fund Management’s assets under management was
S$54.48 billion.
Schroder Investment Management (Singapore) Ltd
Schroder Investment Management (Singapore) Ltd was incorporated in Singapore and has been managing collective investment
schemes and discretionary funds since 1992.
Schroders is a leading global asset management company, whose history dates back over 200 years. The group’s holding
company, Schroders Plc is and has been listed on the London Stock Exchange since 1959. Assets under management totalled
£500.20 billion (as of 31 December 2019).
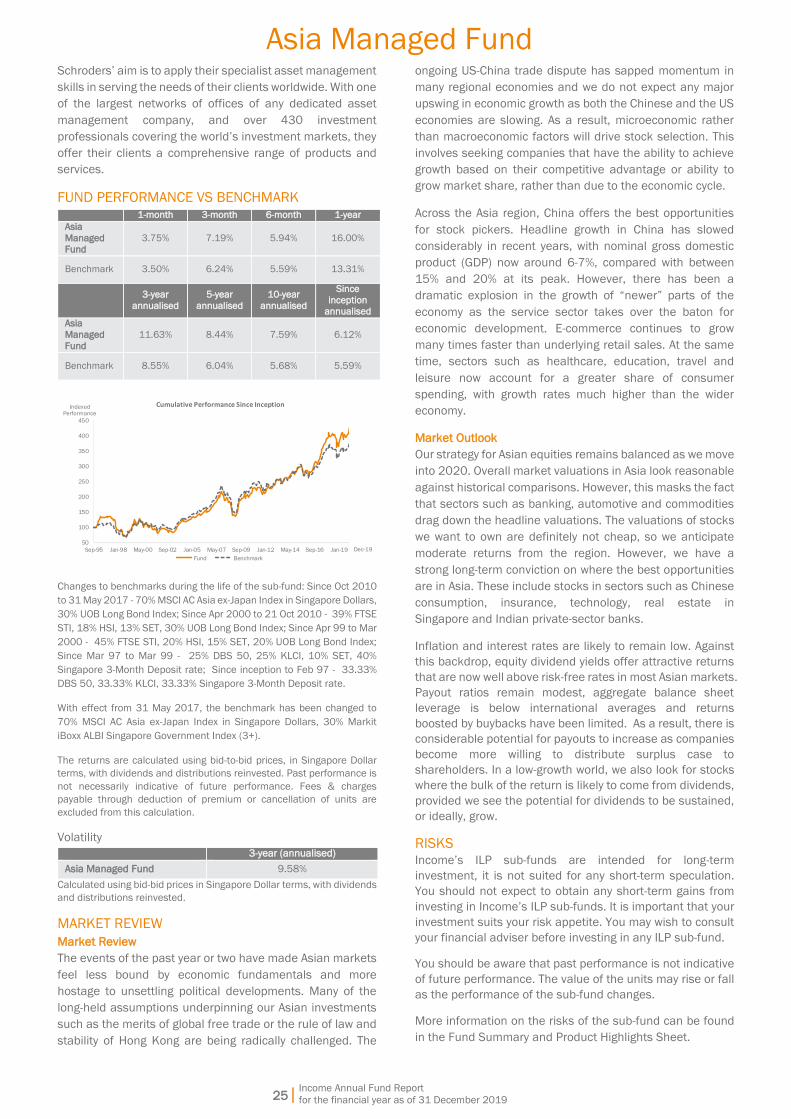
25|
Asia Managed Fund
Income Annual Fund Report
for the financial year as of 31 December 2019
Schroders’ aim is to apply their specialist asset management
skills in serving the needs of their clients worldwide. With one
of the largest networks of offices of any dedicated asset
management company, and over 430 investment
professionals covering the world’s investment markets, they
offer their clients a comprehensive range of products and
services.
FUND PERFORMANCE VS BENCHMARK
1-month 3-month 6-month 1-year
Asia
Managed
Fund
3.75% 7.19% 5.94% 16.00%
Benchmark 3.50% 6.24% 5.59% 13.31%
3-year
annualised
5-year
annualised
10-year
annualised
Since
inception annualised
Asia
Managed
Fund
11.63% 8.44% 7.59% 6.12%
Benchmark 8.55% 6.04% 5.68% 5.59%
50
100
150
200
250
300
350
400
450
Sep-95 Jan-98 May-00 Sep-02 Jan-05 May-07 Sep-09 Jan-12 May-14 Sep-16 Jan-19
Cumulative Performance Since Inception
Fund Benchmark
IndexedPerformance
Dec-19
Changes to benchmarks during the life of the sub-fund: Since Oct 2010
to 31 May 2017 - 70% MSCI AC Asia ex-Japan Index in Singapore Dollars,
30% UOB Long Bond Index; Since Apr 2000 to 21 Oct 2010 - 39% FTSE
STI, 18% HSI, 13% SET, 30% UOB Long Bond Index; Since Apr 99 to Mar
2000 - 45% FTSE STI, 20% HSI, 15% SET, 20% UOB Long Bond Index;
Since Mar 97 to Mar 99 - 25% DBS 50, 25% KLCI, 10% SET, 40%
Singapore 3-Month Deposit rate; Since inception to Feb 97 - 33.33%
DBS 50, 33.33% KLCI, 33.33% Singapore 3-Month Deposit rate.
With effect from 31 May 2017, the benchmark has been changed to
70% MSCI AC Asia ex-Japan Index in Singapore Dollars, 30% Markit
iBoxx ALBI Singapore Government Index (3+).
The returns are calculated using bid-to-bid prices, in Singapore Dollar
terms, with dividends and distributions reinvested. Past performance is
not necessarily indicative of future performance. Fees & charges
payable through deduction of premium or cancellation of units are
excluded from this calculation.
Volatility
3-year (annualised)
Asia Managed Fund 9.58%
Calculated using bid-bid prices in Singapore Dollar terms, with dividends
and distributions reinvested.
MARKET REVIEW
Market Review
The events of the past year or two have made Asian markets
feel less bound by economic fundamentals and more
hostage to unsettling political developments. Many of the
long-held assumptions underpinning our Asian investments
such as the merits of global free trade or the rule of law and
stability of Hong Kong are being radically challenged. The
ongoing US-China trade dispute has sapped momentum in
many regional economies and we do not expect any major
upswing in economic growth as both the Chinese and the US
economies are slowing. As a result, microeconomic rather
than macroeconomic factors will drive stock selection. This
involves seeking companies that have the ability to achieve
growth based on their competitive advantage or ability to
grow market share, rather than due to the economic cycle.
Across the Asia region, China offers the best opportunities
for stock pickers. Headline growth in China has slowed
considerably in recent years, with nominal gross domestic
product (GDP) now around 6-7%, compared with between
15% and 20% at its peak. However, there has been a
dramatic explosion in the growth of “newer” parts of the
economy as the service sector takes over the baton for
economic development. E-commerce continues to grow
many times faster than underlying retail sales. At the same
time, sectors such as healthcare, education, travel and
leisure now account for a greater share of consumer
spending, with growth rates much higher than the wider
economy.
Market Outlook
Our strategy for Asian equities remains balanced as we move
into 2020. Overall market valuations in Asia look reasonable
against historical comparisons. However, this masks the fact
that sectors such as banking, automotive and commodities
drag down the headline valuations. The valuations of stocks
we want to own are definitely not cheap, so we anticipate
moderate returns from the region. However, we have a
strong long-term conviction on where the best opportunities
are in Asia. These include stocks in sectors such as Chinese
consumption, insurance, technology, real estate in
Singapore and Indian private-sector banks.
Inflation and interest rates are likely to remain low. Against
this backdrop, equity dividend yields offer attractive returns
that are now well above risk-free rates in most Asian markets.
Payout ratios remain modest, aggregate balance sheet
leverage is below international averages and returns
boosted by buybacks have been limited. As a result, there is
considerable potential for payouts to increase as companies
become more willing to distribute surplus case to
shareholders. In a low-growth world, we also look for stocks
where the bulk of the return is likely to come from dividends,
provided we see the potential for dividends to be sustained,
or ideally, grow.
RISKS
Income’s ILP sub-funds are intended for long-term
investment, it is not suited for any short-term speculation.
You should not expect to obtain any short-term gains from
investing in Income’s ILP sub-funds. It is important that your
investment suits your risk appetite. You may wish to consult
your financial adviser before investing in any ILP sub-fund.
You should be aware that past performance is not indicative
of future performance. The value of the units may rise or fall
as the performance of the sub-fund changes.
More information on the risks of the sub-fund can be found
in the Fund Summary and Product Highlights Sheet.

26|
Asia Managed Fund
Income Annual Fund Report
for the financial year as of 31 December 2019
EXPENSE AND TURNOVER RATIO
Asia Managed Fund
Expense ratio Turnover ratio
As of 31
December 2019 1.22% 9.31%
As of 31
December 2018 1.29% 7.88%
Singapore Bond Fund
Expense ratio Turnover ratio
As of 31
December 2019 0.52% 21.30%
As of 31
December 2018 0.52% 32.17%
Expense ratio does not include (where applicable) charges for insurance
coverage, brokerage and other transaction costs, performance fee,
foreign exchange gains or losses, front or back end loads arising from
the purchase or sale of collective investment schemes and tax deducted
at source or arising out of income received.
Schroder Asian Growth Fund
Expense ratio Turnover ratio
As of 31
December 2019 1.34% 16.44%
As of 31
December 2018 1.35% 12.92%
Expense ratio does not include brokerage and other transaction costs,
performance fee, foreign exchange gains or losses, front or back end
loads arising from the purchase or sale of other schemes and tax
deducted at source or arising out of income received.
ASSET ALLOCATION AS OF 31 DECEMBER 2019
Market Value
S$ (mil)
% of Net Asset
Value
Corporate Bonds 19.41 13.11
Government Bonds 24.87 16.80
Equities 103.60 69.97
Cash & Others 0.18 0.12
Total 148.06 100.00
Important: Any difference in the total and percentage of the Net Asset
Value is the result of rounding.
SUBSCRIPTIONS AND REDEMPTIONS AS OF 31
DECEMBER 2019
S$
Subscriptions 9,972,818
Redemptions (20,879,552)
EXPOSURE TO DERIVATIVES
Nil.
INVESTMENT IN COLLECTIVE INVESTMENT SCHEMES
December 2019
Market
Value
S$ (mil)
% of Net
Asset
Value
Schroder Asian Growth Fund 103.60 69.97
Singapore Bond Fund 44.58 30.11
BORROWINGS
Nil.
RELATED PARTY DISCLOSURE
Income is the Investment Manager of the sub-fund. During
the financial period ended 31 December 2019,
management fee paid or payable by the sub-fund to the
Investment Manager is S$1,453,896.
Fullerton is the Sub-Investment Manager of the Singapore
Bond Fund, which the sub-fund invests into. During the
financial period ended 31 December 2019, they managed
S$44,583,197, equivalent to 30.11% of its net asset value.
SOFT DOLLAR COMMISSION OR ARRANGEMENT
Income
The Manager does not retain for its own account, cash or
commission rebates arising out of transactions executed in
or outside Singapore. The Manager also does not receive
soft dollars for the sub-fund.
Schroder
In the management of the Schroder Asian Growth Fund,
Schroder may accept soft dollar commissions from, or enter
into soft dollar arrangement with, stockbrokers who execute
trades on behalf of the Schroder Asian Growth Fund and the
soft dollars received are restricted to the following kinds of
services:
i. Research and price information;
ii. Performance measurement;
iii. Portfolio valuations; and
iv. Analysis and administration services.
Schroder may not receive or enter into soft dollar
commissions or arrangements unless (a) such soft dollar
commissions or arrangements shall reasonably assist
Schroder in their management of the Schroder Asian Growth
Fund, (b) best execution is carried out for the transactions,
and (c) that no unnecessary trades are entered into in order
to qualify for such soft dollar commissions or arrangements.
Schroder shall not receive goods and services such as travel,
accommodation and entertainment.
Fullerton
Fullerton may and intend to receive or enter into soft-dollar
commissions/arrangements in our management of the
portfolio. Fullerton will comply with applicable regulatory and
industry standards on soft dollars. Such soft dollar
commissions include research and advisory services,
economic and political analyses, portfolio analyses including
valuation and performance measurements, market analyses,
data and quotation services, computer hardware and
software or any other information facilities to the extent that
they are used to support the investment decision making
process, the giving of advice, or the conduct of research or
analysis for investments managed for clients.
Soft dollar commissions/arrangements will not include travel,
accommodation, entertainment, general administrative
goods and services, general office equipment or premises,
membership fees, employees’ salaries or direct money
payment.
Fullerton will not accept or enter into soft dollar
commissions/arrangements unless such soft dollar
commissions/arrangements would, in Fullerton’s opinion,
27|
Asia Managed Fund
Income Annual Fund Report
for the financial year as of 31 December 2019
assist them in their management of the portfolio, providing
that Fullerton ensures at all times that best execution is
carried out for the transactions and that no unnecessary
trades are entered into in order to qualify for such soft-dollar
commissions/arrangements.
CONFLICTS OF INTEREST
Income
As the Manager of various Income ILP sub-funds and
insurance funds, we may from time to time have to deal with
competing or conflicting interests between these sub-
funds/insurance funds. However, we will use all reasonable
endeavours to act fairly and in the best interest of the sub-
fund. We will conduct all transactions with or for the sub-fund
on an arm’s length basis. The Manager has in place policies
and procedures to monitor and mitigate conflicts of interests
which may arise in the management of these sub-funds. We
believe that these policies and procedures are reasonably
designed to ensure that portfolio management decisions are
made in the best interest of the sub-fund and each sub-fund
is treated fairly, regardless of the existence of any conflict.
Schroder
Scrhoder may from time to time have to deal with competing
or conflicting interests between the other unit trusts which
are managed by Schroder and the Schroder Asian Growth
Fund. For example, Schroder may make a purchase or sale
decision on behalf of some or all of their other unit trusts
without making the same decision on behalf of the Schroder
Asian Growth Fund, as a decision whether or not to make the
same investment or sale for the Schroder Asian Growth Fund
depends on factors such as the cash availability and portfolio
balance of the Schroder Asian Growth Fund. However
Schroder will use reasonable endeavours at all times to act
fairly and in the interests of the Schroder Asian Growth Fund.
In particular, after taking into account the availability of cash
and the relevant investment guidelines of the other unit
trusts managed by Schroder and the Schroder Asian Growth
Fund, Schroder will endeavour to ensure that securities
bought and sold will be allocated proportionately as far as
possible among the Schroder Asian Growth Fund and the
other unit trusts managed by Schroder.
The factors which Schroder will take into account when
determining if there are any conflicts of interest as described
above include the assets (including cash) of the Schroder
Asian Growth Fund as well as the assets of the other unit
trusts managed by Schroder. To the extent that another unit
trust managed by Schroder intends to purchase substantially
similar assets, Schroder will ensure that the assets are
allocated fairly and proportionately and that the interests of
all investors are treated equally between the Schroder Asian
Growth Fund and the other unit trusts.
Associates of the trustee for the Schroder Asian Growth Fund
may be engaged to provide financial, banking or brokerage
services to the Schroder Asian Growth Fund or buy, hold and
deal in any investments, enter into contracts or other
arrangements with the trustee and make profits from these
activities. Such services to the Schroder Asian Growth Fund,
where provided, and such activities with the trustee, where
entered into, will be on an arm’s length basis.
Fullerton
Fullerton is of the view that there are no conflicts of interests
in managing the portfolio. Under the conditions of its license,
Fullerton is required to conduct its business in a manner so
as to avoid conflicts of interests, and ensure that any
conflicts of interests arising are resolved fairly and equitably.
In addition, as a member of the Investment Management
Association of Singapore ("IMAS"), Fullerton adopts the
principles and standards of investment conduct, which
includes ensuring fair allocation, as set out in the IMAS Code
of Ethics & Standards of Professional Conduct.
OTHER PARTIES
The auditor of this sub-fund is KPMG LLP. Please note that
financial results ending 31 December of each year will be
audited.
MATERIAL INFORMATION
Nil.
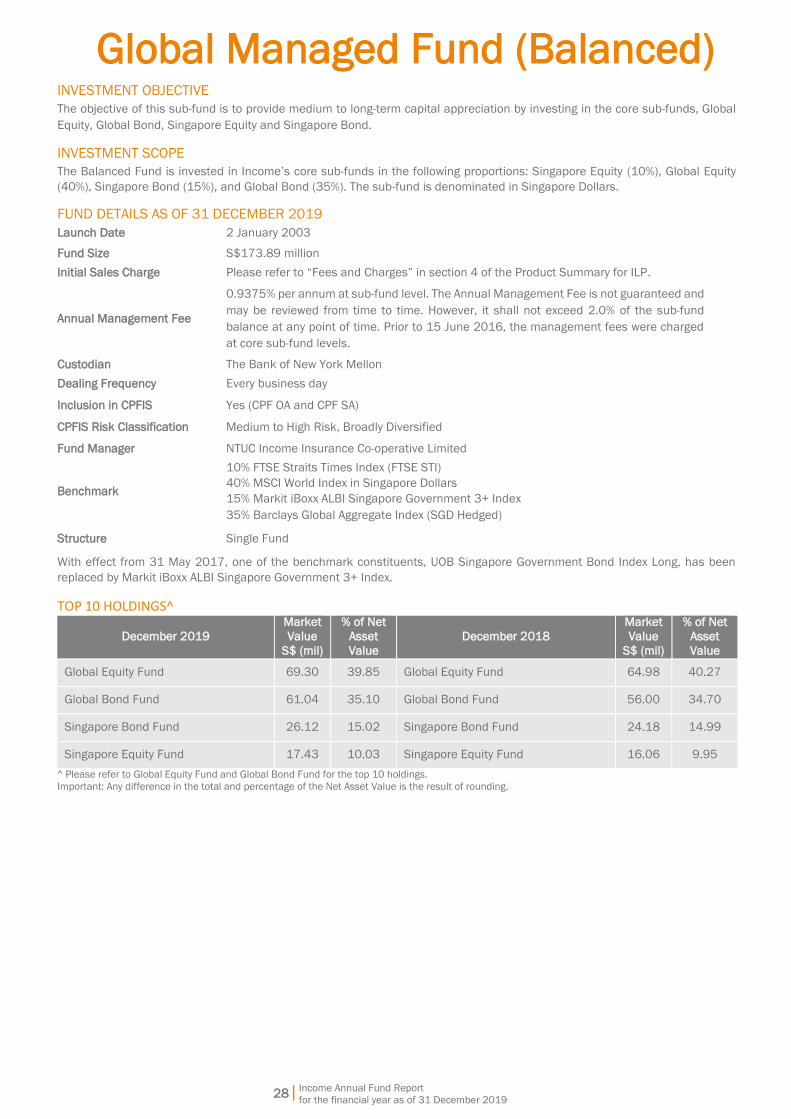
Global Managed Fund (Balanced)
Income Annual Fund Report
for the financial year as of 31 December 2019
28|
INVESTMENT OBJECTIVE
The objective of this sub-fund is to provide medium to long-term capital appreciation by investing in the core sub-funds, Global
Equity, Global Bond, Singapore Equity and Singapore Bond.
INVESTMENT SCOPE
The Balanced Fund is invested in Income’s core sub-funds in the following proportions: Singapore Equity (10%), Global Equity
(40%), Singapore Bond (15%), and Global Bond (35%). The sub-fund is denominated in Singapore Dollars.
FUND DETAILS AS OF 31 DECEMBER 2019
Launch Date 2 January 2003
Fund Size S$173.89 million
Initial Sales Charge Please refer to “Fees and Charges” in section 4 of the Product Summary for ILP.
Annual Management Fee
0.9375% per annum at sub-fund level. The Annual Management Fee is not guaranteed and
may be reviewed from time to time. However, it shall not exceed 2.0% of the sub-fund
balance at any point of time. Prior to 15 June 2016, the management fees were charged
at core sub-fund levels.
Custodian The Bank of New York Mellon
Dealing Frequency Every business day
Inclusion in CPFIS Yes (CPF OA and CPF SA)
CPFIS Risk Classification Medium to High Risk, Broadly Diversified
Fund Manager NTUC Income Insurance Co-operative Limited
Benchmark
10% FTSE Straits Times Index (FTSE STI)
40% MSCI World Index in Singapore Dollars
15% Markit iBoxx ALBI Singapore Government 3+ Index
35% Barclays Global Aggregate Index (SGD Hedged)
Structure Single Fund
With effect from 31 May 2017, one of the benchmark constituents, UOB Singapore Government Bond Index Long, has been
replaced by Markit iBoxx ALBI Singapore Government 3+ Index.
TOP 10 HOLDINGS^
December 2019
Market
Value
S$ (mil)
% of Net
Asset
Value
December 2018
Market
Value
S$ (mil)
% of Net
Asset
Value
Global Equity Fund 69.30 39.85 Global Equity Fund 64.98 40.27
Global Bond Fund 61.04 35.10 Global Bond Fund 56.00 34.70
Singapore Bond Fund 26.12 15.02 Singapore Bond Fund 24.18 14.99
Singapore Equity Fund 17.43 10.03 Singapore Equity Fund 16.06 9.95
^ Please refer to Global Equity Fund and Global Bond Fund for the top 10 holdings.
Important: Any difference in the total and percentage of the Net Asset Value is the result of rounding.

Income Annual Fund Report
for the financial year as of 31 December 2019
29|
Global Managed Fund (Balanced)
FUND MANAGER
NTUC Income Insurance Co-operative Limited is the
Investment Manager of the sub-fund.
The sub-fund invests in the Singapore Equity Fund,
Singapore Bond Fund, Global Equity Fund and Global Bond
Fund. The Investment Manager for these sub-funds is NTUC
Income Insurance Co-operative Limited. The Sub-Investment
Managers of the Singapore Equity Fund are Fullerton Fund
Management Company Ltd and State Street Global Advisors
Singapore Limited. The Sub-Investment Managers of the
Global Bond Fund and Singapore Bond Fund is Amundi
Singapore Limited and Fullerton Fund Management
Company Ltd respectively. The Sub-Investment Managers of
the Global Equity Fund are Morgan Stanley Investment
Management Company, MFS International Singapore Pte Ltd,
and Wellington Management Singapore Pte Ltd.
Further information on the underlying core sub-funds,
Singapore Equity, Singapore Bond, Global Equity, and Global
Bond, can be found in the respective Product Highlights
Sheets and Fund Summaries on our website
www.income.com.sg/fund/coopprices.asp.
NTUC Income Insurance Co-operative Limited (Income)
Income was established in 1970 to make essential
insurance accessible to all Singaporeans. Today, Income is
the leading composite insurer in Singapore offering life,
health and general insurance. Our wide network of financial
advisers and partners provide value-added financial advisory
that complements today’s digital-first landscape, offering
insurance products and services that serve the protection,
savings and investment needs of customers at different
stages and across all segments of society.
As of 31 December 2019, Income had S$40.45 billion in
assets under management. Our financial strength and
diversified investment portfolio are reflected by our strong
credit ratings and predicated on our core investment
philosophy of value, prudence and discipline.
Amundi Singapore Limited
Amundi Singapore Limited is a wholly-owned subsidiary of
Amundi Asset Management. It was established in Singapore
in 1989 as a business hub for Amundi’s group operations in
South East Asia. Amundi Singapore Limited is licensed and
regulated by the Monetary Authority of Singapore and has
been managing collective investment schemes and/or
discretionary funds since 1989. It is also one of Amundi’s
group investment centres responsible for Asian investment
management. Amundi manages €1.65 trillion euros of
assets as of 31 December 2019.
Morgan Stanley Investment Management Company (MSIM)
MSIM was established in 1975 as a subsidiary of Morgan
Stanley Group Inc. As of December 31, 2019, MSIM employs
711 investment professionals worldwide in 23 countries and
offers its clients personalised attention, the intelligence and
creativity of some of the brightest professionals in the
industry and access to the global resources of Morgan
Stanley. As of December 31, 2019, MSIM managed US$552
billion in assets for its clients.
MFS International Singapore Pte Ltd^
MFS International Singapore Pte Ltd is incorporated in
Singapore and is authorised under a capital market service
license with the Monetary Authority of Singapore to provide
fund management services. MFS has been managing pooled
vehicles/investment funds and/or discretionary funds in
Singapore since 1997. MFS Investment Management
(parent company of MFS International Singapore Pte Ltd)
was founded in 1924. Asset under management totalled
US$526 billion as of 31 December 2019. MFS believes in
active bottom-up research aimed at consistently identifying
high-quality investments by focusing on companies that have
potential to generate above-average and sustainable
earnings. MFS has a global network of research analysts and
portfolio managers based in Boston, Toronto, Mexico City,
London, Tokyo, Hong Kong, Singapore and Sydney.
^Prior to November 2013, MFS was operating as a branch of MFS
International limited and was an exempted fund manager under the
Singaporean regulatory regime.
Wellington Management Singapore Pte Ltd (WMS)*
WMS is an affiliate of Wellington Management Company LLP
(WMS, Wellington Management Company LLP and the other
affiliates of Wellington Management Company LLP are
collectively referred to as WMC). With US$1.1 trillion in
assets under management, WMC serves as an investment
adviser to over 2,200 clients located in more than 60
countries, as of 31 December 2019. WMC’s singular focus is
investments — from global equities and fixed income to
currencies and commodities. WMC describes themselves as
a community of teams that create solutions designed to
respond to specific client needs. WMC’s most distinctive
strength is their proprietary, independent research, which is
shared across all areas of the organisation and used only for
managing clients' portfolios. Tracing its roots to the founding
of Wellington Fund in 1928, the firm has offices in Boston,
Massachusetts; Chicago, Illinois; Radnor, Pennsylvania; San
Francisco, California; Toronto, Canada; Beijing; Frankfurt;
Hong Kong; London; Singapore; Sydney; Tokyo; Luxembourg
and Zurich.
*With effect from 29 April 2016, WMS has replaced Trust Company of
the West (TCW) Asset Management Company as the Sub-Investment
Manager of the Global Technology Fund.
State Street Global Advisors Singapore Limited (SSGA)
For four decades, State Street Global Advisors has served the
world’s governments, institutions and financial advisors.
With a rigorous, risk-aware approach built on research,
analysis and market-tested experience, we build from a
breadth of active and index strategies to create cost-effective
solutions. As stewards, we help portfolio companies see that
what is fair for people and sustainable for the planet can
deliver long-term performance. And, as pioneers in index,
ETF, and ESG investing, we are always inventing new ways to
invest. As a result, we have become the world’s third largest
asset manager with nearly US$3.12 trillion* under our care.
*This figure is presented as of December 31, 2019 and includes
approximately $45 billion of assets with respect to SPDR products for
which State Street Global Advisors Funds Distributors, LLC (SSGA FD)
acts solely as the marketing agent. SSGA FD and State Street Global
Advisors are affiliated.
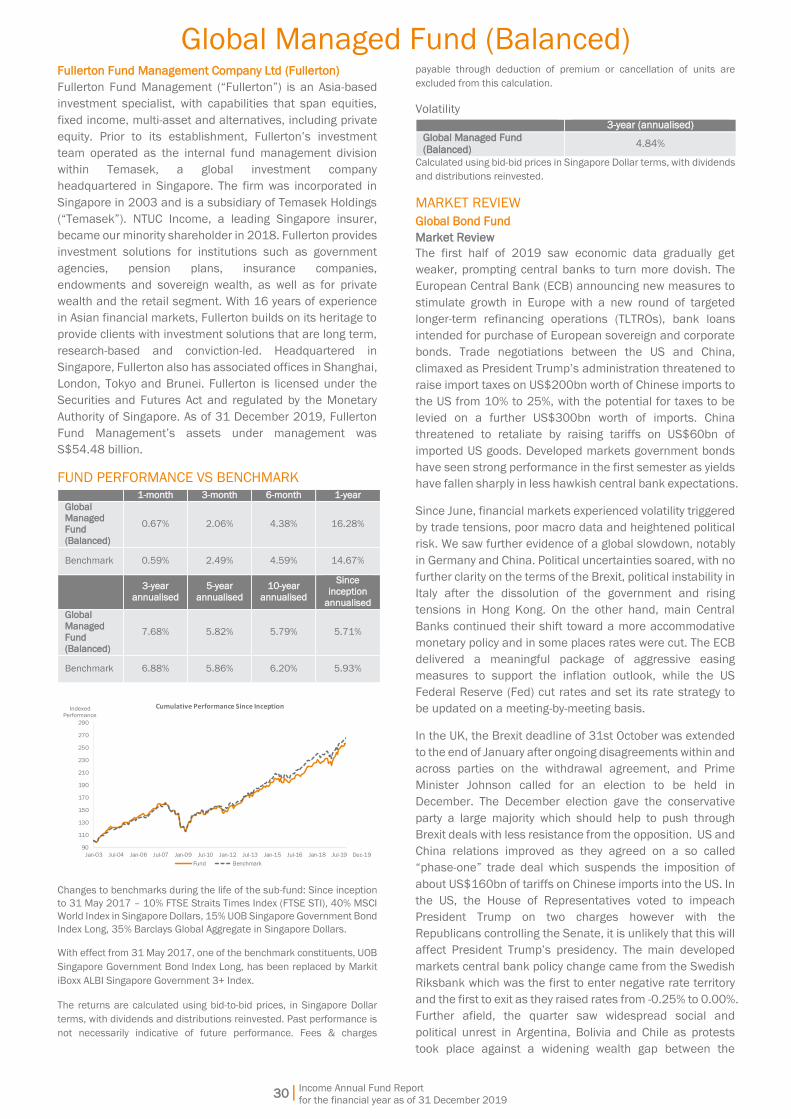
Income Annual Fund Report
for the financial year as of 31 December 2019
30|
Global Managed Fund (Balanced)
Fullerton Fund Management Company Ltd (Fullerton)
Fullerton Fund Management (“Fullerton”) is an Asia-based
investment specialist, with capabilities that span equities,
fixed income, multi-asset and alternatives, including private
equity. Prior to its establishment, Fullerton’s investment
team operated as the internal fund management division
within Temasek, a global investment company
headquartered in Singapore. The firm was incorporated in
Singapore in 2003 and is a subsidiary of Temasek Holdings
(“Temasek”). NTUC Income, a leading Singapore insurer,
became our minority shareholder in 2018. Fullerton provides
investment solutions for institutions such as government
agencies, pension plans, insurance companies,
endowments and sovereign wealth, as well as for private
wealth and the retail segment. With 16 years of experience
in Asian financial markets, Fullerton builds on its heritage to
provide clients with investment solutions that are long term,
research-based and conviction-led. Headquartered in
Singapore, Fullerton also has associated offices in Shanghai,
London, Tokyo and Brunei. Fullerton is licensed under the
Securities and Futures Act and regulated by the Monetary
Authority of Singapore. As of 31 December 2019, Fullerton
Fund Management’s assets under management was
S$54.48 billion.
FUND PERFORMANCE VS BENCHMARK 1-month 3-month 6-month 1-year
Global Managed
Fund
(Balanced)
0.67% 2.06% 4.38% 16.28%
Benchmark 0.59% 2.49% 4.59% 14.67%
3-year
annualised
5-year
annualised
10-year
annualised
Since
inception
annualised
Global
Managed
Fund
(Balanced)
7.68% 5.82% 5.79% 5.71%
Benchmark 6.88% 5.86% 6.20% 5.93%
90
110
130
150
170
190
210
230
250
270
290
Jan-03 Jul-04 Jan-06 Jul-07 Jan-09 Jul-10 Jan-12 Jul-13 Jan-15 Jul-16 Jan-18 Jul-19
Cumulative Performance Since Inception
Fund Benchmark
IndexedPerformance
Dec-19
Changes to benchmarks during the life of the sub-fund: Since inception
to 31 May 2017 – 10% FTSE Straits Times Index (FTSE STI), 40% MSCI
World Index in Singapore Dollars, 15% UOB Singapore Government Bond
Index Long, 35% Barclays Global Aggregate in Singapore Dollars.
With effect from 31 May 2017, one of the benchmark constituents, UOB
Singapore Government Bond Index Long, has been replaced by Markit
iBoxx ALBI Singapore Government 3+ Index.
The returns are calculated using bid-to-bid prices, in Singapore Dollar
terms, with dividends and distributions reinvested. Past performance is
not necessarily indicative of future performance. Fees & charges
payable through deduction of premium or cancellation of units are
excluded from this calculation.
Volatility
3-year (annualised)
Global Managed Fund
(Balanced) 4.84%
Calculated using bid-bid prices in Singapore Dollar terms, with dividends
and distributions reinvested.
MARKET REVIEW
Global Bond Fund Market Review The first half of 2019 saw economic data gradually get
weaker, prompting central banks to turn more dovish. The
European Central Bank (ECB) announcing new measures to
stimulate growth in Europe with a new round of targeted
longer-term refinancing operations (TLTROs), bank loans
intended for purchase of European sovereign and corporate
bonds. Trade negotiations between the US and China,
climaxed as President Trump’s administration threatened to
raise import taxes on US$200bn worth of Chinese imports to
the US from 10% to 25%, with the potential for taxes to be
levied on a further US$300bn worth of imports. China
threatened to retaliate by raising tariffs on US$60bn of
imported US goods. Developed markets government bonds
have seen strong performance in the first semester as yields
have fallen sharply in less hawkish central bank expectations.
Since June, financial markets experienced volatility triggered
by trade tensions, poor macro data and heightened political
risk. We saw further evidence of a global slowdown, notably
in Germany and China. Political uncertainties soared, with no
further clarity on the terms of the Brexit, political instability in
Italy after the dissolution of the government and rising
tensions in Hong Kong. On the other hand, main Central
Banks continued their shift toward a more accommodative
monetary policy and in some places rates were cut. The ECB
delivered a meaningful package of aggressive easing
measures to support the inflation outlook, while the US
Federal Reserve (Fed) cut rates and set its rate strategy to
be updated on a meeting-by-meeting basis.
In the UK, the Brexit deadline of 31st October was extended
to the end of January after ongoing disagreements within and
across parties on the withdrawal agreement, and Prime
Minister Johnson called for an election to be held in
December. The December election gave the conservative
party a large majority which should help to push through
Brexit deals with less resistance from the opposition. US and
China relations improved as they agreed on a so called
“phase-one” trade deal which suspends the imposition of
about US$160bn of tariffs on Chinese imports into the US. In
the US, the House of Representatives voted to impeach
President Trump on two charges however with the
Republicans controlling the Senate, it is unlikely that this will
affect President Trump’s presidency. The main developed
markets central bank policy change came from the Swedish
Riksbank which was the first to enter negative rate territory
and the first to exit as they raised rates from -0.25% to 0.00%.
Further afield, the quarter saw widespread social and
political unrest in Argentina, Bolivia and Chile as protests
took place against a widening wealth gap between the

Income Annual Fund Report
for the financial year as of 31 December 2019
31|
Global Managed Fund (Balanced)
richest and the average population in addition to disputed
elections.
Market Outlook For 2020 we currently see five key themes that could have
significant impact on the markets. We see fiscal and
monetary easing across developed markets which could
provide a welcome tailwind that with tactical opportunities.
The global assessment of trade dynamics is impacting areas
and countries differently, with some emerging markets (EM)
possibly benefitting as trade that would have gone to China
becomes diverted to other countries. We expect China to
decelerate but to manage the slower growth by addressing
productivity growth, while avoiding a credit bubble burst.
There is some spill over from manufacturing to services, but
US consumers will remain sufficiently resilient in 2020 due
to healthier household balance sheet. Global earnings per
share growth is expected in the lower single digit space.
Currency dynamics and spreads are the main areas to
monitor, as the materialisation of downside risk might be
sudden and impactful in a world washed by government and
corporate debt. With a good balance of positives and risks
expected to materialise in 2020, the ability and flexibility to
quickly allocate risk across a wide spectrum of assets to
where it will reap the largest rewards remains critical.
We are currently overall underweight duration, particularly on
the shorter end of the curve. Geographically, we are
underweight duration in the Eurozone and Japan whilst being
overweight USD-denominated duration. We remain
overweight investment grade corporate bonds as they still
offer a decent pick-up over government bonds, we also hold
selective allocations to EM bonds. Within currencies, we are
underweight the USD with an overweight allocation to the
EUR which stands to grow on improved growth expectations.
In addition, we hold overweight allocations to select high
yielding EM currencies like the MXN, TRY and RUB. We are
underweight the USD which we view as being fully priced in.
Singapore Bond Fund Market Review Global markets were roiled by political events in 2019,
including the protracted US-China trade war and Brexit
concerns, in addition to worries of a global growth slowdown.
Despite this, most financial markets, including Asian bond
markets, closed the year on a strong note as central banks
globally pledged monetary policy support and boosted fiscal
efforts. As the year comes to a close, financial markets were
further supported by a benign inflation backdrop, fading risk
of a hard Brexit, and the agreement of a Phase One trade
deal between the US and China in December.
Central banks across Asia have followed the Fed’s dovish tilt
in 2019, in aggressively lowering borrowing costs as growth
slows. Countries such as Thailand, India, Indonesia, the
Philippines, South Korea, and Malaysia are among those that
have front loaded easier monetary policy in 2019 and the
pace of cuts is likely to be more modest from hereon.
Importantly, fiscal policy in Asia remained supportive,
cushioning domestic demand and offset the drag from the
external sectors.
In Singapore, advance estimates showed that Singapore’s
economy grew by 0.8%yoy in 4Q2019, bringing the full year
gross domestic product (GDP) growth for 2019 to 0.7%yoy.
On the inflation front, consumer price index (CPI) inflation
inched up slightly to 0.6% est. for 2019, from 0.4% in 2018.
Core inflation is projected to ease to 1.1%. On the exports
front, Singapore’s non-oil domestic exports (NODX)
registered a growth of 2.4%yoy in December, marking an
encouraging end to a difficult year.
Market Outlook Risk assets are off to a good start in 2020, following positive
developments on the trade front and nascent indicators of
stabilising global growth. In Asia, the latest regional
purchasing managers index (PMI) have improved, with South
Korea, Thailand and Taiwan among those in expansionary
territory. In China, new export orders have risen and are now
in expansion territory, reflecting reduced trade tensions and
firmer external demand.
Similarly in Singapore, we expect modest growth recovery in
2020, spurred by the reprieve in US-China trade tensions.
The recent uptick in higher-frequency indicators such as
industrial production and NODX are also encouraging.
Inflation is likely to remain stable on the back of the steady
supply in food and commodities, and lower wage growth. The
modest growth environment coupled with negative output
gap will also limit the pass though effect.
Against such a backdrop, we are keeping to a modest
underweight in duration as Singapore bond yields may edge
higher, in tandem with rising US Treasury yields in the near
term, given firmer risk sentiments. The yield curve is also
likely to steepen, given some front-loading of long-end SGS
supply in Q12020. We continue to allocate to overall credit
beta as an expression of our positive risk disposition and
sidelined SGD agencies (on expensive relative valuations).
That said, we may re-engage the SGD agency markets should
spreads widen out.
Global Equity Fund Market Review Global equities, as measured by the MSCI World Index,
produced a total return of 22.8% in SGD terms in 2019.
Easier global monetary policy, anticipation of a phase one
trade deal between China and the US and receding risks of a
near-term no deal Brexit helped propel the market.
The US S&P 500 index produced a total return of 23.7% in
SGD terms in 2019. A trio of rate cuts from the Fed, along
with the resumption of Treasury bill purchases by the Fed to
pump additional reserves into money markets were
supportive from a monetary policy perspective while easing
geopolitical and trade tensions contributed to the year's
strong performance.
European stocks, as measured by the STOXX Europe 50
Index, returned 25% in SGD terms in 2019. Fading fears of a
no deal Brexit, anticipation of a US-China trade agreement
and additional monetary policy accommodation from the
ECB underpinned performance.
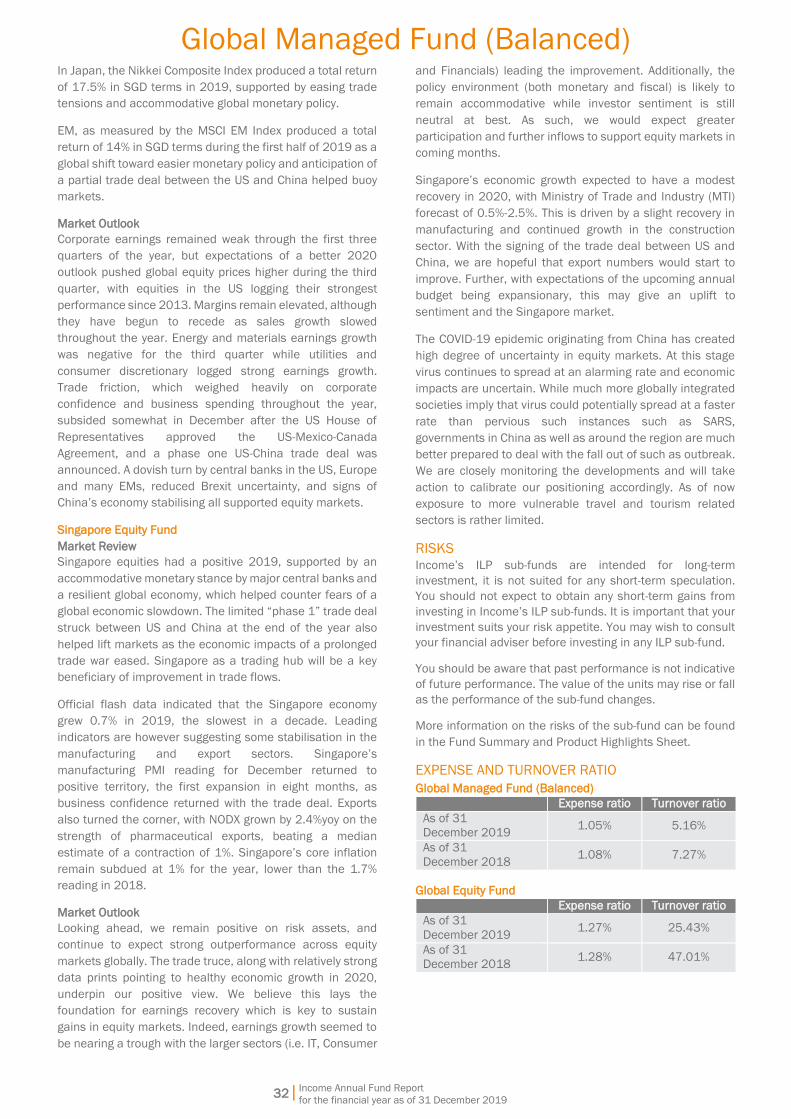
Income Annual Fund Report
for the financial year as of 31 December 2019
32|
Global Managed Fund (Balanced)
In Japan, the Nikkei Composite Index produced a total return
of 17.5% in SGD terms in 2019, supported by easing trade
tensions and accommodative global monetary policy.
EM, as measured by the MSCI EM Index produced a total
return of 14% in SGD terms during the first half of 2019 as a
global shift toward easier monetary policy and anticipation of
a partial trade deal between the US and China helped buoy
markets.
Market Outlook Corporate earnings remained weak through the first three
quarters of the year, but expectations of a better 2020
outlook pushed global equity prices higher during the third
quarter, with equities in the US logging their strongest
performance since 2013. Margins remain elevated, although
they have begun to recede as sales growth slowed
throughout the year. Energy and materials earnings growth
was negative for the third quarter while utilities and
consumer discretionary logged strong earnings growth.
Trade friction, which weighed heavily on corporate
confidence and business spending throughout the year,
subsided somewhat in December after the US House of
Representatives approved the US-Mexico-Canada
Agreement, and a phase one US-China trade deal was
announced. A dovish turn by central banks in the US, Europe
and many EMs, reduced Brexit uncertainty, and signs of
China’s economy stabilising all supported equity markets.
Singapore Equity Fund Market Review Singapore equities had a positive 2019, supported by an
accommodative monetary stance by major central banks and
a resilient global economy, which helped counter fears of a
global economic slowdown. The limited “phase 1” trade deal
struck between US and China at the end of the year also
helped lift markets as the economic impacts of a prolonged
trade war eased. Singapore as a trading hub will be a key
beneficiary of improvement in trade flows.
Official flash data indicated that the Singapore economy
grew 0.7% in 2019, the slowest in a decade. Leading
indicators are however suggesting some stabilisation in the
manufacturing and export sectors. Singapore’s
manufacturing PMI reading for December returned to
positive territory, the first expansion in eight months, as
business confidence returned with the trade deal. Exports
also turned the corner, with NODX grown by 2.4%yoy on the
strength of pharmaceutical exports, beating a median
estimate of a contraction of 1%. Singapore’s core inflation
remain subdued at 1% for the year, lower than the 1.7%
reading in 2018.
Market Outlook Looking ahead, we remain positive on risk assets, and
continue to expect strong outperformance across equity
markets globally. The trade truce, along with relatively strong
data prints pointing to healthy economic growth in 2020,
underpin our positive view. We believe this lays the
foundation for earnings recovery which is key to sustain
gains in equity markets. Indeed, earnings growth seemed to
be nearing a trough with the larger sectors (i.e. IT, Consumer
and Financials) leading the improvement. Additionally, the
policy environment (both monetary and fiscal) is likely to
remain accommodative while investor sentiment is still
neutral at best. As such, we would expect greater
participation and further inflows to support equity markets in
coming months.
Singapore’s economic growth expected to have a modest
recovery in 2020, with Ministry of Trade and Industry (MTI)
forecast of 0.5%-2.5%. This is driven by a slight recovery in
manufacturing and continued growth in the construction
sector. With the signing of the trade deal between US and
China, we are hopeful that export numbers would start to
improve. Further, with expectations of the upcoming annual
budget being expansionary, this may give an uplift to
sentiment and the Singapore market.
The COVID-19 epidemic originating from China has created
high degree of uncertainty in equity markets. At this stage
virus continues to spread at an alarming rate and economic
impacts are uncertain. While much more globally integrated
societies imply that virus could potentially spread at a faster
rate than pervious such instances such as SARS,
governments in China as well as around the region are much
better prepared to deal with the fall out of such as outbreak.
We are closely monitoring the developments and will take
action to calibrate our positioning accordingly. As of now
exposure to more vulnerable travel and tourism related
sectors is rather limited.
RISKS
Income’s ILP sub-funds are intended for long-term
investment, it is not suited for any short-term speculation.
You should not expect to obtain any short-term gains from
investing in Income’s ILP sub-funds. It is important that your
investment suits your risk appetite. You may wish to consult
your financial adviser before investing in any ILP sub-fund.
You should be aware that past performance is not indicative
of future performance. The value of the units may rise or fall
as the performance of the sub-fund changes.
More information on the risks of the sub-fund can be found
in the Fund Summary and Product Highlights Sheet.
EXPENSE AND TURNOVER RATIO
Global Managed Fund (Balanced)
Expense ratio Turnover ratio
As of 31
December 2019 1.05% 5.16%
As of 31
December 2018 1.08% 7.27%
Global Equity Fund
Expense ratio Turnover ratio
As of 31
December 2019 1.27% 25.43%
As of 31
December 2018 1.28% 47.01%
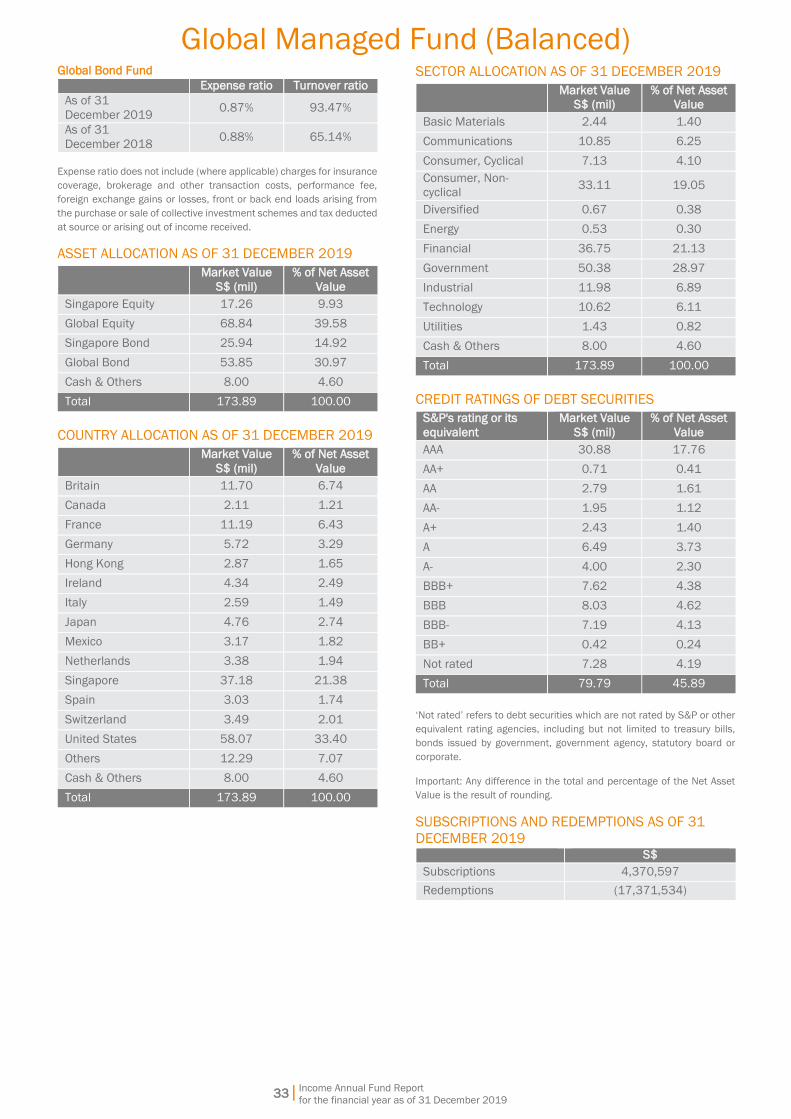
Income Annual Fund Report
for the financial year as of 31 December 2019
33|
Global Managed Fund (Balanced)
Global Bond Fund
Expense ratio Turnover ratio
As of 31
December 2019 0.87% 93.47%
As of 31
December 2018 0.88% 65.14%
Expense ratio does not include (where applicable) charges for insurance
coverage, brokerage and other transaction costs, performance fee,
foreign exchange gains or losses, front or back end loads arising from
the purchase or sale of collective investment schemes and tax deducted
at source or arising out of income received.
ASSET ALLOCATION AS OF 31 DECEMBER 2019
Market Value
S$ (mil)
% of Net Asset
Value
Singapore Equity 17.26 9.93
Global Equity 68.84 39.58
Singapore Bond 25.94 14.92
Global Bond 53.85 30.97
Cash & Others 8.00 4.60
Total 173.89 100.00
COUNTRY ALLOCATION AS OF 31 DECEMBER 2019
Market Value
S$ (mil)
% of Net Asset
Value
Britain 11.70 6.74
Canada 2.11 1.21
France 11.19 6.43
Germany 5.72 3.29
Hong Kong 2.87 1.65
Ireland 4.34 2.49
Italy 2.59 1.49
Japan 4.76 2.74
Mexico 3.17 1.82
Netherlands 3.38 1.94
Singapore 37.18 21.38
Spain 3.03 1.74
Switzerland 3.49 2.01
United States 58.07 33.40
Others 12.29 7.07
Cash & Others 8.00 4.60
Total 173.89 100.00
SECTOR ALLOCATION AS OF 31 DECEMBER 2019
Market Value
S$ (mil)
% of Net Asset
Value
Basic Materials 2.44 1.40
Communications 10.85 6.25
Consumer, Cyclical 7.13 4.10
Consumer, Non-
cyclical 33.11 19.05
Diversified 0.67 0.38
Energy 0.53 0.30
Financial 36.75 21.13
Government 50.38 28.97
Industrial 11.98 6.89
Technology 10.62 6.11
Utilities 1.43 0.82
Cash & Others 8.00 4.60
Total 173.89 100.00
CREDIT RATINGS OF DEBT SECURITIES
S&P's rating or its
equivalent
Market Value
S$ (mil)
% of Net Asset
Value
AAA 30.88 17.76
AA+ 0.71 0.41
AA 2.79 1.61
AA- 1.95 1.12
A+ 2.43 1.40
A 6.49 3.73
A- 4.00 2.30
BBB+ 7.62 4.38
BBB 8.03 4.62
BBB- 7.19 4.13
BB+ 0.42 0.24
Not rated 7.28 4.19
Total 79.79 45.89
‘Not rated’ refers to debt securities which are not rated by S&P or other
equivalent rating agencies, including but not limited to treasury bills,
bonds issued by government, government agency, statutory board or
corporate.
Important: Any difference in the total and percentage of the Net Asset
Value is the result of rounding.
SUBSCRIPTIONS AND REDEMPTIONS AS OF 31
DECEMBER 2019 S$
Subscriptions 4,370,597
Redemptions (17,371,534)

Income Annual Fund Report
for the financial year as of 31 December 2019
34|
Global Managed Fund (Balanced)
EXPOSURE TO DERIVATIVES
More information can be found in the respective Fund
Reports of Singapore Equity Fund, Singapore Bond Fund,
Global Equity Fund and Global Bond Fund.
INVESTMENT IN COLLECTIVE INVESTMENT SCHEMES
December 2019
Market
Value
S$ (mil)
% of Net
Asset
Value
Global Equity Fund 69.30 39.85
Global Bond Fund 61.04 35.10
Singapore Bond Fund 26.12 15.02
Singapore Equity Fund 17.43 10.03
BORROWINGS
Nil.
RELATED PARTY DISCLOSURE
Income is the Investment Manager of the sub-fund. During
the financial period ended 31 December 2019,
management fee paid or payable by the sub-fund to the
Investment Manager is S$1,601,309.
Fullerton is the Sub-Investment Manager of the Singapore
Bond Fund and Singapore Equity Fund, which the sub-fund
invests into. During the financial period ended 31 December
2019, they managed S$32,781,795, equivalent to 18.85%
of its net asset value.
SOFT DOLLAR COMMISSION OR ARRANGEMENT
The Manager did not retain for its own account cash or
commission rebates arising out of transactions executed in
or outside Singapore. Soft dollar commission/arrangement
had been received/entered into by the Manager in respect of
the sub-fund. The soft dollar commission/arrangement
relates essentially to research services, economic and
political analyses, portfolio analyses, market analyses, data
and quotation services, computer hardware and software
used for and in support of the investment process. The
Manager did not accept or enter into soft dollar
commission/arrangement unless such commission
/arrangement would, in the opinion of the Manager, assist
the Manager in the management of the sub-fund. The
Manager confirmed that trades were made on best execution
basis, that is, the Manager took all reasonable steps to
obtain the best possible result for the sub-fund, taking into
account the following execution factors: price, costs, speed,
likelihood of execution and settlement, size, nature or any
other consideration relevant to the execution of a trade or
transaction, and there was no churning of trades. The said
brokers had also executed trades for other sub-funds
managed by the Manager.
More information can be found in the respective Fund
Reports of Singapore Equity Fund, Singapore Bond Fund,
Global Equity Fund and Global Bond Fund.
CONFLICTS OF INTEREST
As the Manager of various Income ILP sub-funds and
insurance funds, we may from time to time have to deal with
competing or conflicting interests between these sub-
funds/insurance funds. However, we will use all reasonable
endeavours to act fairly and in the best interest of the sub-
fund. We will conduct all transactions with or for the sub-fund
on an arm’s length basis. The Manager has in place policies
and procedures to monitor and mitigate conflicts of interests
which may arise in the management of these sub-funds. We
believe that these policies and procedures are reasonably
designed to ensure that portfolio management decisions are
made in the best interest of the sub-fund and each sub-fund
is treated fairly, regardless of the existence of any conflict.
More information can be found in the respective Fund
Reports of Singapore Equity Fund, Singapore Bond Fund,
Global Equity Fund and Global Bond Fund.
OTHER PARTIES
The auditor of this sub-fund is KPMG LLP. Please note that
financial results ending 31 December of each year will be
audited.
MATERIAL INFORMATION
Nil.
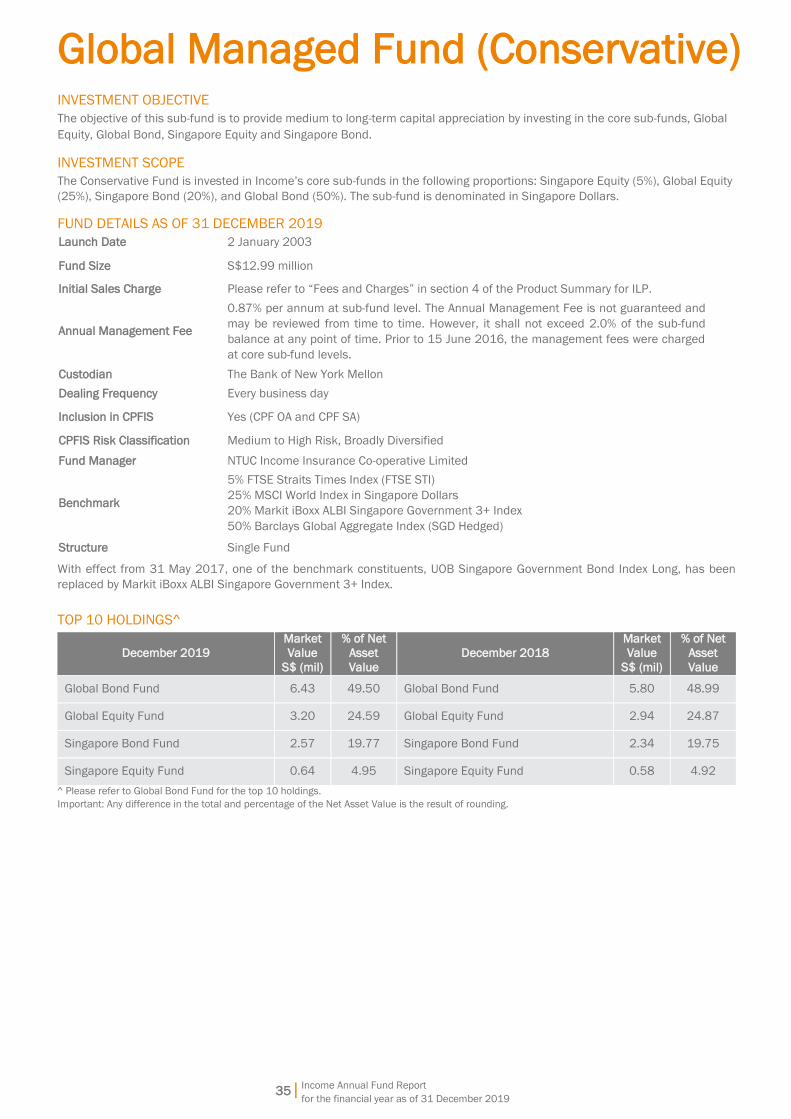
35|
Global Managed Fund (Conservative)
Income Annual Fund Report
for the financial year as of 31 December 2019
INVESTMENT OBJECTIVE
The objective of this sub-fund is to provide medium to long-term capital appreciation by investing in the core sub-funds, Global
Equity, Global Bond, Singapore Equity and Singapore Bond.
INVESTMENT SCOPE
The Conservative Fund is invested in Income’s core sub-funds in the following proportions: Singapore Equity (5%), Global Equity
(25%), Singapore Bond (20%), and Global Bond (50%). The sub-fund is denominated in Singapore Dollars.
FUND DETAILS AS OF 31 DECEMBER 2019
Launch Date 2 January 2003
Fund Size S$12.99 million
Initial Sales Charge Please refer to “Fees and Charges” in section 4 of the Product Summary for ILP.
Annual Management Fee
0.87% per annum at sub-fund level. The Annual Management Fee is not guaranteed and
may be reviewed from time to time. However, it shall not exceed 2.0% of the sub-fund
balance at any point of time. Prior to 15 June 2016, the management fees were charged
at core sub-fund levels.
Custodian The Bank of New York Mellon
Dealing Frequency Every business day
Inclusion in CPFIS Yes (CPF OA and CPF SA)
CPFIS Risk Classification Medium to High Risk, Broadly Diversified
Fund Manager NTUC Income Insurance Co-operative Limited
Benchmark
5% FTSE Straits Times Index (FTSE STI)
25% MSCI World Index in Singapore Dollars
20% Markit iBoxx ALBI Singapore Government 3+ Index
50% Barclays Global Aggregate Index (SGD Hedged)
Structure Single Fund
With effect from 31 May 2017, one of the benchmark constituents, UOB Singapore Government Bond Index Long, has been
replaced by Markit iBoxx ALBI Singapore Government 3+ Index.
TOP 10 HOLDINGS^
December 2019
Market
Value
S$ (mil)
% of Net
Asset
Value
December 2018
Market
Value
S$ (mil)
% of Net
Asset
Value
Global Bond Fund 6.43 49.50 Global Bond Fund 5.80 48.99
Global Equity Fund 3.20 24.59 Global Equity Fund 2.94 24.87
Singapore Bond Fund 2.57 19.77 Singapore Bond Fund 2.34 19.75
Singapore Equity Fund 0.64 4.95 Singapore Equity Fund 0.58 4.92
^ Please refer to Global Bond Fund for the top 10 holdings.
Important: Any difference in the total and percentage of the Net Asset Value is the result of rounding.
36|
Global Managed Fund (Conservative)
Income Annual Fund Report
for the financial year as of 31 December 2019
FUND MANAGER
NTUC Income Insurance Co-operative Limited is the
Investment Manager of the sub-fund.
The sub-fund invests in the Singapore Equity Fund,
Singapore Bond Fund, Global Equity Fund and Global Bond
Fund. The Investment Manager for these sub-funds is NTUC
Income Insurance Co-operative Limited. The Sub-Investment
Managers of the Singapore Equity Fund are Fullerton Fund
Management Company Ltd and State Street Global Advisors
Singapore Limited. The Sub-Investment Managers of the
Global Bond Fund and Singapore Bond Fund is Amundi
Singapore Limited and Fullerton Fund Management
Company Ltd respectively. The Sub-Investment Managers of
the Global Equity Fund are Morgan Stanley Investment
Management Company, MFS International Singapore Pte Ltd,
and Wellington Management Singapore Pte Ltd.
Further information on the underlying core sub-funds,
Singapore Equity, Singapore Bond, Global Equity, and Global
Bond, can be found in the respective Product Highlights
Sheets and Fund Summaries on our website
www.income.com.sg/fund/coopprices.asp.
NTUC Income Insurance Co-operative Limited (Income)
Income was established in 1970 to make essential
insurance accessible to all Singaporeans. Today, Income is
the leading composite insurer in Singapore offering life,
health and general insurance. Our wide network of financial
advisers and partners provide value-added financial advisory
that complements today’s digital-first landscape, offering
insurance products and services that serve the protection,
savings and investment needs of customers at different
stages and across all segments of society.
As of 31 December 2019, Income had S$40.45 billion in
assets under management. Our financial strength and
diversified investment portfolio are reflected by our strong
credit ratings and predicated on our core investment
philosophy of value, prudence and discipline.
Amundi Singapore Limited
Amundi Singapore Limited is a wholly-owned subsidiary of
Amundi Asset Management. It was established in Singapore
in 1989 as a business hub for Amundi’s group operations in
South East Asia. Amundi Singapore Limited is licensed and
regulated by the Monetary Authority of Singapore and has
been managing collective investment schemes and/or
discretionary funds since 1989. It is also one of Amundi’s
group investment centres responsible for Asian investment
management. Amundi manages €1.65 trillion euros of
assets as of 31 December 2019.
Morgan Stanley Investment Management Company (MSIM)
MSIM was established in 1975 as a subsidiary of Morgan
Stanley Group Inc. As of December 31, 2019, MSIM employs
711 investment professionals worldwide in 23 countries and
offers its clients personalised attention, the intelligence and
creativity of some of the brightest professionals in the
industry and access to the global resources of Morgan
Stanley. As of December 31, 2019, MSIM managed US$552
billion in assets for its clients.
MFS International Singapore Pte Ltd^
MFS International Singapore Pte Ltd is incorporated in
Singapore and is authorised under a capital market service
license with the Monetary Authority of Singapore to provide
fund management services. MFS has been managing pooled
vehicles/investment funds and/or discretionary funds in
Singapore since 1997. MFS Investment Management
(parent company of MFS International Singapore Pte Ltd)
was founded in 1924. Asset under management totalled
US$526 billion as of 31 December 2019. MFS believes in
active bottom-up research aimed at consistently identifying
high-quality investments by focusing on companies that have
potential to generate above-average and sustainable
earnings. MFS has a global network of research analysts and
portfolio managers based in Boston, Toronto, Mexico City,
London, Tokyo, Hong Kong, Singapore and Sydney.
^Prior to November 2013, MFS was operating as a branch of MFS
International limited and was an exempted fund manager under the
Singaporean regulatory regime.
Wellington Management Singapore Pte Ltd (WMS)*
WMS is an affiliate of Wellington Management Company LLP
(WMS, Wellington Management Company LLP and the other
affiliates of Wellington Management Company LLP are
collectively referred to as WMC). With US$1.1 trillion in
assets under management, WMC serves as an investment
adviser to over 2,200 clients located in more than 60
countries, as of 31 December 2019. WMC’s singular focus is
investments — from global equities and fixed income to
currencies and commodities. WMC describes themselves as
a community of teams that create solutions designed to
respond to specific client needs. WMC’s most distinctive
strength is their proprietary, independent research, which is
shared across all areas of the organisation and used only for
managing clients' portfolios. Tracing its roots to the founding
of Wellington Fund in 1928, the firm has offices in Boston,
Massachusetts; Chicago, Illinois; Radnor, Pennsylvania; San
Francisco, California; Toronto, Canada; Beijing; Frankfurt;
Hong Kong; London; Singapore; Sydney; Tokyo; Luxembourg
and Zurich.
*With effect from 29 April 2016, WMS has replaced Trust Company of
the West (TCW) Asset Management Company as the Sub-Investment
Manager of the Global Technology Fund.
State Street Global Advisors Singapore Limited (SSGA)
For four decades, State Street Global Advisors has served
the world’s governments, institutions and financial advisors.
With a rigorous, risk-aware approach built on research,
analysis and market-tested experience, we build from a
breadth of active and index strategies to create cost-effective
solutions. As stewards, we help portfolio companies see that
what is fair for people and sustainable for the planet can
deliver long-term performance. And, as pioneers in index,
ETF, and ESG investing, we are always inventing new ways to
invest. As a result, we have become the world’s third largest
asset manager with nearly US$3.12 trillion* under our care.
*This figure is presented as of December 31, 2019 and includes
approximately $45 billion of assets with respect to SPDR products for
which State Street Global Advisors Funds Distributors, LLC (SSGA FD)
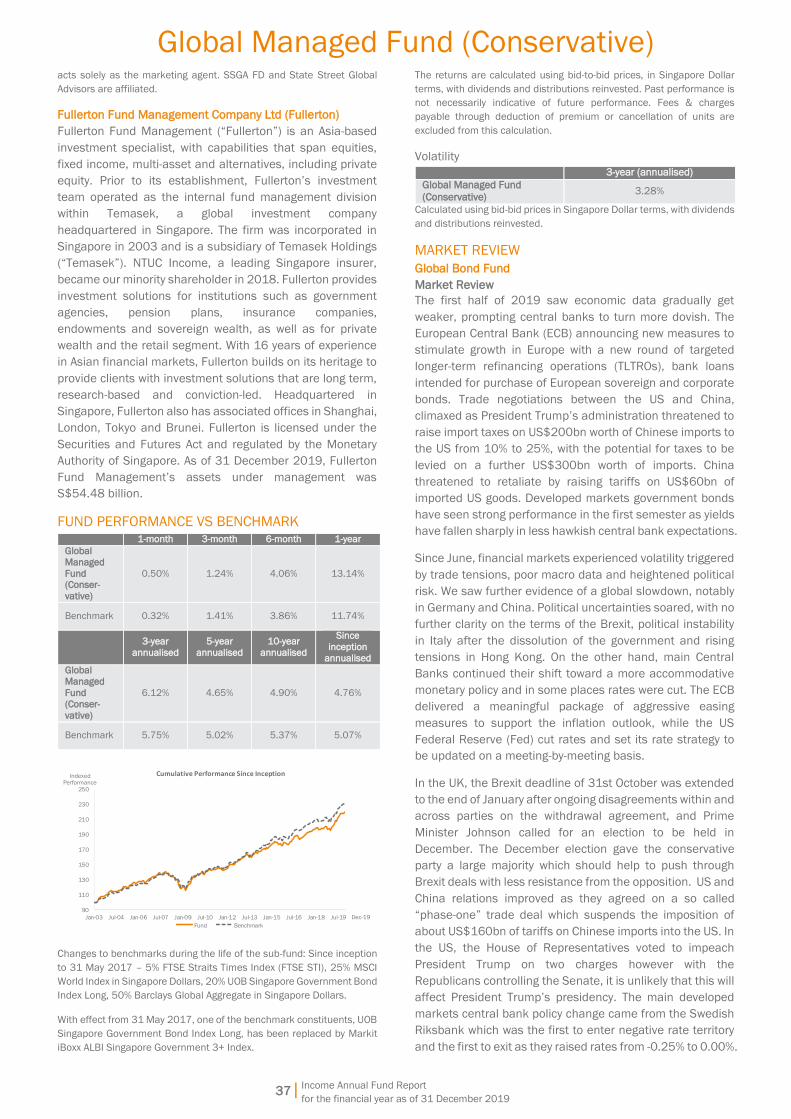
37|
Global Managed Fund (Conservative)
Income Annual Fund Report
for the financial year as of 31 December 2019
acts solely as the marketing agent. SSGA FD and State Street Global
Advisors are affiliated.
Fullerton Fund Management Company Ltd (Fullerton)
Fullerton Fund Management (“Fullerton”) is an Asia-based
investment specialist, with capabilities that span equities,
fixed income, multi-asset and alternatives, including private
equity. Prior to its establishment, Fullerton’s investment
team operated as the internal fund management division
within Temasek, a global investment company
headquartered in Singapore. The firm was incorporated in
Singapore in 2003 and is a subsidiary of Temasek Holdings
(“Temasek”). NTUC Income, a leading Singapore insurer,
became our minority shareholder in 2018. Fullerton provides
investment solutions for institutions such as government
agencies, pension plans, insurance companies,
endowments and sovereign wealth, as well as for private
wealth and the retail segment. With 16 years of experience
in Asian financial markets, Fullerton builds on its heritage to
provide clients with investment solutions that are long term,
research-based and conviction-led. Headquartered in
Singapore, Fullerton also has associated offices in Shanghai,
London, Tokyo and Brunei. Fullerton is licensed under the
Securities and Futures Act and regulated by the Monetary
Authority of Singapore. As of 31 December 2019, Fullerton
Fund Management’s assets under management was
S$54.48 billion.
FUND PERFORMANCE VS BENCHMARK 1-month 3-month 6-month 1-year
Global
Managed
Fund (Conser-
vative)
0.50% 1.24% 4.06% 13.14%
Benchmark 0.32% 1.41% 3.86% 11.74%
3-year
annualised
5-year
annualised
10-year
annualised
Since
inception
annualised
Global
Managed
Fund
(Conser-
vative)
6.12% 4.65% 4.90% 4.76%
Benchmark 5.75% 5.02% 5.37% 5.07%
90
110
130
150
170
190
210
230
250
Jan-03 Jul-04 Jan-06 Jul-07 Jan-09 Jul-10 Jan-12 Jul-13 Jan-15 Jul-16 Jan-18 Jul-19
Cumulative Performance Since Inception
Fund Benchmark
Dec-19
IndexedPerformance
Changes to benchmarks during the life of the sub-fund: Since inception
to 31 May 2017 – 5% FTSE Straits Times Index (FTSE STI), 25% MSCI
World Index in Singapore Dollars, 20% UOB Singapore Government Bond
Index Long, 50% Barclays Global Aggregate in Singapore Dollars.
With effect from 31 May 2017, one of the benchmark constituents, UOB
Singapore Government Bond Index Long, has been replaced by Markit
iBoxx ALBI Singapore Government 3+ Index.
The returns are calculated using bid-to-bid prices, in Singapore Dollar
terms, with dividends and distributions reinvested. Past performance is
not necessarily indicative of future performance. Fees & charges
payable through deduction of premium or cancellation of units are
excluded from this calculation.
Volatility
3-year (annualised)
Global Managed Fund
(Conservative) 3.28%
Calculated using bid-bid prices in Singapore Dollar terms, with dividends
and distributions reinvested.
MARKET REVIEW
Global Bond Fund Market Review The first half of 2019 saw economic data gradually get
weaker, prompting central banks to turn more dovish. The
European Central Bank (ECB) announcing new measures to
stimulate growth in Europe with a new round of targeted
longer-term refinancing operations (TLTROs), bank loans
intended for purchase of European sovereign and corporate
bonds. Trade negotiations between the US and China,
climaxed as President Trump’s administration threatened to
raise import taxes on US$200bn worth of Chinese imports to
the US from 10% to 25%, with the potential for taxes to be
levied on a further US$300bn worth of imports. China
threatened to retaliate by raising tariffs on US$60bn of
imported US goods. Developed markets government bonds
have seen strong performance in the first semester as yields
have fallen sharply in less hawkish central bank expectations.
Since June, financial markets experienced volatility triggered
by trade tensions, poor macro data and heightened political
risk. We saw further evidence of a global slowdown, notably
in Germany and China. Political uncertainties soared, with no
further clarity on the terms of the Brexit, political instability
in Italy after the dissolution of the government and rising
tensions in Hong Kong. On the other hand, main Central
Banks continued their shift toward a more accommodative
monetary policy and in some places rates were cut. The ECB
delivered a meaningful package of aggressive easing
measures to support the inflation outlook, while the US
Federal Reserve (Fed) cut rates and set its rate strategy to
be updated on a meeting-by-meeting basis.
In the UK, the Brexit deadline of 31st October was extended
to the end of January after ongoing disagreements within and
across parties on the withdrawal agreement, and Prime
Minister Johnson called for an election to be held in
December. The December election gave the conservative
party a large majority which should help to push through
Brexit deals with less resistance from the opposition. US and
China relations improved as they agreed on a so called
“phase-one” trade deal which suspends the imposition of
about US$160bn of tariffs on Chinese imports into the US. In
the US, the House of Representatives voted to impeach
President Trump on two charges however with the
Republicans controlling the Senate, it is unlikely that this will
affect President Trump’s presidency. The main developed
markets central bank policy change came from the Swedish
Riksbank which was the first to enter negative rate territory
and the first to exit as they raised rates from -0.25% to 0.00%.

38|
Global Managed Fund (Conservative)
Income Annual Fund Report
for the financial year as of 31 December 2019
Further afield, the quarter saw widespread social and
political unrest in Argentina, Bolivia and Chile as protests
took place against a widening wealth gap between the
richest and the average population in addition to disputed
elections.
Market Outlook For 2020 we currently see five key themes that could have
significant impact on the markets. We see fiscal and
monetary easing across developed markets which could
provide a welcome tailwind that with tactical opportunities.
The global assessment of trade dynamics is impacting areas
and countries differently, with some emerging markets (EM)
possibly benefitting as trade that would have gone to China
becomes diverted to other countries. We expect China to
decelerate but to manage the slower growth by addressing
productivity growth, while avoiding a credit bubble burst.
There is some spill over from manufacturing to services, but
US consumers will remain sufficiently resilient in 2020 due
to healthier household balance sheet. Global earnings per
share growth is expected in the lower single digit space.
Currency dynamics and spreads are the main areas to
monitor, as the materialisation of downside risk might be
sudden and impactful in a world washed by government and
corporate debt. With a good balance of positives and risks
expected to materialise in 2020, the ability and flexibility to
quickly allocate risk across a wide spectrum of assets to
where it will reap the largest rewards remains critical.
We are currently overall underweight duration, particularly on
the shorter end of the curve. Geographically, we are
underweight duration in the Eurozone and Japan whilst being
overweight USD-denominated duration. We remain
overweight investment grade corporate bonds as they still
offer a decent pick-up over government bonds, we also hold
selective allocations to EM bonds. Within currencies, we are
underweight the USD with an overweight allocation to the
EUR which stands to grow on improved growth expectations.
In addition, we hold overweight allocations to select high
yielding EM currencies like the MXN, TRY and RUB. We are
underweight the USD which we view as being fully priced in.
Singapore Bond Fund Market Review Global markets were roiled by political events in 2019,
including the protracted US-China trade war and Brexit
concerns, in addition to worries of a global growth slowdown.
Despite this, most financial markets, including Asian bond
markets, closed the year on a strong note as central banks
globally pledged monetary policy support and boosted fiscal
efforts. As the year comes to a close, financial markets were
further supported by a benign inflation backdrop, fading risk
of a hard Brexit, and the agreement of a Phase One trade
deal between the US and China in December.
Central banks across Asia have followed the Fed’s dovish tilt
in 2019, in aggressively lowering borrowing costs as growth
slows. Countries such as Thailand, India, Indonesia, the
Philippines, South Korea, and Malaysia are among those that
have front loaded easier monetary policy in 2019 and the
pace of cuts is likely to be more modest from hereon.
Importantly, fiscal policy in Asia remained supportive,
cushioning domestic demand and offset the drag from the
external sectors.
In Singapore, advance estimates showed that Singapore’s
economy grew by 0.8%yoy in 4Q2019, bringing the full year
gross domestic product (GDP) growth for 2019 to 0.7%yoy.
On the inflation front, consumer price index (CPI) inflation
inched up slightly to 0.6% est. for 2019, from 0.4% in 2018.
Core inflation is projected to ease to 1.1%. On the exports
front, Singapore’s non-oil domestic exports (NODX)
registered a growth of 2.4%yoy in December, marking an
encouraging end to a difficult year.
Market Outlook Risk assets are off to a good start in 2020, following positive
developments on the trade front and nascent indicators of
stabilising global growth. In Asia, the latest regional
purchasing managers index (PMI) have improved, with South
Korea, Thailand and Taiwan among those in expansionary
territory. In China, new export orders have risen and are now
in expansion territory, reflecting reduced trade tensions and
firmer external demand.
Similarly in Singapore, we expect modest growth recovery in
2020, spurred by the reprieve in US-China trade tensions.
The recent uptick in higher-frequency indicators such as
industrial production and NODX are also encouraging.
Inflation is likely to remain stable on the back of the steady
supply in food and commodities, and lower wage growth. The
modest growth environment coupled with negative output
gap will also limit the pass though effect.
Against such a backdrop, we are keeping to a modest
underweight in duration as Singapore bond yields may edge
higher, in tandem with rising US Treasury yields in the near
term, given firmer risk sentiments. The yield curve is also
likely to steepen, given some front-loading of long-end SGS
supply in Q12020. We continue to allocate to overall credit
beta as an expression of our positive risk disposition and
sidelined SGD agencies (on expensive relative valuations).
That said, we may re-engage the SGD agency markets should
spreads widen out.
Global Equity Fund Market Review Global equities, as measured by the MSCI World Index,
produced a total return of 22.8% in SGD terms in 2019.
Easier global monetary policy, anticipation of a phase one
trade deal between China and the US and receding risks of a
near-term no deal Brexit helped propel the market.
The US S&P 500 index produced a total return of 23.7% in
SGD terms in 2019. A trio of rate cuts from the Fed, along
with the resumption of Treasury bill purchases by the Fed to
pump additional reserves into money markets were
supportive from a monetary policy perspective while easing
geopolitical and trade tensions contributed to the year's
strong performance.
European stocks, as measured by the STOXX Europe 50
Index, returned 25% in SGD terms in 2019. Fading fears of a
39|
Global Managed Fund (Conservative)
Income Annual Fund Report
for the financial year as of 31 December 2019
no deal Brexit, anticipation of a US-China trade agreement
and additional monetary policy accommodation from the
ECB underpinned performance.
In Japan, the Nikkei Composite Index produced a total return
of 17.5% in SGD terms in 2019, supported by easing trade
tensions and accommodative global monetary policy.
EM, as measured by the MSCI EM Index produced a total
return of 14% in SGD terms during the first half of 2019 as a
global shift toward easier monetary policy and anticipation of
a partial trade deal between the US and China helped buoy
markets.
Market Outlook Corporate earnings remained weak through the first three
quarters of the year, but expectations of a better 2020
outlook pushed global equity prices higher during the third
quarter, with equities in the US logging their strongest
performance since 2013. Margins remain elevated, although
they have begun to recede as sales growth slowed
throughout the year. Energy and materials earnings growth
was negative for the third quarter while utilities and
consumer discretionary logged strong earnings growth.
Trade friction, which weighed heavily on corporate
confidence and business spending throughout the year,
subsided somewhat in December after the US House of
Representatives approved the US-Mexico-Canada
Agreement, and a phase one US-China trade deal was
announced. A dovish turn by central banks in the US, Europe
and many EMs, reduced Brexit uncertainty, and signs of
China’s economy stabilising all supported equity markets.
Singapore Equity Fund Market Review Singapore equities had a positive 2019, supported by an
accommodative monetary stance by major central banks
and a resilient global economy, which helped counter fears
of a global economic slowdown. The limited “phase 1” trade
deal struck between US and China at the end of the year also
helped lift markets as the economic impacts of a prolonged
trade war eased. Singapore as a trading hub will be a key
beneficiary of improvement in trade flows.
Official flash data indicated that the Singapore economy
grew 0.7% in 2019, the slowest in a decade. Leading
indicators are however suggesting some stabilisation in the
manufacturing and export sectors. Singapore’s
manufacturing PMI reading for December returned to
positive territory, the first expansion in eight months, as
business confidence returned with the trade deal. Exports
also turned the corner, with NODX grown by 2.4%yoy on the
strength of pharmaceutical exports, beating a median
estimate of a contraction of 1%. Singapore’s core inflation
remain subdued at 1% for the year, lower than the 1.7%
reading in 2018.
Market Outlook Looking ahead, we remain positive on risk assets, and
continue to expect strong outperformance across equity
markets globally. The trade truce, along with relatively strong
data prints pointing to healthy economic growth in 2020,
underpin our positive view. We believe this lays the
foundation for earnings recovery which is key to sustain
gains in equity markets. Indeed, earnings growth seemed to
be nearing a trough with the larger sectors (i.e. IT, Consumer
and Financials) leading the improvement. Additionally, the
policy environment (both monetary and fiscal) is likely to
remain accommodative while investor sentiment is still
neutral at best. As such, we would expect greater
participation and further inflows to support equity markets in
coming months.
Singapore’s economic growth expected to have a modest
recovery in 2020, with Ministry of Trade and Industry (MTI)
forecast of 0.5%-2.5%. This is driven by a slight recovery in
manufacturing and continued growth in the construction
sector. With the signing of the trade deal between US and
China, we are hopeful that export numbers would start to
improve. Further, with expectations of the upcoming annual
budget being expansionary, this may give an uplift to
sentiment and the Singapore market.
The COVID-19 epidemic originating from China has created
high degree of uncertainty in equity markets. At this stage
virus continues to spread at an alarming rate and economic
impacts are uncertain. While much more globally integrated
societies imply that virus could potentially spread at a faster
rate than pervious such instances such as SARS,
governments in China as well as around the region are much
better prepared to deal with the fall out of such as outbreak.
We are closely monitoring the developments and will take
action to calibrate our positioning accordingly. As of now
exposure to more vulnerable travel and tourism related
sectors is rather limited.
RISKS
Income’s ILP sub-funds are intended for long-term
investment, it is not suited for any short-term speculation.
You should not expect to obtain any short-term gains from
investing in Income’s ILP sub-funds. It is important that your
investment suits your risk appetite. You may wish to consult
your financial adviser before investing in any ILP sub-fund.
You should be aware that past performance is not indicative
of future performance. The value of the units may rise or fall
as the performance of the sub-fund changes.
More information on the risks of the sub-fund can be found
in the Fund Summary and Product Highlights Sheet.
EXPENSE AND TURNOVER RATIO
Global Managed Fund (Conservative)
Expense ratio Turnover ratio
As of 31
December 2019 0.97% 4.65%
As of 31
December 2018 1.00% 4.50%
Global Bond Fund
Expense ratio Turnover ratio
As of 31
December 2019 0.87% 93.47%
As of 31
December 2018 0.88% 65.14%
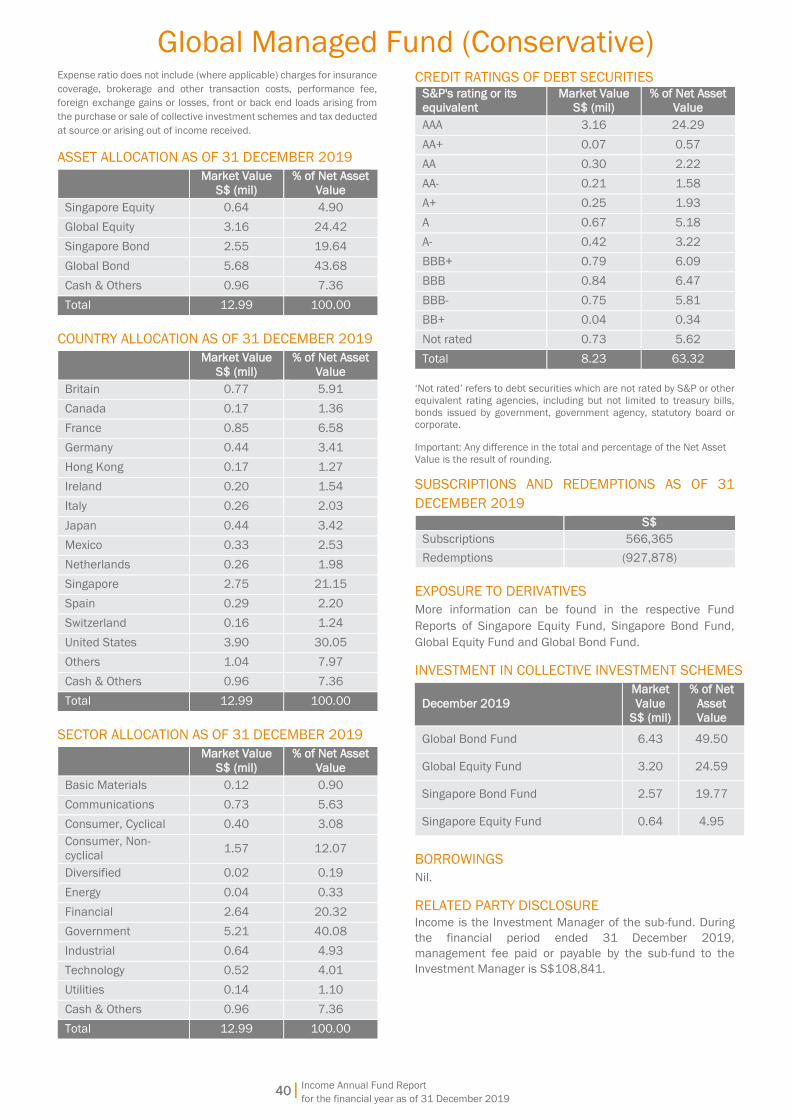
40|
Global Managed Fund (Conservative)
Income Annual Fund Report
for the financial year as of 31 December 2019
Expense ratio does not include (where applicable) charges for insurance
coverage, brokerage and other transaction costs, performance fee,
foreign exchange gains or losses, front or back end loads arising from
the purchase or sale of collective investment schemes and tax deducted
at source or arising out of income received.
ASSET ALLOCATION AS OF 31 DECEMBER 2019
Market Value
S$ (mil)
% of Net Asset
Value
Singapore Equity 0.64 4.90
Global Equity 3.16 24.42
Singapore Bond 2.55 19.64
Global Bond 5.68 43.68
Cash & Others 0.96 7.36
Total 12.99 100.00
COUNTRY ALLOCATION AS OF 31 DECEMBER 2019
Market Value
S$ (mil)
% of Net Asset
Value
Britain 0.77 5.91
Canada 0.17 1.36
France 0.85 6.58
Germany 0.44 3.41
Hong Kong 0.17 1.27
Ireland 0.20 1.54
Italy 0.26 2.03
Japan 0.44 3.42
Mexico 0.33 2.53
Netherlands 0.26 1.98
Singapore 2.75 21.15
Spain 0.29 2.20
Switzerland 0.16 1.24
United States 3.90 30.05
Others 1.04 7.97
Cash & Others 0.96 7.36
Total 12.99 100.00
SECTOR ALLOCATION AS OF 31 DECEMBER 2019
Market Value
S$ (mil)
% of Net Asset
Value
Basic Materials 0.12 0.90
Communications 0.73 5.63
Consumer, Cyclical 0.40 3.08
Consumer, Non-
cyclical 1.57 12.07
Diversified 0.02 0.19
Energy 0.04 0.33
Financial 2.64 20.32
Government 5.21 40.08
Industrial 0.64 4.93
Technology 0.52 4.01
Utilities 0.14 1.10
Cash & Others 0.96 7.36
Total 12.99 100.00
CREDIT RATINGS OF DEBT SECURITIES S&P's rating or its
equivalent
Market Value
S$ (mil)
% of Net Asset
Value
AAA 3.16 24.29
AA+ 0.07 0.57
AA 0.30 2.22
AA- 0.21 1.58
A+ 0.25 1.93
A 0.67 5.18
A- 0.42 3.22
BBB+ 0.79 6.09
BBB 0.84 6.47
BBB- 0.75 5.81
BB+ 0.04 0.34
Not rated 0.73 5.62
Total 8.23 63.32
‘Not rated’ refers to debt securities which are not rated by S&P or other
equivalent rating agencies, including but not limited to treasury bills,
bonds issued by government, government agency, statutory board or
corporate.
Important: Any difference in the total and percentage of the Net Asset
Value is the result of rounding.
SUBSCRIPTIONS AND REDEMPTIONS AS OF 31
DECEMBER 2019
S$
Subscriptions 566,365
Redemptions (927,878)
EXPOSURE TO DERIVATIVES
More information can be found in the respective Fund
Reports of Singapore Equity Fund, Singapore Bond Fund,
Global Equity Fund and Global Bond Fund.
INVESTMENT IN COLLECTIVE INVESTMENT SCHEMES
December 2019
Market
Value
S$ (mil)
% of Net
Asset
Value
Global Bond Fund 6.43 49.50
Global Equity Fund 3.20 24.59
Singapore Bond Fund 2.57 19.77
Singapore Equity Fund 0.64 4.95
BORROWINGS
Nil.
RELATED PARTY DISCLOSURE
Income is the Investment Manager of the sub-fund. During
the financial period ended 31 December 2019,
management fee paid or payable by the sub-fund to the
Investment Manager is S$108,841.

41|
Global Managed Fund (Conservative)
Income Annual Fund Report
for the financial year as of 31 December 2019
Fullerton is the Sub-Investment Manager of the Singapore
Bond Fund and Singapore Equity Fund, which the sub-fund
invests into. During the financial period ended 31 December
2019, they managed S$2,815,022, equivalent to 21.66% of
its net asset value.
SOFT DOLLAR COMMISSION OR ARRANGEMENT
The Manager did not retain for its own account cash or
commission rebates arising out of transactions executed in
or outside Singapore. Soft dollar commission/arrangement
had been received/entered into by the Manager in respect
of the sub-fund. The soft dollar commission/arrangement
relates essentially to research services, economic and
political analyses, portfolio analyses, market analyses, data
and quotation services, computer hardware and software
used for and in support of the investment process. The
Manager did not accept or enter into soft dollar
commission/arrangement unless such commission
/arrangement would, in the opinion of the Manager, assist
the Manager in the management of the sub-fund. The
Manager confirmed that trades were made on best execution
basis, that is, the Manager took all reasonable steps to
obtain the best possible result for the sub-fund, taking into
account the following execution factors: price, costs, speed,
likelihood of execution and settlement, size, nature or any
other consideration relevant to the execution of a trade or
transaction, and there was no churning of trades. The said
brokers had also executed trades for other sub-funds
managed by the Manager.
More information can be found in the respective Fund
Reports of Singapore Equity Fund, Singapore Bond Fund,
Global Equity Fund and Global Bond Fund.
CONFLICTS OF INTEREST
As the Manager of various Income ILP sub-funds and
insurance funds, we may from time to time have to deal with
competing or conflicting interests between these sub-
funds/insurance funds. However, we will use all reasonable
endeavours to act fairly and in the best interest of the sub-
fund. We will conduct all transactions with or for the sub-fund
on an arm’s length basis. The Manager has in place policies
and procedures to monitor and mitigate conflicts of interests
which may arise in the management of these sub-funds. We
believe that these policies and procedures are reasonably
designed to ensure that portfolio management decisions are
made in the best interest of the sub-fund and each sub-fund
is treated fairly, regardless of the existence of any conflict.
More information can be found in the respective Fund
Reports of Singapore Equity Fund, Singapore Bond Fund,
Global Equity Fund and Global Bond Fund.
OTHER PARTIES
The auditor of this sub-fund is KPMG LLP. Please note that
financial results ending 31 December of each year will be
audited.
MATERIAL INFORMATION
Nil.
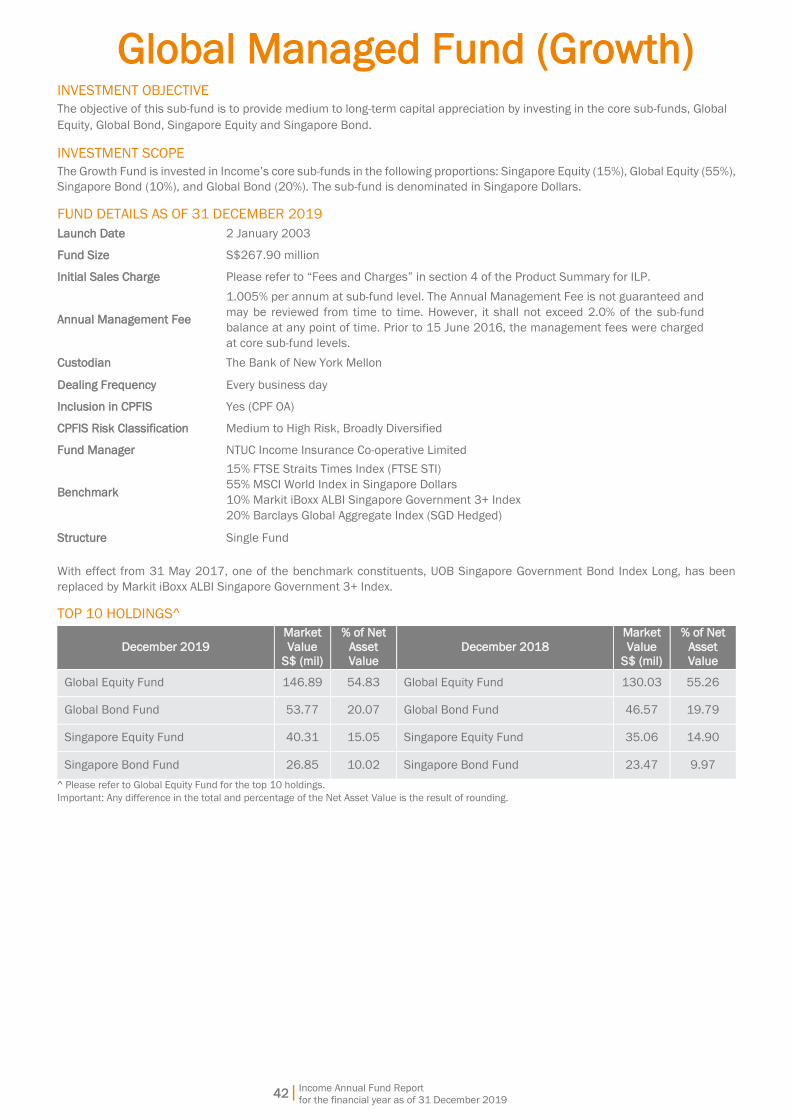
Global Managed Fund (Growth)
Income Annual Fund Report
for the financial year as of 31 December 2019
42|
INVESTMENT OBJECTIVE
The objective of this sub-fund is to provide medium to long-term capital appreciation by investing in the core sub-funds, Global
Equity, Global Bond, Singapore Equity and Singapore Bond.
INVESTMENT SCOPE
The Growth Fund is invested in Income’s core sub-funds in the following proportions: Singapore Equity (15%), Global Equity (55%),
Singapore Bond (10%), and Global Bond (20%). The sub-fund is denominated in Singapore Dollars.
FUND DETAILS AS OF 31 DECEMBER 2019
Launch Date 2 January 2003
Fund Size S$267.90 million
Initial Sales Charge Please refer to “Fees and Charges” in section 4 of the Product Summary for ILP.
Annual Management Fee
1.005% per annum at sub-fund level. The Annual Management Fee is not guaranteed and
may be reviewed from time to time. However, it shall not exceed 2.0% of the sub-fund
balance at any point of time. Prior to 15 June 2016, the management fees were charged
at core sub-fund levels.
Custodian The Bank of New York Mellon
Dealing Frequency Every business day
Inclusion in CPFIS Yes (CPF OA)
CPFIS Risk Classification Medium to High Risk, Broadly Diversified
Fund Manager NTUC Income Insurance Co-operative Limited
Benchmark
15% FTSE Straits Times Index (FTSE STI)
55% MSCI World Index in Singapore Dollars
10% Markit iBoxx ALBI Singapore Government 3+ Index
20% Barclays Global Aggregate Index (SGD Hedged)
Structure Single Fund
With effect from 31 May 2017, one of the benchmark constituents, UOB Singapore Government Bond Index Long, has been
replaced by Markit iBoxx ALBI Singapore Government 3+ Index.
TOP 10 HOLDINGS^
December 2019
Market
Value
S$ (mil)
% of Net
Asset
Value
December 2018
Market
Value
S$ (mil)
% of Net
Asset
Value
Global Equity Fund 146.89 54.83 Global Equity Fund 130.03 55.26
Global Bond Fund 53.77 20.07 Global Bond Fund 46.57 19.79
Singapore Equity Fund 40.31 15.05 Singapore Equity Fund 35.06 14.90
Singapore Bond Fund 26.85 10.02 Singapore Bond Fund 23.47 9.97
^ Please refer to Global Equity Fund for the top 10 holdings.
Important: Any difference in the total and percentage of the Net Asset Value is the result of rounding.

Global Managed Fund (Growth)
Income Annual Fund Report
for the financial year as of 31 December 2019
43|
FUND MANAGER
NTUC Income Insurance Co-operative Limited is the
Investment Manager of the sub-fund.
The sub-fund invests in the Singapore Equity Fund,
Singapore Bond Fund, Global Equity Fund and Global Bond
Fund. The Investment Manager for these sub-funds is NTUC
Income Insurance Co-operative Limited. The Sub-Investment
Managers of the Singapore Equity Fund are Fullerton Fund
Management Company Ltd and State Street Global Advisors
Singapore Limited. The Sub-Investment Managers of the
Global Bond Fund and Singapore Bond Fund is Amundi
Singapore Limited and Fullerton Fund Management
Company Ltd respectively. The Sub-Investment Managers of
the Global Equity Fund are Morgan Stanley Investment
Management Company, MFS International Singapore Pte Ltd,
and Wellington Management Singapore Pte Ltd.
Further information on the underlying core sub-funds,
Singapore Equity, Singapore Bond, Global Equity, and Global
Bond, can be found in the respective Product Highlights
Sheets and Fund Summaries on our website
www.income.com.sg/fund/coopprices.asp.
NTUC Income Insurance Co-operative Limited (Income)
Income was established in 1970 to make essential
insurance accessible to all Singaporeans. Today, Income is
the leading composite insurer in Singapore offering life,
health and general insurance. Our wide network of financial
advisers and partners provide value-added financial advisory
that complements today’s digital-first landscape, offering
insurance products and services that serve the protection,
savings and investment needs of customers at different
stages and across all segments of society.
As of 31 December 2019, Income had S$40.45 billion in
assets under management. Our financial strength and
diversified investment portfolio are reflected by our strong
credit ratings and predicated on our core investment
philosophy of value, prudence and discipline.
Amundi Singapore Limited
Amundi Singapore Limited is a wholly-owned subsidiary of
Amundi Asset Management. It was established in Singapore
in 1989 as a business hub for Amundi’s group operations in
South East Asia. Amundi Singapore Limited is licensed and
regulated by the Monetary Authority of Singapore and has
been managing collective investment schemes and/or
discretionary funds since 1989. It is also one of Amundi’s
group investment centres responsible for Asian investment
management. Amundi manages €1.65 trillion euros of
assets as of 31 December 2019.
Morgan Stanley Investment Management Company (MSIM)
MSIM was established in 1975 as a subsidiary of Morgan
Stanley Group Inc. As of December 31, 2019, MSIM employs
711 investment professionals worldwide in 23 countries and
offers its clients personalised attention, the intelligence and
creativity of some of the brightest professionals in the
industry and access to the global resources of Morgan
Stanley. As of December 31, 2019, MSIM managed US$552
billion in assets for its clients.
MFS International Singapore Pte Ltd^
MFS International Singapore Pte Ltd is incorporated in
Singapore and is authorised under a capital market service
license with the Monetary Authority of Singapore to provide
fund management services. MFS has been managing pooled
vehicles/investment funds and/or discretionary funds in
Singapore since 1997. MFS Investment Management
(parent company of MFS International Singapore Pte Ltd)
was founded in 1924. Asset under management totalled
US$526 billion as of 31 December 2019. MFS believes in
active bottom-up research aimed at consistently identifying
high-quality investments by focusing on companies that have
potential to generate above-average and sustainable
earnings. MFS has a global network of research analysts and
portfolio managers based in Boston, Toronto, Mexico City,
London, Tokyo, Hong Kong, Singapore and Sydney.
^Prior to November 2013, MFS was operating as a branch of MFS
International limited and was an exempted fund manager under the
Singaporean regulatory regime.
Wellington Management Singapore Pte Ltd (WMS)*
WMS is an affiliate of Wellington Management Company LLP
(WMS, Wellington Management Company LLP and the other
affiliates of Wellington Management Company LLP are
collectively referred to as WMC). With US$1.1 trillion in
assets under management, WMC serves as an investment
adviser to over 2,200 clients located in more than 60
countries, as of 31 December 2019. WMC’s singular focus
is investments — from global equities and fixed income to
currencies and commodities. WMC describes themselves as
a community of teams that create solutions designed to
respond to specific client needs. WMC’s most distinctive
strength is their proprietary, independent research, which is
shared across all areas of the organisation and used only for
managing clients' portfolios. Tracing its roots to the founding
of Wellington Fund in 1928, the firm has offices in Boston,
Massachusetts; Chicago, Illinois; Radnor, Pennsylvania; San
Francisco, California; Toronto, Canada; Beijing; Frankfurt;
Hong Kong; London; Singapore; Sydney; Tokyo; Luxembourg
and Zurich.
*With effect from 29 April 2016, WMS has replaced Trust Company of
the West (TCW) Asset Management Company as the Sub-Investment
Manager of the Global Technology Fund.
State Street Global Advisors Singapore Limited (SSGA)
For four decades, State Street Global Advisors has served
the world’s governments, institutions and financial advisors.
With a rigorous, risk-aware approach built on research,
analysis and market-tested experience, we build from a
breadth of active and index strategies to create cost-
effective solutions. As stewards, we help portfolio companies
see that what is fair for people and sustainable for the planet
can deliver long-term performance. And, as pioneers in index,
ETF, and ESG investing, we are always inventing new ways to
invest. As a result, we have become the world’s third largest
asset manager with nearly US$3.12 trillion* under our care.
*This figure is presented as of December 31, 2019 and includes
approximately $45 billion of assets with respect to SPDR products for
which State Street Global Advisors Funds Distributors, LLC (SSGA FD)
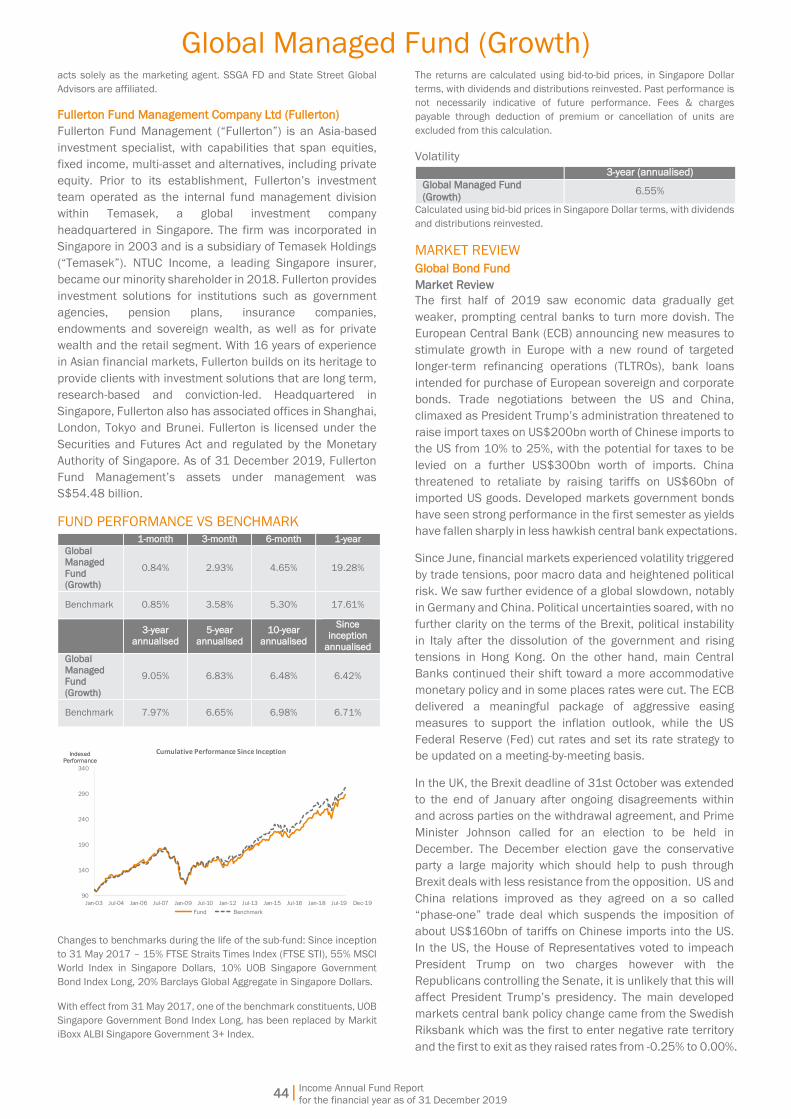
Global Managed Fund (Growth)
Income Annual Fund Report
for the financial year as of 31 December 2019
44|
acts solely as the marketing agent. SSGA FD and State Street Global
Advisors are affiliated.
Fullerton Fund Management Company Ltd (Fullerton)
Fullerton Fund Management (“Fullerton”) is an Asia-based
investment specialist, with capabilities that span equities,
fixed income, multi-asset and alternatives, including private
equity. Prior to its establishment, Fullerton’s investment
team operated as the internal fund management division
within Temasek, a global investment company
headquartered in Singapore. The firm was incorporated in
Singapore in 2003 and is a subsidiary of Temasek Holdings
(“Temasek”). NTUC Income, a leading Singapore insurer,
became our minority shareholder in 2018. Fullerton provides
investment solutions for institutions such as government
agencies, pension plans, insurance companies,
endowments and sovereign wealth, as well as for private
wealth and the retail segment. With 16 years of experience
in Asian financial markets, Fullerton builds on its heritage to
provide clients with investment solutions that are long term,
research-based and conviction-led. Headquartered in
Singapore, Fullerton also has associated offices in Shanghai,
London, Tokyo and Brunei. Fullerton is licensed under the
Securities and Futures Act and regulated by the Monetary
Authority of Singapore. As of 31 December 2019, Fullerton
Fund Management’s assets under management was
S$54.48 billion.
FUND PERFORMANCE VS BENCHMARK
1-month 3-month 6-month 1-year
Global
Managed
Fund (Growth)
0.84% 2.93% 4.65% 19.28%
Benchmark 0.85% 3.58% 5.30% 17.61%
3-year
annualised
5-year
annualised
10-year
annualised
Since inception
annualised
Global
Managed
Fund
(Growth)
9.05% 6.83% 6.48% 6.42%
Benchmark 7.97% 6.65% 6.98% 6.71%
90
140
190
240
290
340
Jan-03 Jul-04 Jan-06 Jul-07 Jan-09 Jul-10 Jan-12 Jul-13 Jan-15 Jul-16 Jan-18 Jul-19
Cumulative Performance Since Inception
Fund Benchmark
IndexedPerformance
IndexedPerformance
Dec-19
Changes to benchmarks during the life of the sub-fund: Since inception
to 31 May 2017 – 15% FTSE Straits Times Index (FTSE STI), 55% MSCI
World Index in Singapore Dollars, 10% UOB Singapore Government
Bond Index Long, 20% Barclays Global Aggregate in Singapore Dollars.
With effect from 31 May 2017, one of the benchmark constituents, UOB
Singapore Government Bond Index Long, has been replaced by Markit
iBoxx ALBI Singapore Government 3+ Index.
The returns are calculated using bid-to-bid prices, in Singapore Dollar
terms, with dividends and distributions reinvested. Past performance is
not necessarily indicative of future performance. Fees & charges
payable through deduction of premium or cancellation of units are
excluded from this calculation.
Volatility
3-year (annualised)
Global Managed Fund
(Growth) 6.55%
Calculated using bid-bid prices in Singapore Dollar terms, with dividends
and distributions reinvested.
MARKET REVIEW
Global Bond Fund Market Review The first half of 2019 saw economic data gradually get
weaker, prompting central banks to turn more dovish. The
European Central Bank (ECB) announcing new measures to
stimulate growth in Europe with a new round of targeted
longer-term refinancing operations (TLTROs), bank loans
intended for purchase of European sovereign and corporate
bonds. Trade negotiations between the US and China,
climaxed as President Trump’s administration threatened to
raise import taxes on US$200bn worth of Chinese imports to
the US from 10% to 25%, with the potential for taxes to be
levied on a further US$300bn worth of imports. China
threatened to retaliate by raising tariffs on US$60bn of
imported US goods. Developed markets government bonds
have seen strong performance in the first semester as yields
have fallen sharply in less hawkish central bank expectations.
Since June, financial markets experienced volatility triggered
by trade tensions, poor macro data and heightened political
risk. We saw further evidence of a global slowdown, notably
in Germany and China. Political uncertainties soared, with no
further clarity on the terms of the Brexit, political instability
in Italy after the dissolution of the government and rising
tensions in Hong Kong. On the other hand, main Central
Banks continued their shift toward a more accommodative
monetary policy and in some places rates were cut. The ECB
delivered a meaningful package of aggressive easing
measures to support the inflation outlook, while the US
Federal Reserve (Fed) cut rates and set its rate strategy to
be updated on a meeting-by-meeting basis.
In the UK, the Brexit deadline of 31st October was extended
to the end of January after ongoing disagreements within
and across parties on the withdrawal agreement, and Prime
Minister Johnson called for an election to be held in
December. The December election gave the conservative
party a large majority which should help to push through
Brexit deals with less resistance from the opposition. US and
China relations improved as they agreed on a so called
“phase-one” trade deal which suspends the imposition of
about US$160bn of tariffs on Chinese imports into the US.
In the US, the House of Representatives voted to impeach
President Trump on two charges however with the
Republicans controlling the Senate, it is unlikely that this will
affect President Trump’s presidency. The main developed
markets central bank policy change came from the Swedish
Riksbank which was the first to enter negative rate territory
and the first to exit as they raised rates from -0.25% to 0.00%.

Global Managed Fund (Growth)
Income Annual Fund Report
for the financial year as of 31 December 2019
45|
Further afield, the quarter saw widespread social and
political unrest in Argentina, Bolivia and Chile as protests
took place against a widening wealth gap between the
richest and the average population in addition to disputed
elections.
Market Outlook For 2020 we currently see five key themes that could have
significant impact on the markets. We see fiscal and
monetary easing across developed markets which could
provide a welcome tailwind that with tactical opportunities.
The global assessment of trade dynamics is impacting areas
and countries differently, with some emerging markets (EM)
possibly benefitting as trade that would have gone to China
becomes diverted to other countries. We expect China to
decelerate but to manage the slower growth by addressing
productivity growth, while avoiding a credit bubble burst.
There is some spill over from manufacturing to services, but
US consumers will remain sufficiently resilient in 2020 due
to healthier household balance sheet. Global earnings per
share growth is expected in the lower single digit space.
Currency dynamics and spreads are the main areas to
monitor, as the materialisation of downside risk might be
sudden and impactful in a world washed by government and
corporate debt. With a good balance of positives and risks
expected to materialise in 2020, the ability and flexibility to
quickly allocate risk across a wide spectrum of assets to
where it will reap the largest rewards remains critical.
We are currently overall underweight duration, particularly on
the shorter end of the curve. Geographically, we are
underweight duration in the Eurozone and Japan whilst being
overweight USD-denominated duration. We remain
overweight investment grade corporate bonds as they still
offer a decent pick-up over government bonds, we also hold
selective allocations to EM bonds. Within currencies, we are
underweight the USD with an overweight allocation to the
EUR which stands to grow on improved growth expectations.
In addition, we hold overweight allocations to select high
yielding EM currencies like the MXN, TRY and RUB. We are
underweight the USD which we view as being fully priced in.
Singapore Bond Fund Market Review Global markets were roiled by political events in 2019,
including the protracted US-China trade war and Brexit
concerns, in addition to worries of a global growth slowdown.
Despite this, most financial markets, including Asian bond
markets, closed the year on a strong note as central banks
globally pledged monetary policy support and boosted fiscal
efforts. As the year comes to a close, financial markets were
further supported by a benign inflation backdrop, fading risk
of a hard Brexit, and the agreement of a Phase One trade
deal between the US and China in December.
Central banks across Asia have followed the Fed’s dovish tilt
in 2019, in aggressively lowering borrowing costs as growth
slows. Countries such as Thailand, India, Indonesia, the
Philippines, South Korea, and Malaysia are among those
that have front loaded easier monetary policy in 2019 and
the pace of cuts is likely to be more modest from hereon.
Importantly, fiscal policy in Asia remained supportive,
cushioning domestic demand and offset the drag from the
external sectors.
In Singapore, advance estimates showed that Singapore’s
economy grew by 0.8%yoy in 4Q2019, bringing the full year
gross domestic product (GDP) growth for 2019 to 0.7%yoy.
On the inflation front, consumer price index (CPI) inflation
inched up slightly to 0.6% est. for 2019, from 0.4% in 2018.
Core inflation is projected to ease to 1.1%. On the exports
front, Singapore’s non-oil domestic exports (NODX)
registered a growth of 2.4%yoy in December, marking an
encouraging end to a difficult year.
Market Outlook Risk assets are off to a good start in 2020, following positive
developments on the trade front and nascent indicators of
stabilising global growth. In Asia, the latest regional
purchasing managers index (PMI) have improved, with South
Korea, Thailand and Taiwan among those in expansionary
territory. In China, new export orders have risen and are now
in expansion territory, reflecting reduced trade tensions and
firmer external demand.
Similarly in Singapore, we expect modest growth recovery in
2020, spurred by the reprieve in US-China trade tensions.
The recent uptick in higher-frequency indicators such as
industrial production and NODX are also encouraging.
Inflation is likely to remain stable on the back of the steady
supply in food and commodities, and lower wage growth. The
modest growth environment coupled with negative output
gap will also limit the pass though effect.
Against such a backdrop, we are keeping to a modest
underweight in duration as Singapore bond yields may edge
higher, in tandem with rising US Treasury yields in the near
term, given firmer risk sentiments. The yield curve is also
likely to steepen, given some front-loading of long-end SGS
supply in Q12020. We continue to allocate to overall credit
beta as an expression of our positive risk disposition and
sidelined SGD agencies (on expensive relative valuations).
That said, we may re-engage the SGD agency markets should
spreads widen out.
Global Equity Fund Market Review Global equities, as measured by the MSCI World Index,
produced a total return of 22.8% in SGD terms in 2019.
Easier global monetary policy, anticipation of a phase one
trade deal between China and the US and receding risks of
a near-term no deal Brexit helped propel the market.
The US S&P 500 index produced a total return of 23.7% in
SGD terms in 2019. A trio of rate cuts from the Fed, along
with the resumption of Treasury bill purchases by the Fed to
pump additional reserves into money markets were
supportive from a monetary policy perspective while easing
geopolitical and trade tensions contributed to the year's
strong performance.
European stocks, as measured by the STOXX Europe 50
Index, returned 25% in SGD terms in 2019. Fading fears of
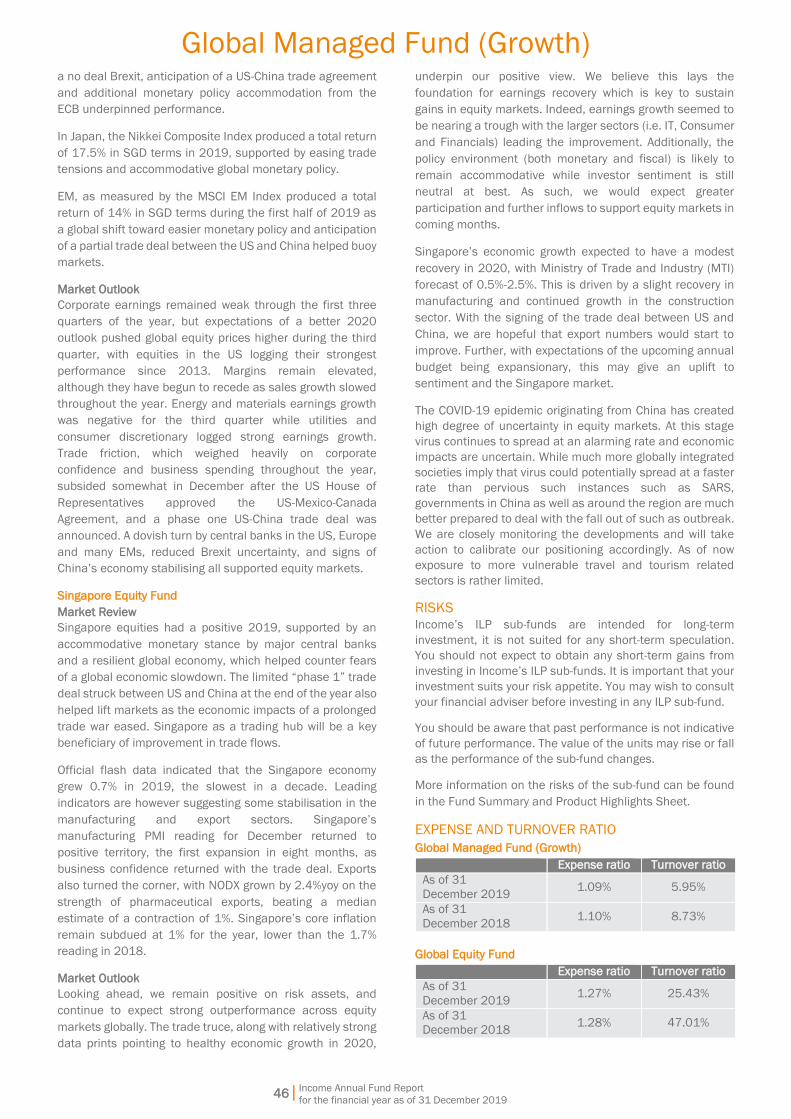
Global Managed Fund (Growth)
Income Annual Fund Report
for the financial year as of 31 December 2019
46|
a no deal Brexit, anticipation of a US-China trade agreement
and additional monetary policy accommodation from the
ECB underpinned performance.
In Japan, the Nikkei Composite Index produced a total return
of 17.5% in SGD terms in 2019, supported by easing trade
tensions and accommodative global monetary policy.
EM, as measured by the MSCI EM Index produced a total
return of 14% in SGD terms during the first half of 2019 as
a global shift toward easier monetary policy and anticipation
of a partial trade deal between the US and China helped buoy
markets.
Market Outlook Corporate earnings remained weak through the first three
quarters of the year, but expectations of a better 2020
outlook pushed global equity prices higher during the third
quarter, with equities in the US logging their strongest
performance since 2013. Margins remain elevated,
although they have begun to recede as sales growth slowed
throughout the year. Energy and materials earnings growth
was negative for the third quarter while utilities and
consumer discretionary logged strong earnings growth.
Trade friction, which weighed heavily on corporate
confidence and business spending throughout the year,
subsided somewhat in December after the US House of
Representatives approved the US-Mexico-Canada
Agreement, and a phase one US-China trade deal was
announced. A dovish turn by central banks in the US, Europe
and many EMs, reduced Brexit uncertainty, and signs of
China’s economy stabilising all supported equity markets.
Singapore Equity Fund Market Review Singapore equities had a positive 2019, supported by an
accommodative monetary stance by major central banks
and a resilient global economy, which helped counter fears
of a global economic slowdown. The limited “phase 1” trade
deal struck between US and China at the end of the year also
helped lift markets as the economic impacts of a prolonged
trade war eased. Singapore as a trading hub will be a key
beneficiary of improvement in trade flows.
Official flash data indicated that the Singapore economy
grew 0.7% in 2019, the slowest in a decade. Leading
indicators are however suggesting some stabilisation in the
manufacturing and export sectors. Singapore’s
manufacturing PMI reading for December returned to
positive territory, the first expansion in eight months, as
business confidence returned with the trade deal. Exports
also turned the corner, with NODX grown by 2.4%yoy on the
strength of pharmaceutical exports, beating a median
estimate of a contraction of 1%. Singapore’s core inflation
remain subdued at 1% for the year, lower than the 1.7%
reading in 2018.
Market Outlook Looking ahead, we remain positive on risk assets, and
continue to expect strong outperformance across equity
markets globally. The trade truce, along with relatively strong
data prints pointing to healthy economic growth in 2020,
underpin our positive view. We believe this lays the
foundation for earnings recovery which is key to sustain
gains in equity markets. Indeed, earnings growth seemed to
be nearing a trough with the larger sectors (i.e. IT, Consumer
and Financials) leading the improvement. Additionally, the
policy environment (both monetary and fiscal) is likely to
remain accommodative while investor sentiment is still
neutral at best. As such, we would expect greater
participation and further inflows to support equity markets in
coming months.
Singapore’s economic growth expected to have a modest
recovery in 2020, with Ministry of Trade and Industry (MTI)
forecast of 0.5%-2.5%. This is driven by a slight recovery in
manufacturing and continued growth in the construction
sector. With the signing of the trade deal between US and
China, we are hopeful that export numbers would start to
improve. Further, with expectations of the upcoming annual
budget being expansionary, this may give an uplift to
sentiment and the Singapore market.
The COVID-19 epidemic originating from China has created
high degree of uncertainty in equity markets. At this stage
virus continues to spread at an alarming rate and economic
impacts are uncertain. While much more globally integrated
societies imply that virus could potentially spread at a faster
rate than pervious such instances such as SARS,
governments in China as well as around the region are much
better prepared to deal with the fall out of such as outbreak.
We are closely monitoring the developments and will take
action to calibrate our positioning accordingly. As of now
exposure to more vulnerable travel and tourism related
sectors is rather limited.
RISKS
Income’s ILP sub-funds are intended for long-term
investment, it is not suited for any short-term speculation.
You should not expect to obtain any short-term gains from
investing in Income’s ILP sub-funds. It is important that your
investment suits your risk appetite. You may wish to consult
your financial adviser before investing in any ILP sub-fund.
You should be aware that past performance is not indicative
of future performance. The value of the units may rise or fall
as the performance of the sub-fund changes.
More information on the risks of the sub-fund can be found
in the Fund Summary and Product Highlights Sheet.
EXPENSE AND TURNOVER RATIO
Global Managed Fund (Growth)
Expense ratio Turnover ratio
As of 31
December 2019 1.09% 5.95%
As of 31
December 2018 1.10% 8.73%
Global Equity Fund
Expense ratio Turnover ratio
As of 31
December 2019 1.27% 25.43%
As of 31
December 2018 1.28% 47.01%
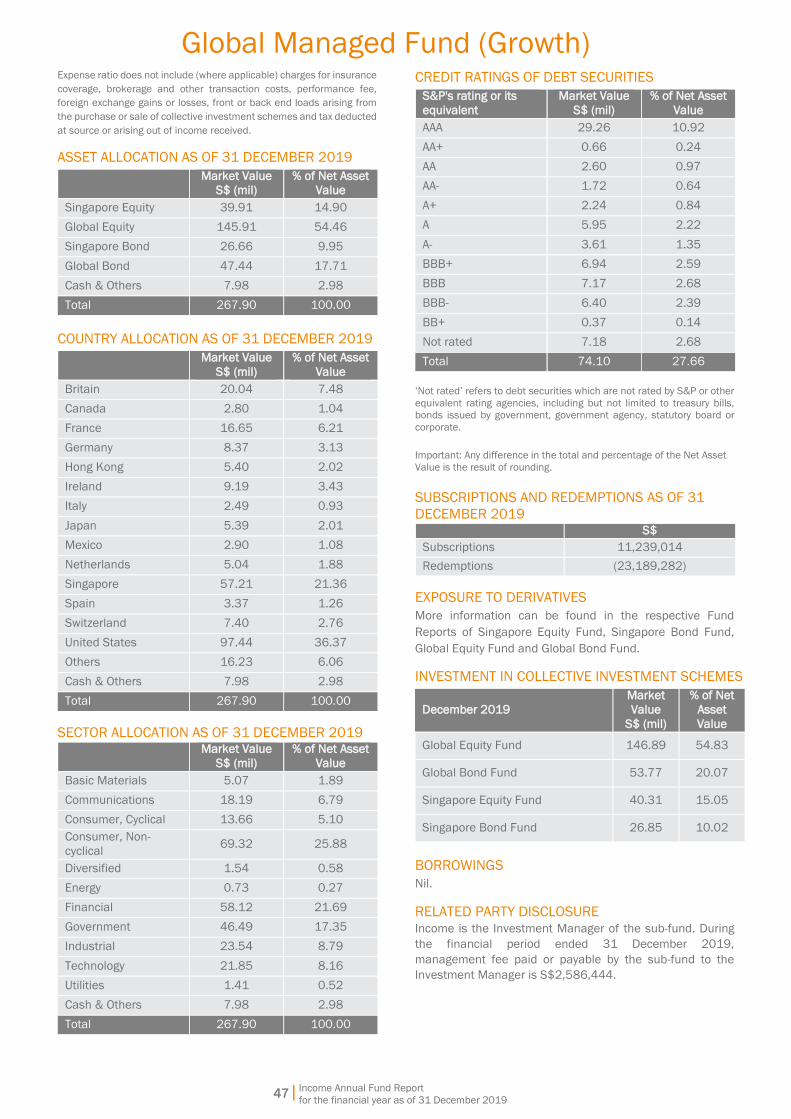
Global Managed Fund (Growth)
Income Annual Fund Report
for the financial year as of 31 December 2019
47|
Expense ratio does not include (where applicable) charges for insurance
coverage, brokerage and other transaction costs, performance fee,
foreign exchange gains or losses, front or back end loads arising from
the purchase or sale of collective investment schemes and tax deducted
at source or arising out of income received.
ASSET ALLOCATION AS OF 31 DECEMBER 2019
Market Value
S$ (mil)
% of Net Asset
Value
Singapore Equity 39.91 14.90
Global Equity 145.91 54.46
Singapore Bond 26.66 9.95
Global Bond 47.44 17.71
Cash & Others 7.98 2.98
Total 267.90 100.00
COUNTRY ALLOCATION AS OF 31 DECEMBER 2019
Market Value
S$ (mil)
% of Net Asset
Value
Britain 20.04 7.48
Canada 2.80 1.04
France 16.65 6.21
Germany 8.37 3.13
Hong Kong 5.40 2.02
Ireland 9.19 3.43
Italy 2.49 0.93
Japan 5.39 2.01
Mexico 2.90 1.08
Netherlands 5.04 1.88
Singapore 57.21 21.36
Spain 3.37 1.26
Switzerland 7.40 2.76
United States 97.44 36.37
Others 16.23 6.06
Cash & Others 7.98 2.98
Total 267.90 100.00
SECTOR ALLOCATION AS OF 31 DECEMBER 2019
Market Value
S$ (mil)
% of Net Asset
Value
Basic Materials 5.07 1.89
Communications 18.19 6.79
Consumer, Cyclical 13.66 5.10
Consumer, Non-
cyclical 69.32 25.88
Diversified 1.54 0.58
Energy 0.73 0.27
Financial 58.12 21.69
Government 46.49 17.35
Industrial 23.54 8.79
Technology 21.85 8.16
Utilities 1.41 0.52
Cash & Others 7.98 2.98
Total 267.90 100.00
CREDIT RATINGS OF DEBT SECURITIES
S&P's rating or its
equivalent
Market Value
S$ (mil)
% of Net Asset
Value
AAA 29.26 10.92
AA+ 0.66 0.24
AA 2.60 0.97
AA- 1.72 0.64
A+ 2.24 0.84
A 5.95 2.22
A- 3.61 1.35
BBB+ 6.94 2.59
BBB 7.17 2.68
BBB- 6.40 2.39
BB+ 0.37 0.14
Not rated 7.18 2.68
Total 74.10 27.66
‘Not rated’ refers to debt securities which are not rated by S&P or other
equivalent rating agencies, including but not limited to treasury bills,
bonds issued by government, government agency, statutory board or
corporate.
Important: Any difference in the total and percentage of the Net Asset
Value is the result of rounding.
SUBSCRIPTIONS AND REDEMPTIONS AS OF 31
DECEMBER 2019 S$
Subscriptions 11,239,014
Redemptions (23,189,282)
EXPOSURE TO DERIVATIVES
More information can be found in the respective Fund
Reports of Singapore Equity Fund, Singapore Bond Fund,
Global Equity Fund and Global Bond Fund.
INVESTMENT IN COLLECTIVE INVESTMENT SCHEMES
December 2019
Market
Value
S$ (mil)
% of Net
Asset
Value
Global Equity Fund 146.89 54.83
Global Bond Fund 53.77 20.07
Singapore Equity Fund 40.31 15.05
Singapore Bond Fund 26.85 10.02
BORROWINGS
Nil.
RELATED PARTY DISCLOSURE
Income is the Investment Manager of the sub-fund. During
the financial period ended 31 December 2019,
management fee paid or payable by the sub-fund to the
Investment Manager is S$2,586,444.

Global Managed Fund (Growth)
Income Annual Fund Report
for the financial year as of 31 December 2019
48|
Fullerton is the Sub-Investment Manager of the Singapore
Bond Fund and Singapore Equity Fund, which the sub-fund
invests into. During the financial period ended 31 December
2019, they managed S$42,245,071, equivalent to 15.77%
of its net asset value.
SOFT DOLLAR COMMISSION OR ARRANGEMENT
The Manager did not retain for its own account cash or
commission rebates arising out of transactions executed in
or outside Singapore. Soft dollar commission/arrangement
had been received/entered into by the Manager in respect
of the sub-fund. The soft dollar commission/arrangement
relates essentially to research services, economic and
political analyses, portfolio analyses, market analyses, data
and quotation services, computer hardware and software
used for and in support of the investment process. The
Manager did not accept or enter into soft dollar
commission/arrangement unless such commission
/arrangement would, in the opinion of the Manager, assist
the Manager in the management of the sub-fund. The
Manager confirmed that trades were made on best
execution basis, that is, the Manager took all reasonable
steps to obtain the best possible result for the sub-fund,
taking into account the following execution factors: price,
costs, speed, likelihood of execution and settlement, size,
nature or any other consideration relevant to the execution
of a trade or transaction, and there was no churning of trades.
The said brokers had also executed trades for other sub-
funds managed by the Manager.
More information can be found in the respective Fund
Reports of Singapore Equity Fund, Singapore Bond Fund,
Global Equity Fund and Global Bond Fund.
CONFLICTS OF INTEREST
As the Manager of various Income ILP sub-funds and
insurance funds, we may from time to time have to deal with
competing or conflicting interests between these sub-
funds/insurance funds. However, we will use all reasonable
endeavours to act fairly and in the best interest of the sub-
fund. We will conduct all transactions with or for the sub-fund
on an arm’s length basis. The Manager has in place policies
and procedures to monitor and mitigate conflicts of interests
which may arise in the management of these sub-funds. We
believe that these policies and procedures are reasonably
designed to ensure that portfolio management decisions are
made in the best interest of the sub-fund and each sub-fund
is treated fairly, regardless of the existence of any conflict.
More information can be found in the respective Fund
Reports of Singapore Equity Fund, Singapore Bond Fund,
Global Equity Fund and Global Bond Fund.
OTHER PARTIES
The auditor of this sub-fund is KPMG LLP. Please note that
financial results ending 31 December of each year will be
audited.
MATERIAL INFORMATION
Nil.
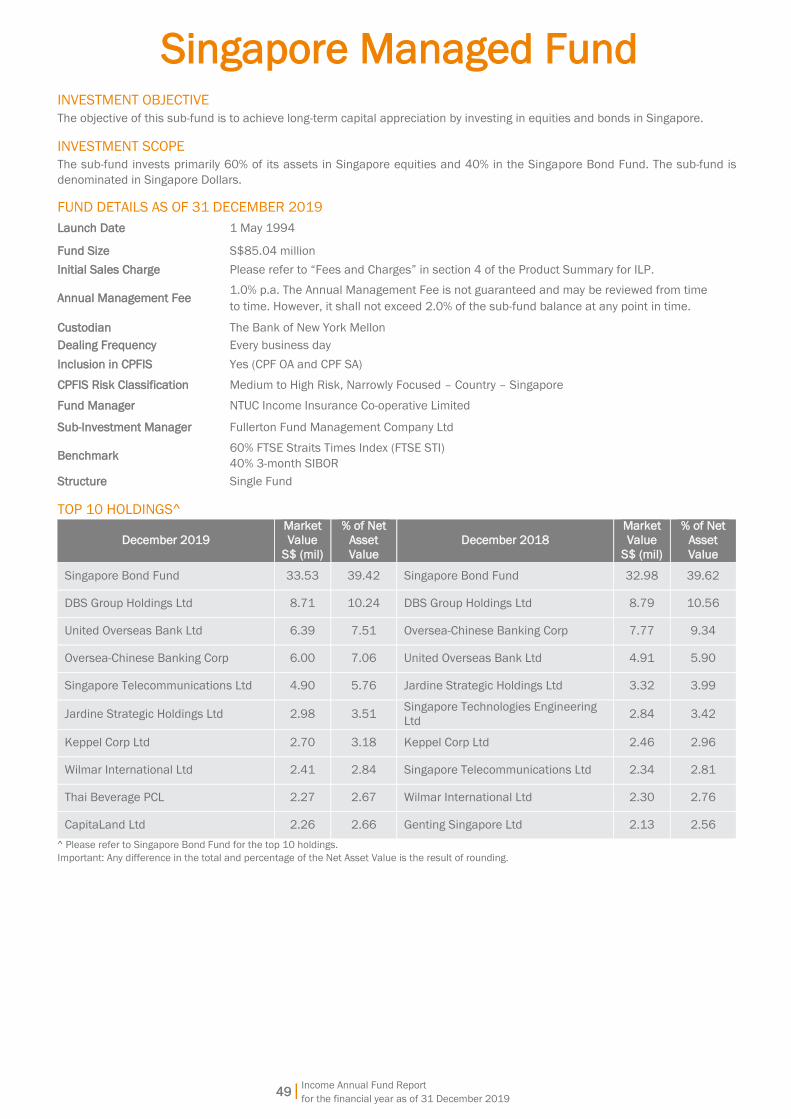
49|
Singapore Managed Fund
Income Annual Fund Report
for the financial year as of 31 December 2019
INVESTMENT OBJECTIVE
The objective of this sub-fund is to achieve long-term capital appreciation by investing in equities and bonds in Singapore.
INVESTMENT SCOPE
The sub-fund invests primarily 60% of its assets in Singapore equities and 40% in the Singapore Bond Fund. The sub-fund is
denominated in Singapore Dollars.
FUND DETAILS AS OF 31 DECEMBER 2019
Launch Date 1 May 1994
Fund Size S$85.04 million
Initial Sales Charge Please refer to “Fees and Charges” in section 4 of the Product Summary for ILP.
Annual Management Fee 1.0% p.a. The Annual Management Fee is not guaranteed and may be reviewed from time
to time. However, it shall not exceed 2.0% of the sub-fund balance at any point in time.
Custodian The Bank of New York Mellon
Dealing Frequency Every business day
Inclusion in CPFIS Yes (CPF OA and CPF SA)
CPFIS Risk Classification Medium to High Risk, Narrowly Focused – Country – Singapore
Fund Manager NTUC Income Insurance Co-operative Limited
Sub-Investment Manager Fullerton Fund Management Company Ltd
Benchmark 60% FTSE Straits Times Index (FTSE STI)
40% 3-month SIBOR
Structure Single Fund
TOP 10 HOLDINGS^
December 2019
Market
Value
S$ (mil)
% of Net
Asset
Value
December 2018
Market
Value
S$ (mil)
% of Net
Asset
Value
Singapore Bond Fund 33.53 39.42 Singapore Bond Fund 32.98 39.62
DBS Group Holdings Ltd 8.71 10.24 DBS Group Holdings Ltd 8.79 10.56
United Overseas Bank Ltd 6.39 7.51 Oversea-Chinese Banking Corp 7.77 9.34
Oversea-Chinese Banking Corp 6.00 7.06 United Overseas Bank Ltd 4.91 5.90
Singapore Telecommunications Ltd 4.90 5.76 Jardine Strategic Holdings Ltd 3.32 3.99
Jardine Strategic Holdings Ltd 2.98 3.51 Singapore Technologies Engineering
Ltd 2.84 3.42
Keppel Corp Ltd 2.70 3.18 Keppel Corp Ltd 2.46 2.96
Wilmar International Ltd 2.41 2.84 Singapore Telecommunications Ltd 2.34 2.81
Thai Beverage PCL 2.27 2.67 Wilmar International Ltd 2.30 2.76
CapitaLand Ltd 2.26 2.66 Genting Singapore Ltd 2.13 2.56
^ Please refer to Singapore Bond Fund for the top 10 holdings. Important: Any difference in the total and percentage of the Net Asset Value is the result of rounding.

50|
Singapore Managed Fund
Income Annual Fund Report
for the financial year as of 31 December 2019
FUND MANAGER
NTUC Income Insurance Co-operative Limited is the
Investment Manager of the sub-fund. Fullerton Fund
Management Company Ltd is the Sub-Investment Manager
of the sub-fund. The sub-fund invests significantly in
Singapore Bond Fund which is managed by NTUC Income
Insurance Co-operative Limited and is sub-managed by
Fullerton Fund Management Company Ltd.
Further information on the Singapore Bond Fund can be
found is the Product Highlights Sheet and Fund Summary on
our website www.income.com.sg/fund/coopprices.asp.
NTUC Income Insurance Co-operative Limited (Income) Income was established in 1970 to make essential
insurance accessible to all Singaporeans. Today, Income is
the leading composite insurer in Singapore offering life,
health and general insurance. Our wide network of financial
advisers and partners provide value-added financial advisory
that complements today’s digital-first landscape, offering
insurance products and services that serve the protection,
savings and investment needs of customers at different
stages and across all segments of society.
As of 31 December 2019, Income had S$40.45 billion in
assets under management. Our financial strength and
diversified investment portfolio are reflected by our strong
credit ratings and predicated on our core investment
philosophy of value, prudence and discipline.
Fullerton Fund Management Company Ltd (Fullerton)
Fullerton Fund Management (“Fullerton”) is an Asia-based
investment specialist, with capabilities that span equities,
fixed income, multi-asset and alternatives, including private
equity. Prior to its establishment, Fullerton’s investment
team operated as the internal fund management division
within Temasek, a global investment company
headquartered in Singapore. The firm was incorporated in
Singapore in 2003 and is a subsidiary of Temasek Holdings
(“Temasek”). NTUC Income, a leading Singapore insurer,
became our minority shareholder in 2018. Fullerton provides
investment solutions for institutions such as government
agencies, pension plans, insurance companies,
endowments and sovereign wealth, as well as for private
wealth and the retail segment. With 16 years of experience
in Asian financial markets, Fullerton builds on its heritage to
provide clients with investment solutions that are long term,
research-based and conviction-led. Headquartered in
Singapore, Fullerton also has associated offices in Shanghai,
London, Tokyo and Brunei. Fullerton is licensed under the
Securities and Futures Act and regulated by the Monetary
Authority of Singapore. As of 31 December 2019, Fullerton
Fund Management’s assets under management was
S$54.48 billion.
FUND PERFORMANCE VS BENCHMARK
1-month 3-month 6-month 1-year
Singapore
Managed
Fund
0.51% 2.66% 1.57% 8.66%
Benchmark 0.73% 2.51% -0.19% 6.57%
3-year
annualised 5-year
annualised 10-year
annualised
Since
inception
annualised
Singapore
Managed
Fund
6.09% 3.01% 3.26% 5.52%
Benchmark 5.37% 2.43% 3.24% 3.91%
50
100
150
200
250
300
350
400
May-94 Jan-97 Sep-99 May-02 Jan-05 Sep-07 May-10 Jan-13 Sep-15 May-18
Cumulative Performance Since Inception
Fund Benchmark
IndexedPerformance
Dec-19
Changes to benchmarks during the life of the sub-fund: Since inception
to 31 Mar 98 - 60% DBS50, 40% Singapore 3-Month Deposit rate.
The returns are calculated using bid-to-bid prices, in Singapore Dollar
terms, with dividends and distributions reinvested. Past performance is
not necessarily indicative of future performance. Fees & charges
payable through deduction of premium or cancellation of units are
excluded from this calculation.
Volatility
3-year (annualised)
Singapore Managed Fund 7.59%
Calculated using bid-bid prices in Singapore Dollar terms, with dividends
and distributions reinvested.
MARKET REVIEW
Market Review
Singapore equities had a positive 2019, supported by an
accommodative monetary stance by major central banks
and a resilient global economy, which helped counter fears
of a global economic slowdown. The limited “phase 1” trade
deal struck between US and China at the end of the year also
helped lift markets as the economic impacts of a prolonged
trade war eased. Singapore as a trading hub will be a key
beneficiary of improvement in trade flows.
Official flash data indicated that the Singapore economy
grew 0.7% in 2019, the slowest in a decade. Leading
indicators are however suggesting some stabilisation in the
manufacturing and export sectors. Singapore’s
manufacturing purchasing managers index (PMI) reading for
December returned to positive territory, the first expansion
in eight months, as business confidence returned with the
trade deal. Exports also turned the corner, with non-oil
domestic exports (NODX) grown by 2.4%yoy on the strength
of pharmaceutical exports, beating a median estimate of a
contraction of 1%. Singapore’s core inflation remain
subdued at 1% for the year, lower than the 1.7% reading in
2018.
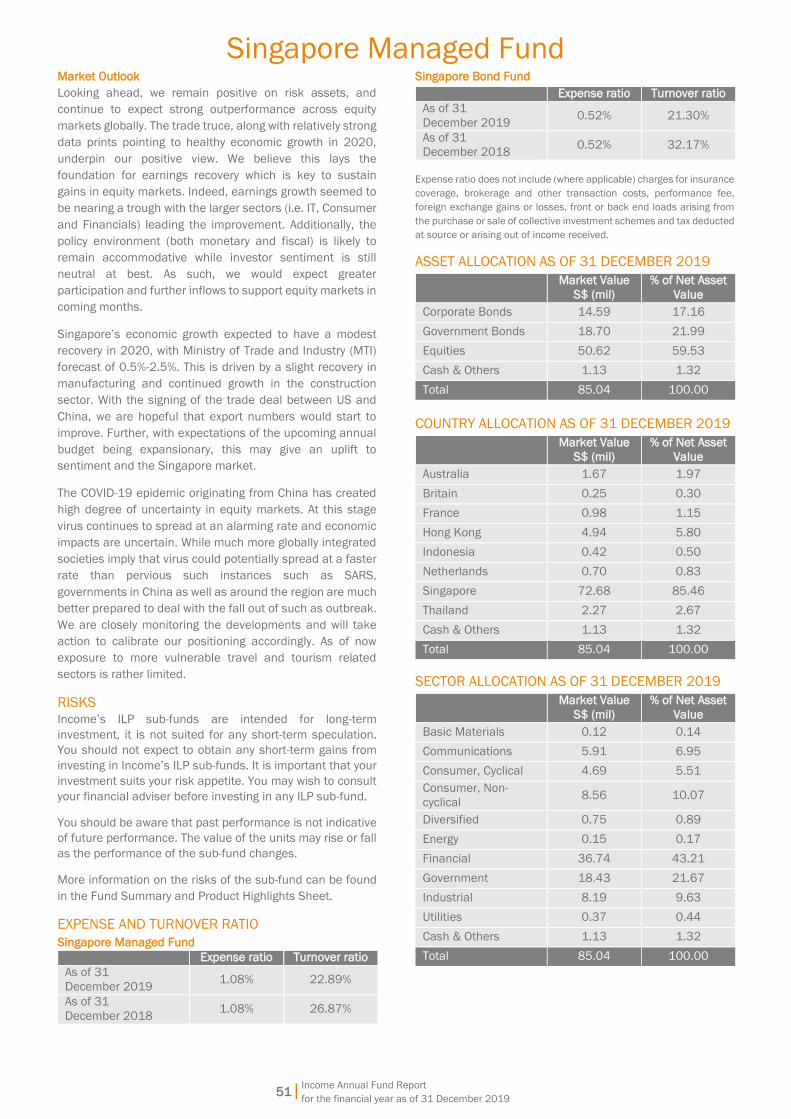
51|
Singapore Managed Fund
Income Annual Fund Report
for the financial year as of 31 December 2019
Market Outlook
Looking ahead, we remain positive on risk assets, and
continue to expect strong outperformance across equity
markets globally. The trade truce, along with relatively strong
data prints pointing to healthy economic growth in 2020,
underpin our positive view. We believe this lays the
foundation for earnings recovery which is key to sustain
gains in equity markets. Indeed, earnings growth seemed to
be nearing a trough with the larger sectors (i.e. IT, Consumer
and Financials) leading the improvement. Additionally, the
policy environment (both monetary and fiscal) is likely to
remain accommodative while investor sentiment is still
neutral at best. As such, we would expect greater
participation and further inflows to support equity markets in
coming months.
Singapore’s economic growth expected to have a modest
recovery in 2020, with Ministry of Trade and Industry (MTI)
forecast of 0.5%-2.5%. This is driven by a slight recovery in
manufacturing and continued growth in the construction
sector. With the signing of the trade deal between US and
China, we are hopeful that export numbers would start to
improve. Further, with expectations of the upcoming annual
budget being expansionary, this may give an uplift to
sentiment and the Singapore market.
The COVID-19 epidemic originating from China has created
high degree of uncertainty in equity markets. At this stage
virus continues to spread at an alarming rate and economic
impacts are uncertain. While much more globally integrated
societies imply that virus could potentially spread at a faster
rate than pervious such instances such as SARS,
governments in China as well as around the region are much
better prepared to deal with the fall out of such as outbreak.
We are closely monitoring the developments and will take
action to calibrate our positioning accordingly. As of now
exposure to more vulnerable travel and tourism related
sectors is rather limited.
RISKS
Income’s ILP sub-funds are intended for long-term
investment, it is not suited for any short-term speculation.
You should not expect to obtain any short-term gains from
investing in Income’s ILP sub-funds. It is important that your
investment suits your risk appetite. You may wish to consult
your financial adviser before investing in any ILP sub-fund.
You should be aware that past performance is not indicative
of future performance. The value of the units may rise or fall
as the performance of the sub-fund changes.
More information on the risks of the sub-fund can be found
in the Fund Summary and Product Highlights Sheet.
EXPENSE AND TURNOVER RATIO
Singapore Managed Fund
Expense ratio Turnover ratio
As of 31
December 2019 1.08% 22.89%
As of 31
December 2018 1.08% 26.87%
Singapore Bond Fund
Expense ratio Turnover ratio
As of 31
December 2019 0.52% 21.30%
As of 31
December 2018 0.52% 32.17%
Expense ratio does not include (where applicable) charges for insurance
coverage, brokerage and other transaction costs, performance fee,
foreign exchange gains or losses, front or back end loads arising from
the purchase or sale of collective investment schemes and tax deducted
at source or arising out of income received.
ASSET ALLOCATION AS OF 31 DECEMBER 2019
Market Value
S$ (mil)
% of Net Asset
Value
Corporate Bonds 14.59 17.16
Government Bonds 18.70 21.99
Equities 50.62 59.53
Cash & Others 1.13 1.32
Total 85.04 100.00
COUNTRY ALLOCATION AS OF 31 DECEMBER 2019
Market Value
S$ (mil)
% of Net Asset
Value
Australia 1.67 1.97
Britain 0.25 0.30
France 0.98 1.15
Hong Kong 4.94 5.80
Indonesia 0.42 0.50
Netherlands 0.70 0.83
Singapore 72.68 85.46
Thailand 2.27 2.67
Cash & Others 1.13 1.32
Total 85.04 100.00
SECTOR ALLOCATION AS OF 31 DECEMBER 2019
Market Value
S$ (mil)
% of Net Asset
Value
Basic Materials 0.12 0.14
Communications 5.91 6.95
Consumer, Cyclical 4.69 5.51
Consumer, Non-
cyclical 8.56 10.07
Diversified 0.75 0.89
Energy 0.15 0.17
Financial 36.74 43.21
Government 18.43 21.67
Industrial 8.19 9.63
Utilities 0.37 0.44
Cash & Others 1.13 1.32
Total 85.04 100.00
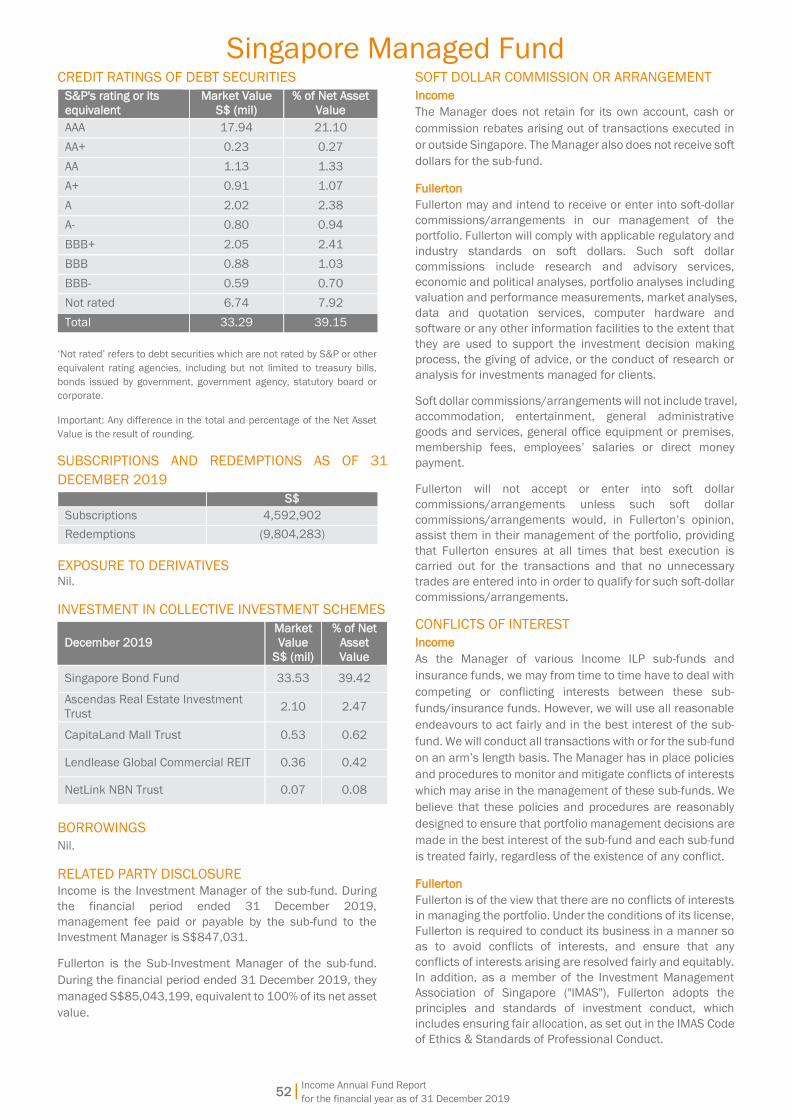
52|
Singapore Managed Fund
Income Annual Fund Report
for the financial year as of 31 December 2019
CREDIT RATINGS OF DEBT SECURITIES
S&P's rating or its
equivalent
Market Value
S$ (mil)
% of Net Asset
Value
AAA 17.94 21.10
AA+ 0.23 0.27
AA 1.13 1.33
A+ 0.91 1.07
A 2.02 2.38
A- 0.80 0.94
BBB+ 2.05 2.41
BBB 0.88 1.03
BBB- 0.59 0.70
Not rated 6.74 7.92
Total 33.29 39.15
‘Not rated’ refers to debt securities which are not rated by S&P or other
equivalent rating agencies, including but not limited to treasury bills,
bonds issued by government, government agency, statutory board or
corporate.
Important: Any difference in the total and percentage of the Net Asset
Value is the result of rounding.
SUBSCRIPTIONS AND REDEMPTIONS AS OF 31
DECEMBER 2019
S$
Subscriptions 4,592,902
Redemptions (9,804,283)
EXPOSURE TO DERIVATIVES Nil.
INVESTMENT IN COLLECTIVE INVESTMENT SCHEMES
December 2019
Market
Value
S$ (mil)
% of Net
Asset
Value
Singapore Bond Fund 33.53 39.42
Ascendas Real Estate Investment
Trust 2.10 2.47
CapitaLand Mall Trust 0.53 0.62
Lendlease Global Commercial REIT 0.36 0.42
NetLink NBN Trust 0.07 0.08
BORROWINGS
Nil.
RELATED PARTY DISCLOSURE
Income is the Investment Manager of the sub-fund. During
the financial period ended 31 December 2019,
management fee paid or payable by the sub-fund to the
Investment Manager is S$847,031.
Fullerton is the Sub-Investment Manager of the sub-fund.
During the financial period ended 31 December 2019, they
managed S$85,043,199, equivalent to 100% of its net asset
value.
SOFT DOLLAR COMMISSION OR ARRANGEMENT
Income
The Manager does not retain for its own account, cash or
commission rebates arising out of transactions executed in
or outside Singapore. The Manager also does not receive soft
dollars for the sub-fund.
Fullerton
Fullerton may and intend to receive or enter into soft-dollar
commissions/arrangements in our management of the
portfolio. Fullerton will comply with applicable regulatory and
industry standards on soft dollars. Such soft dollar
commissions include research and advisory services,
economic and political analyses, portfolio analyses including
valuation and performance measurements, market analyses,
data and quotation services, computer hardware and
software or any other information facilities to the extent that
they are used to support the investment decision making
process, the giving of advice, or the conduct of research or
analysis for investments managed for clients.
Soft dollar commissions/arrangements will not include travel,
accommodation, entertainment, general administrative
goods and services, general office equipment or premises,
membership fees, employees’ salaries or direct money
payment.
Fullerton will not accept or enter into soft dollar
commissions/arrangements unless such soft dollar
commissions/arrangements would, in Fullerton’s opinion,
assist them in their management of the portfolio, providing
that Fullerton ensures at all times that best execution is
carried out for the transactions and that no unnecessary
trades are entered into in order to qualify for such soft-dollar
commissions/arrangements.
CONFLICTS OF INTEREST
Income
As the Manager of various Income ILP sub-funds and
insurance funds, we may from time to time have to deal with
competing or conflicting interests between these sub-
funds/insurance funds. However, we will use all reasonable
endeavours to act fairly and in the best interest of the sub-
fund. We will conduct all transactions with or for the sub-fund
on an arm’s length basis. The Manager has in place policies
and procedures to monitor and mitigate conflicts of interests
which may arise in the management of these sub-funds. We
believe that these policies and procedures are reasonably
designed to ensure that portfolio management decisions are
made in the best interest of the sub-fund and each sub-fund
is treated fairly, regardless of the existence of any conflict.
Fullerton
Fullerton is of the view that there are no conflicts of interests
in managing the portfolio. Under the conditions of its license,
Fullerton is required to conduct its business in a manner so
as to avoid conflicts of interests, and ensure that any
conflicts of interests arising are resolved fairly and equitably.
In addition, as a member of the Investment Management
Association of Singapore ("IMAS"), Fullerton adopts the
principles and standards of investment conduct, which
includes ensuring fair allocation, as set out in the IMAS Code
of Ethics & Standards of Professional Conduct.
53|
Singapore Managed Fund
Income Annual Fund Report
for the financial year as of 31 December 2019
OTHER PARTIES
The auditor of this sub-fund is KPMG LLP. Please note that
financial results ending 31 December of each year will be
audited.
MATERIAL INFORMATION
Nil.

Income Annual Fund Report
for the financial year as of 31 December 2019
AIM Now Fund
54|
INVESTMENT OBJECTIVE
To provide investors with a regular and steady income whilst maintaining a stable capital value.
The sub-fund offers a semi-annual pay-out feature, with a historical distribution of up to 4% per annum (which constitutes of
payouts up to 2% of the net asset value on 31 May and 30 November every year). Distributions are not guaranteed and can be
made out of income, capital gains, and/or capital of the sub-fund which is expected to result in an immediate reduction of the
net asset value per unit/share. Past payout yields do not represent future payout yields.
INVESTMENT SCOPE
The sub-fund intends to achieve this objective by investing in a diversified portfolio of asset classes including fixed income,
equities and alternatives. The sub-fund is denominated in Singapore Dollars.
FUND DETAILS AS OF 31 DECEMBER 2019
Launch Date 25 September 2009
Fund Size S$67.58 million
Initial Sales Charge Please refer to “Fees and Charges” in section 4 of the Product Summary for ILP.
Annual Management Fee 0.85% p.a. The Annual Management Fee is not guaranteed and may be reviewed from time
to time. However, it shall not exceed 2.0% of the sub-fund balance at any point of time.
Custodian The Bank of New York Mellon
Dealing Frequency Every business day
Fund Manager NTUC Income Insurance Co-operative Limited
Inclusion in CPFIS Yes (CPF OA and CPF SA)
CPFIS Risk Classification Low to Medium Risk, Broadly Diversified
Sub-Investment Manager Schroder Investment Management (Singapore) Ltd
Benchmark
Barclays Global Aggregate Index (SGD Hedged)
Markit iBoxx ALBI Singapore Government Index
MSCI AC Asia ex Japan Index in Singapore Dollars
MSCI AC World Index in Singapore Dollars
FTSE Straits Times Index (FTSE STI)
Gold Spot hedged to Singapore Dollars
Structure Single Fund
With effect from 31 May 2017, one of the benchmark constituents, UOB Singapore Government Bond Index All, has been replaced
by Markit iBoxx ALBI Singapore Government Index.
TOP 10 HOLDINGS^
December 2019
Market
Value
S$ (mil)
% of Net
Asset
Value
December 2018
Market
Value
S$ (mil)
% of Net
Asset
Value
Singapore Bond Fund 24.39 36.10 Singapore Bond Fund 31.56 45.70
Schroder Global Quality Bond 12.31 18.22 Schroder Asian Investment Grade
Credit 7.69 11.13
Schroder ISF Global Corporate Bond 8.81 13.04 Schroder ISF Global Bond 6.94 10.05
Schroder ISF Global Inflation Linked
Bond 5.55 8.21
Schroder ISF Global Inflation Linked
Bond 6.62 9.59
Schroder Asian Investment Grade
Credit 4.69 6.94 Schroder ISF Global Corporate Bond 5.06 7.33
Schroder ISF Asian Opportunities 3.97 5.88 Schroder ISF Asian Opportunities 3.59 5.20
Schroder ISF Global Equity 2.93 4.33 SPDR Gold Shares 2.24 3.24
SPDR Gold Shares 2.01 2.97 Singapore Equity Fund 2.09 3.03
Singapore Equity Fund 1.97 2.91 Schroder ISF Global Equity 1.36 1.97
^ Please refer to Singapore Bond Fund for the top 10 holdings.
Important: Any difference in the total and percentage of the Net Asset Value is the result of rounding.
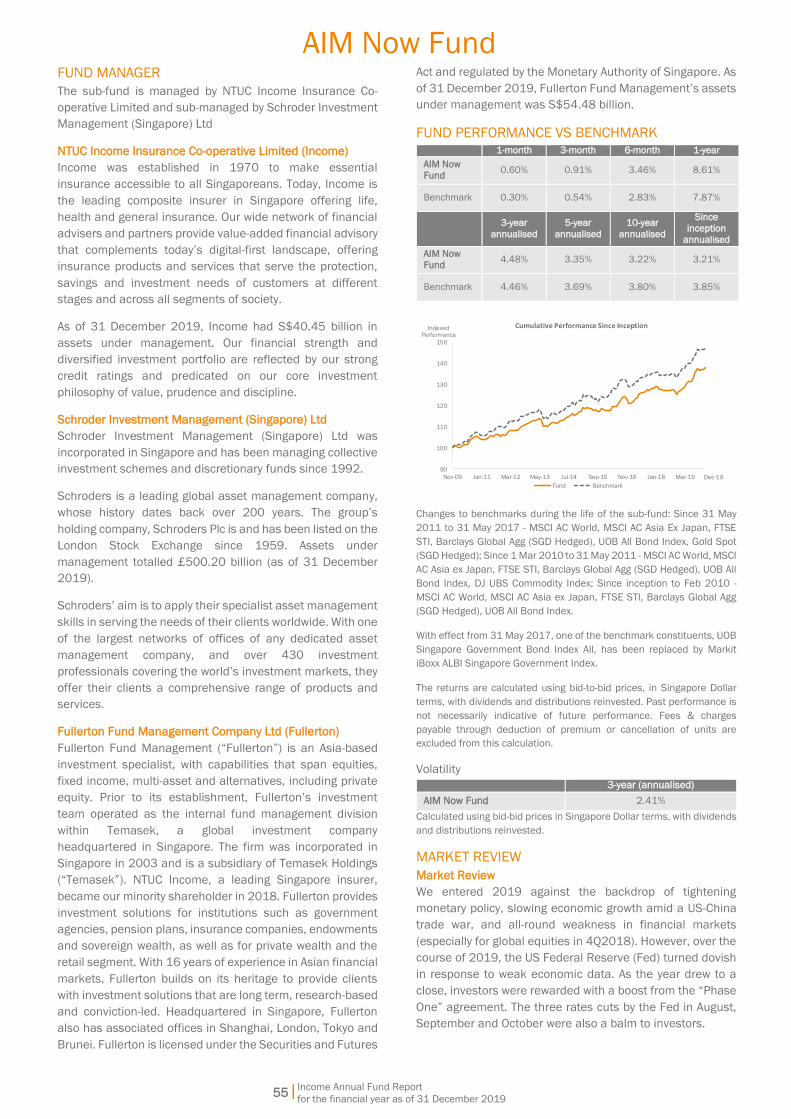
Income Annual Fund Report
for the financial year as of 31 December 2019
55|
AIM Now Fund FUND MANAGER
The sub-fund is managed by NTUC Income Insurance Co-
operative Limited and sub-managed by Schroder Investment
Management (Singapore) Ltd
NTUC Income Insurance Co-operative Limited (Income)
Income was established in 1970 to make essential
insurance accessible to all Singaporeans. Today, Income is
the leading composite insurer in Singapore offering life,
health and general insurance. Our wide network of financial
advisers and partners provide value-added financial advisory
that complements today’s digital-first landscape, offering
insurance products and services that serve the protection,
savings and investment needs of customers at different
stages and across all segments of society.
As of 31 December 2019, Income had S$40.45 billion in
assets under management. Our financial strength and
diversified investment portfolio are reflected by our strong
credit ratings and predicated on our core investment
philosophy of value, prudence and discipline.
Schroder Investment Management (Singapore) Ltd
Schroder Investment Management (Singapore) Ltd was
incorporated in Singapore and has been managing collective
investment schemes and discretionary funds since 1992.
Schroders is a leading global asset management company,
whose history dates back over 200 years. The group’s
holding company, Schroders Plc is and has been listed on the
London Stock Exchange since 1959. Assets under
management totalled £500.20 billion (as of 31 December
2019).
Schroders’ aim is to apply their specialist asset management
skills in serving the needs of their clients worldwide. With one
of the largest networks of offices of any dedicated asset
management company, and over 430 investment
professionals covering the world’s investment markets, they
offer their clients a comprehensive range of products and
services.
Fullerton Fund Management Company Ltd (Fullerton)
Fullerton Fund Management (“Fullerton”) is an Asia-based
investment specialist, with capabilities that span equities,
fixed income, multi-asset and alternatives, including private
equity. Prior to its establishment, Fullerton’s investment
team operated as the internal fund management division
within Temasek, a global investment company
headquartered in Singapore. The firm was incorporated in
Singapore in 2003 and is a subsidiary of Temasek Holdings
(“Temasek”). NTUC Income, a leading Singapore insurer,
became our minority shareholder in 2018. Fullerton provides
investment solutions for institutions such as government
agencies, pension plans, insurance companies, endowments
and sovereign wealth, as well as for private wealth and the
retail segment. With 16 years of experience in Asian financial
markets, Fullerton builds on its heritage to provide clients
with investment solutions that are long term, research-based
and conviction-led. Headquartered in Singapore, Fullerton
also has associated offices in Shanghai, London, Tokyo and
Brunei. Fullerton is licensed under the Securities and Futures
Act and regulated by the Monetary Authority of Singapore. As
of 31 December 2019, Fullerton Fund Management’s assets
under management was S$54.48 billion.
FUND PERFORMANCE VS BENCHMARK
1-month 3-month 6-month 1-year
AIM Now
Fund 0.60% 0.91% 3.46% 8.61%
Benchmark 0.30% 0.54% 2.83% 7.87%
3-year
annualised
5-year
annualised
10-year
annualised
Since
inception
annualised
AIM Now
Fund 4.48% 3.35% 3.22% 3.21%
Benchmark 4.46% 3.69% 3.80% 3.85%
90
100
110
120
130
140
150
Nov-09 Jan-11 Mar-12 May-13 Jul-14 Sep-15 Nov-16 Jan-18 Mar-19
Cumulative Performance Since Inception
Fund Benchmark
IndexedPerformance
Dec-19
Changes to benchmarks during the life of the sub-fund: Since 31 May
2011 to 31 May 2017 - MSCI AC World, MSCI AC Asia Ex Japan, FTSE
STI, Barclays Global Agg (SGD Hedged), UOB All Bond Index, Gold Spot
(SGD Hedged); Since 1 Mar 2010 to 31 May 2011 - MSCI AC World, MSCI
AC Asia ex Japan, FTSE STI, Barclays Global Agg (SGD Hedged), UOB All
Bond Index, DJ UBS Commodity Index; Since inception to Feb 2010 -
MSCI AC World, MSCI AC Asia ex Japan, FTSE STI, Barclays Global Agg
(SGD Hedged), UOB All Bond Index.
With effect from 31 May 2017, one of the benchmark constituents, UOB
Singapore Government Bond Index All, has been replaced by Markit
iBoxx ALBI Singapore Government Index.
The returns are calculated using bid-to-bid prices, in Singapore Dollar
terms, with dividends and distributions reinvested. Past performance is
not necessarily indicative of future performance. Fees & charges
payable through deduction of premium or cancellation of units are
excluded from this calculation.
Volatility
3-year (annualised)
AIM Now Fund 2.41%
Calculated using bid-bid prices in Singapore Dollar terms, with dividends
and distributions reinvested.
MARKET REVIEW
Market Review
We entered 2019 against the backdrop of tightening
monetary policy, slowing economic growth amid a US-China
trade war, and all-round weakness in financial markets
(especially for global equities in 4Q2018). However, over the
course of 2019, the US Federal Reserve (Fed) turned dovish
in response to weak economic data. As the year drew to a
close, investors were rewarded with a boost from the “Phase
One” agreement. The three rates cuts by the Fed in August,
September and October were also a balm to investors.
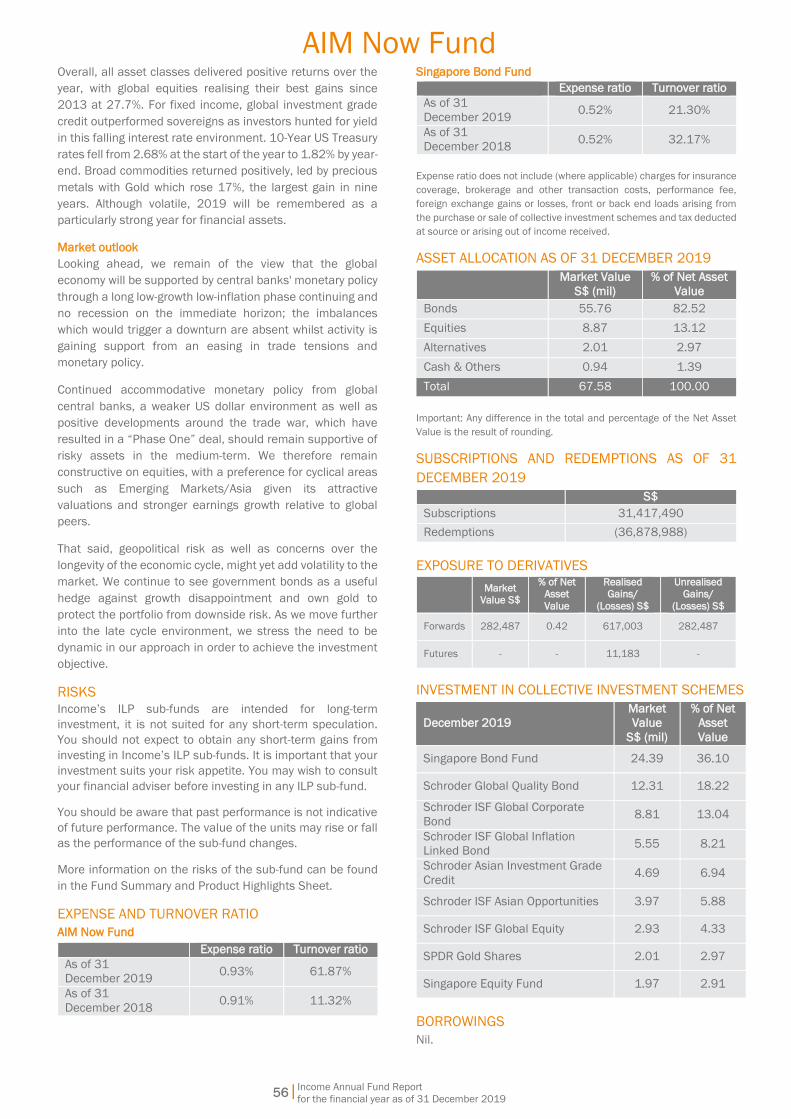
Income Annual Fund Report
for the financial year as of 31 December 2019
56|
AIM Now Fund Overall, all asset classes delivered positive returns over the
year, with global equities realising their best gains since
2013 at 27.7%. For fixed income, global investment grade
credit outperformed sovereigns as investors hunted for yield
in this falling interest rate environment. 10-Year US Treasury
rates fell from 2.68% at the start of the year to 1.82% by year-
end. Broad commodities returned positively, led by precious
metals with Gold which rose 17%, the largest gain in nine
years. Although volatile, 2019 will be remembered as a
particularly strong year for financial assets.
Market outlook
Looking ahead, we remain of the view that the global
economy will be supported by central banks' monetary policy
through a long low-growth low-inflation phase continuing and
no recession on the immediate horizon; the imbalances
which would trigger a downturn are absent whilst activity is
gaining support from an easing in trade tensions and
monetary policy.
Continued accommodative monetary policy from global
central banks, a weaker US dollar environment as well as
positive developments around the trade war, which have
resulted in a “Phase One” deal, should remain supportive of
risky assets in the medium-term. We therefore remain
constructive on equities, with a preference for cyclical areas
such as Emerging Markets/Asia given its attractive
valuations and stronger earnings growth relative to global
peers.
That said, geopolitical risk as well as concerns over the
longevity of the economic cycle, might yet add volatility to the
market. We continue to see government bonds as a useful
hedge against growth disappointment and own gold to
protect the portfolio from downside risk. As we move further
into the late cycle environment, we stress the need to be
dynamic in our approach in order to achieve the investment
objective.
RISKS
Income’s ILP sub-funds are intended for long-term
investment, it is not suited for any short-term speculation.
You should not expect to obtain any short-term gains from
investing in Income’s ILP sub-funds. It is important that your
investment suits your risk appetite. You may wish to consult
your financial adviser before investing in any ILP sub-fund.
You should be aware that past performance is not indicative
of future performance. The value of the units may rise or fall
as the performance of the sub-fund changes.
More information on the risks of the sub-fund can be found
in the Fund Summary and Product Highlights Sheet.
EXPENSE AND TURNOVER RATIO
AIM Now Fund
Expense ratio Turnover ratio
As of 31
December 2019 0.93% 61.87%
As of 31
December 2018 0.91% 11.32%
Singapore Bond Fund
Expense ratio Turnover ratio
As of 31
December 2019 0.52% 21.30%
As of 31
December 2018 0.52% 32.17%
Expense ratio does not include (where applicable) charges for insurance
coverage, brokerage and other transaction costs, performance fee,
foreign exchange gains or losses, front or back end loads arising from
the purchase or sale of collective investment schemes and tax deducted
at source or arising out of income received.
ASSET ALLOCATION AS OF 31 DECEMBER 2019
Market Value
S$ (mil)
% of Net Asset
Value
Bonds 55.76 82.52
Equities 8.87 13.12
Alternatives 2.01 2.97
Cash & Others 0.94 1.39
Total 67.58 100.00
Important: Any difference in the total and percentage of the Net Asset
Value is the result of rounding.
SUBSCRIPTIONS AND REDEMPTIONS AS OF 31
DECEMBER 2019
S$
Subscriptions 31,417,490
Redemptions (36,878,988)
EXPOSURE TO DERIVATIVES
Market
Value S$
% of Net
Asset
Value
Realised
Gains/
(Losses) S$
Unrealised
Gains/
(Losses) S$
Forwards 282,487 0.42 617,003 282,487
Futures - - 11,183 -
INVESTMENT IN COLLECTIVE INVESTMENT SCHEMES
December 2019
Market
Value
S$ (mil)
% of Net
Asset
Value
Singapore Bond Fund 24.39 36.10
Schroder Global Quality Bond 12.31 18.22
Schroder ISF Global Corporate
Bond 8.81 13.04
Schroder ISF Global Inflation
Linked Bond 5.55 8.21
Schroder Asian Investment Grade
Credit 4.69 6.94
Schroder ISF Asian Opportunities 3.97 5.88
Schroder ISF Global Equity 2.93 4.33
SPDR Gold Shares 2.01 2.97
Singapore Equity Fund 1.97 2.91
BORROWINGS
Nil.
Income Annual Fund Report
for the financial year as of 31 December 2019
57|
AIM Now Fund RELATED PARTY DISCLOSURE
Income is the Investment Manager of the sub-fund. During
the financial period ended 31 December 2019, management
fee paid or payable by the sub-fund to the Investment
Manager is S$573,996.
Fullerton is the Sub-Investment Manager of the Singapore
Bond Fund and Singapore Equity Fund, which the sub-fund
invests into. During the financial period ended 31 December
2019, they managed S$25,145,454, equivalent to 37.21%
of its net asset value.
SOFT DOLLAR COMMISSION OR ARRANGEMENT
The Manager and Sub-Investment Manager did not retain for
its own account, cash or commission rebates arising out of
transactions executed in or outside Singapore. The Manager
and Sub-Investment Manager also did not receive soft
dollars for the sub-fund.
More information on soft dollars for Singapore Bond Fund
can be found in the Fund Report of Singapore Bond Fund.
CONFLICTS OF INTEREST
Income
As the Manager of various Income ILP sub-funds and
insurance funds, we may from time to time have to deal with
competing or conflicting interests between these sub-
funds/insurance funds. However, we will use all reasonable
endeavours to act fairly and in the best interest of the sub-
fund. We will conduct all transactions with or for the sub-fund
on an arm’s length basis. The Manager has in place policies
and procedures to monitor and mitigate conflicts of interests
which may arise in the management of these sub-funds. We
believe that these policies and procedures are reasonably
designed to ensure that portfolio management decisions are
made in the best interest of the sub-fund and each sub-fund
is treated fairly, regardless of the existence of any conflict.
Schroder
Schroder has in place policies and procedures to mitigate
conflicts of interests which may arise in the management of
clients’ accounts. Schroder believes that these policies and
procedures are reasonably designed to ensure that clients
are treated fairly and material conflicts of interest are either
avoided or are managed to avoid damage to a client’s
interests.
OTHER PARTIES
The auditor of this sub-fund is KPMG LLP. Please note that
financial results ending 31 December of each year will be
audited.
MATERIAL INFORMATION
Nil.
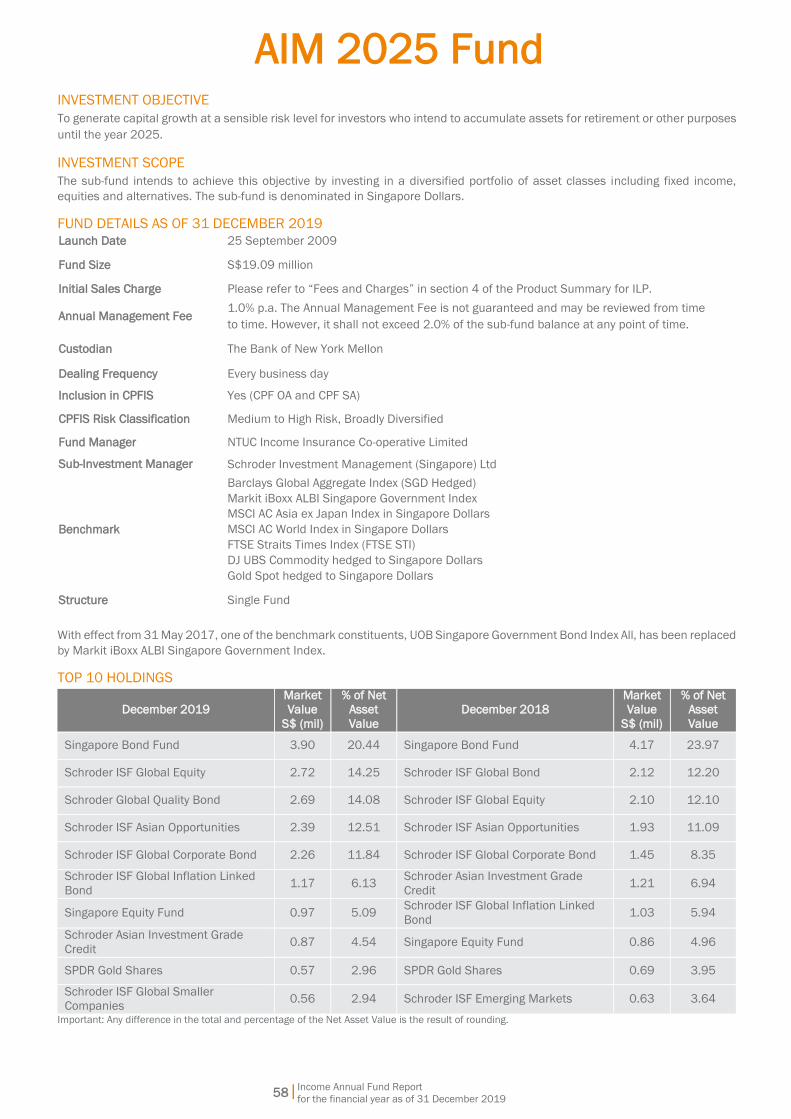
Income Annual Fund Report
for the financial year as of 31 December 2019
AIM 2025 Fund
58|
INVESTMENT OBJECTIVE
To generate capital growth at a sensible risk level for investors who intend to accumulate assets for retirement or other purposes
until the year 2025.
INVESTMENT SCOPE
The sub-fund intends to achieve this objective by investing in a diversified portfolio of asset classes including fixed income,
equities and alternatives. The sub-fund is denominated in Singapore Dollars.
FUND DETAILS AS OF 31 DECEMBER 2019
Launch Date 25 September 2009
Fund Size S$19.09 million
Initial Sales Charge Please refer to “Fees and Charges” in section 4 of the Product Summary for ILP.
Annual Management Fee 1.0% p.a. The Annual Management Fee is not guaranteed and may be reviewed from time
to time. However, it shall not exceed 2.0% of the sub-fund balance at any point of time.
Custodian The Bank of New York Mellon
Dealing Frequency Every business day
Inclusion in CPFIS Yes (CPF OA and CPF SA)
CPFIS Risk Classification Medium to High Risk, Broadly Diversified
Fund Manager NTUC Income Insurance Co-operative Limited
Sub-Investment Manager Schroder Investment Management (Singapore) Ltd
Benchmark
Barclays Global Aggregate Index (SGD Hedged)
Markit iBoxx ALBI Singapore Government Index
MSCI AC Asia ex Japan Index in Singapore Dollars
MSCI AC World Index in Singapore Dollars
FTSE Straits Times Index (FTSE STI)
DJ UBS Commodity hedged to Singapore Dollars
Gold Spot hedged to Singapore Dollars
Structure Single Fund
With effect from 31 May 2017, one of the benchmark constituents, UOB Singapore Government Bond Index All, has been replaced
by Markit iBoxx ALBI Singapore Government Index.
TOP 10 HOLDINGS
December 2019
Market
Value
S$ (mil)
% of Net
Asset
Value
December 2018
Market
Value
S$ (mil)
% of Net
Asset
Value
Singapore Bond Fund 3.90 20.44 Singapore Bond Fund 4.17 23.97
Schroder ISF Global Equity 2.72 14.25 Schroder ISF Global Bond 2.12 12.20
Schroder Global Quality Bond 2.69 14.08 Schroder ISF Global Equity 2.10 12.10
Schroder ISF Asian Opportunities 2.39 12.51 Schroder ISF Asian Opportunities 1.93 11.09
Schroder ISF Global Corporate Bond 2.26 11.84 Schroder ISF Global Corporate Bond 1.45 8.35
Schroder ISF Global Inflation Linked
Bond 1.17 6.13
Schroder Asian Investment Grade
Credit 1.21 6.94
Singapore Equity Fund 0.97 5.09 Schroder ISF Global Inflation Linked
Bond 1.03 5.94
Schroder Asian Investment Grade
Credit 0.87 4.54 Singapore Equity Fund 0.86 4.96
SPDR Gold Shares 0.57 2.96 SPDR Gold Shares 0.69 3.95
Schroder ISF Global Smaller
Companies 0.56 2.94 Schroder ISF Emerging Markets 0.63 3.64
Important: Any difference in the total and percentage of the Net Asset Value is the result of rounding.
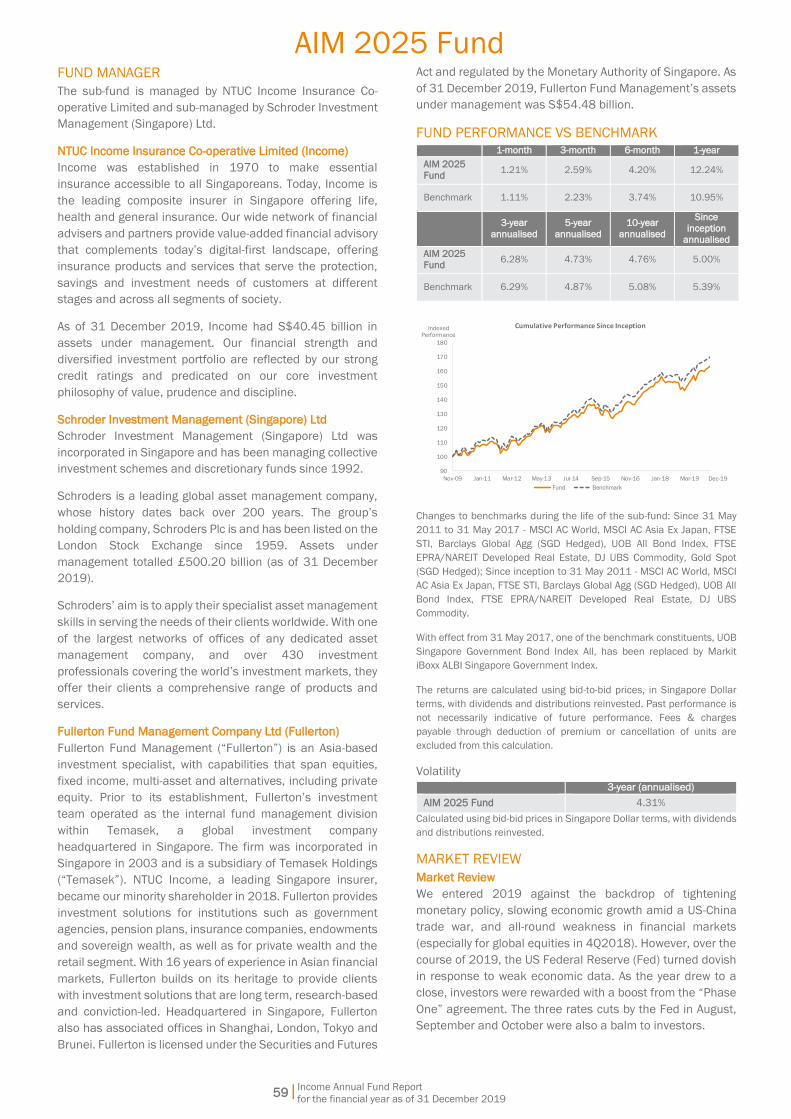
Income Annual Fund Report
for the financial year as of 31 December 2019
59|
AIM 2025 Fund FUND MANAGER
The sub-fund is managed by NTUC Income Insurance Co-
operative Limited and sub-managed by Schroder Investment
Management (Singapore) Ltd.
NTUC Income Insurance Co-operative Limited (Income)
Income was established in 1970 to make essential
insurance accessible to all Singaporeans. Today, Income is
the leading composite insurer in Singapore offering life,
health and general insurance. Our wide network of financial
advisers and partners provide value-added financial advisory
that complements today’s digital-first landscape, offering
insurance products and services that serve the protection,
savings and investment needs of customers at different
stages and across all segments of society.
As of 31 December 2019, Income had S$40.45 billion in
assets under management. Our financial strength and
diversified investment portfolio are reflected by our strong
credit ratings and predicated on our core investment
philosophy of value, prudence and discipline.
Schroder Investment Management (Singapore) Ltd
Schroder Investment Management (Singapore) Ltd was
incorporated in Singapore and has been managing collective
investment schemes and discretionary funds since 1992.
Schroders is a leading global asset management company,
whose history dates back over 200 years. The group’s
holding company, Schroders Plc is and has been listed on the
London Stock Exchange since 1959. Assets under
management totalled £500.20 billion (as of 31 December
2019).
Schroders’ aim is to apply their specialist asset management
skills in serving the needs of their clients worldwide. With one
of the largest networks of offices of any dedicated asset
management company, and over 430 investment
professionals covering the world’s investment markets, they
offer their clients a comprehensive range of products and
services.
Fullerton Fund Management Company Ltd (Fullerton)
Fullerton Fund Management (“Fullerton”) is an Asia-based
investment specialist, with capabilities that span equities,
fixed income, multi-asset and alternatives, including private
equity. Prior to its establishment, Fullerton’s investment
team operated as the internal fund management division
within Temasek, a global investment company
headquartered in Singapore. The firm was incorporated in
Singapore in 2003 and is a subsidiary of Temasek Holdings
(“Temasek”). NTUC Income, a leading Singapore insurer,
became our minority shareholder in 2018. Fullerton provides
investment solutions for institutions such as government
agencies, pension plans, insurance companies, endowments
and sovereign wealth, as well as for private wealth and the
retail segment. With 16 years of experience in Asian financial
markets, Fullerton builds on its heritage to provide clients
with investment solutions that are long term, research-based
and conviction-led. Headquartered in Singapore, Fullerton
also has associated offices in Shanghai, London, Tokyo and
Brunei. Fullerton is licensed under the Securities and Futures
Act and regulated by the Monetary Authority of Singapore. As
of 31 December 2019, Fullerton Fund Management’s assets
under management was S$54.48 billion.
FUND PERFORMANCE VS BENCHMARK
1-month 3-month 6-month 1-year
AIM 2025
Fund 1.21% 2.59% 4.20% 12.24%
Benchmark 1.11% 2.23% 3.74% 10.95%
3-year
annualised
5-year
annualised
10-year
annualised
Since
inception
annualised
AIM 2025
Fund 6.28% 4.73% 4.76% 5.00%
Benchmark 6.29% 4.87% 5.08% 5.39%
90
100
110
120
130
140
150
160
170
180
Nov-09 Jan-11 Mar-12 May-13 Jul-14 Sep-15 Nov-16 Jan-18 Mar-19
Cumulative Performance Since Inception
Fund Benchmark
IndexedPerformance
Dec-19
Changes to benchmarks during the life of the sub-fund: Since 31 May
2011 to 31 May 2017 - MSCI AC World, MSCI AC Asia Ex Japan, FTSE
STI, Barclays Global Agg (SGD Hedged), UOB All Bond Index, FTSE
EPRA/NAREIT Developed Real Estate, DJ UBS Commodity, Gold Spot
(SGD Hedged); Since inception to 31 May 2011 - MSCI AC World, MSCI
AC Asia Ex Japan, FTSE STI, Barclays Global Agg (SGD Hedged), UOB All
Bond Index, FTSE EPRA/NAREIT Developed Real Estate, DJ UBS
Commodity.
With effect from 31 May 2017, one of the benchmark constituents, UOB
Singapore Government Bond Index All, has been replaced by Markit
iBoxx ALBI Singapore Government Index.
The returns are calculated using bid-to-bid prices, in Singapore Dollar
terms, with dividends and distributions reinvested. Past performance is
not necessarily indicative of future performance. Fees & charges
payable through deduction of premium or cancellation of units are
excluded from this calculation.
Volatility
3-year (annualised)
AIM 2025 Fund 4.31%
Calculated using bid-bid prices in Singapore Dollar terms, with dividends
and distributions reinvested.
MARKET REVIEW
Market Review
We entered 2019 against the backdrop of tightening
monetary policy, slowing economic growth amid a US-China
trade war, and all-round weakness in financial markets
(especially for global equities in 4Q2018). However, over the
course of 2019, the US Federal Reserve (Fed) turned dovish
in response to weak economic data. As the year drew to a
close, investors were rewarded with a boost from the “Phase
One” agreement. The three rates cuts by the Fed in August,
September and October were also a balm to investors.

Income Annual Fund Report
for the financial year as of 31 December 2019
60|
AIM 2025 Fund Overall, all asset classes delivered positive returns over the
year, with global equities realising their best gains since
2013 at 27.7%. For fixed income, global investment grade
credit outperformed sovereigns as investors hunted for yield
in this falling interest rate environment. 10-Year US Treasury
rates fell from 2.68% at the start of the year to 1.82% by year-
end. Broad commodities returned positively, led by precious
metals with Gold which rose 17%, the largest gain in nine
years. Although volatile, 2019 will be remembered as a
particularly strong year for financial assets.
Market outlook
Looking ahead, we remain of the view that the global
economy will be supported by central banks' monetary policy
through a long low-growth low-inflation phase continuing and
no recession on the immediate horizon; the imbalances
which would trigger a downturn are absent whilst activity is
gaining support from an easing in trade tensions and
monetary policy.
Continued accommodative monetary policy from global
central banks, a weaker US dollar environment as well as
positive developments around the trade war, which have
resulted in a “Phase One” deal, should remain supportive of
risky assets in the medium-term. We therefore remain
constructive on equities, with a preference for cyclical areas
such as Emerging Markets/Asia given its attractive
valuations and stronger earnings growth relative to global
peers.
That said, geopolitical risk as well as concerns over the
longevity of the economic cycle, might yet add volatility to the
market. We continue to see government bonds as a useful
hedge against growth disappointment and own gold to
protect the portfolio from downside risk. As we move further
into the late cycle environment, we stress the need to be
dynamic in our approach in order to achieve the investment
objective.
RISKS
Income’s ILP sub-funds are intended for long-term
investment, it is not suited for any short-term speculation.
You should not expect to obtain any short-term gains from
investing in Income’s ILP sub-funds. It is important that your
investment suits your risk appetite. You may wish to consult
your financial adviser before investing in any ILP sub-fund.
You should be aware that past performance is not indicative
of future performance. The value of the units may rise or fall
as the performance of the sub-fund changes.
More information on the risks of the sub-fund can be found
in the Fund Summary and Product Highlights Sheet.
EXPENSE AND TURNOVER RATIO
Expense ratio Turnover ratio
As of 31
December 2019 1.16% 39.61%
As of 31
December 2018 1.21% 28.31%
Expense ratio does not include (where applicable) charges for insurance
coverage, brokerage and other transaction costs, performance fee,
foreign exchange gains or losses, front or back end loads arising from
the purchase or sale of collective investment schemes and tax deducted
at source or arising out of income received.
ASSET ALLOCATION AS OF 31 DECEMBER 2019
Market Value
S$ (mil)
% of Net Asset
Value
Bonds 10.88 57.03
Equities 7.15 37.45
Alternatives 0.76 3.96
Cash & Others 0.30 1.56
Total 19.09 100.00
Important: Any difference in the total and percentage of the Net Asset
Value is the result of rounding.
SUBSCRIPTIONS AND REDEMPTIONS AS OF 31
DECEMBER 2019
S$
Subscriptions 4,165,280
Redemptions (4,614,453)
EXPOSURE TO DERIVATIVES
Market
Value S$
% of Net
Asset
Value
Realised
Gains/
(Losses) S$
Unrealised
Gains/
(Losses) S$
Forwards 68,433 0.36 142,383 68,433
Futures - - 2,267 -
INVESTMENT IN COLLECTIVE INVESTMENT SCHEMES
December 2019
Market
Value
S$ (mil)
% of Net
Asset
Value
Singapore Bond Fund 3.90 20.44
Schroder ISF Global Equity 2.72 14.25
Schroder Global Quality Bond 2.69 14.08
Schroder ISF Asian Opportunities 2.39 12.51
Schroder ISF Global Corporate Bond 2.26 11.84
Schroder ISF Global Inflation Linked
Bond 1.17 6.13
Singapore Equity Fund 0.97 5.09
Schroder Asian Investment Grade
Credit 0.87 4.54
SPDR Gold Shares 0.57 2.96
Schroder ISF Global Smaller
Companies 0.56 2.94
Schroder ISF Emerging Markets 0.51 2.65
Schroder Alt Solutions Commodity 0.19 1.00
BORROWINGS
Nil.

Income Annual Fund Report
for the financial year as of 31 December 2019
61|
AIM 2025 Fund RELATED PARTY DISCLOSURE
Income is the Investment Manager of the sub-fund. During
the financial period ended 31 December 2019, management
fee paid or payable by the sub-fund to the Investment
Manager is S$187,947.
Fullerton is the Sub-Investment Manager of the Singapore
Bond Fund and Singapore Equity Fund, which the sub-fund
invests into. During the financial period ended 31 December
2019, they managed S$4,273,416, equivalent to 22.39% of
its net asset value.
SOFT DOLLAR COMMISSION OR ARRANGEMENT
The Manager and Sub-Investment Manager did not retain for
its own account, cash or commission rebates arising out of
transactions executed in or outside Singapore. The Manager
and Sub-Investment Manager also did not receive soft
dollars for the sub-fund.
CONFLICTS OF INTEREST
Income
As the Manager of various Income ILP sub-funds and
insurance funds, we may from time to time have to deal with
competing or conflicting interests between these sub-
funds/insurance funds. However, we will use all reasonable
endeavours to act fairly and in the best interest of the sub-
fund.
We will conduct all transactions with or for the sub-fund on
an arm’s length basis. The Manager has in place policies and
procedures to monitor and mitigate conflicts of interests
which may arise in the management of these sub-funds. We
believe that these policies and procedures are reasonably
designed to ensure that portfolio management decisions are
made in the best interest of the sub-fund and each sub-fund
is treated fairly, regardless of the existence of any conflict.
Schroder
Schroder has in place policies and procedures to mitigate
conflicts of interests which may arise in the management of
clients’ accounts. Schroder believes that these policies and
procedures are reasonably designed to ensure that clients
are treated fairly and material conflicts of interest are either
avoided or are managed to avoid damage to a client’s
interests.
OTHER PARTIES
The auditor of this sub-fund is KPMG LLP. Please note that
financial results ending 31 December of each year will be
audited.
MATERIAL INFORMATION
Nil.
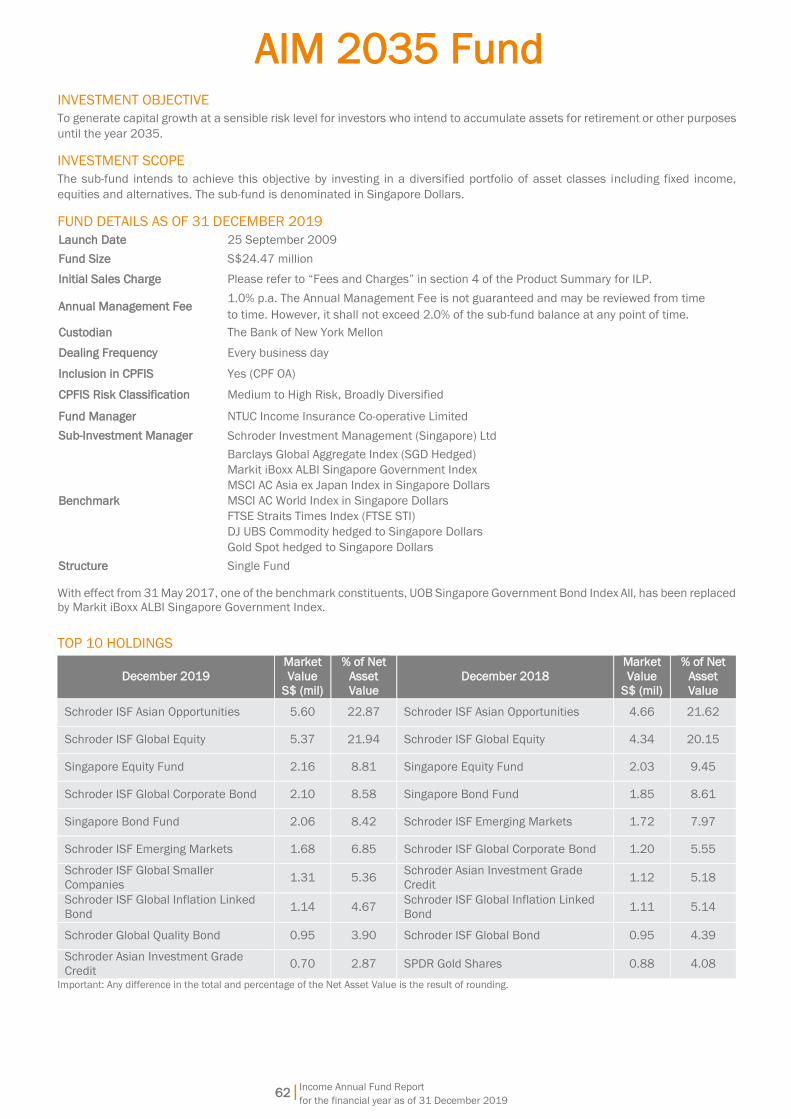
Income Annual Fund Report
for the financial year as of 31 December 2019 62|
AIM 2035 Fund
INVESTMENT OBJECTIVE
To generate capital growth at a sensible risk level for investors who intend to accumulate assets for retirement or other purposes
until the year 2035.
INVESTMENT SCOPE
The sub-fund intends to achieve this objective by investing in a diversified portfolio of asset classes including fixed income,
equities and alternatives. The sub-fund is denominated in Singapore Dollars.
FUND DETAILS AS OF 31 DECEMBER 2019
Launch Date 25 September 2009
Fund Size S$24.47 million
Initial Sales Charge Please refer to “Fees and Charges” in section 4 of the Product Summary for ILP.
Annual Management Fee 1.0% p.a. The Annual Management Fee is not guaranteed and may be reviewed from time
to time. However, it shall not exceed 2.0% of the sub-fund balance at any point of time.
Custodian The Bank of New York Mellon
Dealing Frequency Every business day
Inclusion in CPFIS Yes (CPF OA)
CPFIS Risk Classification Medium to High Risk, Broadly Diversified
Fund Manager NTUC Income Insurance Co-operative Limited
Sub-Investment Manager Schroder Investment Management (Singapore) Ltd
Benchmark
Barclays Global Aggregate Index (SGD Hedged)
Markit iBoxx ALBI Singapore Government Index
MSCI AC Asia ex Japan Index in Singapore Dollars
MSCI AC World Index in Singapore Dollars
FTSE Straits Times Index (FTSE STI)
DJ UBS Commodity hedged to Singapore Dollars
Gold Spot hedged to Singapore Dollars
Structure Single Fund
With effect from 31 May 2017, one of the benchmark constituents, UOB Singapore Government Bond Index All, has been replaced
by Markit iBoxx ALBI Singapore Government Index.
TOP 10 HOLDINGS
December 2019
Market
Value
S$ (mil)
% of Net
Asset
Value
December 2018
Market
Value
S$ (mil)
% of Net
Asset
Value
Schroder ISF Asian Opportunities 5.60 22.87 Schroder ISF Asian Opportunities 4.66 21.62
Schroder ISF Global Equity 5.37 21.94 Schroder ISF Global Equity 4.34 20.15
Singapore Equity Fund 2.16 8.81 Singapore Equity Fund 2.03 9.45
Schroder ISF Global Corporate Bond 2.10 8.58 Singapore Bond Fund 1.85 8.61
Singapore Bond Fund 2.06 8.42 Schroder ISF Emerging Markets 1.72 7.97
Schroder ISF Emerging Markets 1.68 6.85 Schroder ISF Global Corporate Bond 1.20 5.55
Schroder ISF Global Smaller
Companies 1.31 5.36
Schroder Asian Investment Grade
Credit 1.12 5.18
Schroder ISF Global Inflation Linked
Bond 1.14 4.67
Schroder ISF Global Inflation Linked
Bond 1.11 5.14
Schroder Global Quality Bond 0.95 3.90 Schroder ISF Global Bond 0.95 4.39
Schroder Asian Investment Grade
Credit 0.70 2.87 SPDR Gold Shares 0.88 4.08
Important: Any difference in the total and percentage of the Net Asset Value is the result of rounding.

Income Annual Fund Report
for the financial year as of 31 December 2019 63|
AIM 2035 Fund
FUND MANAGER
The sub-fund is managed by NTUC Income Insurance Co-
operative Limited and sub-managed by Schroder Investment
Management (Singapore) Ltd.
NTUC Income Insurance Co-operative Limited (Income)
Income was established in 1970 to make essential
insurance accessible to all Singaporeans. Today, Income is
the leading composite insurer in Singapore offering life,
health and general insurance. Our wide network of financial
advisers and partners provide value-added financial advisory
that complements today’s digital-first landscape, offering
insurance products and services that serve the protection,
savings and investment needs of customers at different
stages and across all segments of society.
As of 31 December 2019, Income had S$40.45 billion in
assets under management. Our financial strength and
diversified investment portfolio are reflected by our strong
credit ratings and predicated on our core investment
philosophy of value, prudence and discipline.
Schroder Investment Management (Singapore) Ltd
Schroder Investment Management (Singapore) Ltd was
incorporated in Singapore and has been managing collective
investment schemes and discretionary funds since 1992.
Schroders is a leading global asset management company,
whose history dates back over 200 years. The group’s
holding company, Schroders Plc is and has been listed on
the London Stock Exchange since 1959. Assets under
management totalled £500.20 billion (as of 31 December
2019).
Schroders’ aim is to apply their specialist asset management
skills in serving the needs of their clients worldwide. With one
of the largest networks of offices of any dedicated asset
management company, and over 430 investment
professionals covering the world’s investment markets, they
offer their clients a comprehensive range of products and
services.
Fullerton Fund Management Company Ltd (Fullerton)
Fullerton Fund Management (“Fullerton”) is an Asia-based
investment specialist, with capabilities that span equities,
fixed income, multi-asset and alternatives, including private
equity. Prior to its establishment, Fullerton’s investment
team operated as the internal fund management division
within Temasek, a global investment company
headquartered in Singapore. The firm was incorporated in
Singapore in 2003 and is a subsidiary of Temasek Holdings
(“Temasek”). NTUC Income, a leading Singapore insurer,
became our minority shareholder in 2018. Fullerton provides
investment solutions for institutions such as government
agencies, pension plans, insurance companies,
endowments and sovereign wealth, as well as for private
wealth and the retail segment. With 16 years of experience
in Asian financial markets, Fullerton builds on its heritage to
provide clients with investment solutions that are long term,
research-based and conviction-led. Headquartered in
Singapore, Fullerton also has associated offices in Shanghai,
London, Tokyo and Brunei. Fullerton is licensed under the
Securities and Futures Act and regulated by the Monetary
Authority of Singapore. As of 31 December 2019, Fullerton
Fund Management’s assets under management was
S$54.48 billion.
FUND PERFORMANCE VS BENCHMARK 1-month 3-month 6-month 1-year
AIM 2035
Fund 2.13% 4.78% 5.09% 16.22%
Benchmark 2.02% 4.19% 4.65% 14.41%
3-year
annualised
5-year
annualised
10-year
annualised
Since
inception
annualised
AIM 2035
Fund 8.22% 6.16% 5.77% 6.18%
Benchmark 7.82% 5.98% 5.87% 6.31%
90
110
130
150
170
190
210
Nov-09 Jan-11 Mar-12 May-13 Jul-14 Sep-15 Nov-16 Jan-18 Mar-19
Cumulative Performance Since Inception
Fund Benchmark
IndexedPerformance
Dec-19
Changes to benchmarks during the life of the sub-fund: Since 31 May
2011 to 31 May 2017 - MSCI AC World, MSCI AC Asia Ex Japan, FTSE
STI, Barclays Global Agg (SGD Hedged), UOB All Bond Index, FTSE
EPRA/NAREIT Developed Real Estate, DJ UBS Commodity, Gold Spot
(SGD Hedged); Since inception to 31 May 2011 - MSCI AC World, MSCI
AC Asia Ex Japan, FTSE STI, Barclays Global Agg (SGD Hedged), UOB All
Bond Index, FTSE EPRA/NAREIT Developed Real Estate, DJ UBS
Commodity.
With effect from 31 May 2017, one of the benchmark constituents, UOB
Singapore Government Bond Index All, has been replaced by Markit
iBoxx ALBI Singapore Government Index.
The returns are calculated using bid-to-bid prices, in Singapore Dollar
terms, with dividends and distributions reinvested. Past performance is
not necessarily indicative of future performance. Fees & charges
payable through deduction of premium or cancellation of units are
excluded from this calculation.
Volatility
3-year (annualised)
AIM 2035 Fund 7.32%
Calculated using bid-bid prices in Singapore Dollar terms, with dividends
and distributions reinvested.
MARKET REVIEW
Market Review
We entered 2019 against the backdrop of tightening
monetary policy, slowing economic growth amid a US-China
trade war, and all-round weakness in financial markets
(especially for global equities in 4Q2018). However, over the
course of 2019, the US Federal Reserve (Fed) turned dovish
in response to weak economic data. As the year drew to a
close, investors were rewarded with a boost from the “Phase
One” agreement. The three rates cuts by the Fed in August,
September and October were also a balm to investors.

Income Annual Fund Report
for the financial year as of 31 December 2019 64|
AIM 2035 Fund
Overall, all asset classes delivered positive returns over the
year, with global equities realising their best gains since
2013 at 27.7%. For fixed income, global investment grade
credit outperformed sovereigns as investors hunted for yield
in this falling interest rate environment. 10-Year US Treasury
rates fell from 2.68% at the start of the year to 1.82% by year-
end. Broad commodities returned positively, led by precious
metals with Gold which rose 17%, the largest gain in nine
years. Although volatile, 2019 will be remembered as a
particularly strong year for financial assets.
Market outlook
Looking ahead, we remain of the view that the global
economy will be supported by central banks' monetary policy
through a long low-growth low-inflation phase continuing and
no recession on the immediate horizon; the imbalances
which would trigger a downturn are absent whilst activity is
gaining support from an easing in trade tensions and
monetary policy.
Continued accommodative monetary policy from global
central banks, a weaker US dollar environment as well as
positive developments around the trade war, which have
resulted in a “Phase One” deal, should remain supportive of
risky assets in the medium-term. We therefore remain
constructive on equities, with a preference for cyclical areas
such as Emerging Markets/Asia given its attractive
valuations and stronger earnings growth relative to global
peers.
That said, geopolitical risk as well as concerns over the
longevity of the economic cycle, might yet add volatility to the
market. We continue to see government bonds as a useful
hedge against growth disappointment and own gold to
protect the portfolio from downside risk. As we move further
into the late cycle environment, we stress the need to be
dynamic in our approach in order to achieve the investment
objective.
RISKS
Income’s ILP sub-funds are intended for long-term
investment, it is not suited for any short-term speculation.
You should not expect to obtain any short-term gains from
investing in Income’s ILP sub-funds. It is important that your
investment suits your risk appetite. You may wish to consult
your financial adviser before investing in any ILP sub-fund.
You should be aware that past performance is not indicative
of future performance. The value of the units may rise or fall
as the performance of the sub-fund changes.
More information on the risks of the sub-fund can be found
in the Fund Summary and Product Highlights Sheet.
EXPENSE AND TURNOVER RATIO
Expense ratio Turnover ratio
As of 31
December 2019 1.20% 21.29%
As of 31
December 2018 1.24% 31.19%
Expense ratio does not include (where applicable) charges for insurance
coverage, brokerage and other transaction costs, performance fee,
foreign exchange gains or losses, front or back end loads arising from
the purchase or sale of collective investment schemes and tax deducted
at source or arising out of income received.
ASSET ALLOCATION AS OF 31 DECEMBER 2019
Market Value
S$ (mil)
% of Net Asset
Value
Bonds 6.96 28.44
Equities 16.11 65.84
Alternatives 0.87 3.56
Cash & Others 0.53 2.16
Total 24.47 100.00
Important: Any difference in the total and percentage of the Net Asset
Value is the result of rounding.
SUBSCRIPTIONS AND REDEMPTIONS AS OF 31
DECEMBER 2019
S$
Subscriptions 1,693,075
Redemptions (2,230,485)
EXPOSURE TO DERIVATIVES
Market
Value S$
% of Net
Asset
Value
Realised
Gains/
(Losses) S$
Unrealised
Gains/
(Losses) S$
Forwards 57,259 0.23 116,550 57,259
Futures - - 4,198 -
INVESTMENT IN COLLECTIVE INVESTMENT SCHEMES
December 2019
Market
Value
S$ (mil)
% of Net
Asset
Value
Schroder ISF Asian Opportunities 5.60 22.87
Schroder ISF Global Equity 5.37 21.94
Singapore Equity Fund 2.16 8.81
Schroder ISF Global Corporate Bond 2.10 8.58
Singapore Bond Fund 2.06 8.42
Schroder ISF Emerging Markets 1.68 6.85
Schroder ISF Global Smaller
Companies 1.31 5.36
Schroder ISF Global Inflation Linked
Bond 1.14 4.67
Schroder Global Quality Bond 0.95 3.90
Schroder Asian Investment Grade
Credit 0.70 2.87
SPDR Gold Shares 0.63 2.56
Schroder Alt Solutions Commodity 0.24 1.00
BORROWINGS Nil.

Income Annual Fund Report
for the financial year as of 31 December 2019 65|
AIM 2035 Fund
RELATED PARTY DISCLOSURE
Income is the Investment Manager of the sub-fund. During
the financial period ended 31 December 2019,
management fee paid or payable by the sub-fund to the
Investment Manager is S$232,151.
Fullerton is the Sub-Investment Manager of the Singapore
Bond Fund and Singapore Equity Fund, which the sub-fund
invests into. During the financial period ended 31 December
2019, they managed S$2,884,117, equivalent to 11.79% of
its net asset value.
SOFT DOLLAR COMMISSION OR ARRANGEMENT
The Manager and Sub-Investment Manager did not retain for
its own account, cash or commission rebates arising out of
transactions executed in or outside Singapore. The Manager
and Sub-Investment Manager also did not receive soft
dollars for the sub-fund.
CONFLICTS OF INTEREST
Income
As the Manager of various Income ILP sub-funds and
insurance funds, we may from time to time have to deal with
competing or conflicting interests between these
subfunds/insurance funds. However, we will use all
reasonable endeavours to act fairly and in the best interest
of the sub-fund.
We will conduct all transactions with or for the sub-fund on
an arm’s length basis. The Manager has in place policies and
procedures to monitor and mitigate conflicts of interests
which may arise in the management of these sub-funds. We
believe that these policies and procedures are reasonably
designed to ensure that portfolio management decisions are
made in the best interest of the sub-fund and each sub-fund
is treated fairly, regardless of the existence of any conflict.
Schroder
Schroder has in place policies and procedures to mitigate
conflicts of interests which may arise in the management of
clients’ accounts. Schroder believes that these policies and
procedures are reasonably designed to ensure that clients
are treated fairly and material conflicts of interest are either
avoided or are managed to avoid damage to a client’s
interests.
OTHER PARTIES
The auditor of this sub-fund is KPMG LLP. Please note that
financial results ending 31 December of each year will be
audited.
MATERIAL INFORMATION
Nil.
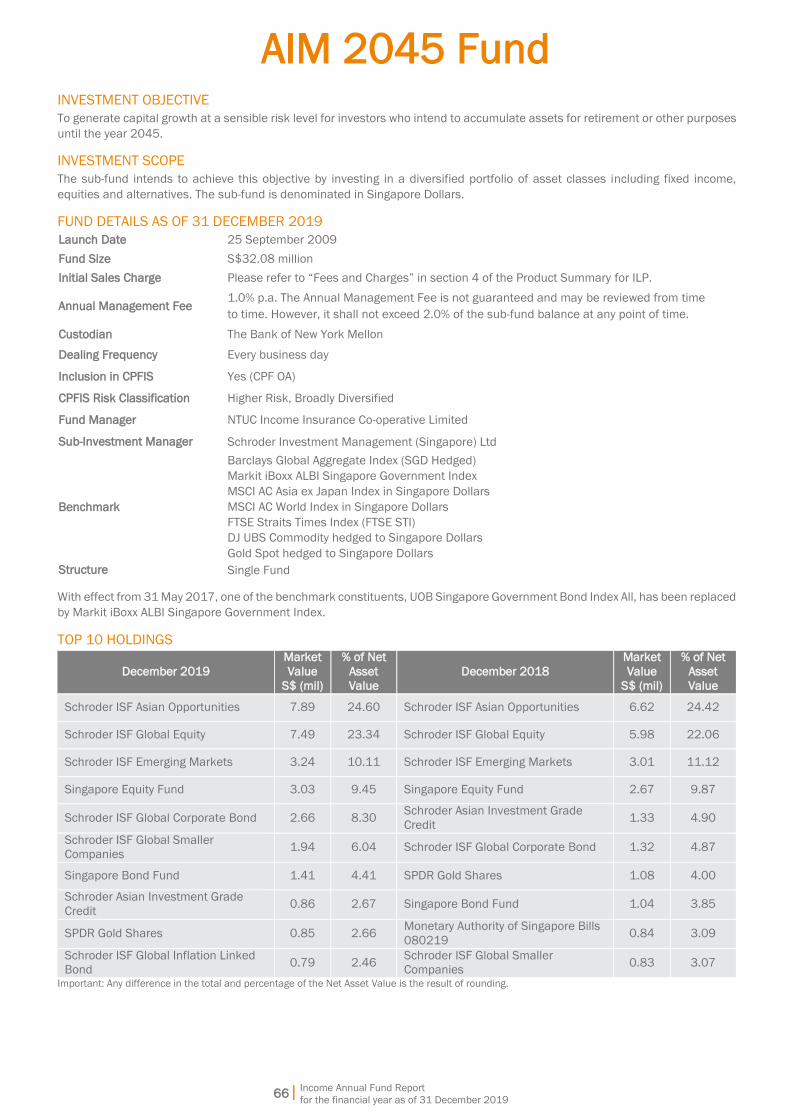
Income Annual Fund Report
for the financial year as of 31 December 2019
AIM 2045 Fund
66|
INVESTMENT OBJECTIVE
To generate capital growth at a sensible risk level for investors who intend to accumulate assets for retirement or other purposes
until the year 2045.
INVESTMENT SCOPE
The sub-fund intends to achieve this objective by investing in a diversified portfolio of asset classes including fixed income,
equities and alternatives. The sub-fund is denominated in Singapore Dollars.
FUND DETAILS AS OF 31 DECEMBER 2019
Launch Date 25 September 2009
Fund Size S$32.08 million
Initial Sales Charge Please refer to “Fees and Charges” in section 4 of the Product Summary for ILP.
Annual Management Fee 1.0% p.a. The Annual Management Fee is not guaranteed and may be reviewed from time
to time. However, it shall not exceed 2.0% of the sub-fund balance at any point of time.
Custodian The Bank of New York Mellon
Dealing Frequency Every business day
Inclusion in CPFIS Yes (CPF OA)
CPFIS Risk Classification Higher Risk, Broadly Diversified
Fund Manager NTUC Income Insurance Co-operative Limited
Sub-Investment Manager Schroder Investment Management (Singapore) Ltd
Benchmark
Barclays Global Aggregate Index (SGD Hedged)
Markit iBoxx ALBI Singapore Government Index
MSCI AC Asia ex Japan Index in Singapore Dollars
MSCI AC World Index in Singapore Dollars
FTSE Straits Times Index (FTSE STI)
DJ UBS Commodity hedged to Singapore Dollars
Gold Spot hedged to Singapore Dollars
Structure Single Fund
With effect from 31 May 2017, one of the benchmark constituents, UOB Singapore Government Bond Index All, has been replaced
by Markit iBoxx ALBI Singapore Government Index.
TOP 10 HOLDINGS
December 2019
Market
Value
S$ (mil)
% of Net
Asset
Value
December 2018
Market
Value
S$ (mil)
% of Net
Asset
Value
Schroder ISF Asian Opportunities 7.89 24.60 Schroder ISF Asian Opportunities 6.62 24.42
Schroder ISF Global Equity 7.49 23.34 Schroder ISF Global Equity 5.98 22.06
Schroder ISF Emerging Markets 3.24 10.11 Schroder ISF Emerging Markets 3.01 11.12
Singapore Equity Fund 3.03 9.45 Singapore Equity Fund 2.67 9.87
Schroder ISF Global Corporate Bond 2.66 8.30 Schroder Asian Investment Grade
Credit 1.33 4.90
Schroder ISF Global Smaller
Companies 1.94 6.04 Schroder ISF Global Corporate Bond 1.32 4.87
Singapore Bond Fund 1.41 4.41 SPDR Gold Shares 1.08 4.00
Schroder Asian Investment Grade
Credit 0.86 2.67 Singapore Bond Fund 1.04 3.85
SPDR Gold Shares 0.85 2.66 Monetary Authority of Singapore Bills
080219 0.84 3.09
Schroder ISF Global Inflation Linked
Bond 0.79 2.46
Schroder ISF Global Smaller
Companies 0.83 3.07
Important: Any difference in the total and percentage of the Net Asset Value is the result of rounding.
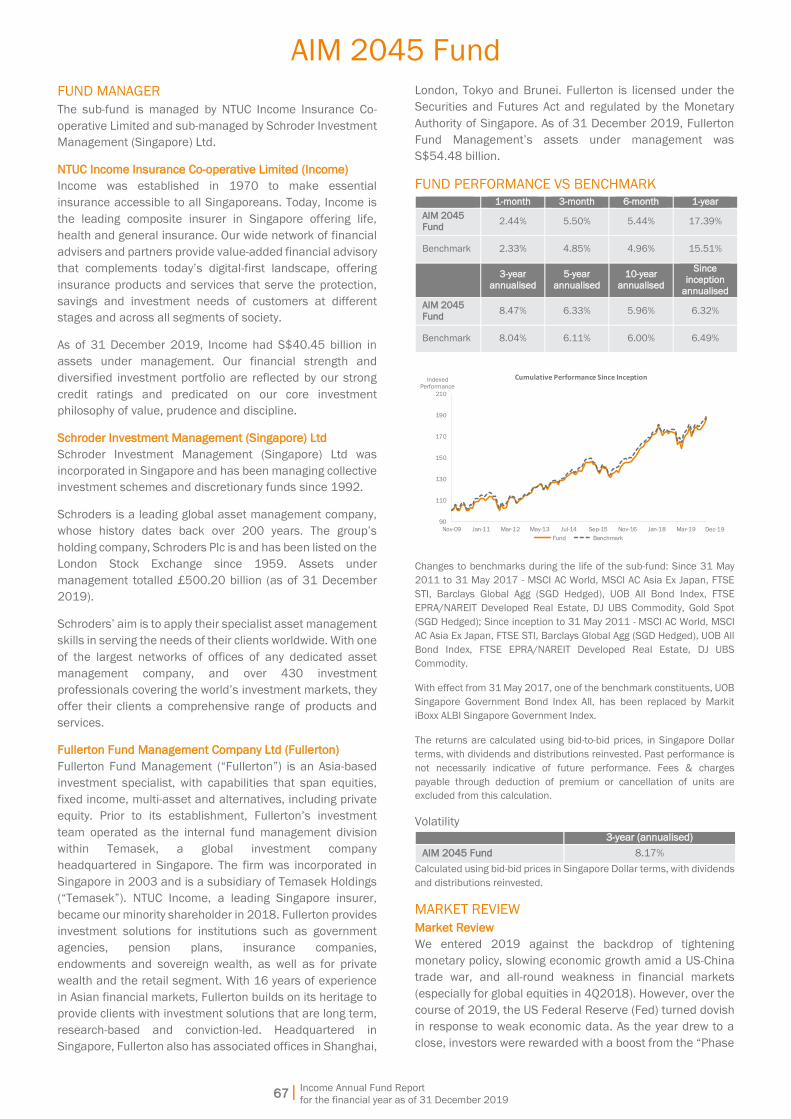
AIM 2045 Fund
Income Annual Fund Report
for the financial year as of 31 December 2019
67|
FUND MANAGER
The sub-fund is managed by NTUC Income Insurance Co-
operative Limited and sub-managed by Schroder Investment
Management (Singapore) Ltd.
NTUC Income Insurance Co-operative Limited (Income)
Income was established in 1970 to make essential
insurance accessible to all Singaporeans. Today, Income is
the leading composite insurer in Singapore offering life,
health and general insurance. Our wide network of financial
advisers and partners provide value-added financial advisory
that complements today’s digital-first landscape, offering
insurance products and services that serve the protection,
savings and investment needs of customers at different
stages and across all segments of society.
As of 31 December 2019, Income had S$40.45 billion in
assets under management. Our financial strength and
diversified investment portfolio are reflected by our strong
credit ratings and predicated on our core investment
philosophy of value, prudence and discipline.
Schroder Investment Management (Singapore) Ltd
Schroder Investment Management (Singapore) Ltd was
incorporated in Singapore and has been managing collective
investment schemes and discretionary funds since 1992.
Schroders is a leading global asset management company,
whose history dates back over 200 years. The group’s
holding company, Schroders Plc is and has been listed on the
London Stock Exchange since 1959. Assets under
management totalled £500.20 billion (as of 31 December
2019).
Schroders’ aim is to apply their specialist asset management
skills in serving the needs of their clients worldwide. With one
of the largest networks of offices of any dedicated asset
management company, and over 430 investment
professionals covering the world’s investment markets, they
offer their clients a comprehensive range of products and
services.
Fullerton Fund Management Company Ltd (Fullerton)
Fullerton Fund Management (“Fullerton”) is an Asia-based
investment specialist, with capabilities that span equities,
fixed income, multi-asset and alternatives, including private
equity. Prior to its establishment, Fullerton’s investment
team operated as the internal fund management division
within Temasek, a global investment company
headquartered in Singapore. The firm was incorporated in
Singapore in 2003 and is a subsidiary of Temasek Holdings
(“Temasek”). NTUC Income, a leading Singapore insurer,
became our minority shareholder in 2018. Fullerton provides
investment solutions for institutions such as government
agencies, pension plans, insurance companies,
endowments and sovereign wealth, as well as for private
wealth and the retail segment. With 16 years of experience
in Asian financial markets, Fullerton builds on its heritage to
provide clients with investment solutions that are long term,
research-based and conviction-led. Headquartered in
Singapore, Fullerton also has associated offices in Shanghai,
London, Tokyo and Brunei. Fullerton is licensed under the
Securities and Futures Act and regulated by the Monetary
Authority of Singapore. As of 31 December 2019, Fullerton
Fund Management’s assets under management was
S$54.48 billion.
FUND PERFORMANCE VS BENCHMARK
1-month 3-month 6-month 1-year
AIM 2045
Fund 2.44% 5.50% 5.44% 17.39%
Benchmark 2.33% 4.85% 4.96% 15.51%
3-year
annualised
5-year
annualised
10-year
annualised
Since
inception
annualised
AIM 2045
Fund 8.47% 6.33% 5.96% 6.32%
Benchmark 8.04% 6.11% 6.00% 6.49%
90
110
130
150
170
190
210
Nov-09 Jan-11 Mar-12 May-13 Jul-14 Sep-15 Nov-16 Jan-18 Mar-19
Cumulative Performance Since Inception
Fund Benchmark
IndexedPerformance
Dec-19
Changes to benchmarks during the life of the sub-fund: Since 31 May
2011 to 31 May 2017 - MSCI AC World, MSCI AC Asia Ex Japan, FTSE
STI, Barclays Global Agg (SGD Hedged), UOB All Bond Index, FTSE
EPRA/NAREIT Developed Real Estate, DJ UBS Commodity, Gold Spot
(SGD Hedged); Since inception to 31 May 2011 - MSCI AC World, MSCI
AC Asia Ex Japan, FTSE STI, Barclays Global Agg (SGD Hedged), UOB All
Bond Index, FTSE EPRA/NAREIT Developed Real Estate, DJ UBS
Commodity.
With effect from 31 May 2017, one of the benchmark constituents, UOB
Singapore Government Bond Index All, has been replaced by Markit
iBoxx ALBI Singapore Government Index.
The returns are calculated using bid-to-bid prices, in Singapore Dollar
terms, with dividends and distributions reinvested. Past performance is
not necessarily indicative of future performance. Fees & charges
payable through deduction of premium or cancellation of units are
excluded from this calculation.
Volatility
3-year (annualised)
AIM 2045 Fund 8.17%
Calculated using bid-bid prices in Singapore Dollar terms, with dividends
and distributions reinvested.
MARKET REVIEW
Market Review
We entered 2019 against the backdrop of tightening
monetary policy, slowing economic growth amid a US-China
trade war, and all-round weakness in financial markets
(especially for global equities in 4Q2018). However, over the
course of 2019, the US Federal Reserve (Fed) turned dovish
in response to weak economic data. As the year drew to a
close, investors were rewarded with a boost from the “Phase
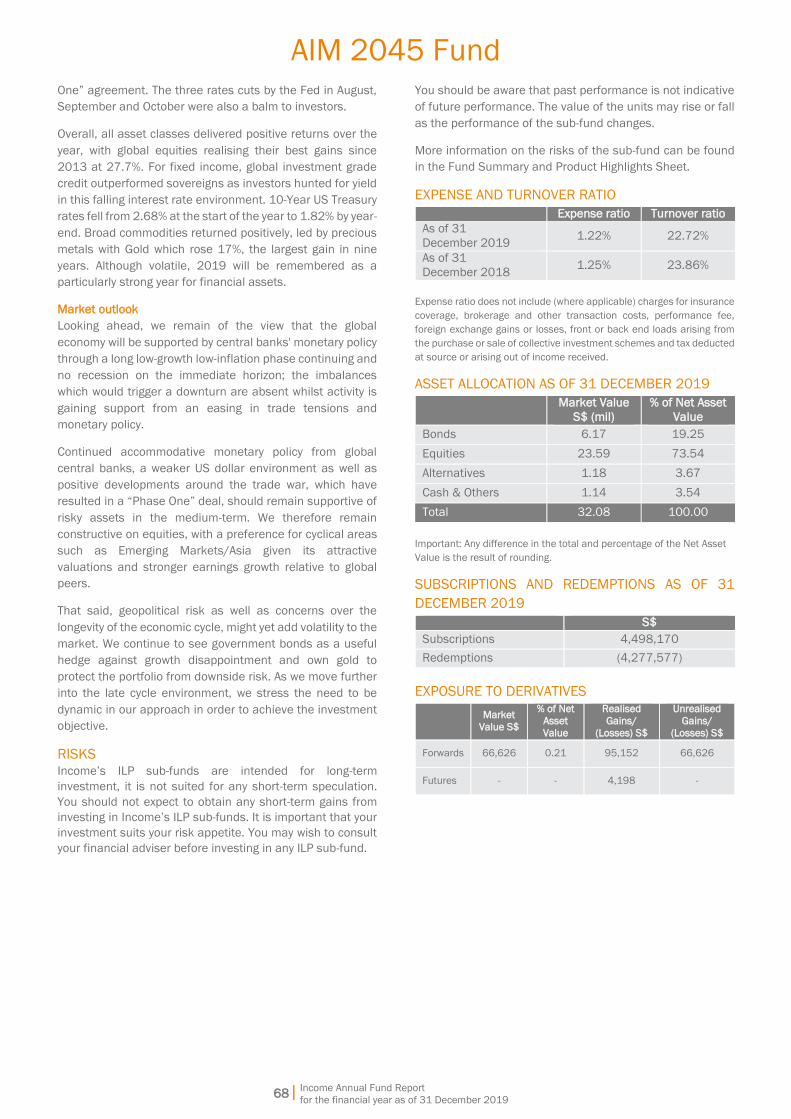
AIM 2045 Fund
Income Annual Fund Report
for the financial year as of 31 December 2019
68|
One” agreement. The three rates cuts by the Fed in August,
September and October were also a balm to investors.
Overall, all asset classes delivered positive returns over the
year, with global equities realising their best gains since
2013 at 27.7%. For fixed income, global investment grade
credit outperformed sovereigns as investors hunted for yield
in this falling interest rate environment. 10-Year US Treasury
rates fell from 2.68% at the start of the year to 1.82% by year-
end. Broad commodities returned positively, led by precious
metals with Gold which rose 17%, the largest gain in nine
years. Although volatile, 2019 will be remembered as a
particularly strong year for financial assets.
Market outlook
Looking ahead, we remain of the view that the global
economy will be supported by central banks' monetary policy
through a long low-growth low-inflation phase continuing and
no recession on the immediate horizon; the imbalances
which would trigger a downturn are absent whilst activity is
gaining support from an easing in trade tensions and
monetary policy.
Continued accommodative monetary policy from global
central banks, a weaker US dollar environment as well as
positive developments around the trade war, which have
resulted in a “Phase One” deal, should remain supportive of
risky assets in the medium-term. We therefore remain
constructive on equities, with a preference for cyclical areas
such as Emerging Markets/Asia given its attractive
valuations and stronger earnings growth relative to global
peers.
That said, geopolitical risk as well as concerns over the
longevity of the economic cycle, might yet add volatility to the
market. We continue to see government bonds as a useful
hedge against growth disappointment and own gold to
protect the portfolio from downside risk. As we move further
into the late cycle environment, we stress the need to be
dynamic in our approach in order to achieve the investment
objective.
RISKS
Income’s ILP sub-funds are intended for long-term
investment, it is not suited for any short-term speculation.
You should not expect to obtain any short-term gains from
investing in Income’s ILP sub-funds. It is important that your
investment suits your risk appetite. You may wish to consult
your financial adviser before investing in any ILP sub-fund.
You should be aware that past performance is not indicative
of future performance. The value of the units may rise or fall
as the performance of the sub-fund changes.
More information on the risks of the sub-fund can be found
in the Fund Summary and Product Highlights Sheet.
EXPENSE AND TURNOVER RATIO
Expense ratio Turnover ratio
As of 31
December 2019 1.22% 22.72%
As of 31
December 2018 1.25% 23.86%
Expense ratio does not include (where applicable) charges for insurance
coverage, brokerage and other transaction costs, performance fee,
foreign exchange gains or losses, front or back end loads arising from
the purchase or sale of collective investment schemes and tax deducted
at source or arising out of income received.
ASSET ALLOCATION AS OF 31 DECEMBER 2019
Market Value
S$ (mil)
% of Net Asset
Value
Bonds 6.17 19.25
Equities 23.59 73.54
Alternatives 1.18 3.67
Cash & Others 1.14 3.54
Total 32.08 100.00
Important: Any difference in the total and percentage of the Net Asset
Value is the result of rounding.
SUBSCRIPTIONS AND REDEMPTIONS AS OF 31
DECEMBER 2019
S$
Subscriptions 4,498,170
Redemptions (4,277,577)
EXPOSURE TO DERIVATIVES
Market
Value S$
% of Net
Asset
Value
Realised
Gains/
(Losses) S$
Unrealised
Gains/
(Losses) S$
Forwards 66,626 0.21 95,152 66,626
Futures - - 4,198 -
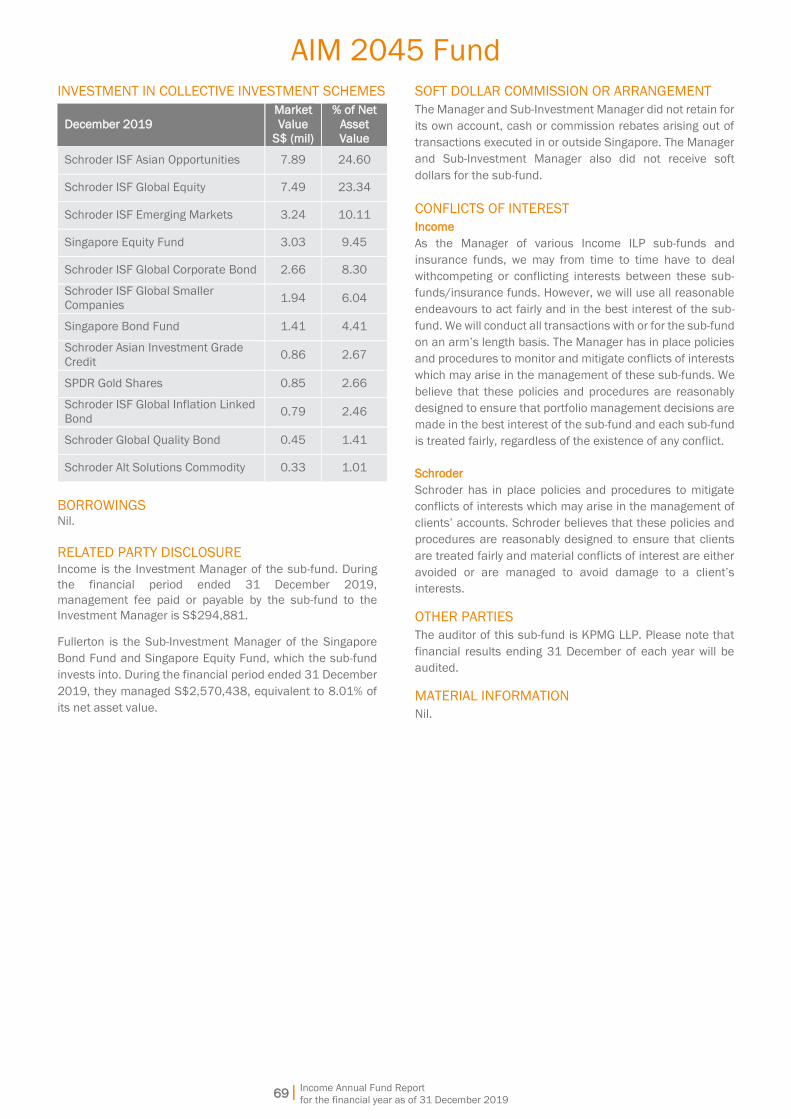
AIM 2045 Fund
Income Annual Fund Report
for the financial year as of 31 December 2019
69|
INVESTMENT IN COLLECTIVE INVESTMENT SCHEMES
December 2019
Market
Value
S$ (mil)
% of Net
Asset
Value
Schroder ISF Asian Opportunities 7.89 24.60
Schroder ISF Global Equity 7.49 23.34
Schroder ISF Emerging Markets 3.24 10.11
Singapore Equity Fund 3.03 9.45
Schroder ISF Global Corporate Bond 2.66 8.30
Schroder ISF Global Smaller
Companies 1.94 6.04
Singapore Bond Fund 1.41 4.41
Schroder Asian Investment Grade
Credit 0.86 2.67
SPDR Gold Shares 0.85 2.66
Schroder ISF Global Inflation Linked
Bond 0.79 2.46
Schroder Global Quality Bond 0.45 1.41
Schroder Alt Solutions Commodity 0.33 1.01
BORROWINGS Nil.
RELATED PARTY DISCLOSURE
Income is the Investment Manager of the sub-fund. During
the financial period ended 31 December 2019,
management fee paid or payable by the sub-fund to the
Investment Manager is S$294,881.
Fullerton is the Sub-Investment Manager of the Singapore
Bond Fund and Singapore Equity Fund, which the sub-fund
invests into. During the financial period ended 31 December
2019, they managed S$2,570,438, equivalent to 8.01% of
its net asset value.
SOFT DOLLAR COMMISSION OR ARRANGEMENT
The Manager and Sub-Investment Manager did not retain for
its own account, cash or commission rebates arising out of
transactions executed in or outside Singapore. The Manager
and Sub-Investment Manager also did not receive soft
dollars for the sub-fund.
CONFLICTS OF INTEREST
Income
As the Manager of various Income ILP sub-funds and
insurance funds, we may from time to time have to deal
withcompeting or conflicting interests between these sub-
funds/insurance funds. However, we will use all reasonable
endeavours to act fairly and in the best interest of the sub-
fund. We will conduct all transactions with or for the sub-fund
on an arm’s length basis. The Manager has in place policies
and procedures to monitor and mitigate conflicts of interests
which may arise in the management of these sub-funds. We
believe that these policies and procedures are reasonably
designed to ensure that portfolio management decisions are
made in the best interest of the sub-fund and each sub-fund
is treated fairly, regardless of the existence of any conflict.
Schroder
Schroder has in place policies and procedures to mitigate
conflicts of interests which may arise in the management of
clients’ accounts. Schroder believes that these policies and
procedures are reasonably designed to ensure that clients
are treated fairly and material conflicts of interest are either
avoided or are managed to avoid damage to a client’s
interests.
OTHER PARTIES
The auditor of this sub-fund is KPMG LLP. Please note that
financial results ending 31 December of each year will be
audited.
MATERIAL INFORMATION
Nil.

Income Annual Fund Report
for the financial year as of 31 December 2019
70|
Money Market Fund
INVESTMENT OBJECTIVE
To achieve a return that is better than short-term cash deposits while maintaining liquidity and security of capital.
INVESTMENT SCOPE
This sub-fund invests mainly in good quality money market instruments and short-term bonds which include bank deposits,
government and statutory board securities, certificates of deposit and corporate bonds. Non-SGD denominated investments, if
any, will be hedged to SGD. The sub-fund may be suitable for investors seeking for yield enhancement to their SGD deposit. Do
note that the purchase of a unit in the money market fund is not the same as placing funds on deposit with a bank or deposit-
taking financial institution. The sub-fund is denominated in Singapore Dollars.
FUND DETAILS AS OF 31 DECEMBER 2019
Launch Date 1 May 2006
Fund Size S$12.27 million
Initial Sales Charge Please refer to “Fees and Charges” in section 4 of the Product Summary for ILP.
Annual Management Fee 0.25% p.a. The Annual Management Fee is not guaranteed and may be reviewed from time
to time. However, it shall not exceed 2.0% of the sub-fund balance at any point of time.
Custodian The Bank of New York Mellon
Dealing Frequency Every business day
Inclusion in CPFIS N.A.
CPFIS Risk Classification N.A.
Fund Manager NTUC Income Insurance Co-operative Limited
Sub-Investment Manager Fullerton Fund Management Company Ltd
Benchmark Singapore 3-month Interbank Bid Rate
Structure Single Fund
TOP 10 HOLDINGS
December 2019
Market
Value
S$ (mil)
% of Net
Asset
Value
December 2018
Market
Value
S$ (mil)
% of Net
Asset
Value
SP PowerAssets 4.665% 180820 1.03 8.43 Singapore Government Bonds 2.5%
010619 1.51 11.10
Land Transport Authority 2.73%
180920 1.01 8.27
National University of Singapore
1.708% 130219 1.26 9.26
Temasek FINL I 3.265% 190220 1.01 8.26 Bank of China/SG Bchina 2.75%
300619 1.25 9.22
SingTel Group 3.4875% 080420 1.01 8.25 Monetary Authority of Singapore Bills
250119 1.25 9.20
Chn Const BK/SG 2.08% 261020 1.00 8.18 Temasek FINL I 3.265% 190220 1.02 7.54
Sun Hung Kai Properties 3.25%
200521 0.76 6.23 SingTel Group 3.4875% 080420 1.02 7.53
Monetary Authority of Singapore Bills
310120 0.75 6.10
Housing & Development Board
2.223% 280519 1.00 7.39
Singapore T-Bill 140120 0.50 4.07 Singapore Government Bonds
1.625% 011019 1.00 7.38
Monetary Authority of Singapore Bills
240120 0.50 4.07 Mizuho Bank Ltd 2.77% 150319 0.76 5.58
Singapore T-Bill 311020 0.49 4.02 Monetary Authority of Singapore Bills
110119 0.75 5.52
Important: Any difference in the total and percentage of the Net Asset Value is the result of rounding.
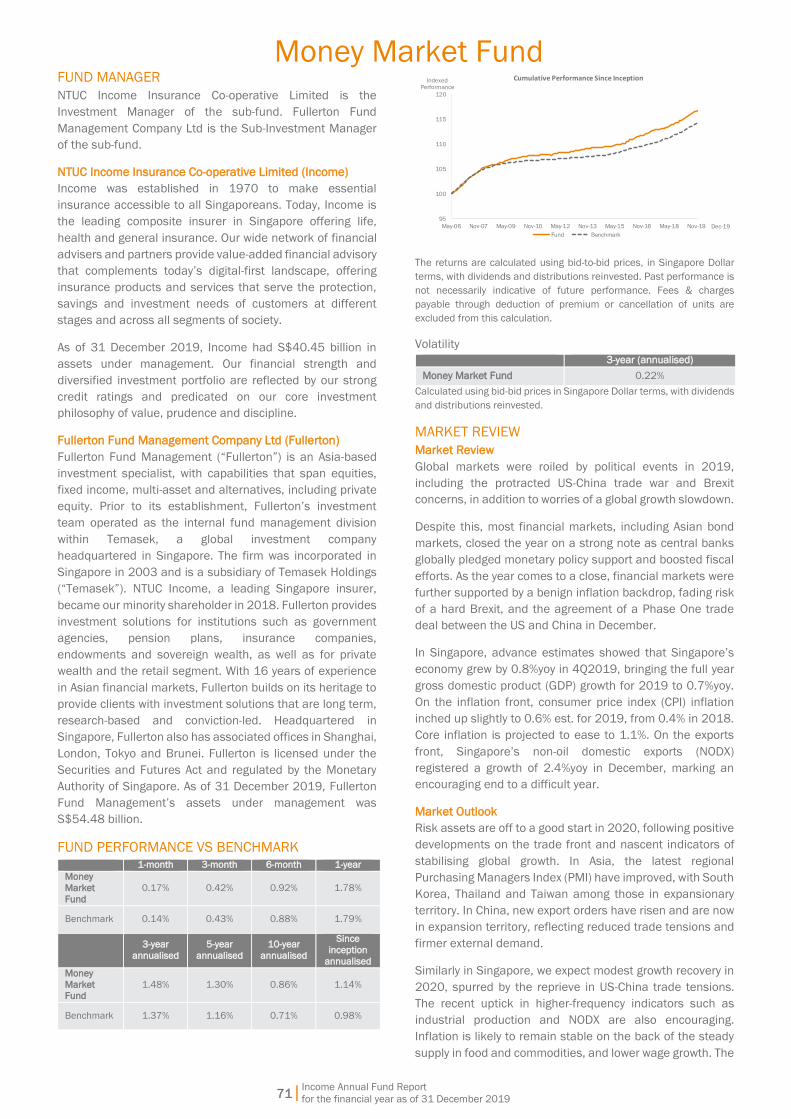
Income Annual Fund Report
for the financial year as of 31 December 2019
71|
Money Market Fund FUND MANAGER
NTUC Income Insurance Co-operative Limited is the
Investment Manager of the sub-fund. Fullerton Fund
Management Company Ltd is the Sub-Investment Manager
of the sub-fund.
NTUC Income Insurance Co-operative Limited (Income)
Income was established in 1970 to make essential
insurance accessible to all Singaporeans. Today, Income is
the leading composite insurer in Singapore offering life,
health and general insurance. Our wide network of financial
advisers and partners provide value-added financial advisory
that complements today’s digital-first landscape, offering
insurance products and services that serve the protection,
savings and investment needs of customers at different
stages and across all segments of society.
As of 31 December 2019, Income had S$40.45 billion in
assets under management. Our financial strength and
diversified investment portfolio are reflected by our strong
credit ratings and predicated on our core investment
philosophy of value, prudence and discipline.
Fullerton Fund Management Company Ltd (Fullerton)
Fullerton Fund Management (“Fullerton”) is an Asia-based
investment specialist, with capabilities that span equities,
fixed income, multi-asset and alternatives, including private
equity. Prior to its establishment, Fullerton’s investment
team operated as the internal fund management division
within Temasek, a global investment company
headquartered in Singapore. The firm was incorporated in
Singapore in 2003 and is a subsidiary of Temasek Holdings
(“Temasek”). NTUC Income, a leading Singapore insurer,
became our minority shareholder in 2018. Fullerton provides
investment solutions for institutions such as government
agencies, pension plans, insurance companies,
endowments and sovereign wealth, as well as for private
wealth and the retail segment. With 16 years of experience
in Asian financial markets, Fullerton builds on its heritage to
provide clients with investment solutions that are long term,
research-based and conviction-led. Headquartered in
Singapore, Fullerton also has associated offices in Shanghai,
London, Tokyo and Brunei. Fullerton is licensed under the
Securities and Futures Act and regulated by the Monetary
Authority of Singapore. As of 31 December 2019, Fullerton
Fund Management’s assets under management was
S$54.48 billion.
FUND PERFORMANCE VS BENCHMARK 1-month 3-month 6-month 1-year
Money
Market
Fund
0.17% 0.42% 0.92% 1.78%
Benchmark 0.14% 0.43% 0.88% 1.79%
3-year
annualised
5-year
annualised
10-year
annualised
Since
inception
annualised
Money
Market Fund
1.48% 1.30% 0.86% 1.14%
Benchmark 1.37% 1.16% 0.71% 0.98%
95
100
105
110
115
120
May-06 Nov-07 May-09 Nov-10 May-12 Nov-13 May-15 Nov-16 May-18 Nov-19
Cumulative Performance Since Inception
Fund Benchmark
IndexedPerformance
Dec-19
The returns are calculated using bid-to-bid prices, in Singapore Dollar
terms, with dividends and distributions reinvested. Past performance is
not necessarily indicative of future performance. Fees & charges
payable through deduction of premium or cancellation of units are
excluded from this calculation.
Volatility
3-year (annualised)
Money Market Fund 0.22%
Calculated using bid-bid prices in Singapore Dollar terms, with dividends
and distributions reinvested.
MARKET REVIEW
Market Review
Global markets were roiled by political events in 2019,
including the protracted US-China trade war and Brexit
concerns, in addition to worries of a global growth slowdown.
Despite this, most financial markets, including Asian bond
markets, closed the year on a strong note as central banks
globally pledged monetary policy support and boosted fiscal
efforts. As the year comes to a close, financial markets were
further supported by a benign inflation backdrop, fading risk
of a hard Brexit, and the agreement of a Phase One trade
deal between the US and China in December.
In Singapore, advance estimates showed that Singapore’s
economy grew by 0.8%yoy in 4Q2019, bringing the full year
gross domestic product (GDP) growth for 2019 to 0.7%yoy.
On the inflation front, consumer price index (CPI) inflation
inched up slightly to 0.6% est. for 2019, from 0.4% in 2018.
Core inflation is projected to ease to 1.1%. On the exports
front, Singapore’s non-oil domestic exports (NODX)
registered a growth of 2.4%yoy in December, marking an
encouraging end to a difficult year.
Market Outlook
Risk assets are off to a good start in 2020, following positive
developments on the trade front and nascent indicators of
stabilising global growth. In Asia, the latest regional
Purchasing Managers Index (PMI) have improved, with South
Korea, Thailand and Taiwan among those in expansionary
territory. In China, new export orders have risen and are now
in expansion territory, reflecting reduced trade tensions and
firmer external demand.
Similarly in Singapore, we expect modest growth recovery in
2020, spurred by the reprieve in US-China trade tensions.
The recent uptick in higher-frequency indicators such as
industrial production and NODX are also encouraging.
Inflation is likely to remain stable on the back of the steady
supply in food and commodities, and lower wage growth. The

Income Annual Fund Report
for the financial year as of 31 December 2019
72|
Money Market Fund modest growth environment coupled with negative output
gap will also limit the pass though effect.
RISKS
Income’s ILP sub-funds are intended for long-term
investment, it is not suited for any short-term speculation.
You should not expect to obtain any short-term gains from
investing in Income’s ILP sub-funds. It is important that your
investment suits your risk appetite. You may wish to consult
your financial adviser before investing in any ILP sub-fund.
You should be aware that past performance is not indicative
of future performance. The value of the units may rise or fall
as the performance of the sub-fund changes.
More information on the risks of the sub-fund can be found
in the Fund Summary and Product Highlights Sheet.
EXPENSE AND TURNOVER RATIO
Expense ratio Turnover ratio
As of 31
December 2019 0.27% 18.39%
As of 31
December 2018 0.27% 22.30%
Expense ratio does not include (where applicable) charges for insurance
coverage, brokerage and other transaction costs, performance fee,
foreign exchange gains or losses, front or back end loads arising from
the purchase or sale of collective investment schemes and tax deducted
at source or arising out of income received.
ASSET ALLOCATION AS OF 31 DECEMBER 2019
Market Value
S$ (mil)
% of Net Asset
Value
Corporate Bonds 4.83 39.34
Government Bonds 4.95 40.33
Cash & Others 2.49 20.33
Total 12.27 100.00
COUNTRY ALLOCATION AS OF 31 DECEMBER 2019
Market Value
S$ (mil)
% of Net Asset
Value
Hong Kong 0.77 6.23
Singapore 9.01 73.44
Cash & Others 2.49 20.33
Total 12.27 100.00
SECTOR ALLOCATION AS OF 31 DECEMBER 2019
Market Value
S$ (mil)
% of Net Asset
Value
Communications 1.01 8.25
Financial 4.94 40.16
Government 2.80 22.83
Utilities 1.03 8.43
Cash & Others 2.49 20.33
Total 12.27 100.00
TERM TO MATURITY OF INVESTMENTS AS OF
31 DECEMBER 2019
Term to maturity Market Value
S$ (mil)
% of Net Asset
Value
1-30 3.81 31.05
31-60 2.01 16.40
61-90 0.25 2.03
91-120 1.01 8.25
121-180 0.55 4.45
>180 4.56 37.14
Total 12.19 99.32
CREDIT RATINGS OF DEBT SECURITIES
S&P's rating or its
equivalent
Market Value
S$ (mil)
% of Net Asset
Value
AAA 1.02 8.26
AA 1.03 8.42
A+ 1.78 14.48
A 1.00 8.18
Not rated 4.95 40.33
Total 9.78 79.67
‘Not rated’ refers to debt securities which are not rated by S&P or other
equivalent rating agencies, including but not limited to treasury bills,
bonds issued by government, government agency, statutory board or
corporate.
Important: Any difference in the total and percentage of the Net Asset
Value is the result of rounding.
SUBSCRIPTIONS AND REDEMPTIONS AS OF 31
DECEMBER 2019
S$
Subscriptions 11,945,164
Redemptions (13,509,739)
EXPOSURE TO DERIVATIVES
Nil.
INVESTMENT IN COLLECTIVE INVESTMENT SCHEMES
Nil.
BORROWINGS
Nil.
RELATED PARTY DISCLOSURE
Income is the Investment Manager of the sub-fund. During
the financial period ended 31 December 2019,
management fee paid or payable by the sub-fund to the
Investment Manager is S$33,457.
Fullerton is the Sub-Investment Manager of the sub-fund.
During the financial period ended 31 December 2019, they
managed S$12,271,390, equivalent to 100% of its net asset
value.
Income Annual Fund Report
for the financial year as of 31 December 2019
73|
Money Market Fund SOFT DOLLAR COMMISSION OR ARRANGEMENT
Income
The Manager does not retain for its own account, cash or
commission rebates arising out of transactions executed in
or outside Singapore. The Manager also does not receive soft
dollars for the sub-fund.
Fullerton
Fullerton may and intend to receive or enter into soft-dollar
commissions/arrangements in our management of the
portfolio. Fullerton will comply with applicable regulatory and
industry standards on soft dollars. Such soft dollar
commissions include research and advisory services,
economic and political analyses, portfolio analyses including
valuation and performance measurements, market analyses,
data and quotation services, computer hardware and
software or any other information facilities to the extent that
they are used to support the investment decision making
process, the giving of advice, or the conduct of research or
analysis for investments managed for clients.
Soft dollar commissions/arrangements will not include travel,
accommodation, entertainment, general administrative
goods and services, general office equipment or premises,
membership fees, employees’ salaries or direct money
payment.
Fullerton will not accept or enter into soft dollar
commissions/arrangements unless such soft dollar
commissions/arrangements would, in Fullerton’s opinion,
assist them in their management of the portfolio, providing
that Fullerton ensures at all times that best execution is
carried out for the transactions and that no unnecessary
trades are entered into in order to qualify for such soft-dollar
commissions/arrangements.
CONFLICTS OF INTEREST
Income
As the Manager of various Income ILP sub-funds and
insurance funds, we may from time to time have to deal with
competing or conflicting interests between these sub-
funds/insurance funds. However, we will use all reasonable
endeavours to act fairly and in the best interest of the sub-
fund. We will conduct all transactions with or for the sub-fund
on an arm’s length basis. The Manager has in place policies
and procedures to monitor and mitigate conflicts of interests
which may arise in the management of these sub-funds. We
believe that these policies and procedures are reasonably
designed to ensure that portfolio management decisions are
made in the best interest of the sub-fund and each sub-fund
is treated fairly, regardless of the existence of any conflict.
Fullerton
Fullerton is of the view that there are no conflicts of interests
in managing the portfolio. Under the conditions of its license,
Fullerton is required to conduct its business in a manner so
as to avoid conflicts of interests, and ensure that any
conflicts of interests arising are resolved fairly and equitably.
In addition, as a member of the Investment Management
Association of Singapore ("IMAS"), Fullerton adopts the
principles and standards of investment conduct, which
includes ensuring fair allocation, as set out in the IMAS Code
of Ethics & Standards of Professional Conduct.
OTHER PARTIES
The auditor of this sub-fund is KPMG LLP. Please note that
financial results ending 31 December of each year will be
audited.
MATERIAL INFORMATION
Nil.
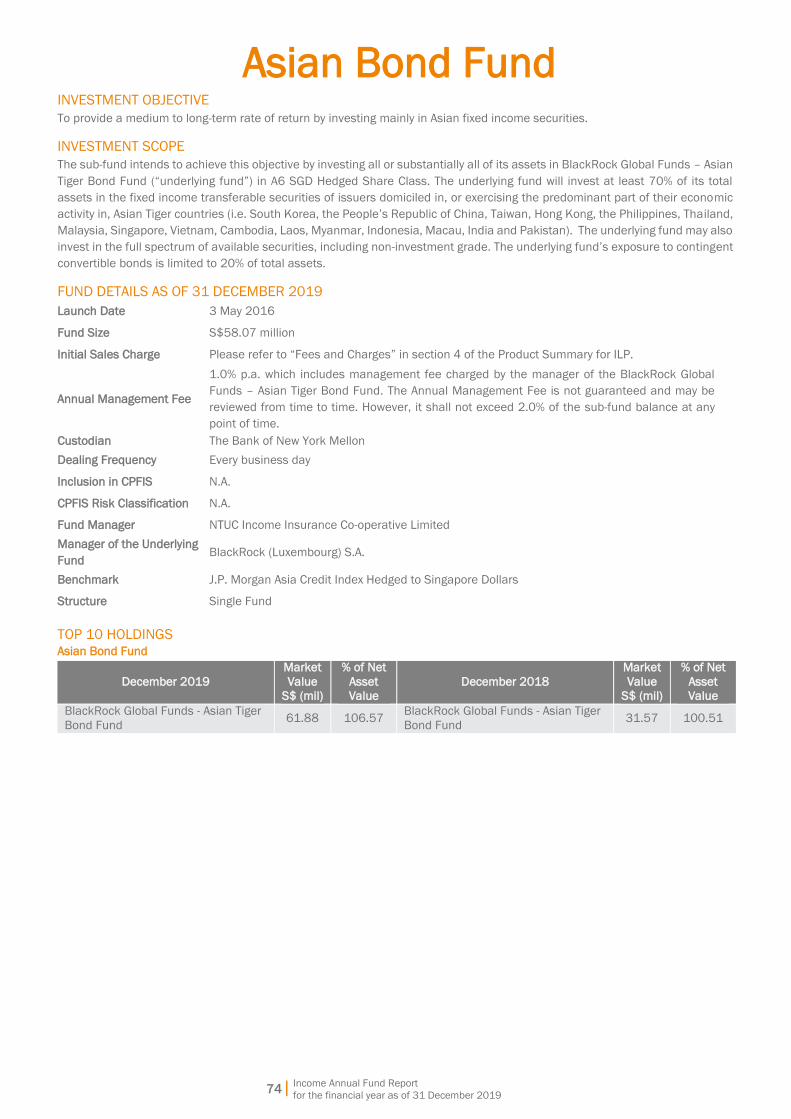
Asian Bond Fund
Income Annual Fund Report
for the financial year as of 31 December 2019
74|
INVESTMENT OBJECTIVE
To provide a medium to long-term rate of return by investing mainly in Asian fixed income securities.
INVESTMENT SCOPE
The sub-fund intends to achieve this objective by investing all or substantially all of its assets in BlackRock Global Funds – Asian
Tiger Bond Fund (“underlying fund”) in A6 SGD Hedged Share Class. The underlying fund will invest at least 70% of its total
assets in the fixed income transferable securities of issuers domiciled in, or exercising the predominant part of their economic
activity in, Asian Tiger countries (i.e. South Korea, the People’s Republic of China, Taiwan, Hong Kong, the Philippines, Thailand,
Malaysia, Singapore, Vietnam, Cambodia, Laos, Myanmar, Indonesia, Macau, India and Pakistan). The underlying fund may also
invest in the full spectrum of available securities, including non-investment grade. The underlying fund’s exposure to contingent
convertible bonds is limited to 20% of total assets.
FUND DETAILS AS OF 31 DECEMBER 2019
Launch Date 3 May 2016
Fund Size S$58.07 million
Initial Sales Charge Please refer to “Fees and Charges” in section 4 of the Product Summary for ILP.
Annual Management Fee
1.0% p.a. which includes management fee charged by the manager of the BlackRock Global
Funds – Asian Tiger Bond Fund. The Annual Management Fee is not guaranteed and may be
reviewed from time to time. However, it shall not exceed 2.0% of the sub-fund balance at any
point of time.
Custodian The Bank of New York Mellon
Dealing Frequency Every business day
Inclusion in CPFIS N.A.
CPFIS Risk Classification N.A.
Fund Manager NTUC Income Insurance Co-operative Limited
Manager of the Underlying
Fund BlackRock (Luxembourg) S.A.
Benchmark J.P. Morgan Asia Credit Index Hedged to Singapore Dollars
Structure Single Fund
TOP 10 HOLDINGS Asian Bond Fund
December 2019
Market
Value
S$ (mil)
% of Net
Asset
Value
December 2018
Market
Value
S$ (mil)
% of Net
Asset
Value
BlackRock Global Funds - Asian Tiger
Bond Fund 61.88 106.57
BlackRock Global Funds - Asian Tiger
Bond Fund 31.57 100.51
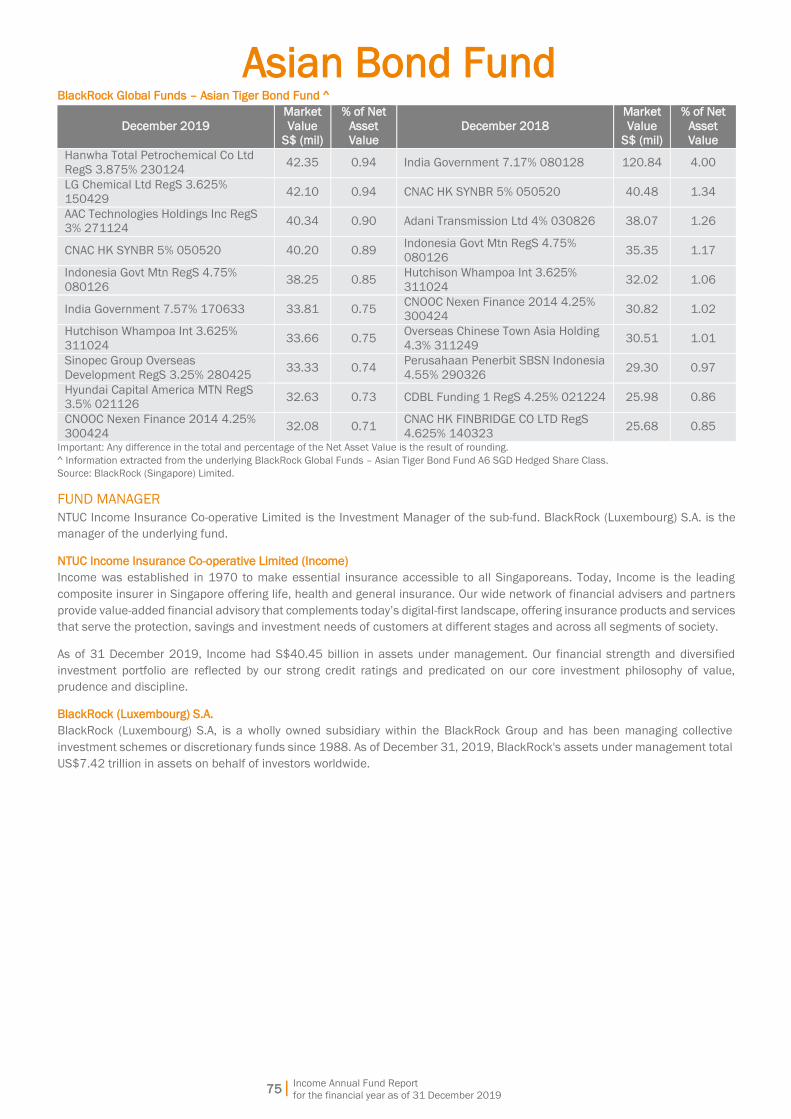
Asian Bond Fund
Income Annual Fund Report
for the financial year as of 31 December 2019
75|
BlackRock Global Funds – Asian Tiger Bond Fund ^
December 2019
Market
Value
S$ (mil)
% of Net
Asset
Value
December 2018
Market
Value
S$ (mil)
% of Net
Asset
Value
Hanwha Total Petrochemical Co Ltd
RegS 3.875% 230124 42.35 0.94 India Government 7.17% 080128 120.84 4.00
LG Chemical Ltd RegS 3.625%
150429 42.10 0.94 CNAC HK SYNBR 5% 050520 40.48 1.34
AAC Technologies Holdings Inc RegS
3% 271124 40.34 0.90 Adani Transmission Ltd 4% 030826 38.07 1.26
CNAC HK SYNBR 5% 050520 40.20 0.89 Indonesia Govt Mtn RegS 4.75%
080126 35.35 1.17
Indonesia Govt Mtn RegS 4.75%
080126 38.25 0.85
Hutchison Whampoa Int 3.625%
311024 32.02 1.06
India Government 7.57% 170633 33.81 0.75 CNOOC Nexen Finance 2014 4.25%
300424 30.82 1.02
Hutchison Whampoa Int 3.625%
311024 33.66 0.75
Overseas Chinese Town Asia Holding
4.3% 311249 30.51 1.01
Sinopec Group Overseas
Development RegS 3.25% 280425 33.33 0.74
Perusahaan Penerbit SBSN Indonesia
4.55% 290326 29.30 0.97
Hyundai Capital America MTN RegS
3.5% 021126 32.63 0.73 CDBL Funding 1 RegS 4.25% 021224 25.98 0.86
CNOOC Nexen Finance 2014 4.25%
300424 32.08 0.71
CNAC HK FINBRIDGE CO LTD RegS
4.625% 140323 25.68 0.85
Important: Any difference in the total and percentage of the Net Asset Value is the result of rounding.
^ Information extracted from the underlying BlackRock Global Funds – Asian Tiger Bond Fund A6 SGD Hedged Share Class.
Source: BlackRock (Singapore) Limited.
FUND MANAGER
NTUC Income Insurance Co-operative Limited is the Investment Manager of the sub-fund. BlackRock (Luxembourg) S.A. is the
manager of the underlying fund.
NTUC Income Insurance Co-operative Limited (Income)
Income was established in 1970 to make essential insurance accessible to all Singaporeans. Today, Income is the leading
composite insurer in Singapore offering life, health and general insurance. Our wide network of financial advisers and partners
provide value-added financial advisory that complements today’s digital-first landscape, offering insurance products and services
that serve the protection, savings and investment needs of customers at different stages and across all segments of society.
As of 31 December 2019, Income had S$40.45 billion in assets under management. Our financial strength and diversified
investment portfolio are reflected by our strong credit ratings and predicated on our core investment philosophy of value,
prudence and discipline.
BlackRock (Luxembourg) S.A.
BlackRock (Luxembourg) S.A, is a wholly owned subsidiary within the BlackRock Group and has been managing collective
investment schemes or discretionary funds since 1988. As of December 31, 2019, BlackRock's assets under management total
US$7.42 trillion in assets on behalf of investors worldwide.

Asian Bond Fund
Income Annual Fund Report
for the financial year as of 31 December 2019
76|
FUND PERFORMANCE VS BENCHMARK
1-month 3-month 6-month 1-year
Asian Bond
Fund 0.42% 1.03% 2.51% 10.39%
Benchmark 0.31% 1.05% 2.84% 10.73%
3-year
annualised
5-year
annualised
10-year
annualised
Since
inception
annualised
Asian Bond
Fund 3.94% N.A. N.A. 3.31%
Benchmark 4.78% N.A. N.A. 4.16%
90
95
100
105
110
115
120
May-16 Sep-16 Jan-17 May-17 Sep-17 Jan-18 May-18 Sep-18 Jan-19 May-19 Sep-19
Cumulative Performance Since Inception
Fund Benchmark
IndexedPerformance
Dec-19
The returns are calculated using bid-to-bid prices, in Singapore Dollar
terms, with dividends and distributions reinvested. Past performance is
not necessarily indicative of future performance. Fees & charges
payable through deduction of premium or cancellation of units are
excluded from this calculation.
Volatility
3-year (annualised)
Asian Bond Fund 3.14%
Calculated using bid-bid prices in Singapore Dollar terms, with dividends
and distributions reinvested.
MARKET REVIEW
Market Review
2019 proved to be an exemplary year for Asian Credit across
ratings and sectors. The JPM Asian Credit Index generating
11.34%, the highest yearly return since 2012. The two
factors that most impacted Asian Credit markets this year
were US-China trade tensions and the US Federal Reserve
(Fed). The state of the former played a large hand in market
risk sentiment, and expectations concerning the latter
guided the direction of market risk free rates.
Moving into 2019, risk assets were poised for recovery after
a year of drawdowns and uncertainty that resulted in
valuations that were at multi-year highs. One of the main
triggering points that turned markets was the increased
dovishness of the Fed. This downshift in rate rise
expectations, expected stabilisation of the USD and easing
in trade escalations produced a positive backdrop for
emerging markets (EM) assets, kick starting a resumption in
inflows.
Talks of a potential partial trade deal between US and China
surfaced in the last few months of the year. Described by
President Trump as "Phase 1" deal, the agreement primarily
involved larger purchases of US farm goods by China and a
suspension of tariff hikes by the US. While negotiations were
temporarily complicated by President Trump ratifying the
Hong Kong Human Rights and Democracy Act, investors
continued to hope for the materialisation of the partial deal.
After a brief period of nervousness in the beginning of
December when President Trump said there was no deadline
for the trade talks, both countries came up with an
agreement in mid-December that was due to be signed in
January. This development fuelled a market rally towards
yearend.
In stark contrast with 2018 when the Fed hiked overnight
lending rates four times, softer economic data meant the
central bank took a much more accommodative stance in
2019. In a series of moves, the Fed cut rates by 75bps in
2019 – 25bps each in July, September and October. This
round of monetary policy action was widely considered a mid-
cycle adjustment and not an aggressive easing cycle. The
Fed chairman Mr. Powell emphasised the data-dependency
of the interest rate trajectory amidst disparity in views within
the committee. Earlier in the cutting cycle, his commentaries
were perceived as less dovish than market expectations,
especially in light of elevated levels of ongoing geopolitical
uncertainty in the form of trade tensions, Brexit, oil prices
and slowing global growth. After the October cut, Mr. Powell
emphasised that policy rate was “likely to remain
appropriate” unless there is a “material reassessment” of
the Fed’s outlook for moderate growth, a strong jobs market,
and healthier inflation.
Chinese authorities also took steps to buoy the domestic
economy in light of the ongoing trade war. The People's Bank
of China (PBoC) injected liquidity using a range of methods,
including medium-term lending facility, seven-day reverse
repo rate, the 1-year and 5-year Loan Prime Rate and the
Reserve Requirement Ratio. Recently, the Ministry of
Finance stepped up “counter-cyclical measures” by
announcing a pre-allocation of RMB1 trillion local
government bond quota for bond issuance before Q1 2020
to boost infrastructure investment.
In India, the incumbent Prime Minister Modi received the
mandate for a second five-year term following a landslide
victory in India's 17th general election. We became positive
on the INR because in the near-term, current account deficit
could be financed by a combination of portfolio and
improved foreign direct investment flows post-election. On
the monetary policy front, the Reserve Bank of India (RBI)
was likely to continue to ease its monetary policy given near-
term growth indicators remain soft and inflation remains in
line with RBI’s mandate.
Indonesia too saw the re-election of the incumbent in this
month's elections. In line with market expectations, the
Indonesian electoral commission certified President
Jokowi’s re-election. We saw opportunities in local
Indonesian bonds due to high real yields and expectations of
a stable dollar and rupiah. Flows had been positive and we
expected policy continuity to be supportive.
Market Outlook
In 2020, we expect returns in Asian Credit to normalise and
to come predominantly from income. A global backdrop of
slowing growth and lingering geopolitical uncertainty
continues to dominate investor attention and the
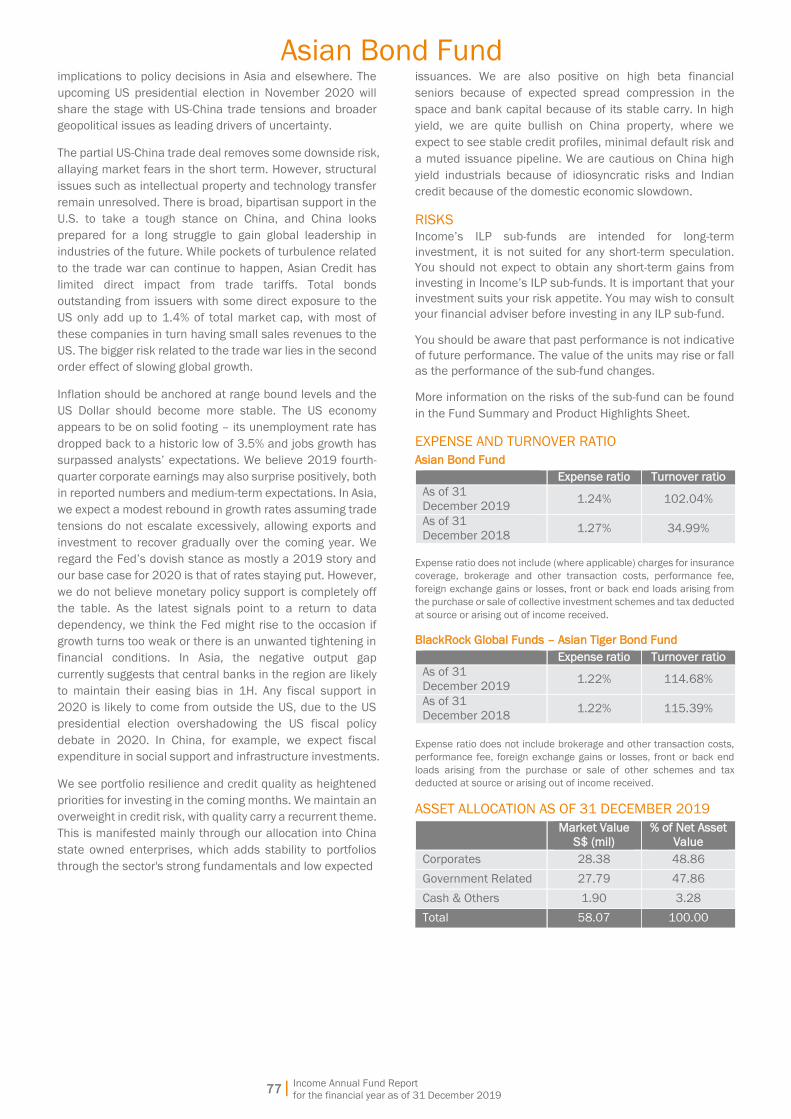
Asian Bond Fund
Income Annual Fund Report
for the financial year as of 31 December 2019
77|
implications to policy decisions in Asia and elsewhere. The
upcoming US presidential election in November 2020 will
share the stage with US-China trade tensions and broader
geopolitical issues as leading drivers of uncertainty.
The partial US-China trade deal removes some downside risk,
allaying market fears in the short term. However, structural
issues such as intellectual property and technology transfer
remain unresolved. There is broad, bipartisan support in the
U.S. to take a tough stance on China, and China looks
prepared for a long struggle to gain global leadership in
industries of the future. While pockets of turbulence related
to the trade war can continue to happen, Asian Credit has
limited direct impact from trade tariffs. Total bonds
outstanding from issuers with some direct exposure to the
US only add up to 1.4% of total market cap, with most of
these companies in turn having small sales revenues to the
US. The bigger risk related to the trade war lies in the second
order effect of slowing global growth.
Inflation should be anchored at range bound levels and the
US Dollar should become more stable. The US economy
appears to be on solid footing – its unemployment rate has
dropped back to a historic low of 3.5% and jobs growth has
surpassed analysts’ expectations. We believe 2019 fourth-
quarter corporate earnings may also surprise positively, both
in reported numbers and medium-term expectations. In Asia,
we expect a modest rebound in growth rates assuming trade
tensions do not escalate excessively, allowing exports and
investment to recover gradually over the coming year. We
regard the Fed’s dovish stance as mostly a 2019 story and
our base case for 2020 is that of rates staying put. However,
we do not believe monetary policy support is completely off
the table. As the latest signals point to a return to data
dependency, we think the Fed might rise to the occasion if
growth turns too weak or there is an unwanted tightening in
financial conditions. In Asia, the negative output gap
currently suggests that central banks in the region are likely
to maintain their easing bias in 1H. Any fiscal support in
2020 is likely to come from outside the US, due to the US
presidential election overshadowing the US fiscal policy
debate in 2020. In China, for example, we expect fiscal
expenditure in social support and infrastructure investments.
We see portfolio resilience and credit quality as heightened
priorities for investing in the coming months. We maintain an
overweight in credit risk, with quality carry a recurrent theme.
This is manifested mainly through our allocation into China
state owned enterprises, which adds stability to portfolios
through the sector's strong fundamentals and low expected
issuances. We are also positive on high beta financial
seniors because of expected spread compression in the
space and bank capital because of its stable carry. In high
yield, we are quite bullish on China property, where we
expect to see stable credit profiles, minimal default risk and
a muted issuance pipeline. We are cautious on China high
yield industrials because of idiosyncratic risks and Indian
credit because of the domestic economic slowdown.
RISKS
Income’s ILP sub-funds are intended for long-term
investment, it is not suited for any short-term speculation.
You should not expect to obtain any short-term gains from
investing in Income’s ILP sub-funds. It is important that your
investment suits your risk appetite. You may wish to consult
your financial adviser before investing in any ILP sub-fund.
You should be aware that past performance is not indicative
of future performance. The value of the units may rise or fall
as the performance of the sub-fund changes.
More information on the risks of the sub-fund can be found
in the Fund Summary and Product Highlights Sheet.
EXPENSE AND TURNOVER RATIO Asian Bond Fund
Expense ratio Turnover ratio
As of 31
December 2019 1.24% 102.04%
As of 31
December 2018 1.27% 34.99%
Expense ratio does not include (where applicable) charges for insurance
coverage, brokerage and other transaction costs, performance fee,
foreign exchange gains or losses, front or back end loads arising from
the purchase or sale of collective investment schemes and tax deducted
at source or arising out of income received.
BlackRock Global Funds – Asian Tiger Bond Fund
Expense ratio Turnover ratio
As of 31
December 2019 1.22% 114.68%
As of 31
December 2018 1.22% 115.39%
Expense ratio does not include brokerage and other transaction costs,
performance fee, foreign exchange gains or losses, front or back end
loads arising from the purchase or sale of other schemes and tax
deducted at source or arising out of income received.
ASSET ALLOCATION AS OF 31 DECEMBER 2019
Market Value
S$ (mil)
% of Net Asset
Value
Corporates 28.38 48.86
Government Related 27.79 47.86
Cash & Others 1.90 3.28
Total 58.07 100.00

Asian Bond Fund
Income Annual Fund Report
for the financial year as of 31 December 2019
78|
COUNTRY ALLOCATION AS OF 31 DECEMBER 2019
Market Value
S$ (mil)
% of Net Asset
Value
China 30.34 52.24
Indonesia 5.80 9.98
India 4.36 7.51
South Korea 2.72 4.68
Hong Kong 1.90 3.27
United Arab Emirates 1.46 2.52
Philippines 1.35 2.33
Sri Lanka 1.14 1.96
United States 1.10 1.89
Others 6.00 10.34
Cash & Others 1.90 3.28
Total 58.07 100.00
SECTOR ALLOCATION AS OF 31 DECEMBER 2019
Market Value
S$ (mil)
% of Net Asset
Value
Agency 18.08 31.14
Banking 3.12 5.38
Basic Industry 1.87 3.23
Brokerage/Asset
Managers/Exchanges 0.11 0.17
Capital Goods 0.44 0.76
Communications 0.40 0.68
Consumer Cyclical 8.73 15.05
Consumer Non-
Cyclical 0.30 0.52
Electric 2.89 4.99
Energy 0.70 1.20
Finance Companies 0.22 0.38
Financial Other 1.45 2.50
Government 2.77 4.76
Industrial Other 3.41 5.87
Insurance 0.83 1.43
Local Authority 0.92 1.58
REITs 1.63 2.80
Sovereign 6.02 10.37
Technology 1.48 2.54
Transportation 0.80 1.37
Cash & Others 1.90 3.28
Total 58.07 100.00
CREDIT RATINGS OF DEBT SECURITIES
S&P's rating or its
equivalent
Market Value
S$ (mil)
% of Net Asset
Value
AAA 1.10 1.89
AA 1.13 1.94
A 12.34 21.25
BBB 26.86 46.26
BB 4.38 7.54
B 9.31 16.03
CCC 0.34 0.58
CC 0.09 0.16
D 0.04 0.07
Not rated 0.58 1.00
Total 56.17 96.72
‘Not rated’ refers to debt securities which are not rated by S&P or other
equivalent rating agencies, including but not limited to treasury bills,
bonds issued by government, government agency, statutory board or
corporate.
Important: Any difference in the total and percentage of the Net Asset
Value is the result of rounding.
SUBSCRIPTIONS AND REDEMPTIONS AS OF 31
DECEMBER 2019
S$
Subscriptions 69,387,112
Redemptions (44,192,948)
EXPOSURE TO DERIVATIVES
Nil.
INVESTMENT IN COLLECTIVE INVESTMENT SCHEMES
December 2019
Market
Value
S$ (mil)
% of Net
Asset
Value
BlackRock Global Funds - Asian
Tiger Bond Fund 61.88 106.57
BORROWINGS Nil.
RELATED PARTY DISCLOSURE
Income is the Investment Manager of the sub-fund. During
the financial period ended 31 December 2019,
management fee paid or payable by the sub-fund to the
Investment Manager is S$387,376.
SOFT DOLLAR COMMISSION OR ARRANGEMENT
Income
The Manager did not retain for its own account, cash or
commission rebates arising out of transactions executed in
or outside Singapore. The Manager also did not receive soft
dollars for the sub-fund.
Asian Bond Fund
Income Annual Fund Report
for the financial year as of 31 December 2019
79|
BlackRock
Pursuant to EU Directive 2014/65/EU on markets in
financial instruments referred to as "MiFID II", the BlackRock
group (including the investment manager of the Underlying
Fund) (“BlackRock Group”) will no longer pay for external
research via client trading commissions for its MiFID II-
impacted funds (“MIFID II-impacted funds”).
The BlackRock Group shall meet such research costs out of
its own resources. MiFID II-impacted funds are those which
have appointed a BlackRock Group MiFID firm as investment
adviser or where investment management has been
delegated by such firm to an overseas affiliate.
Funds which have directly appointed an overseas affiliate of
the BlackRock Group within a third country (i.e. outside the
European Union) to perform portfolio management are not
in-scope for the purposes of MiFID II and will be subject to
the local laws and market practices governing external
research in the applicable jurisdiction of the relevant affiliate.
This means that costs of external research may continue to
be met out of the assets of such funds. A list of such funds
is available on request from the Management Company of
the Underlying Fund.
Where investments are made in non-BlackRock Group funds,
they will continue to be subject to the external manager’s
approach to paying for external research in each case. This
approach may be different from that of the BlackRock Group
and may include the collection of a research charge
alongside trading commissions in accordance with
applicable laws and market practice. This means that the
costs of external research may continue to be met out of the
assets within the fund.
Where permitted by applicable regulation (excluding, for the
avoidance of doubt, any Funds which are in scope for MiFID
II), certain BlackRock Group companies acting as investment
adviser to the Funds may accept commissions generated
when trading equities with certain brokers in certain
jurisdictions. Commissions may be reallocated to purchase
eligible research services. Such arrangements may benefit
one Fund over another because research can be used for a
broader range of clients than just those whose trading
funded it. The BlackRock Group has a Use of Commissions
Policy designed to ensure only eligible services are
purchased and excess commissions are reallocated to an
eligible service provider where appropriate.
To the extent that investment advisers within the BlackRock
Group are permitted to receive trading commissions or soft
dollar commissions, with respect to the Funds (or portion of
a Fund) for which they provide investment management and
advice, they may select brokers (including, without limitation,
brokers who are affiliated with the BlackRock Group or PNC
Group) that furnish the BlackRock Group, directly or through
third-party or correspondent relationships, with research or
execution services which provide, in BlackRock Group’s view,
lawful and appropriate assistance to each applicable
BlackRock Group company in the investment decision-
making or trade execution processes and the nature of which
is that their provision can reasonably be expected to benefit
the Fund as a whole and may contribute to an improvement
in the Funds’ performance. Such research or execution
services may include, without limitation and to the extent
permitted by applicable law: research reports on companies,
industries and securities; economic and financial
information and analysis; and quantitative analytical
software. Research or execution services obtained in this
manner may be used in servicing not only the account from
which commissions were used to pay for the services, but
also other BlackRock Group client accounts. For the
avoidance of doubt, such goods and services do not include
travel, accommodation, entertainment, general
administrative goods and services, general office equipment,
computer hardware or premises, membership fees,
employee salaries or direct money payments.
To the extent that the BlackRock Group uses its clients’
commission dollars to obtain research or execution services,
BlackRock Group companies will not have to pay for those
products and services themselves. BlackRock Group
companies may receive research or execution services that
are bundled with the trade execution, clearing and/or
settlement services provided by a particular broker-dealer.
To the extent that each BlackRock Group company receives
research or execution services on this basis, many of the
same potential conflicts related to receipt of these services
through third party arrangements exist. For example, the
research effectively will be paid by client commissions that
also will be used to pay for the execution, clearing and
settlement services provided by the broker-dealer and will
not be paid by that BlackRock Group company.
Each BlackRock Group company may endeavour, subject to
best execution, to execute trades through brokers who,
pursuant to such arrangements, provide research or
execution services in order to ensure the continued receipt
of research or execution services that the BlackRock Group
company believes are useful in their investment decision-
making or trade execution process.
Each BlackRock Group company may pay, or be deemed to
have paid, commission rates higher than it could have
otherwise paid in order to obtain research or execution
services if that BlackRock Group company determines in
good faith that the commission paid is reasonable in relation
to the value of the research or execution services provided.
The BlackRock Group believes that using commission dollars
to obtain the research or execution services enhances its
investment research and trading processes, thereby
increasing the prospect for higher investment returns.
The BlackRock Group may from time to time choose to alter
or choose not to engage in the above described
arrangements to varying degrees, without notice to
BlackRock Group clients, to the extent permitted by
applicable law.
Asian Bond Fund
Income Annual Fund Report
for the financial year as of 31 December 2019
80|
CONFLICTS OF INTEREST
Income
As the Manager of various Income ILP sub-funds and
insurance funds, we may from time to time have to deal with
competing or conflicting interests between these sub-
funds/insurance funds. However, we will use all reasonable
endeavours to act fairly and in the best interest of the sub-
fund. We will conduct all transactions with or for the sub-fund
on an arm’s length basis. The Manager has in place policies
and procedures to monitor and mitigate conflicts of interests
which may arise in the management of these sub-funds. We
believe that these policies and procedures are reasonably
designed to ensure that portfolio management decisions are
made in the best interest of the sub-fund and each sub-fund
is treated fairly, regardless of the existence of any conflict.
BlackRock
The Management Company of the Underlying Fund and other
BlackRock Group companies undertake business for other
clients. The BlackRock Group companies, their employees
and their other clients face conflicts with the interests of the
Management Company of the Underlying Fund and its
clients. BlackRock Group maintains a Conflicts of Interest
Policy. It is not always possible for the risk of detriment to a
client’s interests to be entirely mitigated such that, on every
transaction when acting for clients, a risk of detriment to
their interests does not remain.
The types of conflict scenario giving rise to risks which the
sub investment manager considers it cannot with
reasonable confidence mitigate are disclosed in the
Luxembourg Prospectus of the Underlying Fund. The
disclosable conflict scenarios, may be updated from time to
time.
Please refer to the section “Conflicts of Interest” in Appendix
C of the Underlying Fund’s Luxembourg Prospectus for more
information.
BlackRock’s Prospectus Disclosures
https://www.blackrock.com/sg/en/literature/prospectus/b
gf-singapore-prospectus-sg.pdf
OTHER PARTIES
The auditor of this sub-fund is KPMG LLP. Please note that
financial results ending 31 December of each year will be
audited.
MATERIAL INFORMATION
Nil.

Income Annual Fund Report
for the financial year as of 31 December 2019
Asian Income Fund
81|
INVESTMENT OBJECTIVE
The Asian Income Fund aims to provide income and capital growth over the medium- to longer-term by investing primarily in Asian
equities (including real estate investment trusts) and Asian fixed income securities.
The sub-fund currently offers a monthly distribution pay-out feature. Distributions are not guaranteed and can be made out of
the income, capital gains and/or capital of the sub-fund.
INVESTMENT SCOPE
The sub-fund intends to achieve this objective by investing all or substantially all of its assets in Schroder International
Opportunities Portfolio – Schroder Asian Income (“underlying fund”), in Class X Distribution, which is managed by Schroder
Investment Management (Singapore) Ltd. The underlying fund will seek to achieve the investment objective primarily through
investment in a portfolio of equity securities of Asian companies which offer attractive yields and sustainable dividend payments,
and fixed income securities and other fixed or floating rate securities, of investment grade or below investment grade (at the time
of or subsequent to acquisition), issued by governments, government agencies, supra-national and corporate issuers in Asia
which offer attractive yields. The underlying fund may substantially invest in fixed income securities and debt securities which
are below investment grade or unrated.
The sub-fund is denominated in Singapore Dollars.
FUND DETAILS AS OF 31 DECEMBER 2019
Launch Date 12 May 2014
Fund Size S$903.08 million
Initial Sales Charge Please refer to “Fees and Charges” in section 4 of the Product Summary for ILP.
Annual Management Fee
1.25% p.a., which includes management fee charged by the investment manager of the
Schroder Asian Income Fund. The Annual Management Fee is not guaranteed and may be
reviewed from time to time. However, it shall not exceed 2.0% of the sub-fund balance at any
point in time.
Custodian The Bank of New York Mellon
Dealing Frequency Every business day
Inclusion in CPFIS N.A.
CPFIS Risk Classification N.A.
Fund Manager NTUC Income Insurance Co-operative Limited
Manager of the Underlying
Fund Schroder Investment Management (Singapore) Ltd
Benchmark
The Asian Income Fund is neither constrained to nor is it targeting any specific benchmark.
However, as an indication of the performance of such a strategy, investors can consider the
performance of a reference benchmark comprising 50% MSCI AC Asia Pacific ex Japan Net and
50% JP Morgan Asia Credit Index.
Structure Single Fund
TOP 10 HOLDINGS Asian Income Fund
December 2019
Market
Value
S$ (mil)
% of Net
Asset
Value
December 2018
Market
Value
S$ (mil)
% of Net
Asset
Value
Schroder International Opportunities
Portfolio – Schroder Asian Income 898.39 99.48
Schroder International Opportunities
Portfolio – Schroder Asian Income 701.43 99.82
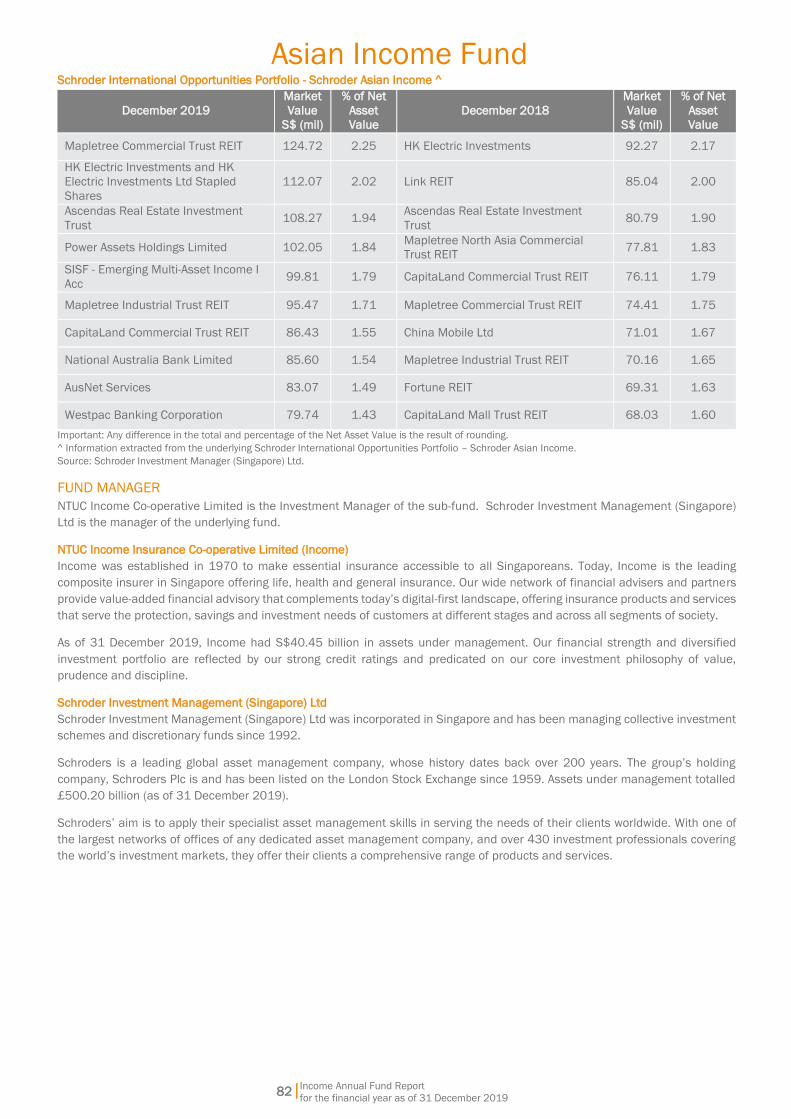
Income Annual Fund Report
for the financial year as of 31 December 2019
Asian Income Fund
82|
Schroder International Opportunities Portfolio - Schroder Asian Income ^
December 2019
Market
Value
S$ (mil)
% of Net
Asset
Value
December 2018
Market
Value
S$ (mil)
% of Net
Asset
Value
Mapletree Commercial Trust REIT 124.72 2.25 HK Electric Investments 92.27 2.17
HK Electric Investments and HK
Electric Investments Ltd Stapled
Shares
112.07 2.02 Link REIT 85.04 2.00
Ascendas Real Estate Investment
Trust 108.27 1.94
Ascendas Real Estate Investment
Trust 80.79 1.90
Power Assets Holdings Limited 102.05 1.84 Mapletree North Asia Commercial
Trust REIT 77.81 1.83
SISF - Emerging Multi-Asset Income I
Acc 99.81 1.79 CapitaLand Commercial Trust REIT 76.11 1.79
Mapletree Industrial Trust REIT 95.47 1.71 Mapletree Commercial Trust REIT 74.41 1.75
CapitaLand Commercial Trust REIT 86.43 1.55 China Mobile Ltd 71.01 1.67
National Australia Bank Limited 85.60 1.54 Mapletree Industrial Trust REIT 70.16 1.65
AusNet Services 83.07 1.49 Fortune REIT 69.31 1.63
Westpac Banking Corporation 79.74 1.43 CapitaLand Mall Trust REIT 68.03 1.60
Important: Any difference in the total and percentage of the Net Asset Value is the result of rounding.
^ Information extracted from the underlying Schroder International Opportunities Portfolio – Schroder Asian Income.
Source: Schroder Investment Manager (Singapore) Ltd.
FUND MANAGER
NTUC Income Co-operative Limited is the Investment Manager of the sub-fund. Schroder Investment Management (Singapore)
Ltd is the manager of the underlying fund.
NTUC Income Insurance Co-operative Limited (Income)
Income was established in 1970 to make essential insurance accessible to all Singaporeans. Today, Income is the leading
composite insurer in Singapore offering life, health and general insurance. Our wide network of financial advisers and partners
provide value-added financial advisory that complements today’s digital-first landscape, offering insurance products and services
that serve the protection, savings and investment needs of customers at different stages and across all segments of society.
As of 31 December 2019, Income had S$40.45 billion in assets under management. Our financial strength and diversified
investment portfolio are reflected by our strong credit ratings and predicated on our core investment philosophy of value,
prudence and discipline.
Schroder Investment Management (Singapore) Ltd
Schroder Investment Management (Singapore) Ltd was incorporated in Singapore and has been managing collective investment
schemes and discretionary funds since 1992.
Schroders is a leading global asset management company, whose history dates back over 200 years. The group’s holding
company, Schroders Plc is and has been listed on the London Stock Exchange since 1959. Assets under management totalled
£500.20 billion (as of 31 December 2019).
Schroders’ aim is to apply their specialist asset management skills in serving the needs of their clients worldwide. With one of
the largest networks of offices of any dedicated asset management company, and over 430 investment professionals covering
the world’s investment markets, they offer their clients a comprehensive range of products and services.
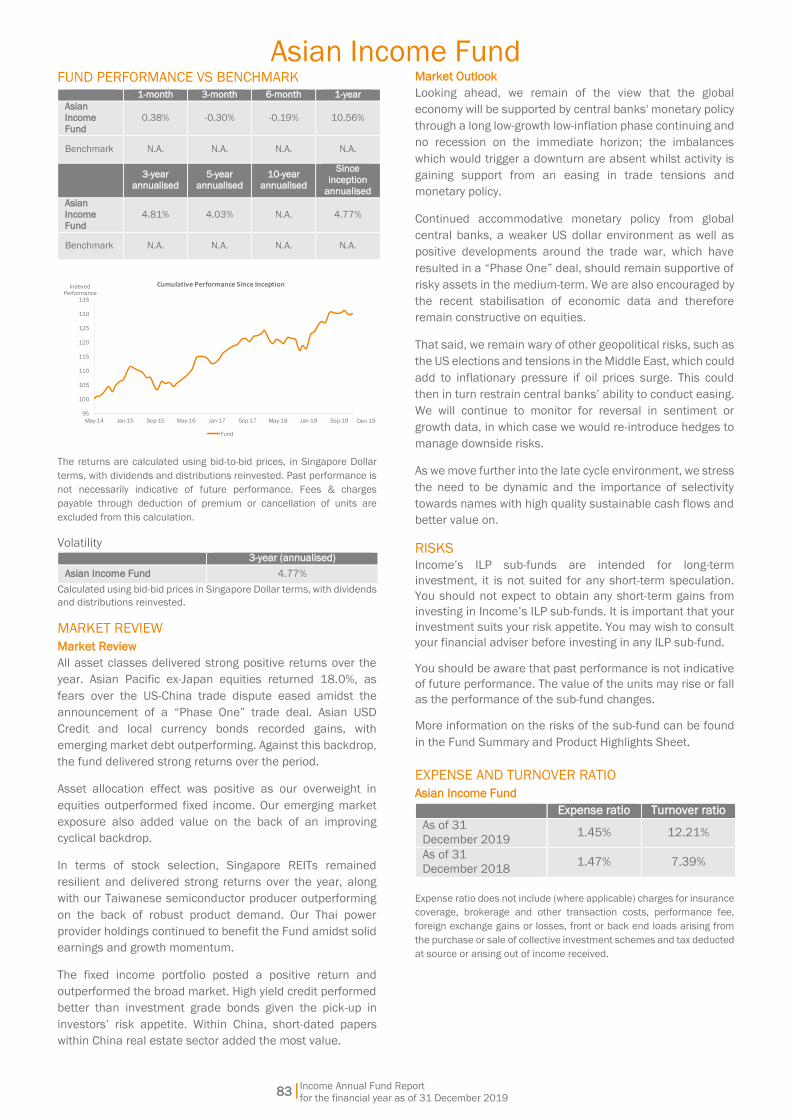
Income Annual Fund Report
for the financial year as of 31 December 2019
Asian Income Fund
83|
FUND PERFORMANCE VS BENCHMARK 1-month 3-month 6-month 1-year
Asian
Income
Fund
0.38% -0.30% -0.19% 10.56%
Benchmark N.A. N.A. N.A. N.A.
3-year
annualised 5-year
annualised 10-year
annualised
Since
inception
annualised
Asian
Income
Fund
4.81% 4.03% N.A. 4.77%
Benchmark N.A. N.A. N.A. N.A.
95
100
105
110
115
120
125
130
135
May-14 Jan-15 Sep-15 May-16 Jan-17 Sep-17 May-18 Jan-19 Sep-19
Cumulative Performance Since Inception
Fund
IndexedPerformance
Dec-19
The returns are calculated using bid-to-bid prices, in Singapore Dollar
terms, with dividends and distributions reinvested. Past performance is
not necessarily indicative of future performance. Fees & charges
payable through deduction of premium or cancellation of units are
excluded from this calculation.
Volatility
3-year (annualised)
Asian Income Fund 4.77%
Calculated using bid-bid prices in Singapore Dollar terms, with dividends
and distributions reinvested.
MARKET REVIEW
Market Review
All asset classes delivered strong positive returns over the
year. Asian Pacific ex-Japan equities returned 18.0%, as
fears over the US-China trade dispute eased amidst the
announcement of a “Phase One” trade deal. Asian USD
Credit and local currency bonds recorded gains, with
emerging market debt outperforming. Against this backdrop,
the fund delivered strong returns over the period.
Asset allocation effect was positive as our overweight in
equities outperformed fixed income. Our emerging market
exposure also added value on the back of an improving
cyclical backdrop.
In terms of stock selection, Singapore REITs remained
resilient and delivered strong returns over the year, along
with our Taiwanese semiconductor producer outperforming
on the back of robust product demand. Our Thai power
provider holdings continued to benefit the Fund amidst solid
earnings and growth momentum.
The fixed income portfolio posted a positive return and
outperformed the broad market. High yield credit performed
better than investment grade bonds given the pick-up in
investors’ risk appetite. Within China, short-dated papers
within China real estate sector added the most value.
Market Outlook
Looking ahead, we remain of the view that the global
economy will be supported by central banks' monetary policy
through a long low-growth low-inflation phase continuing and
no recession on the immediate horizon; the imbalances
which would trigger a downturn are absent whilst activity is
gaining support from an easing in trade tensions and
monetary policy.
Continued accommodative monetary policy from global
central banks, a weaker US dollar environment as well as
positive developments around the trade war, which have
resulted in a “Phase One” deal, should remain supportive of
risky assets in the medium-term. We are also encouraged by
the recent stabilisation of economic data and therefore
remain constructive on equities.
That said, we remain wary of other geopolitical risks, such as
the US elections and tensions in the Middle East, which could
add to inflationary pressure if oil prices surge. This could
then in turn restrain central banks’ ability to conduct easing.
We will continue to monitor for reversal in sentiment or
growth data, in which case we would re-introduce hedges to
manage downside risks.
As we move further into the late cycle environment, we stress
the need to be dynamic and the importance of selectivity
towards names with high quality sustainable cash flows and
better value on.
RISKS
Income’s ILP sub-funds are intended for long-term
investment, it is not suited for any short-term speculation.
You should not expect to obtain any short-term gains from
investing in Income’s ILP sub-funds. It is important that your
investment suits your risk appetite. You may wish to consult
your financial adviser before investing in any ILP sub-fund.
You should be aware that past performance is not indicative
of future performance. The value of the units may rise or fall
as the performance of the sub-fund changes.
More information on the risks of the sub-fund can be found
in the Fund Summary and Product Highlights Sheet.
EXPENSE AND TURNOVER RATIO
Asian Income Fund
Expense ratio Turnover ratio
As of 31
December 2019 1.45% 12.21%
As of 31
December 2018 1.47% 7.39%
Expense ratio does not include (where applicable) charges for insurance
coverage, brokerage and other transaction costs, performance fee,
foreign exchange gains or losses, front or back end loads arising from
the purchase or sale of collective investment schemes and tax deducted
at source or arising out of income received.

Income Annual Fund Report
for the financial year as of 31 December 2019
Asian Income Fund
84|
Schroder International Opportunities Portfolio - Schroder
Asian Income
Expense ratio Turnover ratio
As of 31
December 2019 1.44% 38.23%
As of 31
December 2018 1.45% 26.18%
Expense ratio does not include brokerage and other transaction costs,
performance fee, foreign exchange gains or losses, front or back end
loads arising from the purchase or sale of other schemes and tax
deducted at source or arising out of income received.
ASSET ALLOCATION AS OF 31 DECEMBER 2019
Market Value
S$ (mil)
% of Net Asset
Value
Equities 474.83 52.58
Fixed Income 336.49 37.26
Collective Investment
Schemes - Multi -
Asset
16.17 1.79
Collective Investment
Schemes - Equities 10.75 1.19
Collective Investment
Schemes - Fixed
Income
0.36 0.04
Cash & Others 64.48 7.14
Total 903.08 100.00
COUNTRY ALLOCATION AS OF 31 DECEMBER 2019
Market Value
S$ (mil)
% of Net Asset
Value
Australia 122.46 13.56
Brazil 9.67 1.07
China 176.64 19.56
Hong Kong 102.41 11.34
India 47.32 5.24
Indonesia 38.74 4.29
Luxembourg 27.27 3.02
Macao 11.38 1.26
Philippines 12.82 1.42
Singapore 146.39 16.21
South Korea 14.81 1.64
Taiwan 15.08 1.67
Thailand 35.04 3.88
United Arab Emirates 19.87 2.20
Others 58.70 6.50
Cash & Others 64.48 7.14
Total 903.08 100.00
SECTOR ALLOCATION AS OF 31 DECEMBER 2019
Market Value
S$ (mil)
% of Net Asset
Value
Bank 124.35 13.77
Collective Investment
Schemes - Equities 10.75 1.19
Collective Investment
Schemes - Multi-
Asset
16.17 1.79
Government 27.80 3.08
Hotel & Leisure 13.37 1.48
Metals & Mining 13.91 1.54
Miscellaneous 99.52 11.02
Oil & Gas 37.66 4.17
Real Estate 233.90 25.90
Semiconductor 13.73 1.52
Telecommunications 59.87 6.63
Transportation &
Logistics 17.16 1.90
Utilities 107.92 11.95
Others 62.49 6.92
Cash & Others 64.48 7.14
Total 903.08 100.00
CREDIT RATINGS OF DEBT SECURITIES
S&P's rating or its
equivalent
Market Value
S$ (mil)
% of Net Asset
Value
AAA / Aaa 1.73 0.19
AA+ / Aa1 0.90 0.10
AA / Aa2 7.13 0.79
AA- / Aa3 0.63 0.07
A+ / A1 26.11 2.89
A / A2 18.78 2.08
A- / A3 18.24 2.02
BBB+ / Baa1 59.33 6.57
BBB / Baa2 51.66 5.72
BBB- / Baa3 41.90 4.64
BB+ / Ba1 6.95 0.77
BB / Ba2 14.27 1.58
BB- / Ba3 23.48 2.60
B+ / B1 17.97 1.99
B / B2 15.17 1.68
B- / B3 2.26 0.25
CCC+ / Caa1 0.36 0.04
Not Rated 29.62 3.28
Total 336.49 37.26
‘Not rated’ refers to debt securities which are not rated by S&P or other
equivalent rating agencies, including but not limited to treasury bills,
bonds issued by government, government agency, statutory board or
corporate.
Important: Any difference in the total and percentage of the Net Asset
Value is the result of rounding.

Income Annual Fund Report
for the financial year as of 31 December 2019
Asian Income Fund
85|
SUBSCRIPTIONS AND REDEMPTIONS AS OF 31
DECEMBER 2019
S$
Subscriptions 263,391,433
Redemptions (97,833,899)
EXPOSURE TO DERIVATIVES Nil.
INVESTMENT IN COLLECTIVE INVESTMENT SCHEMES
December 2019
Market
Value
S$ (mil)
% of Net
Asset
Value
Schroder International Opportunities
Portfolio – Schroder Asian Income 898.39 99.48
BORROWINGS
Nil.
RELATED PARTY DISCLOSURE
Income is the Investment Manager of the sub-fund. During
the financial period ended 31 December 2019,
management fee paid or payable by the sub-fund to the
Investment Manager is S$10,255,635.
SOFT DOLLAR COMMISSION OR ARRANGEMENT
Income
The Manager did not retain for its own account, cash or
commission rebates arising out of transactions executed in
or outside Singapore. The Manager also did not receive soft
dollars for the sub-fund.
Schroder
In the management of the underlying Fund, Schroder may
accept soft dollar commissions from, or enter into soft dollar
arrangements with, stockbrokers who execute trades on
behalf of the underlying Fund and the soft dollars received
are restricted to the following kinds of services:
i. Research, analysis or price information, including
computer or other information facilities;
ii. Performance measurement;
iii. Portfolio valuations; and
iv. Administration services.
Schroder may not receive or enter into soft dollar
commissions or arrangements unless (a) such soft dollar
commissions or arrangements shall reasonably assist
Schroder in their management of the underlying Fund, (b)
best execution is carried out for the transactions, and (c) that
no unnecessary trades are entered into in order to qualify for
such soft dollar commissions or arrangements. Schroder
shall not receive goods and services such as travel,
accommodation and entertainment.
CONFLICTS OF INTEREST
Income
As the Manager of various Income ILP sub-funds and
insurance funds, we may from time to time have to deal with
competing or conflicting interests between these sub-
funds/insurance funds. However, we will use all reasonable
endeavours to act fairly and in the best interest of the sub-
fund. We will conduct all transactions with or for the sub-fund
on an arm’s length basis. The Manager has in place policies
and procedures to monitor and mitigate conflicts of interests
which may arise in the management of these sub-funds. We
believe that these policies and procedures are reasonably
designed to ensure that portfolio management decisions are
made in the best interest of the sub-fund and each sub-fund
is treated fairly, regardless of the existence of any conflict.
Schroder
The Managers and/or SIML may from time to time have to
deal with competing or conflicting interests between the
other funds which are managed by the Managers and/or
SIML (as the case may be) with (in the case of the Managers)
one or more of the Sub-Funds or (in the case of SIML) the
Schroder Global Quality Bond. For example, the Managers or
SIML may make a purchase or sale decision on behalf of
some or all of the other funds without making the same
decision on behalf of the relevant Sub-Fund(s), as a decision
whether or not to make the same investment or sale for the
relevant Sub-Fund(s) depends on factors such as the cash
availability and portfolio balance of such Sub-Fund(s).
However the Managers and SIML will each use reasonable
endeavours at all times to act fairly and in the interests of
the relevant Sub-Fund(s). In particular, after taking into
account the availability of cash and relevant investment
guidelines of the other funds and the relevant Sub-Fund(s),
the Managers and/or SIML (as the case may be) will
endeavour to ensure that securities bought and sold will be
allocated proportionately as far as possible among the other
funds and the relevant Sub-Fund(s).
The factors which the Managers and/or SIML will take into
account when determining if there are any conflicts of
interest as described above include the assets (including
cash) of the relevant Sub-Fund(s) as well as the assets of the
other funds managed by the Managers and/or SIML (as the
case may be). To the extent that another fund managed by
the Managers and/or SIML (as the case may be) intends to
purchase substantially similar assets, the Managers and/or
SIML (as the case may be) will ensure that the assets are
allocated fairly and proportionately and that the interests of
all investors are treated equally between the relevant Sub-
Fund(s) and the other funds. Associates of the Trustee may
be engaged to offer financial, banking and brokerage
services to the Sub-Fund(s) or buy, hold and deal in any
investments, enter into contracts or other arrangements with
the Trustee and make profits from these activities. Such
services, where provided, and such activities, where entered
into, will be on an arm’s length basis.
OTHER PARTIES
The auditor of this sub-fund is KPMG LLP. Please note that
financial results ending 31 December of each year will be
audited.
MATERIAL INFORMATION
Nil.

Global Income Fund
86| Income Annual Fund Report
for the financial year as of 31 December 2019
INVESTMENT OBJECTIVE
The Global Income Fund aims to provide income and capital growth over the medium to long-term by investing primarily in global
equities and global fixed income securities directly or indirectly through the use of investment funds or financial derivative
instruments (including, but not limited to, futures, options and credit default swaps).
The sub-fund currently offers a monthly distribution pay-out feature. Distributions are not guaranteed and can be made out of
the income, capital gains and/or capital of the sub-fund.
INVESTMENT SCOPE
The sub-fund intends to achieve the objective by investing all or substantially all of its assets in Schroder International Selection
Fund Global Multi-Asset Income (“underlying fund”) in SGD Hedged A Distribution Share Class. The underlying fund invests at
least two-thirds of its assets directly or indirectly through derivatives in equity and equity-related securities, fixed income securities
and alternative asset classes. As the underlying fund is index-unconstrained it is managed without reference to an index.
The sub-fund is denominated in Singapore Dollars.
Further information on the exposure to alternative asset classes, can be found in Appendix III, section "Fund Details" of the
underlying fund’s Luxembourg Prospectus available at https://www.schroders.com/getfunddocument/?oid=1.9.116178.
FUND DETAILS AS OF 31 DECEMBER 2019
Launch Date 26 March 2015
Fund Size S$86.33 million
Initial Sales Charge Please refer to “Fees and Charges” in section 4 of the Product Summary for ILP.
Annual Management Fee
1.25% p.a. which includes management fee charged by the investment manager of the Schroder
International Selection Fund Global Multi-Asset Income. The Annual Management Fee is not
guaranteed and may be reviewed from time to time. However, it shall not exceed 2.0% of the sub-
fund balance at any point of time.
Custodian The Bank of New York Mellon
Dealing Frequency Every business day
Inclusion in CPFIS N.A.
CPFIS Risk Classification N.A.
Fund Manager NTUC Income Insurance Co-operative Limited
Investment Manager of the
Underlying Fund Schroder Investment Management Limited
Benchmark The Global Income fund is unconstrained and therefore not managed with reference to a
benchmark.
Structure Single Fund
TOP 10 HOLDINGS Global Income Fund
December 2019
Market
Value
S$ (mil)
% of Net
Asset
Value
December 2018
Market
Value
S$ (mil)
% of Net
Asset
Value
Schroder International Selection Fund
- Global Multi-Asset Income 86.12 99.76
Schroder International Selection Fund
- Global Multi-Asset Income 87.12 100.35

Global Income Fund
87| Income Annual Fund Report
for the financial year as of 31 December 2019
Schroder International Selection Fund - Global Multi-Asset Income^
December 2019
Market
Value
S$ (mil)
% of Net
Asset
Value
December 2018
Market
Value
S$ (mil)
% of Net
Asset
Value
Avantor Inc 6% 150522 24.88 0.65 US Treasury Note 2.875% 150828 149.89 3.66
Wells Fargo & Co Series L Perp 7.5%
311249 23.35 0.61 Triple Point Social Housing REIT Plc 31.12 0.76
Bank of America Corp Perp 7.25%
311249 22.58 0.59 GCP Infrastructure Investments Ltd 30.71 0.75
Broadcom Inc 8% 300922 20.28 0.53 Schroder Real Estate Investment
Trust Ltd 28.26 0.69
Cheniere Energy Partners LP 5.625%
011026 19.91 0.52
Starwood European Real Estate
Finance Ltd 28.26 0.69
Tenet Healthcare Corporation 4.875%
010126 18.38 0.48
Schroder European Real Estate
Investment Trust Ltd 24.57 0.60
Microsoft Corporation 17.22 0.45 International Public Partnerships
Limited 23.35 0.57
Sprint Capital Corporation 6.875%
151128 16.84 0.44
Bilfinger Berger Global Infrastructure
SICAV SA 22.93 0.56
CCO Holdings LLC 5.375% 010629 16.84 0.44 Federative Republic Of Brazil 10%
010123 22.93 0.56
AIA Group Ltd 14.92 0.39 HICL Infrastructure Ltd 20.48 0.50
Important: Any difference in the total and percentage of the Net Asset Value is the result of rounding.
^ Information extracted from the underlying Schroder International Selection Fund - Global Multi-Asset Income.
Source: Schroder Investment Manager (Singapore) Ltd.
FUND MANAGER
NTUC Income Insurance Co-operative Limited is the Investment Manager of the sub-fund. The investment manager of the
underlying fund is Schroder Investment Management Limited.
NTUC Income Insurance Co-operative Limited (Income)
Income was established in 1970 to make essential insurance accessible to all Singaporeans. Today, Income is the leading
composite insurer in Singapore offering life, health and general insurance. Our wide network of financial advisers and partners
provide value-added financial advisory that complements today’s digital-first landscape, offering insurance products and services
that serve the protection, savings and investment needs of customers at different stages and across all segments of society.
As of 31 December 2019, Income had S$40.45 billion in assets under management. Our financial strength and diversified
investment portfolio are reflected by our strong credit ratings and predicated on our core investment philosophy of value,
prudence and discipline.
Schroder Investment Management Limited
The investment manager of the underlying fund is Schroder Investment Management Limited which is domiciled in the United
Kingdom and has been managing collective investment schemes and discretionary funds since 1985. The management company
of Schroder International Selection Fund is Schroder Investment Management (Europe) S.A. which has been managing funds
since 2005.
Schroder Investment Management (Singapore) Ltd
Schroder Investment Management (Singapore) Ltd was incorporated in Singapore and has been managing collective investment
schemes and discretionary funds since 1992.
Schroders is a leading global asset management company, whose history dates back over 200 years. The group’s holding
company, Schroders Plc is and has been listed on the London Stock Exchange since 1959. Assets under management totalled
£500.20 billion (as of 31 December 2019).
Schroders’ aim is to apply their specialist asset management skills in serving the needs of their clients worldwide. With one of
the largest networks of offices of any dedicated asset management company, and over 430 investment professionals covering
the world’s investment markets, they offer their clients a comprehensive range of products and services.
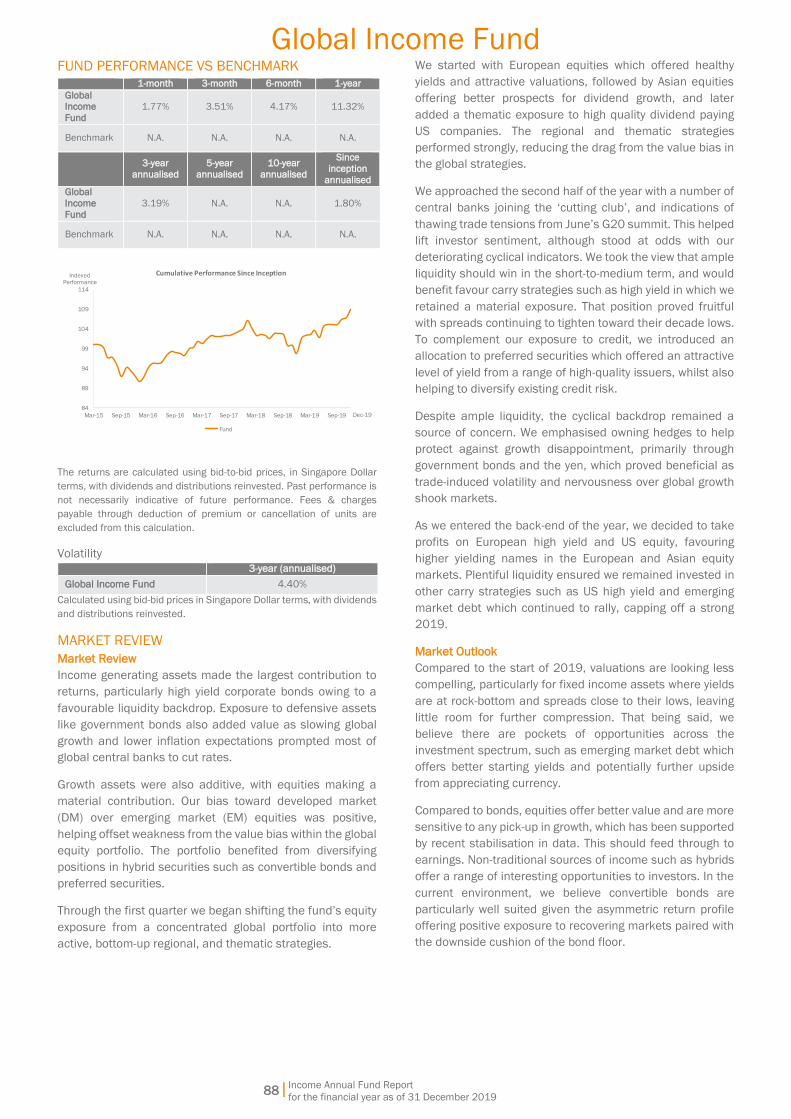
Global Income Fund
88| Income Annual Fund Report
for the financial year as of 31 December 2019
FUND PERFORMANCE VS BENCHMARK
1-month 3-month 6-month 1-year
Global Income
Fund
1.77% 3.51% 4.17% 11.32%
Benchmark N.A. N.A. N.A. N.A.
3-year
annualised
5-year
annualised
10-year
annualised
Since
inception
annualised
Global
Income
Fund
3.19% N.A. N.A. 1.80%
Benchmark N.A. N.A. N.A. N.A.
84
89
94
99
104
109
114
Mar-15 Sep-15 Mar-16 Sep-16 Mar-17 Sep-17 Mar-18 Sep-18 Mar-19 Sep-19
Cumulative Performance Since Inception
Fund
IndexedPerformance
Dec-19
The returns are calculated using bid-to-bid prices, in Singapore Dollar
terms, with dividends and distributions reinvested. Past performance is
not necessarily indicative of future performance. Fees & charges
payable through deduction of premium or cancellation of units are
excluded from this calculation.
Volatility
3-year (annualised)
Global Income Fund 4.40%
Calculated using bid-bid prices in Singapore Dollar terms, with dividends
and distributions reinvested.
MARKET REVIEW
Market Review
Income generating assets made the largest contribution to
returns, particularly high yield corporate bonds owing to a
favourable liquidity backdrop. Exposure to defensive assets
like government bonds also added value as slowing global
growth and lower inflation expectations prompted most of
global central banks to cut rates.
Growth assets were also additive, with equities making a
material contribution. Our bias toward developed market
(DM) over emerging market (EM) equities was positive,
helping offset weakness from the value bias within the global
equity portfolio. The portfolio benefited from diversifying
positions in hybrid securities such as convertible bonds and
preferred securities.
Through the first quarter we began shifting the fund’s equity
exposure from a concentrated global portfolio into more
active, bottom-up regional, and thematic strategies.
We started with European equities which offered healthy
yields and attractive valuations, followed by Asian equities
offering better prospects for dividend growth, and later
added a thematic exposure to high quality dividend paying
US companies. The regional and thematic strategies
performed strongly, reducing the drag from the value bias in
the global strategies.
We approached the second half of the year with a number of
central banks joining the ‘cutting club’, and indications of
thawing trade tensions from June’s G20 summit. This helped
lift investor sentiment, although stood at odds with our
deteriorating cyclical indicators. We took the view that ample
liquidity should win in the short-to-medium term, and would
benefit favour carry strategies such as high yield in which we
retained a material exposure. That position proved fruitful
with spreads continuing to tighten toward their decade lows.
To complement our exposure to credit, we introduced an
allocation to preferred securities which offered an attractive
level of yield from a range of high-quality issuers, whilst also
helping to diversify existing credit risk.
Despite ample liquidity, the cyclical backdrop remained a
source of concern. We emphasised owning hedges to help
protect against growth disappointment, primarily through
government bonds and the yen, which proved beneficial as
trade-induced volatility and nervousness over global growth
shook markets.
As we entered the back-end of the year, we decided to take
profits on European high yield and US equity, favouring
higher yielding names in the European and Asian equity
markets. Plentiful liquidity ensured we remained invested in
other carry strategies such as US high yield and emerging
market debt which continued to rally, capping off a strong
2019.
Market Outlook
Compared to the start of 2019, valuations are looking less
compelling, particularly for fixed income assets where yields
are at rock-bottom and spreads close to their lows, leaving
little room for further compression. That being said, we
believe there are pockets of opportunities across the
investment spectrum, such as emerging market debt which
offers better starting yields and potentially further upside
from appreciating currency.
Compared to bonds, equities offer better value and are more
sensitive to any pick-up in growth, which has been supported
by recent stabilisation in data. This should feed through to
earnings. Non-traditional sources of income such as hybrids
offer a range of interesting opportunities to investors. In the
current environment, we believe convertible bonds are
particularly well suited given the asymmetric return profile
offering positive exposure to recovering markets paired with
the downside cushion of the bond floor.
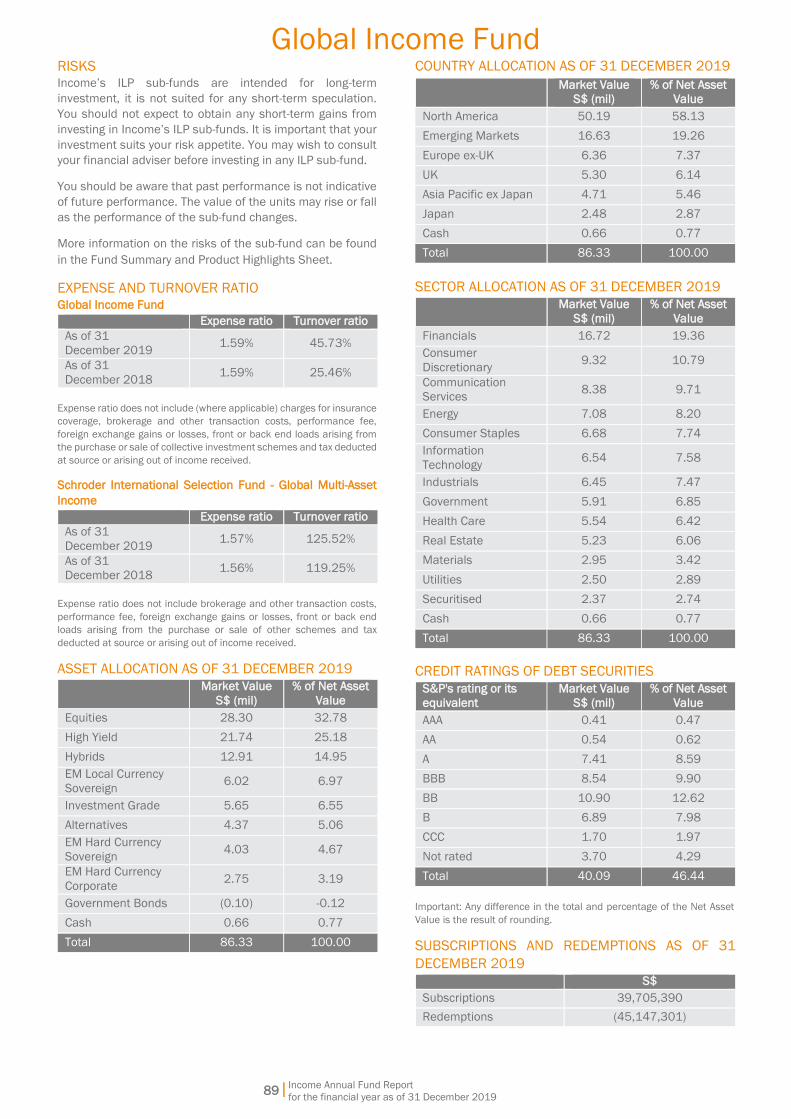
Global Income Fund
89| Income Annual Fund Report
for the financial year as of 31 December 2019
RISKS
Income’s ILP sub-funds are intended for long-term
investment, it is not suited for any short-term speculation.
You should not expect to obtain any short-term gains from
investing in Income’s ILP sub-funds. It is important that your
investment suits your risk appetite. You may wish to consult
your financial adviser before investing in any ILP sub-fund.
You should be aware that past performance is not indicative
of future performance. The value of the units may rise or fall
as the performance of the sub-fund changes.
More information on the risks of the sub-fund can be found
in the Fund Summary and Product Highlights Sheet.
EXPENSE AND TURNOVER RATIO Global Income Fund
Expense ratio Turnover ratio
As of 31
December 2019 1.59% 45.73%
As of 31
December 2018 1.59% 25.46%
Expense ratio does not include (where applicable) charges for insurance
coverage, brokerage and other transaction costs, performance fee,
foreign exchange gains or losses, front or back end loads arising from
the purchase or sale of collective investment schemes and tax deducted
at source or arising out of income received.
Schroder International Selection Fund - Global Multi-Asset
Income
Expense ratio Turnover ratio
As of 31
December 2019 1.57% 125.52%
As of 31
December 2018 1.56% 119.25%
Expense ratio does not include brokerage and other transaction costs,
performance fee, foreign exchange gains or losses, front or back end
loads arising from the purchase or sale of other schemes and tax
deducted at source or arising out of income received.
ASSET ALLOCATION AS OF 31 DECEMBER 2019
Market Value
S$ (mil)
% of Net Asset
Value
Equities 28.30 32.78
High Yield 21.74 25.18
Hybrids 12.91 14.95
EM Local Currency
Sovereign 6.02 6.97
Investment Grade 5.65 6.55
Alternatives 4.37 5.06
EM Hard Currency
Sovereign 4.03 4.67
EM Hard Currency
Corporate 2.75 3.19
Government Bonds (0.10) -0.12
Cash 0.66 0.77
Total 86.33 100.00
COUNTRY ALLOCATION AS OF 31 DECEMBER 2019
Market Value
S$ (mil)
% of Net Asset
Value
North America 50.19 58.13
Emerging Markets 16.63 19.26
Europe ex-UK 6.36 7.37
UK 5.30 6.14
Asia Pacific ex Japan 4.71 5.46
Japan 2.48 2.87
Cash 0.66 0.77
Total 86.33 100.00
SECTOR ALLOCATION AS OF 31 DECEMBER 2019
Market Value
S$ (mil)
% of Net Asset
Value
Financials 16.72 19.36
Consumer
Discretionary 9.32 10.79
Communication
Services 8.38 9.71
Energy 7.08 8.20
Consumer Staples 6.68 7.74
Information
Technology 6.54 7.58
Industrials 6.45 7.47
Government 5.91 6.85
Health Care 5.54 6.42
Real Estate 5.23 6.06
Materials 2.95 3.42
Utilities 2.50 2.89
Securitised 2.37 2.74
Cash 0.66 0.77
Total 86.33 100.00
CREDIT RATINGS OF DEBT SECURITIES
S&P's rating or its
equivalent
Market Value
S$ (mil)
% of Net Asset
Value
AAA 0.41 0.47
AA 0.54 0.62
A 7.41 8.59
BBB 8.54 9.90
BB 10.90 12.62
B 6.89 7.98
CCC 1.70 1.97
Not rated 3.70 4.29
Total 40.09 46.44
Important: Any difference in the total and percentage of the Net Asset
Value is the result of rounding.
SUBSCRIPTIONS AND REDEMPTIONS AS OF 31
DECEMBER 2019
S$
Subscriptions 39,705,390
Redemptions (45,147,301)
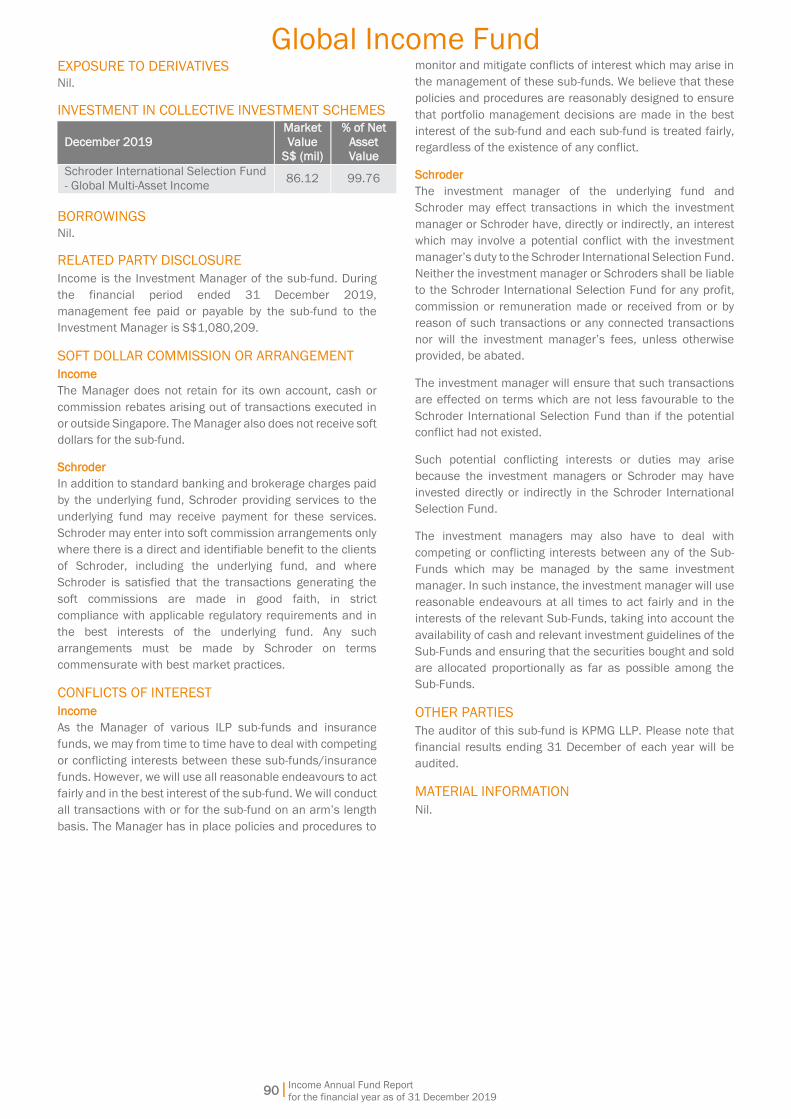
Global Income Fund
90| Income Annual Fund Report
for the financial year as of 31 December 2019
EXPOSURE TO DERIVATIVES Nil.
INVESTMENT IN COLLECTIVE INVESTMENT SCHEMES
December 2019
Market
Value
S$ (mil)
% of Net
Asset
Value
Schroder International Selection Fund
- Global Multi-Asset Income 86.12 99.76
BORROWINGS Nil.
RELATED PARTY DISCLOSURE
Income is the Investment Manager of the sub-fund. During
the financial period ended 31 December 2019,
management fee paid or payable by the sub-fund to the
Investment Manager is S$1,080,209.
SOFT DOLLAR COMMISSION OR ARRANGEMENT
Income
The Manager does not retain for its own account, cash or
commission rebates arising out of transactions executed in
or outside Singapore. The Manager also does not receive soft
dollars for the sub-fund.
Schroder
In addition to standard banking and brokerage charges paid
by the underlying fund, Schroder providing services to the
underlying fund may receive payment for these services.
Schroder may enter into soft commission arrangements only
where there is a direct and identifiable benefit to the clients
of Schroder, including the underlying fund, and where
Schroder is satisfied that the transactions generating the
soft commissions are made in good faith, in strict
compliance with applicable regulatory requirements and in
the best interests of the underlying fund. Any such
arrangements must be made by Schroder on terms
commensurate with best market practices.
CONFLICTS OF INTEREST
Income
As the Manager of various ILP sub-funds and insurance
funds, we may from time to time have to deal with competing
or conflicting interests between these sub-funds/insurance
funds. However, we will use all reasonable endeavours to act
fairly and in the best interest of the sub-fund. We will conduct
all transactions with or for the sub-fund on an arm’s length
basis. The Manager has in place policies and procedures to
monitor and mitigate conflicts of interest which may arise in
the management of these sub-funds. We believe that these
policies and procedures are reasonably designed to ensure
that portfolio management decisions are made in the best
interest of the sub-fund and each sub-fund is treated fairly,
regardless of the existence of any conflict.
Schroder
The investment manager of the underlying fund and
Schroder may effect transactions in which the investment
manager or Schroder have, directly or indirectly, an interest
which may involve a potential conflict with the investment
manager’s duty to the Schroder International Selection Fund.
Neither the investment manager or Schroders shall be liable
to the Schroder International Selection Fund for any profit,
commission or remuneration made or received from or by
reason of such transactions or any connected transactions
nor will the investment manager’s fees, unless otherwise
provided, be abated.
The investment manager will ensure that such transactions
are effected on terms which are not less favourable to the
Schroder International Selection Fund than if the potential
conflict had not existed.
Such potential conflicting interests or duties may arise
because the investment managers or Schroder may have
invested directly or indirectly in the Schroder International
Selection Fund.
The investment managers may also have to deal with
competing or conflicting interests between any of the Sub-
Funds which may be managed by the same investment
manager. In such instance, the investment manager will use
reasonable endeavours at all times to act fairly and in the
interests of the relevant Sub-Funds, taking into account the
availability of cash and relevant investment guidelines of the
Sub-Funds and ensuring that the securities bought and sold
are allocated proportionally as far as possible among the
Sub-Funds.
OTHER PARTIES
The auditor of this sub-fund is KPMG LLP. Please note that
financial results ending 31 December of each year will be
audited.
MATERIAL INFORMATION
Nil.

Income Annual Fund Report
for the financial year as of 31 December 2019
91|
Global Technology Fund
INVESTMENT OBJECTIVE
To achieve long-term capital growth by investing globally in technology or technology-related industries.
INVESTMENT SCOPE
The sub-fund is fully invested in global technology equities. The sub-fund is denominated in Singapore Dollars.
FUND DETAILS AS OF 31 DECEMBER 2019 Launch Date 1 August 2000
Fund Size S$96.52 million
Initial Sales Charge Please refer to “Fees and Charges” in section 4 of the Product Summary for ILP.
Annual Management Fee 1.25% p.a. The Annual Management Fee is not guaranteed and may be reviewed from time to
time. However, it shall not exceed 2.0% of the sub-fund balance at any point in time.
Custodian The Bank of New York Mellon
Dealing Frequency Every business day
Inclusion in CPFIS Yes (CPF OA)
CPFIS Risk Classification Higher Risk, Narrowly Focused – Sector – Technology
Fund Manager NTUC Income Insurance Co-operative Limited
Sub-Investment Manager Wellington Management Singapore Pte Ltd
Benchmark MSCI World Information Technology Index (with net dividends reinvested) in Singapore Dollars
Structure Single Fund
TOP 10 HOLDINGS
December 2019
Market
Value
S$ (mil)
% of Net
Asset
Value
December 2018
Market
Value
S$ (mil)
% of Net
Asset
Value
Microsoft Corporation 6.52 6.76 Amazon.com Inc 5.45 6.77
Apple Inc 5.90 6.11 Alphabet Inc 4.40 5.46
Alibaba Group Holdings 4.86 5.04 Microsoft Corporation 3.77 4.69
Alphabet Inc 4.74 4.91 Salesforce.com Inc 3.57 4.43
Salesforce.com Inc 3.25 3.37 Workday Inc 2.94 3.65
Tencent Holdings Ltd 3.20 3.31 PayPal Holdings Inc 2.93 3.63
PayPal Holdings Inc 3.11 3.22 Tencent Holdings Ltd 2.82 3.50
Global Payments Inc 3.03 3.14 Harris Corp 2.51 3.11
KLA Corp 2.98 3.09 Alibaba Group Holdings 2.35 2.92
Marvell Technology Group Ltd 2.87 2.97 Visa Inc 2.13 2.65
Important: Any difference in the total and percentage of the Net Asset Value is the result of rounding.

Income Annual Fund Report
for the financial year as of 31 December 2019
92|
Global Technology Fund
FUND MANAGER
NTUC Income Insurance Co-operative Limited is the
Investment Manager of the sub-fund. Wellington
Management Singapore Pte Ltd is the Sub-Investment
Manager of the sub-fund.
NTUC Income Insurance Co-operative Limited (Income)
Income was established in 1970 to make essential
insurance accessible to all Singaporeans. Today, Income is
the leading composite insurer in Singapore offering life,
health and general insurance. Our wide network of financial
advisers and partners provide value-added financial advisory
that complements today’s digital-first landscape, offering
insurance products and services that serve the protection,
savings and investment needs of customers at different
stages and across all segments of society.
As of 31 December 2019, Income had S$40.45 billion in
assets under management. Our financial strength and
diversified investment portfolio are reflected by our strong
credit ratings and predicated on our core investment
philosophy of value, prudence and discipline.
Wellington Management Singapore Pte Ltd (WMS)*
WMS is an affiliate of Wellington Management Company LLP
(WMS, Wellington Management Company LLP and the other
affiliates of Wellington Management Company LLP are
collectively referred to as WMC). With US$1.1 trillion in
assets under management, WMC serves as an investment
adviser to over 2,200 clients located in more than 60
countries, as of 31 December 2019. WMC’s singular focus
is investments — from global equities and fixed income to
currencies and commodities. WMC describes themselves as
a community of teams that create solutions designed to
respond to specific client needs. WMC’s most distinctive
strength is their proprietary, independent research, which is
shared across all areas of the organisation and used only for
managing clients' portfolios. Tracing its roots to the founding
of Wellington Fund in 1928, the firm has offices in Boston,
Massachusetts; Chicago, Illinois; Radnor, Pennsylvania; San
Francisco, California; Toronto, Canada; Beijing; Frankfurt;
Hong Kong; London; Singapore; Sydney; Tokyo; Luxembourg
and Zurich.
*With effect from 29 April 2016, WMS has replaced Trust Company of
the West (TCW) Asset Management Company as the Sub-Investment
Manager of the Global Technology Fund.
FUND PERFORMANCE VS BENCHMARK
1-month 3-month 6-month 1-year
Global
Technology
Fund
2.36% 7.30% 9.23% 36.58%
Benchmark 2.42% 10.82% 15.84% 45.57%
3-year
annualised 5-year
annualised 10-year
annualised
Since
inception
annualised
Global
Technology
Fund
19.12% 16.26% 14.86% -0.48%
Benchmark 22.74% 18.48% 14.62% 4.11%
0
50
100
150
200
250
Oct-00 Aug-02 Jun-04 Apr-06 Feb-08 Dec-09 Oct-11 Aug-13 Jun-15 Apr-17 Feb-19
Cumulative Performance Since Inception
Fund Benchmark
IndexedPerformance
Dec-19
Changes to benchmarks during the life of the sub-fund: Since inception
to Mar 2009 - 100% NASDAQ Composite Index.
From Mar 2009 to 29 April 2016, the benchmark has been changed to
Merrill Lynch 100 Technology Index in Singapore Dollar. With effect from
29 April 2016, the benchmark has been changed to MSCI World
Information Technology Index in Singapore Dollars unhedged.
The returns are calculated using bid-to-bid prices, in Singapore Dollar
terms, with dividends and distributions reinvested. Past performance is
not necessarily indicative of future performance. Fees & charges
payable through deduction of premium or cancellation of units are
excluded from this calculation.
Volatility
3-year (annualised)
Global Technology Fund 16.62%
Calculated using bid-bid prices in Singapore Dollar terms, with dividends
and distributions reinvested.
MARKET REVIEW
Market review For the twelve-month period ended 31 December 2019,
global equities rose more than 26.9% as measured by the
MSCI ACWI Index. In the first quarter of 2019, global markets
recovered and surged due to productive trade negotiations
between the US and China, and by dovish rhetoric and policy
actions from the major central banks. Brexit remained a key
area of concern with the British parliament rejecting Prime
Minister Theresa May’s deal for the third time.
In the second quarter of 2019, global equities rose for the
second straight quarter. Trade tensions between China and
the US escalated in May but eased at the end of the quarter
after the two countries agreed at the G20 summit to resume
trade negotiations. Brexit was a major concern, with the UK
avoiding an abrupt no-deal departure after the European
Union (EU) leaders granted the UK a flexible extension until
October 31. UK Prime Minister Theresa May announced that
she would resign on June 7 after failing to secure a Brexit
deal.
In the third quarter of 2019, Boris Johnson was appointed as
the new prime minister of the UK after his victory in the
Conservative Party leadership contest. UK opposition parties
vowed to block Prime Minister Johnson’s bid for a general
election and Parliament passed legislation requiring him to
request an extension to the Brexit process if he fails to
secure an acceptable deal. On the monetary front, the US
Federal Reserve (Fed) cut interest rates in July, September
and October to extend the US economic expansion amid a
slowdown in growth and trade uncertainty. The European
Central Bank (ECB) unveiled a sweeping, long-term economic
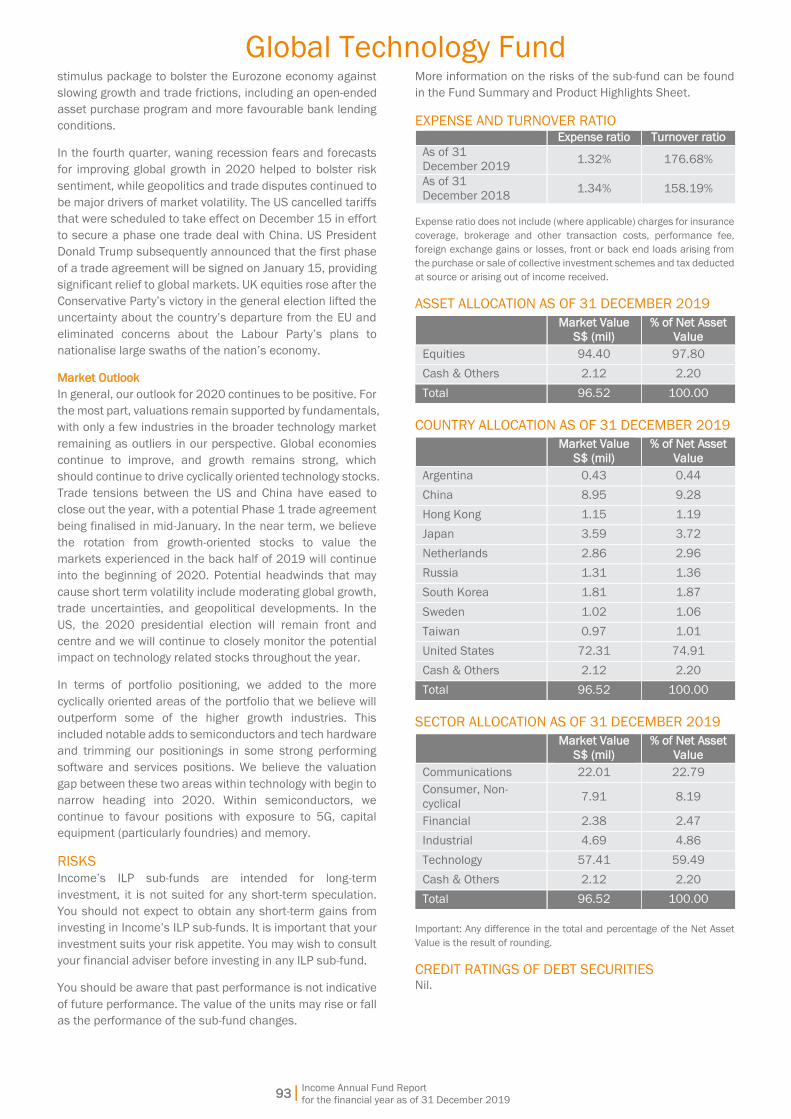
Income Annual Fund Report
for the financial year as of 31 December 2019
93|
Global Technology Fund
stimulus package to bolster the Eurozone economy against
slowing growth and trade frictions, including an open-ended
asset purchase program and more favourable bank lending
conditions.
In the fourth quarter, waning recession fears and forecasts
for improving global growth in 2020 helped to bolster risk
sentiment, while geopolitics and trade disputes continued to
be major drivers of market volatility. The US cancelled tariffs
that were scheduled to take effect on December 15 in effort
to secure a phase one trade deal with China. US President
Donald Trump subsequently announced that the first phase
of a trade agreement will be signed on January 15, providing
significant relief to global markets. UK equities rose after the
Conservative Party’s victory in the general election lifted the
uncertainty about the country’s departure from the EU and
eliminated concerns about the Labour Party’s plans to
nationalise large swaths of the nation’s economy.
Market Outlook In general, our outlook for 2020 continues to be positive. For
the most part, valuations remain supported by fundamentals,
with only a few industries in the broader technology market
remaining as outliers in our perspective. Global economies
continue to improve, and growth remains strong, which
should continue to drive cyclically oriented technology stocks.
Trade tensions between the US and China have eased to
close out the year, with a potential Phase 1 trade agreement
being finalised in mid-January. In the near term, we believe
the rotation from growth-oriented stocks to value the
markets experienced in the back half of 2019 will continue
into the beginning of 2020. Potential headwinds that may
cause short term volatility include moderating global growth,
trade uncertainties, and geopolitical developments. In the
US, the 2020 presidential election will remain front and
centre and we will continue to closely monitor the potential
impact on technology related stocks throughout the year.
In terms of portfolio positioning, we added to the more
cyclically oriented areas of the portfolio that we believe will
outperform some of the higher growth industries. This
included notable adds to semiconductors and tech hardware
and trimming our positionings in some strong performing
software and services positions. We believe the valuation
gap between these two areas within technology with begin to
narrow heading into 2020. Within semiconductors, we
continue to favour positions with exposure to 5G, capital
equipment (particularly foundries) and memory.
RISKS
Income’s ILP sub-funds are intended for long-term
investment, it is not suited for any short-term speculation.
You should not expect to obtain any short-term gains from
investing in Income’s ILP sub-funds. It is important that your
investment suits your risk appetite. You may wish to consult
your financial adviser before investing in any ILP sub-fund.
You should be aware that past performance is not indicative
of future performance. The value of the units may rise or fall
as the performance of the sub-fund changes.
More information on the risks of the sub-fund can be found
in the Fund Summary and Product Highlights Sheet.
EXPENSE AND TURNOVER RATIO
Expense ratio Turnover ratio
As of 31
December 2019 1.32% 176.68%
As of 31
December 2018 1.34% 158.19%
Expense ratio does not include (where applicable) charges for insurance
coverage, brokerage and other transaction costs, performance fee,
foreign exchange gains or losses, front or back end loads arising from
the purchase or sale of collective investment schemes and tax deducted
at source or arising out of income received.
ASSET ALLOCATION AS OF 31 DECEMBER 2019
Market Value
S$ (mil)
% of Net Asset
Value
Equities 94.40 97.80
Cash & Others 2.12 2.20
Total 96.52 100.00
COUNTRY ALLOCATION AS OF 31 DECEMBER 2019
Market Value
S$ (mil)
% of Net Asset
Value
Argentina 0.43 0.44
China 8.95 9.28
Hong Kong 1.15 1.19
Japan 3.59 3.72
Netherlands 2.86 2.96
Russia 1.31 1.36
South Korea 1.81 1.87
Sweden 1.02 1.06
Taiwan 0.97 1.01
United States 72.31 74.91
Cash & Others 2.12 2.20
Total 96.52 100.00
SECTOR ALLOCATION AS OF 31 DECEMBER 2019
Market Value
S$ (mil)
% of Net Asset
Value
Communications 22.01 22.79
Consumer, Non-
cyclical 7.91 8.19
Financial 2.38 2.47
Industrial 4.69 4.86
Technology 57.41 59.49
Cash & Others 2.12 2.20
Total 96.52 100.00
Important: Any difference in the total and percentage of the Net Asset
Value is the result of rounding.
CREDIT RATINGS OF DEBT SECURITIES Nil.

Income Annual Fund Report
for the financial year as of 31 December 2019
94|
Global Technology Fund
SUBSCRIPTIONS AND REDEMPTIONS AS OF 31
DECEMBER 2019
S$
Subscriptions 38,707,033
Redemptions (51,268,297)
EXPOSURE TO DERIVATIVES
Market
Value S$
% of Net
Asset
Value
Realised
Gains/
(Losses) S$
Unrealised
Gains/
(Losses) S$
Forwards (34) <0.01 (1,361) (34)
INVESTMENT IN COLLECTIVE INVESTMENT SCHEMES Nil.
BORROWINGS
Nil.
RELATED PARTY DISCLOSURE
Income is the Investment Manager of the sub-fund. During
the financial period ended 31 December 2019, management
fee paid or payable by the sub-fund to the Investment
Manager is S$1,167,755.
SOFT DOLLAR COMMISSION OR ARRANGEMENT
Income
The Manager does not retain for its own account, cash or
commission rebates arising out of transactions executed in
or outside Singapore. The Manager also does not receive
soft dollars for the sub-fund.
Wellington
The Managers did not retain for its own account cash or
commission rebates arising out of transactions executed in
or outside Singapore. Soft dollar commission/ arrangement
has been received/ entered into by the Sub-Investment
Manager in respect of the ILP. The soft dollar commission/
arrangement relates essentially to research services used
for and in support of the investment process.
The Sub-Investment Manager did not accept or enter into
soft dollar commission/ arrangement unless such
commission/ arrangement would reasonably assist the Sub-
Investment Manager in the management of the ILP and the
trades were executed on a best execution basis. The Sub-
Investment Manager took all reasonable steps to obtain the
best possible result of the ILP, taking into account the
following execution factors, including but not limited to, price,
costs, speed, likelihood of execution and settlement, size,
nature or any other consideration relevant to the execution
of a trade or transaction, and there was no churning of trades.
CONFLICTS OF INTEREST
The Manager and Sub-Investment Managers may from time
to time have to deal with competing or conflicting interests
between these sub-funds. However, the Manager and Sub-
Investment Managers will use all reasonable endeavours to
act fairly and in the best interest of the sub-fund. We will
conduct all transactions with or for the sub-fund on an arm’s
length basis. The Manager and Sub-investment Managers
have in place policies and procedures to monitor and
mitigate conflicts of interests which may arise in the
management of these sub-funds. We believe that these
policies and procedures are reasonably designed to ensure
that portfolio management decisions are made in the best
interest of the sub-fund and each sub-fund is treated fairly,
regardless of the existence of any conflict.
OTHER PARTIES
The auditor of this sub-fund is KPMG LLP. Please note that
financial results ending 31 December of each year will be
audited.
MATERIAL INFORMATION
Nil.

Income Annual Fund Report
for the financial year as of 31 December 2019
Multi-Asset Premium Fund
95|
INVESTMENT OBJECTIVE
To generate regular income and long-term capital appreciation for investors by investing into various asset classes.
INVESTMENT SCOPE
The sub-fund aims to achieve the objective by investing all or substantially all of its assets in the Fullerton Premium Fund
(“underlying fund”) Class C SGD distributing class. The underlying fund may invest in collective investment schemes, other
investment funds, exchange traded funds (“ETFs”), real estate investment trusts (“REITs”), listed and unlisted securities
(including but not limited to equities, fixed income/debt securities and securitised/asset-backed instruments), alternative
instruments (including but not limited to listed and OTC financial derivative instruments (“FDIs”)), money market instruments,
cash deposits and other permissible investments as deemed appropriate to achieve its investment objective and asset allocation
strategy.
The underlying fund may opportunistically allocate into private equities, commodities and other alternative investments for
additional diversification.
The underlying fund may use FDIs for hedging, efficient portfolio management, optimising returns or a combination of all three
objectives.
The sub-fund is denominated in Singapore Dollars.
FUND DETAILS AS OF 31 DECEMBER 2019
Launch Date 27 April 2018
Fund Size S$4.89 million
Initial Sales Charge Please refer to “Fees and Charges” in section 4 of the Product Summary for ILP.
Annual Management Fee
1.3% p.a. which includes management fee charged by the manager of the Fullerton Premium
Fund Class C SGD distributing class. The Annual Management Fee is not guaranteed and may
be reviewed from time to time. However, it shall not exceed 2.0% of the sub-fund balance at
any point of time.
Custodian The Bank of New York Mellon
Dealing Frequency Every business day
Inclusion in CPFIS N.A.
CPFIS Risk Classification N.A.
Fund Manager NTUC Income Insurance Co-operative Limited
Manager of the Underlying
Fund Fullerton Fund Management Company Ltd
Benchmark The Multi-Asset Premium Fund is unconstrained and therefore not managed with reference to
a benchmark.
Structure Single Fund
TOP 10 HOLDINGS Multi-Asset Premium Fund
December 2019
Market
Value
S$ (mil)
% of Net
Asset
Value
December 2018
Market
Value
S$ (mil)
% of Net
Asset
Value
Fullerton Premium Fund 4.88 99.90 Fullerton Premium Fund 3.93 100.05
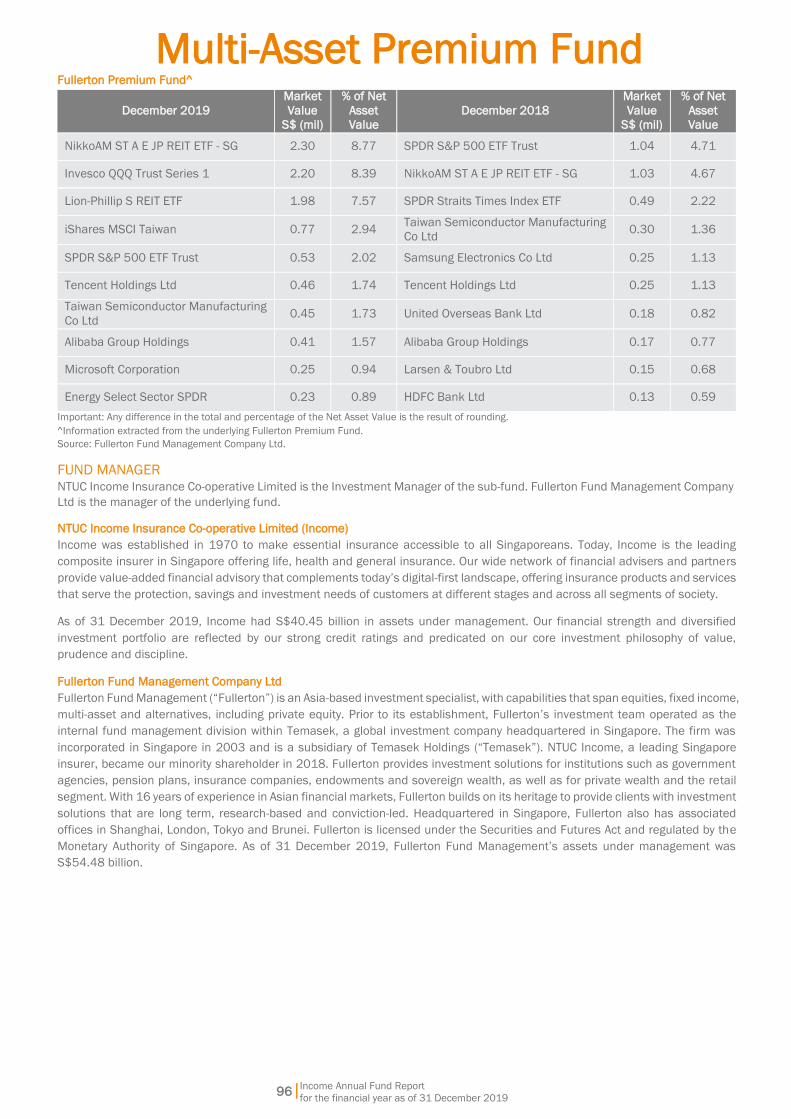
Income Annual Fund Report
for the financial year as of 31 December 2019
Multi-Asset Premium Fund
96|
Fullerton Premium Fund^
December 2019
Market
Value
S$ (mil)
% of Net
Asset
Value
December 2018
Market
Value
S$ (mil)
% of Net
Asset
Value
NikkoAM ST A E JP REIT ETF - SG 2.30 8.77 SPDR S&P 500 ETF Trust 1.04 4.71
Invesco QQQ Trust Series 1 2.20 8.39 NikkoAM ST A E JP REIT ETF - SG 1.03 4.67
Lion-Phillip S REIT ETF 1.98 7.57 SPDR Straits Times Index ETF 0.49 2.22
iShares MSCI Taiwan 0.77 2.94 Taiwan Semiconductor Manufacturing
Co Ltd 0.30 1.36
SPDR S&P 500 ETF Trust 0.53 2.02 Samsung Electronics Co Ltd 0.25 1.13
Tencent Holdings Ltd 0.46 1.74 Tencent Holdings Ltd 0.25 1.13
Taiwan Semiconductor Manufacturing
Co Ltd 0.45 1.73 United Overseas Bank Ltd 0.18 0.82
Alibaba Group Holdings 0.41 1.57 Alibaba Group Holdings 0.17 0.77
Microsoft Corporation 0.25 0.94 Larsen & Toubro Ltd 0.15 0.68
Energy Select Sector SPDR 0.23 0.89 HDFC Bank Ltd 0.13 0.59
Important: Any difference in the total and percentage of the Net Asset Value is the result of rounding.
^Information extracted from the underlying Fullerton Premium Fund.
Source: Fullerton Fund Management Company Ltd.
FUND MANAGER
NTUC Income Insurance Co-operative Limited is the Investment Manager of the sub-fund. Fullerton Fund Management Company
Ltd is the manager of the underlying fund.
NTUC Income Insurance Co-operative Limited (Income)
Income was established in 1970 to make essential insurance accessible to all Singaporeans. Today, Income is the leading
composite insurer in Singapore offering life, health and general insurance. Our wide network of financial advisers and partners
provide value-added financial advisory that complements today’s digital-first landscape, offering insurance products and services
that serve the protection, savings and investment needs of customers at different stages and across all segments of society.
As of 31 December 2019, Income had S$40.45 billion in assets under management. Our financial strength and diversified
investment portfolio are reflected by our strong credit ratings and predicated on our core investment philosophy of value,
prudence and discipline.
Fullerton Fund Management Company Ltd
Fullerton Fund Management (“Fullerton”) is an Asia-based investment specialist, with capabilities that span equities, fixed income,
multi-asset and alternatives, including private equity. Prior to its establishment, Fullerton’s investment team operated as the
internal fund management division within Temasek, a global investment company headquartered in Singapore. The firm was
incorporated in Singapore in 2003 and is a subsidiary of Temasek Holdings (“Temasek”). NTUC Income, a leading Singapore
insurer, became our minority shareholder in 2018. Fullerton provides investment solutions for institutions such as government
agencies, pension plans, insurance companies, endowments and sovereign wealth, as well as for private wealth and the retail
segment. With 16 years of experience in Asian financial markets, Fullerton builds on its heritage to provide clients with investment
solutions that are long term, research-based and conviction-led. Headquartered in Singapore, Fullerton also has associated
offices in Shanghai, London, Tokyo and Brunei. Fullerton is licensed under the Securities and Futures Act and regulated by the
Monetary Authority of Singapore. As of 31 December 2019, Fullerton Fund Management’s assets under management was
S$54.48 billion.
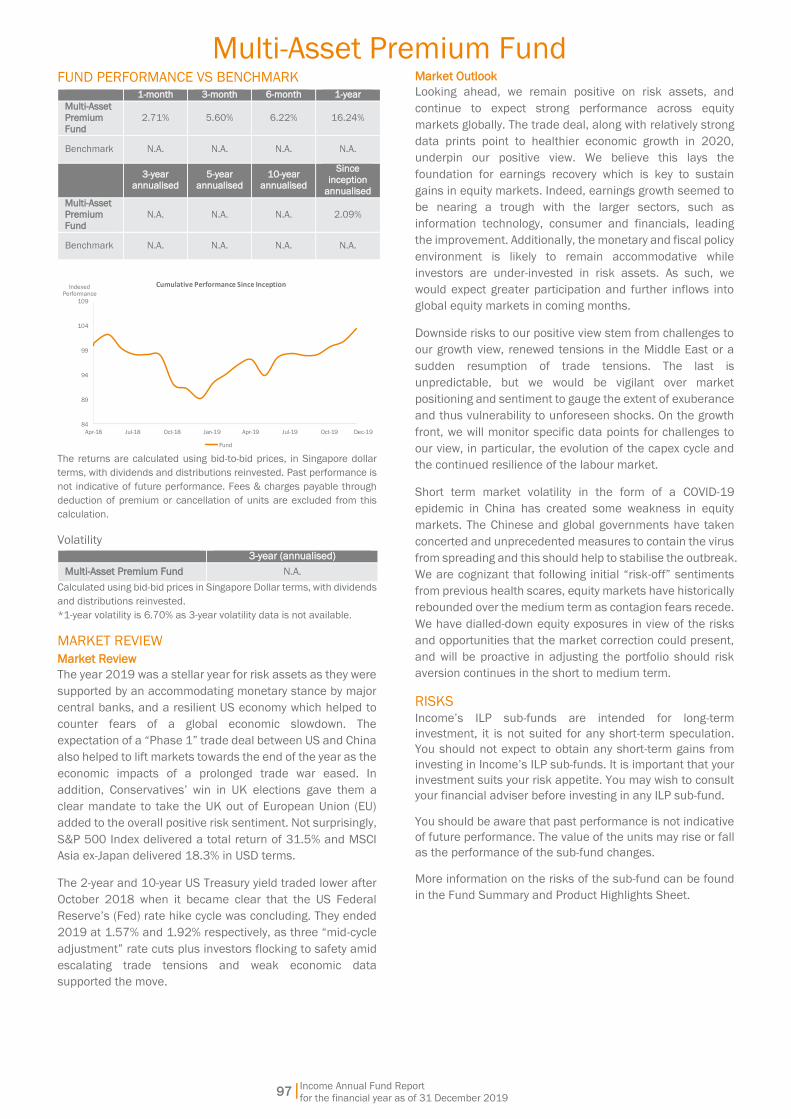
Income Annual Fund Report
for the financial year as of 31 December 2019
97|
Multi-Asset Premium Fund
FUND PERFORMANCE VS BENCHMARK
1-month 3-month 6-month 1-year
Multi-Asset
Premium
Fund
2.71% 5.60% 6.22% 16.24%
Benchmark N.A. N.A. N.A. N.A.
3-year
annualised 5-year
annualised 10-year
annualised
Since
inception
annualised
Multi-Asset
Premium
Fund
N.A. N.A. N.A. 2.09%
Benchmark N.A. N.A. N.A. N.A.
84
89
94
99
104
109
Apr-18 Jul-18 Oct-18 Jan-19 Apr-19 Jul-19 Oct-19
Cumulative Performance Since Inception
Fund
IndexedPerformance
Dec-19
The returns are calculated using bid-to-bid prices, in Singapore dollar
terms, with dividends and distributions reinvested. Past performance is
not indicative of future performance. Fees & charges payable through
deduction of premium or cancellation of units are excluded from this
calculation.
Volatility
3-year (annualised)
Multi-Asset Premium Fund N.A.
Calculated using bid-bid prices in Singapore Dollar terms, with dividends
and distributions reinvested.
*1-year volatility is 6.70% as 3-year volatility data is not available.
MARKET REVIEW
Market Review
The year 2019 was a stellar year for risk assets as they were
supported by an accommodating monetary stance by major
central banks, and a resilient US economy which helped to
counter fears of a global economic slowdown. The
expectation of a “Phase 1” trade deal between US and China
also helped to lift markets towards the end of the year as the
economic impacts of a prolonged trade war eased. In
addition, Conservatives’ win in UK elections gave them a
clear mandate to take the UK out of European Union (EU)
added to the overall positive risk sentiment. Not surprisingly,
S&P 500 Index delivered a total return of 31.5% and MSCI
Asia ex-Japan delivered 18.3% in USD terms.
The 2-year and 10-year US Treasury yield traded lower after
October 2018 when it became clear that the US Federal
Reserve’s (Fed) rate hike cycle was concluding. They ended
2019 at 1.57% and 1.92% respectively, as three “mid-cycle
adjustment” rate cuts plus investors flocking to safety amid
escalating trade tensions and weak economic data
supported the move.
Market Outlook Looking ahead, we remain positive on risk assets, and
continue to expect strong performance across equity
markets globally. The trade deal, along with relatively strong
data prints point to healthier economic growth in 2020,
underpin our positive view. We believe this lays the
foundation for earnings recovery which is key to sustain
gains in equity markets. Indeed, earnings growth seemed to
be nearing a trough with the larger sectors, such as
information technology, consumer and financials, leading
the improvement. Additionally, the monetary and fiscal policy
environment is likely to remain accommodative while
investors are under-invested in risk assets. As such, we
would expect greater participation and further inflows into
global equity markets in coming months.
Downside risks to our positive view stem from challenges to
our growth view, renewed tensions in the Middle East or a
sudden resumption of trade tensions. The last is
unpredictable, but we would be vigilant over market
positioning and sentiment to gauge the extent of exuberance
and thus vulnerability to unforeseen shocks. On the growth
front, we will monitor specific data points for challenges to
our view, in particular, the evolution of the capex cycle and
the continued resilience of the labour market.
Short term market volatility in the form of a COVID-19
epidemic in China has created some weakness in equity
markets. The Chinese and global governments have taken
concerted and unprecedented measures to contain the virus
from spreading and this should help to stabilise the outbreak.
We are cognizant that following initial “risk-off” sentiments
from previous health scares, equity markets have historically
rebounded over the medium term as contagion fears recede.
We have dialled-down equity exposures in view of the risks
and opportunities that the market correction could present,
and will be proactive in adjusting the portfolio should risk
aversion continues in the short to medium term.
RISKS
Income’s ILP sub-funds are intended for long-term
investment, it is not suited for any short-term speculation.
You should not expect to obtain any short-term gains from
investing in Income’s ILP sub-funds. It is important that your
investment suits your risk appetite. You may wish to consult
your financial adviser before investing in any ILP sub-fund.
You should be aware that past performance is not indicative
of future performance. The value of the units may rise or fall
as the performance of the sub-fund changes.
More information on the risks of the sub-fund can be found
in the Fund Summary and Product Highlights Sheet.
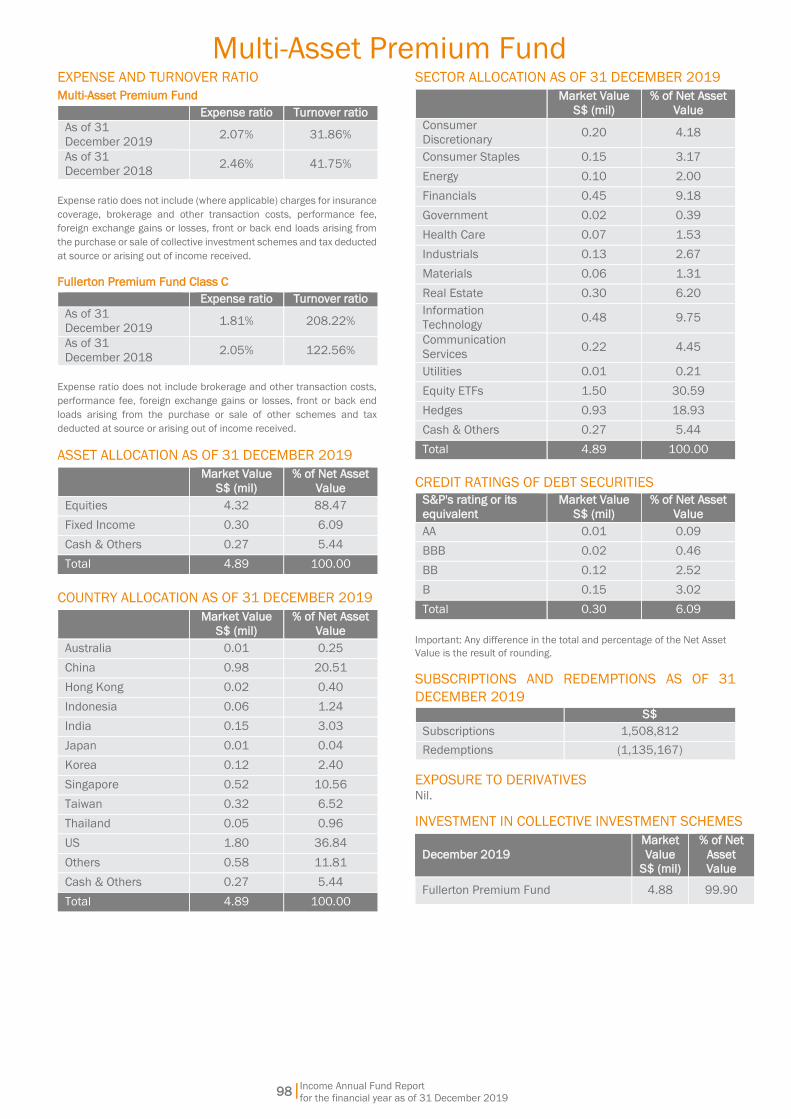
Income Annual Fund Report
for the financial year as of 31 December 2019
98|
Multi-Asset Premium Fund
EXPENSE AND TURNOVER RATIO
Multi-Asset Premium Fund
Expense ratio Turnover ratio
As of 31
December 2019 2.07% 31.86%
As of 31
December 2018 2.46% 41.75%
Expense ratio does not include (where applicable) charges for insurance
coverage, brokerage and other transaction costs, performance fee,
foreign exchange gains or losses, front or back end loads arising from
the purchase or sale of collective investment schemes and tax deducted
at source or arising out of income received.
Fullerton Premium Fund Class C
Expense ratio Turnover ratio
As of 31
December 2019 1.81% 208.22%
As of 31
December 2018 2.05% 122.56%
Expense ratio does not include brokerage and other transaction costs,
performance fee, foreign exchange gains or losses, front or back end
loads arising from the purchase or sale of other schemes and tax
deducted at source or arising out of income received.
ASSET ALLOCATION AS OF 31 DECEMBER 2019
Market Value
S$ (mil)
% of Net Asset
Value
Equities 4.32 88.47
Fixed Income 0.30 6.09
Cash & Others 0.27 5.44
Total 4.89 100.00
COUNTRY ALLOCATION AS OF 31 DECEMBER 2019
Market Value
S$ (mil)
% of Net Asset
Value
Australia 0.01 0.25
China 0.98 20.51
Hong Kong 0.02 0.40
Indonesia 0.06 1.24
India 0.15 3.03
Japan 0.01 0.04
Korea 0.12 2.40
Singapore 0.52 10.56
Taiwan 0.32 6.52
Thailand 0.05 0.96
US 1.80 36.84
Others 0.58 11.81
Cash & Others 0.27 5.44
Total 4.89 100.00
SECTOR ALLOCATION AS OF 31 DECEMBER 2019
Market Value
S$ (mil)
% of Net Asset
Value
Consumer
Discretionary 0.20 4.18
Consumer Staples 0.15 3.17
Energy 0.10 2.00
Financials 0.45 9.18
Government 0.02 0.39
Health Care 0.07 1.53
Industrials 0.13 2.67
Materials 0.06 1.31
Real Estate 0.30 6.20
Information
Technology 0.48 9.75
Communication
Services 0.22 4.45
Utilities 0.01 0.21
Equity ETFs 1.50 30.59
Hedges 0.93 18.93
Cash & Others 0.27 5.44
Total 4.89 100.00
CREDIT RATINGS OF DEBT SECURITIES
S&P's rating or its
equivalent
Market Value
S$ (mil)
% of Net Asset
Value
AA 0.01 0.09
BBB 0.02 0.46
BB 0.12 2.52
B 0.15 3.02
Total 0.30 6.09
Important: Any difference in the total and percentage of the Net Asset
Value is the result of rounding.
SUBSCRIPTIONS AND REDEMPTIONS AS OF 31
DECEMBER 2019
S$
Subscriptions 1,508,812
Redemptions (1,135,167)
EXPOSURE TO DERIVATIVES Nil.
INVESTMENT IN COLLECTIVE INVESTMENT SCHEMES
December 2019
Market
Value
S$ (mil)
% of Net
Asset
Value
Fullerton Premium Fund 4.88 99.90
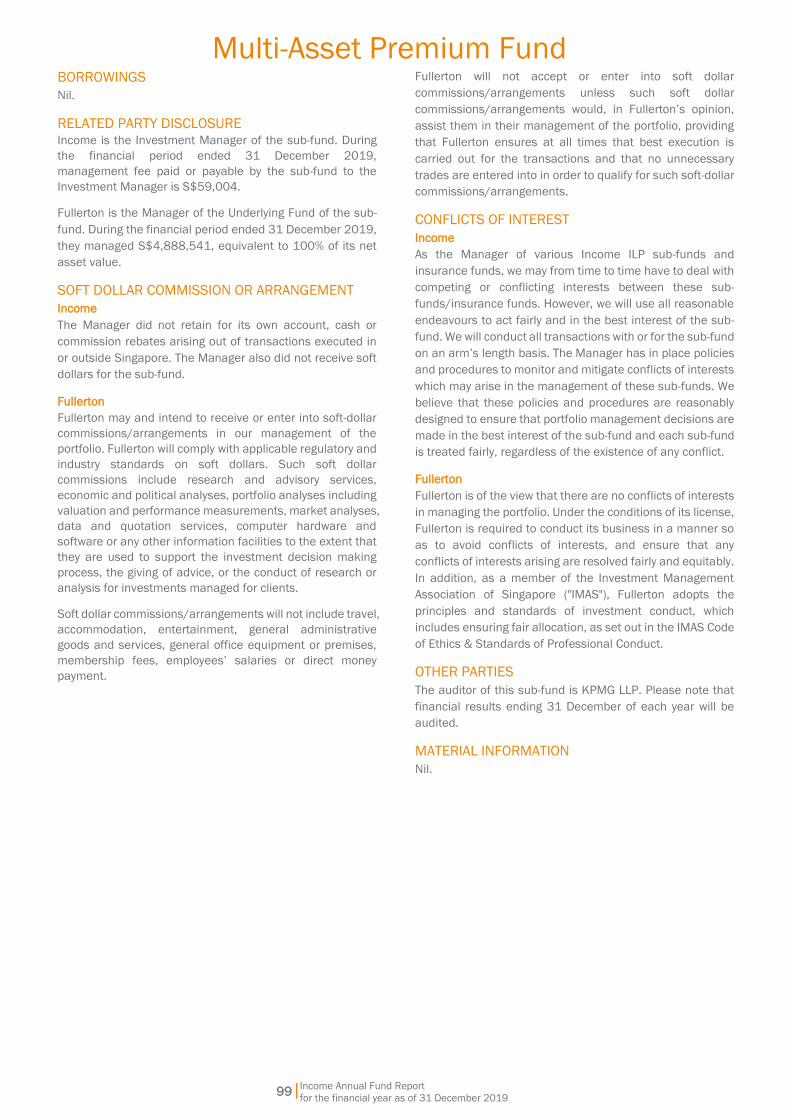
Income Annual Fund Report
for the financial year as of 31 December 2019
99|
Multi-Asset Premium Fund
BORROWINGS
Nil.
RELATED PARTY DISCLOSURE
Income is the Investment Manager of the sub-fund. During
the financial period ended 31 December 2019,
management fee paid or payable by the sub-fund to the
Investment Manager is S$59,004.
Fullerton is the Manager of the Underlying Fund of the sub-
fund. During the financial period ended 31 December 2019,
they managed S$4,888,541, equivalent to 100% of its net
asset value.
SOFT DOLLAR COMMISSION OR ARRANGEMENT
Income
The Manager did not retain for its own account, cash or
commission rebates arising out of transactions executed in
or outside Singapore. The Manager also did not receive soft
dollars for the sub-fund.
Fullerton
Fullerton may and intend to receive or enter into soft-dollar
commissions/arrangements in our management of the
portfolio. Fullerton will comply with applicable regulatory and
industry standards on soft dollars. Such soft dollar
commissions include research and advisory services,
economic and political analyses, portfolio analyses including
valuation and performance measurements, market analyses,
data and quotation services, computer hardware and
software or any other information facilities to the extent that
they are used to support the investment decision making
process, the giving of advice, or the conduct of research or
analysis for investments managed for clients.
Soft dollar commissions/arrangements will not include travel,
accommodation, entertainment, general administrative
goods and services, general office equipment or premises,
membership fees, employees’ salaries or direct money
payment.
Fullerton will not accept or enter into soft dollar
commissions/arrangements unless such soft dollar
commissions/arrangements would, in Fullerton’s opinion,
assist them in their management of the portfolio, providing
that Fullerton ensures at all times that best execution is
carried out for the transactions and that no unnecessary
trades are entered into in order to qualify for such soft-dollar
commissions/arrangements.
CONFLICTS OF INTEREST
Income
As the Manager of various Income ILP sub-funds and
insurance funds, we may from time to time have to deal with
competing or conflicting interests between these sub-
funds/insurance funds. However, we will use all reasonable
endeavours to act fairly and in the best interest of the sub-
fund. We will conduct all transactions with or for the sub-fund
on an arm’s length basis. The Manager has in place policies
and procedures to monitor and mitigate conflicts of interests
which may arise in the management of these sub-funds. We
believe that these policies and procedures are reasonably
designed to ensure that portfolio management decisions are
made in the best interest of the sub-fund and each sub-fund
is treated fairly, regardless of the existence of any conflict.
Fullerton
Fullerton is of the view that there are no conflicts of interests
in managing the portfolio. Under the conditions of its license,
Fullerton is required to conduct its business in a manner so
as to avoid conflicts of interests, and ensure that any
conflicts of interests arising are resolved fairly and equitably.
In addition, as a member of the Investment Management
Association of Singapore ("IMAS"), Fullerton adopts the
principles and standards of investment conduct, which
includes ensuring fair allocation, as set out in the IMAS Code
of Ethics & Standards of Professional Conduct.
OTHER PARTIES
The auditor of this sub-fund is KPMG LLP. Please note that
financial results ending 31 December of each year will be
audited.
MATERIAL INFORMATION
Nil.
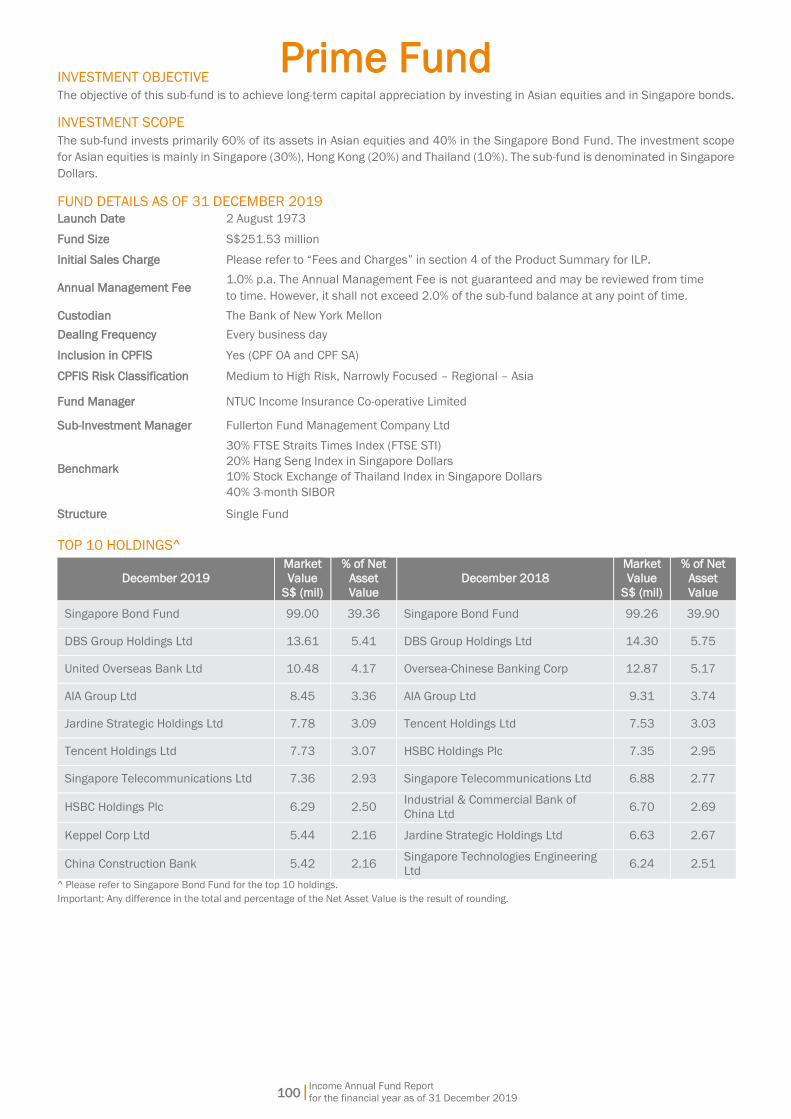
Prime Fund
Income Annual Fund Report
for the financial year as of 31 December 2019
100|
INVESTMENT OBJECTIVE
The objective of this sub-fund is to achieve long-term capital appreciation by investing in Asian equities and in Singapore bonds.
INVESTMENT SCOPE
The sub-fund invests primarily 60% of its assets in Asian equities and 40% in the Singapore Bond Fund. The investment scope
for Asian equities is mainly in Singapore (30%), Hong Kong (20%) and Thailand (10%). The sub-fund is denominated in Singapore
Dollars.
FUND DETAILS AS OF 31 DECEMBER 2019
Launch Date 2 August 1973
Fund Size S$251.53 million
Initial Sales Charge Please refer to “Fees and Charges” in section 4 of the Product Summary for ILP.
Annual Management Fee 1.0% p.a. The Annual Management Fee is not guaranteed and may be reviewed from time
to time. However, it shall not exceed 2.0% of the sub-fund balance at any point of time.
Custodian The Bank of New York Mellon
Dealing Frequency Every business day
Inclusion in CPFIS Yes (CPF OA and CPF SA)
CPFIS Risk Classification Medium to High Risk, Narrowly Focused – Regional – Asia
Fund Manager NTUC Income Insurance Co-operative Limited
Sub-Investment Manager Fullerton Fund Management Company Ltd
Benchmark
30% FTSE Straits Times Index (FTSE STI)
20% Hang Seng Index in Singapore Dollars
10% Stock Exchange of Thailand Index in Singapore Dollars
40% 3-month SIBOR
Structure Single Fund
TOP 10 HOLDINGS^
December 2019
Market
Value
S$ (mil)
% of Net
Asset
Value
December 2018
Market
Value
S$ (mil)
% of Net
Asset
Value
Singapore Bond Fund 99.00 39.36 Singapore Bond Fund 99.26 39.90
DBS Group Holdings Ltd 13.61 5.41 DBS Group Holdings Ltd 14.30 5.75
United Overseas Bank Ltd 10.48 4.17 Oversea-Chinese Banking Corp 12.87 5.17
AIA Group Ltd 8.45 3.36 AIA Group Ltd 9.31 3.74
Jardine Strategic Holdings Ltd 7.78 3.09 Tencent Holdings Ltd 7.53 3.03
Tencent Holdings Ltd 7.73 3.07 HSBC Holdings Plc 7.35 2.95
Singapore Telecommunications Ltd 7.36 2.93 Singapore Telecommunications Ltd 6.88 2.77
HSBC Holdings Plc 6.29 2.50 Industrial & Commercial Bank of
China Ltd 6.70 2.69
Keppel Corp Ltd 5.44 2.16 Jardine Strategic Holdings Ltd 6.63 2.67
China Construction Bank 5.42 2.16 Singapore Technologies Engineering
Ltd 6.24 2.51
^ Please refer to Singapore Bond Fund for the top 10 holdings. Important: Any difference in the total and percentage of the Net Asset Value is the result of rounding.
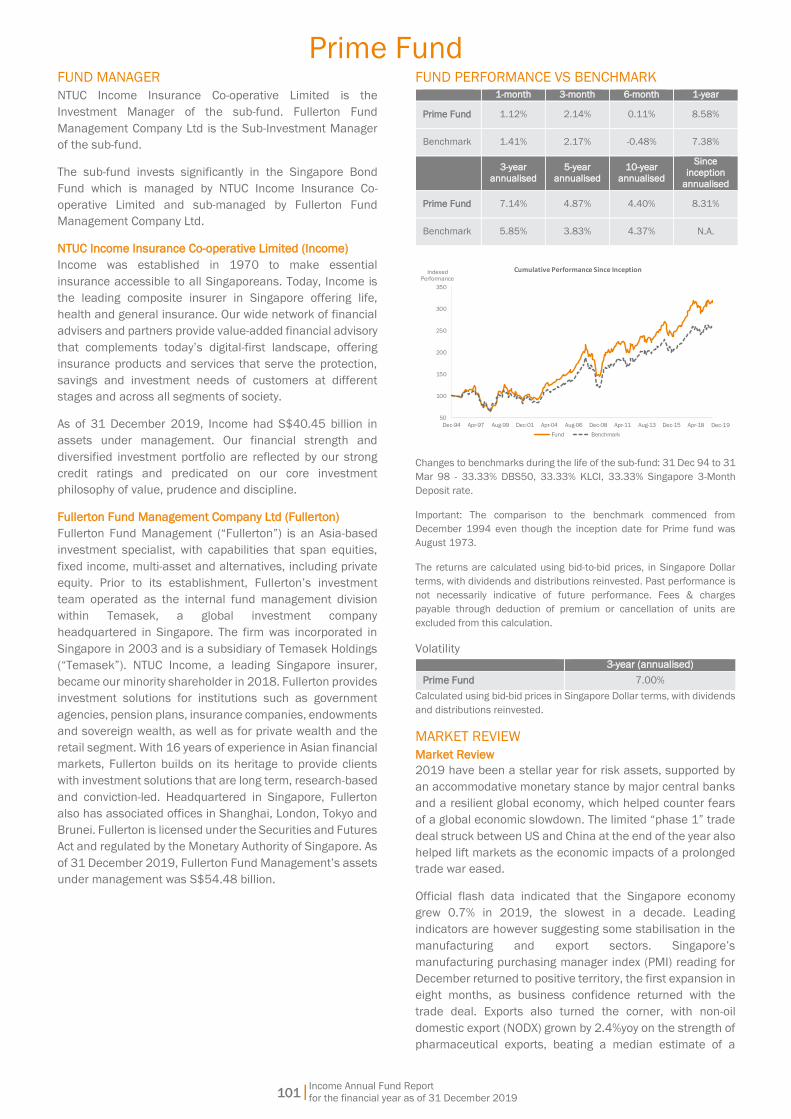
Income Annual Fund Report
for the financial year as of 31 December 2019
101|
Prime Fund
FUND MANAGER
NTUC Income Insurance Co-operative Limited is the
Investment Manager of the sub-fund. Fullerton Fund
Management Company Ltd is the Sub-Investment Manager
of the sub-fund.
The sub-fund invests significantly in the Singapore Bond
Fund which is managed by NTUC Income Insurance Co-
operative Limited and sub-managed by Fullerton Fund
Management Company Ltd.
NTUC Income Insurance Co-operative Limited (Income)
Income was established in 1970 to make essential
insurance accessible to all Singaporeans. Today, Income is
the leading composite insurer in Singapore offering life,
health and general insurance. Our wide network of financial
advisers and partners provide value-added financial advisory
that complements today’s digital-first landscape, offering
insurance products and services that serve the protection,
savings and investment needs of customers at different
stages and across all segments of society.
As of 31 December 2019, Income had S$40.45 billion in
assets under management. Our financial strength and
diversified investment portfolio are reflected by our strong
credit ratings and predicated on our core investment
philosophy of value, prudence and discipline.
Fullerton Fund Management Company Ltd (Fullerton)
Fullerton Fund Management (“Fullerton”) is an Asia-based
investment specialist, with capabilities that span equities,
fixed income, multi-asset and alternatives, including private
equity. Prior to its establishment, Fullerton’s investment
team operated as the internal fund management division
within Temasek, a global investment company
headquartered in Singapore. The firm was incorporated in
Singapore in 2003 and is a subsidiary of Temasek Holdings
(“Temasek”). NTUC Income, a leading Singapore insurer,
became our minority shareholder in 2018. Fullerton provides
investment solutions for institutions such as government
agencies, pension plans, insurance companies, endowments
and sovereign wealth, as well as for private wealth and the
retail segment. With 16 years of experience in Asian financial
markets, Fullerton builds on its heritage to provide clients
with investment solutions that are long term, research-based
and conviction-led. Headquartered in Singapore, Fullerton
also has associated offices in Shanghai, London, Tokyo and
Brunei. Fullerton is licensed under the Securities and Futures
Act and regulated by the Monetary Authority of Singapore. As
of 31 December 2019, Fullerton Fund Management’s assets
under management was S$54.48 billion.
FUND PERFORMANCE VS BENCHMARK
1-month 3-month 6-month 1-year
Prime Fund 1.12% 2.14% 0.11% 8.58%
Benchmark 1.41% 2.17% -0.48% 7.38%
3-year
annualised
5-year
annualised
10-year
annualised
Since
inception
annualised
Prime Fund 7.14% 4.87% 4.40% 8.31%
Benchmark 5.85% 3.83% 4.37% N.A.
50
100
150
200
250
300
350
Dec-94 Apr-97 Aug-99 Dec-01 Apr-04 Aug-06 Dec-08 Apr-11 Aug-13 Dec-15 Apr-18
Cumulative Performance Since Inception
Fund Benchmark
IndexedPerformance
Dec-19
Changes to benchmarks during the life of the sub-fund: 31 Dec 94 to 31
Mar 98 - 33.33% DBS50, 33.33% KLCI, 33.33% Singapore 3-Month
Deposit rate.
Important: The comparison to the benchmark commenced from
December 1994 even though the inception date for Prime fund was
August 1973.
The returns are calculated using bid-to-bid prices, in Singapore Dollar
terms, with dividends and distributions reinvested. Past performance is
not necessarily indicative of future performance. Fees & charges
payable through deduction of premium or cancellation of units are
excluded from this calculation.
Volatility
3-year (annualised)
Prime Fund 7.00%
Calculated using bid-bid prices in Singapore Dollar terms, with dividends
and distributions reinvested.
MARKET REVIEW
Market Review
2019 have been a stellar year for risk assets, supported by
an accommodative monetary stance by major central banks
and a resilient global economy, which helped counter fears
of a global economic slowdown. The limited “phase 1” trade
deal struck between US and China at the end of the year also
helped lift markets as the economic impacts of a prolonged
trade war eased.
Official flash data indicated that the Singapore economy
grew 0.7% in 2019, the slowest in a decade. Leading
indicators are however suggesting some stabilisation in the
manufacturing and export sectors. Singapore’s
manufacturing purchasing manager index (PMI) reading for
December returned to positive territory, the first expansion in
eight months, as business confidence returned with the
trade deal. Exports also turned the corner, with non-oil
domestic export (NODX) grown by 2.4%yoy on the strength of
pharmaceutical exports, beating a median estimate of a

Income Annual Fund Report
for the financial year as of 31 December 2019
102|
Prime Fund
contraction of 1%. Singapore’s core inflation remain
subdued at 1% for the year, lower than the 1.7% reading in
2018.
Up North, Thai manufacturing PMI readings have been weak
throughout the year but returned to positive territory in
December, driven by demand from domestic markets.
Exports fell by 2.7% in 2019 from a year earlier, weighed
down by trade disruptions and a stronger baht. The Bank of
Thailand had cut rate twice in 2019, to a record low of 1.25%.
In Hong Kong, International Monetary Fund (IMF) estimated
that the economy contracted 1.9% in 2019 as a result of
weak global growth and subdued economic activities
attributed to the social unrest that began in summer.
Manufacturing PMI however rose to 42.1 in December from
November’s 38.5, a respite from the severe downturn since
July. Exports fell 1.4%yoy in November, its thirteenth straight
month of decline, on trade tensions and heightened
uncertainties.
Market Outlook Looking ahead, we remain positive on risk assets, and
continue to expect strong outperformance across equity
markets globally. The trade truce, along with relatively strong
data prints pointing to healthy economic growth in 2020,
underpin our positive view. We believe this lays the
foundation for earnings recovery which is key to sustain
gains in equity markets. Indeed, earnings growth seemed to
be nearing a trough with the larger sectors (i.e. IT, Consumer
and Financials) leading the improvement. Additionally, the
policy environment (both monetary and fiscal) is likely to
remain accommodative while investor sentiment is still
neutral at best. As such, we would expect greater
participation and further inflows to support equity markets in
coming months.
Downside risks to our positive view stem from challenges to
our growth view or a sudden resumption of trade tensions.
The latter is unpredictable, but we would be vigilant over
market positioning and sentiment to gauge the extent of
exuberance and thus vulnerability to unforeseen shocks. On
the growth front, we will monitor specific data points for
challenges to our view, in particular, the evolution of the
capex cycle and the continued resilience of the labour
market.
The COVID-19 epidemic originating from China has created
high degree of uncertainty in equity markets. At this stage
virus continues to spread at an alarming rate and economic
impacts are uncertain. While much more globally integrated
societies imply that virus could potentially spread at a faster
rate than previous instances such as SARS, governments in
China as well as around the region are much better prepared
to deal with the fall out of such as outbreak. We are closely
monitoring the developments and will take action to calibrate
our positioning accordingly. As of now exposure to more
vulnerable travel and tourism related sectors is rather limited.
RISKS
Income’s ILP sub-funds are intended for long-term
investment, it is not suited for any short-term speculation.
You should not expect to obtain any short-term gains from
investing in Income’s ILP sub-funds. It is important that your
investment suits your risk appetite. You may wish to consult
your financial adviser before investing in any ILP sub-fund.
You should be aware that past performance is not indicative
of future performance. The value of the units may rise or fall
as the performance of the sub-fund changes.
More information on the risks of the sub-fund can be found
in the Fund Summary and Product Highlights Sheet.
EXPENSE AND TURNOVER RATIO
Prime Fund
Expense ratio Turnover ratio
As of 31
December 2019 1.07% 24.25%
As of 31
December 2018 1.06% 27.19%
Singapore Bond Fund
Expense ratio Turnover ratio
As of 31
December 2019 0.52% 21.30%
As of 31
December 2018 0.52% 32.17%
Expense ratio does not include (where applicable) charges for insurance
coverage, brokerage and other transaction costs, performance fee,
foreign exchange gains or losses, front or back end loads arising from
the purchase or sale of collective investment schemes and tax deducted
at source or arising out of income received.
ASSET ALLOCATION AS OF 31 DECEMBER 2019
Market Value
S$ (mil)
% of Net Asset
Value
Corporate Bonds 43.09 17.14
Government Bonds 55.22 21.95
Equities 149.02 59.24
Cash & Others 4.20 1.67
Total 251.53 100.00
COUNTRY ALLOCATION AS OF 31 DECEMBER 2019
Market Value
S$ (mil)
% of Net Asset
Value
Hong Kong 48.57 19.31
Singapore 174.60 69.41
Thailand 24.16 9.61
Cash & Others 4.20 1.67
Total 251.53 100.00
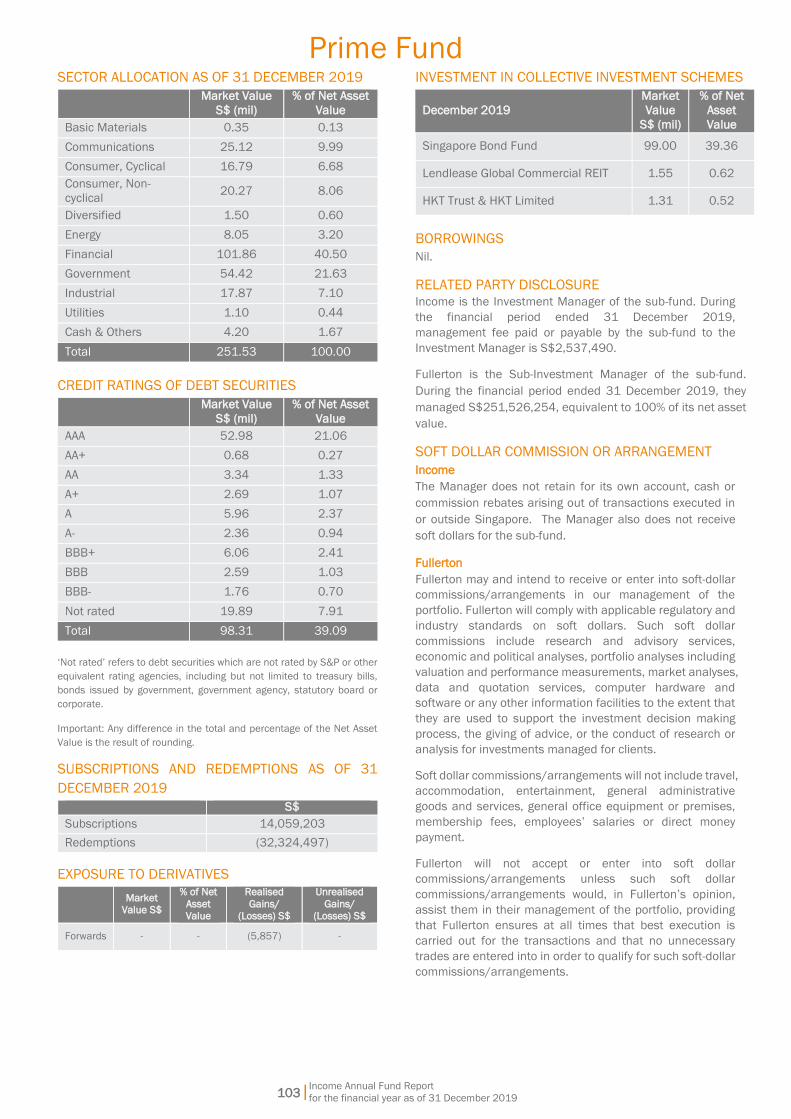
Income Annual Fund Report
for the financial year as of 31 December 2019
103|
Prime Fund
SECTOR ALLOCATION AS OF 31 DECEMBER 2019
Market Value
S$ (mil)
% of Net Asset
Value
Basic Materials 0.35 0.13
Communications 25.12 9.99
Consumer, Cyclical 16.79 6.68
Consumer, Non-
cyclical 20.27 8.06
Diversified 1.50 0.60
Energy 8.05 3.20
Financial 101.86 40.50
Government 54.42 21.63
Industrial 17.87 7.10
Utilities 1.10 0.44
Cash & Others 4.20 1.67
Total 251.53 100.00
CREDIT RATINGS OF DEBT SECURITIES
Market Value
S$ (mil)
% of Net Asset
Value
AAA 52.98 21.06
AA+ 0.68 0.27
AA 3.34 1.33
A+ 2.69 1.07
A 5.96 2.37
A- 2.36 0.94
BBB+ 6.06 2.41
BBB 2.59 1.03
BBB- 1.76 0.70
Not rated 19.89 7.91
Total 98.31 39.09
‘Not rated’ refers to debt securities which are not rated by S&P or other
equivalent rating agencies, including but not limited to treasury bills,
bonds issued by government, government agency, statutory board or
corporate.
Important: Any difference in the total and percentage of the Net Asset
Value is the result of rounding.
SUBSCRIPTIONS AND REDEMPTIONS AS OF 31
DECEMBER 2019
S$
Subscriptions 14,059,203
Redemptions (32,324,497)
EXPOSURE TO DERIVATIVES
Market
Value S$
% of Net
Asset
Value
Realised
Gains/
(Losses) S$
Unrealised
Gains/
(Losses) S$
Forwards - - (5,857) -
INVESTMENT IN COLLECTIVE INVESTMENT SCHEMES
December 2019
Market
Value
S$ (mil)
% of Net
Asset
Value
Singapore Bond Fund 99.00 39.36
Lendlease Global Commercial REIT 1.55 0.62
HKT Trust & HKT Limited 1.31 0.52
BORROWINGS
Nil.
RELATED PARTY DISCLOSURE
Income is the Investment Manager of the sub-fund. During
the financial period ended 31 December 2019,
management fee paid or payable by the sub-fund to the
Investment Manager is S$2,537,490.
Fullerton is the Sub-Investment Manager of the sub-fund.
During the financial period ended 31 December 2019, they
managed S$251,526,254, equivalent to 100% of its net asset
value.
SOFT DOLLAR COMMISSION OR ARRANGEMENT
Income
The Manager does not retain for its own account, cash or
commission rebates arising out of transactions executed in
or outside Singapore. The Manager also does not receive
soft dollars for the sub-fund.
Fullerton
Fullerton may and intend to receive or enter into soft-dollar
commissions/arrangements in our management of the
portfolio. Fullerton will comply with applicable regulatory and
industry standards on soft dollars. Such soft dollar
commissions include research and advisory services,
economic and political analyses, portfolio analyses including
valuation and performance measurements, market analyses,
data and quotation services, computer hardware and
software or any other information facilities to the extent that
they are used to support the investment decision making
process, the giving of advice, or the conduct of research or
analysis for investments managed for clients.
Soft dollar commissions/arrangements will not include travel,
accommodation, entertainment, general administrative
goods and services, general office equipment or premises,
membership fees, employees’ salaries or direct money
payment.
Fullerton will not accept or enter into soft dollar
commissions/arrangements unless such soft dollar
commissions/arrangements would, in Fullerton’s opinion,
assist them in their management of the portfolio, providing
that Fullerton ensures at all times that best execution is
carried out for the transactions and that no unnecessary
trades are entered into in order to qualify for such soft-dollar
commissions/arrangements.

Income Annual Fund Report
for the financial year as of 31 December 2019
104|
Prime Fund
CONFLICTS OF INTEREST
Income
As the Manager of various Income ILP sub-funds and
insurance funds, we may from time to time have to deal with
competing or conflicting interests between these sub-
funds/insurance funds. However, we will use all reasonable
endeavours to act fairly and in the best interest of the sub-
fund. We will conduct all transactions with or for the sub-fund
on an arm’s length basis. The Manager has in place policies
and procedures to monitor and mitigate conflicts of interests
which may arise in the management of these sub-funds. We
believe that these policies and procedures are reasonably
designed to ensure that portfolio management decisions are
made in the best interest of the sub-fund and each sub-fund
is treated fairly, regardless of the existence of any conflict.
Fullerton
Fullerton is of the view that there are no conflicts of interests
in managing the portfolio. Under the conditions of its license,
Fullerton is required to conduct its business in a manner so
as to avoid conflicts of interests, and ensure that any
conflicts of interests arising are resolved fairly and equitably.
In addition, as a member of the Investment Management
Association of Singapore ("IMAS"), Fullerton adopts the
principles and standards of investment conduct, which
includes ensuring fair allocation, as set out in the IMAS Code
of Ethics & Standards of Professional Conduct.
OTHER PARTIES
The auditor of this sub-fund is KPMG LLP. Please note that
financial results ending 31 December of each year will be
audited.
MATERIAL INFORMATION
Nil.
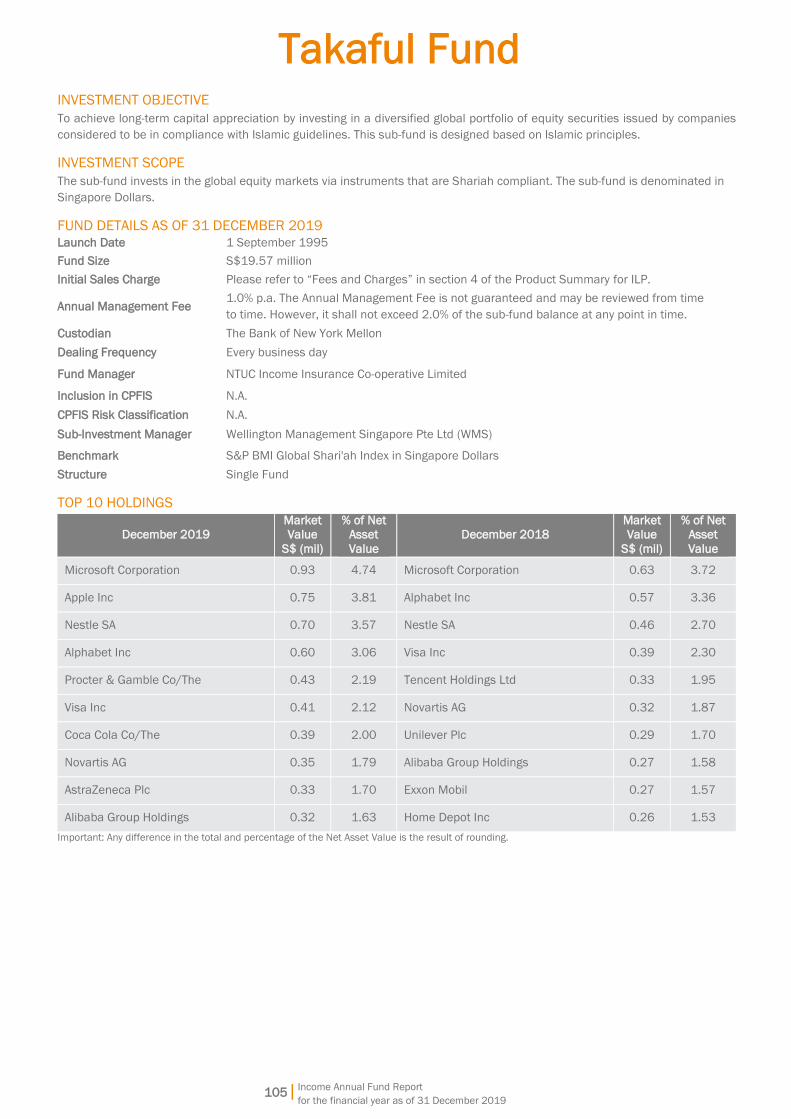
Income Annual Fund Report
for the financial year as of 31 December 2019 105|
Takaful Fund
INVESTMENT OBJECTIVE
To achieve long-term capital appreciation by investing in a diversified global portfolio of equity securities issued by companies
considered to be in compliance with Islamic guidelines. This sub-fund is designed based on Islamic principles.
INVESTMENT SCOPE
The sub-fund invests in the global equity markets via instruments that are Shariah compliant. The sub-fund is denominated in
Singapore Dollars.
FUND DETAILS AS OF 31 DECEMBER 2019 Launch Date 1 September 1995
Fund Size S$19.57 million
Initial Sales Charge Please refer to “Fees and Charges” in section 4 of the Product Summary for ILP.
Annual Management Fee 1.0% p.a. The Annual Management Fee is not guaranteed and may be reviewed from time
to time. However, it shall not exceed 2.0% of the sub-fund balance at any point in time.
Custodian The Bank of New York Mellon
Dealing Frequency Every business day
Fund Manager NTUC Income Insurance Co-operative Limited
Inclusion in CPFIS N.A.
CPFIS Risk Classification N.A.
Sub-Investment Manager Wellington Management Singapore Pte Ltd (WMS)
Benchmark S&P BMI Global Shari'ah Index in Singapore Dollars
Structure Single Fund
TOP 10 HOLDINGS
December 2019
Market
Value
S$ (mil)
% of Net
Asset
Value
December 2018
Market
Value
S$ (mil)
% of Net
Asset
Value
Microsoft Corporation 0.93 4.74 Microsoft Corporation 0.63 3.72
Apple Inc 0.75 3.81 Alphabet Inc 0.57 3.36
Nestle SA 0.70 3.57 Nestle SA 0.46 2.70
Alphabet Inc 0.60 3.06 Visa Inc 0.39 2.30
Procter & Gamble Co/The 0.43 2.19 Tencent Holdings Ltd 0.33 1.95
Visa Inc 0.41 2.12 Novartis AG 0.32 1.87
Coca Cola Co/The 0.39 2.00 Unilever Plc 0.29 1.70
Novartis AG 0.35 1.79 Alibaba Group Holdings 0.27 1.58
AstraZeneca Plc 0.33 1.70 Exxon Mobil 0.27 1.57
Alibaba Group Holdings 0.32 1.63 Home Depot Inc 0.26 1.53
Important: Any difference in the total and percentage of the Net Asset Value is the result of rounding.

Takaful Fund
106| Income Annual Fund Report
for the financial year as of 31 December 2019
FUND MANAGER
NTUC Income Insurance Co-operative Limited is the
Investment Manager of the sub-fund. Wellington
Management Singapore Pte Ltd is the Sub-Investment
Manager of the sub-fund.
NTUC Income Insurance Co-operative Limited (Income) Income was established in 1970 to make essential
insurance accessible to all Singaporeans. Today, Income is
the leading composite insurer in Singapore offering life,
health and general insurance. Our wide network of financial
advisers and partners provide value-added financial
advisory that complements today’s digital-first landscape,
offering insurance products and services that serve the
protection, savings and investment needs of customers at
different stages and across all segments of society.
As of 31 December 2019, Income had S$40.45 billion in
assets under management. Our financial strength and
diversified investment portfolio are reflected by our strong
credit ratings and predicated on our core investment
philosophy of value, prudence and discipline.
Wellington Management Singapore Pte Ltd (WMS)*
WMS is an affiliate of Wellington Management Company
LLP (WMS, Wellington Management Company LLP and the
other affiliates of Wellington Management Company LLP are
collectively referred to as WMC). With US$1.1 trillion in
assets under management, WMC serves as an investment
adviser to over 2,200 clients located in more than 60
countries, as of 31 December 2019. WMC’s singular focus
is investments — from global equities and fixed income to
currencies and commodities. WMC describes themselves as
a community of teams that create solutions designed to
respond to specific client needs. WMC’s most distinctive
strength is their proprietary, independent research, which is
shared across all areas of the organisation and used only
for managing clients' portfolios. Tracing its roots to the
founding of Wellington Fund in 1928, the firm has offices in
Boston, Massachusetts; Chicago, Illinois; Radnor,
Pennsylvania; San Francisco, California; Toronto, Canada;
Beijing; Frankfurt; Hong Kong; London; Singapore; Sydney;
Tokyo; Luxembourg and Zurich.
*With effect from 29 April 2016, WMS has replaced Trust Company of
the West (TCW) Asset Management Company as the Sub-Investment
Manager of the Global Technology Fund.
FUND PERFORMANCE VS BENCHMARK
1-month 3-month 6-month 1-year
Takaful
Fund 1.67% 6.84% 10.11% 31.13%
Benchmark 1.92% 7.09% 10.11% 29.44%
3-year
annualised
5-year
annualised
10-year
annualised
Since
inception
annualised
Takaful
Fund 13.13% 11.22% 10.80% 3.22%
Benchmark 13.31% 11.12% 10.42% 4.47%
30
80
130
180
230
280
330
Sep-95 Jan-98 May-00 Sep-02 Jan-05 May-07 Sep-09 Jan-12 May-14 Sep-16 Jan-19
Cumulative Performance Since Inception
Fund Benchmark
IndexedPerformance
Dec-19
Changes to benchmarks during the life of the sub-fund: Since 1 Jul
2010 to 16 Dec 2010 - 60% S&P Global BMI Shari’ah Index, 20% FTSE
STI, 16% HSI,4% SET; Since Oct 2002 to Jun 2010 - 60% DJ Islamic
Index, 20% FTSE STI, 16% HSI, 4% SET; Since Jun 2001 to Sep 2002 -
60% MSCI World, 20% FTSE STI, 16% HSI, 4% SET; Since Apr 1998 to
May 2001 - 50% FTSE STI, 40% HSI, 10% SET; Since Apr 1997 to Mar
1998 - 50% FTSE STI, 50% KLCI; Since inception to Mar 1997 - 33.33%
DBS 50, 33.33% KLCI, 33.33% Singapore 3-Month Deposit rate.
The returns are calculated using bid-to-bid prices, in Singapore Dollar
terms, with dividends and distributions reinvested. Past performance is
not necessarily indicative of future performance. Fees & charges
payable through deduction of premium or cancellation of units are
excluded from this calculations.
Note to our Policyholders on Revision of Benchmark Return:
Effective from 1 April 2011, dividend reinvested has been included in
the returns of the benchmark to achieve a better comparison of the
sub-fund’s performance against its benchmark. The historical
benchmark returns for the period from 1 July 2010 to 31 March 2011
have therefore been revised.
Volatility
3-year (annualised)
Takaful Fund 11.26%
Calculated using bid-bid prices in Singapore Dollar terms, with
dividends and distributions reinvested.
MARKET REVIEW
Market Review For the twelve-month period ended December 31 2019,
global equities rose more than 26.9% as measured by the
MSCI ACWI Index. In the first quarter of 2019, global
markets recovered and surged due to productive trade
negotiations between the US and China, and by dovish
rhetoric and policy actions from the major central banks.
Brexit remained a key area of concern with the British
parliament rejecting Prime Minister Theresa May’s deal for
the third time.
In the second quarter of 2019, global equities rose for the
second straight quarter. Trade tensions between China and
the US escalated in May but eased at the end of the quarter
after the two countries agreed at the G20 summit to resume
trade negotiations. Brexit was a major concern, with the UK
avoiding an abrupt no-deal departure after the European
Union (EU) leaders granted the UK a flexible extension until
October 31. UK Prime Minister Theresa May announced that
she would resign on June 7 after failing to secure a Brexit
deal.
In the third quarter of 2019, Boris Johnson was appointed
as the new Prime Minister of the UK after his victory in the
Conservative Party leadership contest. UK opposition
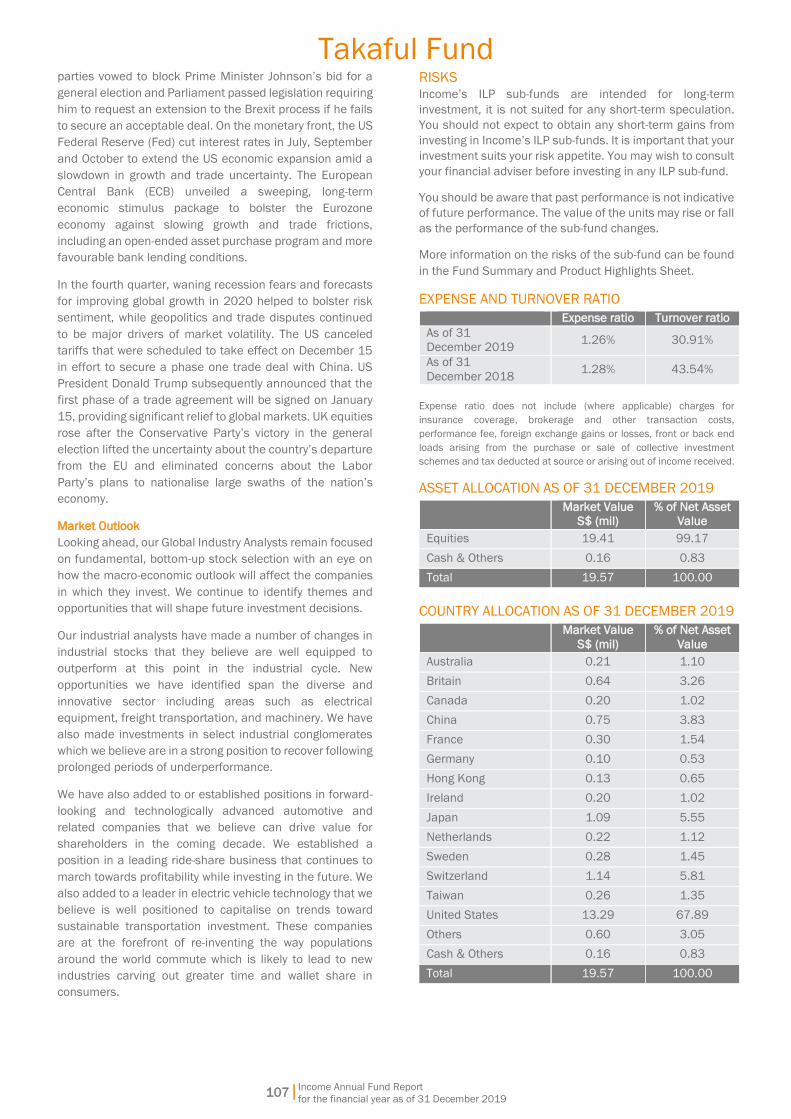
Takaful Fund
107| Income Annual Fund Report
for the financial year as of 31 December 2019
parties vowed to block Prime Minister Johnson’s bid for a
general election and Parliament passed legislation requiring
him to request an extension to the Brexit process if he fails
to secure an acceptable deal. On the monetary front, the US
Federal Reserve (Fed) cut interest rates in July, September
and October to extend the US economic expansion amid a
slowdown in growth and trade uncertainty. The European
Central Bank (ECB) unveiled a sweeping, long-term
economic stimulus package to bolster the Eurozone
economy against slowing growth and trade frictions,
including an open-ended asset purchase program and more
favourable bank lending conditions.
In the fourth quarter, waning recession fears and forecasts
for improving global growth in 2020 helped to bolster risk
sentiment, while geopolitics and trade disputes continued
to be major drivers of market volatility. The US canceled
tariffs that were scheduled to take effect on December 15
in effort to secure a phase one trade deal with China. US
President Donald Trump subsequently announced that the
first phase of a trade agreement will be signed on January
15, providing significant relief to global markets. UK equities
rose after the Conservative Party’s victory in the general
election lifted the uncertainty about the country’s departure
from the EU and eliminated concerns about the Labor
Party’s plans to nationalise large swaths of the nation’s
economy.
Market Outlook Looking ahead, our Global Industry Analysts remain focused
on fundamental, bottom-up stock selection with an eye on
how the macro-economic outlook will affect the companies
in which they invest. We continue to identify themes and
opportunities that will shape future investment decisions.
Our industrial analysts have made a number of changes in
industrial stocks that they believe are well equipped to
outperform at this point in the industrial cycle. New
opportunities we have identified span the diverse and
innovative sector including areas such as electrical
equipment, freight transportation, and machinery. We have
also made investments in select industrial conglomerates
which we believe are in a strong position to recover following
prolonged periods of underperformance.
We have also added to or established positions in forward-
looking and technologically advanced automotive and
related companies that we believe can drive value for
shareholders in the coming decade. We established a
position in a leading ride-share business that continues to
march towards profitability while investing in the future. We
also added to a leader in electric vehicle technology that we
believe is well positioned to capitalise on trends toward
sustainable transportation investment. These companies
are at the forefront of re-inventing the way populations
around the world commute which is likely to lead to new
industries carving out greater time and wallet share in
consumers.
RISKS
Income’s ILP sub-funds are intended for long-term
investment, it is not suited for any short-term speculation.
You should not expect to obtain any short-term gains from
investing in Income’s ILP sub-funds. It is important that your
investment suits your risk appetite. You may wish to consult
your financial adviser before investing in any ILP sub-fund.
You should be aware that past performance is not indicative
of future performance. The value of the units may rise or fall
as the performance of the sub-fund changes.
More information on the risks of the sub-fund can be found
in the Fund Summary and Product Highlights Sheet.
EXPENSE AND TURNOVER RATIO
Expense ratio Turnover ratio
As of 31
December 2019 1.26% 30.91%
As of 31
December 2018 1.28% 43.54%
Expense ratio does not include (where applicable) charges for
insurance coverage, brokerage and other transaction costs,
performance fee, foreign exchange gains or losses, front or back end
loads arising from the purchase or sale of collective investment
schemes and tax deducted at source or arising out of income received.
ASSET ALLOCATION AS OF 31 DECEMBER 2019
Market Value
S$ (mil)
% of Net Asset
Value
Equities 19.41 99.17
Cash & Others 0.16 0.83
Total 19.57 100.00
COUNTRY ALLOCATION AS OF 31 DECEMBER 2019
Market Value
S$ (mil)
% of Net Asset
Value
Australia 0.21 1.10
Britain 0.64 3.26
Canada 0.20 1.02
China 0.75 3.83
France 0.30 1.54
Germany 0.10 0.53
Hong Kong 0.13 0.65
Ireland 0.20 1.02
Japan 1.09 5.55
Netherlands 0.22 1.12
Sweden 0.28 1.45
Switzerland 1.14 5.81
Taiwan 0.26 1.35
United States 13.29 67.89
Others 0.60 3.05
Cash & Others 0.16 0.83
Total 19.57 100.00
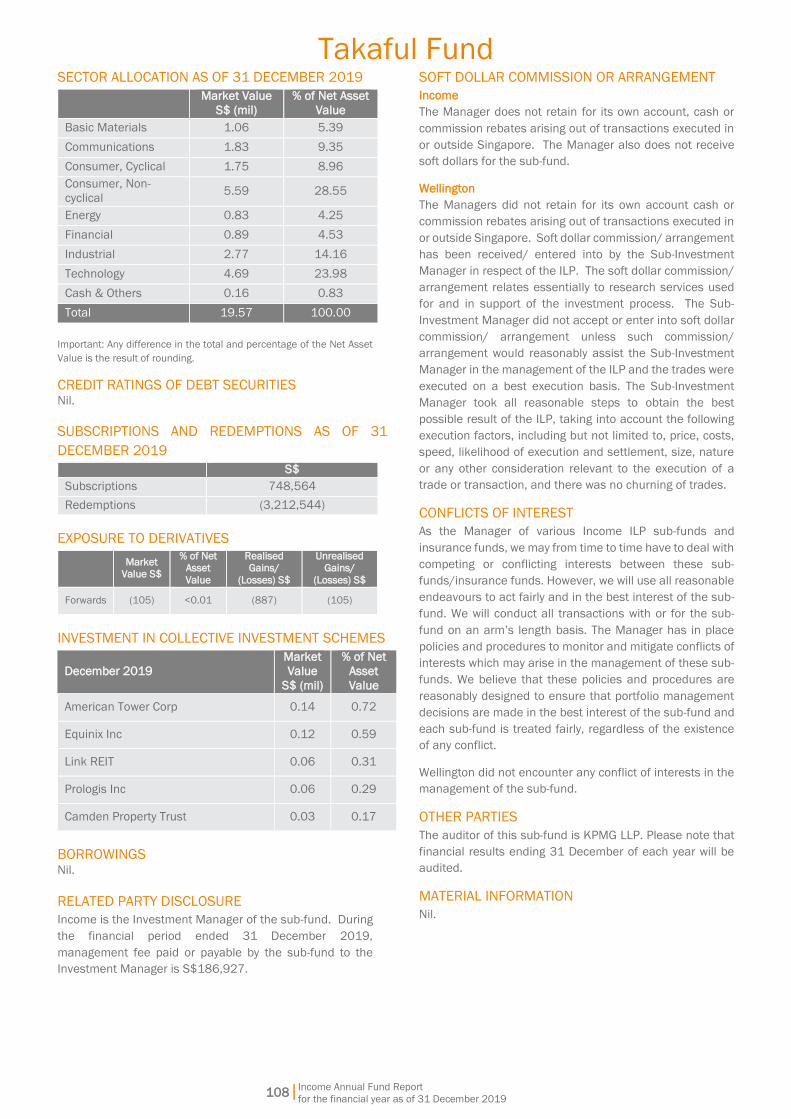
Takaful Fund
108| Income Annual Fund Report
for the financial year as of 31 December 2019
SECTOR ALLOCATION AS OF 31 DECEMBER 2019
Market Value
S$ (mil)
% of Net Asset
Value
Basic Materials 1.06 5.39
Communications 1.83 9.35
Consumer, Cyclical 1.75 8.96
Consumer, Non-
cyclical 5.59 28.55
Energy 0.83 4.25
Financial 0.89 4.53
Industrial 2.77 14.16
Technology 4.69 23.98
Cash & Others 0.16 0.83
Total 19.57 100.00
Important: Any difference in the total and percentage of the Net Asset
Value is the result of rounding.
CREDIT RATINGS OF DEBT SECURITIES Nil.
SUBSCRIPTIONS AND REDEMPTIONS AS OF 31
DECEMBER 2019
S$
Subscriptions 748,564
Redemptions (3,212,544)
EXPOSURE TO DERIVATIVES
Market
Value S$
% of Net
Asset
Value
Realised
Gains/
(Losses) S$
Unrealised
Gains/
(Losses) S$
Forwards (105) <0.01 (887) (105)
INVESTMENT IN COLLECTIVE INVESTMENT SCHEMES
December 2019
Market
Value
S$ (mil)
% of Net
Asset
Value
American Tower Corp 0.14 0.72
Equinix Inc 0.12 0.59
Link REIT 0.06 0.31
Prologis Inc 0.06 0.29
Camden Property Trust 0.03 0.17
BORROWINGS Nil.
RELATED PARTY DISCLOSURE
Income is the Investment Manager of the sub-fund. During
the financial period ended 31 December 2019,
management fee paid or payable by the sub-fund to the
Investment Manager is S$186,927.
SOFT DOLLAR COMMISSION OR ARRANGEMENT
Income
The Manager does not retain for its own account, cash or
commission rebates arising out of transactions executed in
or outside Singapore. The Manager also does not receive
soft dollars for the sub-fund.
Wellington
The Managers did not retain for its own account cash or
commission rebates arising out of transactions executed in
or outside Singapore. Soft dollar commission/ arrangement
has been received/ entered into by the Sub-Investment
Manager in respect of the ILP. The soft dollar commission/
arrangement relates essentially to research services used
for and in support of the investment process. The Sub-
Investment Manager did not accept or enter into soft dollar
commission/ arrangement unless such commission/
arrangement would reasonably assist the Sub-Investment
Manager in the management of the ILP and the trades were
executed on a best execution basis. The Sub-Investment
Manager took all reasonable steps to obtain the best
possible result of the ILP, taking into account the following
execution factors, including but not limited to, price, costs,
speed, likelihood of execution and settlement, size, nature
or any other consideration relevant to the execution of a
trade or transaction, and there was no churning of trades.
CONFLICTS OF INTEREST
As the Manager of various Income ILP sub-funds and
insurance funds, we may from time to time have to deal with
competing or conflicting interests between these sub-
funds/insurance funds. However, we will use all reasonable
endeavours to act fairly and in the best interest of the sub-
fund. We will conduct all transactions with or for the sub-
fund on an arm’s length basis. The Manager has in place
policies and procedures to monitor and mitigate conflicts of
interests which may arise in the management of these sub-
funds. We believe that these policies and procedures are
reasonably designed to ensure that portfolio management
decisions are made in the best interest of the sub-fund and
each sub-fund is treated fairly, regardless of the existence
of any conflict.
Wellington did not encounter any conflict of interests in the
management of the sub-fund.
OTHER PARTIES
The auditor of this sub-fund is KPMG LLP. Please note that
financial results ending 31 December of each year will be
audited.
MATERIAL INFORMATION
Nil.
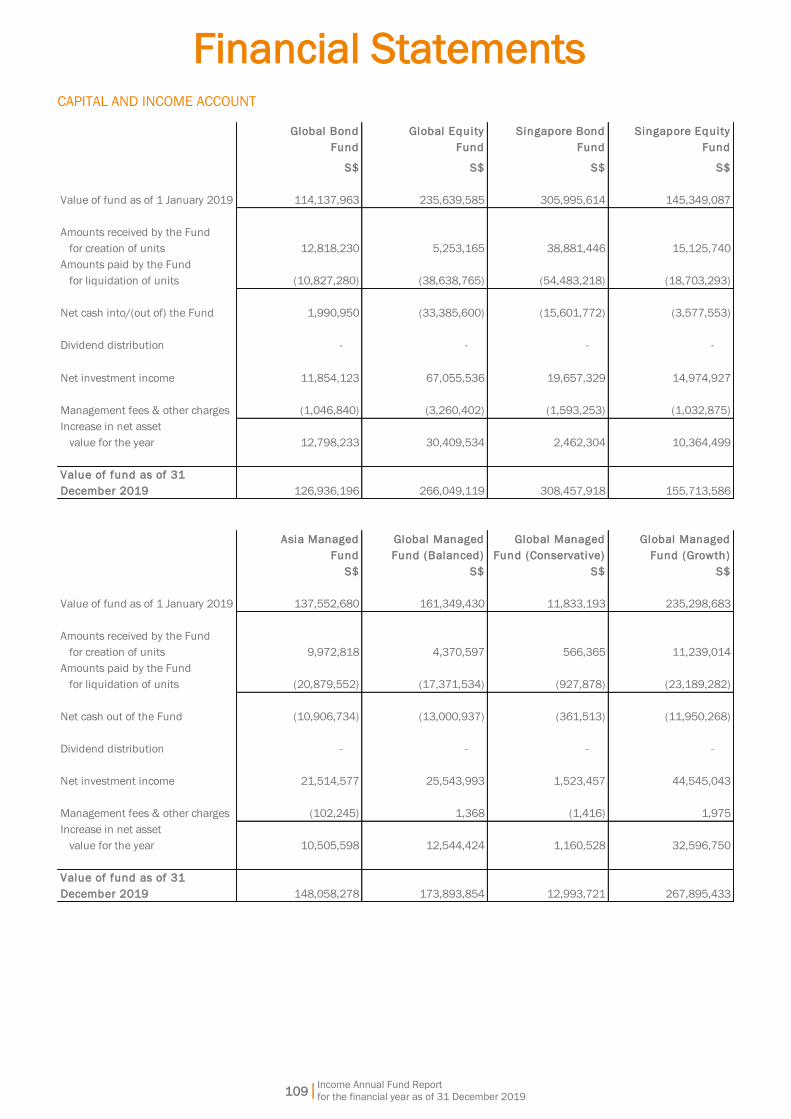
Financial Statements
109|
Income Annual Fund Report
for the financial year as of 31 December 2019
CAPITAL AND INCOME ACCOUNT
Global Bond
Fund
Global Equity
Fund
Singapore Bond
Fund
Singapore Equity
Fund
S$ S$ S$ S$
Value of fund as of 1 January 2019 114,137,963 235,639,585 305,995,614 145,349,087
Amounts received by the Fund
for creation of units
Amounts paid by the Fund
for liquidation of units
Net cash into/(out of) the Fund 1,990,950 (33,385,600) (15,601,772) (3,577,553)
Dividend distribution - - - -
Net investment income 11,854,123 67,055,536 19,657,329 14,974,927
Management fees & other charges (1,046,840) (3,260,402) (1,593,253) (1,032,875)
Increase in net asset
value for the year
Value of fund as of 31
December 2019 126,936,196 266,049,119 308,457,918 155,713,586
Asia Managed
Fund
Global Managed
Fund (Balanced)
Global Managed
Fund (Conservative)
Global Managed
Fund (Growth)
S$ S$ S$ S$
Value of fund as of 1 January 2019 137,552,680 161,349,430 11,833,193 235,298,683
Amounts received by the Fund
for creation of units
Amounts paid by the Fund
for liquidation of units
Net cash out of the Fund (10,906,734) (13,000,937) (361,513) (11,950,268)
Dividend distribution - - - -
Net investment income 21,514,577 25,543,993 1,523,457 44,545,043
Management fees & other charges (102,245) 1,368 (1,416) 1,975
Increase in net asset
value for the year
Value of fund as of 31
December 2019 148,058,278 173,893,854 12,993,721 267,895,433
10,505,598 12,544,424 1,160,528 32,596,750
9,972,818 4,370,597 566,365 11,239,014
(20,879,552) (17,371,534) (927,878) (23,189,282)
12,798,233 30,409,534 2,462,304 10,364,499
12,818,230 5,253,165 38,881,446 15,125,740
(10,827,280) (38,638,765) (54,483,218) (18,703,293)

Financial Statements
110|
Income Annual Fund Report
for the financial year as of 31 December 2019
CAPITAL AND INCOME ACCOUNT
Singapore Managed
Fund
Aim Now Fund Aim 2025 Fund Aim 2035 Fund
S$ S$ S$ S$
Value of fund as of 1 January 2019 83,236,255 69,061,881 17,378,324 21,532,227
Amounts received by the Fund
for creation of units
Amounts paid by the Fund
for liquidation of units
Net cash out of the Fund (5,211,381) (5,461,498) (449,173) (537,410)
Dividend distribution - (1,733,284) - -
Net investment income 7,710,579 6,118,843 2,318,843 3,687,007
Management fees & other charges (692,254) (408,507) (160,714) (214,510)
Increase/(decrease) in net asset
value for the year
Value of fund as of 31
December 2019 85,043,199 67,577,435 19,087,280 24,467,314
Aim 2045 Fund Money Market
Fund
Asian Bond
Fund
Asian Income
Fund
S$ S$ S$ S$
Value of fund as of 1 January 2019 27,098,547 13,575,561 31,406,103 702,700,574
Amounts received by the Fund
for creation of units
Amounts paid by the Fund
for liquidation of units
Net cash into/(out of) the Fund 220,593 (1,564,575) 25,194,164 165,557,534
Dividend distribution - - (2,144,109) (41,949,796)
Net investment income 5,036,221 295,751 3,613,411 76,877,610
Management fees & other charges (279,248) (35,347) (4,410) (103,993)
Increase/(decrease) in net asset
value for the year
Value of fund as of 31
December 2019 32,076,113 12,271,390 58,065,159 903,081,929
4,977,566 (1,304,171) 26,659,056 200,381,355
4,498,170 11,945,164 69,387,112 263,391,433
(4,277,577) (13,509,739) (44,192,948) (97,833,899)
(9,804,283) (36,878,988) (4,614,453) (2,230,485)
1,806,944 (1,484,446) 1,708,956 2,935,087
4,592,902 31,417,490 4,165,280 1,693,075
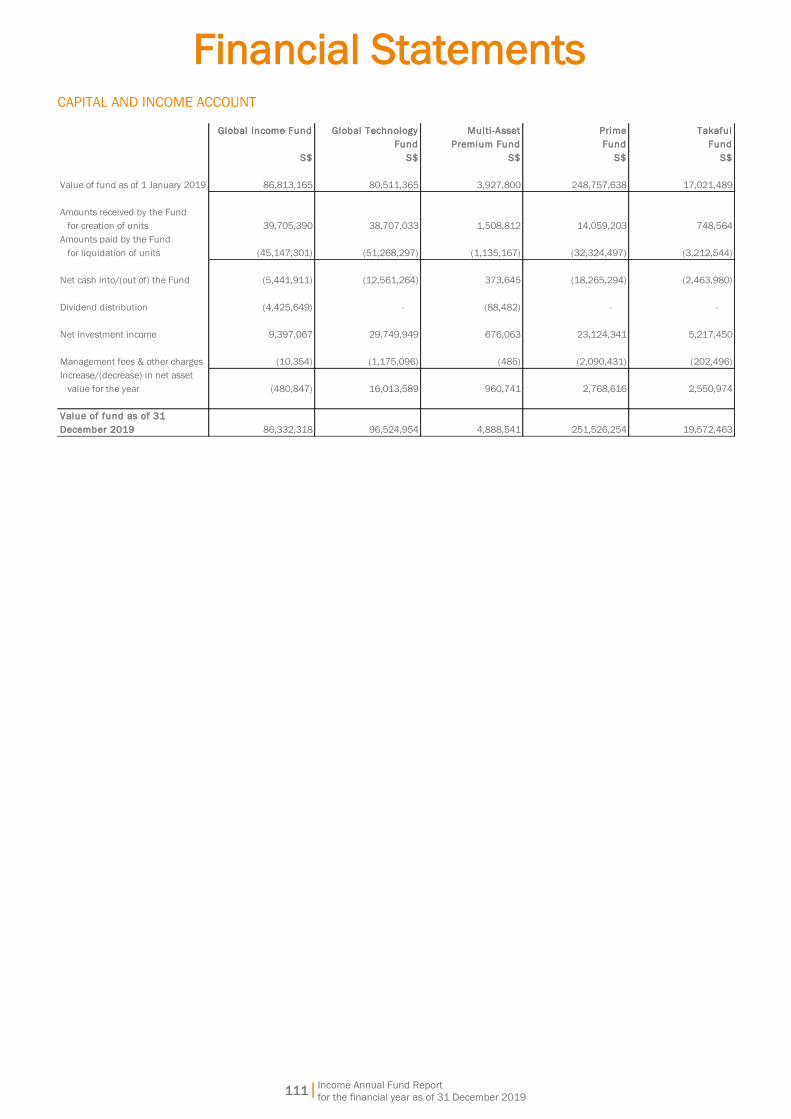
Financial Statements
111|
Income Annual Fund Report
for the financial year as of 31 December 2019
CAPITAL AND INCOME ACCOUNT
Global Income Fund Global Technology
Fund
Multi -Asset
Premium Fund
Prime
Fund
Takaful
Fund
S$ S$ S$ S$ S$
Value of fund as of 1 January 2019 86,813,165 80,511,365 3,927,800 248,757,638 17,021,489
Amounts received by the Fund
for creation of units
Amounts paid by the Fund
for liquidation of units
Net cash into/(out of) the Fund (5,441,911) (12,561,264) 373,645 (18,265,294) (2,463,980)
Dividend distribution (4,425,649) - (88,482) - -
Net investment income 9,397,067 29,749,949 676,063 23,124,341 5,217,450
Management fees & other charges (10,354) (1,175,096) (485) (2,090,431) (202,496)
Increase/(decrease) in net asset
value for the year
Value of fund as of 31
December 2019 86,332,318 96,524,954 4,888,541 251,526,254 19,572,463
(480,847) 16,013,589 960,741 2,768,616 2,550,974
748,564
(45,147,301) (51,268,297) (1,135,167) (32,324,497) (3,212,544)
39,705,390 38,707,033 1,508,812 14,059,203
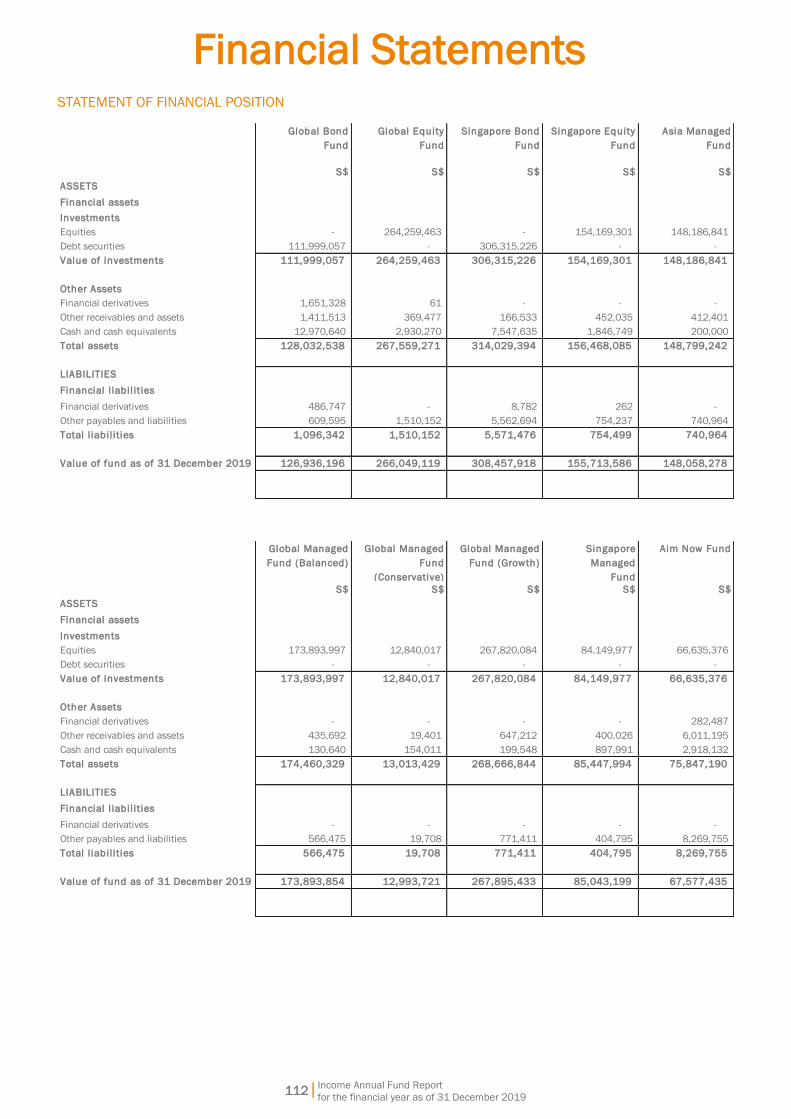
Financial Statements
112|
Income Annual Fund Report
for the financial year as of 31 December 2019
STATEMENT OF FINANCIAL POSITION
Global Bond
Fund
Global Equity
Fund
Singapore Bond
Fund
Singapore Equity
Fund
Asia Managed
Fund
S$ S$ S$ S$ S$
ASSETS
Financial assets
Investments
Equities - 264,259,463 - 154,169,301 148,186,841
Debt securities 111,999,057 - 306,315,226 - -
Value of investments 111,999,057 264,259,463 306,315,226 154,169,301 148,186,841
Other Assets
Financial derivatives 1,651,328 61 - - -
Other receivables and assets 1,411,513 369,477 166,533 452,035 412,401
Cash and cash equivalents 12,970,640 2,930,270 7,547,635 1,846,749 200,000
Total assets 128,032,538 267,559,271 314,029,394 156,468,085 148,799,242
LIABILITIES
Financial l iabil ities
Financial derivatives 486,747 - 8,782 262 -
Other payables and liabilities 609,595 1,510,152 5,562,694 754,237 740,964
Total l iabil ities 1,096,342 1,510,152 5,571,476 754,499 740,964
Value of fund as of 31 December 2019 126,936,196 266,049,119 308,457,918 155,713,586 148,058,278
Global Managed
Fund (Balanced)
Global Managed
Fund
(Conservative)
Global Managed
Fund (Growth)
Singapore
Managed
Fund
Aim Now Fund
S$ S$ S$ S$ S$
ASSETS
Financial assets
Investments
Equities 173,893,997 12,840,017 267,820,084 84,149,977 66,635,376
Debt securities - - - - -
Value of investments 173,893,997 12,840,017 267,820,084 84,149,977 66,635,376
Other Assets
Financial derivatives - - - - 282,487
Other receivables and assets 435,692 19,401 647,212 400,026 6,011,195
Cash and cash equivalents 130,640 154,011 199,548 897,991 2,918,132
Total assets 174,460,329 13,013,429 268,666,844 85,447,994 75,847,190
LIABILITIES
Financial l iabil ities
Financial derivatives - - - - -
Other payables and liabilities 566,475 19,708 771,411 404,795 8,269,755
Total l iabil ities 566,475 19,708 771,411 404,795 8,269,755
Value of fund as of 31 December 2019 173,893,854 12,993,721 267,895,433 85,043,199 67,577,435
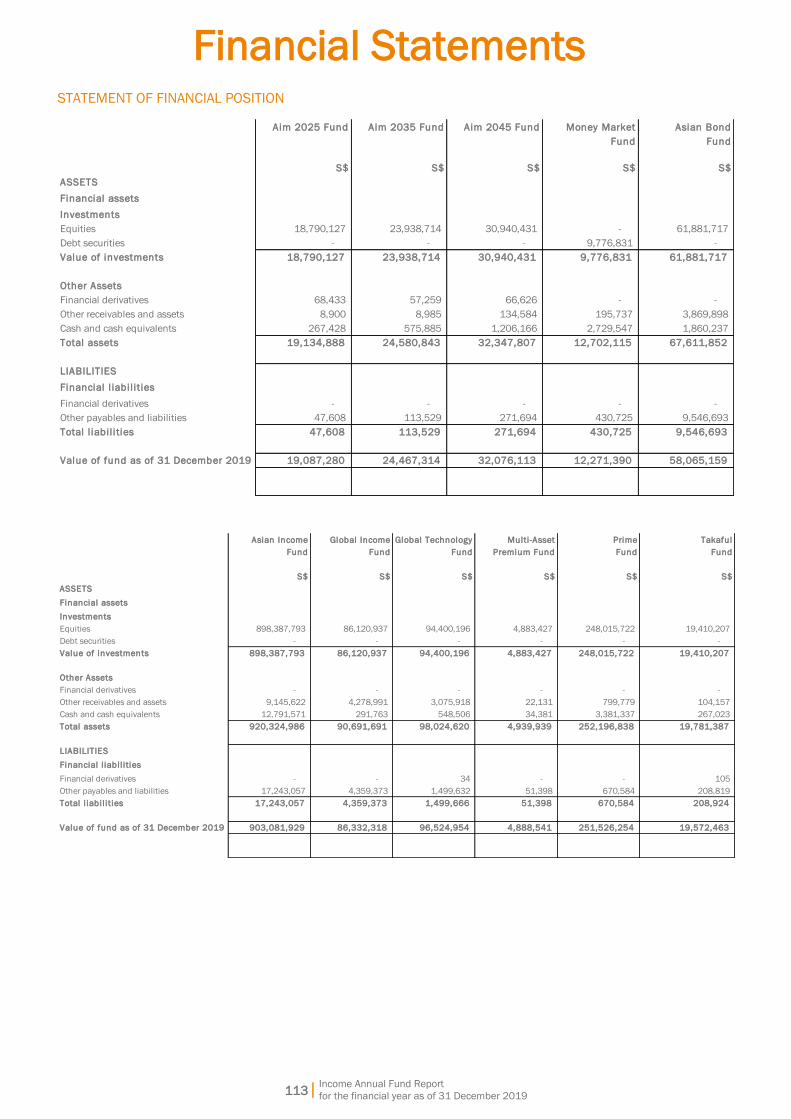
Financial Statements
113|
Income Annual Fund Report
for the financial year as of 31 December 2019
STATEMENT OF FINANCIAL POSITION
Aim 2025 Fund Aim 2035 Fund Aim 2045 Fund Money Market
Fund
Asian Bond
Fund
S$ S$ S$ S$ S$
ASSETS
Financial assets
Investments
Equities 18,790,127 23,938,714 30,940,431 - 61,881,717
Debt securities - - - 9,776,831 -
Value of investments 18,790,127 23,938,714 30,940,431 9,776,831 61,881,717
Other Assets
Financial derivatives 68,433 57,259 66,626 - -
Other receivables and assets 8,900 8,985 134,584 195,737 3,869,898
Cash and cash equivalents 267,428 575,885 1,206,166 2,729,547 1,860,237
Total assets 19,134,888 24,580,843 32,347,807 12,702,115 67,611,852
LIABILITIES
Financial l iabil ities - - - - -
Financial derivatives - - - - -
Other payables and liabilities 47,608 113,529 271,694 430,725 9,546,693
Total l iabil ities 47,608 113,529 271,694 430,725 9,546,693
Value of fund as of 31 December 2019 19,087,280 24,467,314 32,076,113 12,271,390 58,065,159
Asian Income
Fund
Global Income
Fund
Global Technology
Fund
Multi -Asset
Premium Fund
Prime
Fund
Takaful
Fund
S$ S$ S$ S$ S$ S$
ASSETS
Financial assets
Investments
Equities 898,387,793 86,120,937 94,400,196 4,883,427 248,015,722 19,410,207
Debt securities - - - - - -
Value of investments 898,387,793 86,120,937 94,400,196 4,883,427 248,015,722 19,410,207
Other Assets
Financial derivatives - - - - - -
Other receivables and assets 9,145,622 4,278,991 3,075,918 22,131 799,779 104,157
Cash and cash equivalents 12,791,571 291,763 548,506 34,381 3,381,337 267,023
Total assets 920,324,986 90,691,691 98,024,620 4,939,939 252,196,838 19,781,387
LIABILITIES
Financial l iabil ities - - - - - -
Financial derivatives - - 34 - - 105
Other payables and liabilities 17,243,057 4,359,373 1,499,632 51,398 670,584 208,819
Total l iabil ities 17,243,057 4,359,373 1,499,666 51,398 670,584 208,924
Value of fund as of 31 December 2019 903,081,929 86,332,318 96,524,954 4,888,541 251,526,254 19,572,463
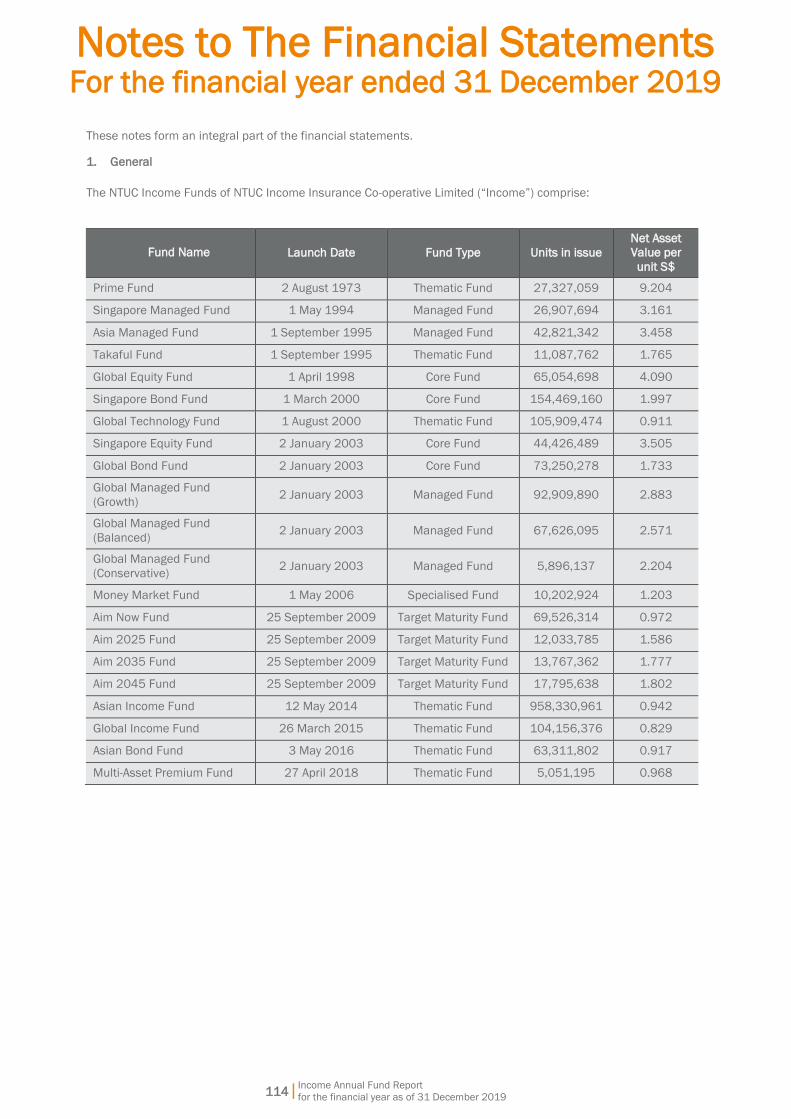
Notes to The Financial Statements For the financial year ended 31 December 2019
Income Annual Fund Report
for the financial year as of 31 December 2019
114|
These notes form an integral part of the financial statements.
1. General
The NTUC Income Funds of NTUC Income Insurance Co-operative Limited (“Income”) comprise:
Fund Name Launch Date Fund Type Units in issue
Net Asset
Value per
unit S$
Prime Fund 2 August 1973 Thematic Fund 27,327,059 9.204
Singapore Managed Fund 1 May 1994 Managed Fund 26,907,694 3.161
Asia Managed Fund 1 September 1995 Managed Fund 42,821,342 3.458
Takaful Fund 1 September 1995 Thematic Fund 11,087,762 1.765
Global Equity Fund 1 April 1998 Core Fund 65,054,698 4.090
Singapore Bond Fund 1 March 2000 Core Fund 154,469,160 1.997
Global Technology Fund 1 August 2000 Thematic Fund 105,909,474 0.911
Singapore Equity Fund 2 January 2003 Core Fund 44,426,489 3.505
Global Bond Fund 2 January 2003 Core Fund 73,250,278 1.733
Global Managed Fund
(Growth) 2 January 2003 Managed Fund 92,909,890 2.883
Global Managed Fund
(Balanced) 2 January 2003 Managed Fund 67,626,095 2.571
Global Managed Fund
(Conservative) 2 January 2003 Managed Fund 5,896,137 2.204
Money Market Fund 1 May 2006 Specialised Fund 10,202,924 1.203
Aim Now Fund 25 September 2009 Target Maturity Fund 69,526,314 0.972
Aim 2025 Fund 25 September 2009 Target Maturity Fund 12,033,785 1.586
Aim 2035 Fund 25 September 2009 Target Maturity Fund 13,767,362 1.777
Aim 2045 Fund 25 September 2009 Target Maturity Fund 17,795,638 1.802
Asian Income Fund 12 May 2014 Thematic Fund 958,330,961 0.942
Global Income Fund 26 March 2015 Thematic Fund 104,156,376 0.829
Asian Bond Fund 3 May 2016 Thematic Fund 63,311,802 0.917
Multi-Asset Premium Fund 27 April 2018 Thematic Fund 5,051,195 0.968
Notes to The Financial Statements For the financial year ended 31 December 2019
Income Annual Fund Report
for the financial year as of 31 December 2019
115|
2. Significant Accounting Policies
(a) Basis of preparation
The financial statements of the NTUC Income Funds have been prepared on the historical cost basis,
except for investments and derivative financial instruments which are stated at fair value.
The financial statements of the NTUC Income Funds are expressed in Singapore Dollars.
(b) Recognition of income and expenses
Dividend income is recognised when the right to receive payment is established.
Interest income on bank deposits is recognised using the effective interest method.
Expenses are recognised on an accrual basis.
(c) Investments
All purchases of investments are recognised on their trade dates, which are the dates the commitment
exists to purchase the investments. The investments are initially recorded at fair value, being the
consideration given and excluding acquisition charges associated with the investments. These
acquisition charges are recognised in the Capital and Income Account when incurred. After initial
recognition, the unrealised gains or losses on re-measurement to fair value are taken to the Capital and
Income Account. The quoted market price at the close of trading is adopted for all equity investments.
Equity investments comprise the direct investments in equity securities and investments in funds. The
bid price has been adopted for all fixed income investments. Unquoted fixed income securities are valued
at bid prices quoted by banks, inclusive of accrued interest.
(d) Derivative financial instruments
Derivative financial instruments are measured at initial recognition, and subsequently, at fair value and
changes in fair value are recognised in the Capital and Income Account. Transaction costs incurred in
buying and selling derivative instruments are recognised in the Capital and Income Account when
incurred. All derivatives are carried as assets when fair value is positive and as liabilities when fair value
is negative.
The fair value of a derivative financial instrument is determined by reference to its quoted price if quoted
prices are regularly available from an exchange, dealer, or broker and there are regularly recurring market
transactions in the instrument.
(e) Realised gains/losses from sale of investments
All sales of investments are recognised on their trade dates, which are the dates the Fund commits to
sell the investments.
Realised gains/losses from the sale of investments are taken to the Capital and Income Account.
(f) Foreign currency transactions
Foreign currency transactions are translated into Singapore Dollars at the exchange rates prevailing at
the dates of the transactions. Monetary assets and liabilities denominated in foreign currencies at the
reporting date are translated to the functional currency at the exchange rates at the reporting date.
Foreign currency differences are recognised in the Capital and Income Account.
Notes to The Financial Statements For the financial year ended 31 December 2019
Income Annual Fund Report
for the financial year as of 31 December 2019
116|
3. Other notes to Capital and Income Accounts
(a) Amounts received by the Fund for creation of units
The amounts received by the Fund represent the net amount received from policyholders less initial
charges (including the bid-offer spread) for the purchase of units in the NTUC Income Funds.
(b) Amounts paid by the Fund for liquidation of units
The amounts paid by the Fund represent the net asset values (bid price) of the units paid to policyholders
when they surrender their unit-linked policies.
Policy fees and other benefit charges are charged to the Capital and Income Accounts by way of unit
deductions.
(c) Dividend distribution
Dividend distribution represents payments made to policyholders when the funds make distribution.
(d) Management fees
The annual management charges net of rebates, if applicable for each Fund are accrued on a daily basis.
(e) Taxation
No provision for taxation is made in the financial statements as NTUC Income Insurance Co-operative
Limited is exempted from income tax under Section 13(1)(f)(ii) of the Income Tax Act, Cap. 134.