annual financial report rpts/2016 coral gables.pdf · communication maria rosa higgins-fallon...
TRANSCRIPT

City of Coral Gables, FloridaComprehensiveAnnual Financial ReportFiscal Year Ended September 30, 2016
A World-Class CityWith A Home-Town Feel
ON THE COVER:
Coral Gables City Hall
405 Biltmore Way
Coral Gables, Florida
The cornerstone of Coral Gables City Hall was laid on November 10, 1927 and the building was formally opened on
February 28, 1928 by the City’s first Mayor Edward E. “Doc” Dammers. City Hall, designed in the Spanish Renaissance
style by architect Phineas Paist, is constructed primarily of Miami oolite, a native limestone, commonly referred to as
coral rock. The building cost approximately $182,000 to build and includes design features such as a semi-circular
projecting bay with twelve stone columns, a balcony, fountains, and cast concrete ornamentation that incorporates the
1926 City Seal. The prominent building is crowned by a three-stage bell tower topped by a clock. Within the building are
finely detailed features including: vaulted ceilings, a grand staircase, and a cupola painted to represent the four seasons.
Coral Gables City Hall is both a local landmark and listed on National Registers of Historic Places.
COMPREHENSIVE
ANNUAL FINANCIAL REPORT
CITY OF CORAL GABLES, FLORIDA
For the
FISCAL YEAR ENDED
September 30, 2016
"The City Beautiful"
Prepared by
FINANCE DEPARTMENT

CITY OF CORAL GABLES, FLORIDA
COMMISSION - MANAGER FORM OF GOVERNMENT
CITY COMMISSION
JIM C. CASON, MAYOR
FRANK C. QUESADA., Vice Mayor PATRICIA KEON, Commissioner
VINCE LAGO, Commissioner JEANNETTE SLESNICK, Commissioner
CITY MANAGER
CATHY SWANSON-RIVENBARK
FINANCE DIRECTOR
DIANA M. GOMEZ, C.P.A.
ASSISTANT FINANCE DIRECTOR
FOR REPORTING AND OPERATIONS
SALLY OLA OLA

Introductory Section
TABLE OF CONTENTS
LETTER OF TRANSMITTAL
GFOA CERTIFICATE OF ACHIEVEMENT
ORGANIZATIONAL CHART
LIST OF PRINCIPAL OFFICIALS

[This Page Intentionally Left Blank]

CITY OF CORAL GABLES, FLORIDA – COMPREHENSIVE ANNUAL FINANCIAL REPORT – FISCAL YEAR ENDED SEPTEMBER 30, 2016
ii
TABLE OF CONTENTS PAGE
INTRODUCTORY SECTION (Unaudited)
Letter of Transmittal – Finance Director ............................................................................................................................... iii
Certificate of Achievement ................................................................................................................................................... ix
City of Coral Gables Organizational Chart ............................................................................................................................. x
List of Principal Officials ...................................................................................................................................................... xi
FINANCIAL SECTION
Report of Independent Certified Public Accountants ..............................................................................................................1
Management’s Discussion and Analysis (Unaudited) ............................................................................................................5
BASIC FINANCIAL STATEMENTS
Government-Wide Financial Statements
Statement of Net Position ..........................................................................................................................................20
Statement of Activities ...............................................................................................................................................21
Fund Financial Statements
Balance Sheet – Governmental Funds .......................................................................................................................24
Reconciliation of the Governmental Funds Balance Sheet to the Statement of Net Position ....................................25
Statement of Revenues, Expenditures, and Changes in Fund Balances (Deficits) – Governmental Funds................26
Reconciliation of the Statement of Revenues, Expenditures, and Changes in Fund Balances
Governmental Funds to the Statement of Activities .............................................................................................27
Statement of Net Position – Proprietary Funds ..........................................................................................................30
Statement of Revenues, Expenses and Changes in Fund Net Position – Proprietary Funds ......................................31
Statement of Cash Flows – Proprietary Funds ...........................................................................................................32
Statement of Fiduciary Net Position – Fiduciary Funds .............................................................................................33
Statement of Changes in Fiduciary Net Position – Fiduciary Funds ..........................................................................34
Notes to Financial Statements ........................................................................................................................................35
REQUIRED SUPPLEMENTARY INFORMATION (Unaudited)
Schedule of Revenues, Expenditures, and Changes in Fund Balance
Budget and Actual – General Fund ......................................................................................................................94
Schedule of Changes in the City’s Net Pension Liability and Related Ratios ...........................................................95
Schedule of Contributions .........................................................................................................................................96
Schedule of Funding Progress (OPEB) ......................................................................................................................97
Notes to Required Supplementary Information ..........................................................................................................98
COMBINING INDIVIDUAL FUND STATEMENTS AND SCHEDULES
Combining Balance Sheet– Nonmajor Governmental Funds...................................................................................103
Combining Statement of Revenues, Expenditures, and Changes in
Fund Balances (Deficit) – Nonmajor Governmental Funds ...............................................................................104
Schedules of Revenues, Expenditures, and Changes in
Fund Balances – Budget and Actual:
Debt Service Fund ................................................................................................................................................105
Combining Statement of Net Position – Internal Service Funds .............................................................................108
Combining Statement of Revenues, Expenses, and Changes in
Fund Net Position – Internal Service Funds ......................................................................................................109
Combining Statement of Cash Flows – Internal Service Funds ...............................................................................110
Combining Statement of Fiduciary Net Position – Pension Trust Funds .................................................................112
Combining Statement of Changes in Fiduciary Net Position – Pension Trust Funds ..............................................113
Combining Statement of Changes in Assets and Liabilities – Agency Funds ..........................................................114

CITY OF CORAL GABLES, FLORIDA – COMPREHENSIVE ANNUAL FINANCIAL REPORT – FISCAL YEAR ENDED SEPTEMBER 30, 2016
iiii
TABLE OF CONTENTS
PAGE
STATISTICAL SECTION (Unaudited)
Net Position by Component ...............................................................................................................................................116
Changes in Net Position .....................................................................................................................................................117
Fund Balances, Governmental Funds .................................................................................................................................118
Changes in Fund Balances, Governmental Funds ..............................................................................................................119
Property Tax Levies and Tax Collections ...........................................................................................................................120
Assessed Values of Taxable Property ................................................................................................................................120
Property Tax Rates Direct and Overlapping Governments..................................................................................................120
Principal Taxpayers .............................................................................................................................................................121
Special Assessment Billings and Collections ......................................................................................................................121
Ratio of Oustanding Debt by Type .....................................................................................................................................122
Ratio of Annual Debt Service for General Bonded Debt to Total General Government Expenditures ...............................122
Computation of Direct and Overlapping Bonded Debt – General Obligation Bonds .........................................................123
Pledged-Revenue Coverage.................................................................................................................................................124
Demographic and Economic Statistics ................................................................................................................................125
General Government Tax Revenue by Source.....................................................................................................................125
Principal Employers ............................................................................................................................................................126
Position Control – Full Time Positions ...............................................................................................................................127
Operating Indicators by Function/Program .........................................................................................................................128
Capital Asset Statistics by Function/Program .....................................................................................................................129


ix

CITY OF CORAL GABLES-COMPREHENSIVE ANNUAL FINANCIAL REPORT-FISCAL YEAR ENDED SEPTEMBER 30, 2016
CITY COMMISSION
CITY OF CORAL GABLES, FLORIDA
ORGANIZATION CHART
RESIDENTS &
CUSTOMERS
CITY BOARDS &
COMMITTEES
Jim C. Cason - Mayor
Frank C. Quesada - Vice Mayor
Patricia Keon - Commissioner
Vince C. Lago - Commissioner
Jeannett Slesnick - Commissioner
CITY CLERK
Craig E. Leen, Esq. Walter Foeman
[email protected] [email protected] [email protected]
CITY ATTORNEY CITY MANAGER
Cathy Swanson-Rivenbark,
ICMA-CM, AICP, CEcD
FINANCE COMMUNICATIONS
Diana M. Gomez, CPA
Director
Maria Rosa Higgins-Fallon
Public Affairs Manager
[email protected] [email protected]
INTERNAL AUDIT
Crowe Horwath, LLPASSISTANT CITY MANAGER
OPERATIONS &
INFRASTRUCTURE
ASSISTANT CITY MANAGER
DIRECTOR OF PUBLIC
SAFETY
Peter J. Iglesias, P.E. Frank G. Fernandez
[email protected] [email protected]
PUBLIC
WORKS
COMMUNITY
RECREATIONPOLICE FIRE
Eduardo Santamaria, P.E.
Director
Fred Couceyro
Parks & Rec. Director
Edward Hudak
Police Chief
Marcos De La Rosa
Fire Chief
[email protected] [email protected] [email protected] [email protected]
ECONOMIC
DEVELOPMENT
HISTORICAL RESOURCES
& CULTURAL ARTS
LABOR RELATIONS &
RISK MANAGEMENT
HUMAN
RESOURCES
Javier Betancourt
Director
Dona Spain
Historical Preservation Officer
Raquel Elejabarrieta, Esq.
Director
Karla Green
Director (Interim)[email protected]
DEVELOPMENT
SERVICESPARKING
INFORMATION
TECHNOLOGYEMERGENCY
MANAGEMENTCharles Wu, A.I.C.P.
Director (Interim)
Kevin Kinney, Esq.
Director
Raimundo Rodulfo, P.E.
Director
[email protected] [email protected] [email protected]
[email protected] [email protected] [email protected]
x

CITY OF CORAL GABLES – COMPREHENSIVE ANNUAL FINANCIAL REPORT – FISCAL YEAR ENDED SEPTEMBER 30, 2016
CITY OF CORAL GABLES
LIST OF PRINCIPAL OFFICIALS
JIM C. CASON MAYOR
FRANK C. QUESADA PATRICIA KEON VINCE C. LAGO JEANNETTE SLESNICK VICE MAYOR COMMISSIONER COMMISSIONER COMMISSIONER
WALTER FOEMAN CATHY SWANSON-RIVENBARK CRAIG E. LEEN CITY CLERK CITY MANAGER CITY ATTORNEY
FRANK G. FERNANDEZ PETER J. IGLESIAS ASST. CITY MANAGER / DIRECTOR OF PUBLIC SAFETY ASST. CITY MANAGER/OPERATIONS & INFRASTRUCTURE
DEPARTMENT DIRECTORS
Communication Maria Rosa Higgins-Fallon
Community Recreation Fred Couceyro
Development Services Charles Wu (Interim)
Economic Development Javier Betancourt
Finance Diana M. Gomez
Fire Chief Marcos De La Rosa
Historical Resources Dona M. Spain
Human Resources Karla Green (Interim)
Information Technology
Labor Relations & Risk Mgmt.
Parking
Police Chief
Public Works
Raimundo Rodulfo
Raquel Elejabarrieta
Kevin J. Kinney
Edward Hudak
Eduardo Santamaria
xi

[ This Page Intentionally Left Blank ]
xii
Financial Section
REPORT OF INDEPENDENT CERTIFIED
PUBLIC ACCOUNTANTS
MANAGEMENT’S DISCUSSION AND ANALYSIS
BASIC FINANCIAL STATEMENTS
NOTES TO FINANCIAL STATEMENTS
REQUIRED SUPPLEMENTARY INFORMATION
SUPPLEMENTARY INFORMATION
NOTES TO REQUIRED SUPPLEMENTARY
INFORMATION

[ This Page Intentionally Left Blank ]

1
Independent Auditor's Report Honorable Mayor and Members of the City Commission City of Coral Gables, Florida Report on the Financial Statements We have audited the accompanying financial statements of the governmental activities, the business-type activities, each major fund, and the aggregate remaining fund information of the City of Coral Gables, Florida (the City), as of and for the year ended September 30, 2016, and the related notes to the financial statements, which collectively comprise the City’s basic financial statements as listed in the table of contents. Management’s Responsibility for the Financial Statements Management is responsible for the preparation and fair presentation of these financial statements in accordance with accounting principles generally accepted in the United States of America; this includes the design, implementation and maintenance of internal control relevant to the preparation and fair presentation of financial statements that are free from material misstatement, whether due to fraud or error. Auditor’s Responsibility Our responsibility is to express opinions on these financial statements based on our audit. We did not audit the financial statements of the City of Coral Gables Retirement Fund and Police Officers’ Pension Fund, which represent 83% of the total assets/deferred outflows of resources and 62% of the total revenues/additions of the aggregate remaining fund information. Those statements were audited by other auditors whose reports have been furnished to us, and our opinion, insofar as it relates to the amounts included for the City of Coral Gables Retirement Fund and Police Officers’ Pension Fund, is based solely on the report of the other auditors. We conducted our audit in accordance with auditing standards generally accepted in the United States of America and the standards applicable to financial audits contained in Government Auditing Standards, issued by the Comptroller General of the United States. Those standards require that we plan and perform the audit to obtain reasonable assurance about whether the financial statements are free from material misstatement. The financial statements of the City of Coral Gables Retirement Fund were not audited in accordance with Government Auditing Standards. An audit involves performing procedures to obtain audit evidence about the amounts and disclosures in the financial statements. The procedures selected depend on the auditor’s judgment, including the assessment of the risks of material misstatement of the financial statements, whether due to fraud or error. In making those risk assessments, the auditor considers internal control relevant to the entity’s preparation and fair presentation of the financial statements in order to design audit procedures that are appropriate in the circumstances, but not for the purpose of expressing an opinion on the effectiveness of the entity’s internal control. Accordingly, we express no such opinion. An audit also includes evaluating the appropriateness of accounting policies used and the reasonableness of significant accounting estimates made by management, as well as evaluating the overall presentation of the financial statements.

2
We believe that the audit evidence we have obtained is sufficient and appropriate to provide a basis for our audit opinions. Opinions In our opinion, based on our audit and the reports of other auditors, the financial statements referred to above present fairly, in all material respects, the respective financial position of the governmental activities, the business-type activities, each major fund, and the aggregate remaining fund information of the City of Coral Gables, Florida, as of September 30, 2016, and the respective changes in financial position and, where applicable, cash flows thereof for the year then ended in accordance with accounting principles generally accepted in the United States of America. Other Matters
Required Supplementary Information
Accounting principles generally accepted in the United States of America require that the management’s discussion and analysis (MD&A), budgetary comparison information for the general fund, and the pension related schedules be presented to supplement the basic financial statements. Such information, although not a part of the basic financial statements, is required by the Governmental Accounting Standards Board who considers it to be an essential part of financial reporting for placing the basic financial statements in an appropriate operational, economic, or historical context. We and other auditors have applied certain limited procedures to the required supplementary information in accordance with auditing standards generally accepted in the United States of America, which consisted of inquiries of management about the methods of preparing the information and comparing the information for consistency with management’s responses to our inquiries, the basic financial statements, and other knowledge we obtained during our audit of the basic financial statements. We do not express an opinion or provide any assurance on the information because the limited procedures do not provide us with sufficient evidence to express an opinion or provide any assurance. Other Information
Our audit was conducted for the purpose of forming opinions on the financial statements that collectively comprise the City’s basic financial statements. The accompanying introductory section, the combining individual fund statements and schedules, and the statistical section, are presented for purposes of additional analysis and are not a required part of the basic financial statements. The combining individual fund statements and schedules are the responsibility of management and were derived from and relates directly to the underlying accounting and other records used to prepare the basic financial statements. Such information has been subjected to the auditing procedures applied in the audit of the basic financial statements and certain additional procedures, including comparing and reconciling such information directly to the underlying accounting and other records used to prepare the basic financial statements or to the basic financial statements themselves, and other additional procedures in accordance with auditing standards generally accepted in the United States of America by us and other auditors. In our opinion, based on our audit, the procedures performed as described above, and the report of the other auditors, the combining individual fund statements and schedules are fairly stated, in all material respects, in relation to the basic financial statements as a whole. The introductory and statistical sections have not been subjected to the auditing procedures applied in the audit of the basic financial statements, and accordingly, we do not express an opinion or provide any assurance on them.

3
Other Reporting Required by Government Auditing Standards In accordance with Government Auditing Standards, we have also issued our report dated March 24, 2017 on our consideration of the City’s internal control over financial reporting and on our tests of its compliance with certain provisions of laws, regulations, contracts, and grant agreements and other matters. The purpose of that report is to describe the scope of our testing of internal control over financial reporting and compliance and the results of that testing, and not to provide an opinion on internal control over financial reporting or on compliance. That report is an integral part of an audit performed in accordance with Government Auditing Standards in considering the City’s internal control over financial reporting and compliance.
Miami, Florida March 24, 2017

[ This Page Intentionally Left Blank ]
4

CITY OF CORAL GABLES, FLORIDA – COMPREHENSIVE ANNUAL FINANCIAL REPORT – FISCAL YEAR ENDED SEPTEMBER 30, 2016
5
MANAGEMENT’S DISCUSSION AND ANALYSIS (Unaudited)
This section of the City’s financial statements presents management’s analysis of the City’s
financial performance during the fiscal year that ended on September 30, 2016. We encourage
readers to consider the information presented here in conjunction with the additional
information that we have furnished in our Letter of Transmittal and the City’s financial
statements.
Financial Highlights
• The assets and deferred outflows of resources of the City exceeded its liabilities and
deferred inflows of resources at the close of the most recent fiscal year by $130.54 million
(net position) which increased $13.63 million when compared to prior year.
• The City has no general obligation debt outstanding.
• As of the close of the current fiscal year, the City’s governmental funds reported combined
fund balances of $132.09 million, an increase of $11.84 million in comparison with the
prior year. Of this amount, $41.63 million or approximately 31.51% is unassigned fund
balance in the General Fund which is maintained in accordance with the City’s Fund
Balance Reserve Policy.
• At the end of the current year, the total of the committed, assigned, and unassigned
components of fund balances for the general fund was $52.98 million or 41% of the total
general fund expenditures and is available for future spending.
• The 2015-2016 annual principal and semi-annual monthly interest payments on loans from
the Sunshine State Governmental Financing Commission are 100% funded from the non-ad
valorem revenues of the General Fund; and operating revenues of the Parking System Fund
and the Stormwater Utility Fund.
• The City’s Streetscape Improvement Project for Miracle Mile and Giralda Avenue was
underway during fiscal year 2016. On January 26, 2016, the City passed Resolution 2016-33
approving a construction contract for a guaranteed maximum price of $21.6 million, and a
contract for construction administration services not to exceed $500,000. The total project
cost is estimated at $25.9 million which includes design, the guaranteed construction price,
construction administration services, and other related project costs.
• To finance the cost of the Streetscape Improvement Project, the City issued Capital
Improvement Revenue Bonds Series 2016A, Series 2016B and Series 2016C with total
principal and premium amount of $23.79 million. The 2016 Bonds are secured by a
covenant to budget and appropriate from legally available non ad valorem revenue. In
addition, the 2016 Bonds are secured by special assessments imposed on properties located
in the defined assessment areas that will specially benefit from the improvement projects.
Total special assessment is $9.04 million where $898,000 has been received by the City
from property owners who have prepaid their special assessment.

CITY OF CORAL GABLES, FLORIDA – COMPREHENSIVE ANNUAL FINANCIAL REPORT – FISCAL YEAR ENDED SEPTEMBER 30, 2016
6
Overview of the Financial Statements
This discussion and analysis is intended to serve as an introduction to the City’s basic financial
statements. The basic financial statements consist of three parts: government-wide financial
statements, fund financial statements and notes to the financial statements.
This report also includes required supplementary information that provides more detail to some
of the information in the financial statements.
Government-Wide Financial Statements
The government-wide financial statements of the City provide a broad overview of the City’s
finances and reports information about the City using accounting methods similar to those used
by private sector companies.
The Statement of Net Position includes all of the City’s assets, liabilities and deferred
inflows/outflows of resources, with the difference reported as net position. It provides
information about the nature and amounts of investments in resources (assets and deferred
outflows of resources) and the obligations to City creditors (liabilities and deferred inflows of
resources). Net position, the difference between assets, plus deferred outflows of resources, less
liabilities and deferred inflows of resources, provide the basis for computing rate of return,
evaluating the capital structure of the City, and assessing the liquidity and financial flexibility of
the City. Over time, increases or decreases in net position may serve as a useful indicator of
whether the financial position of the City is improving or deteriorating. The Statement of Activities measures the activities of the City’s operations over the past year
and can be used to determine whether the City has successfully recovered all its costs through
its services provided, as well as its credit worthiness. All changes in net position are reported as
soon as the underlying event giving rise to the change occurs, regardless of the timing of related
cash flows. Thus, revenues and expenses are reported in this statement for some items that will
only result in cash flows in future periods.
The government-wide statements distinguish functions of the City that are principally supported
by taxes and intergovernmental revenues (governmental activities) from other functions that are
intended to recover all or a significant portion of their costs through user fees and charges
(business-type activities). Governmental activities include general government, public safety,
physical environment, transportation, economic environment and culture and recreation.
Business-type activities include a stormwater utility, a sanitary sewer collection system and a
parking system.
The government-wide financial statements can be found on pages 20-21 of this report.
CITY OF CORAL GABLES, FLORIDA – COMPREHENSIVE ANNUAL FINANCIAL REPORT – FISCAL YEAR ENDED SEPTEMBER 30, 2016
7
Fund Financial Statements
Governmental Funds - Governmental funds are used to account for essentially the same
functions reported as governmental activities in the government-wide financial statements.
However, these funds focus on near-term inflows and outflows of spendable resources as well
as on balances of spendable resources available at the end of the fiscal year. Both the
governmental fund balance sheet and the governmental fund statement of revenues,
expenditures, and changes in fund balances provide a reconciliation to facilitate this comparison
between governmental funds and governmental activities.
The City maintains eight individual governmental funds. Information is presented separately for
the general fund, debt service fund and capital project general improvement fund, as they are
considered major funds. Data for the other governmental funds are aggregated into a single
presentation. Individual fund data for each of these nonmajor governmental funds is provided in
the form of combining statements elsewhere in this report.
The basic governmental fund financial statements can be found on pages 24-27 of this report.
Proprietary Funds - The City maintains two different types of proprietary funds. Enterprise
funds are used to report the same functions presented as business-type activities in the
government-wide financial statements. The City uses enterprise funds to account for a
stormwater utility, a sanitary sewer collection system and a parking system. Internal service
funds are an accounting device used to accumulate and allocate costs internally among the
City’s various functions. The City uses internal service funds to account for its maintenance
facility for automotive and other City equipment, its building maintenance, utilities and general
housekeeping services for City property and for its general, automobile and workers’
compensation insurance programs. Because these services primarily support governmental
rather than business-type functions, they have been included within governmental activities in
the government-wide statements.
Proprietary funds provide the same type of information as the government-wide statements.
Separate information is provided for each of the City’s enterprise funds, however, the City’s
internal service funds are combined into a single, aggregated presentation in the proprietary
fund financial statements. Individual fund data are presented in the form of combining
statements elsewhere in this report.
The basic proprietary fund financial statements can be found on pages 30-32 of this report.
Fiduciary Funds - Fiduciary funds are used to account for resources held for the benefit of
parties outside of the government and, consequently, are not reflected in the government-wide
statements because the resources are not available to support the City’s own programs. The
accounting for fiduciary funds is much like that of proprietary funds.
The basic fiduciary fund financial statements can be found on pages 33-34 of this report.
Notes to the financial statements - The notes provide additional information that is essential to a
full understanding of the data provided in the government-wide and fund financial statements.
The notes to the financial statements can be found beginning on page 35 of this report.
Other information - In addition to the basic financial statements and notes, this report also
presents certain required supplementary information concerning the City’s net pension liability

CITY OF CORAL GABLES, FLORIDA – COMPREHENSIVE ANNUAL FINANCIAL REPORT – FISCAL YEAR ENDED SEPTEMBER 30, 2016
8
and progress in funding its other post-employment benefits to its employees. Additionally, the
City adopts an annual appropriated budget for its general fund and debt service fund. A
budgetary comparison schedule has been provided as required supplementary information for
the general fund to demonstrate compliance with this budget. Required supplementary
information can be found beginning on page 94 of this report.
The combining statements referred to earlier in connection with nonmajor governmental funds,
internal service funds and fiduciary funds are presented immediately following the required
supplementary information. Combining and individual fund statements and schedules can be
found beginning on page 103 of this report.
Government-Wide Financial Analysis
Our analysis of the government-wide financial statements of the City begins below. One of the
most important questions asked about the City’s finances is “Is the City as a whole better off or
worse off as a result of the year’s activities?” The Statement of Net Position and the Statement
of Activities report information about the City’s activities in a way that will help answer this
question. These two statements report the net position of the City and changes in them. You
can think of the City’s net position as one way to measure financial health or financial position.
Over time, increases or decreases in the City’s net position are one indicator of whether its
financial health is improving or deteriorating. However, you will need to consider other non-
financial factors such as changes in economic conditions, regulations and new or changes to
government legislation. As of September 30, 2016, the City’s total net position increased by
$13.63 million when compared to prior year which indicates that the City’s overall financial
position has continued to improve.
To begin our analysis, a summary of the City’s government-wide Statement of Net Position is
presented in Table A-1.

CITY OF CORAL GABLES, FLORIDA – COMPREHENSIVE ANNUAL FINANCIAL REPORT – FISCAL YEAR ENDED SEPTEMBER 30, 2016
9
Table A-1 Condensed Statement of Net Position (In millions of dollars)
2016 2015 2016 2015 2016 2015
Current and other assets 209.14$ 184.76$ 22.36$ 25.38$ 231.50$ 210.14$
Capital assets 198.85 180.07 43.94 42.76 242.79 222.83
Total Assets 407.99 364.83 66.30 68.14 474.29 432.97
Total Deferred Outflows of
Resource 48.04 27.80 1.55 0.94 49.59 28.74
Current liabilities 25.26 13.97 2.69 2.96 27.95 16.93
Noncurrent liabilities 335.24 296.40 23.90 24.39 359.14 320.79
Total Liabilities 360.50 310.37 26.59 27.35 387.09 337.72
Total Deferred Inflows of
Resource 6.16 6.96 0.09 0.12 6.25 7.08
Net Position:
Net Investment in capital
assets 135.58 133.37 29.44 23.57 165.02 156.94
Restricted 23.79 21.86 0.35 0.30 24.14 22.16
Unrestricted (70.00) (79.93) 11.38 17.74 (58.62) (62.19)
Total Net Position 89.37$ 75.30$ 41.17$ 41.61$ 130.54$ 116.91$
Business-Type
Activities
Governmental
Activities Total
The major component of the City’s net position is “net investment in capital assets”, which
represents the City’s investment in its capital assets, net of the amounts borrowed to purchase
these assets. An additional portion of the City’s net position of $24.14 million, or 18% of the net
position, is restricted due to external restrictions on how they may be used. The City’s
unrestricted net position is a deficit of $58.62 million.
For the governmental activities, capital assets represent 49% of total assets, while noncurrent
liabilities represent 93% of the total long-term liabilities. For the business-type activities, these
capital assets represent 66% of total assets, while noncurrent liabilities represent 90% of the
total long-term liabilities.
Current and other assets increased $24.4 million for governmental activities mainly due to (a)
unspent proceeds from the issuance of special obligation bonds for capital improvements; (b)
prepayments of $5.98 million received for the solidwaste collection fees for services to be
rendered by the City in fiscal year 2017 and (c) positive results of operations of $14.07 million
as shown in the statements of revenues, expenditures and changes in fund balance on page 26 of
this report. Current and other assets decreased $3.02 million for business-type activities mainly
due to increase activity related to sanitary sewer system inflow and infiltration maintenance
projects and continuing maintenance and upgrade of parking garages.

CITY OF CORAL GABLES, FLORIDA – COMPREHENSIVE ANNUAL FINANCIAL REPORT – FISCAL YEAR ENDED SEPTEMBER 30, 2016
10
Current liabilities increased by $11.29 million for governmental activities primarily due to (a)
increase in contractor invoices of $4.08 million related to various on-going capital projects such
as the Streetscape projects, improvement of passive parks, and artwork installation at
roundabouts and circles; and (b) prepayments of $5.98 million received for the solidwaste
collection fees for services to be rendered by the City in fiscal year 2017.
Current liabilities decreased $270 thousand for business-type activities mainly due to decrease
in accounts payable related to contractor invoices related to various improvement projects
related to sanitary sewer system inflow and infiltration maintenance projects and continuing
maintenance and upgrade of parking garages.
Total Non-current liabilities had a net increase of $38.40 million due to (a) increase in net
pension liability of $16.3 million; (b) scheduled principal payments in fiscal year ended 2016 of
$4.68 million and issuance of new debt of $23.8 million; (c) repayment of capital lease payable
of $298 thousand; (d) increase in net OPEB obligation of $1.15 million; and (e) increase in
claims payable of $2.2 million.
The deferred outflows of resources consist of deferred outflows related to pension and deferred
charge on bond refunding. Deferred outflows related to pension of $49.26 million consists of
difference between expected and actual experience and pension contribution to be expensed in
the subsequent period. Deferred charge on refunding of $335 thousand resulted from issuance of
a refunding bond with reacquisition price exceeding the net carrying value of the refunded debt.
The deferred inflows of resources consist of business tax receipts of $2.9 million received in
advance for fiscal year 2017, and deferred inflows related to pension of $3.2 million
representing the net difference between projected and actual earnings on pension plan
investments.
While the Statement of Net Position shows the change in financial position of the City’s net
position, the Statement of Activities provides answers as to the nature and source of these
changes.
CITY OF CORAL GABLES, FLORIDA – COMPREHENSIVE ANNUAL FINANCIAL REPORT – FISCAL YEAR ENDED SEPTEMBER 30, 2016
11
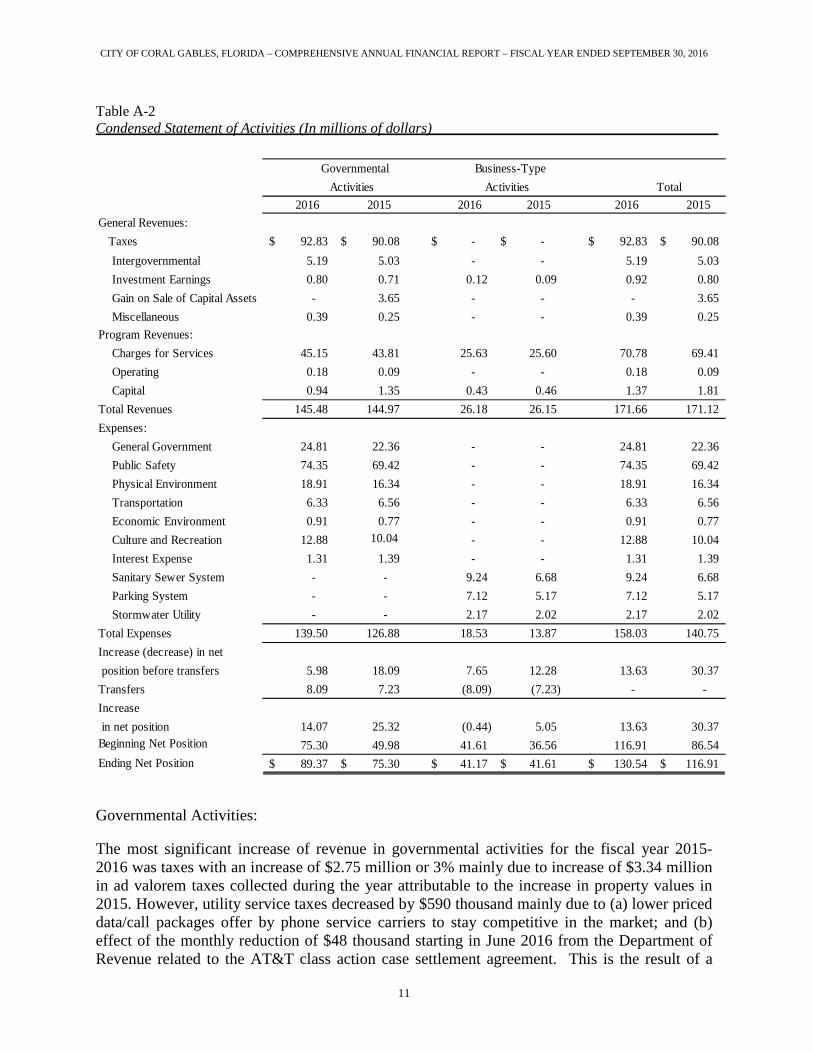
Table A-2
Condensed Statement of Activities (In millions of dollars)
2016 2015 2016 2015 2016 2015
General Revenues:
Taxes 92.83$ 90.08$ -$ -$ 92.83$ 90.08$
Intergovernmental 5.19 5.03 - - 5.19 5.03
Investment Earnings 0.80 0.71 0.12 0.09 0.92 0.80
Gain on Sale of Capital Assets - 3.65 - - - 3.65
Miscellaneous 0.39 0.25 - - 0.39 0.25
Program Revenues:
Charges for Services 45.15 43.81 25.63 25.60 70.78 69.41
Operating 0.18 0.09 - - 0.18 0.09
Capital 0.94 1.35 0.43 0.46 1.37 1.81
Total Revenues 145.48 144.97 26.18 26.15 171.66 171.12
Expenses:
General Government 24.81 22.36 - - 24.81 22.36
Public Safety 74.35 69.42 - - 74.35 69.42
Physical Environment 18.91 16.34 - - 18.91 16.34
Transportation 6.33 6.56 - - 6.33 6.56
Economic Environment 0.91 0.77 - - 0.91 0.77
Culture and Recreation 12.88 10.04 - - 12.88 10.04
Interest Expense 1.31 1.39 - - 1.31 1.39
Sanitary Sewer System - - 9.24 6.68 9.24 6.68
Parking System - - 7.12 5.17 7.12 5.17
Stormwater Utility - - 2.17 2.02 2.17 2.02
Total Expenses 139.50 126.88 18.53 13.87 158.03 140.75
Increase (decrease) in net
position before transfers
Transfers 8.09 7.23 (8.09) (7.23) - -
Increase
in net position
Beginning Net Position 75.30 49.98 41.61 36.56 116.91 86.54
Ending Net Position 89.37$ 75.30$ 41.17$ 41.61$ 130.54$ 116.91$
Governmental
Activities
Business-Type
Activities Total
12.28 13.63 30.37
14.07 25.32 5.05 13.63 30.37
5.98 18.09 7.65
(0.44)
Governmental Activities:
The most significant increase of revenue in governmental activities for the fiscal year 2015-
2016 was taxes with an increase of $2.75 million or 3% mainly due to increase of $3.34 million
in ad valorem taxes collected during the year attributable to the increase in property values in
2015. However, utility service taxes decreased by $590 thousand mainly due to (a) lower priced
data/call packages offer by phone service carriers to stay competitive in the market; and (b)
effect of the monthly reduction of $48 thousand starting in June 2016 from the Department of
Revenue related to the AT&T class action case settlement agreement. This is the result of a
CITY OF CORAL GABLES, FLORIDA – COMPREHENSIVE ANNUAL FINANCIAL REPORT – FISCAL YEAR ENDED SEPTEMBER 30, 2016
12
federal case where AT&T was required to refund taxes collected on charges for internet access
and for AT&T to seek refund of communication service tax from Florida Department of
Revenue on behalf of their Florida customers. Most of jurisdictions in the State of Florida are
affected by this refund. Total refund claim from the City of Coral Gables was $730,000 and
will be collected through fifteen (15) monthly reductions of $48 thousand each.
Charges for services increased by $1.34 million mainly due to transaction rent of $816 thousand
received by the City as a result of change in the ownership of a property as provided in the
ground lease agreement with the City.
During fiscal year 2015, as part of a settlement agreement with a third-party for $3.9 million,
the City sold the land and building used as trolley maintenance facility. The net gain on the sale
was $3.65 million.
The largest outflow of resources for the City is represented in the public safety function which
represents the City’s costs related to providing police and fire services, as well as various
ancillary services for the protection of the City’s residents and businesses. Further analysis of
change in the expenditures of the governmental fund is included in the analysis of the City’s
major funds.
Business-Type Activities:
The City’s business-type activities showed a decrease of approximately $440 thousand in net
position. Further analysis of this change is included in the analysis of the Proprietary Funds that
follows.
Financial Analysis of the City’s Major Funds
Governmental Funds
General Fund - This fund recognized $140.82 million of revenue during the fiscal year, offset
by $129.22 million of expenditures. As noted above, taxes represent the largest portion of
revenues and public safety represents the largest portion of expenditures. In fiscal year 2016,
public safety and general government functions increased $3.0 million and $1.6 million,
respectively, due to increase in personnel costs. During fiscal year 2016, the City made an
additional contribution of $4.076 million to the City of Coral Gables Retirement System to pay
down a portion of the unfunded pension liability. This additional pension contribution resulted
in an increase in personnel cost as noted above. The City decreased its millage rate from
5.5890 to 5.5590 and maintained a more stable source of revenues and maintained a stringent
control on expenditures to achieve a positive result of operations in fiscal year 2016.
Debt Service Fund – In fiscal year 2016, the City issued Capital Improvement Revenue Bonds
Series 2016A, Series 2016B and Series 2016C with total principal and premium amount of
$23.79 million to finance the cost of the Streetscape Improvement Projects. In addition, the
City paid $3.6 million in scheduled principal payments in fiscal year ended 2016.
Capital Project General Improvement Fund - This fund recognized $283 thousand in revenue
and other financing sources of $31.3 million; and offset by $17.15 million in capital
expenditures. Significant capital project expenditures include the Streetscape Improvement

CITY OF CORAL GABLES, FLORIDA – COMPREHENSIVE ANNUAL FINANCIAL REPORT – FISCAL YEAR ENDED SEPTEMBER 30, 2016
13
Projects for Miracle Mile and Giralda Avenue, construction of the adult activity center,
construction and implementation of the new radio system and replacement of the microwave
relay system, improvements of various parks and construction and improvements of City
facilities.
Proprietary Funds
The City’s proprietary funds provide the same type of information found in the government-
wide financial statements, for business-type activities, but in more detail.
Sanitary Sewer - Operating revenues increased by approximately $55,000 and operating
expenses increased by approximately $2.5 million from the prior year. The increase in the
operating expenses is mainly due to the higher cost of sewer disposal fee which increased by
$1.1 million in fiscal year 2016. There has been a significant infiltration of rainwater into the
sewer lines that caused the City to pay more for the volume of water going through the sewer
lines. This issue resulted to increase in activities related to sanitary sewer system inflow and
infiltration maintenance projects. In October 2016, the City received $400,000 of grant funds
from Florida Department of Environmental Protection as partial funding for the sanitary sewer
system inflow and infiltration maintenance projects. During the current year, the Sanitary
Sewer Fund received $70,000 as transfers-in from the Parking Fund to provide additional
funding for the repairs and maintenance of sewer pumps; and transferred approximately $1.1
million to the General Fund to subsidize the cost of operations of the fund. The resulting
negative change in the net position of $400,000 is funded from the planned use of the
unrestricted net position of the Sanitary Sewer System Fund as provided for in the adopted
budget for fiscal year 2016.
Parking System - Operating revenues decreased by approximately $42,000 from the prior year.
The operating revenue is considered strong and stable since it did not decrease significantly due
to the effect of the Streetscape Projects to the overall flow of traffic along the construction
areas. The operating expense showed increase of $1.90 million mainly related to various repairs
and maintenance to garage facilities. Additionally, during the current year the Parking Fund
transferred approximately $6.63 million to the General Fund to subsidize the cost of operations
of the fund; $70,000 to the Sanitary Sewer Fund; and $14,000 to Stormwater Fund to provide
additional funding for the repairs and maintenance of sewer pumps and stormwater system. The
resulting negative change in the net position of $790,000 is funded from the planned use of the
unrestricted net position of the Parking Fund as provided for in the adopted budget for fiscal
year 2016. Stormwater Utility Fund - Operating revenues increased by approximately $14,000 from the
prior year. In fiscal year 2016, the City maintained the system user rates similar to fiscal year
2015. The operating expense showed an increase of $101,000 mainly due to maintenance-type
work on the stormwater infrastructure. In addition, during fiscal year 2016 the Stormwater
Utility Fund transferred approximately $321,000 to the General Fund to subsidize the cost of
operations of the fund; and received $14,000 from Parking Fund to provide additional funding
for the repairs and maintenance of the stormwater system.
General Fund Budgetary Highlights
Budget and actual comparison schedules are presented in the required supplementary
information for the General Fund. The budget and actual comparison schedules show the

CITY OF CORAL GABLES, FLORIDA – COMPREHENSIVE ANNUAL FINANCIAL REPORT – FISCAL YEAR ENDED SEPTEMBER 30, 2016
14
original adopted budgets, the final revised budget, actual results, and variances between the
final budget and actual results.
After the original budget is approved, it may be revised for a variety of reasons such as
unforeseen circumstances, loan proceeds, new grant awards, or other unanticipated revenues
and expenditures.
Differences between the original budget and the final amended budget for the General Fund are
summarized as follows:
The City’s budgeted revenues increased from $134.56 million to $135.54 million from the
original to the final budget. The City’s budgeted expenditures increased from $135.66
million to $136.08 million from the original to the final budget. For the fiscal year, the
budget amendments related to revenue mainly pertain to increase in ad valorem taxes and
miscellaneous revenues. The budget amendments related to expenditures mainly pertains to
increase in operating equipment replacement for culture and recreation.
The City budgeted $135.54 million in revenue and recognized $140.82 million. The City
budgeted $136.08 million in expenditures, but incurred $129.22 million.
The budget to actual variances in revenue were due to increases in permits and related building
and planning fees as a direct result of the increase in construction and new developments in the
City, increase in recreation activity fees, receipt of equitable sharing revenues from federal
agencies as part of the City’s participation in public safety operations/programs, receipt of
transaction rent and improved collection of waste collection fees through the tax bill.
The budget to actual variances in expenditures were due to decreases in general government,
public safety, physical environment, transportation, and culture and recreation, as a result of
management initiatives towards more prudent control on spending.
Capital Assets and Debt Administration
Capital Assets
The City’s capital assets for its governmental and business type activities as of September 30,
2016 amounted to $242.78 million (net of accumulated depreciation). This investment in
capital assets includes land, buildings, improvements, machinery and equipment, parks, roads,
highways, and bridges. The City’s investment in net capital assets increased by $19.96 million
from the prior year.
During the current fiscal year, significant additions in governmental activities included $7.1
million for purchase of seven parcels of land to be developed as passive parks, and acquisition
of historical land and building; $15.06 million of various construction in progress, and $5.14
million in machinery and equipment. Significant additions for business-type activities included
$1.60 million in construction in progress relating to rehabilitation and improvements of various
pump stations and $925,000 in machinery and equipment.

CITY OF CORAL GABLES, FLORIDA – COMPREHENSIVE ANNUAL FINANCIAL REPORT – FISCAL YEAR ENDED SEPTEMBER 30, 2016
15
Table A-3
Capital Assets (In millions of dollars)
2016 2015 2016 2015 2016 2015
Land $ 52.52 $ 45.41 $ 3.70 $ 3.70 $ 56.22 $ 49.11
Construction in Progress 17.84 13.05 4.62 3.02 22.46 16.07
Infrastructure 113.07 113.07 27.32 27.32 140.39 140.39
Building 67.91 63.64 30.25 30.25 98.16 93.89
Improvements Other Than Buildings 50.09 49.79 0.63 0.61 50.72 50.40
Machinery and Equipment 59.80 49.95 3.85 2.93 63.65 52.88
Total Capital Assets 361.23 334.91 70.37 67.83 431.60 402.74
Accumulated Depreciation 162.39 154.85 26.43 25.07 188.82 179.92
Net Capital Assets $ 198.84 $ 180.06 $ 43.94 $ 42.76 $242.78 $222.82
Total
Governmental
Activities
Business-Type
Activities
Additional information on the City’s capital assets can be found in Note 5 of this report.
Debt Administration
The City has received a “AAA” issuer credit rating from Standard & Poor's Corporation and a
“Aaa” long term issuer rating from Moody’s Investors Service. The City has no general
obligation bonds outstanding as of September 30, 2016.
The City has utilized the Sunshine State Governmental Financing Commission (the
“Commission”) since 1987 as its primary funding source to finance the acquisition and
construction of City facilities. The Commission was created in November 1985 to provide a
limited number of qualifying governments the ability to participate in pooled debt financings
with pricing and cost structures not normally available to governmental entities acting
individually. The loans issued from the Commission are the obligation and debt of the
individually participating city. There are twelve cities and three counties in Florida that are
members of the Commission.
The City’s total outstanding Sunshine State Governmental Financing Commission principal
debt outstanding as of September 30, 2016 was $96.92 million. Financing is provided by a
general pledge of resources other than property taxes and the amount needed is transferred from
other funds. In addition, the Capital Improvement Revenue Bonds Series 2016A, and Series
2016B are also secured by special assessment imposed on benefited property owners.
Additional long-term liabilities include compensated absences payable, pollution remediation
obligation, net OPEB obligation, estimated claims liabilities related to the City’s self-insurance
programs, and net pension liability. The City’s General Fund is primarily utilized for the
payment of these liabilities for the governmental activities. Overall, long-term liabilities
increased by $38.34 million. This increase is due primarily to the net effect of the following:
increase in net pension liability of $16.31 million, increase in OPEB obligation of $1.16 million,
issuance of new special revenue bonds of $23.8 million and debt service payments of $4.7; and
increase in estimated insurance claims of $2.09 million.
CITY OF CORAL GABLES, FLORIDA – COMPREHENSIVE ANNUAL FINANCIAL REPORT – FISCAL YEAR ENDED SEPTEMBER 30, 2016
16
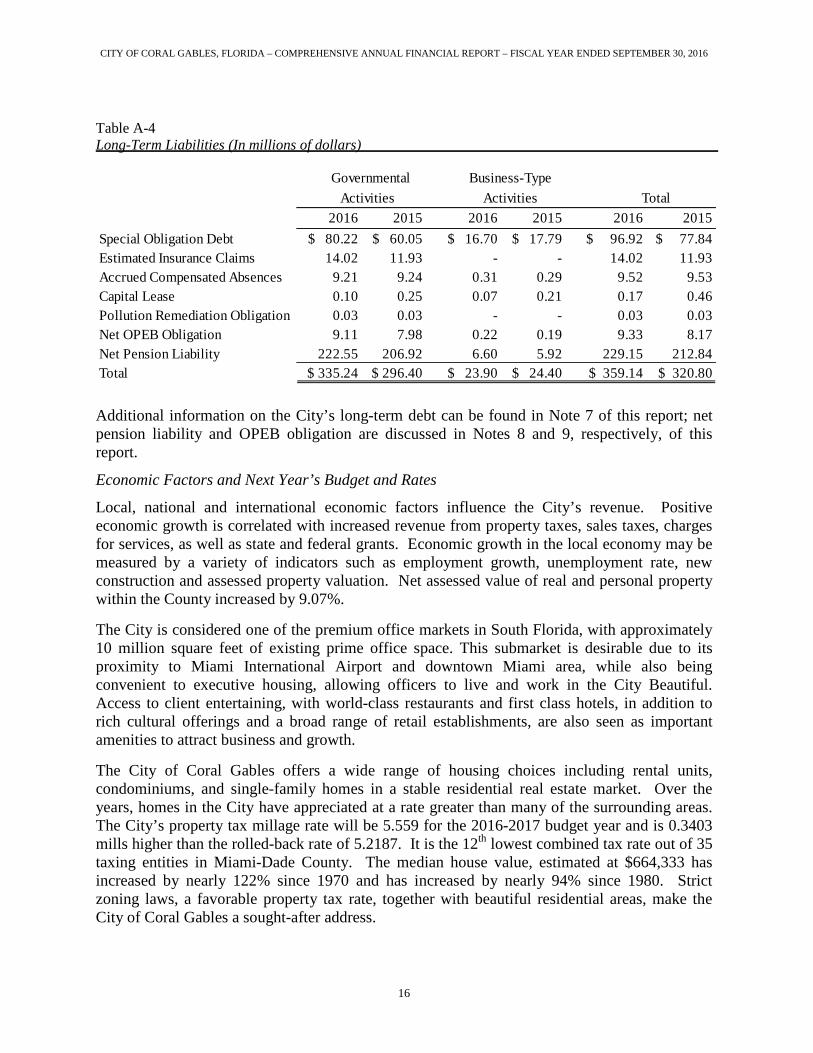
Table A-4
Long-Term Liabilities (In millions of dollars)
2016 2015 2016 2015 2016 2015
Special Obligation Debt $ 80.22 $ 60.05 $ 16.70 $ 17.79 $ 96.92 $ 77.84
Estimated Insurance Claims 14.02 11.93 - - 14.02 11.93
Accrued Compensated Absences 9.21 9.24 0.31 0.29 9.52 9.53
Capital Lease 0.10 0.25 0.07 0.21 0.17 0.46
Pollution Remediation Obligation 0.03 0.03 - - 0.03 0.03
Net OPEB Obligation 9.11 7.98 0.22 0.19 9.33 8.17
Net Pension Liability 222.55 206.92 6.60 5.92 229.15 212.84
Total $ 335.24 $ 296.40 $ 23.90 $ 24.40 $ 359.14 $ 320.80
Activities Total
Governmental
Activities
Business-Type
Additional information on the City’s long-term debt can be found in Note 7 of this report; net
pension liability and OPEB obligation are discussed in Notes 8 and 9, respectively, of this
report.
Economic Factors and Next Year’s Budget and Rates
Local, national and international economic factors influence the City’s revenue. Positive
economic growth is correlated with increased revenue from property taxes, sales taxes, charges
for services, as well as state and federal grants. Economic growth in the local economy may be
measured by a variety of indicators such as employment growth, unemployment rate, new
construction and assessed property valuation. Net assessed value of real and personal property
within the County increased by 9.07%.
The City is considered one of the premium office markets in South Florida, with approximately
10 million square feet of existing prime office space. This submarket is desirable due to its
proximity to Miami International Airport and downtown Miami area, while also being
convenient to executive housing, allowing officers to live and work in the City Beautiful.
Access to client entertaining, with world-class restaurants and first class hotels, in addition to
rich cultural offerings and a broad range of retail establishments, are also seen as important
amenities to attract business and growth.
The City of Coral Gables offers a wide range of housing choices including rental units,
condominiums, and single-family homes in a stable residential real estate market. Over the
years, homes in the City have appreciated at a rate greater than many of the surrounding areas.
The City’s property tax millage rate will be 5.559 for the 2016-2017 budget year and is 0.3403
mills higher than the rolled-back rate of 5.2187. It is the 12th
lowest combined tax rate out of 35
taxing entities in Miami-Dade County. The median house value, estimated at $664,333 has
increased by nearly 122% since 1970 and has increased by nearly 94% since 1980. Strict
zoning laws, a favorable property tax rate, together with beautiful residential areas, make the
City of Coral Gables a sought-after address.

CITY OF CORAL GABLES, FLORIDA – COMPREHENSIVE ANNUAL FINANCIAL REPORT – FISCAL YEAR ENDED SEPTEMBER 30, 2016
17
Requests for Information
This financial report is designed to provide a general overview of the City’s finances for all
those with an interest in the City’s finances. Questions concerning any of the information
provided in this report or requests for additional information should be addressed to the City’s
Finance Director, 405 Biltmore Way, Coral Gables, Florida 33134.

[ This Page Intentionally Left Blank ]
18

Basic Financial Statements
Government-Wide Financial Statements
Fund Financial Statements
Notes to the Financial Statements
19

CITY OF CORAL GABLES, FLORIDA - COMPREHENSIVE ANNUAL FINANCIAL REPORT - FISCAL YEAR ENDED SEPTEMBER 30, 2016
Governmental Business-Type
Activities Activities Total
ASSETS
Cash and Cash Equivalents 54,427,629$ 3,837,385$ 58,265,014$
Restricted Cash and Cash Equivalents 10,398,606 641,409 11,040,015
Investments 83,433,459 10,423,401 93,856,860
Restricted Investments 32,566,624 3,065,245 35,631,869
Accounts Receivable, Net 16,825,457 2,486,570 19,312,027
Interest Receivable 136,750 19,425 156,175
Assessment Liens Receivable 8,234,812 69,696 8,304,508
Internal Balances (1,390,994) 1,390,994 -
Due from Other Governments 2,274,988 408,741 2,683,729
Inventory 57,730 - 57,730
Prepaid and Deposits 2,171,298 18,725 2,190,023
Capital Assets Not Being Depreciated:
Land 52,521,947 3,701,838 56,223,785
Construction in Progress 17,841,292 4,615,650 22,456,942
Capital Assets, Net of Accumulated Depreciation:
Infrastructure 31,447,653 15,865,779 47,313,432
Buildings 43,633,608 18,158,124 61,791,732
Improvements Other Than Buildings 34,232,858 202,121 34,434,979
Machinery and Equipment 19,171,459 1,394,866 20,566,325
Total Assets 407,985,176 66,299,969 474,285,145
DEFERRED OUTFLOWS OF RESOURCES
Deferred Charge on Refunding 200,491 134,194 334,685
Deferred Outflows Related to Pension 47,839,827 1,418,644 49,258,471
Total Deferred Outflows of Resources 48,040,318 1,552,838 49,593,156
LIABILITIES
Accounts Payable 11,876,204 1,969,165 13,845,369
Accrued Payroll 2,449,797 152,071 2,601,868
Unearned Revenue 6,587,120 284,595 6,871,715
Due to Other Governments 244,428 - 244,428
Deposits Payable 4,099,133 286,745 4,385,878
Noncurrent Liabilities:
Due Within One Year 14,981,799 1,318,154 16,299,953
Due In More Than One Year 320,257,483 22,578,770 342,836,253
Total Liabilities 360,495,964 26,589,500 387,085,464
DEFERRED INFLOWS OF RESOURCES
Revenues Received in Advance 2,968,169 - 2,968,169
Deferred Inflows Related to Pension 3,196,019 94,775 3,290,794
Total Deferred Inflows of Resources 6,164,188 94,775 6,258,963
NET POSITION
Net Investment in Capital Assets 135,571,942 29,433,426 165,005,368
Restricted for:
Debt Service 2,782,052 - 2,782,052
Public Safety 3,150,674 - 3,150,674
Streetscape Assessment Projects 9,210,328 - 9,210,328
Capital Improvements 4,079,507 354,664 4,434,171
Law Enforcement 2,364,205 - 2,364,205
Public and Historic Art 1,372,363 - 1,372,363
Records Management 833,084 - 833,084
Unrestricted (69,998,813) 11,380,442 (58,618,371)
Total Net Position 89,365,342$ 41,168,532$ 130,533,874$
The notes to the financial statements are an integral part of this statement.
CITY OF CORAL GABLES, FLORIDASTATEMENT OF NET POSITION
September 30, 2016
20

CITY OF CORAL GABLES, FLORIDA - COMPREHENSIVE ANNUAL FINANCIAL REPORT - FISCAL YEAR ENDED SEPTEMBER 30, 2016
Operating Capital
Charges for Grants and Grants and Governmental Business-type
FUNCTION/PROGRAM Expenses Services Contributions Contributions Activities Activities Total
Governmental Activities:
General Government 24,813,095$ 24,430,334$ -$ -$ (382,761)$ -$ (382,761)$
Public Safety 74,351,854 6,211,081 17,216 62,078 (68,061,479) - (68,061,479)
Physical Environment 18,909,774 8,472,957 60,338 875,877 (9,500,602) - (9,500,602)
Transportation 6,328,566 - 106,754 - (6,221,812) - (6,221,812)
Economic Environment 911,210 670,000 - - (241,210) - (241,210)
Culture and Recreation 12,878,923 5,362,407 - - (7,516,516) - (7,516,516)
Interest on Long-term Debt 1,312,000 - - - (1,312,000) - (1,312,000)
Total Governmental Activities 139,505,422 45,146,779 184,308 937,955 (93,236,380) - (93,236,380)
Business-type Activities:
Sanitary Sewer System 9,242,508 9,429,516 - 429,977 - 616,985 616,985
Parking System 7,117,985 12,982,960 - - - 5,864,975 5,864,975
Stormwater Utility 2,165,850 3,212,526 - - - 1,046,676 1,046,676
Total Business-type Activities 18,526,343 25,625,002 - 429,977 - 7,528,636 7,528,636
Total 158,031,765$ 70,771,781$ 184,308$ 1,367,932$ (93,236,380) 7,528,636 (85,707,744)
General Revenues:
Taxes:
Property Taxes 71,447,141 - 71,447,141
Franchise Fees 6,859,844 - 6,859,844
Utilities Service Taxes 11,423,512 - 11,423,512
Other Taxes 3,103,387 - 3,103,387
Intergovernmental, not restricted for specific programs 5,189,453 - 5,189,453
Investment Earnings 804,623 119,408 924,031
Miscellaneous 390,552 - 390,552
Transfers 8,086,399 (8,086,399) -
Total General Revenues and Transfers 107,304,911 (7,966,991) 99,337,920
Change in Net Position 14,068,531 (438,355) 13,630,176
Net Position - Beginning 75,296,811 41,606,887 116,903,698
Net Position - Ending 89,365,342$ 41,168,532$ 130,533,874$
The notes to the financial statements are an integral part of this statement.
CITY OF CORAL GABLES, FLORIDASTATEMENT OF ACTIVITIES
For the Fiscal Year Ended September 30, 2016
Net (Expense) Revenue
Program Revenues and Changes in Net Position
21

[ This Page Intentionally Left Blank ]
22
Major Governmental Funds
General Fund - to account for all financial resources that relate to the
general operations of the City, except for those required to be accounted for
in another fund.
Debt Service Fund – to account for and report the financial resources that
are restricted, committed, or assigned for the periodic payment of principal,
interest, and expenditures on special obligation long-term debt of
governmental funds, specifically, Sunshine State Notes issued by the City for
various capital projects
Capital Project General Improvement Fund - to account for and report the
financial resources that are restricted, committed, or assigned for the
acquisition or construction of various major capital improvements except
those financed by enterprise funds.
23

CITY OF CORAL GABLES, FLORIDA - COMPREHENSIVE ANNUAL FINANCIAL REPORT - FISCAL YEAR ENDED SEPTEMBER 30, 2016
Nonmajor Funds
Capital Project
General Other Total
General Debt Service Improvement Governmental Governmental
Fund Fund Fund Funds Funds
ASSETS
Pooled Cash and Cash Equivalents 19,591,186$ -$ 21,364,317$ 1,711,253$ 42,666,756$
Restricted Cash and Cash Equivalents - 3,058,907 453,324 6,886,375 10,398,606
Pooled Investments 44,618,692 - 21,045,801 2,366,729 68,031,222
Restricted Investments 8,687,485 777,204 18,337,578 4,764,357 32,566,624
Accounts Receivable, Net 16,563,878 11,000 64,401 166,915 16,806,194
Interest Receivable 55,781 1,256 44,250 10,890 112,177
Streetscape Projects Assessment Liens Receivable - 8,144,819 - - 8,144,819
Other Liens Receivable 87,526 2,467 - - 89,993
Due from Other Funds 165,000 - - - 165,000
Due from Other Governments 869,533 - 14,018 1,391,437 2,274,988
Prepaid and Deposits 75,288 - 1,000 22,223 98,511
Total Assets 90,714,369 11,995,653 61,324,689 17,320,179 181,354,890
LIABILITIES
Accounts Payable 3,567,417 1,066,315 4,505,388 1,368,835 10,507,955
Accrued Payroll 2,339,278 - - 5,391 2,344,669
Due to Other Funds - - - 165,000 165,000
Unearned Revenue 6,560,320 - 26,800 - 6,587,120
Refundable Deposits 4,099,133 - - - 4,099,133
Due to Other Governments 244,428 - - - 244,428
Total Liabilities 16,810,576 1,066,315 4,532,188 1,539,226 23,948,305
DEFERRED INFLOWS OF RESOURCES
Unavailable Revenue 13,295,372 8,147,286 78,387 826,361 22,347,406
Revenues Received in Advance 2,968,169 - - - 2,968,169
Total Deferred Inflow of Resources 16,263,541 8,147,286 78,387 826,361 25,315,575
FUND BALANCES
Nonspendable:
Prepaid Items 75,288 - 1,000 22,223 98,511
Restricted to:
Law Enforcement 2,364,205 - - - 2,364,205
Public and Historic Art 1,372,363 - 99,173 - 1,471,536
Records Management 833,084 - - - 833,084
Public Safety Communication System - - 453,324 - 453,324
Debt Service Reserve - 2,782,052 - - 2,782,052
Police and Fire System Improvements - - - 3,150,674 3,150,674
Parks System Improvements - - - 4,062,693 4,062,693
Entraces/Circles/Fountains - - - 1,744,077 1,744,077
Miracle Mile/Giralda Streetscape Project - - 18,140,169 - 18,140,169
Other Physical Environment 18,700 - 98,236 2,182,498 2,299,434
Impact Fee Administration - - - 62,508 62,508
Assigned to:
Administration Buildings and Equipment - - 2,213,991 - 2,213,991
Pension Stabilization 2,000,000 - - - 2,000,000
Historical Preservation 67,277 - - - 67,277
Roads and Streets - - 1,223,502 - 1,223,502
Other Public Safety Projects 76,173 - 11,034,896 - 11,111,069
Other Parks and Recreation Projects - - 8,116,675 - 8,116,675
Other Physical Environment - - 405,616 - 405,616
Other Capital Projects - - 7,521,614 4,124,753 11,646,367
Other Purposes 9,204,205 - 7,405,918 - 16,610,123
Unassigned 41,628,957 - - (394,834) 41,234,123
Total Fund Balances 57,640,252 2,782,052 56,714,114 14,954,592 132,091,010 Total Liabilities, Deferred Inflows of Resources
and Fund Balances 90,714,369$ 11,995,653$ 61,324,689$ 17,320,179$ 181,354,890$
The notes to the financial statements are an integral part of this statement.
CITY OF CORAL GABLES, FLORIDABALANCE SHEET
GOVERNMENTAL FUNDS
September 30, 2016
Major Funds
24

CITY OF CORAL GABLES, FLORIDA- COMPREHENSIVE ANNUAL FINANCIAL REPORT - FISCAL YEAR ENDED SEPTEMBER 30, 2016
Total Fund Balances - Governmental Funds 132,091,010$
Amounts reported for governmental activities in the statement of net position are different because:
Capital assets used in governmental activities are not financial resources and therefore are not
reported in the governmental funds. 191,476,695
Other long-term assets are not available to pay current period expenditures and,
therefore, are reported as unavailable revenue in the governmental funds. 22,347,406
Internal service funds are used by management to charge the costs of certain activities such as
insurance and fleet management to individual funds. The assets and liabilities of the internal
service funds are included in governmental activities in the statement of net position. 14,627,803
(1,390,994)
Long-term liabilities are not due and payable in the current period and therefore are not
reported in the governmental funds.
Compensated Absences $ (8,860,578)
Special Obligations Debt Payable (78,435,243)
Premium on Special Obligation Debt Issued (1,788,626)
Deferred Charge on Bond Refunding 200,491
Capital Lease Payable (97,740)
Pollution Remediation Obligation (25,000)
Net OPEB Obligation (8,861,483)
Net Pension Liability (215,059,064) (312,927,243)
Deferred inflows/outflows of resources in the Statement of Net Position
will be recognized in future periods.
Deferred Outflows of Resources Related to Pension 46,229,075
Deferred Inflows of Resources Related to Pension (3,088,410) 43,140,665
Total Net Position - Governmental Activities 89,365,342$
The notes to the financial statements are an integral part of this statement.
CITY OF CORAL GABLES, FLORIDARECONCILIATION OF THE GOVERNMENTAL FUNDS BALANCE SHEET -
TO THE STATEMENT OF NET POSITION
September 30, 2016
The Statement of Net Position includes an adjustment to reflect an allocation of the internal
service funds income to business-type activities. This adjustment decreases the Internal
Balances account of governmental activities.
25

CITY OF CORAL GABLES, FLORIDA - COMPREHENSIVE ANNUAL FINANCIAL REPORT - FISCAL YEAR ENDED SEPTEMBER 30, 2016
Nonmajor
Funds
Capital Project
General Other Total
General Debt Service Improvement Governmental Governmental
Fund Fund Fund Funds Funds
REVENUES
Taxes 89,730,497$ -$ -$ 2,941,042$ 92,671,539$
Licenses 3,496,840 - - - 3,496,840
Permits 9,007,729 - - - 9,007,729
Fines and Forfeitures 2,552,563 - - - 2,552,563
Intergovernmental 5,329,086 - 8,817 494,107 5,832,010
Charges for Services 19,393,779 - - - 19,393,779
Recreation Activity Fees 4,575,172 - - - 4,575,172
Rental Income 5,833,825 - - 29,032 5,862,857
Investment Earnings 443,236 7,184 244,336 109,867 804,623
Special Assessments - 33,719 29,657 1,602,180 1,665,556
Contributions and Donations 70,500 - - - 70,500
Miscellaneous 390,552 - - - 390,552
Total Revenues 140,823,779 40,903 282,810 5,176,228 146,323,720
EXPENDITURES
Current:
General Government 20,764,296 - 906,154 48,786 21,719,236
Public Safety 75,065,555 - 485,448 - 75,551,003
Physical Environment 18,791,023 - 183,230 - 18,974,253
Transportation 2,964,063 - 294,100 3,282,726 6,540,889
Economic Environment 936,939 - 10,180 - 947,119
Culture and Recreation 9,545,041 - 1,384,898 1,290,284 12,220,223
Debt Service:
Retirement of Principal 156,950 3,624,492 - - 3,781,442
Interest 803 1,802,632 - - 1,803,435
Capital Outlay 994,674 - 13,886,704 9,752,082 24,633,460
Total Expenditures 129,219,344 5,427,124 17,150,714 14,373,878 166,171,060
Excess (deficiency) of Revenues Over (Under)
Expenditures before Other Financing Sources (Uses) 11,604,435 (5,386,221) (16,867,904) (9,197,650) (19,847,340)
OTHER FINANCING SOURCES (Uses)
Special Revenue Bonds Issued - - 22,005,000 - 22,005,000
Premium on Special Revenue Bonds Issued - - 1,788,626 - 1,788,626
Transfers In 9,422,325 6,487,428 8,110,973 544,491 24,565,217
Transfers Out (16,126,431) - (540,161) - (16,666,592)
Total Other Financing Sources (Uses) (6,704,106) 6,487,428 31,364,438 544,491 31,692,251
Net Change in Fund Balances 4,900,329 1,101,207 14,496,534 (8,653,159) 11,844,911
Fund Balances - Beginning 52,739,923 1,680,845 42,217,580 23,607,751 120,246,099
Fund Balances - Ending 57,640,252$ 2,782,052$ 56,714,114$ 14,954,592$ 132,091,010$
The notes to the financial statements are an integral part of this statement.
CITY OF CORAL GABLES, FLORIDASTATEMENT OF REVENUES, EXPENDITURES AND CHANGES IN FUND BALANCES
GOVERNMENTAL FUNDS
For the Fiscal Year Ended September 30, 2016
Major
Funds
26

CITY OF CORAL GABLES, FLORIDA - COMPREHENSIVE ANNUAL FINANCIAL REPORT - FISCAL YEAR ENDED SEPTEMBER 30, 2016
Net Change in Fund Balances - Total Governmental Funds 11,844,911$
Amounts reported for governmental activities in the statement of activities are different because:
Governmental funds report capital outlays as expenditures. However, in the statement of activities,
the cost of those assets is allocated over their estimated useful lives as depreciation expense. This
is the amount by which capital outlay expense exceeded depreciation expense and net disposal
of assets in the current period.
Depreciation Expense (6,750,977)$
Capital Outlay 24,633,460
Capitalized Interest 491,435 18,373,918
Revenues recognized in the statement of activities which are not available are not recognized in
the governmental funds.
Change in unavailable revenues (836,166) (836,166)
Debt issued provides current financial resources to governmental funds, but issuing debt
increases long-term liabilities in the statement of net position. Repayment of bond principal
is an expenditure in the governmental funds, but reduces long-term liabilities
in the statement of net position. This is the amount by which repayment exceeded the
amount issued in the current period.
Loan Repayments 3,781,442
Debt Proceeds (23,793,626) (20,012,184)
15,961
Expenses in the statement of activities that do not require the use of current financial resources
are not reported in the government funds.
9,257
Net OPEB Obligation (1,097,276)
(31,351) (1,119,370)
Governmental funds report pension contributions as expenditures. However, in the
Statement of Activities, the cost of pension benefits earned net of employee
contributions is reported as pension expense.
Pension Contributions 26,206,884
(20,405,423) 5,801,461
Change in Net Position of Governmental Activities 14,068,531$
The notes to the financial statements are an integral part of this statement.
CITY OF CORAL GABLES, FLORIDARECONCILIATION OF THE STATEMENT OF REVENUES, EXPENDITURES,
AND CHANGES IN FUND BALANCES - GOVERNMENTAL FUNDS
TO THE STATEMENT OF ACTIVITIES
For the Fiscal Year Ended September 30, 2015
Cost of benefits earned net of
employee contributions
Amortization of Deferred
Charge on Refunding
The amount of the internal service fund's income on transactions with business-type activities was
eliminated from the governmental activities in the statement of activities.
Compensated Absences
27

[ This Page Intentionally Left Blank ]
28

Major Proprietary Funds
Sanitary Sewer System Fund - accounts for the operation and maintenance of a sanitary
sewer collection system providing services to certain residents of the City, the University of
Miami and certain non-resident sewer connections in areas adjacent to the City. All activities
necessary to provide these services are accounted for in this fund.
Parking System Fund - accounts for the operation of on-street and off-street automobile
parking facilities, including five parking garages, to the residents, merchants, and visitors of
the City. All activities necessary to provide such services are accounted for in this fund,
including, but not limited to, administration, operations, construction maintenance and
financing.
Non-major Proprietary Fund
Stormwater Utility Fund - accounts for the operation and maintenance of a storm water
collection system providing services to all residents, and commercial properties of the City.
All activities necessary to provide these services are accounted for in this fund.
29

CITY OF CORAL GABLES, FLORIDA - COMPREHENSIVE ANNUAL FINANCIAL REPORT - FISCAL YEAR ENDED SEPTEMBER 30, 2016
NONMAJOR
FUND GOVERNMENTAL
SANITARY ACTIVITIES -
SEWER PARKING STORMWATER INTERNAL
SYSTEM SYSTEM UTILITY SERVICE
FUND FUND FUND TOTALS FUNDS
ASSETS
Current Assets:
Pooled Cash and Cash Equivalents 1,840,856$ 1,202,178$ 794,351$ 3,837,385$ 11,760,873$
Restricted Cash and Cash Equivalents 354,664 286,745 - 641,409 -
Pooled Investments 3,152,635 5,127,032 2,143,734 10,423,401 15,402,237
Restricted Investments 3,065,245 - - 3,065,245 -
Accounts Receivable, Net 1,350,303 539,845 596,422 2,486,570 19,263
Interest Receivable 8,583 7,911 2,931 19,425 24,573
Inventories - - - - 57,730
Assessment Liens Receivable 69,696 - - 69,696 -
Due from Other Governments 400,000 - 8,741 408,741 -
Prepaid and Deposits - 18,725 - 18,725 2,072,787
Total Current Assets 10,241,982 7,182,436 3,546,179 20,970,597 29,337,463
Noncurrent Assets:
Capital Assets:
Land 97,980 3,603,858 - 3,701,838 -
Buildings - 30,247,473 - 30,247,473 -
Construction in Progress 3,425,632 208,526 981,492 4,615,650 40,231
Infrastructure 23,222,793 - 4,099,341 27,322,134 -
Improvements Other Than Buildings - 632,256 - 632,256 -
Machinery and Equipment 556,963 3,256,143 37,572 3,850,678 30,849,746
Accumulated Depreciation (10,735,710) (14,505,225) (1,190,716) (26,431,651) (23,517,855)
Total Noncurrent Assets 16,567,658 23,443,031 3,927,689 43,938,378 7,372,122
Total Assets 26,809,640 30,625,467 7,473,868 64,908,975 36,709,585
DEFERRED OUTFLOWS OF RESOURCES
Deferred Charge on Refunding - 134,194 - 134,194 -
Deferred Outflows Related to Pensions 467,955 620,657 330,032 1,418,644 1,610,752
Total Deferred Outflows of Resources 467,955 754,851 330,032 1,552,838 1,610,752
LIABILITIES
Current Liabilities:
Accounts Payable 1,038,775 807,129 123,261 1,969,165 1,368,249
Accrued Payroll and Other Expenses 72,232 36,504 43,335 152,071 105,128
Deposits Payable - 286,745 - 286,745 -
Unearned Revenue - 284,595 - 284,595 -
Accrued Compensated Absences 53,959 84,844 43,935 182,738 199,665
Estimated Liability for Claims Payable - - - - 6,092,000
Special Obligations Debt Payable 345,000 656,760 101,916 1,103,676 -
Capital Lease Payable - 31,740 - 31,740 -
Total Current Liabilities 1,509,966 2,188,317 312,447 4,010,730 7,765,042
Noncurrent Liabilities:
Accrued Compensated Absences 21,569 64,890 35,971 122,430 153,753
Estimated Liability for Claims Payable - - - - 7,930,000
Special Obligations Debt Payable 3,090,000 10,813,612 1,697,469 15,601,081 -
Capital Lease Payable - 40,575 - 40,575 -
Net OPEB Obligation 62,451 104,084 48,573 215,108 242,863
Net Pension Liability 2,176,943 2,887,315 1,535,318 6,599,576 7,493,267
Total Noncurrent Liabilities 5,350,963 13,910,476 3,317,331 22,578,770 15,819,883
Total Liabilities 6,860,929 16,098,793 3,629,778 26,589,500 23,584,925
DEFERRED INFLOWS OF RESOURCES
Deferred Inflows Related to Pensions 31,263 41,464 22,048 94,775 107,609
Total Deferred Inflows of Resources 31,263 41,464 22,048 94,775 107,609
NET POSITION
Net Investment in Capital Assets 15,771,033 11,582,578 2,079,815 29,433,426 7,372,122
Restricted for Capital Improvements 354,664 - - 354,664 -
Unrestricted 4,259,706 3,657,483 2,072,259 9,989,448 7,255,681
Total Net Position 20,385,403$ 15,240,061$ 4,152,074$ 39,777,538 14,627,803$
Adjustment to reflect the allocation of internal service fund activities related to enterprise funds. 1,390,994
Net position of business-type activities 41,168,532$
The notes to the financial statements are an integral part of this statement.
CITY OF CORAL GABLES, FLORIDASTATEMENT OF NET POSITION
PROPRIETARY FUNDS
September 30, 2016
BUSINESS -TYPE ACTIVITIES-ENTERPRISE FUNDS
MAJOR FUNDS
30

CITY OF CORAL GABLES, FLORIDA - COMPREHENSIVE ANNUAL FINANCIAL REPORT - FISCAL YEAR ENDED SEPTEMBER 30, 2016
NONMAJOR
FUND GOVERNMENTAL
SANITARY ACTIVITIES -
SEWER PARKING STORMWATER INTERNAL
SYSTEM SYSTEM UTILITY SERVICE
FUND FUND FUND TOTALS FUNDS
OPERATING REVENUES
Charges for Services:
Sewer Use Charges 9,429,516$ -$ -$ 9,429,516$ -$
Service Use Charges - - 3,212,526 3,212,526 -
Billings to Departments for Insurance Protection - - - - 11,422,719
Parking Fees:
On Street Meters - 8,020,827 - 8,020,827 -
Meter and Permit Lots - 1,316,623 - 1,316,623 -
Parking Garages - 3,061,468 - 3,061,468 -
Parking Leases - 584,042 - 584,042 -
Rental of Equipment and Facilities to Various Funds - - - - 14,548,552
Total Operating Revenues 9,429,516 12,982,960 3,212,526 25,625,002 25,971,271
OPERATING EXPENSES
Administration 1,136,613 1,638,811 856,815 3,632,239 4,085,930
Cost of Sales and Services 7,661,220 4,332,460 1,171,639 13,165,319 7,450,907
Benefit Payments - - - - 5,099,911
Insurance - - - - 7,985,755
Depreciation 355,483 919,432 86,790 1,361,705 2,074,827
Total Operating Expenses 9,153,316 6,890,703 2,115,244 18,159,263 26,697,330
Operating Income 276,200 6,092,257 1,097,282 7,465,739 (726,059)
NONOPERATING REVENUES (EXPENSES)
Interest Income 51,976 48,999 18,433 119,408 151,915
Interest Expense (83,127) (219,940) (48,052) (351,119) -
Miscellaneous - - - - 94,530
Gain from Sale of Capital Assets - - - - 291,840
Total Nonoperating Revenues (Expenses) (31,151) (170,941) (29,619) (231,711) 538,285
Income Before Contributions 245,049 5,921,316 1,067,663 7,234,028 (187,774)
421,236 - 8,741 429,977 -
Income Before Transfers 666,285 5,921,316 1,076,404 7,664,005 (187,774)
Transfers In 70,584 - 14,673 85,257 1,523,700
Transfers Out (1,136,822) (6,713,051) (321,783) (8,171,656) (1,335,926)
Change In Net Position (399,953) (791,735) 769,294 (422,394) -
Net Position - Beginning 20,785,356 16,031,796 3,382,780 14,627,803
Net Positon - Ending 20,385,403$ 15,240,061$ 4,152,074$ 14,627,803$
Adjustment to reflect the allocation of internal service fund activities related to enterprise funds. (15,961)
Change in net position of business-type activities (438,355)$
The notes to the financial statements are an integral part of this statement.
Capital Contributions from Federal, State
and Local Grants
CITY OF CORAL GABLES, FLORIDASTATEMENT OF REVENUES, EXPENSES AND CHANGES IN NET POSITION
PROPRIETARY FUNDS
For the Fiscal Year Ended September 30, 2016
BUSINESS -TYPE ACTIVITIES-ENTERPRISE FUNDS
MAJOR FUNDS
31

CITY OF CORAL GABLES, FLORIDA - COMPREHENSIVE ANNUAL FINANCIAL REPORT - FISCAL YEAR ENDED SEPTEMBER 30, 2016
NONMAJOR
FUND GOVERNMENTAL
SANITARY ACTIVITIES -
SEWER PARKING STORMWATER INTERNAL
SYSTEM SYSTEM UTILITY SERVICE
FUND FUND FUND TOTALS FUNDS
CASH FLOWS FROM OPERATING ACTIVITIES
Receipts from Customers and Users 9,432,955$ 12,941,338$ 3,207,632$ 25,581,925$ 26,004,806$
Payments to Employees (1,160,312) (1,526,753) (866,542) (3,553,607) (3,950,640)
Payments to Suppliers (8,282,851) (4,133,882) (1,071,133) (13,487,866) (19,334,965)
Net Cash Provided by (used in) Operating Activities (10,208) 7,280,703 1,269,957 8,540,452 2,719,201
CASH FLOWS FROM NONCAPITAL FINANCING ACTIVITIES
Transfers in from Other Funds 70,584 - - 70,584 1,523,700
Transfers out to Other Funds (1,136,822) (6,713,051) (307,110) (8,156,983) (1,335,926)
Net Cash Provided by (used in) Noncapital Financing Activities (1,066,238) (6,713,051) (307,110) (8,086,399) 187,774
CASH FLOWS FROM CAPITAL AND RELATED
FINANCING ACTIVITIES
Acquisition and Construction of Capital Assets (717,346) (1,039,054) (791,490) (2,547,890) (2,479,739)
Proceeds from Sale of Capital Assets - - - - 291,840
Contributions from Other Governments 485,000 - - 485,000 -
Principal Paid on Debt (335,000) (787,665) (100,128) (1,222,793) -
Interest Paid on Debt (83,127) (198,952) (48,052) (330,131) -
Net Cash Provided by (used in) Capital and Related Financing Activities (650,473) (2,025,671) (939,670) (3,615,814) (2,187,899)
CASH FLOWS PROVIDED BY INVESTING ACTIVITIES
Purchase of Investments (6,338,740) (5,618,078) (2,351,192) (14,308,010) (19,223,409)
Proceeds from Sale of Investments 5,763,162 4,836,268 1,893,612 12,493,042 19,417,279
Interest and Dividends Received 49,269 45,847 17,771 112,887 244,650
Net Cash Provided by (used in) Investing Activities (526,309) (735,963) (439,809) (1,702,081) 438,520
Net Increase (Decrease) in Cash and Cash Equivalents (2,253,228) (2,193,982) (416,632) (4,863,842) 1,157,596
Cash and Cash Equivalents - Beginning 4,448,748 3,682,905 1,210,983 9,342,636 10,603,277
Cash and Cash Equivalents - Ending 2,195,520$ 1,488,923$ 794,351$ 4,478,794$ 11,760,873$
Reconciliation to the statement of net position
Cash and Cash Equivalents 1,840,856$ 1,202,178$ 794,351$ 3,837,385$ 11,760,873$
Restricted Cash and Cash Equivalents 354,664 286,745 - 641,409 -
Total 2,195,520$ 1,488,923$ 794,351$ 4,478,794$ 11,760,873$
Reconciliation of operating income to net cash provided by
operating activities:
Operating Income (Loss) 276,200$ 6,092,257$ 1,097,282$ 7,465,739$ (726,059)$
Adjustments to Reconcile Operating Income to Net Cash
Provided by (Used in) Operating Activities:
Depreciation Expense 355,483 919,432 86,790 1,361,705 2,074,827
Pension Expense (33,888) 82,304 (21,760) 26,656 88,401
Change in Assets and Liabilities:
Accounts Receivable 3,439 (72,380) (4,894) (73,835) 33,535
Inventory - - - - 3,123
Prepaid and Deposits - (18,725) - (18,725) (800,541)
Accounts Payable (621,631) 217,303 100,506 (303,822) (94,974)
Deposits Payable - 8,211 - 8,211 -
Accrued Payroll and Other Expenses (766) 8,106 460 7,800 30,095
Accrued Compensated Absences 3,510 9,240 5,782 18,532 (12,157)
Unearned Revenues - 22,547 - 22,547 -
Claims Payable - - - - 2,094,000
Net OPEB Obligation 7,445 12,408 5,791 25,644 28,951
Total Adjustments (286,408) 1,188,446 172,675 1,074,713 3,445,260
Net Cash Provided by Operating Activities (10,208)$ 7,280,703$ 1,269,957$ 8,540,452$ 2,719,201$
Noncash Operating Activities:
Deferred Outflows Related to Pension 467,955$ 620,657$ 330,032$ 1,418,644$ 1,610,752$
Deferred Inflows Related to Pension (31,263) (41,464) (22,048) (94,775) (107,609)
Net Pension Liability (2,176,943) (2,887,315) (1,535,318) (6,599,576) (7,493,267)
The notes to the financial statements are an integral part of this statement.
BUSINESS -TYPE ACTIVITIES-ENTERPRISE FUNDS
CITY OF CORAL GABLES, FLORIDASTATEMENT OF CASH FLOWS
PROPRIETARY FUNDS
For the Fiscal Year Ended September 30, 2016
MAJOR FUNDS
32

CITY OF CORAL GABLES, FLORIDA - COMPREHENSIVE ANNUAL FINANCIAL REPORT - FISCAL YEAR ENDED SEPTEMBER 30, 2016
Pension
Trust Agency
Funds Funds
ASSETS
Cash and Cash Equivalents 10,127,085$ 2,530,047$
Receivables:
Accrued Interest and Dividends 296,900 -
Share Plan Contributions 271,268 -
Receivable for Securities Sold 1,924,870 -
Other Receivables 42,418 -
Total Receivables 2,535,456 -
Securities Lending Cash Collateral - Invested 43,613,878 -
Investments at Fair Value:
U.S. Government and Agency 17,507,028 -
Domestic Fixed Income Fund 2,593,987 -
Global fixed income 8,393,093 -
Corporate Bonds 15,530,070 -
Common Stocks 119,418,870 -
International Equity 51,483,515 -
Real Estate Investment Trust (REIT) 51,046,126 -
Alternative Investments 67,139,780 -
Guaranteed Investment Contract 9,564,092 -
Mutual Funds 9,760,046 -
Total Investments 352,436,607 -
Total Assets 408,713,026 2,530,047
LIABILITIES
Accounts Payable 333,644 -
Payable for Securities Purchased 949,467 -
Due to Coral Gables Retirement Fund 239,389 -
Obligations under Securities Lending 43,613,878 -
Deferred Compensation Payable - 556,775
Due to Other Governments - 1,973,272
Total Liabilities 45,136,378 2,530,047$
NET POSITION
Net Position Restricted for Pension Benefits 363,576,648$
The notes to the financial statements are an integral part of this statement.
CITY OF CORAL GABLES, FLORIDA
STATEMENT OF FIDUCIARY NET POSITION
FIDUCIARY FUNDS
September 30, 2016
33
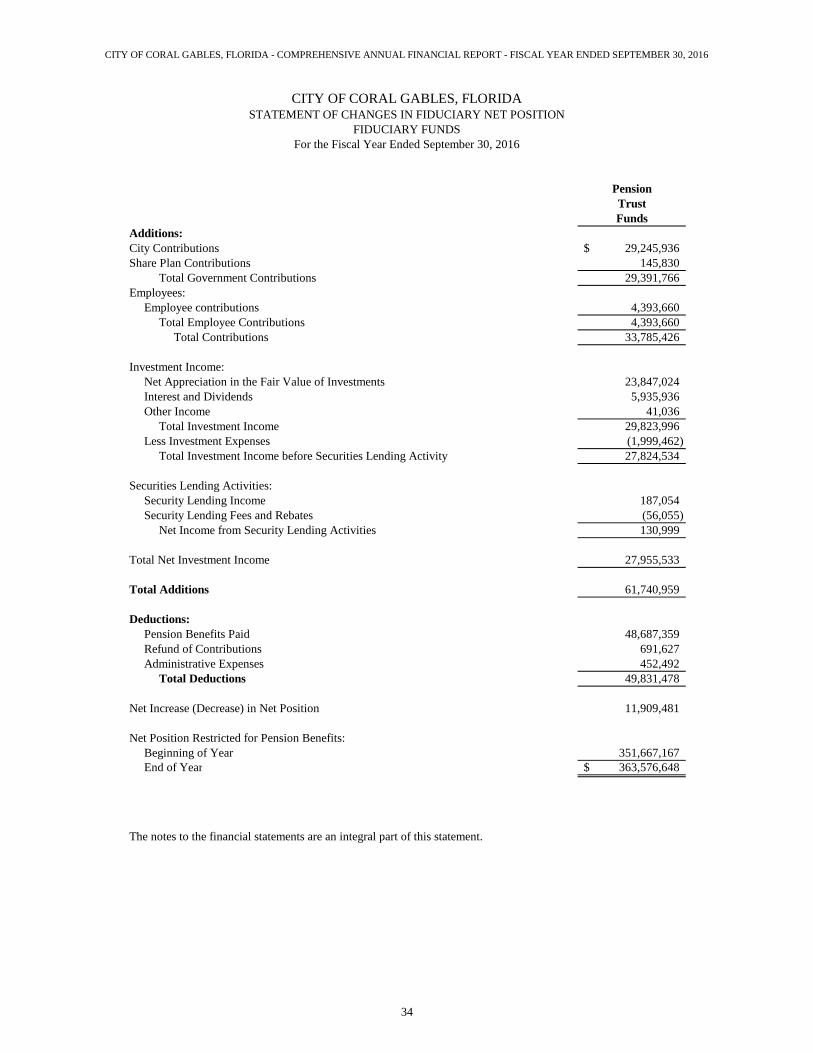
CITY OF CORAL GABLES, FLORIDA - COMPREHENSIVE ANNUAL FINANCIAL REPORT - FISCAL YEAR ENDED SEPTEMBER 30, 2016
Pension
Trust
Funds
Additions:
City Contributions 29,245,936$
Share Plan Contributions 145,830
Total Government Contributions 29,391,766
Employees:
Employee contributions 4,393,660
Total Employee Contributions 4,393,660
Total Contributions 33,785,426
Investment Income:
Net Appreciation in the Fair Value of Investments 23,847,024
Interest and Dividends 5,935,936
Other Income 41,036
Total Investment Income 29,823,996
Less Investment Expenses (1,999,462)
Total Investment Income before Securities Lending Activity 27,824,534
Securities Lending Activities:
Security Lending Income 187,054
Security Lending Fees and Rebates (56,055)
Net Income from Security Lending Activities 130,999
Total Net Investment Income 27,955,533
Total Additions 61,740,959
Deductions:
Pension Benefits Paid 48,687,359
Refund of Contributions 691,627
Administrative Expenses 452,492
Total Deductions 49,831,478
Net Increase (Decrease) in Net Position 11,909,481
Net Position Restricted for Pension Benefits:
Beginning of Year 351,667,167
End of Year 363,576,648$
The notes to the financial statements are an integral part of this statement.
CITY OF CORAL GABLES, FLORIDASTATEMENT OF CHANGES IN FIDUCIARY NET POSITION
FIDUCIARY FUNDS
For the Fiscal Year Ended September 30, 2016
34

CITY OF CORAL GABLES, FLORIDA - COMPREHENSIVE ANNUAL FINANCIAL REPORT - FISCAL YEAR ENDED SEPTEMBER 30, 2016
CITY OF CORAL GABLES, FLORIDA
NOTES TO FINANCIAL STATEMENTS
NOTE 1 - SUMMARY OF SIGNIFICANT ACCOUNTING POLICIES
The financial statements of the City of Coral Gables, Florida (the “City”) have been prepared in
conformity with Accounting Principles Generally Accepted in the United States of America (GAAP) as
applicable to governmental units. The Governmental Accounting Standards Board (GASB) is the
accepted standard-setting body for establishing governmental accounting and financial reporting
principles. The more significant of the City’s accounting policies are described below.
(a) Reporting Entity
The accompanying financial statements present the financial position, changes in financial position, and
cash flows of the applicable funds governed by the City Commission. For financial reporting purposes,
all funds, agencies, departments, and offices that make up the City’s legal entity and constitute its primary
government are included. The City of Coral Gables Health Facility Authority (Authority) is a related
organization because the City Commission has the responsibility of appointing the members of the
Authority’s Board. However, it is not included as a part of the financial reporting entity because it is
fiscally independent and it has no financial accountability to the City. The Authority is not exclusively
for the benefit of the City and the City Commission cannot impose its will over operations, cannot hire,
reassign or dismiss management, and cannot remove Authority Board members without cause. On
February 23, 2016, the City passed Ordinance 2016-12 approving to abolish the Coral Gables Health
Facility Authority. The City does not have any component units as defined by GASB Statement No. 61,
The Financial Reporting Entity: Omnibus - an amendment of GASB Statements No. 14 and No. 34.
(b) Government -Wide and Fund Financial Statements
The government-wide financial statements (the statement of net position and the statement of activities)
report information on all of the non-fiduciary activities of the City. As a basic rule, the government-wide
financial statements are consolidated. However, an exception must be made for inter-fund services
provided and used between functions. Elimination of these charges would distort the direct costs and
program revenues reported for the various functions concerned. Governmental activities, which normally
are supported by taxes and intergovernmental revenues, are reported separately from business-type
activities, which rely to a significant extent on fees and charges for support.
The statement of activities demonstrates the degree to which the direct expenses of a given function are
offset by program revenues. Direct expenses are those that are clearly identifiable with a specific
function. Program revenues include 1) charges to customers or applicants who purchase, use, or directly
benefit from goods, services, or privileges provided by a given function and 2) grants and contributions,
including special assessments, that are restricted to meeting the operational or capital requirements of a
particular function. Taxes and other items not included among program revenues are reported instead as
general revenues.
Separate financial statements are provided for governmental funds, proprietary funds, and fiduciary funds.
Major individual governmental and enterprise funds are reported as separate columns in the fund financial
statements.
Since the governmental fund financial statements are presented on a different measurement focus and
basis of accounting than the government-wide statements’ governmental activities column, a
35

CITY OF CORAL GABLES, FLORIDA - COMPREHENSIVE ANNUAL FINANCIAL REPORT - FISCAL YEAR ENDED SEPTEMBER 30, 2016
reconciliation is presented on the page following each statement, which briefly explains the adjustments
necessary to reconcile the governmental fund-based financial statements to the governmental activities
column of the government-wide presentation.
Internal Service Funds of a government (which traditionally provide services primarily to other funds of
the government) are presented in summary form as part of the proprietary fund financial statements. Since
the principal users of the internal services are the City’s governmental activities, financial statements of
internal service funds are included in the governmental activities column when presented at the
governmental-wide level. To the extent possible, the costs of these services are reflected in the
appropriate governmental activities.
The City’s fiduciary funds are presented in the fund financial statements by type. Since by definition,
these assets are being held for the benefit of a third party (other local governments, private parties,
pension participants, etc.) and cannot be used to address activities or obligations of the City, these funds
are excluded from the government-wide statements.
(c) Measurement Focus, Basis of Accounting, and Financial Statement Presentation
The government-wide financial statements are reported using the economic resources measurement focus
and the accrual basis of accounting, as are the proprietary and fiduciary fund financial statements.
Revenues are recognized when earned and expenses are recognized when incurred, regardless of the
timing of cash flows. Property taxes are recognized as revenues in the year for which they are levied.
Grants and similar items are recognized as revenue as soon as all eligibility requirements imposed by the
provider have been met. The financial statements of Agency Funds are prepared using the accrual basis
of accounting. Agency Funds are purely custodial and thus do not involve measurement of result of
operations. Plan member contributions are recognized in the period in which the contributions are due.
The City’s contributions are recognized when due and a formal commitment to provide the contributions
has been made. Benefits and refunds are recognized when due and payable in accordance with the terms
of the plan.
Governmental fund financial statements are reported using the current financial resources measurement
focus and the modified accrual basis of accounting. Revenues are recognized as soon as they are both
measurable and available. Revenues are considered to be available when they are collectible within three
months of the end of the fiscal year to be used to pay liabilities of the current period with the exception
of property tax revenue, which is deferred unless received within sixty days after year-end. Expenditures
generally are recorded when a liability is incurred, as under accrual accounting. However, debt service
expenditures, as well as expenditures related to compensated absences, pension, other post-employment
benefits, and claims and judgments, are recorded only when payment is due/liability mature.
Revenues considered measurable are recognized, if available, these include the following: Property
Taxes when levied for, Special Assessments, Garbage and Trash Fees, Franchise Taxes, Utility Service
Taxes, Intergovernmental when eligibility requirements are met, Charges for Services, Recreation
Activity, Rental Income, Occupational License, Interest Income, and Ambulance Transport Fees. Only
the portion of special assessments receivable due within the current fiscal period is considered to be
susceptible to accrual as revenue of the current period. All other revenue items are considered to be
measurable only when cash is received by the City.
36
CITY OF CORAL GABLES, FLORIDA - COMPREHENSIVE ANNUAL FINANCIAL REPORT - FISCAL YEAR ENDED SEPTEMBER 30, 2016
1) Governmental Fund Types
Governmental fund types are those funds through which most governmental functions typically are
financed. Governmental fund reporting focuses on the sources, uses, and balances of current financial
resources. Expendable assets are assigned to the various governmental funds according to the purposes
for which they may or must be used; current liabilities are assigned to the fund from which they are paid;
and the difference between governmental fund assets and liabilities, the fund equity, is referred to as
“fund balance”. The measurement focus is upon determination of changes in financial position, rather
than upon net income determination. The following comprise the City’s major governmental funds:
General Fund - The General Fund is the City’s primary operating fund. It accounts for all financial
resources that relate to the general operations of the City, except for those required to be accounted for in
another fund.
Debt Service Fund - is used to account for and report the financial resources that are restricted,
committed, or assigned for the periodic payment of principal, interest, and expenditures on special
obligation long-term debt of governmental funds, specifically, Sunshine State Notes issued by the City for
various capital projects.
Capital Project General Improvement Fund - is used to account for and report the financial resources
that are restricted, committed, or assigned for the acquisition or construction of various major capital
improvements except those financed by enterprise funds. This fund is reported as major fund because of
public interest and consistency.
Additionally, the City reports the following nonmajor governmental funds:
Capital Projects Funds - is used to account for and report the financial resources that are restricted,
committed, or assigned for the acquisition or construction of major capital facilities such as general and
roadway improvement projects; and public parks and plazas.
2) Proprietary Fund Types
Proprietary fund types are used to account for a government’s ongoing organizations and activities which
are similar to those often found in the private sector. The measurement focus is upon income
determination, financial position, and cash flows.
The City reports the following major proprietary funds:
Sanitary Sewer System Fund - This fund is used to account for the operation and maintenance of a
sanitary sewer collection system providing services to certain residents of the City, the University of
Miami and certain non-resident sewer connections in areas adjacent to the City.
Parking System Fund - This fund is used to account for the operation of on-street and off-street
automobile parking facilities, including five parking garages, to the residents, merchants, and visitors of
the City.
Additionally, the City reports the following nonmajor proprietary fund:
Stormwater Utility Fund - This fund is used to account for the operation and maintenance of a
stormwater collection system providing services to all residents of the City and all commercial properties.
37

CITY OF CORAL GABLES, FLORIDA - COMPREHENSIVE ANNUAL FINANCIAL REPORT - FISCAL YEAR ENDED SEPTEMBER 30, 2016
The City also reports the following funds:
Internal Service Funds - Internal Service Funds are used to account for fleet maintenance, general
maintenance (building maintenance, utilities and general housekeeping services) and insurance services
provided to other departments of the City on a cost reimbursement basis.
Pension Trust Funds - Pension Trust Funds are used to account for the accumulation of resources to be
used for retirement benefits of all employees at appropriate amounts and times in the future and for
supplemental retirement benefits for police officers and fire fighters, and, consequently, are not reflected
in the government-wide statements because the resources are not available to support the City’s own
programs.
Agency Funds - Agency Funds are custodial in nature and do not involve measurement of results of
operations:
Employee Benefits Fund - Accounts for the value of the employees’ excess sick leave balance which
is paid to the employees each year through deposits in this fund which the City handles as custodian
in accordance with the agreement between the City and its employees. The funds are to be paid to
employees upon retirement or to the employee’s named beneficiary upon death.
Law Enforcement Fund - Accounts for confiscated assets of the South Florida Money Laundering
Strike Force (Strike Force) which have been released by the judicial courts to be placed in the fund
which the City handles as custodian.
In the government-wide financial statements, amounts reported as program revenues include 1) charges to
customers or applicants for goods, services, or privileges provided, 2) operating grants and contributions
and 3) capital grants and contributions, including special assessments. Internally dedicated resources are
reported as general revenues rather than as program revenues. Likewise, general revenues include all
taxes.
(d) Cash and Cash Equivalents
The City maintains a cash and investment pool that is available for use by most funds. Each fund’s
portion of this pool is included in the financial statements as “Cash and Cash Equivalents”. Cash and
Cash Equivalents is defined to include cash on hand, demand deposits, cash with a state agency and
investments with private agencies with original maturities of three months or less. Interest earned on
pooled cash and investments is allocated monthly based on cash and investment balances of the respective
funds.
(e) Investments
The City’s investments are reported at fair value as defined by GASB Statement 72 except for the
position in the Local Government Surplus Funds Trust Fund. The investments held by Local Government
Surplus Fund Trust Fund are allocated among two funds, LGIP (formerly known as LGIP-A) and Fund B
(formerly known as LGIP-B). The value of the City’s investments in LGIP funds is the same as the value
of the pool shares and is recorded at amortized cost. At September 30, 2016, the City’s investment in
LGIP-A is $1,010 and there were no redemption fees or maximum transaction amounts, or any other
requirements that serve to limit the City’s daily access to 100 percent of the account value.
Investments for the pension plans are discussed in Notes 4 and 8.
38

CITY OF CORAL GABLES, FLORIDA - COMPREHENSIVE ANNUAL FINANCIAL REPORT - FISCAL YEAR ENDED SEPTEMBER 30, 2016
f) Receivables/Special Assessment Receivable
All receivables are reported net of an allowance for uncollectible amount. Receivables are analyzed for their
collectability based on the terms of the agreement and the financial assessment of the creditor.
Following are the significant components of the receivables due to the City at September 30, 2016:
1. Taxes, Franchise Fees, False Alarms and Rent – This amount represents communications and
utility taxes, franchise fees, false alarms and rent payments due by September 30, 2016, but not
collected as of that date;
2. Waste Fees, Ambulance Transport Fees – This amount represents the unpaid, billed charges for
various fines and municipal services.
3. University of Miami Development Agreement Fee – This amount represents the remaining balance
of the development agreement fee assessed to the University of Miami and is to be collected over the
remaining term of fourteen (14) years.
4. Donation to Coral Gables Museum – This amount represents the remaining balance of funds
pledged to the City through fiscal funding agreements with private institutions for the construction of
the Coral Gables Museum. The City has met the eligibility requirement of the funding agreement.
Special assessments primarily consists of amounts imposed by the City in accordance with City ordinance to
fund certain project costs of local improvements or the service cost of related services that provide a special
benefit to property based on logical relationship to the value, use, or characteristics of property identified.
(g) Due From Other Governments
Due from other governments primarily consists of amounts due to the City as of September 30, 2016 such as
ad valorem tax, grant revenues, fines and other fees.
(h) Inventories and Prepaid Items
Inventories are stated at cost using the weighted average method. Inventory is accounted for using the
consumption method whereby inventories are recorded as expenditures when they are used.
Prepaid items are accounted for using the consumption method and recorded as expenditures/expenses in
the fund level and government-wide financial statements in the period benefited.
(i) Capital Assets
Capital asset acquisitions are recorded as expenditures in the governmental fund financial statements and
include property, plant, equipment and infrastructure assets (i.e., streets, alleys, sidewalks, drainage and
lighting systems). Capital assets are recorded at historical cost in the government-wide and proprietary
fund financial statements. In the case of gifts or contributions, such assets are recorded at fair value at the
date of receipt. Capital assets are defined as assets with an initial, individual cost of more than $1,000
plus a useful life of more than one year.
The cost of normal maintenance and repairs that do not add to the value of the asset or materially extend
the life of the asset are not capitalized.
39

CITY OF CORAL GABLES, FLORIDA - COMPREHENSIVE ANNUAL FINANCIAL REPORT - FISCAL YEAR ENDED SEPTEMBER 30, 2016
Major outlays for capital assets and improvements are capitalized as projects are constructed. Interest
incurred during the construction phase of capital assets for business-type activities and proprietary funds
are included as part of the capitalized value of the assets constructed. Depreciation is provided over the
estimated useful lives of the respective assets using the straight-line method. The estimated useful lives
are as follows:
Asset Years
Buildings 50
Improvements other than Buildings 15-45
Machinery and Equipment 4-10
Infrastructure 15-80
Works of arts, historical treasures and similar assets acquired, donated or constructed by the City are not
capitalized. These collections of assets are held for public exhibition at the Coral Gables Museum, and or
installed at outdoor civic monuments, traffic circles and fountains.
(j) Accounts Payable and Accrued Payroll
Accounts payable consists primarily of amounts due to vendors and contractors for various operational and
capital purchases. Accrued payroll includes salaries and wages as well as related fringe benefits.
(k) Pensions
For purposes of measuring the net pension liability, deferred outflows of resources and deferred inflows
of resources related to pensions, and pension expense, information about the fiduciary net position of the
Coral Gables Retirement Fund (the “Plan”) and additions to/deductions from the Plan’s fiduciary net
position have been determined on the same basis as they are reported by Plan. For this purpose, benefit
payments (including refunds of employee contributions) are recognized when due and payable in
accordance with the benefit terms. Investments are reported at fair value.
(l) Long-Term Obligations
In the government-wide and the proprietary fund financial statements, long-term debt and other long-term
obligations are reported as liabilities in the governmental-wide and proprietary fund type Statements of
Net Position. Bonds payable are reported net of the applicable bond premiums or discounts. Bond
premiums and discounts are amortized over the life of the bonds using the effective interest method.
Deferred amounts (the difference between the reacquisition price and the net carrying amount) on
refunding are amortized over the shorter of the remaining life of the old debt or the life of the new debt
using the straight-line method, which does not result in a material difference from the effective interest
method. Debt issuance costs, except for the portion which relates to prepaid insurance costs, are
recognized as an expense in the period incurred. Prepaid insurance costs are reported as an asset and are
recognized as expense on a straight line basis over the duration of the related debt.
In the fund financial statements, governmental fund types recognize as applicable, bond premiums and
discounts, as well as bond issuance costs. The face amount of debt issued is reported as other financing
sources. Premiums received on debt issuances are reported as other financing sources while discounts on
debt issuances are reported as other financing uses. Issuance costs, whether or not withheld from the
actual debt proceeds received, are reported as debt service expenditures. Payment of debt principal and
interest is reported as an expenditure.
40

CITY OF CORAL GABLES, FLORIDA - COMPREHENSIVE ANNUAL FINANCIAL REPORT - FISCAL YEAR ENDED SEPTEMBER 30, 2016
(m) Deferred Outflows/Inflows of Resources and Unearned Revenues
In addition to assets, the statement of financial position will sometimes report a separate section for deferred
outflows of resources. This separate financial statement element, deferred outflows of resources, represents
a consumption of net position that applies to a future period(s) and so will not be recognized as an outflow
of resources (expense/expenditure) until then. The City has two items that qualifies for reporting in this
category: (a) deferred charge on bond refunding and deferred outflows related to pension which are reported
in the government-wide Statement of Net Position and Statement of Net Position of the proprietary funds.
In addition to liabilities, the statement of financial position will sometimes report a separate section for
deferred inflows of resources. This separate financial statement element, deferred inflows of resources,
represents an acquisition of net position that applies to a future period(s) and so will not be recognized as an
inflow of resources (revenue) until that time. The City has two types of item recognized as deferred inflow
of resources under a modified accrual basis of accounting. In the governmental funds, revenues that are
measurable, but are not available; and revenues received in advance which are applicable to future period,
are recognized as deferred inflows and are reported in this category. The governmental funds report
unavailable revenue from various sources which primarily include grants and contributions, charges for
services and special assessments. The government-wide statements Statement of Net Position and Statement
of Net Position of the proprietary funds report deferred inflows of resources related to pension and deferred
inflow of resources for revenues received in advance which are applicable to future periods, such as
business taxes payments received in advance.
Resources that do not meet revenue recognition requirements (not earned) are recorded as unearned revenue
in the government-wide and the fund financial statements.
(n) Inter-Fund Transactions/Due To/From Other Funds
Activities between funds that are representative of lending/borrowing arrangements at the end of the fiscal
year are referred to as “due to/from other funds” or “advances to/from other funds”. Any residual balances
outstanding between the governmental activities and business-type activities are reported in the government-
wide financial statements as “internal balances”.
Transactions among City funds that would be treated as revenues and expenditures or expenses if they
involved organizations external to City government are accounted for as revenues and expenditures or
expenses in the funds involved.
Transactions which constitute reimbursements to a fund for expenditures initially made from it which are
properly applicable to another fund are recorded as expenditures in the reimbursing fund and as reductions
of expenditures in the reimbursed fund.
Transactions which constitute the transfer of resources from a fund receiving revenues to a fund through
which the revenues are to be expended, are separately reported in the respective funds’ operating statements.
(o) Capital Contributions
Capital contributions are recorded in certain Enterprise and Internal Service Funds and consist primarily
of donations from private sources or other governmental entities.
41
CITY OF CORAL GABLES, FLORIDA - COMPREHENSIVE ANNUAL FINANCIAL REPORT - FISCAL YEAR ENDED SEPTEMBER 30, 2016
(p) Restricted Assets
Restricted assets of the government-wide and proprietary funds represents the balance of cash and cash
equivalents and investments with imposed constraints on the use of certain revenues, unspent proceeds
from the issuance of special obligation bonds for capital improvements, and funds set aside for repayment
of customer deposits and debt service payment.
The Capital Project Neighborhood Renaissance Program Fund reports restricted assets representing
unspent proceeds from the issuance of special obligation bonds for capital improvements. The Capital
Project General Improvement Fund reports restricted assets from the Miracle Mile and Giralda capital
project assessment program.
The Debt Service Fund reports restricted assets set aside for debt service.
The Parking Fund has restricted assets which are set aside for customer deposits.
(q) Fund Balance/Net Position
1) Fund Equity
In the fund financial statements, governmental funds report fund balance in categories as nonspendable,
restricted, committed, assigned and unassigned. These categories are based primarily on the extent to
which the City is bound to honor constraints on the specific purposes for which amounts in fund balances
can be spent.
The City’s fund balance classification policies and procedures are as follows:
Nonspendable funds are funds that cannot be spent because they are either not in spendable form (e.g.
inventories and prepaids) or are legally or contractually required to be maintained intact.
Restricted funds are funds that have constraints placed on their use either externally by creditors, grantors,
contributors, laws or regulations or other governments or by law through constitutional provisions or
enabling legislation.
Committed funds are funds that have constraints placed on their use through the passage of a formal
action by the City Commission which is the City’s highest level of decision-making authority. The City
Commission has the authority to set aside funds for a specific purpose and requires the passage of a
resolution or ordinance. Resolutions and ordinances are considered an equally binding form of City’s
highest level of formal action. The passage of a resolution or ordinance must take place prior to
September 30th of the applicable fiscal year but the amount can be determined at a later date. A resolution
or ordinance would also be required to modify or rescind the specific use or amount.
Assigned funds are funds that have constraints placed on their use by the City Manager. The City
Manager has the authority to set aside funds for the intended use of a specific purpose. This act would be
as part of the annual budget process or in the form of a written notification to the Finance Director. Any
modifications or rescissions would be in a written notification to the Finance Director. Upon passage of a
budget ordinance where fund balance is used as a source to balance the budget, that amount shall be
recorded as Assigned Fund Balance.
42

CITY OF CORAL GABLES, FLORIDA - COMPREHENSIVE ANNUAL FINANCIAL REPORT - FISCAL YEAR ENDED SEPTEMBER 30, 2016
Unassigned fund balance is the residual amount of fund balance in the General Fund and deficit
unassigned fund balance of other governmental funds. It represents the resources available for future
spending when amount is not a deficit.
2) Net Position
Net position of the government-wide and proprietary funds are categorized as net investment in capital
assets, restricted or unrestricted. The first category represents net position related to property, plant,
equipment and infrastructure reduced by depreciation and outstanding debt used to construct or purchase
capital assets, and deferred inflow/outflow of resources that are attributed to the acquisition of those
assets or related debt are included in this component of net position. The restricted category represents
the balance of assets restricted by requirements of revenue bonds and other externally imposed constraints
or by enabling legislation in excess of the related liabilities payable from restricted assets. All remaining
amounts are considered to be unrestricted.
(r) Operating versus Non-operating Income
Proprietary funds distinguish operating revenues and expenses from non-operating items. Operating
revenues and expenses generally result from providing services and producing and delivering goods in
connection with the fund’s principal ongoing operations. The principal operating revenues of the City’s
Enterprise and Internal Service Funds are charges to customers for sales and services. Operating revenues
for the Enterprise Funds include sewer and stormwater service fees as well as user fees at the various City
parking facilities. For the Internal Service Funds, operating revenues include charges to other
departments for various maintenance and insurance services. Operating expenses for the Enterprise and
Internal Service Funds include costs of sales and services, administrative fees, insurance payments and
depreciation. All revenues and expenses not meeting this definition are considered non-operating items.
(s) Use of Resources
When both restricted and unrestricted resources are available for use, it is the City’s policy to use
restricted resources first, then unrestricted resources as they are needed. When committed, assigned and
unassigned resources are available for use, it is the City’s policy to use committed resources first,
assigned resources second, and unassigned resources third.
(t) Compensated Absences
City employees earn both vacation and sick leave. Vacation leave may be taken, converted into cash with
certain restrictions, or accumulated up to certain limits and paid upon retirement or termination.
Sick leave may be taken or accumulated and paid up to certain limits upon retirement or death. The
current liability for vacation and sick leave (up to a specified amount) is reflected in the accrued
compensated absences amounts in the government-wide, proprietary and fiduciary fund financial
statements. According to City Commission Resolution No. 15199, unused sick leave in excess of the
maximum amount is deferred in the Employee Benefit Fund until payable to the employee. The excess
sick leave is fully funded. A liability for these amounts is reported in governmental funds only if they
have matured, for example, as a result of employee resignations and retirements. Accrued compensated
absences of the governmental activities is not reported in the balance sheet of the governmental funds
and, accordingly, represents a reconciling item between the fund financial statements and government-
wide financial statements. Payments are generally paid out of the General Fund.
43
CITY OF CORAL GABLES, FLORIDA - COMPREHENSIVE ANNUAL FINANCIAL REPORT - FISCAL YEAR ENDED SEPTEMBER 30, 2016
(u) Pollution Remediation Obligation
The City accrues future pollution remediation costs that meet the measurement criteria as outlined in
GASB 49, Accounting and Financial Reporting for Pollution Remediation Obligations. These liabilities
are shown as part of the non-current liabilities in the Statement of Net Position. The City measures
pollution remediation costs using the expected cash flow technique. The estimated cost of all pollution
remediation is measured annually and adjusted when benchmarks are met or when new information
indicates changes in estimated outlays due to changes in remediation plan or operating conditions.
(v) Employee Benefits Plan
The City provides a defined benefit pension plan covering substantially all regular full-time general,
police and fire department employees. The City also provides two defined contribution plans - Police
Officers’ Pension Fund and Firefighters’ Pension Fund, as a supplement to the benefits provided under
the defined benefit pension plan.
(w) Post-Employment Benefits Other Than Pensions (OPEB)
Pursuant to Section 112.0801, Florida Statues, the City is mandated to permit participation in the health
insurance program by retirees and their eligible dependents at a cost to the retiree that is no greater than
the cost at which coverage is available for active employees. Retirees are required to pay 100% of the
premium rates where premiums are determined based upon a blended rates used for active employees and
retirees. These premium rates were adjusted to reflect differing utilization rates by age and gender and
the impact of the Medicare program on claim costs. The blended rates provide an implicit subsidy for
retirees because, on an actuarial basis, their current and future claims are expected to result in higher costs
to the plan on average than those of active employees.
The City currently provides these benefits in accordance with the vesting and retirement requirement of
the City of Coral Gables Retirement System covering substantially all regular full time general, police,
and fire department employees of the City.
The City is financing the post employee benefits on a pay-as-you go basis. As determined by an actuarial
valuation, the City records a Net OPEB obligation in its government-wide and proprietary financial
statements related to the implicit subsidy. The OPEB plan does not issue separate financial statements.
(x) Risk Management
The City has a self-insurance program, for General Liability, Automobile Liability and Workers’
Compensation pursuant to Florida Statute Section 768.28 (Waiver of Statute of Limitations: Exclusions:
Indemnifications; Risk Management Programs). The City is protected by Florida Statute 768.28 which
limits losses to, except for certain federal causes of action, (a) $100,000 per person / $200,000 per
occurrence for claims arising between October 1, 1981 and October 1, 2011; and (b) $200,000 per person
/ $300,000 per occurrence for claims arising after October 1, 2011.
The discounted accrued liability for estimated insurance claims represents an estimate of the ultimate cost
of settling claims arising prior to year end including claims incurred but not yet reported.
The City has fully insured individual health care plans for each employee group.
44
CITY OF CORAL GABLES, FLORIDA - COMPREHENSIVE ANNUAL FINANCIAL REPORT - FISCAL YEAR ENDED SEPTEMBER 30, 2016
(y) Use of Estimates
The preparation of financial statements in conformity with accounting principles generally accepted in the
United States of America, requires management to make estimates and assumptions that affect the
reported amounts of assets, liabilities and deferred inflows/outflows of resources and disclosures of
contingent assets, liabilities and deferred inflows/outflows at the date of the financial statements and the
reported amounts of revenues and expenditures/expenses during the reporting period. Actual results
could differ from those estimates.
(z) New Accounting Pronouncements Adopted
At September 30, 2016, the City adopted GASB Statement No. 72, Fair Value Measurement and
Application. This Statement defines fair value and describes how fair value should be measured, what
assets and liabilities should be measured at fair value, and what information about fair value should be
disclosed in the notes to the financial statements. See Note 4 for the related disclosures.
At September 30, 2016, the City adopted GASB Statement No. 76, The Hierarchy of Generally Accepted
Accounting Principles for State and Local Governments, which supersedes Statement No. 55, The
Hierarchy of Generally Accepted Accounting Principles for State and Local Governments. The adoption
of this Statement had no impact on the City’s financial statements in fiscal year 2016.
At September 30, 2016, the City adopted GASB Statement No. 79, Certain External Investment Pools
and Pool Participants. This Statement addresses accounting and financial reporting for certain external
investment pools and pool participants. Specifically, it establishes criteria for an external investment pool
to qualify for making the election to measure all of its investments at amortized cost for financial
reporting purposes. See note 1(e) for the related disclosures.
NOTE 2 - REAL AND PERSONAL PROPERTY TAXES
Property taxes are levied to support the fiscal period commencing October 1, each year. Taxes are payable
beginning November 1 and become delinquent the following April 1. Unpaid taxes represent a lien
against the property until paid. The City’s real and personal property taxes for all property located within
the City are levied each October on the taxable value assessed as of the prior January 1. Taxable values
are established by the Miami-Dade County Property Appraiser at market value, less statutory exemptions.
The taxable value of property at January 1, 2015, upon which the 2015-2016 levy was based, was
approximately $13.7 billion. A tax levy of $5.5590 mills ($5.5590 per $1,000 of taxable value) was
required to finance general operations for the fiscal year ended September 30, 2016.
45

CITY OF CORAL GABLES, FLORIDA - COMPREHENSIVE ANNUAL FINANCIAL REPORT - FISCAL YEAR ENDED SEPTEMBER 30, 2016
Governmental Business-Type
Activities Activities
General Fund
Franchise Taxes $ 1,105,383 $ -
False Alarms 395,019 -
Utility Taxes 898,235 -
Delinquent Waste Fees 1,443,141 -
Ambulance Transport Fees 514,256 -
Granada Golf Course 37,800 -
Leased Properties - Rent Receivable 204,636 -
Donations Receivable - Coral Gables Museum 50,000 -
University of Miami Development Agreement Fee 11,600,000 -
Other 379,538 -
16,628,008 -
Less: Allowance (64,130) -
Total 16,563,878 -
- Debt Service Fund
Miscellaneous 11,000
Total 11,000 -
General Improvement Fund
Due from Cocoplum Community Property Owners 64,401 -
Total 64,401 -
Other Governmental Funds
BID Accounts Receivable 166,915 -
Total 166,915 -
- Parking Fund
Parking Leased Space - 525,329
Parking – General - 402,736
928,065
Less: Allowance - (388,219)
Total - 539,845
Sanitary Sewer Fund
Customer Receivable - 1,226,022
Miscellaneous - 124,696
1,350,718
Less Allowance - (415)
Total - 1,350,303
Stormwater Fund
Service Use Charges - 596,422
Total - 596,422
Total Governmental Funds 16,806,194
Total Business-Type
Activities/Proprietary Funds $ 2,486,570
Internal Service Fund
Miscellaneous 19,263
Total Internal Service Funds 19,263
Total $ 16,825,457
NOTE 3 - RECEIVABLE
(a) Accounts receivable are summarized below and are shown net of allowance for doubtful accounts as follows:
46
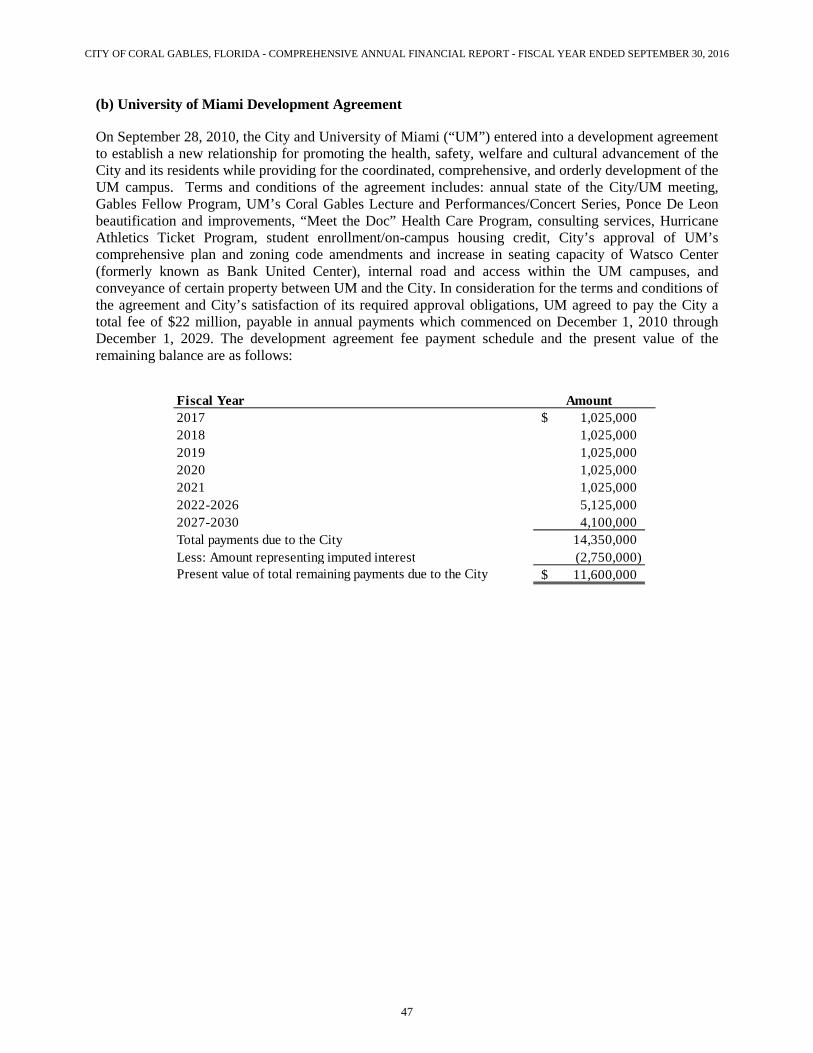
CITY OF CORAL GABLES, FLORIDA - COMPREHENSIVE ANNUAL FINANCIAL REPORT - FISCAL YEAR ENDED SEPTEMBER 30, 2016
(b) University of Miami Development Agreement
On September 28, 2010, the City and University of Miami (“UM”) entered into a development agreement
to establish a new relationship for promoting the health, safety, welfare and cultural advancement of the
City and its residents while providing for the coordinated, comprehensive, and orderly development of the
UM campus. Terms and conditions of the agreement includes: annual state of the City/UM meeting,
Gables Fellow Program, UM’s Coral Gables Lecture and Performances/Concert Series, Ponce De Leon
beautification and improvements, “Meet the Doc” Health Care Program, consulting services, Hurricane
Athletics Ticket Program, student enrollment/on-campus housing credit, City’s approval of UM’s
comprehensive plan and zoning code amendments and increase in seating capacity of Watsco Center
(formerly known as Bank United Center), internal road and access within the UM campuses, and
conveyance of certain property between UM and the City. In consideration for the terms and conditions of
the agreement and City’s satisfaction of its required approval obligations, UM agreed to pay the City a
total fee of $22 million, payable in annual payments which commenced on December 1, 2010 through
December 1, 2029. The development agreement fee payment schedule and the present value of the
remaining balance are as follows:
Fiscal Year Amount
2017 1,025,000$
2018 1,025,000
2019 1,025,000
2020 1,025,000
2021 1,025,000
2022-2026 5,125,000
2027-2030 4,100,000
Total payments due to the City 14,350,000
Less: Amount representing imputed interest (2,750,000)
Present value of total remaining payments due to the City 11,600,000$
47

CITY OF CORAL GABLES, FLORIDA - COMPREHENSIVE ANNUAL FINANCIAL REPORT - FISCAL YEAR ENDED SEPTEMBER 30, 2016
(c) Deferred Inflows/Unearned Revenue
The components of deferred inflow of resources (unavailable revenues) and unearned revenues as of
September 30, 2016 are as follows:
Unavailable Unearned
Revenues Revenues
General Fund
False Alarms 395,019$ -$
Delinquent Waste Fees 499,152 -
Ambulance Transport Fees 470,545 -
Donations to Coral Gables
Museum 50,000 -
University of Miami
Development Agreement Fee 11,600,000 -
Liens and Other Receivables 280,656 -
Prepaid Business Tax Receipts 2,968,169 -
Prepaid Waste Fees 5,979,877
Prepaid Rent and Other fees - 574,694
Grant Receipts Not Yet Earned - 5,749
Total 16,263,541 6,560,320
Debt Service Fund
Miracle Mile/Giralda Streetscape
Improvement Assessment 8,144,819 -
Liens and Other Receivables 2,467 -
Total 8,147,286 -
General Improvement Fund
Grants and Contributions 13,978 26,800
Liens and Other Receivables 64,409 -
Total 78,387 26,800
Other Governmental Funds
Grants and Contributions 826,361 -
Total 826,361 -
Total Governmental Funds 25,315,575$
Total Governmental Activities/Funds 6,587,120$
Total Governmental Activities:
Prepaid Business Tax Receipts 2,968,169$
Parking Fund
Prepaid Parking Fees - 284,595
Total Proprietary Funds
Business-Type Activities -$ 284,595$
48

CITY OF CORAL GABLES, FLORIDA - COMPREHENSIVE ANNUAL FINANCIAL REPORT - FISCAL YEAR ENDED SEPTEMBER 30, 2016
(d) Capital Project and Related Services Assessment Program
In January 2011, the City through Resolution No. 2011-25 (As Amended) approved a strategic downtown
initiative for Miracle Mile and Restaurant Row, or Giralda Avenue, and approved the implementation of
this initiative, including design, cost estimates and financing, each subject to the City Commission’s
subsequent approval. The initiative aimed to position the City’s downtown for economic growth and
livability by transforming them into a beautiful, functional public space that will attract new residents and
businesses and will increase the quality of life and property values.
In April 2014, the City adopted the Capital Project and Related Services Ordinance No. 2014-07 (the
“Ordinance”). The Ordinance establishes the City’s procedures for the imposition of capital special
assessment programs for the provision of improvements and related services providing a special benefit to
local areas within the City; provides for the creation of assessment areas within the City; authorizes the
imposition and collection of special assessments to fund the cost of capital improvements and services
providing a special benefit to local areas within the City; outlines the procedures for the establishment of
an assessment area and the initial and annual implementation steps for imposing special assessments by
subsequent resolution. The Ordinance also replaces the City’s existing Local Improvement Act, and it
provides for the adoption of Florida Statutes section 197.3632 and 197.3635, “Uniform Assessment
Collection Act” authorizing the collection of non-ad valorem assessments on the same bill as ad valorem
taxes.
The City held various workshops relative to the proposed streetscape improvement project for Miracle
Mile and Giralda Avenue. Additionally, the City engaged the services of professionals and consultants to
assist in developing the related assessment and methodology that involved a special assessment for the
specially benefited properties. The City adopted several resolutions describing the method of assessing
the cost of the design, acquisition, construction and installation of the improvement projects, established
estimated annual assessment rates, prepared preliminary assessment rolls and approved the mailings and
publication of notices required by Ordinance No. 2014-07 for the following improvement projects:
a) Resolution No. 2014-169 - Final Assessment Resolution for Miracle Mile Improvement Project,
adopted on August 26, 2014 for the provision of the improvement project, providing authority and
definitions, approving the final assessment rolls, providing for the imposition of the assessment to
fund the Miracle Mile improvement project, and providing for collection of the assessments pursuant
to the uniform assessment collection act.
The Miracle Mile project will create a unique sense of place - a civic promenade that will become a
focal point for the region. The project includes widening of the pedestrian area utilizing high quality
materials and finishes, installing extensive gardens and landscaping, setting the stage for
incorporation of public art, providing decorative street lighting and way finding, as well as improving
drainage and creating new cohesive surfaces from one side of the street to the other.
The properties located in the assessment area that will specially benefit from the improvement project
are allocated with total special assessment (initial pre-pay amount) of $7.37 million. The maximum
annual assessments, which includes interest costs and other annual costs, is payable in annual
installment for a period of twenty (20) years, and collection of the assessments will commence with
the ad valorem tax bill in November 2017. The total maximum assessment to all property tax parcels
is approximately $13.35 million over the twenty-year period. The initial pre-payment period allows
property owners to pay the assessment amount as described in the assessment roll to avoid interest
and other annual costs included in the total maximum assessment amount.
49
CITY OF CORAL GABLES, FLORIDA - COMPREHENSIVE ANNUAL FINANCIAL REPORT - FISCAL YEAR ENDED SEPTEMBER 30, 2016
Additionally, property owners may pay-off their assessment at any time during the 20-year repayment
period. As of September 30, 2016, a total of $891,759 was received from property owners who
prepaid their assessments within the initial pre-payment period.
The total remaining special assessment (initial pre-payment amount) of $6.5 million is recognized as
an assessment receivable and deferred inflow of resources – unavailable revenue in the governmental
fund financial statement.
b) Resolution No. 2014-171 - Final Assessment Resolution for Giralda Avenue Improvement Project,
adopted on August 26, 2014 for the provision of the improvement project, providing authority and
definitions, approving the final assessment rolls, providing for the imposition of the assessment to
fund the Giralda Avenue improvement project, and providing for collection of the assessments
pursuant to the uniform assessment collection act.
The Giralda project for restaurant row will include creating a single surface curb-free environment
utilizing high quality materials and finishes including an artistic street paver design covering the full
width of the road from building to building, installing landscaping, setting the stage for incorporation
of public art, providing decorative street lighting and way finding, as well as improving drainage and
creating a new and cohesive experience.
The properties located in the assessment area that will specially benefit from the improvement project
are allocated with total special assessment (initial pre-pay amount) of $1.67 million. The maximum
annual assessments, which includes interest costs and other annual costs, is payable in annual
installment for a period of twenty (20) years, and collection of the assessments will commence with
the ad valorem tax bill in November 2017. The total maximum assessment to all property tax parcels
is approximately $2.93 million over the twenty-year period. The initial pre-payment period allows
property owners to pay the assessment amount as described in the assessment roll to avoid interest
and other annual costs included in the total maximum assessment amount.
Additionally, property owners may pay-off their assessment at any time during the 20-year repayment
period. As of September 30, 2016, a total of $5,853 was received from property owners who prepaid
their assessments within the initial pre-payment period.
The total remaining special assessment (initial pre-payment amount) of $1.67 million is recognized as
an assessment receivable and deferred inflow of resources – unavailable revenue in the governmental
fund financial statement.
In February 2015, the City received the Final Judgment validating and confirming the City’s authority to
enter and execute a loan agreement, and the legality and validity of the imposition of the special
assessment to fund the streetscape improvements to assessed property, the methodology used to apportion
the assessment, the collection of the assessment in annual installment for a period of twenty years, and the
lien of the special assessments being equal in rank and dignity with the lien of all state, county and
municipal taxes.
On January 26, 2016, the City passed Resolution 2016-33 approving a contract for the construction of the
Miracle Mile and Giralda Streetscape Projects (the Project) for a guaranteed maximum price of $21.6
million, and contract for the construction administration services not to exceed $500,000. The total
project cost is estimated at $25.9 million which includes the guaranteed construction price, construction
administration services, design and other project costs.
See Note 7 for information on the Capital Improvement Revenue Bonds, Series 2016A, Series 2016B,
and Series 2016C long-term permanent financing to finance the cost of the Streetscape Projects.
50

CITY OF CORAL GABLES, FLORIDA - COMPREHENSIVE ANNUAL FINANCIAL REPORT - FISCAL YEAR ENDED SEPTEMBER 30, 2016
(e) Service Assessments for Solid Waste and Recyclable Materials
The City adopted Ordinance No. 2016-02 which established the imposition of service assessments for
solid waste and recyclable materials collection and disposal service, facilities and programs against
residential property within the city, established the initial and annual implementation steps for special
assessments by subsequent resolution, and authorized the collection of the special assessments on the
same tax bill as ad valorem taxes. Effective September 29, 2015, the City may utilize the uniform method
of collection of pursuant to Florida Statutes Chapter 197, whereby residential unit owners shall pay for
residential solid waste collection services and delinquent amount on the tax bill. The Ordinance also
provided for the advance payment of the annual assessment at a discounted rate if paid on or before
August 15 of each year.
During fiscal year 2016, the City issued the solid waste assessment bill for the annual assessment for
fiscal year 2016-2017 to allow resident owners to avail of the discounted rate if paid by August 15, 2016.
As of September 30, 2016, the City collected $5.9 million of advance payment related to the annual
assessment for fiscal year 2016-2017 and the amount is reported as part of unearned revenue in the
governmental fund financial statements and governmental activities – statement of net position.
NOTE 4 – CASH, CASH EQUIVALENTS AND INVESTMENTS
Deposits. As of September 30, 2016, the City’s cash, cash equivalents and investments were as follows:
Cash and Cash
Equivalents Investments Total
Governmental activities 64,826,235$ 116,000,083$ 180,826,318$
Business-type activities 4,478,794 13,488,646 17,967,440
Pension Trust Funds 10,127,085 352,436,607 362,563,692
Agency Funds 2,530,047 - 2,530,047
Total Cash, Cash Equivalents and Investments 81,962,161$ 481,925,336$ 563,887,497$
Deposits 81,962,161$
Investments 481,925,336
Total Deposits and Investments 563,887,497$
The City maintains cash, cash equivalents and an investment pool that is available for use by all funds
except for those which the cash and investments must be segregated due to bond indenture or other legal
restrictions. The interest-bearing and non-interest-bearing bank deposits are entirely insured by the
Federal Depository Insurance Corporation or collateral held by the State Treasurer. Under provision of
the Florida Security for Public Deposits Act, Chapter 280, all qualified public depositories are required to
pledge collateral having a fair value equal to or greater than the depository’s collateral pledging level.
Interest earned on pooled cash, cash equivalents and investments is allocated monthly based on cash and
investment balances of the respective funds.
The City of Coral Gables Retirement Fund deposits are included in cash and cash equivalents in the
Plan’s statement of plan net position. Cash and cash equivalents include demand accounts and short-term
investment funds (STIF). The allowable STIF investments are the custodial short-term (money market)
commingled funds, commercial paper and U.S. governmental obligations.
51

CITY OF CORAL GABLES, FLORIDA - COMPREHENSIVE ANNUAL FINANCIAL REPORT - FISCAL YEAR ENDED SEPTEMBER 30, 2016
Authorized Investments
The City does not have a formal investment policy and follows the State Statutes. The State Statutes
authorize the City to invest any surplus funds in notes, bonds and other obligations of agencies of the
United States which are unconditionally guaranteed by the U.S. Government, commercial paper,
certificates of deposit issued by domestic and foreign financial institutions in the US; and pools of
investments administered by the State of Florida known as the Local Government Surplus Funds Trust
Fund. These investments held by Local Government Surplus Fund Trust Fund are allocated among two
funds, LGIP (formerly known as LGIP-A) and Fund B (formerly known as LGIP-B). The value of the
City’s investments in LGIP funds is the same as the value of the pool shares and is recorded at amortized
cost. The SBA is not a registrant with the Securities and Exchange Commission. SBA accounts are not
subject to custodial credit risk categorization as these investments are not evidenced by securities that
exist in physical or book entry form and they do not have a credit rating.
City of Coral Gables Retirement Fund
The City of Coral Gables Retirement Fund (the “Plan”) investment policy is determined by the Board of
Trustees (the “Board”). The policy has been identified by the Board to conduct the operations of the Plan
in a manner so that the assets will provide for the pension and other benefits provided under applicable
laws, including City ordinances, preserving principal while maximizing the rate of return.
The Board is authorized to acquire and retain every kind of property, real, personal or mixed, and every
kind of investment specifically including, but not by way of limitation, bonds, debentures, and other
corporate obligations, and stocks, preferred or common.
Investments in all equity securities shall be limited to fully and easily negotiable equity securities and
shall not exceed 70% of the fair value of the total fund assets. No more than 10% (at cost) of the portfolio
may be invested in the shares of a single corporate issuer. Investments in securities (equity or fixed
income) issued by foreign corporations are limited to no more than 25% of fund assets. Investments in
shares of public companies that have been publicly traded for less than a year are limited to no more than
15% of the market value of the total Plan assets. Convertible securities are not to exceed 10% of the
market value of the total Plan assets. Equity funds may be managed through the purchase of open-ended,
no-load mutual funds or commingled funds. The Board implicitly accepts the policy of a mutual fund or
commingled fund when it makes a direct investment.
The fixed income portfolio shall comply with the following: the average credit quality of the bond Plan
assets portfolio shall be "A" or higher. The duration of the total Plan assets should be less than 135% of
the duration of the market index. Investments in all corporate fixed income securities shall be limited to
securities issued by a corporation organized under the laws of the United States, any state or organized
territory of the United States, or the District of Columbia. Yankee bonds and non U.S. dollar denominated
bonds may not exceed 10% of the entire fixed income portfolio. No more than 10% at market of total Plan
asset shall be invested in the securities of any single corporate issuer. Securities rated below "BBB" shall
not exceed 15% of the market value of the Plan assets.
Investments in Collateralized Mortgage Obligations (CMOS) shall be limited to 25% of the market value
of total Plan assets and shall be restricted to issues backed by the full faith of the U.S. Government, an
agency thereof, or are rated AAA by a major rating service and PAC (Planned amortization class), NAC
(non-accelerated securities) or VADM (very accurately defined maturity) securities.
There is no limit imposed on investments in fixed income securities issued directly by the United States
Government or any agency or instrumentality thereof. Fixed income funds may be managed through the
52

CITY OF CORAL GABLES, FLORIDA - COMPREHENSIVE ANNUAL FINANCIAL REPORT - FISCAL YEAR ENDED SEPTEMBER 30, 2016
purchase of open-ended, no-load mutual funds or commingled funds. Fixed income funds purchased by
investment advisors are expected to adhere to the guidelines herein. The Board implicitly accepts the
policy of a mutual fund or commingled fund when it makes a direct investment.
Investments in real estate shall not exceed 15% at market valuation of the total Plan assets. All real estate
investments shall be made through participation in diversified commingled funds of real properties. These
funds shall be broadly diversified as to property type and location. Experienced and professional real
property investment managers shall manage all real estate investments.
The Plan may invest up to 15% of the total fair value of the portfolio in limited partnerships and/or
private equity structures in order to diversify the Fund’s portfolio and/or to enhance the Fund’s return
opportunities. It is understood that these types of investments may have limited liquidity and/or “lock-
up” periods with no liquidity. It is also recognized that these types of investments may have higher fees
and demonstrate highly variable returns over short periods of time. The Board shall consider special
criteria including, but not limited to, the following in evaluation of any investments in this category:
tenure, expertise, and track record of management team; diversification potential of the alternative
investment relative to other Plan investments; risk control provisions of the alternative investment;
liquidity provisions of the alternative investment; use of leverage or other means of return enhancement
by the alternative investment; fees and potential conflicts of interest associated with the alternative
investment.
Police Officers’ Pension Fund
The Police Officers’ Pension Fund (the “Plan”) investment policy is determined by the Board of Trustees
(the “Board”). The policy was designed by the Board to maximize the Fund’s asset value, while
assuming a risk that is consistent with the Board’s risk tolerance. As is prudent, the Board has adopted
policy to diversify investment risk among several institutionally acceptable asset classes including equity
securities, bonds debentures, and other corporate obligations. The Board is prohibited to invest in bonds
issued by a corporation, state or municipality, futures, obligations issued by a foreign government
(excluding the State of Israel), hedge funds, internally managed assets, limited partnerships, margin
accounts, options, private equity, private mortgages, securities lending, illiquid investments and
scrutinized companies published by the Florida State Board of Administration.
The Plan limits investment in the securities of any one issuer, other than the U.S. Government and its
agencies, to no more than 5% of net fiduciary position. Investments more than 5% of the net fiduciary
position consisted of Vanguard Inflation-Protected Securities Fund (5.1%); Vanguard Intermediate-Term
Corporate Fund (10.8%); Vanguard Short Term Bond EFT (10%); Vanguard REIT Index Fund (6.2%)
and American Funds Europacific Growth Fund (13.2%).
Firefighters’ Pension Fund
The Firefighters’ Pension Fund (the “Plan”) investment policy is determined by the Board of Trustees
(the “Board”). The policy was designed by the Board to preserve the purchasing power of the Plan’s
assets and earn a reasonable real rate of return (after inflation) over the long-term while minimizing the
short-term volatility of results. To achieve these objectives, the Board adopted policy to create a
conservative, well diversified and balanced portfolio of high quality equity securities, fixed income and
money market securities.
Investments in equity securities shall be limited to those actively traded on a major stock exchange or
NASDAQ, and shall not exceed 40% at cost of the investment manager’s total portfolio. No more than
53

CITY OF CORAL GABLES, FLORIDA - COMPREHENSIVE ANNUAL FINANCIAL REPORT - FISCAL YEAR ENDED SEPTEMBER 30, 2016
10% at cost of the plan’s total assets may be invested in foreign securities. No more than 5% at cost of
the portfolio total value may be invested in the shares of a single corporate issuer. Investment in equity
securities issued by corporations with a total market capitalization of $3 billion or less shall not exceed
15% of the total portfolio equity value at cost.
Investments in corporate fixed income securities shall be limited to those that hold a rating in one of the
three (3) highest classifications by a major rating service. No more than 10% at cost of the fixed income
portfolio total value may be invested in the securities of any single corporate issuer. Investments in
Collateral Mortgage Obligation (CMOs) shall be limited to 10% of the fair value of the total fixed income
portfolio and shall be restricted to those issues backed by securities issued or guaranteed by the
Government National Mortgage Association, the Federal Home Loan Mortgage Corporation, or the
Federal National Mortgage Association, or that are rated “Aaa” by Moody or AAA” by Standard & Poor
rating agencies. There is no limit imposed on investments in fixed income securities issued directly by
the US Government or agency or instrumentality thereof.
Short-term investment shall be limited to direct obligations of the US Government with a maturity of one
year or less, commercial paper with a maturity of 270 days or less that is rated A-1 by S&P or P-1 by
Moody’s, and bankers acceptance issued by the largest fifty banks in the US.
Investments in tax-exempt bonds, interest-only or principal only CMOs, interest rate swaps, precious
metals, limited partnerships of any kind, real estate, REIT, venture capital, future contracts or option
contracts are prohibited. Trading on margin and short term selling are also prohibited.
Types of Investments
Florida Statutes and the Coral Gables Retirement Fund investment policy authorize the Board to invest
funds in various investments. The current target asset allocation range of these investments at market is as
follows:
Authorized Investments Minimum Maximum Domestic equities 35% 45%
International equities 15% 25%
Domestic fixed income 10% 20%
International fixed income 0% 10%
Real estate 5% 15%
Alternative 0% 15%
Florida Statutes and Police Officers’ Pension Fund investment policy authorize the Board to invest funds
in various investments. The target asset allocation range of these investments at market is as follows:
Authorized Investments Target % of Portfolio
Domestic equity 22 - 44%
Convertibles 2 - 8%
Treasury Inflation Protected Securities 3 - 7%
International equities 5 - 25%
Real estate 0 - 8%
Fixed income 15%-no limit
Cash and cash equivalents 10 - 40%
54

CITY OF CORAL GABLES, FLORIDA - COMPREHENSIVE ANNUAL FINANCIAL REPORT - FISCAL YEAR ENDED SEPTEMBER 30, 2016
Florida Statutes and Firefighters’ Pension Fund investment policy authorize the Board to invest funds in
various investments. The target asset allocation of these investments at market is as follows:
Authorized Investments Target % of Portfolio Domestic equity 30%
Foreign equity 10%
Fixed income securities 60%
Fair Value Measurements
Fair value is defined as the price that would be received to sell an asset or paid to transfer a liability in an
orderly transaction between market participants at the measurement date. Fair value measurements are
categorized within the fair value hierarchy as established by generally accepted accounting principles.
The fair value hierarchy categorizes inputs to valuation techniques used to measure fair value into three
levels based on the extent to which input used in measuring fair value are observable in the market.
Investments measured and reported at fair value are classified and disclosed in one of the following
categories:
Level 1 – Inputs are quoted prices (unadjusted) for identical assets or liabilities in active markets that a
government can access at the measurement date.
Level 2 – Inputs are other than quoted prices included within Level 1 that are observable for an assets or
liability, either directly or indirectly, including quoted market prices for similar assets or liabilities in
active markets.
Level 3 – Inputs are significant unobservable inputs used to measure fair value to the extent that
observable inputs are not available, thereby allowing for situations where there is little, if any, market
activity for the asset or liability at the measurement date.
55

CITY OF CORAL GABLES, FLORIDA - COMPREHENSIVE ANNUAL FINANCIAL REPORT - FISCAL YEAR ENDED SEPTEMBER 30, 2016
The following table presents the fair value hierarchy for investments at fair value as of September 30,
2016:
Qouted
Prices In Significant
Active Other Significant
Market for Observable Unobservable
Identical Assets Inputs Inputs
Total (Level 1) (Level 2) (Level 3)
Investments at fair value level:
City of Coral Gables
Debt securities:
US Treasury Securities 25,031,460$ 25,031,460$ -$ -$
US Agency Discount Notes 40,468,547 - 40,468,547 -
US Agency Fixed Rate Debentures 63,987,712 - 63,987,712 -
Total Investment by fair value level 129,487,719 25,031,460$ 104,456,259$ -$
Investment measured at amortized cost* 1,010
Total Investments 129,488,729$
Firefighters' Pension Fund
Mutual Funds 5,695,837$ 5,695,837$ -$ -$
Investment by fair value level 5,695,837 5,695,837$ -$ -$
Guaranteed Investment Contract 9,564,092
Total Investments 15,259,929$
Police Officers' Pension Fund
Equity securities:
Common stocks 217,105$ 217,105$ -$ -$
Mutual Funds 2,495,817 2,495,817 - -
Total 2,712,922 2,712,922 - -
Debt securities:
Fixed income mutual funds 1,568,392 1,568,392 - -
Total Investment by fair value level 4,281,314 4,281,314$ -$ -$
Money market funds (exempt)* 1,059,562
Total Investments 5,340,876$
City of Coral Gables Retirement Fund
Equity securities:
Domestic equities 96,782,622$ 96,782,622$ -$ -$
International equities 3,204,775 3,204,775 - -
Total equity secuties 99,987,397 99,987,397 - -
Debt securities:
Government and agency 17,507,028 - 17,507,028 -
Corporate bonds 15,530,070 - 15,530,070 -
Total debt securities 33,037,098 - 33,037,098 -
Alternative investments:
Real estate 51,046,126 - - 51,046,126
Venture capital 1,180,889 - - 1,180,889
Total alternative investments 52,227,015 - - 52,227,015
Total investments by fair value level 185,251,510 99,987,397$ 33,037,098$ 52,227,015$
Investment measured at the net asset value (NAV)*
Commingled international equity fund 51,483,515
Commingled global fixed income 8,393,093
Commingled domestic fixed income fund 2,593,987
Commingled domestic equity fund 19,214,368
Hedge funds 65,958,891
Total investment measured at the NAV 147,643,854
Total investment measured at fair value 332,895,364$
* These investments are not measured according to the hierarchy established by GASB Statement No. 72
Fair Value Measurement Using
56

CITY OF CORAL GABLES, FLORIDA - COMPREHENSIVE ANNUAL FINANCIAL REPORT - FISCAL YEAR ENDED SEPTEMBER 30, 2016
City of Coral Gables Retirement Fund
The Plan has established a framework to consistently measure the fair value of the Plan’s assets and
liabilities in accordance with applicable accounting, legal, and regulatory guidance. This framework has
been provided by establishing valuation policy and procedures that will provide reasonable assurance that
assets and liabilities are carried at fair value. In certain cases, the inputs used to measure fair value may
fall into different levels of the fair value hierarchy. In such cases, an investment’s level within the fair
value hierarchy is based on the lowest level of input that is significant to the fair value measurement. The
Plan’s assessment of the significance of a particular input to the fair value measurement requires
judgment and considers factors specific to the investment.
The overall valuation process and information sources by major investment classification are as follows:
• Equity securities: These include common stock, domestic and international equity funds.
Domestic securities traded on a national securities exchange are valued at the last reported sales
price on the last business day of the fiscal year. Securities traded in the over-the counter market
and listed securities for which no sale was reported on that date are valued at the last reported bid
price. International equities are valued based upon quoted foreign market prices and translated
into U.S. dollars at the exchange rate in effect at September 30, 2016. Securities which are not
traded on a national security exchange are valued by the respective fund manager or other third
parties based on yields currently available on comparable securities of issuers with similar credit
ratings.
• Debt Securities: Debt securities consist primarily of negotiable obligations of the U.S.
government and U.S. government-sponsored agencies, corporations, and securitized residential
and commercial mortgages. These securities can typically be valued using the close or last traded
price on a specific date (quoted prices in active markets). When quoted prices are not available,
fair value is determined based on valuation models that use inputs that include market observable
inputs. These inputs included recent trades, yields, price quotes, cash flows, maturity, credit
ratings, and other assumptions based upon the specifics of the investment’s type.
• Alternative investments: These investments include real estate equity and venture capital
investments where no readily ascertainable market value exists. To value these investments,
management, in consultation with the general partner and investment advisors, determines the fair
values for the individual investments based upon the partnership’s or limited liability company’s
most recent available financial information adjusted for cash flow activities through September
30, 2016. The estimated fair value of these investments may differ from values that would have
been used had a ready market existed.
57
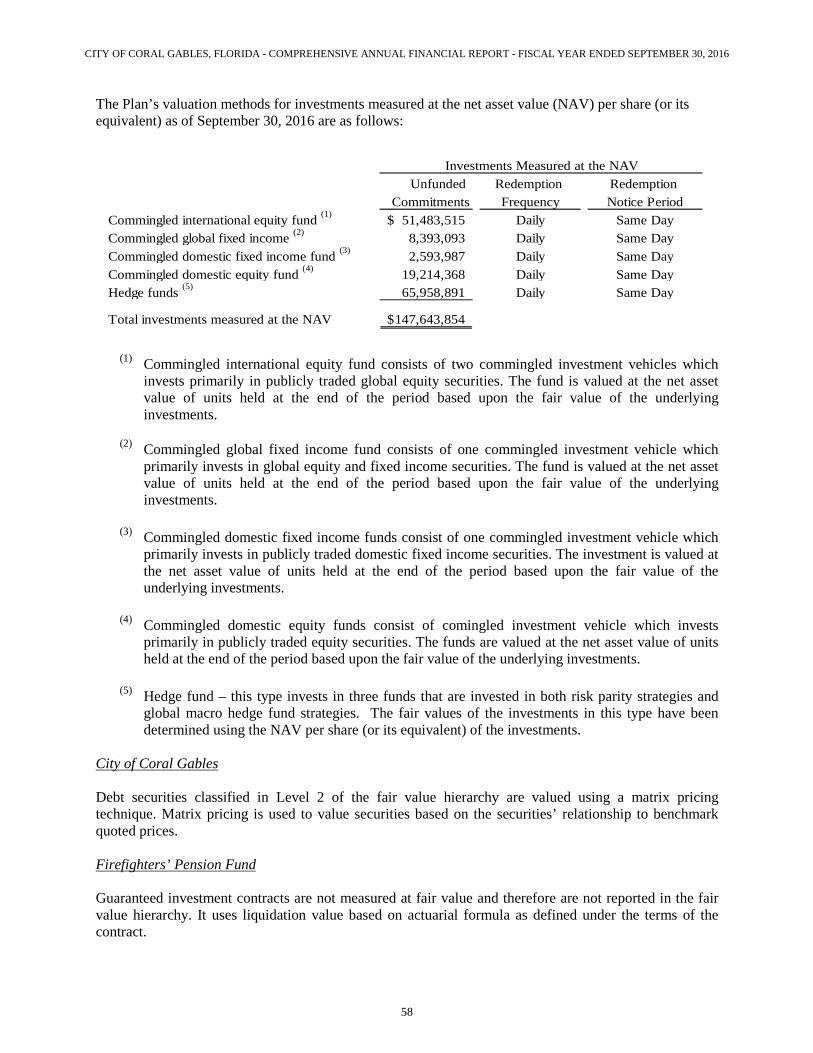
CITY OF CORAL GABLES, FLORIDA - COMPREHENSIVE ANNUAL FINANCIAL REPORT - FISCAL YEAR ENDED SEPTEMBER 30, 2016
The Plan’s valuation methods for investments measured at the net asset value (NAV) per share (or its
equivalent) as of September 30, 2016 are as follows:
Unfunded Redemption Redemption
Commitments Frequency Notice Period
Commingled international equity fund (1)
51,483,515$ Daily Same Day
Commingled global fixed income (2)
8,393,093 Daily Same Day
Commingled domestic fixed income fund (3)
2,593,987 Daily Same Day
Commingled domestic equity fund (4)
19,214,368 Daily Same Day
Hedge funds (5)
65,958,891 Daily Same Day
Total investments measured at the NAV 147,643,854$
Investments Measured at the NAV
(1) Commingled international equity fund consists of two commingled investment vehicles which
invests primarily in publicly traded global equity securities. The fund is valued at the net asset
value of units held at the end of the period based upon the fair value of the underlying
investments.
(2) Commingled global fixed income fund consists of one commingled investment vehicle which
primarily invests in global equity and fixed income securities. The fund is valued at the net asset
value of units held at the end of the period based upon the fair value of the underlying
investments.
(3) Commingled domestic fixed income funds consist of one commingled investment vehicle which
primarily invests in publicly traded domestic fixed income securities. The investment is valued at
the net asset value of units held at the end of the period based upon the fair value of the
underlying investments.
(4) Commingled domestic equity funds consist of comingled investment vehicle which invests
primarily in publicly traded equity securities. The funds are valued at the net asset value of units
held at the end of the period based upon the fair value of the underlying investments.
(5) Hedge fund – this type invests in three funds that are invested in both risk parity strategies and
global macro hedge fund strategies. The fair values of the investments in this type have been
determined using the NAV per share (or its equivalent) of the investments.
City of Coral Gables
Debt securities classified in Level 2 of the fair value hierarchy are valued using a matrix pricing
technique. Matrix pricing is used to value securities based on the securities’ relationship to benchmark
quoted prices.
Firefighters’ Pension Fund
Guaranteed investment contracts are not measured at fair value and therefore are not reported in the fair
value hierarchy. It uses liquidation value based on actuarial formula as defined under the terms of the
contract.
58
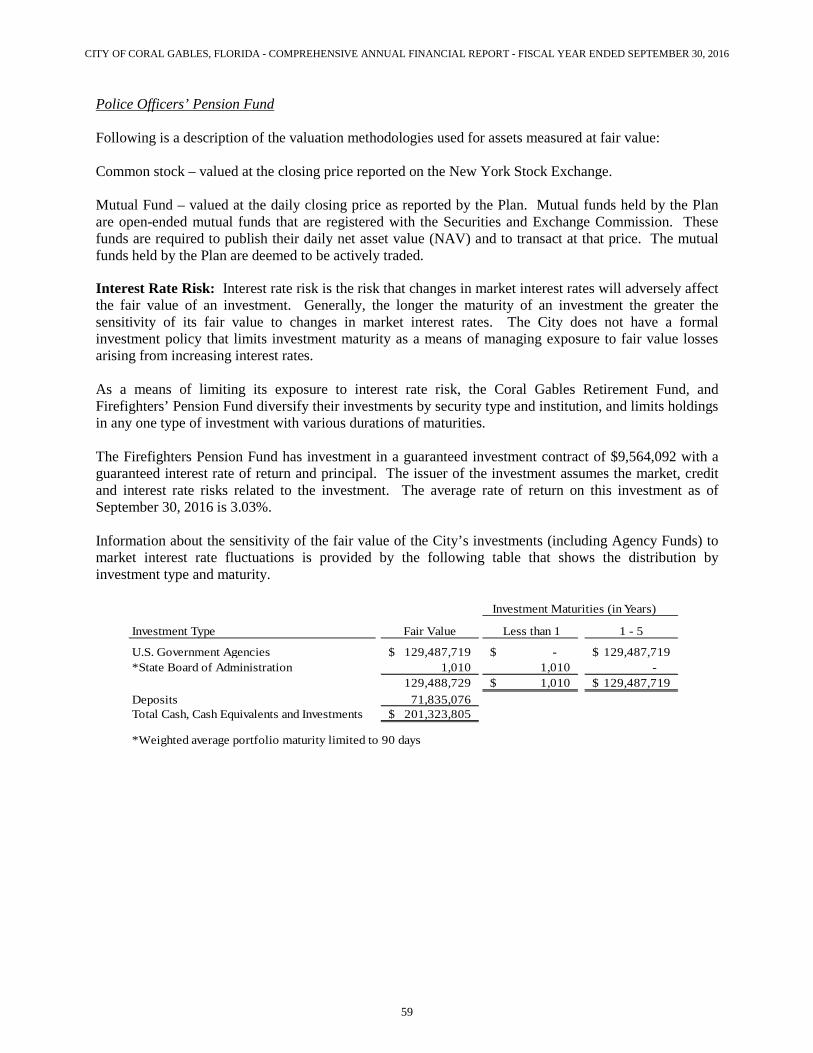
CITY OF CORAL GABLES, FLORIDA - COMPREHENSIVE ANNUAL FINANCIAL REPORT - FISCAL YEAR ENDED SEPTEMBER 30, 2016
Police Officers’ Pension Fund
Following is a description of the valuation methodologies used for assets measured at fair value:
Common stock – valued at the closing price reported on the New York Stock Exchange.
Mutual Fund – valued at the daily closing price as reported by the Plan. Mutual funds held by the Plan
are open-ended mutual funds that are registered with the Securities and Exchange Commission. These
funds are required to publish their daily net asset value (NAV) and to transact at that price. The mutual
funds held by the Plan are deemed to be actively traded.
Interest Rate Risk: Interest rate risk is the risk that changes in market interest rates will adversely affect
the fair value of an investment. Generally, the longer the maturity of an investment the greater the
sensitivity of its fair value to changes in market interest rates. The City does not have a formal
investment policy that limits investment maturity as a means of managing exposure to fair value losses
arising from increasing interest rates.
As a means of limiting its exposure to interest rate risk, the Coral Gables Retirement Fund, and
Firefighters’ Pension Fund diversify their investments by security type and institution, and limits holdings
in any one type of investment with various durations of maturities.
The Firefighters Pension Fund has investment in a guaranteed investment contract of $9,564,092 with a
guaranteed interest rate of return and principal. The issuer of the investment assumes the market, credit
and interest rate risks related to the investment. The average rate of return on this investment as of
September 30, 2016 is 3.03%.
Information about the sensitivity of the fair value of the City’s investments (including Agency Funds) to
market interest rate fluctuations is provided by the following table that shows the distribution by
investment type and maturity.
Investment Type Fair Value Less than 1 1 - 5
U.S. Government Agencies 129,487,719$ -$ 129,487,719$
*State Board of Administration 1,010 1,010 -
129,488,729 1,010$ 129,487,719$
Deposits 71,835,076
Total Cash, Cash Equivalents and Investments 201,323,805$
*Weighted average portfolio maturity limited to 90 days
Investment Maturities (in Years)
59

CITY OF CORAL GABLES, FLORIDA - COMPREHENSIVE ANNUAL FINANCIAL REPORT - FISCAL YEAR ENDED SEPTEMBER 30, 2016
Information about the sensitivity of the fair values of the Coral Gables Retirement Fund’s investments to
market interest rate fluctuations is provided by the following table that shows the distribution of the
Plan’s investments by maturity at September 30, 2016:
Fair Less More
Investment Type Value than 1 1-5 6-10 than 10
U.S. government and agency 17,507,028$ 208,004$ 5,377,588$ 1,784,650$ 10,136,786$
Corporate bonds 15,530,070 1,313,607 9,045,583 4,363,016 807,864
Global fixed income 8,393,093 - - - 8,393,093
Other fixed income 2,593,987 - - - 2,593,987
44,024,178$ 1,521,611$ 14,423,171$ 6,147,666$ 21,931,730$
Investment Maturities (in Years)
The Police Officers’ Pension Fund’s investment policy does not use limits on investment maturities as a means
of managing its exposure to fair value losses arising from increasing interest rates. Information about the
distribution of the Plan’s investments by maturity at September 30, 2016 is provided by the following table:
Fair Less More
Investment Type Value than 1 1-5 6-10 than 10
Fixed income mutual funds 1,568,392$ 25,848$ 800,331$ 512,951$ 229,262$
Investment Maturities (in Years)
Credit Risk: Generally, credit risk is the risk that an issuer of an investment will not fulfill its obligation to the
holder of the investment. This is measured by the assignment of a rating by a nationally recognized statistical
rating organization (NRSRO’s). It is the City’s and Firefighters’ Pension Fund’s policy to limit its investment
to the top rating issued by NRSRO’s. Information about the sensitivity of the fair value of the City’s and
Firefighters’ Pension Fund’s investments to credit ratings is provided by the following table that shows the
distribution of the investments by investment type:
Investment Type City
Firefighters'
Pension Fund
US Treasury Securities Aaa 25,031,460$ -$
US Agency Discount Notes P-1 40,468,547 -
US Agency Fixed Rate Debentures Aaa 63,987,712 -
Guaranteed Investment Contract Aa2 - 9,564,092
Mutual Funds Not Rated - 5,695,837
State Board of Administration AAAm* 1,010 -
129,488,729$ 15,259,929$
*-rated by Standard and Poor's
Fair Value
Credit Rating
Moody's
The Coral Gables Retirement Fund and Police Officers’ Pension Fund investment policy utilizes portfolio
diversification in order to control credit risk.
60

CITY OF CORAL GABLES, FLORIDA - COMPREHENSIVE ANNUAL FINANCIAL REPORT - FISCAL YEAR ENDED SEPTEMBER 30, 2016
The following table discloses Coral Gables Retirement Fund’s credit ratings by investment type, at September
30, 2016 as applicable:
Percentage
Fair Value of Portfolio
U.S. government guaranteed* 17,507,028$ 39.77%
Rating of credit risk debt securities by S&P:
AAA 499,864 1.14%
AA+ 85,267 0.19%
AA 469,117 1.07%
AA- 874,503 1.99%
A+ 151,314 0.34%
A 2,719,054 6.18%
A- 2,902,098 6.59%
BBB+ 4,848,584 11.01%
BBB 1,706,970 3.88%
BBB- 394,109 0.89%
Not rated 11,866,270 26.95%
Total credit risk debt securities 26,517,150 60.23%
Total fixed income securities $ 44,024,178 100%
*Obligations of the U.S. government or obligations explicitly or implicitly guaranteed by the U.S. government
are not considered to have credit risk and do not have purchase limitations.
The following table discloses Police Officers’ Pension Fund’s credit ratings by investment type, at September
30, 2016 as applicable:
Percentage
Fair Value of Portfolio
Rating of credit risk debt securities by Moody's :
Aaa 116,403$ 7.42%
Aa 28,874 1.84%
A 76,155 4.86%
Aa1 15,042 0.96%
Aa2 28,971 1.85%
Aa3 33,428 2.13%
A1 55,713 3.55%
A2 75,769 4.83%
A3 84,126 5.36%
Baa 120,733 7.70%
Baa1 37,328 2.38%
Baa2 32,871 2.10%
Baa3 32,313 2.06%
Ba1 3,900 0.25%
Ba2 557 0.04%
Ba3 557 0.04%
B1 1,114 0.07%
Not rated 824,538 52.57%
Total credit risk fixed income investments $ 1,568,392 100%
61

CITY OF CORAL GABLES, FLORIDA - COMPREHENSIVE ANNUAL FINANCIAL REPORT - FISCAL YEAR ENDED SEPTEMBER 30, 2016
Concentration of Credit Risk: The Coral Gables Retirement Fund policy limits investments in equities and
fixed income securities to no more than 10% and 10% of an investment manager's portfolio, respectively, in
any one issue. There was no individual investment that represents more than 10% of an investment manager’s
portfolio. The investment policy of the Police Officers' Pension Fund and Firefighters’ Pension Fund contain
limitations on the amount that can be invested in any one issuer as well as maximum portfolio allocation
percentages. There were no individual investments that represent 5% or more of net position at September 30,
2016 for the City and pension trust fund portfolios.
Custodial Credit Risk: The City does not have a formal policy, but its practice is to ensure that all
investments are held by the City or its counterparty in the City's name. These investments are uninsured and
unregistered. In accordance with the Coral Gables Retirement Fund investment policy, investments are held
by the Plan’s custodial banks and registered in the Plan's name. All of the Plan's deposits are insured and or
collateralized by a financial institution separate from the Fund's depository financial institution. In accordance
with the Police Officers' Pension Fund’s and Firefighters’ Pension Fund’s investment policy, investments are
held by the Plan's custodial bank and registered in the Plan's name. All of the Plan's deposits are insured
and/or collateralized by a financial institution separate from the Plan's depository financial institution.
Foreign Currency Risk: Foreign currency risk is the risk that fluctuations in currency exchange rate may
affect transactions conducted in currencies other than US Dollars as well as carrying value of foreign
investments. The Police Officers' Pension Fund’s exposure to foreign currency risk derives mainly from its
investment in international equity funds. The Plan owns participation in international equity funds as well as
individual securities. The investment policy of the Plan limits the foreign investments to no more than 25% of
the Plan’s investment balance. As of year-end, the foreign investments were 12.75% of total investments. The City, Coral Gables Retirement Fund and the Firefighters’ Pension Fund do not have investments in foreign
currency and therefore not subject to foreign currency risk.
Coral Gables Retirement Fund - Securities Lending Transactions
The Coral Gables Retirement Fund is authorized by the state statutes and the Board policies to lend its
investment securities. The lending is managed by the Plan's custodial bank. The Plan lends equity and fixed
income securities for varying terms and receives a fee based on the loaned securities' value. During a loan, the
Plan continues to receive dividends and interest as the owner of the loaned securities. All loans can be
terminated on demand by either the Plan or the borrowers, although the average term of loans is approximately
forty days. The custodial bank and its affiliates are prohibited from borrowing the system's securities.
The agent lends the Plan's U.S. government and agency securities and domestic corporate fixed-income and
equity securities for securities or cash collateral of at least 102 percent and international securities of at least
105 percent of the securities plus any accrued interest. The securities lending contracts do not allow the Plan
to pledge or sell any collateral securities unless the borrower defaults. Cash collateral is invested in the agent's
collateral investment pool, whose share values are based on the amortized cost of the pool's investments. At
year end, the pool has a weighted average term to maturity of forty-five days.
The relationship between the maturities of the investment pool and the Plan's loans is affected by the maturities
of the securities loans made by other entities that use the agent's pool, which the Plan cannot determine. There
are policy restrictions by the custodial bank that limits the amount of securities that can be lent at one time or
to one borrower.
62

CITY OF CORAL GABLES, FLORIDA - COMPREHENSIVE ANNUAL FINANCIAL REPORT - FISCAL YEAR ENDED SEPTEMBER 30, 2016
The following represents the balances relating to securities lending transactions at September 30, 2016:
Market Value Fair Value of
of Securities Cash Collateral
Securities Lent: on Loan for Cash Invested
U.S. government and
agency obligations 2,165,558$ 2,213,462$
Domestic corporate stocks 37,260,965 38,012,927
Domestic corporate bonds 3,309,232 3,387,489
Total Securities Lent $ 42,735,755 $ 43,613,878
The contract with the Plan's custodian requires the custodian to indemnify the Plan if the borrower fails to
return the securities, due to the insolvency of a borrower, and the custodian has failed to live up to its
contractual responsibilities relating to the lending of those securities. At year end, the Plan has no credit risk
exposure to borrowers because the amounts of collateral held by the Plan exceed the amounts the borrowers
owe the Plan. There are no significant violations of legal or contractual provisions, no borrowers or lending
agent default losses, and no recoveries of prior period losses during the year. There are no income
distributions owing on securities lent.
63

CITY OF CORAL GABLES, FLORIDA - COMPREHENSIVE ANNUAL FINANCIAL REPORT - FISCAL YEAR ENDED SEPTEMBER 30, 2016
NOTE 5 CAPITAL ASSETS
Beginning Additions/ Retirements/ Ending
Balance Transfers Transfers Balance
Governmental Activities:
Nondepreciable Assets:
Land $ 45,407,634 $ 7,114,313 $ - $ 52,521,947
Construction in Progress 13,051,473 15,058,023 (10,268,204) 17,841,292
Total Non-depreciable Assets 58,459,107 22,172,336 (10,268,204) 70,363,239
Depreciable Assets:
Infrastructure 113,068,020 - - 113,068,020
Buildings 63,643,946 4,270,857 - 67,914,803
Improvements Other Than Buildings 49,792,845 295,204 - 50,088,049
Machinery and Equipment 49,954,506 11,134,441 (1,286,171) 59,802,776
Total Depreciable Assets 276,459,317 15,700,502 (1,286,171) 290,873,648
Less Accumulated Depreciation for:
Infrastructure 78,599,113 3,021,254 - 81,620,367
Buildings 23,032,887 1,248,308 - 24,281,195
Improvements Other Than Buildings 14,629,816 1,225,375 - 15,855,191
Machinery and Equipment 38,586,621 3,330,867 (1,286,171) 40,631,317
Total Accumulated Depreciation 154,848,437 8,825,804 (1,286,171) 162,388,070
Total Depreciable Assets, net 121,610,880 6,874,698 - 128,485,578
Governmental Activities Capital Assets, net $ 180,069,987 $ 29,047,034 $ (10,268,204) $ 198,848,817
Business-Type Activities:
Nondepreciable Assets:
Land $ 3,701,838 $ - $ - $ 3,701,838
Construction in Progress 3,019,441 1,596,209 - 4,615,650
Total Non-depreciable Assets 6,721,279 1,596,209 - 8,317,488
Depreciable Assets:
Infrastructure 27,322,134 - - 27,322,134
Buildings 30,247,473 - - 30,247,473
Improvements Other Than Buildings 605,157 27,099 - 632,256
Machinery and Equipment 2,926,096 924,582 - 3,850,678
Total Depreciable Assets 61,100,860 951,681 - 62,052,541
Less Accumulated Depreciation for:
Infrastructure 11,014,749 441,606 - 11,456,355
Buildings 11,504,470 584,879 - 12,089,349
Improvements Other Than Buildings 396,748 33,387 - 430,135
Machinery and Equipment 2,153,979 301,833 - 2,455,812
Total Accumulated Depreciation 25,069,946 1,361,705 - 26,431,651
Total Depreciable Assets, net 36,030,914 (410,024) - 35,620,890
Business-Type Activities Capital Assets, net $ 42,752,193 $ 1,186,185 $ - $ 43,938,378
Governmental Activities:
General Government $ 3,926,666
Public Safety 1,665,625
Transportation 1,451,447
Culture and Recreation 1,145,216
Physical Environment 636,850
$ 8,825,804
Business-Type Activities:
Sanitary Sewer System Fund $ 355,483
Parking System Fund 919,432
Stormwater Utility Fund 86,790
$ 1,361,705
Total depreciation expense – Governmental Activities
The following summarizes capital asset activity for the fiscal year ended September 30, 2016:
Depreciation expense was charged to functions/programs of the City as follows for the fiscal year ended September 30, 2016:
Total depreciation expense – Business-Type Activities
64
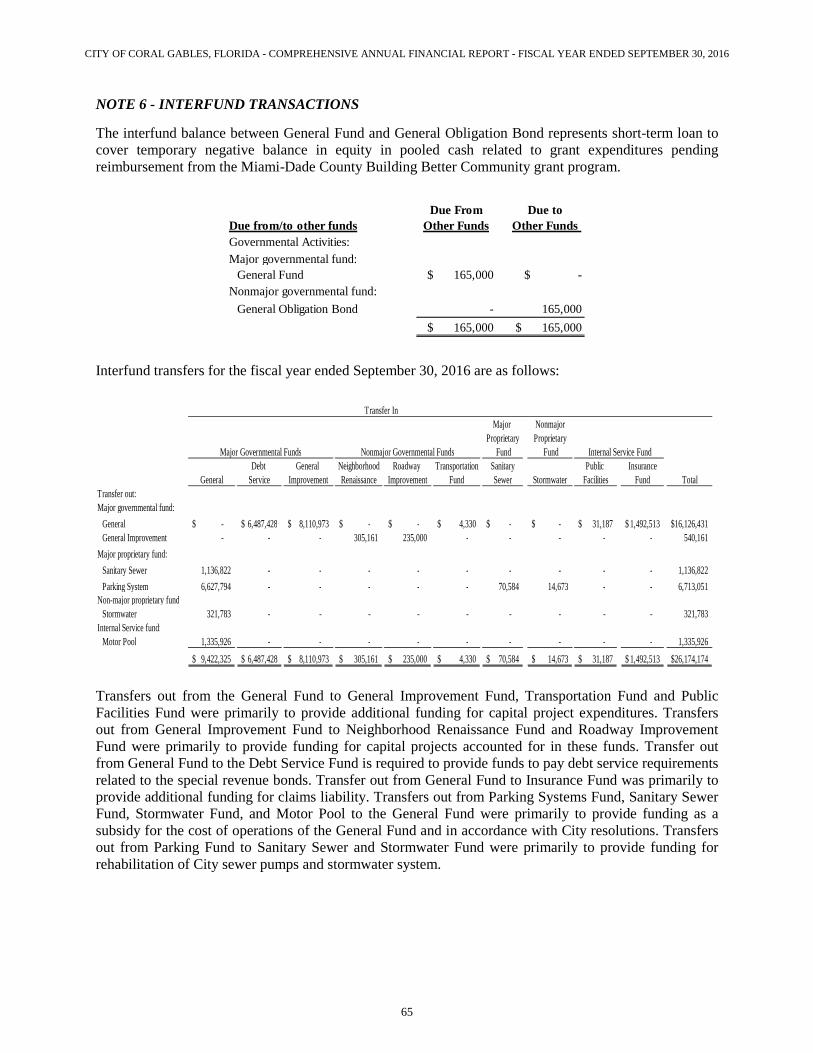
CITY OF CORAL GABLES, FLORIDA - COMPREHENSIVE ANNUAL FINANCIAL REPORT - FISCAL YEAR ENDED SEPTEMBER 30, 2016
NOTE 6 - INTERFUND TRANSACTIONS
The interfund balance between General Fund and General Obligation Bond represents short-term loan to
cover temporary negative balance in equity in pooled cash related to grant expenditures pending
reimbursement from the Miami-Dade County Building Better Community grant program.
Due from/to other funds
Due From
Other Funds
Due to
Other Funds
Governmental Activities:
Major governmental fund:
General Fund $ 165,000 $ -
Nonmajor governmental fund:
General Obligation Bond - 165,000
$ 165,000 $ 165,000
Interfund transfers for the fiscal year ended September 30, 2016 are as follows:
Major Nonmajor
Proprietary Proprietary
Fund Fund
Debt General Neighborhood Roadway Transportation Sanitary Public Insurance
General Service Improvement Renaissance Improvement Fund Sewer Stormwater Facilities Fund Total
Transfer out:
Major governmental fund:
General -$ 6,487,428$ 8,110,973$ -$ -$ 4,330$ -$ -$ 31,187$ 1,492,513$ 16,126,431$
General Improvement - - - 305,161 235,000 - - - - - 540,161
Major proprietary fund:
Sanitary Sewer 1,136,822 - - - - - - - - - 1,136,822
Parking System 6,627,794 - - - - - 70,584 14,673 - - 6,713,051
Non-major proprietary fund
Stormwater 321,783 - - - - - - - - - 321,783
Internal Service fund:
Motor Pool 1,335,926 - - - - - - - - - 1,335,926
9,422,325$ 6,487,428$ 8,110,973$ 305,161$ 235,000$ 4,330$ 70,584$ 14,673$ 31,187$ 1,492,513$ 26,174,174$
Transfer In
Major Governmental Funds Nonmajor Governmental Funds Internal Service Fund
Transfers out from the General Fund to General Improvement Fund, Transportation Fund and Public
Facilities Fund were primarily to provide additional funding for capital project expenditures. Transfers
out from General Improvement Fund to Neighborhood Renaissance Fund and Roadway Improvement
Fund were primarily to provide funding for capital projects accounted for in these funds. Transfer out
from General Fund to the Debt Service Fund is required to provide funds to pay debt service requirements
related to the special revenue bonds. Transfer out from General Fund to Insurance Fund was primarily to
provide additional funding for claims liability. Transfers out from Parking Systems Fund, Sanitary Sewer
Fund, Stormwater Fund, and Motor Pool to the General Fund were primarily to provide funding as a
subsidy for the cost of operations of the General Fund and in accordance with City resolutions. Transfers
out from Parking Fund to Sanitary Sewer and Stormwater Fund were primarily to provide funding for
rehabilitation of City sewer pumps and stormwater system.
65

CITY OF CORAL GABLES, FLORIDA - COMPREHENSIVE ANNUAL FINANCIAL REPORT - FISCAL YEAR ENDED SEPTEMBER 30, 2016
NOTE 7 - LONG-TERM DEBT
(a) Following is a summary of the City’s Special Obligation Bonds at September 30, 2016:
Balance
Issue Maturity Interest Amount Amount Amount Outstanding Current
Date Date Rate Authorized Issued Retired 09/30/16 Portion
06-30-2011 10-01-2016 0.93% $ 2,440,000 $ 2,440,000 $ 1,915,000 $ 525,000 525,000$
06-30-2011 10-01-2032 1.51% 4,365,000 4,365,000 630,000 3,735,000 170,000
06-05-2012 10-01-2031 2.67% 43,096,290 43,096,290 7,898,947 35,197,343 1,991,124
02-28-2013 10-01-2028 2.40% 7,725,700 7,725,700 772,800 6,952,900 400,200
02-28-2013 10-01-2028 3.43% 4,350,000 4,350,000 465,000 3,885,000 240,000
12-19-2014 04-01-2030 2.50% 6,500,000 6,500,000 365,000 6,135,000 370,000
02-26-2016 04-01-2019 2.00% 570,000 570,000 - 570,000 -
04-28-2016 04-01-2037 2.92% 16,975,000 16,975,000 - 16,975,000 -
04-28-2016 04-01-2037 3.045% 4,460,000 4,460,000 - 4,460,000 -
90,481,990 90,481,990 12,046,747 78,435,243 3,696,324
06-05-2012 10-01-2031 2.67% 6,253,710 6,253,710 1,146,053 5,107,657 288,876
02-28-2013 10-01-2028 2.40% 9,069,300 9,069,300 907,200 8,162,100 469,800
08-12-2014 10-01-2024 2.42% 3,770,000 3,770,000 335,000 3,435,000 345,000
19,093,010 19,093,010 2,388,253 16,704,757 1,103,676
$ 109,575,000 $ 109,575,000 $ 14,435,000 $ 95,140,000 $ 4,800,000
Governmental Activities:
Business-Type Activities:
The City’s special obligation bonds consist of loans from the Sunshine State Governmental Financing
Commission to provide funds for the acquisition, construction and improvements of capital facilities, and
are collateralized and payable from non-ad valorem tax revenues of the City and capital special assessments
imposed on local areas within the City. With respect to the governmental special obligation bonds, fiscal
year 2016 debt service was $5,427,124 while total non-ad valorem tax revenue totaled $69,376,638. For the
business-type special obligation bonds, fiscal year 2016, debt service totaled $1,431,627 while total non-ad
valorem revenue totaled $25,625,571. All revenue pledges remain in effect for the life of the special
obligation bonds through final maturity date of April 1, 2037.
In fiscal year 2016, the City issued special obligation bond as follows:
Series 2016A - On April 28, 2016, the City issued Capital Improvement Revenue Bonds, Series 2016A
with principal amount of $16,975,000 plus bond premium of $1,646,707 to finance the cost of the Miracle
Mile Streetscape Project. The bonds are secured by the City’s covenant to budget and appropriate from
legally available non ad valorem revenues. In addition, the bonds are secured by special assessment in
the total amount of $6.5M imposed on benefited property owners on Miracle Mile .The Series 2016A is
tax-exempt and has an all-in-true interest cost of 2.92% payable on April 1 and October 1 of each year and
matures on April 1, 2037. Principal amount is paid annually starting April 1, 2018. The Series 2016A
Bonds are subject to extraordinary mandatory redemption prior to maturity at par on a pro rata basis from
special assessment fully prepaid by property owners.
Series 2016B - On April 28, 2016, the City issued Capital Improvement Revenue Bonds, Series 2016B
with principal amount of $4,460,000 plus bond premium of $141,918 to finance the cost of the Giralda
Avenue Streetscape Project. The bonds are secured by the City’s covenant to budget and appropriate from
legally available non ad valorem revenues. In addition, the bonds are secured by special assessment in
the total amount of $1.67M imposed on benefited property owners on Giralda Avenue. The Series 2016B
is tax-exempt and has an all-in-true interest cost of 2.92% payable on April 1 and October 1 of each year
66

CITY OF CORAL GABLES, FLORIDA - COMPREHENSIVE ANNUAL FINANCIAL REPORT - FISCAL YEAR ENDED SEPTEMBER 30, 2016
and matures on April 1, 2037. The Series 2016A Bonds are subject to extraordinary mandatory redemption
prior to maturity at par on a pro rata basis from special assessment fully prepaid by property owners.
Series 2016C - On February 26, 2016, the City issued Capital Improvement Revenue Bonds, Series
2016C with principal amount of $570,000 to finance the costs of the Miracle Mile and Giralda Avenue
Streetscape Projects that were not eligible for tax exempt funding. The bonds are secured by the City’s
covenant to budget and appropriate from legally available non ad valorem revenues. Series 2016C is
taxable and has a fixed interest rate of 2% payable on April 1 and October 1 of each year and matures on
April 1, 2019. Principal amount is paid annually starting April 1, 2016.
The City has utilized the Sunshine State Governmental Financing Commission (the “Commission”) since
1987 as its source to finance the acquisition and construction of City facilities. The Commission was
created in November 1985, initially by the cities of Tallahassee and Orlando, Florida. As of September 30,
2015, the Commission’s membership consists of the following Florida governmental units: City of Coral
Gables; City of Coral Springs; City of Daytona Beach; City of Ft. Lauderdale; City of Jacksonville; City of
Lakeland; City of Miami; City of Hollywood; City of Miami Beach; City of Orlando; City of St. Petersburg;
City of Tallahassee; City of Vero Beach; Miami-Dade County; Palm Beach County; and Polk County. In
addition, the City of Fort Pierce, Leon County, and the City of West Palm Beach participate in the
Commission’s programs as non-members. Other Florida local governments may in the future become
members or non-member participants, including units of government such as special districts or other
qualifying public agencies. Each member government appoints a representative to the Commission. These
representatives elect a five-member board of directors to administer the loan program.
67

CITY OF CORAL GABLES, FLORIDA - COMPREHENSIVE ANNUAL FINANCIAL REPORT - FISCAL YEAR ENDED SEPTEMBER 30, 2016
Total annual debt service requirements on long-term debt outstanding as of September 30, 2016, are as follows:
Business-Type
Fiscal Activities
Year Principal Interest Total Required Principal Interest Total Total
Required Requirements
2017 1,103,676$ 401,697$ 1,505,373$ 31,740$ 1,209$ 32,949$ 1,538,322$
2018 1,263,758 372,358 1,636,116 32,380 570 32,950 1,669,066
2019 1,290,893 340,684 1,631,577 8,195 41 8,236 1,639,813
2020 1,320,962 308,302 1,629,264 - - - 1,629,264
2021 1,255,139 276,456 1,531,595 - - - 1,531,595
2022-2026 6,420,613 897,139 7,317,752 - - - 7,317,752
2027-2031 3,719,285 226,895 3,946,180 - - - 3,946,180
2032-2036 330,431 4,398 334,829 - - - 334,829
Total 16,704,757 2,827,929$ 19,532,686$ 72,315 1,820$ 74,135$ 19,606,821$
Less: Current portion (1,103,676) (31,740)
Long-term portion 15,601,081$ 40,575$
Governmental
Fiscal Activities
Year Principal Interest Total Principal Interest Total Total
Required Required Requirements
2017 3,696,324$ 2,270,372$ 5,966,696$ 28,153$ 2,726$ 30,879$ 5,997,575$
2018 4,456,242 2,224,668 6,680,910 69,587 1,572 71,159 6,752,069
2019 4,554,107 2,100,935 6,655,042 - - - 6,655,042
2020 4,669,038 1,974,206 6,643,244 - - - 6,643,244
2021 4,114,861 1,850,319 5,965,180 - - - 5,965,180
2022-2026 22,999,387 7,360,283 30,359,670 - - - 30,359,670
2027-2031 22,740,715 3,669,812 26,410,527 - - - 26,410,527
2032-2036 9,694,569 934,385 10,628,954 10,628,954
2037-2041 1,510,000 47,188 1,557,188 - - - 1,557,188
Total 78,435,243 22,432,168$ 100,867,411$ 97,740 4,298$ 102,038$ 100,969,449$
Less: Current portion (3,696,324) (28,153)
Long-term portion 74,738,919$ 69,587$
During the year ended September 30, 2016, the following changes occurred in long-term liabilities of governmental activities:
AMOUNTS
DUE
BEGINNING ENDING WITHIN
BALANCE ADDITIONS REDUCTIONS BALANCE ONE YEAR
Accrued Compensated Absences 9,235,410$ 4,853,695$ 4,875,109$ 9,213,996$ 5,140,322$
Claims Payable 11,928,000 5,357,383 3,263,383 14,022,000 6,092,000
Special Obligation Debt 60,054,735 22,005,000 3,624,492 78,435,243 3,696,324
Premium on Special Obligation Debt - 1,788,626 - 1,788,626 -
Capital Lease 254,690 - 156,950 97,740 28,153
Pollution Remediation Obligation 25,000 - - 25,000 25,000
Net OPEB Obligation 7,978,119 1,126,227 - 9,104,346 -
Net Pension Liability 206,923,480 15,628,851 - 222,552,331 -
296,399,434$ 50,759,782$ 11,919,934$ 335,239,282$ 14,981,799$
During the year ended September 30, 2016, the following changes occurred in long-term liabilities of business type activities:
AMOUNTS
DUE
BEGINNING ENDING WITHIN
BALANCE ADDITIONS REDUCTIONS BALANCE ONE YEAR
Accrued Compensated Absences 286,636$ 164,201$ 145,669$ 305,168$ 182,738$
Special Obligation Debt 17,785,265 - 1,080,508 16,704,757 1,103,676
Capital Lease 214,599 - 142,284 72,315 31,740
Net OPEB Obligation 189,464 25,644 - 215,108 -
Net Pension Liability 5,915,166 684,410 - 6,599,576 -
24,391,130$ 874,255$ 1,368,461$ 23,896,924$ 1,318,154$
Special Obligation Bonds Capital Leases
NOTE 7 - LONG-TERM DEBT (CONTINUED)
Special Obligation Bonds
GOVERNMENTAL ACTIVITIES
Capital Leases
BUSINESS-TYPE ACTIVITIES
68

CITY OF CORAL GABLES, FLORIDA - COMPREHENSIVE ANNUAL FINANCIAL REPORT - FISCAL YEAR ENDED SEPTEMBER 30, 2016
(b) Deferred Charge on Refunding/Deferred Outflow
The City has refunded certain special obligation bonds in prior years that resulted in a deferred loss on
refunding in total amount of $530,801. This amount is reported as deferred charge on refunding in the
statement of net position and amortized over the life of the refunding debt. As of September 30, 2016, the
unamortized amounts of deferred charge on refunding are $200,491 for governmental activities and
$134,194 for business-type activities.
See Note 8 for information on deferred outflows/inflows related to pension.
All of the City’s outstanding loans are tax exempt except for the $4,365,000 loan issued on June 30, 2011
and $570,000 loan issued on February 26, 2016, which are taxable.
(c) Capital Lease Obligations
The City has entered into certain lease agreements as lessee for financing the acquisition of certain
vehicles and equipment for use by different departments. These lease agreements qualify as capital leases
for accounting purposes and, therefore, have been recorded at the present value of their future minimum
lease payments as of the inception date. The capital lease obligations of both governmental activities and
business-type activities are payable from non-ad valorem revenues of the City.
The original present value of the minimum payments under the arrangement and the capitalized basis is
$5,001,684 net of accumulated depreciation of $3,171,708 for governmental activities; and $858,406 as
the capitalized basis and $764,562 accumulated depreciation for business-type activities.
Future minimum lease obligations are as follows:
Business-Type Activities
Year ending September 30: Amount
Total minimum lease payments -2016 74,135$
Less: Amount representing interest (1,820)
Present value of minimum lease payments 72,315$
Governmental Activities
Year ending September 30: Amount
Total minimum lease payments -2016 102,038$
Less: Amount representing interest (4,298)
Present value of minimum lease payments 97,740$
69

CITY OF CORAL GABLES, FLORIDA - COMPREHENSIVE ANNUAL FINANCIAL REPORT - FISCAL YEAR ENDED SEPTEMBER 30, 2016
NOTE 8 - EMPLOYEE PENSION PLANS
The City’s employee retirement plans include one single-employer defined benefit plan and five defined
contribution plans.
(a) Defined Benefit Plan Coral Gables Retirement Plan
(1) Plan Description
Organization - The City of Coral Gables Retirement System (the “Plan”) is a single employer defined
benefit pension plan, covering substantially all regular full-time general, police, and fire department
employees of the City of Coral Gables, Florida (the “City”) that have met the conditions of eligibility.
The following is a brief description of the Plan provided for general information purposes only. Members
should refer to the Plan documents for more complete information.
Plan Membership - Plan membership consisted of the following as of October 1, 2015:
Retirees and beneficiaries currently receiving benefits, including DROP,
and terminated employees entitled to benefits, but not yet receiving them 965
Current Employees:
Vested 272
Non-vested 300
Total 572
Pension Benefits
Firefighters, police officers and participants, other than firefighters and police officers with more than 10
years of credit service at September 30, 2010 may retire and receive normal retirement benefits upon
reaching the earlier of age 52 and 10 years of credited service; age 65 or when the participants age plus
years of credited service equals or exceeds 70 (Rule of 70). Participants other than firefighters and police
officers with less than 10 years of credited service at September 30, 2010, may retire and receive normal
benefits upon reaching the earlier of age 62 and 10 years of credited service; age 65 and 6 years of
service; or when the participant’s age, plus years of credited service equals or exceeds 80 (Rule of 80).
For police officers with less than 10 years of credited service at September 30, 2012, normal retirement
shall be the earliest of (a) age 55 and 10 years of credited service or (b) 25 years of credited service.
Effective September 30, 2013, the normal retirement date for firefighters with less than ten years of
credited service on September 30, 2013, and firefighters hired on or after that date means the first day of
the month coincident with or next following the date on which the participant attains 51 years of age with
25 years of credited service, or “Rule of 76” (age plus years of credited service equal 76); provided, any
such member whose normal retirement date under the “Rule of 76” would be after age 59 and who is
within 12 months of completing 10 years of credited service on October 15, 2013 shall retain the “Rule of
70” normal retirement date.
Upon normal retirement, police officers eligible for normal retirement at September 30, 2012 and
firefighters eligible for normal retirement at September 30, 2013 will receive a monthly pension, payable
for life, equal to 3% of the highest three-year average annual earnings multiplied by years of credited
70

CITY OF CORAL GABLES, FLORIDA - COMPREHENSIVE ANNUAL FINANCIAL REPORT - FISCAL YEAR ENDED SEPTEMBER 30, 2016
service with a maximum of 75% of average annual earnings. For police officers not eligible for normal
retirement at September 30, 2012 the normal retirement benefits shall be 3% for the first 10 years of
credited service and 2.5% thereafter (however, credited service prior to September 30. 2012 will accrue at
3%), multiplied by average final compensation, with a maximum of 75% of average final compensation.
For firefighters, effective September 30, 2013, the monthly amount of normal retirement income payable
to firefighter hired on or after that date shall equal 3% of average final compensation multiplied by the
first 10 years of credited service, and 2.5% of average final compensation multiplied by the total years of
credited service in excess of the first 10 years of credited service, with the combined normal retirement
income not to exceed 75 percent of average final compensation. For employees other than firefighters and
police officers who are not included in any bargaining unit for collective bargaining purposes, effective
September 30, 2010, the normal retirement benefits for participants other than firefighters, police officers,
and excluded employees shall be accrued benefits as of September 30, 2010, plus 2.25% of the average
final compensation (highest five year average) multiplied by the total years of credited service with a
maximum of 75% of average final compensation.
Notwithstanding the foregoing, the normal retirement income payable to participants, other than police
officers and firefighters, who as of September 30, 2010 attained the normal retirement date in effect on
September 29, 2010, shall be based on the highest three-year average.
For employees other than firefighters and police officers who are not included in any bargaining unit for
collective bargaining purposes (excluded employees), normal retirement benefits are accrued benefits as
of September 30, 2010, plus the following:
(a) Managerial employees: 3% multiplier for first 10 years; 2.25% thereafter;
(b) Professional/supervisory employees: 2.5% multiplier for first 10 years; 2.25% thereafter;
(c) Confidential employees: 2.25% multiplier; and
(d) Appointed officials: 3% multiplier.
All participants, with the exception of members of the bargaining units represented by the Fraternal Order
of Police, Lodge No. 7, and the International Association of Firefighters, Local 1210, who retire after
completing 40 years of service, the benefit will be calculated using 80% of the highest two year average
annual earnings.
Early retirement, disability, death and other benefits are also provided. For police officers not eligible for
normal retirement at September 30, 2012, early retirement is eliminated. Firefighters who are employed
on September 30, 2013 and have not attained early retirement eligibility as of that date, and firefighters
hired on or after October 1, 2013, shall not be eligible for early retirement.
Deferred Retirement Option Plan - Members who continue employment with the City and pass their
normal retirement date may freeze their accrued benefit and enter the Deferred Retirement Option Plan
(the “DROP”). Maximum participation in the DROP shall be 5 years for general and police members and
8 years for firefighter members.
For members electing participation in the DROP, an individual DROP account shall be created. Payment
shall be made by the Plan into the member’s DROP account in an amount equal to the regular monthly
retirement benefit which the participant would have received had the participant separated from service
and commenced receipt of pension benefits.
DROP payments contributed to a member's DROP account earn interest at a rate equal to actual rate of
return on the Plan’s portfolio from a minimum of 3% to a maximum of the assumed rate of return.
71

CITY OF CORAL GABLES, FLORIDA - COMPREHENSIVE ANNUAL FINANCIAL REPORT - FISCAL YEAR ENDED SEPTEMBER 30, 2016
Upon termination of employment, the balance in the member’s DROP account, including interest, is
payable to them and they also begin to receive their monthly retirement benefit. The value of the DROP
accounts of all participants at September 30, 2016 was $36,740,993.
Cost of Living Adjustment - Effective January 1 of each year, participants who were receiving benefits for
the full preceding year will receive a cost of living increase based on a formula as defined in the
ordinance, if the fair value rate of return is greater than or equal to 10%. Effective February 10, 2015,
cost of living adjustments may be granted only if the Plan remains in a net positive experience position,
determined on a cumulative basis from July 1, 1994.
Termination - If a member terminates employment before retirement, their contributions are returned to
them. The Plan also provides a special provision for vested benefits for employees who terminate after 10
years of service.
Member Contribution - All police officer and firefighter (prior to September 30, 2013) participants are
required to contribute 5% of their total earnings to the Plan. Effective September 30, 2013, firefighters are
required to contribute 8% of pensionable earnings to the Plan. Effective September 30, 2014, all police
officer and firefighter participants are required to contribute 10% of their pensionable earnings to the
Plan. Members other than firefighters or police officers, who are not included in any bargaining unit for
collective bargaining purposes, are required to contribute 10% of total earnings to the Plan. Effective
October 1, 2010, all participants in the Teamsters Local Union 769 Bargaining Unit are required to
contribute 10% of total earnings to the Plan. Effective October 1, 2011 general employees who were
members of Local Union 769 and management employees shall have their contribution percentage
increased based on increases in City contribution requirements since the October 1, 2009 actuarial
provisions. For the fiscal year ended September 30, 2012, Union 769 employees’ contribution was
determined to be 14.27% and management employees 13.79%. Effective October 1, 2013, the
contribution rate for management and union employees were 15.00% and 17.00%, respectively, of
compensation. Effective October 1, 2014, excluded employees shall contribute in accordance with the
cost-sharing provision with the City.
Funding Requirements – The City is required to pay into the Plan such amount as necessary to maintain
the actuarial soundness of the Plan and to provide the Plan with assets sufficient to meet the benefits to be
paid the members. The City’s contribution is reduced by the following:
(a) For police officers and firefighters:
• Pursuant to Florida Statutes, Chapter 175 and 185, contributions from the State of Florida
Department of Insurance consist of an excise tax imposed by the City upon certain casualty
insurance companies on the gross amount of receipts of premiums from policy holders on all
premiums collected on casualty insurance policies covering property within the City. The
allowable portion of the State (“Share Plan”) contributions is provided to the Share Plan and
is used to reduce the City’s contribution when received.
(b) For general employees who are members of Local Union 769 and excluded employees (effective
October 1, 2011):
• Member contribution percentages for each fiscal year beginning October 1, 2011 and
subsequent fiscal years shall be increased based on the increases in City contribution
requirements since the October 1, 2009 actuarial valuation.
• City contribution percentages shall be decreased by the amount of the members’ contribution
increases.
72
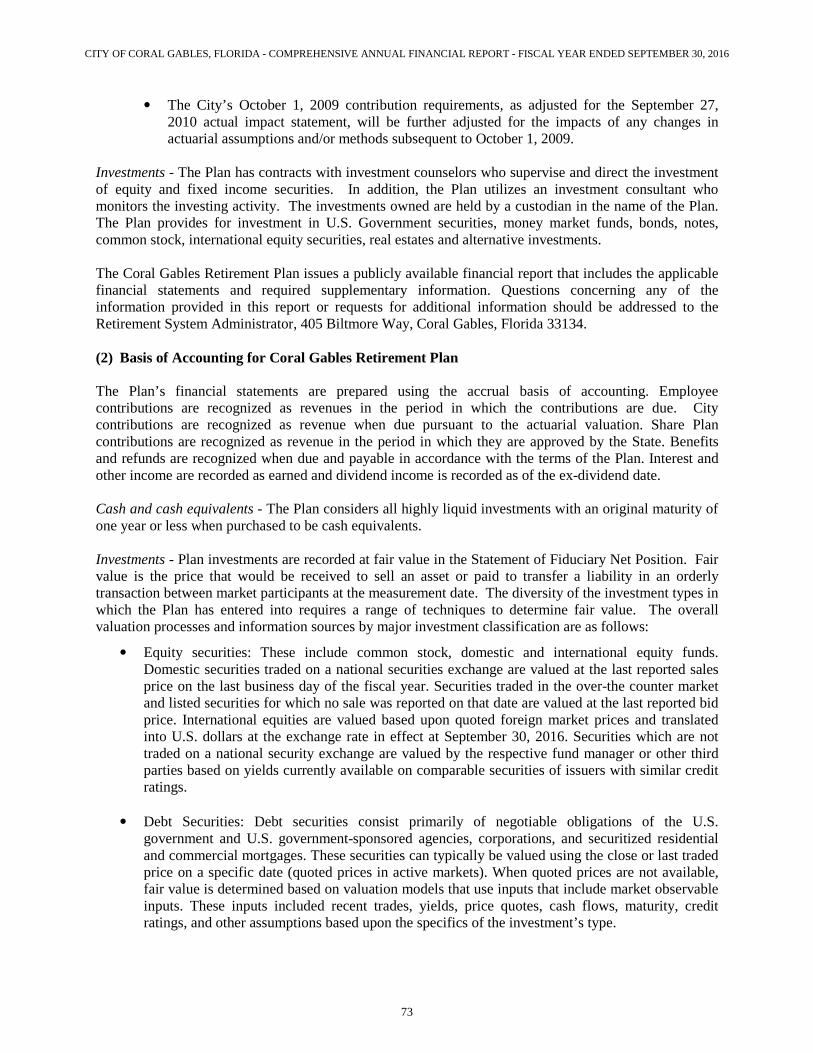
CITY OF CORAL GABLES, FLORIDA - COMPREHENSIVE ANNUAL FINANCIAL REPORT - FISCAL YEAR ENDED SEPTEMBER 30, 2016
• The City’s October 1, 2009 contribution requirements, as adjusted for the September 27,
2010 actual impact statement, will be further adjusted for the impacts of any changes in
actuarial assumptions and/or methods subsequent to October 1, 2009.
Investments - The Plan has contracts with investment counselors who supervise and direct the investment
of equity and fixed income securities. In addition, the Plan utilizes an investment consultant who
monitors the investing activity. The investments owned are held by a custodian in the name of the Plan.
The Plan provides for investment in U.S. Government securities, money market funds, bonds, notes,
common stock, international equity securities, real estates and alternative investments.
The Coral Gables Retirement Plan issues a publicly available financial report that includes the applicable
financial statements and required supplementary information. Questions concerning any of the
information provided in this report or requests for additional information should be addressed to the
Retirement System Administrator, 405 Biltmore Way, Coral Gables, Florida 33134.
(2) Basis of Accounting for Coral Gables Retirement Plan
The Plan’s financial statements are prepared using the accrual basis of accounting. Employee
contributions are recognized as revenues in the period in which the contributions are due. City
contributions are recognized as revenue when due pursuant to the actuarial valuation. Share Plan
contributions are recognized as revenue in the period in which they are approved by the State. Benefits
and refunds are recognized when due and payable in accordance with the terms of the Plan. Interest and
other income are recorded as earned and dividend income is recorded as of the ex-dividend date.
Cash and cash equivalents - The Plan considers all highly liquid investments with an original maturity of
one year or less when purchased to be cash equivalents.
Investments - Plan investments are recorded at fair value in the Statement of Fiduciary Net Position. Fair
value is the price that would be received to sell an asset or paid to transfer a liability in an orderly
transaction between market participants at the measurement date. The diversity of the investment types in
which the Plan has entered into requires a range of techniques to determine fair value. The overall
valuation processes and information sources by major investment classification are as follows:
• Equity securities: These include common stock, domestic and international equity funds.
Domestic securities traded on a national securities exchange are valued at the last reported sales
price on the last business day of the fiscal year. Securities traded in the over-the counter market
and listed securities for which no sale was reported on that date are valued at the last reported bid
price. International equities are valued based upon quoted foreign market prices and translated
into U.S. dollars at the exchange rate in effect at September 30, 2016. Securities which are not
traded on a national security exchange are valued by the respective fund manager or other third
parties based on yields currently available on comparable securities of issuers with similar credit
ratings.
• Debt Securities: Debt securities consist primarily of negotiable obligations of the U.S.
government and U.S. government-sponsored agencies, corporations, and securitized residential
and commercial mortgages. These securities can typically be valued using the close or last traded
price on a specific date (quoted prices in active markets). When quoted prices are not available,
fair value is determined based on valuation models that use inputs that include market observable
inputs. These inputs included recent trades, yields, price quotes, cash flows, maturity, credit
ratings, and other assumptions based upon the specifics of the investment’s type.
73

CITY OF CORAL GABLES, FLORIDA - COMPREHENSIVE ANNUAL FINANCIAL REPORT - FISCAL YEAR ENDED SEPTEMBER 30, 2016
• Alternative investments: These investments include real estate equity and venture capital
investments where no readily ascertainable market value exists. To value these investments,
management, in consultation with the general partner and investment advisors, determines the fair
values for the individual investments based upon the partnership’s or limited liability company’s
most recent available financial information adjusted for cash flow activities through September
30, 2016. The estimated fair value of these investments may differ from values that would have
been used had a ready market existed.
Unrealized gains and losses are presented as net appreciation (depreciation) in fair value of investments
on the statement of changes in fiduciary net position along with the gains and losses realized on sales of
investments. Purchases and sales of investments are reflected on a trade-date basis. Interest income is
recognized as earned and dividend income is recorded as of the ex-dividend date. Realized gains and
losses on the sale of investments are based on average cost identification method.
Given the inherent nature of investments, it is reasonably possible that changes in the value of those
investments will occur in the near term and that such changes could materially affect the amounts
reported in the statements of fiduciary net position.
Use of Estimates – The preparation of financial statements in conformity with accounting principles
generally accepted in the United States of America requires management to make estimates and
assumptions that affect certain reported amounts and disclosures. Accordingly, the actual results could
differ from those estimates.
Income Tax Status - The Plan is exempt from Federal income taxes under the Internal Revenue Code and,
therefore, has recorded no income tax liabilities or expense.
Risks and Uncertainties - Contributions to the Plan and the actuarial information included in the required
supplementary information (RSI) are reported based on certain assumptions pertaining to the interest
rates, inflation rates and member compensation and demographics. Due to the changing nature of these
assumptions, it is at least reasonably possible that changes in these assumptions may occur in the near
term and, due to the uncertainties inherent in settling assumptions, that the effect of such changes could
be material to the financial statements.
Net Pension Liability
The City’s net pension liability was measured as of September 30, 2015 and rolled-forward to September
30, 2016, and the total pension liability used to calculate the net pension liability was determined by an
actuarial valuation as of that date.
The components of the net pension liability of the City at September 30, 2016 were as follows:
Amount
Total pension liability $ 559,057,314
Plan fiduciary net position (329,905,407)
Total net pension liability $ 229,151,907
Plan fiduciary net position as a percentage of
the total pension liability 59.01%
74
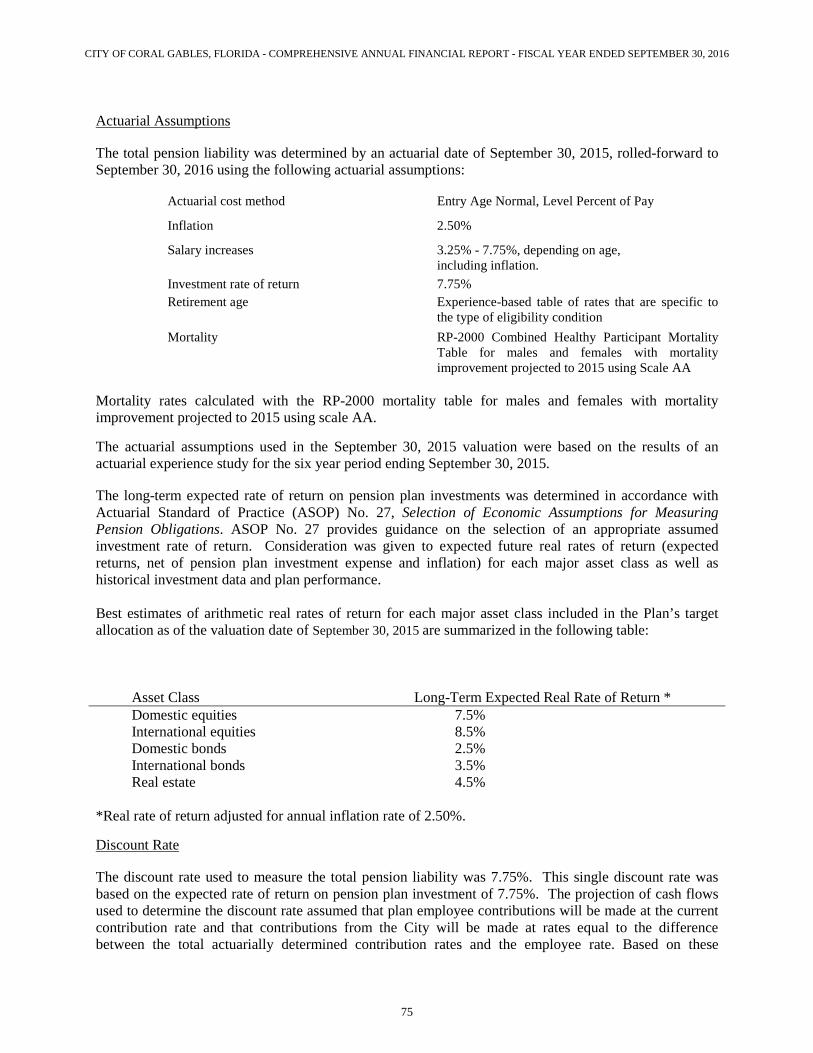
CITY OF CORAL GABLES, FLORIDA - COMPREHENSIVE ANNUAL FINANCIAL REPORT - FISCAL YEAR ENDED SEPTEMBER 30, 2016
Actuarial Assumptions
The total pension liability was determined by an actuarial date of September 30, 2015, rolled-forward to
September 30, 2016 using the following actuarial assumptions:
Actuarial cost method Entry Age Normal, Level Percent of Pay
Inflation 2.50%
Salary increases 3.25% - 7.75%, depending on age,
including inflation.
Investment rate of return 7.75%
Retirement age Experience-based table of rates that are specific to
the type of eligibility condition
Mortality RP-2000 Combined Healthy Participant Mortality
Table for males and females with mortality
improvement projected to 2015 using Scale AA
Mortality rates calculated with the RP-2000 mortality table for males and females with mortality
improvement projected to 2015 using scale AA.
The actuarial assumptions used in the September 30, 2015 valuation were based on the results of an
actuarial experience study for the six year period ending September 30, 2015.
The long-term expected rate of return on pension plan investments was determined in accordance with
Actuarial Standard of Practice (ASOP) No. 27, Selection of Economic Assumptions for Measuring
Pension Obligations. ASOP No. 27 provides guidance on the selection of an appropriate assumed
investment rate of return. Consideration was given to expected future real rates of return (expected
returns, net of pension plan investment expense and inflation) for each major asset class as well as
historical investment data and plan performance.
Best estimates of arithmetic real rates of return for each major asset class included in the Plan’s target
allocation as of the valuation date of September 30, 2015 are summarized in the following table:
Asset Class Long-Term Expected Real Rate of Return *
Domestic equities 7.5%
International equities 8.5%
Domestic bonds 2.5%
International bonds 3.5%
Real estate 4.5%
*Real rate of return adjusted for annual inflation rate of 2.50%.
Discount Rate
The discount rate used to measure the total pension liability was 7.75%. This single discount rate was
based on the expected rate of return on pension plan investment of 7.75%. The projection of cash flows
used to determine the discount rate assumed that plan employee contributions will be made at the current
contribution rate and that contributions from the City will be made at rates equal to the difference
between the total actuarially determined contribution rates and the employee rate. Based on these
75

CITY OF CORAL GABLES, FLORIDA - COMPREHENSIVE ANNUAL FINANCIAL REPORT - FISCAL YEAR ENDED SEPTEMBER 30, 2016
assumptions, the Plan’s fiduciary net position was projected to be available to make all projected future
benefit payments of current Plan members. Therefore, the long-term expected rate of return on pension
plan investments (7.75%) was applied to all periods of projected benefit payments to determine the total
pension liability.
Changes in Net Pension Liability
Total Pension Plan Fiduciary Net Pension
Liability Net Position Liability
(A) (B) (A)-(B)
Beginning Net Pension Liability 549,489,501$ 336,650,855$ 212,838,646
Changes for the year:
Service cost 5,665,063 5,665,063
Interest on the total pension liability 41,412,567 41,412,567
Changes of benefit terms - -
Difference between expected and actual experience 50,400 50,400
Changes of assumptions 4,037,514 4,037,514
Contributions - employer 24,151,856 (24,151,856)
Contributions - nonemployer 145,830 (145,830)
Contributions - member 4,704,069 (4,704,069)
Net investment income 6,282,235 (6,282,235)
Benefit payments (41,290,270) (41,290,270) -
Refunds (307,461) (307,461) -
Administrative expense (431,707) 431,707
Net changes 9,567,813 (6,745,448) 16,313,261
Ending Net Pension Liability 559,057,314$ 329,905,407$ 229,151,907$
Increase (Decrease)
Coral Gables Retirement Plan
Sensitivity of the Net Pension Liability to Change in the Discount Rate
The following presents the net pension liability of the City calculated using the discount rate of percent of
7.75%, as well as what the employer net pension liability would be if it were calculated using a discount
rate that is 1-percentage-point lower (6.75 percent) or 1-percentage-point higher (8.75 higher) than the
current rate as of September 30, 2015 and rolled-forward to September 30, 2016:
City’s Net Pension Liability
1% Decrease
(6.75%)
Current Discount Rate
(7.75%)
1% Increase
(8.75%)
September 30, 2015 $ 280,499,141 $ 229,151,907 $ 185,503,348
76

CITY OF CORAL GABLES, FLORIDA - COMPREHENSIVE ANNUAL FINANCIAL REPORT - FISCAL YEAR ENDED SEPTEMBER 30, 2016
Pension Expense and Deferred Outflows of Resources and
Deferred Inflows of Resources Related to Pensions
For the year ended September 30, 2016, the City recognized pension expense of $22,237,818 as follows:
Amounts recognized in pension expense:
Changes for the year:
Service cost 5,665,063$
Interest on the total pension liability 41,412,567
Current period benefit changes -
Contributions - member (4,704,069)
Projected earnings on plan investments (26,521,503)
Administrative expense 431,707
Recognition of outflow (inflow) of resources due to liabilities 3,003,130
Recognition of outflow (inflow) of resources due to assets 2,950,923
Net changes 22,237,818$
As of September 30, 2016, the City reported deferred outflows and deferred inflows of resources related
to pension from the following sources:
Deferred Outflows Deferred Inflows
of Resources of Resources
Difference between expected and actual experience 2,328,809$ -$
Changes in assumptions 2,814,024 -
Employer contributions made subsequent to the measurement date 27,924,224 -
Net difference between projected and actual earnings on
pension plan investments 16,191,414 3,290,794
Total 49,258,471$ 3,290,794$
Amounts reported as deferred outflows of resources and deferred inflows of resources related to pensions
that will be recognized in pension expense are as follows:
Net Deferred Inflow
Year Ending September 30: of Resources
2017 5,954,053$
2018 4,718,996
2019 3,322,551
2020 4,047,853
Thereafter -
Total 18,043,453$
The deferred outflow of resources of $27,924,224 resulting from City contributions to the Plan
subsequent to the measurement date will be recognized as a reduction of the net pension liability/net
pension expense for the fiscal year ending September 30, 2017.
77

CITY OF CORAL GABLES, FLORIDA - COMPREHENSIVE ANNUAL FINANCIAL REPORT - FISCAL YEAR ENDED SEPTEMBER 30, 2016
The Schedule of Changes in the Net Pension Liability and Related Ratios and the Schedule of
Contributions, presented as Required Supplementary Information (RSI) following the notes to the
financial statements, provides additional information about the net pension liability, plan assets and
contributions for each of the City’s defined benefit pension plan.
(b) Defined Contribution Plans for Police Officers and Firefighters
The City provides pension benefits for its Police Officers and Firefighters, as a supplement to the benefits
provided under the Coral Gables Retirement defined benefit pension plan, through two defined
contribution plans, the Police Officers’ Pension Fund and Firefighters’ Pension Fund. Benefits from these
plans depend solely on amounts contributed to the plans, plus investment earnings. Employer
contributions to both plans are the proceeds of a tax on certain insurance companies collected by the State
of Florida and distributed to qualified municipalities according to Florida Statutes, Chapter 185 for Police
Officers and Chapter 175 for Firefighters. The plan is administered by the Police and Firefighters
Pension Board. The Pension Board with approval of the City Commission has authority for amending the
plan.
Police Officers
(1) Plan Description
The Police Officers’ Retirement Trust Fund (the “Plan”) is a defined contribution pension plan covering
all police officers employed by the City. The Plan was created and is operated under the Code of the City
of Coral Gables, Chapter 50, “Pension”, Article IIII - “Retirement System for Police Officers” enacted in
1988.
Police Officers participate from the date of employment as a police officer. Contributions to the Plan are
distributed to participants based on the years of service for the individual participant as it relates to the
total years of service for all participants. Each participant is credited one share for each year in the Plan,
up to a maximum of thirty (30) shares. Initial shares will be credited to eligible participants on April 1 of
each year. At September 30, 2016, the Plan membership consisted of 266 active members.
Employees are fully vested after 10 years of service; no partial vesting is provided. Amounts forfeited by
employees who leave employment before 10 years of service are redistributed to the remaining
participants.
The City contributions for the fiscal year were $561,552 representing 4.3% of total covered payroll of
police officers participating in the Plan of $12,923,469.
The Police Officers Plan issues a publicly available financial report that includes the applicable financial
statements and required supplementary information. Questions concerning any of the information
provided in this report or requests for additional information should be addressed to the Retirement
System Administrator, 3810 Inverrary Blvd., Lauderhill, Florida 33319.
(2) Summary of Significant Accounting Policies
Basis of accounting - the financial statement of the Plan has been prepared on the accrual basis of
accounting. State contributions are recognized as revenue pursuant to approval by the State of Florida.
Distributions are recognized when due and payable pursuant to the terms of the Plan. Interest income is
recorded on the accrual basis. Dividends are recorded on the ex-dividend date.
78

CITY OF CORAL GABLES, FLORIDA - COMPREHENSIVE ANNUAL FINANCIAL REPORT - FISCAL YEAR ENDED SEPTEMBER 30, 2016
Investments - Reported at fair value. Fair value is the price that would be received to sell an asset or paid
to transfer a liability in an orderly transaction between market participants.
Unrealized gains and losses are presented as net appreciation (depreciation) in fair value of investments
on the statements of changes in fiduciary net position along with gains and losses realized on sales of
investments. Purchases and sales of investments are recorded on a trade-date basis.
Firefighters
(1) Plan Description
The Firefighters’ Pension Fund (the “Plan”) is a defined contribution pension plan covering all
firefighters employed by the City. The Plan was created and is operated under the Code of the City of
Coral Gables, Chapter 50, “Pension”, Article IV - “Firefighters’ Pension Trust Fund” enacted in 1988.
Firefighters participate from the date of employment as a firefighter. Contributions to the Plan are
distributed to participants based on a formula of 5 shares for being a firefighter plus 1 additional share for
every 5 years of service as a firefighter. Employees in service prior to August 25, 1987 are fully vested;
the remaining employees become fully vested after 10 years of service; no partial vesting is provided.
Amounts forfeited by non-vested employees who leave employment are redistributed to the remaining
participants. As of September 30, 2016, there are 122 active plan members and 1,081 participating shares
in the Plan.
The City contributions for the fiscal year were $874,111 representing 6.7% of total covered payroll of
firefighters participating in the plan of $12,991,812. In addition, on October 28, 2016 the Plan received
from the State of Florida supplemental contributions of $31,879.
(2) Summary of Significant Accounting Policies
Basis of accounting - the financial statement of the Plan has been prepared on the accrual basis of
accounting. State contributions are recognized as revenue pursuant to approval by the State of Florida.
Distributions are recognized when due and payable pursuant to the Plan. Interest and dividend income
are recorded as earned.
Investments - Reported at fair value which is based on the closing sales price or bid price as reported by
recognized security exchanges. Bonds are reported at established fair value. Securities that have no
quoted market price are presented at estimated fair value as provided by custodial bank and investment
counsel. The Plan’s Guaranteed Investment Contract is considered a nonparticipating contract since its
fair value is not significantly affected by the impairment of the credit standing of the issuer or other
factors. In accordance with GASB 31, Accounting and Financial Reporting for Certain Investments and
for External Investment Pools, the contract is reported at cost.
Unrealized gains and losses are presented as net appreciation (depreciation) in fair value of investments
on the statements of changes in fiduciary net position along with gains and losses realized on sales of
investments. Purchases and sales of investments are recorded on a trade-date basis.
The following is condensed financial information for the Firefighters’ Pension Fund, which does not issue
a stand-alone report.
79
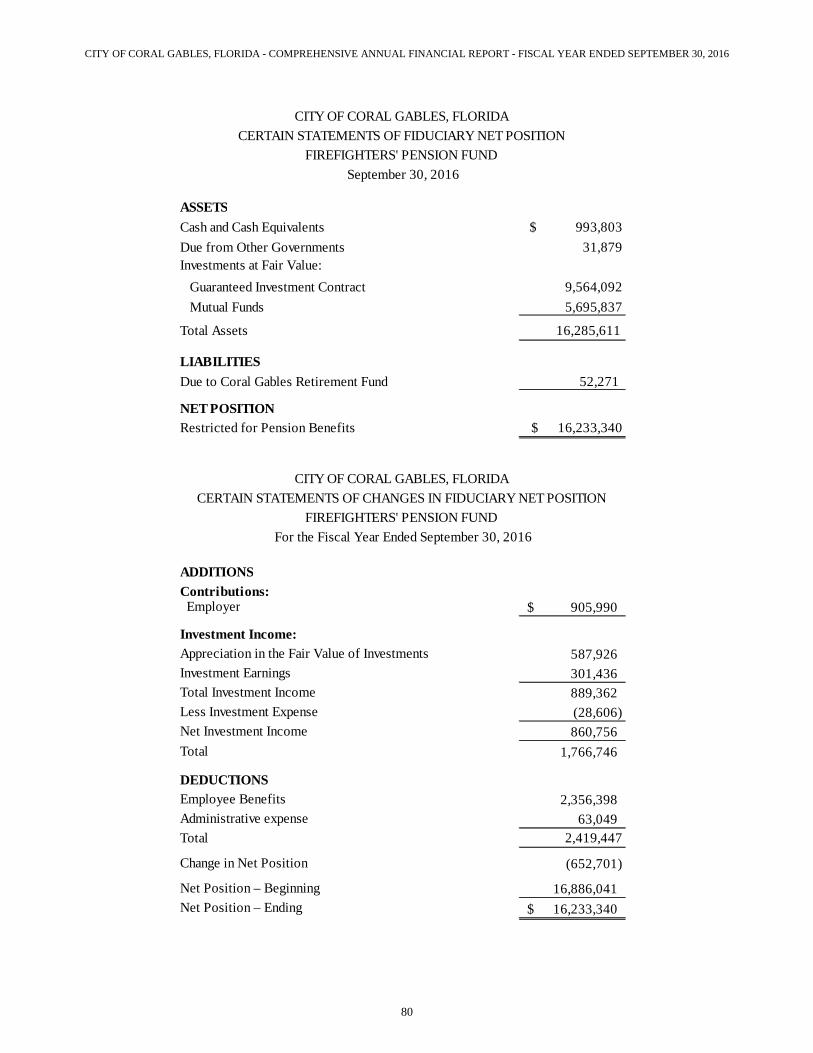
CITY OF CORAL GABLES, FLORIDA - COMPREHENSIVE ANNUAL FINANCIAL REPORT - FISCAL YEAR ENDED SEPTEMBER 30, 2016
ASSETS
Cash and Cash Equivalents $ 993,803
Due from Other Governments 31,879
Investments at Fair Value:
Guaranteed Investment Contract 9,564,092
Mutual Funds 5,695,837
Total Assets 16,285,611
LIABILITIES
Due to Coral Gables Retirement Fund 52,271
NET POSITION
Restricted for Pension Benefits $ 16,233,340
ADDITIONS
Contributions: Employer 905,990$
Investment Income:
Appreciation in the Fair Value of Investments 587,926
Investment Earnings 301,436
Total Investment Income 889,362
Less Investment Expense (28,606)
Net Investment Income 860,756
Total 1,766,746
DEDUCTIONS
Employee Benefits 2,356,398
Administrative expense 63,049
Total 2,419,447
Change in Net Position (652,701)
Net Position – Beginning 16,886,041
Net Position – Ending 16,233,340$
For the Fiscal Year Ended September 30, 2016
CERTAIN STATEMENTS OF CHANGES IN FIDUCIARY NET POSITION
FIREFIGHTERS' PENSION FUND
CITY OF CORAL GABLES, FLORIDA
CITY OF CORAL GABLES, FLORIDA
CERTAIN STATEMENTS OF FIDUCIARY NET POSITION
FIREFIGHTERS' PENSION FUND
September 30, 2016
80

CITY OF CORAL GABLES, FLORIDA - COMPREHENSIVE ANNUAL FINANCIAL REPORT - FISCAL YEAR ENDED SEPTEMBER 30, 2016
(c) Defined Contribution Plans for Appointed Officials, Excluded and General Employees
In September 2015, the City passed Ordinance No. 2015-21 amending the Code of the City of Coral
Gables Section 50-26 pertaining to “Pension” providing that it shall not be mandatory for any appointed
official of the City, or any assistant city manager or deputy city attorney, or department director hired on
or after September 8, 2015, to participate in the Coral Gables Retirement System (the “System”), but have
the option of participation in the System. In the event the appointed officials and employees elect to
participate in any retirement plan other than the System, the City may contribute a sum not to exceed the
maximum limit provided by law to the plan. The ordinance also provides that it is not mandatory for
elected official of the City to participate in the System. In the event the elected official chooses to
participate in any retirement plan other than the System, the City will contribute a sum not to exceed 6.5%
of the elected official’s compensation to that plan.
The City has contracted ICMA-RC on behalf of its excluded and general employees for four defined
contribution pension plans categorized as executives (for assistant city manager/deputy city attorney),
department heads, excluded/teamster employees; and a separate plan for the City Manager and City
Attorney. All plans are established under the provisions of Section 401(a) of the Internal Revenue Code
as Money Purchase Plans and Trusts. The City Commission has the authority for establishing or
amending the plan’s provisions. The assets of the plans are owned by the employee; however, the City
has a custodial responsibility to properly administer the plans. In a defined contributions plan, benefits
depend solely on amounts contributed to the plan plus investment earnings.
The Executives 401(a) Plan provisions require the City to contribute 15% of each participant’s salary and
participants are not required to contribute to the plan. Employees are eligible to participate from the date
of employment. The City’s contributions for each employee (and interest allocated to the employee’s
account) are fully vested at the time of the contribution.
The Department Heads 401(a) Plan provisions require the City to contribute 10% of each participant’s
salary and participants are not required to contribute to the plan. Employees are eligible to participate
from the date of employment. The City’s contributions for each employee (and interest allocated to the
employee’s account) are vested at 20% after first year of service and increases by 20% at every year of
service and fully vested after five years of continuous service.
The Excluded/Teamster 401(a) Plan provisions require the City to contribute 7% of each participant’s
salary and participants are not required to contribute to the plan. Employees are eligible to participate
from the date of employment. The City’s contributions for each employee (and interest allocated to the
employee’s account) are vested at 20% after first year of service and increases by 20% at every year of
service and fully vested after five years of continuous service.
The City Manager’s and City Attorney’s 401(a) Plan requires the City to contribute 25% of the City
Manager’s and City Attorney’s salary for each plan year and are not required to contribute to the plan.
The City’s contribution and those of the City Manager and City Attorney (and interest allocated to their
account) are fully vested at the time of the contribution.
For the year ended September 30, 2016, the City’s total contribution to the 401(a) defined contribution
plans was $183,101.
81

CITY OF CORAL GABLES, FLORIDA - COMPREHENSIVE ANNUAL FINANCIAL REPORT - FISCAL YEAR ENDED SEPTEMBER 30, 2016
NOTE 9 - POSTEMPLOYMENT BENEFITS OTHER THAN PENSIONS
Plan Description – The City provides health insurance benefits to its retired employees through a single-
employer plan administered by the City. Pursuant to the provisions of Section 112.0801, Florida Statues,
the City is mandated to permit participation in the health insurance program by retirees and their eligible
dependents at a cost to the retiree that is no greater than the cost at which coverage is available for active
employees. Retirees are required to pay 100% of the premium where premiums are determined based
upon a blend of active employees and retirees. The blended rates provide an implicit subsidy for retirees
because, on an actuarial basis, their current and future claims are expected to result in higher costs to the
plan on average than those of active employees. The benefits provided under this defined benefit plan are
provided for a retiree’s lifetime (or until such time at which retiree discontinues coverage under the City
sponsored plan, if earlier).
Funding Policy - Currently, the City’s Retiree Health Care Plan is unfunded. The City is financing the
other post-employment benefits (OPEB) on a pay-as-you go basis. There are no separate trust funds or
equivalent arrangement into which the City contributes to advance-fund the OPEB obligations, as it does
for its retiree pension plans. Annual required implied contributions amounted to $1,884,959 for the
current fiscal year, toward which the City made an implied contributions which amounted to $733,088.
At September 30, 2016, the City recognized a net OPEB obligation of $9,104,346 for governmental
activities and $215,108 for business-type activities in its government-wide statement of net position and
proprietary fund statement. The internal service funds reported a net OPEB obligation of $242,863 which
is reported in the governmental activities total as previously mentioned. The net OPEB obligation is a
function of annual required contribution, interest, adjustments to the annual required contribution and
actual employers’ contribution made to the plan.
Annual OPEB Cost and Net OPEB Obligation - The City’s annual OPEB cost (expense) is calculated
based on the annual required contribution of the employer (ARC), an amount actuarially determined in
accordance with the parameters of GASB 45. The ARC represents a level of funding that, if paid on an
ongoing basis, is projected to cover normal cost each year to amortize any unfunded actuarial liabilities
(or funding excess) over a period not to exceed thirty years. The following table shows the components
of the City’s annual OPEB cost for the year ended, the amount actually contributed to the plan as an
implicit subsidy, and changes in the City’s net OPEB obligation to the retiree health plan:
Annual Required Contribution (ARC) 1,880,874$
Interest on Net OPEB Obligation 285,866
Adjustment to ARC (281,781)
Annual OPEB Cost (Expense) 1,884,959
Employer Contribution (733,088)
Increase in Net OPEB Obligation 1,151,871
Net OPEB Obligation- beginning of year 8,167,583
Net OPEB Obligation- ending of year 9,319,454$
82
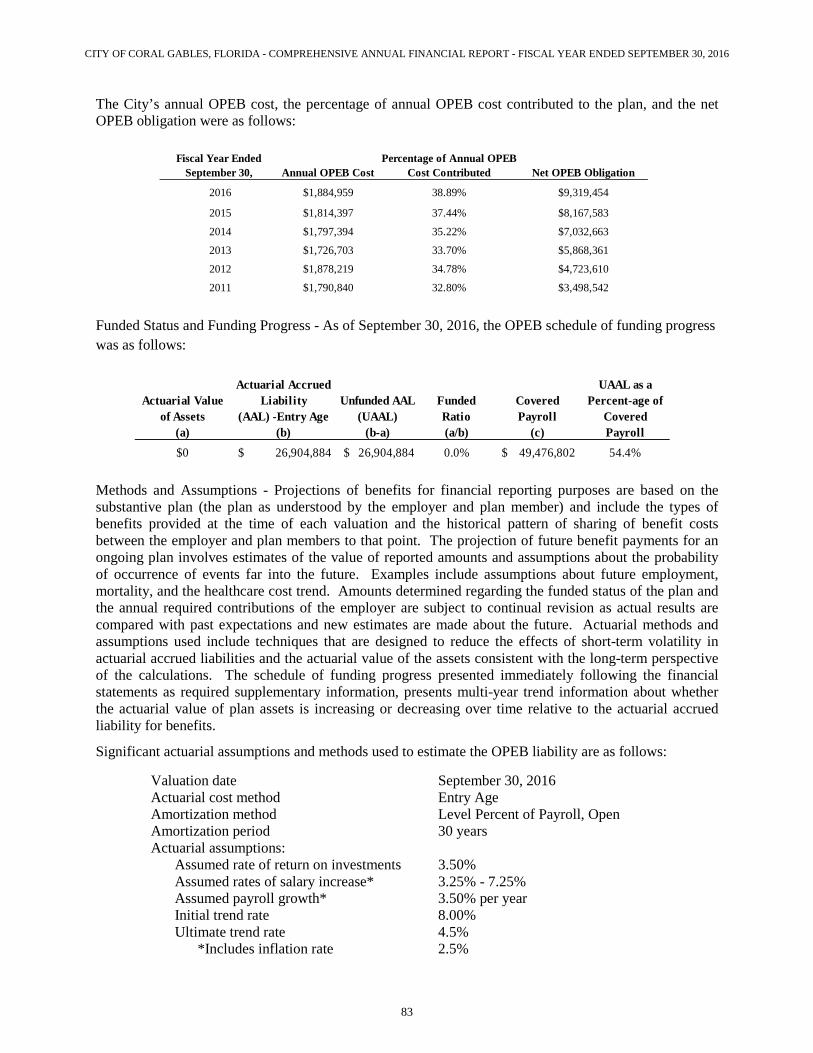
CITY OF CORAL GABLES, FLORIDA - COMPREHENSIVE ANNUAL FINANCIAL REPORT - FISCAL YEAR ENDED SEPTEMBER 30, 2016
The City’s annual OPEB cost, the percentage of annual OPEB cost contributed to the plan, and the net
OPEB obligation were as follows:
2016 $1,884,959 38.89% $9,319,454
2015 $1,814,397 37.44% $8,167,583
2014 $1,797,394 35.22% $7,032,663
2013 $1,726,703 33.70% $5,868,361
2012 $1,878,219 34.78% $4,723,610
2011 $1,790,840 32.80% $3,498,542
Annual OPEB Cost
Fiscal Year Ended
September 30, Net OPEB Obligation
Percentage of Annual OPEB
Cost Contributed
Funded Status and Funding Progress - As of September 30, 2016, the OPEB schedule of funding progress
was as follows:
Actuarial Value
of Assets
(a)
Actuarial Accrued
Liability
(AAL) -Entry Age
(b)
Unfunded AAL
(UAAL)
(b-a)
Funded
Ratio
(a/b)
Covered
Payroll
(c)
UAAL as a
Percent-age of
Covered
Payroll
$0 $ 26,904,884 $ 26,904,884 0.0% $ 49,476,802 54.4%
Methods and Assumptions - Projections of benefits for financial reporting purposes are based on the
substantive plan (the plan as understood by the employer and plan member) and include the types of
benefits provided at the time of each valuation and the historical pattern of sharing of benefit costs
between the employer and plan members to that point. The projection of future benefit payments for an
ongoing plan involves estimates of the value of reported amounts and assumptions about the probability
of occurrence of events far into the future. Examples include assumptions about future employment,
mortality, and the healthcare cost trend. Amounts determined regarding the funded status of the plan and
the annual required contributions of the employer are subject to continual revision as actual results are
compared with past expectations and new estimates are made about the future. Actuarial methods and
assumptions used include techniques that are designed to reduce the effects of short-term volatility in
actuarial accrued liabilities and the actuarial value of the assets consistent with the long-term perspective
of the calculations. The schedule of funding progress presented immediately following the financial
statements as required supplementary information, presents multi-year trend information about whether
the actuarial value of plan assets is increasing or decreasing over time relative to the actuarial accrued
liability for benefits.
Significant actuarial assumptions and methods used to estimate the OPEB liability are as follows:
Valuation date September 30, 2016
Actuarial cost method Entry Age
Amortization method Level Percent of Payroll, Open
Amortization period 30 years
Actuarial assumptions:
Assumed rate of return on investments 3.50%
Assumed rates of salary increase* 3.25% - 7.25%
Assumed payroll growth* 3.50% per year
Initial trend rate 8.00%
Ultimate trend rate
*Includes inflation rate
4.5%
2.5%
83

CITY OF CORAL GABLES, FLORIDA - COMPREHENSIVE ANNUAL FINANCIAL REPORT - FISCAL YEAR ENDED SEPTEMBER 30, 2016
NOTE 10 - POLLUTION REMEDIATION OBLIGATIONS As of September 30, 2016, the City is involved in four (4) pollution remediation obligating events as follows: a) Biltmore Golf Course - In August 2003, the City received a Notice of Violation (NOV) from Miami-
Dade County Regulatory and Economic Resources (RER) (formerly Department of Environmental Resource Management (DERM)) that documented contamination found in an onsite soakage pit and an adjacent monitoring well. The City through its consultant proposed a natural background study for arsenic, in addition to a supplemental site assessment report (SSAR) to address the contamination found in the identified areas. The City has completed Phase 1 of this project and submitted the report for this phase to RER for review. The City has also completed Phase 2 of this project which consisted of source removal of contaminated soil and placement of an engineering control in the vicinity on the maintenance building. The City submitted a Source Removal Report documenting the source removal in September 2015 followed by the filing of a Restrictive Covenant and Engineering Control Implementation Report in 2016. DERM response letter dated September 8, 2016 noted that the removal of additional soil is required. DERM also noted that upon of soil removal, the City is required to submit a “Monitoring Only Plan in Support of No Further Action with Condition” along with a complete Engineering Control Implementation Report and Engineering Control Maintenance Plan. The City estimates the remaining costs for this entire obligating event to be $25,000. This has been recorded as a long-term liability in the City’s financial statements for the year ended September 30, 2016.
b) Granada Golf Course - In April 1988, City applied for entry into the State of Florida Department of Environmental Protection (FDEP) Early Detection Incentive Program. This program allowed for funding and cleanup assistance to be allocated for eligible sites. The City voluntarily removed a 6,000 gallon underground storage tank at the Granada Golf Course. As of September 30, 2016, the City anticipates receiving cleanup assistance from FDEP and is not expecting to incur additional costs to the City. Thus, no liability is recognized for this obligating event for the year ended September 30, 2016.
c) Former Coral Gables Incinerator Site Assessment - In December 2005, the City demolished the incinerator building, combustion chambers and the incinerator stack at the Public Works Facility located at 2800 SW 72
nd Avenue. After the demolition activities were completed, the City’s
consultants conducted a limited site assessment of the existing soil and groundwater conditions in August and September 2007. Based upon the soil and groundwater analytical results, the levels of contamination detected are essentially equivalent and or above the cleanup target levels for residential and commercial/industrial use levels. Based on these results, the Miami-Dade RER required the City to submit a Site Assessment Report Addendum (SARA) to address the outstanding environmental assessment and remediation requirements of the former incinerator. As of September 30, 2016, the City is in the process of completing the SARA and assessing the options for cleanup of the site. Accordingly, as of September 30, 2016 the cost of the remedial action plan cannot be reasonably estimated, therefore a liability for this site is not recorded in the financial statements.
d) Coral Gables Country Club – In May 2002, as part of the renovation of the Country Club, an underground storage tank was removed. The City received a NOV from RER and was required to complete a site assessment report due to release of unknown contamination into the ground as a result of the tank removal activities. As of August 2009, the City completed the remediation activities that included the excavation and removal of all soils surrounding the original tank removal footprint. In 2014, the City completed the required groundwater monitoring and received a notification from RER that there is no additional groundwater sampling requirement for this site. The City is in the process of preparing an additional source removal plan for submission to RER to address remaining areas with contaminated soil. Accordingly, as of September 30, 2016 the cost of the remedial action plan
84

CITY OF CORAL GABLES, FLORIDA - COMPREHENSIVE ANNUAL FINANCIAL REPORT - FISCAL YEAR ENDED SEPTEMBER 30, 2016
cannot be reasonably estimated, therefore a liability for this site is not recorded in the financial statements.
As of September 30, 2016, the City’s total liability related to the pollution remediation obligating events, as discussed previously, is $25,000.
NOTE 11 - INSURANCE PROGRAM
The City has a self-insurance program for General Liability, Automobile Liability and Workers’
Compensation. The City uses a professional servicing organization as third party administrator for the
program. The City has established a separate Internal Service Fund to record the activity related to the
insurance program.
Liabilities of the fund are reported when it is probable that a loss has occurred and the amount of the loss
can be reasonably estimated. The estimate of the claims liability also includes amounts for incremental
claim adjustment expenses related to specific claims and other claim adjustment expenses regardless of
whether allocated to specific claims. The City is exposed to various risks of loss related to torts; theft of,
damage to, and destruction of assets; errors and omissions; and natural disasters for which the City carries
commercial insurance.
The City purchases excess insurance over retention of $500,000 per occurrence for Workers’
Compensation. For General and Automobile Liability, the retention is $350,000. The City is protected by
Florida Statute 768.28 which limits losses to, except for certain federal causes of action: (a) $100,000 per
person / $200,000 per occurrence for claims arising between October 1, 1981 and October 1, 2011; and
(b) $200,000 per person / $300,000 per occurrence for claims arising after October 1, 2011.
The City is fully insured for its employee health program except for Police Officers and Firefighters. For
Police Officers and Firefighters, the City obtained fully insured individual health care plans.
The following schedule presents the changes in claim liabilities for the past two years in the Internal
Service Funds:
2016 2015
Unpaid claim payable, beginning 11,928,000$ 12,026,000$
Incurred claims and claim adjustments 5,357,383 2,305,591
Claims payments (3,263,383) (2,403,591)
Unpaid claims payable, ending 14,022,000$ 11,928,000$
Settled claims have not exceeded coverage in any of the past three years.
NOTE 12 - DEFICIT IN NET POSITION AND FUND BALANCE OF INDIVIDUAL FUNDS The Capital Project General Obligation Bond Fund has a deficit fund balance of $394,834. The deficit
will be offset with reimbursements from the Miami-Dade County Building Better Communities grant
program in the next fiscal year.
NOTE 13 – CONTINGENCIES AND COMMITMENTS
Litigations
There are several pending claims and lawsuits in which the City is involved. The estimated liability
related to these claims has been accrued in the City’s Internal Service Insurance Fund. In the opinion of
85
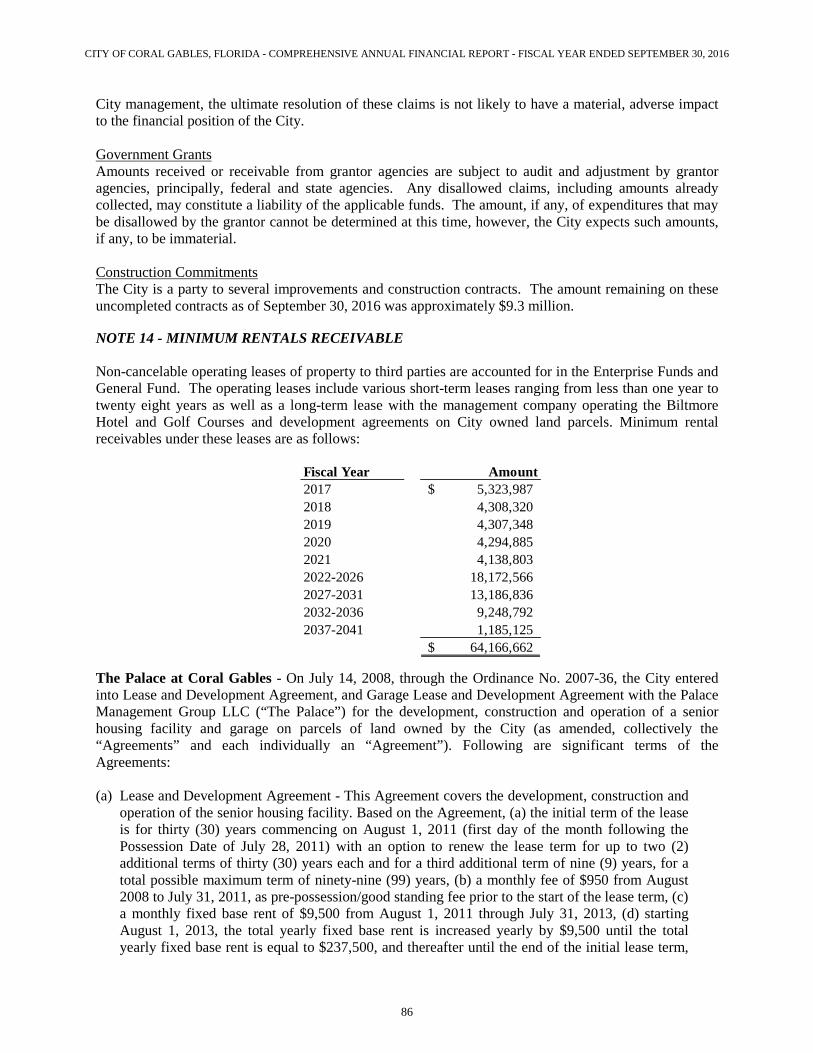
CITY OF CORAL GABLES, FLORIDA - COMPREHENSIVE ANNUAL FINANCIAL REPORT - FISCAL YEAR ENDED SEPTEMBER 30, 2016
City management, the ultimate resolution of these claims is not likely to have a material, adverse impact
to the financial position of the City.
Government Grants
Amounts received or receivable from grantor agencies are subject to audit and adjustment by grantor
agencies, principally, federal and state agencies. Any disallowed claims, including amounts already
collected, may constitute a liability of the applicable funds. The amount, if any, of expenditures that may
be disallowed by the grantor cannot be determined at this time, however, the City expects such amounts,
if any, to be immaterial.
Construction Commitments
The City is a party to several improvements and construction contracts. The amount remaining on these
uncompleted contracts as of September 30, 2016 was approximately $9.3 million. NOTE 14 - MINIMUM RENTALS RECEIVABLE
Non-cancelable operating leases of property to third parties are accounted for in the Enterprise Funds and
General Fund. The operating leases include various short-term leases ranging from less than one year to
twenty eight years as well as a long-term lease with the management company operating the Biltmore
Hotel and Golf Courses and development agreements on City owned land parcels. Minimum rental
receivables under these leases are as follows:
Fiscal Year Amount
2017 5,323,987$
2018 4,308,320
2019 4,307,348
2020 4,294,885
2021 4,138,803
2022-2026 18,172,566
2027-2031 13,186,836
2032-2036 9,248,792
2037-2041 1,185,125
64,166,662$
The Palace at Coral Gables - On July 14, 2008, through the Ordinance No. 2007-36, the City entered
into Lease and Development Agreement, and Garage Lease and Development Agreement with the Palace
Management Group LLC (“The Palace”) for the development, construction and operation of a senior
housing facility and garage on parcels of land owned by the City (as amended, collectively the
“Agreements” and each individually an “Agreement”). Following are significant terms of the
Agreements:
(a) Lease and Development Agreement - This Agreement covers the development, construction and
operation of the senior housing facility. Based on the Agreement, (a) the initial term of the lease
is for thirty (30) years commencing on August 1, 2011 (first day of the month following the
Possession Date of July 28, 2011) with an option to renew the lease term for up to two (2)
additional terms of thirty (30) years each and for a third additional term of nine (9) years, for a
total possible maximum term of ninety-nine (99) years, (b) a monthly fee of $950 from August
2008 to July 31, 2011, as pre-possession/good standing fee prior to the start of the lease term, (c)
a monthly fixed base rent of $9,500 from August 1, 2011 through July 31, 2013, (d) starting
August 1, 2013, the total yearly fixed base rent is increased yearly by $9,500 until the total
yearly fixed base rent is equal to $237,500, and thereafter until the end of the initial lease term,
86

CITY OF CORAL GABLES, FLORIDA - COMPREHENSIVE ANNUAL FINANCIAL REPORT - FISCAL YEAR ENDED SEPTEMBER 30, 2016
(e) during the first renewal of the lease term, the yearly fixed base rent is increased to $242,250
commencing on the second year of the first renewal term will be increased by 2% per year until
the end of the final lease term, including any further renewals thereof, (f) in addition to the
yearly fixed base rent, starting August 1, 2014 a percentage base rent is to be paid to the City
equal to 0.5% of the project revenue of each rental year. The percentage base rent rate is
increased by 0.1% yearly until the rate is equal to 2%, and thereafter remains as the rate for the
remainder of the initial lease term and renewal terms.
In addition, as part of the Agreement, the Palace conveyed to the City the title on two parcels of land that
became part of the land owned by the City on where the project was built. The agreed market value of the
parcels of land was $1,251,000 at the time of the execution of the agreement.
(b) Parking Garage Lease and Development Agreement - This Agreement covers the development,
construction and operation of the Parking Component of the facility for public parking, private
parking and retail spaces. Based on the Agreement, (a) the initial term of the lease is for thirty (30)
years commencing on August 1, 2011 (first day of the month following the Possession Date of July
28, 2011) with an option to renew the lease term for up to two (2) additional terms of thirty (30) years
each and for a third additional term of nine (9) years, for a total possible maximum term of ninety-
nine (99) years, (b) a monthly fee of $50 from August 2008 to July 31, 2011 as pre-possession/good
standing fee, (c) a monthly fixed base rent of $500 from August 1, 2011 through July 31, 2013, (d)
starting August 1, 2013, the total yearly fixed base rent is increased yearly by $500 until the total
yearly fixed base rent is equal to $12,500, and thereafter until the end of the initial lease term, (e)
during the first renewal of the lease term, the yearly fixed base rent is increased to $12,750
commencing on the second year of the first renewal term and will be increased by 2% per year until
the end of the final lease term, including any further renewals thereof, (f) in addition to the yearly
fixed base rent, starting August 1, 2014, a percentage base rent is to be paid to the City equal to 0.5%
of the project revenue of each rental year. The percentage base rent rate is increased by 0.1% yearly
until the rate is equal to 2%, and thereafter remains as the rate for the remainder of the initial lease
term and renewal terms.
In relation to the public parking component of the Parking Facility, the Palace petitioned the City and
Miami-Dade County to create the “Palace at Coral Gables Community Development District”
(“CDD”) to assist in the financing of this component. The City supported the creation of the CDD
and it was established by the Board of County Commissioners of Miami-Dade County through
Ordinance No. 10-49 on July 20, 2010, pursuant to the provision of Chapter 190 of the Florida
Statutes. In July 2011, the CDD issued its Special Assessment Revenue Bonds Series 2011 in the
amount of $9.50 million with interest rate of 5% to 5.625% and maturity date of May 1, 2042. The
proceeds from issuance of the special assessment bond was used to finance the construction of the
public parking facility. The special assessment bonds are payable from CDD’s assessments levied on
the senior housing facility, retail space, private parking facility, and net revenues of the public
parking facility. The Palace is required to maintain an escrow fund and deposit amount
approximately equal to three (3) times the maximum annual debt service under the CDD bonds to be
used solely for the payment of special assessments levied by the CDD. During the construction of the
public parking facility, the bond proceeds were released to the Palace to pay the prorata share of the
public parking component construction costs. On July 28, 2011, prior to commencement of
construction, the Palace granted a sublease of the public parking portion to the CDD, and the CDD
and the City of Coral Gables entered into an Interlocal Agreement regarding operation and funding of
the CDD.
In relation to the CDD special assessment bonds, the City through Resolution No. 2011-56 dated
March 22, 2011 agreed to guarantee the payment of the bonds and the City and the Board entered into
87

CITY OF CORAL GABLES, FLORIDA - COMPREHENSIVE ANNUAL FINANCIAL REPORT - FISCAL YEAR ENDED SEPTEMBER 30, 2016
a Guaranty Agreement. As provided in the guaranty agreement, the City agrees to: (a) irrevocably
agree to pay to the Board from any legally available funds, for the benefit of the bondholders, that
portion of the principal and interest on the bonds that becomes due for payment but unpaid due to the
occurrence and continuation of events calling for guarantor payment; (b) the City’s obligation under
the guarantee agreement is limited to a maximum annual debt service amount of $700,000 and a
maximum total debt service amount of $21 million; (c) the obligation of the City will not constitute a
general debt, liability or obligation of the City within the meaning of any constitutional or statutory
limitation; (d) the City agrees to budget, appropriate and pay to the Board any deficiency amount
within ten (10) business days of the receipt of notice of deficiency from the Board while the CDD
bonds are outstanding; (e) the City received $225,000 from the proceeds of the CDD bond in
consideration for the City’s guaranty; (f) in the event that the City’s guaranty is called upon, the
Palace is considered in default of the two (2) lease agreements and the City may exercise its rights
and remedies, which include but not limited, for the City to initiate a reversion of the Palace’s
leasehold interest in both the private and public facilities.
At September 30, 2016, the City billed to and received from the Palace $143,810 and $7,583 for the Lease
and Development Agreement and Parking Garage Lease and Development Agreement, respectively. Also,
the City billed to and received from the Palace $147,062 percentage rent for the lease term August 1,
2014 to July 31, 2016. In addition, there are no events or occurrences resulting in the City’s guarantee to
be called.
The cost of assets under operating leases is $65,402,046 with a net book value of $53,249,224.
Depreciation expense on leased assets was $617,645 for the fiscal year ended September 30, 2016.
NOTE 15 - MANAGEMENT AGREEMENTS
The City has entered into management agreements with third parties for the management, operation and
maintenance of facilities owned by the City. Major terms of these management agreements are as follows:
Country Club of Coral Gables – the agreement was executed on August 6, 2009 and amended on March
30, 2010, with an initial term of up to ten (10) years, with an option to renew the agreement for an
additional period of ten (10) years. The rent commencement date was October 1, 2011 and the
management company paid $5,000 each month starting January 2, 2011 through October 1, 2011. Starting
October 1, 2011, the monthly base rent is $20,000 payable in advance on the first day of each month. The
monthly base rent for each successive rental year shall be increased by 3.00% annually.
In addition to the base rent, commencing on October 1, 2012 and throughout the initial term of the
agreement, the management company shall pay the City additional annual percentage rent equivalent to
6.00% of the amount by which the gross revenue for the rental year exceeds $4 million, less the amount
by which the real estate tax assessed for the rental year exceeds the adjusted base real estate tax. The
adjusted base real estate tax is defined as $26,943 in the first rental year and shall be increased by 3.00%
annually.
For the year ended September 30, 2016, the City billed and collected from the management company
$270,122 as rental income. In addition, as of September 30, 2016 the City billed to and received from the
management company $61,209 as percentage rent for fiscal year 2015 and 2014.
Biltmore Hotel - the agreement commenced on February 10, 1986 with a term of up to fifty (50) years.
Based on the agreement, the City is entitled to receive on a quarterly basis, $300,000 as base fee which is
adjusted for the effect of cumulative price index over the life of the agreement, and percentage fee equals to
88
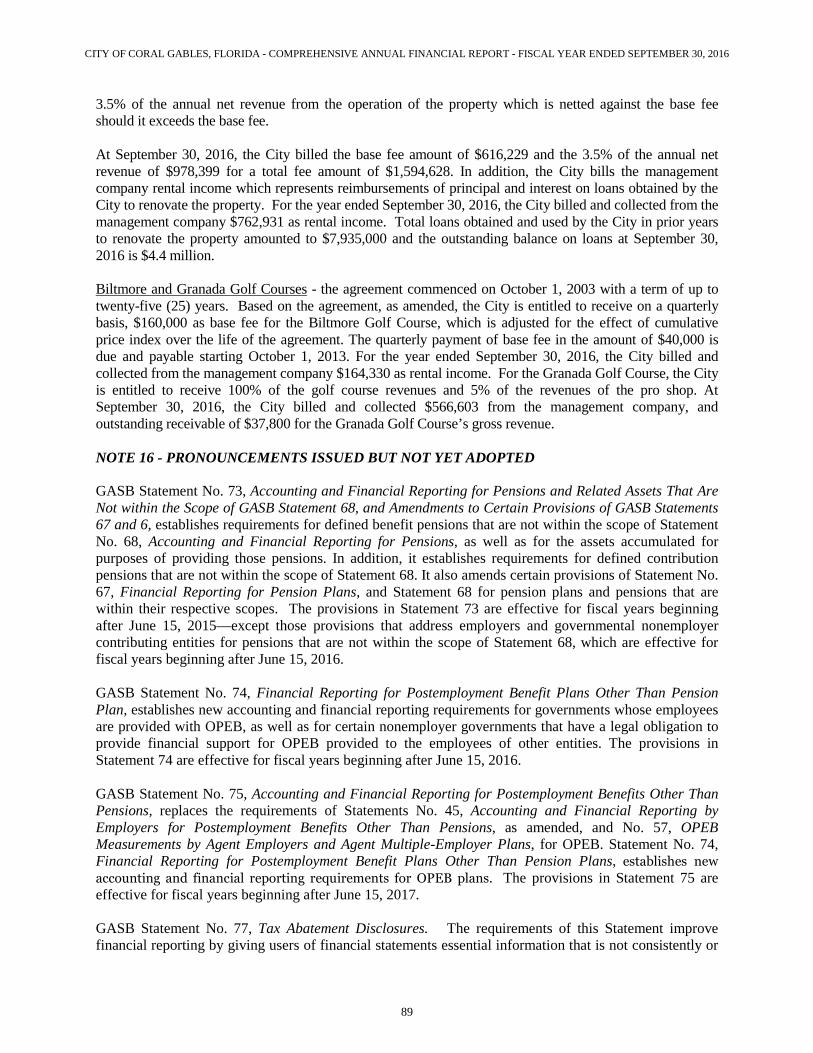
CITY OF CORAL GABLES, FLORIDA - COMPREHENSIVE ANNUAL FINANCIAL REPORT - FISCAL YEAR ENDED SEPTEMBER 30, 2016
3.5% of the annual net revenue from the operation of the property which is netted against the base fee
should it exceeds the base fee.
At September 30, 2016, the City billed the base fee amount of $616,229 and the 3.5% of the annual net
revenue of $978,399 for a total fee amount of $1,594,628. In addition, the City bills the management
company rental income which represents reimbursements of principal and interest on loans obtained by the
City to renovate the property. For the year ended September 30, 2016, the City billed and collected from the
management company $762,931 as rental income. Total loans obtained and used by the City in prior years
to renovate the property amounted to $7,935,000 and the outstanding balance on loans at September 30,
2016 is $4.4 million.
Biltmore and Granada Golf Courses - the agreement commenced on October 1, 2003 with a term of up to
twenty-five (25) years. Based on the agreement, as amended, the City is entitled to receive on a quarterly
basis, $160,000 as base fee for the Biltmore Golf Course, which is adjusted for the effect of cumulative
price index over the life of the agreement. The quarterly payment of base fee in the amount of $40,000 is
due and payable starting October 1, 2013. For the year ended September 30, 2016, the City billed and
collected from the management company $164,330 as rental income. For the Granada Golf Course, the City
is entitled to receive 100% of the golf course revenues and 5% of the revenues of the pro shop. At
September 30, 2016, the City billed and collected $566,603 from the management company, and
outstanding receivable of $37,800 for the Granada Golf Course’s gross revenue.
NOTE 16 - PRONOUNCEMENTS ISSUED BUT NOT YET ADOPTED
GASB Statement No. 73, Accounting and Financial Reporting for Pensions and Related Assets That Are
Not within the Scope of GASB Statement 68, and Amendments to Certain Provisions of GASB Statements
67 and 6, establishes requirements for defined benefit pensions that are not within the scope of Statement
No. 68, Accounting and Financial Reporting for Pensions, as well as for the assets accumulated for
purposes of providing those pensions. In addition, it establishes requirements for defined contribution
pensions that are not within the scope of Statement 68. It also amends certain provisions of Statement No.
67, Financial Reporting for Pension Plans, and Statement 68 for pension plans and pensions that are
within their respective scopes. The provisions in Statement 73 are effective for fiscal years beginning
after June 15, 2015—except those provisions that address employers and governmental nonemployer
contributing entities for pensions that are not within the scope of Statement 68, which are effective for
fiscal years beginning after June 15, 2016.
GASB Statement No. 74, Financial Reporting for Postemployment Benefit Plans Other Than Pension
Plan, establishes new accounting and financial reporting requirements for governments whose employees
are provided with OPEB, as well as for certain nonemployer governments that have a legal obligation to
provide financial support for OPEB provided to the employees of other entities. The provisions in
Statement 74 are effective for fiscal years beginning after June 15, 2016.
GASB Statement No. 75, Accounting and Financial Reporting for Postemployment Benefits Other Than
Pensions, replaces the requirements of Statements No. 45, Accounting and Financial Reporting by
Employers for Postemployment Benefits Other Than Pensions, as amended, and No. 57, OPEB
Measurements by Agent Employers and Agent Multiple-Employer Plans, for OPEB. Statement No. 74,
Financial Reporting for Postemployment Benefit Plans Other Than Pension Plans, establishes new
accounting and financial reporting requirements for OPEB plans. The provisions in Statement 75 are
effective for fiscal years beginning after June 15, 2017.
GASB Statement No. 77, Tax Abatement Disclosures. The requirements of this Statement improve
financial reporting by giving users of financial statements essential information that is not consistently or
89
CITY OF CORAL GABLES, FLORIDA - COMPREHENSIVE ANNUAL FINANCIAL REPORT - FISCAL YEAR ENDED SEPTEMBER 30, 2016
comprehensively reported to the public at present. Disclosure of information about the nature and
magnitude of tax abatements will make these transactions more transparent to financial statement users.
The requirements of this Statement are effective for reporting periods beginning after December 15, 2015.
GASB Statement No. 78, Pensions Provided through Certain Multiple-Employer Defined Benefit Pension
Plans. The objective of this Statement is to address a practice issue regarding the scope and applicability
of Statement No. 68, Accounting and Financial Reporting for Pensions. This issue is associated with
pensions provided through certain multiple-employer defined benefit pension plans and to state or local
governmental employers whose employees are provided with such pensions. The requirements of this
Statement are effective for reporting periods beginning after December 15, 2015.
GASB Statement No. 80, Blending Requirements for Certain Component Units—an amendment of GASB
Statement No. 14. This Statement amends the blending requirements for the financial statement
presentation of component units of all state and local governments. The additional criterion requires
blending of a component unit incorporated as a not-for-profit corporation in which the primary
government is the sole corporate member. The additional criterion does not apply to component units
included in the financial reporting entity pursuant to the provisions of Statement No. 39, Determining
Whether Certain Organizations Are Component Units. The requirements of this Statement are effective for reporting periods beginning after June 15, 2016. Earlier application is encouraged.
GASB Statement No. 81, Irrevocable Split-Interest Agreements. The objective of this Statement is to
improve accounting and financial reporting for irrevocable split-interest agreements by providing
recognition and measurement guidance for situations in which a government is a beneficiary of the
agreement. The requirements of this Statement are effective for periods beginning after December 15, 2016. Earlier application is encouraged.
GASB Statement No. 82, Pension Issues—an amendment of GASB Statements No. 67, No. 68, and No.
73. The objective of this Statement is to address certain issues that have been raised with respect to
Statements No. 67, Financial Reporting for Pension Plans, No. 68, Accounting and Financial Reporting
for Pensions, and No. 73, Accounting and Financial Reporting for Pensions and Related Assets That Are
Not within the Scope of GASB Statement 68, and Amendments to Certain Provisions of GASB Statements
67 and 68. Specifically, this Statement addresses issues regarding (1) the presentation of payroll-related
measures in required supplementary information, (2) the selection of assumptions and the treatment of
deviations from the guidance in an Actuarial Standard of Practice for financial reporting purposes, and (3)
the classification of payments made by employers to satisfy employee (plan member) contribution
requirements. The requirements of this Statement are effective for reporting periods beginning after June 15, 2016, except for the requirements of paragraph 7 in a circumstance in which an employer’s pension liability is measured as of a date other than the employer’s most recent fiscal year-end. In that circumstance, the requirements of paragraph 7 are effective for that employer in the first reporting period in which the measurement date of the pension liability is on or after June 15, 2017. Earlier application is encouraged.
GASB Statement No. 83, Certain Asset Retirement Obligations. This Statement addresses accounting
and financial reporting for certain asset retirement obligations (AROs). An ARO is a legally enforceable
liability associated with the retirement of a tangible capital asset. A government that has legal obligations
to perform future asset retirement activities related to its tangible capital assets should recognize a
liability based on the guidance in this Statement. The requirements of this Statement are effective for reporting periods beginning after June 15, 2018. Earlier application is encouraged.
GASB Statement No. 84, Fiduciary Activities. This Statement establishes criteria for identifying fiduciary
activities of all state and local governments. The focus of the criteria generally is on (1) whether a
government is controlling the assets of the fiduciary activity and (2) the beneficiaries with whom a
90

CITY OF CORAL GABLES, FLORIDA - COMPREHENSIVE ANNUAL FINANCIAL REPORT - FISCAL YEAR ENDED SEPTEMBER 30, 2016
fiduciary relationship exists. Separate criteria are included to identify fiduciary component units and
postemployment benefit arrangements that are fiduciary activities. The requirements of this Statement are
effective for reporting periods beginning after December 15, 2018. Earlier application is encouraged.
The City’s management has not determined the effect these pronouncements will have on the City’s
financial statements.
NOTE 17 - LAW ENFORCEMENT
The City’s financial statements include the Law Enforcement Agency Fund. This fund is used to report
resources held for the South Florida Money Laundering Strikeforce (Strike Force) in a purely custodial
capacity. The Strike Force is made up of 15 police agencies including the City’s police force working
together towards the elimination of specific crime activities. Accumulated resources from confiscation of
property, principally cash are distributed by court order to individuals, private organizations, or other
governments. The assets held in custody by the City are also recognized as a liability.
91

[ This Page Intentionally Left Blank ]
92

Required Supplementary Information (Unaudited)
Supplementary Information
Notes to Required Supplementary Information
93

CITY OF CORAL GABLES, FLORIDA - COMPREHENSIVE ANNUAL FINANCIAL REPORT - FISCAL YEAR ENDED SEPTEMBER 30, 2016
Actual Variance with
Original Final Amounts Final Budget
REVENUES
Taxes 89,511,324$ 90,081,324$ 89,730,497$ (350,827)$
Licenses 3,346,000 3,346,000 3,496,840 150,840
Permits 7,314,501 7,343,000 9,007,729 1,664,729
Fines and Forfeitures 1,958,000 1,958,000 2,552,563 594,563
Intergovernmental 4,965,000 5,113,431 5,329,086 215,655
Charges for Services 18,422,400 18,422,400 19,393,779 971,379
Recreation Activity Fees 3,856,900 3,871,900 4,575,172 703,272
Rental Income 4,839,610 4,839,610 5,833,825 994,215
Investment Earmings 192,857 192,857 443,236 250,379
Contributions and Donations - 19,500 70,500 51,000
Miscellaneous 159,081 352,115 390,552 38,437
Total Revenues 134,565,673 135,540,137 140,823,779 5,283,642
EXPENDITURES
Current:
General Government 22,140,375 21,829,562 20,764,296 1,065,266
Public Safety 77,671,418 76,824,403 75,065,555 1,758,848
Physical Environment 19,634,096 19,598,622 18,791,023 807,599
Transportation 3,088,985 3,064,871 2,964,063 100,808
Economic Environment 964,822 1,042,245 936,939 105,306
Culture and Recreation 11,436,517 11,425,504 9,545,041 1,880,463
Debt Service:
Retirement of Principal 32,200 53,200 156,950 (103,750)
Interest - - 803 (803)
Capital Outlay 690,923 2,246,555 994,674 1,251,881
Total Expenditures 135,659,336 136,084,962 129,219,344 6,865,618
Excess of Revenues Over Expenditures (1,093,663) (544,825) 11,604,435 12,149,260
OTHER FINANCING SOURCES (USES)
Transfers In 7,691,071 8,624,920 9,422,325 797,405
Transfers Out (8,881,214) (11,892,807) (16,126,431) (4,233,624)
Total Other Financing Sources (Uses) (1,190,143) (3,267,887) (6,704,106) (3,436,219)
Net Change in Fund Balance* (2,283,806)$ (3,812,712)$ 4,900,329 8,713,041$
Fund Balance - Beginning 52,739,923
Fund Balance - Ending 57,640,252$
* The net change in fund balances was included in the adopted budget as an appropriation (i.e, planned uses) of fund balance.
See notes to required supplementary information.
CITY OF CORAL GABLES, FLORIDASCHEDULE OF REVENUES, EXPENDITURES AND CHANGES IN FUND BALANCE
BUDGET AND ACTUAL - GENERAL FUND (Unaudited)
For the Fiscal Year Ended September 30, 2016
Budgeted Amounts
94

CITY OF CORAL GABLES, FLORIDA - COMPREHENSIVE ANNUAL FINANCIAL REPORT - FISCAL YEAR ENDED SEPTEMBER 30, 2016
September 30, September 30,
2016 2015
Total pension liability
Service cost 5,665,063$ 6,066,834$
Interest 41,412,567 40,360,719
Benefit changes - 7,175
Differences between expected and actual experience 50,400 5,822,419
Changes of assumptions 4,037,514 -
Benefit payment, including refunds of member contributions (41,597,731) (34,968,554)
Net change in total pension liability 9,567,813 17,288,593
Total pension liability - beginning 549,489,501 532,200,908
Total pension liability - ending 559,057,314 549,489,501
Total fiduciary net position
Contributions - City 24,151,856 25,554,746
Contributions - Share Plan 145,830 145,830
Contributions - Employees 4,704,069 4,095,928
Net investment income 6,282,235 30,421,080
Benefit payments, including refunds of member contributions (41,597,731) (34,968,554)
Administrative expenses (431,707) (334,272)
Net change in plan fiduciary net position (6,745,448) 24,914,758
Plan fiduciary net position - beginning 336,650,855 311,736,097
Plan fiduciary net position - ending 329,905,407$ 336,650,855$
City's net pension liability 229,151,907$ 212,838,646$
Plan fiduciary net position as a percentage of the total pension liability 59.01% 61.27%
Covered Employee Payroll 36,785,806$ 35,930,984$
Net Pension liability as percentage of covered employee payroll 622.94% 592.35%
* Note to Schedule: This Schedule is presented to illustrate the requirement of GASB 68 and intended to show
information for 10 years. Additional years will be displayed as they become available.
REQUIRED SUPPLEMENTARY INFORMATION
CITY OF CORAL GABLES, FLORIDA
SCHEDULE OF CHANGES IN THE CITY'S NET PENSION LIABILITY
(Unaudited)
AND RELATED RATIOS*
95

CITY OF CORAL GABLES, FLORIDA - COMPREHENSIVE ANNUAL FINANCIAL REPORT - FISCAL YEAR ENDED SEPTEMBER 30, 2016
Year Ended Year Ended Year EndedSeptember 30, 2016 September 30, 2015 September 30, 2014
Actuarially determined contribution 23,838,224$ 24,288,466$ 25,678,422$
27,924,224 24,297,686 25,700,576
Contribution deficiency (excess) (4,086,000)$ (9,220)$ (22,154)$
Covered-employee payroll 37,305,296$ 36,785,806$ 35,930,984$
Contributions as a percentage of
covered-employee payroll 74.85% 66.05% 71.53%
Notes to Schedule:
Valuation Date: October 1, 2014 (For Fiscal Year 2016)
Note Actuarially determined contribution rates are calculated as
of October 1, which is two years prior to the end of the fiscal
year in which contributions are reported.
Methods and Assumptions Used to Determine Contribution Rates:
Acturial cost method Entry age normal, level percent of pay
Amortization method Level dollar, closed
Remaining amortization period 21 years (single equivalent period)
Asset valuation method 5-year smoothed market
Inflation 2.50%
Salary increases 3.25% to 7.75% depending on age, including inflation
Investment rate of return 7.75%
Retirement age Experience-based table of rates that are specific to the
type of eligibility condition
Mortality RP-2000 Combined Heathy Participant Mortality Table for
males and females with mortality projected to 2015using Scale AA
* Note to Schedule: This Schedule is presented to illustrate the requirement of GASB 68 and intended to show
information for 10 years. Additional years will be displayed as they become available.
REQUIRED SUPPLEMENTARY INFORMATION
CITY OF CORAL GABLES, FLORIDA
SCHEDULE OF CONTRIBUTIONS
(Unaudited)
Contribution made in relation to the
actuarially determined contribution
96

CITY OF CORAL GABLES, FLORIDA - COMPREHENSIVE ANNUAL FINANCIAL REPORT - FISCAL YEAR ENDED SEPTEMBER 30, 2016
Actuarial UAAL
Actuarial Accrued Unfunded as % of
Value of Liability (AAL) Actuarial Accrued Funded Covered Covered
Actuarial Assets Entry Age Liability (UAAL) Ratio Payroll Payroll
Valuation Date (a) (b) (b-a) (a/b) (c) ((b-a)/c)
September 30, 2016 - $26,905 $26,905 0% $49,477 54.4%
September 30, 2015 - $25,803 $25,803 0% $48,535 53.2%
September 30, 2014 - $25,036 $25,036 0% $48,491 51.6%
September 30, 2013 - $23,907 $23,907 0% $46,841 51.0%
September 30, 2012 - $26,636 $26,636 0% $50,036 53.2%
September 30, 2011 - $25,317 $25,317 0% $49,102 51.6%
September 30, 2010 - $21,100 $21,100 0% $57,458 36.7%
September 30, 2009 - $19,884 $19,884 0% $55,248 36.0%
(Amounts in thousands)
(Unaudited)
REQUIRED SUPPLEMENTARY INFORMATION
SCHEDULE OF FUNDING PROGRESS
OTHER POST EMPLOYMENT BENEFITS
CITY OF CORAL GABLES, FLORIDA
97

CITY OF CORAL GABLES, FLORIDA- COMPREHENSIVE ANNUAL FINANCIAL REPORT-FISCAL YEAR ENDED SEPTEMBER 30, 2016
CITY OF CORAL GABLES, FLORIDA
NOTES TO THE REQUIRED
SUPPLEMENTARY INFORMATION
(Unaudited)
Note 1 – Budgets and Legal Compliance
(a) Budgets are adopted on a basis consistent with GAAP. Annual appropriated budgets are adopted for the
general and debt service fund. All annual appropriations lapse at fiscal year-end. While all appropriations and
encumbrances lapse at year end, valid outstanding encumbrances are re-appropriated and become part of the
subsequent year’s budget. Project-length financial plans are adopted for all capital project funds.
(b) During July of each year, the City Manager submits to the City Commission a proposed operating budget for
the ensuing fiscal year. The proposed budget is prepared by fund, function and activity, and includes information
on the past year, current year estimates, and requested appropriations for the next fiscal year. During September of
each year the City Commission holds two public hearings for adoption of the budget by ordinance. The level of
budgetary control (that is the level at which expenditures cannot legally exceed the appropriated amount) is the
total appropriated by fund. Management may make transfers of appropriations between funds however must seek
City Commission approval to change the total appropriated budget amount, unless changes to the total appropriated
budget are considered necessary for the continuity of the City’s operations, for which management is give the
authority to do so without the City Commission approval.
(c) Budget ordinance provides that transfers between operating, capital, proprietary and internal service funds are
necessary and appropriate during the prior fiscal year-end closing process, as well as subsequent to the adoption of
the annual budget for the continuity of City operations.
(c) The amounts shown in the financial statements reflect the original budgeted amounts and all amendments and
supplements approved through September 30, 2016 that are included in the final amended budget.
98

Combining Individual Fund Statements and Schedules
These financial statements provide a more detailed view of the Capital Projects, Internal
Service, Pension Trust and Agency Fund types included in the Basic Financial
Statements presented in the preceding subsection.
Combining statements are presented when there are more than one fund of a given fund
type.
99

[ This Page Intentionally Left Blank ]
100

Nonmajor Governmental Funds
Capital Projects Funds:
Neighborhood Renaissance Program Fund - to account for and report the proceeds of
the Special Obligation Bonds Series 2012 and Series 2011 and other financial resources
that are restricted, committed, or assigned for the acquisition or construction of various
major capital improvements.
Roadway Improvement Fund – to account for the construction costs of resurfacing and
rebuilding certain city streets along with the related curbs, gutters, drainage and
streelights. These acquisitions are funded from the City’s share of a local option gasoline
sales tax plus the proceeds realized from certain deferred assessment lien revenue on
roadway improvement assessments.
Transportation Fund – to account for the costs of the Urban Improvement Program
which was set in place to assist the flow of traffic in the commercial areas and to provide
connectivity to the metrorail.
General Obligation Bond Fund – to account for projects toward enhancement /
expansion of public parks and plazas; enhance residential and commercial areas;
homeland security and to construct the Coral Gables Museum.
Impact Fees Fund – to account for receipts of impact fees imposed on new developments
within the City, and expenditures for the type of system improvements for which the
impact fee was imposed and only within the impact fee benefit district where the impact
fee was collected.
101

[ This Page Intentionally Left Blank ]
102

CITY OF CORAL GABLES, FLORIDA - COMPREHENSIVE ANNUAL FINANCIAL REPORT - FISCAL YEAR ENDED SEPTEMBER 30, 2016
Neighborhood
Renaissance Roadway General Total Nonmajor
Program Improvement Transportation Obligation Impact Fees Governmental
Fund Fund Fund Bond Fund Fund Funds
ASSETS
Pooled Cash and Cash Equivalents -$ 1,344,242$ 358,655$ 8,356$ -$ 1,711,253$
Restricted Cash and Cash Equivalents 4,048,834 - - - 2,837,541 6,886,375
Pooled Investments - 1,777,668 589,061 - - 2,366,729
Restricted Investments 479,436 - - - 4,284,921 4,764,357
Accounts Receivable, Net - 166,915 - - - 166,915
Interest Receivable 647 2,846 926 - 6,471 10,890
Due from Other Governments - 234,448 755,920 401,069 - 1,391,437
Prepaid and Deposits - - 22,223 - - 22,223
Total Assets 4,528,917 3,526,119 1,726,785 409,425 7,128,933 17,320,179
LIABILITIES
Accounts Payable 340,539 285,077 390,168 238,190 114,861 1,368,835
Accrued Payroll - 223 5,168 - - 5,391
Due to Other Funds - - - 165,000 - 165,000
Total Liabilities 340,539 285,300 395,336 403,190 114,861 1,539,226
DEFERRED INFLOWS OF RESOURCES
Unavailable revenue - Municipal Surtax - - 269,099 - - 269,099
Unavailable revenue - Grants and Contributions - 137,287 - 401,069 - 538,356
Unavailable revenue - Special Assessments - - 18,906 - - 18,906
Total Deferred Inflows of Resources - 137,287 288,005 401,069 - 826,361
FUND BALANCES (DEFICIT)
Nonspendable:
Prepaid Items - - 22,223 - - 22,223
Restricted to:
Public Safety - - - - 3,150,674 3,150,674
Entrances/Circles/Fountains 1,744,077 - - - - 1,744,077
Parks and Recreation 1,908,274 - - - 2,154,419 4,062,693
Other Physical Environment 536,027 - - - 1,646,471 2,182,498
Impact Fee Administration - - - - 62,508 62,508
Assigned to:
Other Capital Projects - 3,103,532 1,021,221 - - 4,124,753
Unassigned - - (394,834) - (394,834)
Total Fund Balances (Deficit) 4,188,378 3,103,532 1,043,444 (394,834) 7,014,072 14,954,592
Total Liabilities, Deferred Inflows of Resources
and Fund Balances (Deficit) 4,528,917$ 3,526,119$ 1,726,785$ 409,425$ 7,128,933$ 17,320,179$
Capital Projects
CITY OF CORAL GABLES, FLORIDA
COMBINING BALANCE SHEET
NONMAJOR GOVERNMENTAL FUNDS
September 30, 2016
103

CITY OF CORAL GABLES, FLORIDA - COMPREHENSIVE ANNUAL FINANCIAL REPORT - FISCAL YEAR ENDED SEPTEMBER 30, 2016
Neighborhood
Renaissance Roadway General Total Nonmajor
Program Improvement Transportation Obligation Impact Fees Governmental
Fund Fund Fund Bond Fund Fund Funds
REVENUES
Gasoline Sales Tax -$ 1,170,162$ -$ -$ -$ 1,170,162$
Municipal Surtax - - 1,770,880 - - 1,770,880
Special Assessments - - - - 1,602,180 1,602,180
Rental Income - - 29,032 - - 29,032
Intergovernmental - - - 494,107 - 494,107
Investment Earnings 53,027 18,536 5,625 32,679 109,867
Total Revenues 53,027 1,188,698 1,805,537 494,107 1,634,859 5,176,228
EXPENDITURES
Current:
General Government 2,902 - - - 45,884 48,786
Transportation 989,073 579,214 1,714,439 - - 3,282,726
Culture and Recreation 1,275,766 - - 14,518 - 1,290,284
Capital Outlay 7,280,545 295,204 365,523 822,912 987,898 9,752,082
Total Expenditures 9,548,286 874,418 2,079,962 837,430 1,033,782 14,373,878
(9,495,259) 314,280 (274,425) (343,323) 601,077 (9,197,650)
OTHER FINANCING SOURCES (USES)
Transfers In 305,161 235,000 4,330 - - 544,491
Total Other Financing Sources (Uses) 305,161 235,000 4,330 - - 544,491
Net Change in Fund Balances (9,190,098) 549,280 (270,095) (343,323) 601,077 (8,653,159)
Fund Balances (Deficit) - Beginning 13,378,476 2,554,252 1,313,539 (51,511) 6,412,995 23,607,751
Fund Balances (Deficit) - Ending 4,188,378$ 3,103,532$ 1,043,444$ (394,834)$ 7,014,072$ 14,954,592$
CITY OF CORAL GABLES, FLORIDACOMBINING STATEMENT OF REVENUES, EXPENDITURES AND CHANGES IN FUND BALANCES (DEFICIT)
NONMAJOR GOVERNMENTAL FUNDS
For the Fiscal Year Ended September 30, 2016
Excess (Deficiency) of Revenues Over (Under)
Expenditures
Capital Projects
104

CITY OF CORAL GABLES, FLORIDA - COMPREHENSIVE ANNUAL FINANCIAL REPORT - FISCAL YEAR ENDED SEPTEMBER 30, 2016
Actual Variance with
Original Final Amounts Final Budget
REVENUES
Special Assessments -$ -$ 33,719$ 33,719$
Investment Earnings - - 7,184 7,184
Total Revenues - - 40,903 40,903
EXPENDITURES
Debt Service:
Retirement of Principal 3,626,061 3,626,061 3,624,492 1,569
Interest 2,861,367 2,861,367 1,802,632 1,058,735
Total Expenditures 6,487,428 6,487,428 5,427,124 1,060,304
Deficiency of Revenues Under Expenditures (6,487,428) (6,487,428) (5,386,221) 1,101,207
OTHER FINANCING SOURCES (USES)
Transfers In 6,487,428 6,487,428 6,487,428 -
Transfers Out - 375,000 - (375,000)
Total Other Financing Sources 6,487,428 6,862,428 6,487,428 (375,000)
Net Change in Fund Balances -$ 375,000$ 1,101,207 726,207$
Fund Balances - Beginning 1,680,845
Fund Balances - Ending 2,782,052$
CITY OF CORAL GABLES, FLORIDASCHEDULE OF REVENUES, EXPENDITURES AND CHANGES IN FUND BALANCES
BUDGET AND ACTUAL - DEBT SERVICE FUND - SUNSHINE STATE LOANS (Unaudited)
For the Fiscal Year Ended September 30, 2016
Budgeted Amounts
105

[ This Page Intentionally Left Blank ]
106

Internal Service Funds Motor Pool Fund - to account for the costs of operating a maintenance facility for automotive and other various
types of equipment used by other City departments. The operating and maintenance costs are allocated to the user
departments by charging a flat rate for annual rental for the equipment. Rental charges are updated annually
based on detail maintenance and operating cost records kept for each item of equipment provided. The equipment
itself is acquired by the Motor Pool Fund and financing is provided by charging the user departments an annual
replacement charge based upon the estimated life of the equipment.
Public Facilities Fund - to account for the costs of providing building maintenance, utilities and general
housekeeping services for all City property. Financing is provided by charging the user departments an annual
rental fee based upon actual costs.
Insurance Fund - to account for the cost to provide general liability, automobile liability and workers’
compensation insurance administered by an outside professional third party administrator, and the cost to provide
health care. Financing is provided by insurance premium charges to the user departments and investment earnings
on accumulated reserves.
107

CITY OF CORAL GABLES, FLORIDA - COMPREHENSIVE ANNUAL FINANCIAL REPORT - FISCAL YEAR ENDED SEPTEMBER 30, 2016
Motor Public
Pool Facilities Insurance Total Internal
Fund Fund Fund Service Funds
ASSETS
Current Assets:
Cash and Cash Equivalents 2,335,308$ 1,656,588$ 7,768,977$ 11,760,873$
Investments 5,153,816 2,061,033 8,187,388 15,402,237
Accounts Receivable, Net 10,951 4,605 3,707 19,263
Interest Receivable 8,355 3,226 12,992 24,573
Inventories 57,730 - - 57,730
Prepaid and Deposits 893,934 - 1,178,853 2,072,787
Total Current Assets 8,460,094 3,725,452 17,151,917 29,337,463
Noncurrent Assets:
Capital Assets:
Construction in Progress 40,231 - - 40,231
Equipment 30,601,339 248,407 - 30,849,746
Accumulated Depreciation (23,347,977) (169,878) - (23,517,855)
Total Noncurrent Assets 7,293,593 78,529 - 7,372,122
Total Assets 15,753,687 3,803,981 17,151,917 36,709,585
DEFERRED OUTFLOWS OF RESOURCES
Deferred Outflows Related to Pensions 965,466 645,286 - 1,610,752
Total Deferred Outflows of Resources 965,466 645,286 - 1,610,752
LIABILITIES
Current Liabilities:
Accounts Payable 225,638 1,012,694 129,917 1,368,249
Accrued Payroll 61,175 43,953 - 105,128
Accrued Compensated Absences 123,868 75,797 - 199,665
Claims Payable - - 6,092,000 6,092,000
Total Current Liabilities 410,681 1,132,444 6,221,917 7,765,042
Noncurrent Liabilities:
Accrued Compensated Absences 106,508 47,245 - 153,753
Claims Payable - - 7,930,000 7,930,000
Net OPEB Obligation 152,657 90,206 - 242,863
Net Pension Liability 4,491,377 3,001,890 - 7,493,267
Total Noncurrent Liabilities 4,750,542 3,139,341 7,930,000 15,819,883
Total Liabilities 5,161,223 4,271,785 14,151,917 23,584,925
DEFERRED INFLOWS OF RESOURCES
Deferred Inflows Related to Pensions 64,500 43,109 - 107,609
Total Deferred Inflows of Resources 64,500 43,109 - 107,609
NET POSITION
Net Investment in Capital Assets 7,293,593 78,529 - 7,372,122
Unrestricted 4,199,837 55,844 3,000,000 7,255,681
Total Net Position 11,493,430$ 134,373$ 3,000,000$ 14,627,803$
CITY OF CORAL GABLES, FLORIDACOMBINING STATEMENT OF NET POSITION
INTERNAL SERVICE FUNDS
September 30, 2016
108

CITY OF CORAL GABLES, FLORIDA - COMPREHENSIVE ANNUAL FINANCIAL REPORT - FISCAL YEAR ENDED SEPTEMBER 30, 2016
Motor Public
Pool Facilities Insurance Total Internal
Fund Fund Fund Service Funds
OPERATING REVENUES
Charges for Services:
Billings to Departments for Insurance Protection -$ -$ 11,422,719$ 11,422,719$
Rental of Equipment and Facilities to Various Funds:
Equipment Operation and Maintenance 4,566,443 - - 4,566,443
Equipment Replacement Charges 3,154,224 - - 3,154,224
Facilities - 6,827,885 - 6,827,885
Total Operating Revenues 7,720,667 6,827,885 11,422,719 25,971,271
OPERATING EXPENSES
Administration 2,328,792 1,757,138 - 4,085,930
Cost of Sales and Services 2,353,152 5,097,755 - 7,450,907
Benefit Payments - - 5,099,911 5,099,911
Insurance - - 7,985,755 7,985,755
Depreciation 2,051,678 23,149 - 2,074,827
Total Operating Expenses 6,733,622 6,878,042 13,085,666 26,697,330
Operating Income 987,045 (50,157) (1,662,947) (726,059)
NONOPERATING REVENUES (EXPENSES)
Interest Earnings 52,281 18,970 80,664 151,915
Interest Expense - - - -
Miscellaneous 4,760 - 89,770 94,530
Gain from Sale of Capital Assets 291,840 - - 291,840
Total Nonoperating Revenues (Expenses) 348,881 18,970 170,434 538,285
Income Before Transfers 1,335,926 (31,187) (1,492,513) (187,774)
Transfers In - 31,187 1,492,513 1,523,700
Transfers Out (1,335,926) - - (1,335,926)
Change In Net Position - - - -
Net Position - Beginning 11,493,430 134,373 3,000,000 14,627,803
Net Position - Ending 11,493,430$ 134,373$ 3,000,000$ 14,627,803$
CITY OF CORAL GABLES, FLORIDACOMBINING STATEMENT OF REVENUES, EXPENSES AND CHANGES IN NET POSITION
INTERNAL SERVICE FUNDS
For the Fiscal Year Ended September 30, 2016
109

CITY OF CORAL GABLES, FLORIDA - COMPREHENSIVE ANNUAL FINANCIAL REPORT - FISCAL YEAR ENDED SEPTEMBER 30, 2016
Motor Public
Pool Facilities Insurance Total Internal
Fund Fund Fund Service Funds
CASH FLOWS FROM OPERATING ACTIVITIES
Receipts from Customers and Users 7,727,418$ 6,858,241$ 11,419,147$ 26,004,806$
Payments to Employees (2,360,074) (1,590,566) - (3,950,640)
Payments to Suppliers (3,539,117) (4,934,386) (10,861,462) (19,334,965)
Net Cash Provided by (used in) Operating Activities 1,828,227 333,289 557,685 2,719,201
CASH FLOWS FROM NONCAPITAL FINANCING ACTIVITIES
Transfers in from Other Funds - 31,187 1,492,513 1,523,700
Transfers out to Other Funds (1,335,926) - - (1,335,926)
Net Cash Provided by (used in) Noncapital Financing Activities (1,335,926) 31,187 1,492,513 187,774
CASH FLOWS FROM CAPITAL AND RELATED
FINANCING ACTIVITIES
Acquisition and Construction of Capital Assets (2,468,990) (10,749) - (2,479,739)
Proceeds from Sale of Capital Assets 291,840 - - 291,840
Net Cash Provided by (used in) Capital and Related Financing Activities (2,177,150) (10,749) - (2,187,899)
CASH FLOWS PROVIDED BY INVESTING ACTIVITIES
Purchase of Investments (6,879,634) (2,515,081) (9,828,694) (19,223,409)
Proceeds from Sale of Investments 7,385,845 2,482,489 9,548,945 19,417,279
Interest and Dividends Received 57,364 18,865 168,421 244,650
Net Cash Provided by (used in) Investing Activities 563,575 (13,727) (111,328) 438,520
Net Increase (Decrease) in Cash and Cash Equivalents (1,121,274) 340,000 1,938,870 1,157,596
Cash and Cash Equivalents - Beginning 3,456,582 1,316,588 5,830,107 10,603,277
Cash and Cash Equivalents - Ending 2,335,308$ 1,656,588$ 7,768,977$ 11,760,873$
Reconciliation of operating income (loss) to net cash provided by
(used in) operating activities:
Operating Income (Loss) 987,045$ (50,157)$ (1,662,947)$ (726,059)$
Adjustments to Reconcile Operating Income (Loss) to Net Cash
Provided by (used in) Operating Activities:
Depreciation Expense 2,051,678 23,149 - 2,074,827
Pension Expense (35,759) 124,160 88,401
Change in Assets and Liabilities:
Accounts Receivable 6,751 30,356 (3,572) 33,535
Inventory 3,123 - - 3,123
Prepaid Items (893,934) 400 92,993 (800,541)
Accounts Payable (295,154) 162,969 37,211 (94,974)
Accrued Payroll and Other Expenses 13,256 16,839 - 30,095
Accrued Compensated Absences (26,977) 14,820 - (12,157)
Claims Payable - - 2,094,000 2,094,000
Net OPEB Obligation 18,198 10,753 - 28,951
Total Adjustments 841,182 383,446 2,220,632 3,445,260
Net Cash Provided by (used in) Operating Activities 1,828,227$ 333,289$ 557,685$ 2,719,201$
Noncash Operating Activities:
Deferred Outflows Related to Pension 965,466$ 645,286$ -$ 1,610,752$
Deferred Inflows Related to Pension (64,500) (43,109) - (107,609)
Net Pension Liability (4,491,377) (3,001,890) - (7,493,267)
CITY OF CORAL GABLES, FLORIDA
COMBINING STATEMENT OF CASH FLOWS
INTERNAL SERVICE FUNDS
For the Fiscal Year Ended September 30, 2016
110

Fiduciary Funds
Pension Trust Funds
Coral Gables Retirement Fund - to account for the accumulation of resources to be used
for retirement annuities of all employees at appropriate amounts and times in the future.
Resources are provided by employer contributions determined by an actuarial study, and in-
vestment earnings.
Police Officers' Pension Fund and Fire Fighters Pension Fund - to account for
accumulation of resources to be used for supplemental retirement benefits for police officers
and fire fighters. Resources are provided by annual employer contributions and investment
earnings. Individual participation is based upon years of service. Individuals may withdraw
their equity upon retirement.
Agency Fund
Employee Benefits Fund - to account for the value of employees’ excess sick leave
deposited in a sick leave bank held by the City as custodian.
Law Enforcement Fund - to account for resources provided as a result of certain police
investigations, seizures and forfeitures.
111
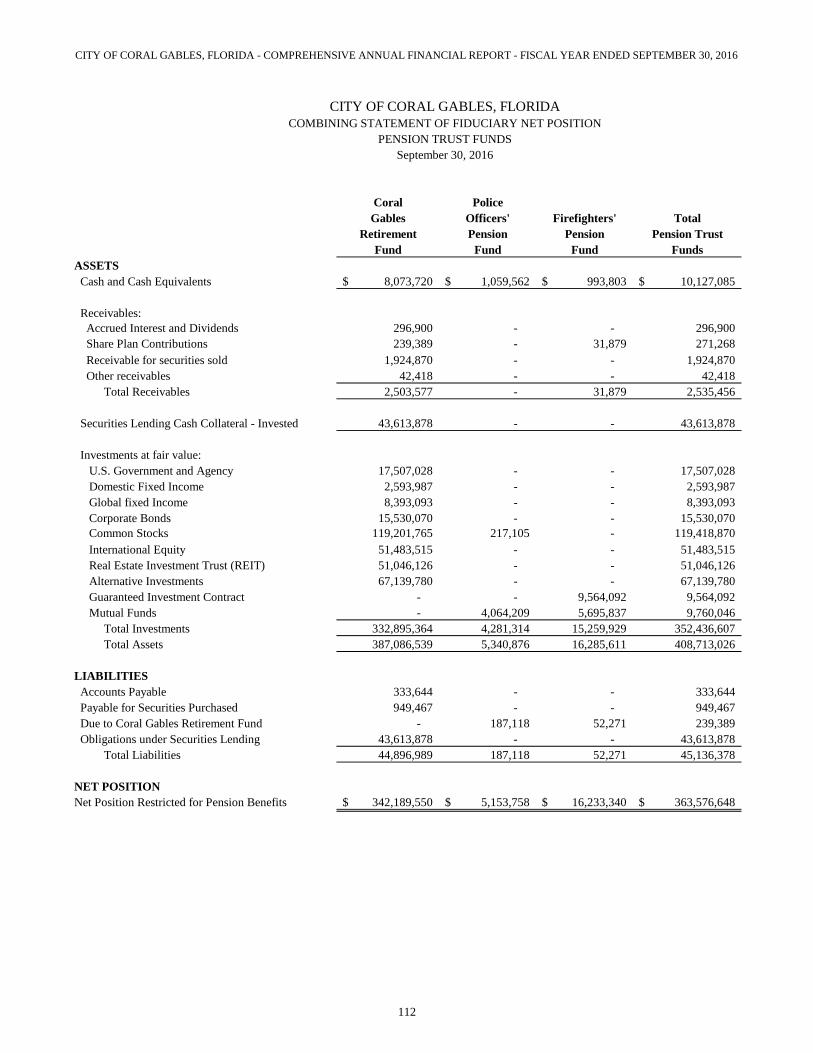
CITY OF CORAL GABLES, FLORIDA - COMPREHENSIVE ANNUAL FINANCIAL REPORT - FISCAL YEAR ENDED SEPTEMBER 30, 2016
Coral Police
Gables Officers' Firefighters' Total
Retirement Pension Pension Pension Trust
Fund Fund Fund Funds
ASSETS
Cash and Cash Equivalents 8,073,720$ 1,059,562$ 993,803$ 10,127,085$
Receivables:
Accrued Interest and Dividends 296,900 - - 296,900
Share Plan Contributions 239,389 - 31,879 271,268
Receivable for securities sold 1,924,870 - - 1,924,870
Other receivables 42,418 - - 42,418
Total Receivables 2,503,577 - 31,879 2,535,456
Securities Lending Cash Collateral - Invested 43,613,878 - - 43,613,878
Investments at fair value:
U.S. Government and Agency 17,507,028 - - 17,507,028
Domestic Fixed Income 2,593,987 - - 2,593,987
Global fixed Income 8,393,093 - - 8,393,093
Corporate Bonds 15,530,070 - - 15,530,070
Common Stocks 119,201,765 217,105 - 119,418,870
International Equity 51,483,515 - - 51,483,515
Real Estate Investment Trust (REIT) 51,046,126 - - 51,046,126
Alternative Investments 67,139,780 - - 67,139,780
Guaranteed Investment Contract - - 9,564,092 9,564,092
Mutual Funds - 4,064,209 5,695,837 9,760,046
Total Investments 332,895,364 4,281,314 15,259,929 352,436,607
Total Assets 387,086,539 5,340,876 16,285,611 408,713,026
LIABILITIES
Accounts Payable 333,644 - - 333,644
Payable for Securities Purchased 949,467 - - 949,467
Due to Coral Gables Retirement Fund - 187,118 52,271 239,389
Obligations under Securities Lending 43,613,878 - - 43,613,878
Total Liabilities 44,896,989 187,118 52,271 45,136,378
NET POSITION
Net Position Restricted for Pension Benefits 342,189,550$ 5,153,758$ 16,233,340$ 363,576,648$
CITY OF CORAL GABLES, FLORIDA
COMBINING STATEMENT OF FIDUCIARY NET POSITION
PENSION TRUST FUNDS
September 30, 2016
112

CITY OF CORAL GABLES, FLORIDA - COMPREHENSIVE ANNUAL FINANCIAL REPORT - FISCAL YEAR ENDED SEPTEMBER 30, 2016
Coral Police
Gables Officers' Firefighters' Total
Retirement Pension Pension Pension Trust
Fund Fund Fund Funds
Additions:
City Contributions 27,778,394$ 561,552$ 905,990$ 29,245,936$
Share Plan Contributions 145,830 - - 145,830
Total Government Contributions 27,924,224 561,552 905,990 29,391,766
Employees:
Employee contributions 4,393,660 - - 4,393,660
Total Employee Contributions 4,393,660 - - 4,393,660
Total Contributions 32,317,884 561,552 905,990 33,785,426
Investment Income:
Net Appreciation in the Fair Value
of Investments 22,957,513 301,585 587,926 23,847,024
Interest and Dividends 5,526,528 107,972 301,436 5,935,936
Other Income 39,156 1,880 - 41,036
Total Investment Income 28,523,197 411,437 889,362 29,823,996
Less Investment Expenses (1,946,786) (24,070) (28,606) (1,999,462)
Total Investment Income before
Securities Lending Activity 26,576,411 387,367 860,756 27,824,534
Securities Lending Activities:
Security Lending Income 187,054 - - 187,054
Security Lending Fees and Rebates (56,055) - - (56,055)
Net Income from Security Lending Activities 130,999 - - 130,999
Total Net Investment Income 26,707,410 387,367 860,756 27,955,533
Total Additions 59,025,294 948,919 1,766,746 61,740,959
Deductions:
Pension Benefits Paid 45,697,331 633,630 2,356,398 48,687,359
Refunds of Contributions 691,627 - - 691,627
Administrative Expense 352,193 37,250 63,049 452,492
Total Deductions 46,741,151 670,880 2,419,447 49,831,478
Net Increase (Decrease) in Net Position 12,284,143 278,039 (652,701) 11,909,481
Net Position Restricted for Pension Benefits:
Beginning of Year 329,905,407 4,875,719 16,886,041 351,667,167
End of Year 342,189,550$ 5,153,758$ 16,233,340$ 363,576,648$
CITY OF CORAL GABLES, FLORIDA
COMBINING STATEMENT OF CHANGES IN FIDUCIARY NET POSITION
PENSION TRUST FUNDS
For the Fiscal Year Ended September 30, 2016
113

CITY OF CORAL GABLES, FLORIDA - COMPREHENSIVE ANNUAL FINANCIAL REPORT - FISCAL YEAR ENDED SEPTEMBER 30, 2016
Employee Law Total
Benefits Enforcement Agency
Fund Fund Funds
ASSETS
Cash and Cash Equivalents
Beginning 634,060$ 2,339,823$ 2,973,883$
Additions 63,027 2,565,103 2,628,130
Deductions (134,687) (2,937,279) (3,071,966)
Total Assets 562,400 1,967,647 2,530,047
LIABILITIES
Deferred Compensation Payable
Beginning 628,435 - 628,435
Additions 63,027 - 63,027
Deductions (134,687) - (134,687)
Ending 556,775 - 556,775
Due to Other Governments
Beginning 5,625 2,339,823 2,345,448
Additions - 2,565,103 2,565,103
Deductions - (2,937,279) (2,937,279)
Ending 5,625 1,967,647 1,973,272
Total Liabilities 562,400$ 1,967,647$ 2,530,047$
CITY OF CORAL GABLES, FLORIDACOMBINING STATEMENT OF CHANGES IN ASSETS AND LIABILITIES
AGENCY FUNDS
For the Fiscal Year Ended September 30, 2016
114

Statistical Section
(UNAUDITED)
This part of the City of Coral Gables’ comprehensive annual financial report
presents detailed information as a context for understanding what the
information in the financial statements, note disclosures, and required
supplementary information says about the city’s overall financial health.
Financial Trends
These schedules contain trend information to help the reader
understand how the city’s financial performance and well-being have
changed over time.
Revenue Capacity
These schedules contain information to help the reader assess the city’s
most significant local revenue source, the property tax.
Debt Capacity
These schedules present information to help the reader assess the
affordability of the city’s current levels of outstanding debt and the
city’s ability to issue additional debt in the future.
Demographic and Economic Information
These schedules offer demographic and economic indicators to help the
reader understand the environment within which the city’s financial
activities take place.
Operating Information These schedules contain service and infrastructure data to help the
reader understand how the information in the city’s financial report
relates to the services the city provides and the activities it performs.
Sources: Unless otherwise noted, the information in these schedules is derived
from the comprehensive annual financial reports for the relevant year.
115

CITY OF CORAL GABLES, FLORIDA - COMPREHENSIVE ANNUAL FINANCIAL REPORT - FISCAL YEAR ENDED SEPTEMBER 30, 2016
2007 2008 2009 2010 2011 2012 2013 2014 2015 2016
Governmental Activities
Net Investment in Capital Assets 139,512,991$ 140,912,940$ 142,963,136$ 141,074,353$ 139,786,744$ 134,659,013$ 130,953,750$ 127,802,756$ 133,586,545$ 135,571,942$
Restricted - - 1,001,238 1,453,694 8,307,036 10,654,748 11,895,868 21,333,586 21,749,068 23,792,213
Unrestricted 3,328,883 - (624,816) 13,801,226 42,070,763 61,902,841 72,103,048 89,657,013 (80,038,802) (69,998,813)
Total Governmental Activities Net Position 142,841,874$ 140,912,940$ 143,339,558$ 156,329,273$ 190,164,543$ 207,216,602$ 214,952,666$ 238,793,355$ 75,296,811$ 89,365,342$
Business-type Activities
Net Investment in Capital Assets 18,930,925$ 19,399,108$ 21,533,924$ 23,080,309$ 25,118,022$ 26,049,636$ 26,449,997$ 26,722,793$ 24,929,687$ 29,433,426$
Restricted - - - - - - - 215,627 299,527 354,664
Unrestricted 10,143,471 10,320,047 7,546,098 8,921,750 9,734,742 12,573,556 13,274,236 15,563,233 16,377,673 11,380,442
Total Business-type Activities Net Position 29,074,396$ 29,719,155$ 29,080,022$ 32,002,059$ 34,852,764$ 38,623,192$ 39,724,233$ 42,501,653$ 41,606,887$ 41,168,532$
Primary Government
Net Investment in Capital Assets 158,443,916$ 160,312,048$ 164,497,060$ 164,154,662$ 164,904,766$ 160,708,649$ 157,403,747$ 154,525,549$ 156,939,127$ 165,005,368$
Restricted - - 1,001,238 1,453,694 8,307,036 10,654,748 11,895,868 21,549,213 22,157,012 24,146,877
Unrestricted 13,472,354 10,320,047 6,921,282 22,722,976 51,805,505 74,476,397 85,377,284 105,220,246 (62,192,441) (58,618,371)
Total Primary Government Net Position 171,916,270$ 170,632,095$ 172,419,580$ 188,331,332$ 225,017,307$ 245,839,794$ 254,676,899$ 281,295,008$ 116,903,698$ 130,533,874$
Note: Historical data for ten years will be displayed as it becomes available.
TABLE 1
CITY OF CORAL GABLES
NET POSITION BY COMPONENT
(accrual basis of accounting)
116

CITY OF CORAL GABLES, FLORIDA - COMPREHENSIVE ANNUAL FINANCIAL REPORT - FISCAL YEAR ENDED SEPTEMBER 30, 2016
2007 2008 2009 2010 2011 2012 2013 2014 2015 2016
Expenses
Governmental Activities:
General Government 21,697,557$ 22,880,968$ 23,349,213$ 22,476,553$ 17,942,595$ 16,972,816$ 19,363,404$ 23,034,595$ 22,362,962$ 24,813,095$
Public Safety 69,844,742 70,019,943 68,528,429 67,626,456 71,096,529 71,388,299 70,947,494 71,806,825 69,415,601 74,351,854
Physical Environment 20,842,416 19,427,236 19,427,373 13,668,200 12,747,191 16,926,907 16,443,793 17,166,760 16,343,967 18,909,774
Transportation 6,348,931 6,068,973 6,284,102 10,426,083 10,103,982 5,585,520 7,312,561 4,578,226 6,558,044 6,328,566
Economic Environment 732,910 691,803 587,993 653,894 547,916 725,712 741,153 849,137 770,611 911,210
Culture and Recreation 10,290,416 10,226,932 8,959,144 8,473,939 9,220,799 9,899,154 10,401,674 9,924,342 10,035,755 12,878,923
Interest on Long-term Debt 1,741,825 1,936,947 1,391,416 1,186,837 1,364,343 2,107,713 1,641,277 1,487,807 1,388,635 1,312,000
Total Governmental Activities 131,498,797 131,252,802 128,527,670 124,511,962 123,023,355 123,606,121 126,851,356 128,847,692 126,875,575 139,505,422
Business-type Activities:
Sanitary Sewer System 4,209,514 4,230,483 3,854,930 4,303,930 4,304,721 5,004,038 6,073,033 5,889,856 6,680,895 9,242,508
Parking System 4,286,312 4,254,921 4,112,309 3,676,444 4,027,320 3,941,559 3,838,427 5,009,894 5,170,070 7,117,985
Stormwater Utility 1,276,688 1,325,574 1,476,060 1,469,640 3,775,173 2,758,505 1,443,704 2,320,104 2,024,485 2,165,850
Total Business-type Activities 9,772,514 9,810,978 9,443,299 9,450,014 12,107,214 11,704,102 11,355,164 13,219,854 13,875,450 18,526,343
Total Expenses 141,271,311$ 141,063,780$ 137,970,969$ 133,961,976$ 135,130,569$ 135,310,223$ 138,206,520$ 142,067,546$ 140,751,025$ 158,031,765$
Program Revenues
Governmental Activities:
Charges for Services:
General Government 15,699,777$ 15,224,883$ 14,161,870$ 13,914,951$ 34,643,739$ 18,229,888$ 17,559,499$ 20,984,076$ 23,300,256$ 24,430,334$
Public Safety 2,926,106 2,298,024 2,723,731 5,847,438 6,732,024 6,013,738 5,394,421 6,400,967 6,582,738 6,211,081
Physical Environment 6,783,403 7,036,996 7,653,827 8,821,783 9,487,606 9,330,652 9,428,396 9,625,413 8,158,310 8,472,957 Transportation - - - - - - - - 18,906 -
Economic Environment - - - - 1,962,748 2,600,000 200,000 1,700,000 680,000 670,000
Culture and Recreation 3,747,163 3,576,441 3,631,334 3,338,009 1,038,967 3,688,909 4,357,075 4,291,802 5,070,153 5,362,407
Operating Grants and Contributions 2,478,666 238,033 108,762 94,832 359,559 415,718 192,080 487,387 87,157 184,308
Capital Grants and Contributions 2,156,192 1,281,665 3,308,654 4,789,203 4,253,176 2,831,825 1,054,644 9,462,285 1,345,958 937,955
Total Governmental Activities 33,791,307 29,656,042 31,588,178 36,806,216 58,477,819 43,110,730 38,186,115 52,951,930 45,243,478 46,269,042
Business-type Activities:
Charges for Services:
Sanitary Sewer System 7,455,717 6,793,767 6,541,910 7,109,919 7,201,475 7,605,600 7,725,590 8,739,881 9,375,348 9,429,516
Parking System 9,187,646 9,088,332 8,311,688 9,227,722 10,154,202 10,330,540 10,830,461 11,625,585 13,025,045 12,982,960
Stormwater Utility 1,496,153 1,546,412 1,857,694 2,340,830 2,417,095 2,524,565 2,399,023 2,930,270 3,198,371 3,212,526
Operating Grants and Contributions - - - - 1,606,542 - - - - -
Capital Grants and Contributions 554,196 - 392,233 238,597 324,445 920,448 37,222 - 463,764 429,977
Total Business-type Activity 18,693,712 17,428,511 17,103,525 18,917,068 21,703,759 21,381,153 20,992,296 23,295,736 26,062,528 26,054,979
Total Program Revenue 52,485,019$ 47,084,553$ 48,691,703$ 55,723,284$ 80,181,578$ 64,491,883$ 59,178,411$ 76,247,666$ 71,306,006$ 72,324,021$
Net(Expense) Revenue
Governmental Activities (97,707,490)$ (101,596,760)$ (96,939,492)$ (87,705,746)$ (64,545,536)$ (80,495,391)$ (88,665,241)$ (75,895,762)$ (81,632,097)$ (93,236,380)$
Business-type Activiites 8,921,198 7,617,533 7,660,226 9,467,054 9,596,545 9,677,051 9,637,132 10,075,882 12,187,078 7,528,636
Total Net Expense (88,786,292)$ (93,979,227)$ (89,279,266)$ (78,238,692)$ (54,948,991)$ (70,818,340)$ (79,028,109)$ (65,819,880)$ (69,445,019)$ (85,707,744)$
Governmental Activities:
Taxes
Property Taxes 69,730,264$ 66,388,634$ 66,397,191$ 70,277,262$ 67,078,084$ 66,377,589$ 62,358,935$ 65,257,324$ 68,107,835$ 71,447,141$
Franchise Fees 7,283,548 7,161,421 7,049,737 6,276,301 6,335,532 6,763,530 6,392,689 6,850,950 6,908,438 6,859,844
Utility Service Taxes 10,186,819 10,422,786 11,293,277 11,219,861 10,953,661 10,897,549 11,316,446 11,861,648 11,986,127 11,423,512
Other Taxes 2,645,290 2,569,027 2,378,268 2,399,014 2,552,642 2,702,518 2,784,018 2,908,745 3,077,874 3,103,387
Intergovermental 4,252,076 4,053,651 3,684,951 3,641,236 3,990,300 4,254,993 4,461,004 4,735,934 5,034,109 5,189,453
Investment Earnings 2,107,709 1,390,848 158,351 75,221 58,769 114,070 5,968 464,999 706,665 804,623
Bad Debt Expense (4,229,491) - - - - - - - - -
Gain on Sale of Capital Assets - - - - - - - - 3,648,411 -
Miscellaneous 310,400 453,448 667,778 239,410 603,945 482,745 494,871 284,566 254,373 390,552
Transfers in/out 4,585,899 7,227,011 8,343,575 6,567,156 6,807,873 5,954,456 8,587,374 7,372,285 7,229,879 8,086,399
Total General Revenues, Transfers and
Special Items 96,872,514 99,666,826 99,973,128 100,695,461 98,380,806 97,547,450 96,401,305 99,736,451 106,953,711 107,304,911
Business-type Activities:
Investment Earnings 80,468 232,392 23,493 9,129 9,266 16,670 20,595 73,698 94,112 119,408
Miscellaneous 168,353 21,845 20,723 13,010 52,767 31,163 30,688 125 - -
Transfers in/out (4,585,899) (7,227,011) (8,343,575) (6,567,156) (6,807,873) (5,954,456) (8,587,374) (7,372,285) (7,229,879) (8,086,399)
Total Business-type Activities (4,337,078) (6,972,774) (8,299,359) (6,545,017) (6,745,840) (5,906,623) (8,536,091) (7,298,462) (7,135,767) (7,966,991)
Total Primary Government 92,535,436$ 92,694,052$ 91,673,769$ 94,150,444$ 91,634,966$ 91,640,827$ 87,865,214$ 92,437,989$ 99,817,944$ 99,337,920$
Change in Net Position
Governmental Activities (834,976)$ (1,929,934)$ 3,033,636$ 12,989,715$ 33,825,270$ 17,052,059$ 7,736,064$ 23,840,689$ 25,321,614$ 14,068,531$
Business-type Activities 4,584,120 644,759 (639,133) 2,922,037 2,850,705 3,770,428 1,101,041 2,777,420 5,051,311 (438,355)
Total Change in Net Position 3,749,144$ (1,285,175)$ 2,394,503$ 15,911,752$ 36,675,975$ 20,822,487$ 8,837,105$ 26,618,109$ 30,372,925$ 13,630,176$
TABLE 2
General Revenues
(accrual basis of accounting)
LAST TEN YEARS
CHANGES IN NET POSITION
CITY OF CORAL GABLES
117
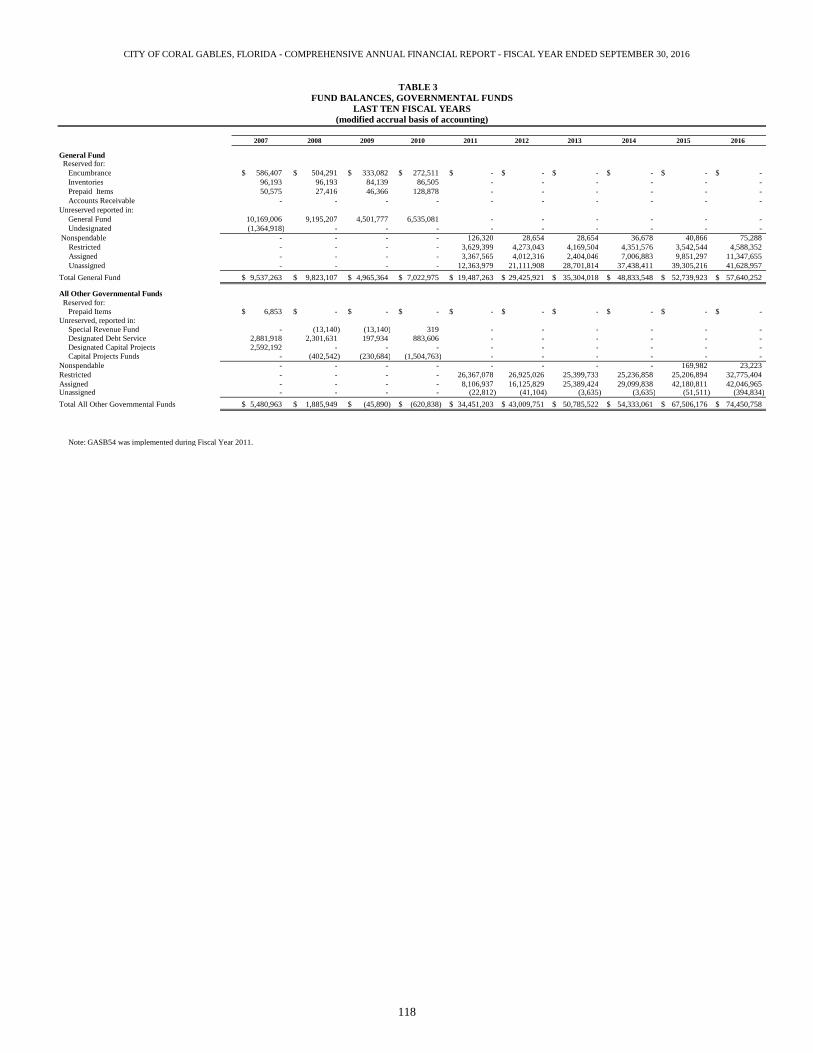
CITY OF CORAL GABLES, FLORIDA - COMPREHENSIVE ANNUAL FINANCIAL REPORT - FISCAL YEAR ENDED SEPTEMBER 30, 2016
2007 2008 2009 2010 2011 2012 2013 2014 2015 2016
Reserved for:
Encumbrance 586,407$ 504,291$ 333,082$ 272,511$ -$ -$ -$ -$ -$ -$
Inventories 96,193 96,193 84,139 86,505 - - - - - -
Prepaid Items 50,575 27,416 46,366 128,878 - - - - - -
Accounts Receivable - - - - - - - - - -
Unreserved reported in:
General Fund 10,169,006 9,195,207 4,501,777 6,535,081 - - - - - -
Undesignated (1,364,918) - - - - - - - - -
Nonspendable - - - - 126,320 28,654 28,654 36,678 40,866 75,288
Restricted - - - - 3,629,399 4,273,043 4,169,504 4,351,576 3,542,544 4,588,352
Assigned - - - - 3,367,565 4,012,316 2,404,046 7,006,883 9,851,297 11,347,655
Unassigned - - - - 12,363,979 21,111,908 28,701,814 37,438,411 39,305,216 41,628,957
Total General Fund 9,537,263$ 9,823,107$ 4,965,364$ 7,022,975$ 19,487,263$ 29,425,921$ 35,304,018$ 48,833,548$ 52,739,923$ 57,640,252$
Reserved for:
Prepaid Items 6,853$ -$ -$ -$ -$ -$ -$ -$ -$ -$
Unreserved, reported in:
Special Revenue Fund - (13,140) (13,140) 319 - - - - - -
Designated Debt Service 2,881,918 2,301,631 197,934 883,606 - - - - - -
Designated Capital Projects 2,592,192 - - - - - - - - -
Capital Projects Funds - (402,542) (230,684) (1,504,763) - - - - - -
Nonspendable - - - - - - - - 169,982 23,223
Restricted - - - - 26,367,078 26,925,026 25,399,733 25,236,858 25,206,894 32,775,404
Assigned - - - - 8,106,937 16,125,829 25,389,424 29,099,838 42,180,811 42,046,965 Unassigned - - - - (22,812) (41,104) (3,635) (3,635) (51,511) (394,834)
Total All Other Governmental Funds 5,480,963$ 1,885,949$ (45,890)$ (620,838)$ 34,451,203$ 43,009,751$ 50,785,522$ 54,333,061$ 67,506,176$ 74,450,758$
Note: GASB54 was implemented during Fiscal Year 2011.
(modified accrual basis of accounting)
All Other Governmental Funds
General Fund
TABLE 3
FUND BALANCES, GOVERNMENTAL FUNDS
LAST TEN FISCAL YEARS
118

CITY OF CORAL GABLES, FLORIDA - COMPREHENSIVE ANNUAL FINANCIAL REPORT - FISCAL YEAR ENDED SEPTEMBER 30, 2016
2007 2008 2009 2010 2011 2012 2013 2014 2015 2016
REVENUES
Taxes 89,845,921$ 86,541,868$ 87,118,473$ 90,172,438$ 86,919,919$ 86,741,186$ 82,852,088$ 86,878,667$ 90,080,274$ 92,671,539$
Licenses 2,887,848 2,921,161 3,038,646 3,086,382 3,052,875 3,148,148 3,250,589 3,318,725 3,255,125 3,496,840
Permits 7,056,610 5,687,950 4,007,602 4,193,899 8,568,709 7,935,003 7,696,589 8,160,391 8,783,434 9,007,729
Fines and Forfeitures 2,719,620 2,593,690 2,888,947 3,473,120 3,996,367 3,641,890 2,891,719 2,587,073 2,494,796 2,552,563
Intergovernmental 11,123,623 6,315,384 7,390,708 6,875,288 5,000,978 6,884,559 6,144,249 5,959,327 6,091,507 5,832,010
Charges for Services 8,834,802 8,478,227 8,770,139 12,534,515 15,680,153 15,447,479 15,638,624 19,214,525 20,169,601 19,393,779
Recreation Actviity Fees 3,747,159 3,576,441 3,631,334 3,338,009 3,816,728 3,534,934 3,979,867 4,211,548 4,377,394 4,575,172
Rental Income 3,682,386 3,610,721 3,126,219 2,526,671 7,355,922 3,638,760 4,269,160 4,724,871 4,886,803 5,862,857
Investment Earnings 2,107,709 1,390,848 158,351 75,221 58,769 114,070 5,968 464,999 706,665 804,623
Bad Debt (4,229,491) - - - - - - - - -
Special Assessments 52,521 364,965 711,258 499,649 2,222,203 476,556 980,246 191,037 2,817,930 1,665,556
Contributions and Donations - - - - 1,140,000 735,131 466,060 185,045 58,292 70,500
Miscellaneous 308,261 453,448 667,778 239,410 603,945 482,745 494,871 284,566 254,373 390,552
Total Revenues 128,136,969 121,934,703 121,509,455 127,014,602 138,416,568 132,780,461 128,670,030 136,180,774 143,976,194 146,323,720
EXPENDITURESCurrent:
General Government 18,077,121 18,247,668 20,512,518 18,000,356 14,134,472 13,930,147 16,000,917 17,853,021 19,608,296 21,719,236
Public Safety 67,908,526 70,467,344 71,460,365 69,089,890 70,798,025 72,542,153 72,738,499 70,604,331 72,413,164 75,551,003
Physical Environment 19,021,263 19,509,302 20,063,855 13,890,885 12,315,830 16,810,152 16,548,289 16,542,033 17,096,014 18,974,253
Transportation 5,524,148 6,178,011 6,660,672 10,980,073 10,158,367 5,792,162 7,601,909 4,544,357 6,938,914 6,540,889
Economic Environment 721,991 704,232 607,676 681,765 558,174 753,151 773,882 851,438 821,259 947,119
Culture and Recreation 10,125,697 9,613,602 8,919,266 8,322,862 8,497,254 9,306,731 9,729,332 8,848,478 9,554,012 12,220,223
Debt Service:
Retirement of Principal 2,357,400 2,617,586 2,717,833 2,851,673 2,984,724 43,762,940 3,368,388 3,217,640 3,352,135 3,781,442
Interest and Other Charges 1,741,825 1,935,947 1,391,416 1,186,837 1,364,343 2,107,713 1,641,277 1,487,807 1,516,080 1,803,435
Bond Issuance Cost - - - - - 61,456 88,020 - - -
Capital outlay 10,267,919 3,197,192 8,047,190 7,797,684 2,922,479 1,285,402 1,551,289 2,810,907 14,984,777 24,633,460
Total Expenditures 135,745,890 132,470,884 140,380,791 132,802,025 123,733,668 166,352,007 130,041,802 126,760,012 146,284,651 166,171,060
Excess (deficiency) of
Revenues Over Expenditures (7,608,921) (10,536,181) (18,871,336) (5,787,423) 14,682,900 (33,571,546) (1,371,772) 9,420,762 (2,308,457) (19,847,340)
OTHER FINANCING SOURCES (USES)Special Revenue Bond Issued - - - - - - - - 6,500,000 22,005,000 Premium on Special Revenue Bonds Issued - - - - - - - - - 1,788,626
Sale of Capital Assets - - - - - - - - 3,900,000 - Proceeds from Capital Leases - - - - - - - 284,022 - -
Refunding Bond Issued 8,547,013 - 3,525,000 702,930 47,100,483 43,096,290 12,075,700 - - -
Payment to Bond Escrow Agent - - - - - - (11,996,561) - - -
Principal Repymt.-Current Bond Refunding - - - - (24,512,273) - - - - -
Transfers In 12,498,880 11,026,884 14,972,721 13,018,055 45,548,224 15,624,666 24,716,096 15,989,837 33,321,551 24,565,217 Transfers Out (12,149,817) (3,799,873) (6,415,967) (6,450,899) (35,283,005) (6,652,204) (9,769,595) (8,617,552) (24,333,604) (16,666,592)
Total Other Financing Sources (Uses) 8,896,076 7,227,011 12,081,754 7,270,086 32,853,429 52,068,752 15,025,640 7,656,307 19,387,947 31,692,251
Net Change In Fund Balances 1,287,155$ (3,309,170)$ (6,789,582)$ 1,482,663$ 47,536,329$ 18,497,206$ 13,653,868$ 17,077,069$ 17,079,490$ 11,844,911$
Debt service as a precentage of noncapital
expenditures 3.52% 3.11% 3.23% 3.60% 27.79% 3.90% 3.80% 3.71% 3.95%
TABLE 4
CHANGES IN FUND BALANCES, GOVERNMENTAL FUNDS
LAST TEN FISCAL YEARS
(modified accrual basis of accounting)
119

CITY OF CORAL GABLES, FLORIDA - COMPREHENSIVE ANNUAL FINANCIAL REPORT - FISCAL YEAR ENDED SEPTEMBER 30, 2016
FISCAL TOTAL COLLECTIONS
YEAR TAX PERCENTAGE IN SUBSEQUENT PERCENTAGE
ENDED LEVY AMOUNT OF LEVY YEARS AMOUNT OF LEVY
2007 73,452,215 69,634,307 94.80% 95,957 69,730,264 94.93%
2008 72,556,824 65,791,821 90.68% 596,813 66,388,634 91.50%
2009 68,055,518 65,609,457 96.41% 787,734 66,397,191 97.56%
2010 72,300,304 69,328,037 95.89% 949,225 70,277,262 97.20%
2011 68,735,926 65,131,368 94.76% 1,946,716 67,078,084 97.59%
2012 66,647,377 64,648,342 97.00% 1,729,247 66,377,589 99.60%
2013 65,676,937 61,713,029 93.96% 645,906 62,358,935 94.95%
2014 66,561,720 65,257,324 98.04% - 65,257,324 98.04%
2015 69,863,911 68,107,835 97.49% - 68,107,835 97.49%
2016 74,646,549 71,447,141 95.71% - 71,447,141 95.71%
FISCAL TOTAL TOTAL
YEAR REAL PERSONAL ASSESSED DIRECTENDED PROPERTY PROPERTY VALUE * TAX RATE
2007 11,383,139,491 348,009,820 11,731,149,311 6.150
2008 12,743,051,207 337,759,609 13,080,810,816 5.250
2009 11,875,112,539 312,425,424 12,187,537,963 5.250
2010 11,069,459,141 297,254,234 11,366,713,375 5.895
2011 11,150,104,798 273,567,777 11,423,672,575 6.072
2012 11,582,581,921 288,250,994 11,870,832,915 5.869
2013 11,752,319,227 273,243,675 12,025,562,902 5.669
2014 11,996,154,496 284,616,094 12,280,770,590 5.629
2015 12,563,996,934 291,419,796 12,855,416,730 5.589
2016 13,395,162,364 297,441,249 13,692,603,613 5.559
(1) Source:
(*) Source:
CITY TAX RATES COUNTY SCHOOL STATE
FISCAL DEBT TOTAL
YEAR OPERATING SERVICE CITY
ENDED MILLAGE MILLAGE MILLAGE MILLAGE MILLAGE MILLAGE TOTAL
2007 6.150 0.000 6.150 6.808 8.105 0.7350 21.7980
2008 5.250 0.000 5.250 5.670 7.948 0.6590 19.5270
2009 5.250 0.000 5.250 5.926 7.797 0.6590 19.6320
2010 5.895 0.000 5.895 6.005 7.995 0.6590 20.5540
2011 6.072 0.000 6.072 6.656 8.249 0.6585 21.6360
2012 5.869 0.000 5.869 5.769 8.005 0.4708 20.1140
2013 5.669 0.000 5.669 5.161 7.998 0.4634 19.2914
2014 5.629 0.000 5.629 5.798 7.977 0.4455 19.8495
2015 5.589 0.000 5.589 5.900 7.974 0.4187 19.8826
2016 5.559 0.000 5.559 5.900 7.612 0.3896 19.4615
TABLE 7
CITY OF CORAL GABLES, FLORIDA
PROPERTY TAX RATES
DIRECT AND OVERLAPPING GOVERNMENTS
LAST TEN FISCAL YEARS
TABLE 5
CITY OF CORAL GABLES, FLORIDA
PROPERTY TAX LEVIES AND TAX COLLECTIONS
LAST TEN FISCAL YEARS
COLLECTED WITHIN THE TOTAL COLLECTIONS
Florida law limits the city, school and county each to a maximum of $10 per $1,000 taxable value for operations. Millage tax rates
are per $1,000 taxable value.
Final tax roll values from the Department of Property Appraisal, except for 2012-2016 which are based on
Certification of Taxable Value Form DR-420 for respective years.
ASSESSED VALUE (1)
FISCAL YEAR OF THE LEVY TO DATE
TABLE 6
CITY OF CORAL GABLES, FLORIDA
ASSESSED VALUES OF TAXABLE PROPERTY
LAST TEN FISCAL YEARS
Miami Dade County Property Appraiser - according to Florida law, taxable property is assessed at 100% of
estimated actual value and further reduced by various statutory exemptions.
120
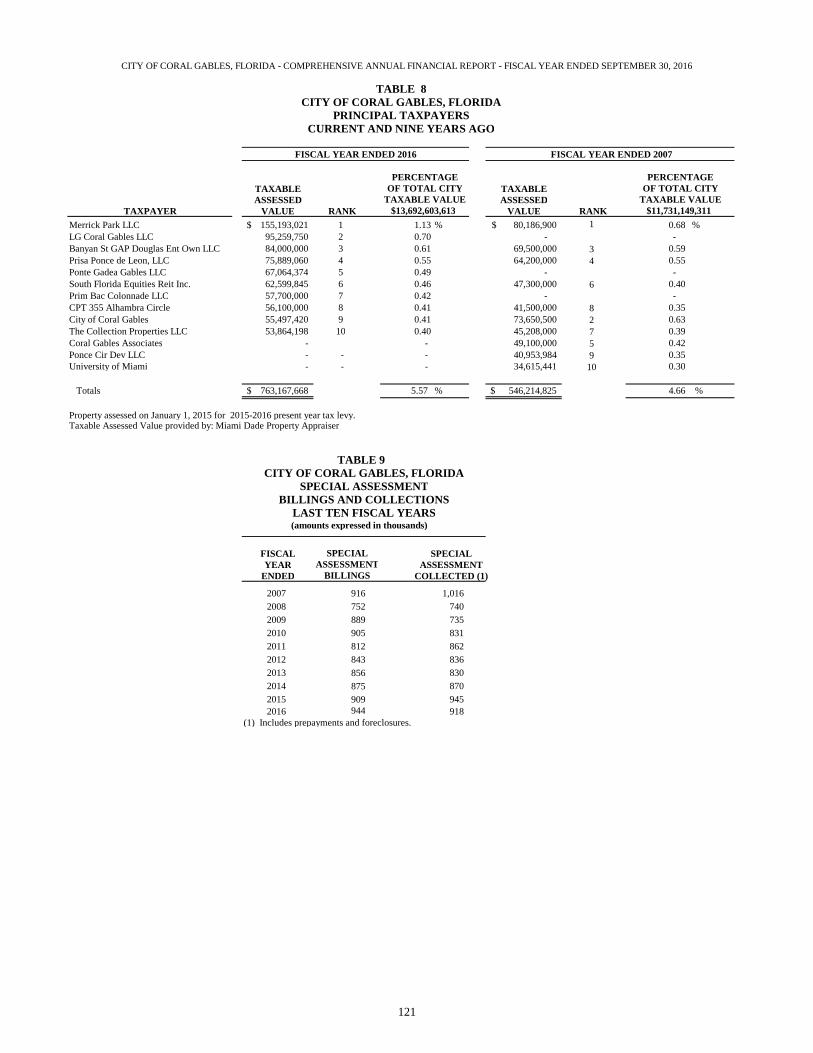
CITY OF CORAL GABLES, FLORIDA - COMPREHENSIVE ANNUAL FINANCIAL REPORT - FISCAL YEAR ENDED SEPTEMBER 30, 2016
TAXABLE TAXABLE
ASSESSED ASSESSED
TAXPAYER VALUE RANK VALUE RANK
Merrick Park LLC 155,193,021$ 1 1.13 % 80,186,900$ 1 0.68 %
LG Coral Gables LLC 95,259,750 2 0.70 - -
Banyan St GAP Douglas Ent Own LLC 84,000,000 3 0.61 69,500,000 3 0.59
Prisa Ponce de Leon, LLC 75,889,060 4 0.55 64,200,000 4 0.55
Ponte Gadea Gables LLC 67,064,374 5 0.49 - -
South Florida Equities Reit Inc. 62,599,845 6 0.46 47,300,000 6 0.40
Prim Bac Colonnade LLC 57,700,000 7 0.42 - -
CPT 355 Alhambra Circle 56,100,000 8 0.41 41,500,000 8 0.35
City of Coral Gables 55,497,420 9 0.41 73,650,500 2 0.63
The Collection Properties LLC 53,864,198 10 0.40 45,208,000 7 0.39
Coral Gables Associates - - 49,100,000 5 0.42
Ponce Cir Dev LLC - - - 40,953,984 9 0.35
University of Miami - - - 34,615,441 10 0.30
Totals 763,167,668$ 5.57 % 546,214,825$ 4.66 %
Property assessed on January 1, 2015 for 2015-2016 present year tax levy.Taxable Assessed Value provided by: Miami Dade Property Appraiser
FISCAL SPECIAL
YEAR ASSESSMENT
ENDED COLLECTED (1)
2007 916 1,016
2008 752 740
2009 889 735
2010 905 831
2011 812 862
2012 843 836
2013 856 830
2014 875 870
2015 909 945
2016 944 918
(1) Includes prepayments and foreclosures.
TAXABLE VALUE
TABLE 8
CITY OF CORAL GABLES, FLORIDA
PRINCIPAL TAXPAYERS
CURRENT AND NINE YEARS AGO
FISCAL YEAR ENDED 2016 FISCAL YEAR ENDED 2007
$11,731,149,311
TABLE 9
CITY OF CORAL GABLES, FLORIDA
SPECIAL ASSESSMENT
BILLINGS AND COLLECTIONS
PERCENTAGE PERCENTAGE
OF TOTAL CITY OF TOTAL CITY
TAXABLE VALUE
LAST TEN FISCAL YEARS(amounts expressed in thousands)
SPECIAL
ASSESSMENT
BILLINGS
$13,692,603,613
121

CITY OF CORAL GABLES, FLORIDA - COMPREHENSIVE ANNUAL FINANCIAL REPORT - FISCAL YEAR ENDED SEPTEMBER 30, 2016
PARKING
FISCAL SPECIAL SPECIAL TOTAL PERCENTAGE
YEAR OBLIGATION CAPITAL OBLIGATION CAPITAL PRIMARY OF PERSONAL PER
ENDED BONDS LEASES BONDS LEASES GOVERNMENT INCOME * CAPITA *
2007 47,729,174 360,117 17,775,000 - 65,864,291 2886% 1,531.73
2008 45,289,405 182,300 16,859,500 - 62,331,205 2523% 1,361.00
2009 46,278,872 - 18,548,600 - 64,827,472 2592% 1,424.75
2010 43,638,768 1,162,886 17,561,900 - 62,363,554 2562% 1,370.60
2011 62,978,533 1,547,084 16,321,467 648,011 81,495,095 3257% 1,742.09
2012 62,544,790 1,672,710 15,795,210 532,128 80,544,838 3481% 1,699.22
2013 59,798,120 2,151,541 15,386,880 396,009 77,732,550 2907% 1,573.18
2014 56,761,060 3,166,037 18,513,940 389,659 78,830,696 2837% 1,588.34
2015 60,054,735 254,690 17,785,265 214,599 78,309,289 2695% 1,528.67 2016 78,435,243 97,740 16,704,757 72,315 95,310,055 3260% 1,864.55
* See Table 13 for personal income and population data.
FISCAL TOTAL TOTAL
YEAR DEBT GENERAL
ENDED PRINCIPAL INTEREST SERVICE EXPENDITURES
2007 - - - 120,323 0%
2008 - - - 121,203 0%
2009 - - - 125,255 0%
2010 - - - 119,758 0%
2011 - - - 113,984 0%
2012 - - - 115,215 0%
2013 - - - 117,134 0%
2014 - - - 117,390 0%
2015 - - - 121,242 0%
2016 - - - 129,219 0%
GOVERNMENTAL ACTIVITIES
RATIO OF ANNUAL DEBT SERVICE FOR
GENERAL BONDED DEBT TO TOTAL GENERAL GOVERNMENT EXPENDITURES
LAST TEN FISCAL YEARS(amounts expressed in thousands)
PERCENTAGE OF
BUSINESS-TYPE ACTIVITIES
EXPENDITURES
TABLE 10
CITY OF CORAL GABLES, FLORIDA
RATIO OF OUTSTANDING DEBT BY TYPE
SEPTEMBER 30, 2016
LAST TEN FISCAL YEARS
TABLE 11
CITY OF CORAL GABLES, FLORIDA
DEBT SERVICE AS
TOTAL GENERAL
122

CITY OF CORAL GABLES, FLORIDA - COMPREHENSIVE ANNUAL FINANCIAL REPORT - FISCAL YEAR ENDED SEPTEMBER 30, 2016
PERCENT OF AMOUNT OF DEBT APPLIED DEBT APPLIED
NET DEBT TO CITY OF TO CITY OFJURISDICTION OUTSTANDING CORAL GABLES (1) CORAL GABLES
City of Coral Gables 78,533$ 100.0% 78,533$
Total direct debt 78,533$
1,566,497$ 5.94% 93,050$
Total overlapping debt 93,050$
Total direct debt and overlapping debt 171,583$
Sources: Data provided by the Miami Dade-County Finance Department
CITY OF CORAL GABLES, FLORIDA
COMPUTATION OF DIRECT AND OVERLAPPING BONDED DEBT
SEPTEMBER 30, 2016(amounts expressed in thousands)
TABLE 12
Miami-Dade County, Florida
TOTAL NET GENERAL OBLIGATION DEBT
The City's General Obligation Bond Debt was paid in full in Fiscal Year 9/30/98.
The City has no legal debt requirement.
Note: Overlapping governments are those that coincide, at least in part, with the
geographic boundaries of the City of Coral Gables. This schedule estimates the
portion of the outstanding debt of those overlapping governments that is borne by
the residents and businesses of the the City of Coral Gables. This process recognizes
that, when considering the City's ability to issue and repay long-term debt, the entire
debt burden borne by the residents and businesses should be taken into account.
However, this does not imply that every taxpayer is a resident, and therefore
responsible for repaying the debt, of each overlapping government.
(1) For debt repaid with property taxes, the percentage of overlapping debt
applicable is estimated using taxable assessed property values. Value that is
within the City's boundaries and dividing it by the Miami-Dade County's taxable
assessed value.
123
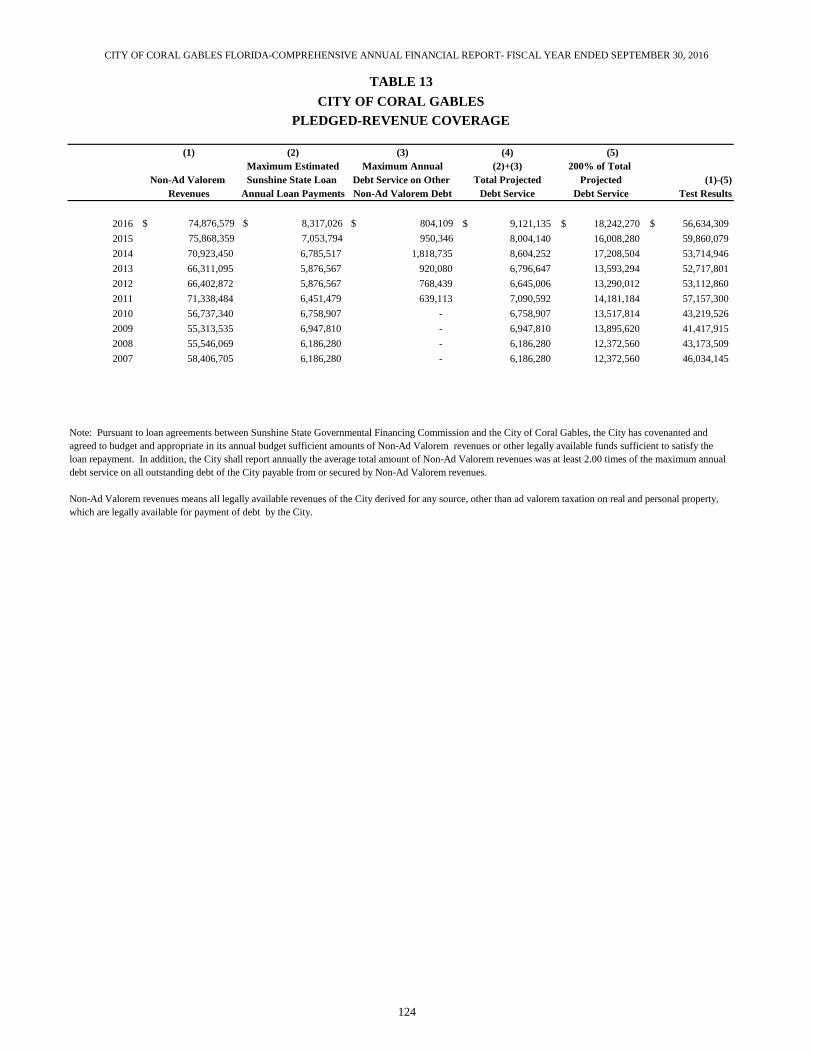
CITY OF CORAL GABLES FLORIDA-COMPREHENSIVE ANNUAL FINANCIAL REPORT- FISCAL YEAR ENDED SEPTEMBER 30, 2016
(1) (2) (3) (4) (5)
Maximum Estimated Maximum Annual (2)+(3) 200% of Total
Non-Ad Valorem Sunshine State Loan Debt Service on Other Total Projected Projected (1)-(5)
Revenues Annual Loan Payments Non-Ad Valorem Debt Debt Service Debt Service Test Results
2016 $ 74,876,579 $ 8,317,026 $ 804,109 9,121,135$ 18,242,270$ 56,634,309$
2015 75,868,359 7,053,794 950,346 8,004,140 16,008,280 59,860,079
2014 70,923,450 6,785,517 1,818,735 8,604,252 17,208,504 53,714,946
2013 66,311,095 5,876,567 920,080 6,796,647 13,593,294 52,717,801
2012 66,402,872 5,876,567 768,439 6,645,006 13,290,012 53,112,860
2011 71,338,484 6,451,479 639,113 7,090,592 14,181,184 57,157,300
2010 56,737,340 6,758,907 - 6,758,907 13,517,814 43,219,526
2009 55,313,535 6,947,810 - 6,947,810 13,895,620 41,417,915
2008 55,546,069 6,186,280 - 6,186,280 12,372,560 43,173,509
2007 58,406,705 6,186,280 - 6,186,280 12,372,560 46,034,145
TABLE 13
CITY OF CORAL GABLES
PLEDGED-REVENUE COVERAGE
Note: Pursuant to loan agreements between Sunshine State Governmental Financing Commission and the City of Coral Gables, the City has covenanted and
agreed to budget and appropriate in its annual budget sufficient amounts of Non-Ad Valorem revenues or other legally available funds sufficient to satisfy the
loan repayment. In addition, the City shall report annually the average total amount of Non-Ad Valorem revenues was at least 2.00 times of the maximum annual
debt service on all outstanding debt of the City payable from or secured by Non-Ad Valorem revenues.
Non-Ad Valorem revenues means all legally available revenues of the City derived for any source, other than ad valorem taxation on real and personal property,
which are legally available for payment of debt by the City.
124

CITY OF CORAL GABLES, FLORIDA - COMPREHENSIVE ANNUAL FINANCIAL REPORT - FISCAL YEAR ENDED SEPTEMBER 30, 2016
(1)
(2) PER (1) (3) (4)
(1) PERSONAL CAPITA MEDIAN SCHOOL UNEMPLOYMENT
POPULATION INCOME INCOME AGE ENROLLMENT RATE
2007 43,000 2,282,053 53,071 39.5 9,354 2.4%
2008 45,798 2,470,802 53,950 40.7 10,071 3.4%
2009 45,501 2,501,372 54,974 41.4 10,257 7.1%
2010 45,501 2,433,848 53,490 41.9 12,917 8.4%
2011 46,780 2,502,262 53.490 38.8 13,469 7.2%
2012 47,401 2,313,690 48,811 39.4 13,644 5.7%
2013 49,411 2,674,025 54,118 41.4 13,514 5.3%
2014 49,631 2,778,790 55,989 40.4 15,385 4.5%
2015 51,227 2,905,647 56,721 40.8 13,705 4.9%
2016 51,117 2,923,637 57,195 41.4 14,198 4.8%
DATA SOURCES
(1) United States Census Bureau estimates by Demographics-www.census.gov
(2) Amounts expressed in thousands
(3) Dade County School District - Public and Private School
(4) United State Department of Labor-Bureau of Labor Statistic-www.bls.gov
FISCAL GENERAL UTILITIES
YEAR PROPERTY FRANCHISE SERVICES OTHER TOTAL
ENDED TAXES (1) TAXES TAXES TAXES TAXES2003 40,078$ 4,634$ 9,658$ -$ 54,370$
2007 69,730 7,284 10,187 2,645 89,846
2008 66,389 7,161 10,423 2,569 86,542
2009 66,397 7,049 11,293 2,378 87,117
2010 70,277 6,276 11,220 2,399 90,172
2011 67,078 6,336 10,954 2,552 86,920
2012 66,378 6,764 10,898 2,703 86,743
2013 62,359 6,393 11,316 2,784 82,852
2014 65,257 6,851 11,862 2,909 86,879
2015 68,108 6,908 11,986 3,078 90,080 2016 71,447 6,860 11,423 3,103 92,833
(1) Net collections of Current and Delinquent Taxes including penalties and discounts.
(amounts expressed in thousands)
TABLE 14 CITY OF CORAL GABLES, FLORIDA
DEMOGRAPHIC AND ECONOMIC STATISTICSLAST TEN FISCAL YEARS
TABLE 14A
YEAR
FISCAL
ENDED
CITY OF CORAL GABLES, FLORIDAGENERAL GOVERNMENT TAX REVENUE BY SOURCE
LAST TEN FISCAL YEARS
125

CITY OF CORAL GABLES, FLORIDA -COMPREHENSIVE ANNUAL FINANCIAL REPORT - FISCAL YEAR ENDED SEPTEMBER 30, 2016
Percentage Percentage
of Total of Total
Employers Employees Employment Employees Employment
University of Miami 15,091 * 38.33% 10,857 64.94%
Baptist Health South Florida/Corporate Office 15,000 38.10% - 0.00%
Bayview Asset Management 2,000 5.08% 1,400 8.37%
Doctors Hospital -Baptist Hospital South Florida 1,000 2.54% 825 4.93%
City of Coral Gables 829 2.11% 869 5.20%
Coral Gables Hospital 702 1.78% 598 3.58%
The Biltmore Hotel 617 1.57% 620 3.71%
Dade County Public Schools 534 1.36% 620 3.71%
Bacardi USA 300 0.76% 330 1.97%
The Collection 325 0.83% N/A N/A
Mercantil Commerce Bank/Commerce Bank 293 0.74% N/A N/A
Gibraltar Bank 284 0.72% N/A N/A
Gables Engineering, Inc. 274 0.70% 230 1.38%
Bill Ussery Motors Mercedez-Benz 258 0.66% 250 1.50%
HBO Latin America 236 0.60% N/A N/A
Cable & Wireless Communication 207 0.53% N/A N/A
IBM Corporation 215 0.55% 120 0.72%
Diageo 190 0.48% N/A N/A
Quirch Foods 177 0.45% N/A N/A
Kindred Hospital 110 0.28% N/A N/A
Yard House Restaurant 141 0.36% N/A N/A
Hyatt Regency Coral Gables 141 0.36% N/A N/A
The Westin Colonnade Hotel 117 0.30% N/A N/A
American Airlines 103 0.26% N/A N/A
AECOM 80 0.20% N/A N/A
Stantec 80 0.20% N/A N/A
Richemont L.A. & Caribbean 64 0.16% N/A N/A
Total 39,368 100.00% 16,719 100.00%
Sources: Coral Gables Economic Sustainability Dept.
Coral Gables Chamber of Commerce
* Faculty & Full/Partime Employees
TABLE 15
CITY OF CORAL GABLES
PRINCIPAL EMPLOYERS
CURRENT YEAR AND TEN YEARS AGO
Fiscal Year Ended September 30,
2016 2007
126

CITY OF CORAL GABLES, FLORIDA - COMPREHENSIVE ANNUAL FINANCIAL REPORT - FISCAL YEAR ENDED SEPTEMBER 30, 2016
FUNCTION / PROGRAM 2007 2008 2009 2010 2011 2012 2013 2014 2015 2016
City Commission 7 7 7 7 7 7 7 7 6 6
City Attorney 4 4 5 5 5 5 5 5 5 5
City Clerk 4 5 5 5 5 5 5 5 7 9
City Manager 12 12 11 10 10 10 11 11 9 10
Human Resources 11 12 12 10 10 10 10 10 11 12
Development Services 58 65 63 58 63 64 64 64 63 62
Planning 5 5 5 4 0 0 0 0 0 0
Historic Resources 5 5 5 4 4 4 4 4 5 6
Public Works 80 76 76 65 63 84 84 204 204 192
Finance 32 31 31 31 31 33 33 34 32 32
Information Technology 11 16 19 16 15 15 15 15 16 16
Public Service 122 122 115 98 93 0 0 0 0 0
Automotive 30 30 30 26 23 0 0 0 0 0
Police 266 264 264 257 255 255 256 263 262 267
Fire 149 149 149 147 147 147 147 147 147 147
Parks & Recreation 36 35 33 28 26 0 0 0 0 0
Economic Sustainability 5 5 4 5 4 4 5 5 6 5
Parking 32 32 34 32 30 0 0 0 0 29
Community/Leisure Services 0 0 0 0 0 148 146 26 28 31
Total 869 875 868 808 791 791 792 800 801 829
Source: City of Coral Gables Budget Book
TABLE 16
CITY OF CORAL GABLES
POSITION CONTROL
FULL TIME POSITIONS
TEN YEAR COMPARISONS
127
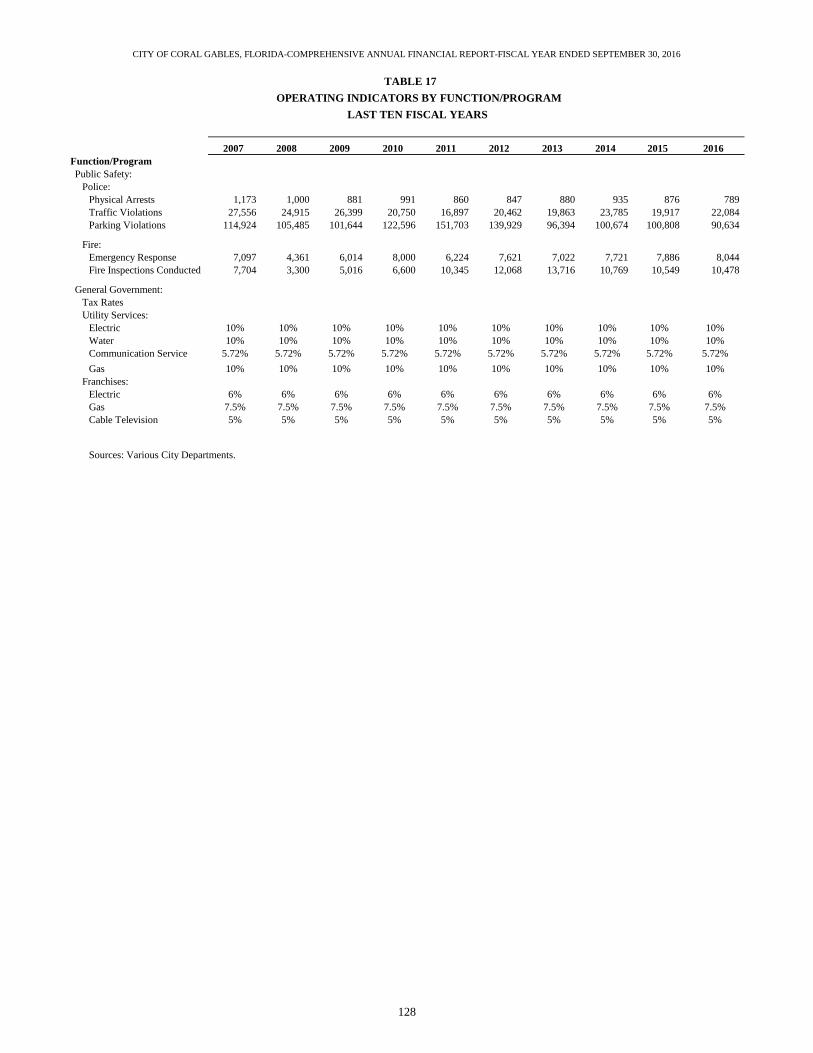
CITY OF CORAL GABLES, FLORIDA-COMPREHENSIVE ANNUAL FINANCIAL REPORT-FISCAL YEAR ENDED SEPTEMBER 30, 2016
2007 2008 2009 2010 2011 2012 2013 2014 2015 2016
Function/Program
Public Safety:
Police:
Physical Arrests 1,173 1,000 881 991 860 847 880 935 876 789
Traffic Violations 27,556 24,915 26,399 20,750 16,897 20,462 19,863 23,785 19,917 22,084
Parking Violations 114,924 105,485 101,644 122,596 151,703 139,929 96,394 100,674 100,808 90,634
Fire:
Emergency Response 7,097 4,361 6,014 8,000 6,224 7,621 7,022 7,721 7,886 8,044
Fire Inspections Conducted 7,704 3,300 5,016 6,600 10,345 12,068 13,716 10,769 10,549 10,478
General Government:
Tax Rates
Utility Services:
Electric 10% 10% 10% 10% 10% 10% 10% 10% 10% 10%
Water 10% 10% 10% 10% 10% 10% 10% 10% 10% 10%
Communication Service 5.72% 5.72% 5.72% 5.72% 5.72% 5.72% 5.72% 5.72% 5.72% 5.72%
Gas 10% 10% 10% 10% 10% 10% 10% 10% 10% 10%
Franchises:
Electric 6% 6% 6% 6% 6% 6% 6% 6% 6% 6%
Gas 7.5% 7.5% 7.5% 7.5% 7.5% 7.5% 7.5% 7.5% 7.5% 7.5%
Cable Television 5% 5% 5% 5% 5% 5% 5% 5% 5% 5%
Sources: Various City Departments.
TABLE 17
OPERATING INDICATORS BY FUNCTION/PROGRAM
LAST TEN FISCAL YEARS
128

CITY OF CORAL GABLES, FLORIDA - COMPREHENSIVE ANNUAL FINANCIAL REPORT-FISCAL YEAR ENDED SEPTEMBER 30, 2016
2007 2008 2009 2010 2011 2012 2013 2014 2015 2016
Function/Program
General Government:
Area
Land (sq. miles) (1) 12.3 12.3 12.3 12.9 13.1 13.1 13.1 13.1 13.1 13.1
Water (sq. miles) 24.0 24.0 24.0 24.0 24.0 24.0 24.0 24.0 24.0 24.0
Infrastructure (2)
Paved streets 228 228 228 228 228 228 228 228 228 228
Unpaved streets 0 0 0 0 0 0 0 0 0 0
Canals and waterways (miles) 47 47 47 47 47 47 47 47 47 47
FPL owned streetlights 3,379 3,439 3,440 3,514 3,506 3,518 3,523 3,533 3,533 3,533
City owned streelights 636 636 636 636 636 636 636 636 636 636
Public Safety:
Fire
Stations 3 3 3 3 3 3 3 3 3 3
Police
Stations 1 1 1 1 1 1 1 1 1 1
Culture and Recreation:
Recreation
Public beach (miles) 0 0 0 0 0 0 0 0 0 0
Municipal parks 14 14 14 14 14 14 14 14 14 14
Undeveloped parks 0 0 0 0 2 2 2 2 2 2
Municipal swimming pool 1 1 1 1 1 1 1 1 1 1
18-hole municipal golf course 1 1 1 1 1 1 1 1 1 1
9-hole municipal golf course 1 1 1 1 1 1 1 1 1 1
Recreational areas (acres) 1,005 1,005 1,005 1,005 1,005 1,005 1,005 1,005 1,005 1,005
Recreation centers 1 1 1 1 1 1 1 1 1 2
Municipal Water System
Water mains (miles) 0 0 0 0 0 0 0 0 0 0
Fire hydrants 1,260 1,260 1,260 1,260 1,260 1,260 1,260 1,260 1,260 1,260
Municipal Sewer System
Wastewater force main (miles) 10 10 10 10 10 10 10 10 10 10
Wastewater lift stations 35 35 35 35 35 35 35 35 35 35
Wastewater Gravity main (miles) 0 0 0 0 0 64 64 64 64 64
(1) Sources: 2012 updated Per 2010 U.S. Census
(2) Sources: Various City Departments
Fiscal Year
TABLE 18
CAPITAL ASSET STATISTICS BY FUNCTION/PROGRAM
LAST TEN FISCAL YEARS
129

[ This Page Intentionally Left Blank ]
130

City of Coral Gables, Florida Compliance Reports and Management Letter Fiscal Year Ended September 30, 2016

Table of Contents
Independent Auditor’s Report on Internal Control Over Financial Reporting and on
Compliance and Other Matters Based on an Audit of Financial Statements Performed in Accordance With Government Auditing Standards 1 – 2
Management Letter Required By Chapter 10.550 of the Rules of the Auditor General of the State of Florida 3 – 4
Appendix A – Current Year’s Recommendations to Improve Financial Management,
Accounting Procedures and Internal Controls.
Independent Accountant’s Report in Accordance with Chapter 10.550 of the Rules of the Auditor General of the State of Florida
5 – 6
7
1
Report on Internal Control Over Financial Reporting and on Compliance and Other Matters Based on an Audit of Financial
Statements Performed in Accordance With Government Auditing Standards
Independent Auditor’s Report
To the Honorable Mayor and Members of the City Commission City of Coral Gables, Florida We have audited, in accordance with the auditing standards generally accepted in the United States of America and the standards applicable to financial audits contained in Government Auditing Standards issued by the Comptroller General of the United States, the financial statements of the governmental activities, the business-type activities, each major fund, and the aggregate remaining fund information of the City of Coral Gables, Florida (the City), as of and for the year ended September 30, 2016, and the related notes to the financial statements, which collectively comprise the City’s basic financial statements and have issued our report thereon dated March 24, 2017, which included a reference to other auditors who audited the financial statements of the City of Coral Gables Retirement Fund and Police Officers’ Pension Fund, as described in our report on the City’s financial statements. This report does not include the results of the other auditors’ testing of internal control over financial reporting or compliance and other matters that are reported on separately by those auditors. The City of Coral Gables Retirement Fund was not audited in accordance with Government Auditing Standards and accordingly this report does not include reporting on internal controls over financial reporting or instances of reportable noncompliance associated with the City of Coral Gables Retirement Fund. Internal Control over Financial Reporting In planning and performing our audit of the financial statements, we considered the City’s internal control over financial reporting (internal control) to determine the audit procedures that are appropriate in the circumstances for the purpose of expressing our opinions on the financial statements, but not for the purpose of expressing an opinion on the effectiveness of the City’s internal control. Accordingly, we do not express an opinion on the effectiveness of the City’s internal control. A deficiency in internal control exists when the design or operation of a control does not allow management or employees, in the normal course of performing their assigned functions, to prevent, or detect and correct, misstatements on a timely basis. A material weakness is a deficiency, or a combination of deficiencies, in internal control, such that there is a reasonable possibility that a material misstatement of the entity’s financial statements will not be prevented, or detected and corrected on a timely basis. A significant deficiency is a deficiency, or a combination of deficiencies, in internal control that is less severe than a material weakness, yet important enough to merit attention by those charged with governance.

2
Our consideration of internal control was for the limited purpose described in the first paragraph of this section and was not designed to identify all deficiencies in internal control that might be material weaknesses or significant deficiencies. Given these limitations, during our audit we did not identify any deficiencies in internal control that we consider to be material weaknesses. However, material weaknesses may exist that have not been identified. Compliance and Other Matters As part of obtaining reasonable assurance about whether the City’s financial statements are free from material misstatement, we performed tests of its compliance with certain provisions of laws, regulations, contracts, and grant agreements, noncompliance with which could have a direct and material effect on the determination of financial statement amounts. However, providing an opinion on compliance with those provisions was not an objective of our audit, and accordingly, we do not express such an opinion. The results of our tests disclosed no instances of noncompliance or other matters that are required to be reported under Government Auditing Standards. Purpose of this Report
The purpose of this report is solely to describe the scope of our testing of internal control and compliance and the results of that testing, and not to provide an opinion on the effectiveness of the entity’s internal control or on compliance. This report is an integral part of an audit performed in accordance with Government Auditing Standards in considering the entity’s internal control and compliance. Accordingly, this communication is not suitable for any other purpose. This report is intended solely for the information and use of the Honorable Mayor, member of the City Commission, management of the City, federal and state awarding agencies and pass-through entities and is not intended to be and should not be used by anyone other than those specified parties.
Miami, Florida March 24, 2017

3
Management Letter Required By Chapter 10.550 of the Rules of the
Auditor General of the State of Florida To the Honorable Mayor and Members
of the City Commission City of Coral Gables, Florida Report on the Financial Statements We have audited the financial statements of the governmental activities, the business-type activities, each major fund, and the aggregate remaining fund information of the City of Coral Gables, Florida (the City), as of and for the fiscal year ended September 30, 2016, and have issued our report thereon dated March 24, 2017. Our report was modified to include a reference to other auditors. This report does not include the findings and recommendations of the other auditors’ that are reported on separately by those auditors. Auditor’s Responsibility We conducted our audit in accordance with auditing standards generally accepted in the United States of America; the standards applicable to financial audits contained in Government Auditing Standards, issued by the Comptroller General of the United States; and Chapter 10.550, Rules of the Auditor General. Other auditors audited the financial statements of the City of Coral Gables Retirement Fund and Police Officers’ Pension Fund, as described in our report on the City’s financial statements. This report does not include the results of the other auditors’ testing of internal control over financial reporting or compliance and other matters that are reported on separately by those auditors. The City of Coral Gables Retirement Fund was not audited in accordance with Government Auditing Standards and accordingly this report does not include reporting on internal controls over financial reporting or instances of reportable noncompliance associated with the City of Coral Gables Retirement Fund. Other Reports and Schedule We have issued our Independent Auditor’s Report on Internal Control over Financial Reporting and Compliance and Other Matters Based on an Audit of the Financial Statements Performed in Accordance with Government Auditing Standards; and our Independent Accountant’s Report on an examination conducted in accordance with AICPA Professional Standards, Section 601, regarding compliance requirements in accordance with Chapter 10.550, Rules of the Auditor General. Disclosures in those reports and schedule, which are dated March 24, 2017 should be considered in conjunction with this management letter. Prior Audit Findings Section 10.554(1)(i)1., Rules of the Auditor General, requires that we determine whether or not corrective actions have been taken to address findings and recommendations made in the preceding annual financial audit report. Corrective action was taken to address management letter comment 2015-01 related to user access controls noted in the proceeding annual financial audit report. Official Title and Legal Authority Section 10.554(1)(i)4., Rules of the Auditor General, requires that the name or official title and legal authority for the primary government and each component unit of the reporting entity be disclosed in this management letter, unless disclosed in the notes to the financial statements. This is disclosed in Note 1 of the financial statements.

4
Financial Condition Section 10.554(1)(i)5.a., Rules of the Auditor General, require that we apply appropriate procedures and report the results of our determination as to whether or not the City has met one or more of the conditions described in Section 218.503(1), Florida Statutes, and identification of the specific condition(s) met. In connection with our audit, we determined that the City did not meet any of the conditions described in Section 218.503(1), Florida Statutes. Pursuant to Sections 10.554(1)(i)5.c. and 10.556(8), Rules of the Auditor General, we applied financial condition assessment procedures. It is management’s responsibility to monitor the City’s financial condition, and our financial condition assessment was based in part on representations made by management and the review of financial information provided by same. Annual Financial Report Section 10.554(1)(i)5.b. and 10.566(7), Rules of the Auditor General, requires that we apply appropriate procedures and report the results of our determination as to whether the annual financial report for the City for the fiscal year ended September 30, 2016, filed with the Florida Department of Financial Services pursuant to Section 218.32(1)(a), Florida Statutes, is in agreement with the annual financial audit report for the fiscal year ended September 30, 2016. In connection with our audit, we determined that these two reports were in agreement. Other Matters Section 10.554(1)(i)2., Rules of the Auditor General, requires that we address in the management letter any recommendations to improve financial management. A recommendation is included in Appendix A – Current Year’s Recommendations to Improve Financial Management, Accounting Procedures and Internal Controls. Section 10.554(1)(i)3., Rules of the Auditor General, requires that we address noncompliance with provisions of contracts or grant agreements, or abuse, that have occurred, or are likely to have occurred, that have an effect on the financial statements that is less than material but which warrants the attention of those charged with governance. In connection with our audit, we did not have any such findings. Purpose of this Letter Our management letter is intended solely for the information and use of the Legislative Auditing Committee, members of the Florida Senate and the Florida House of Representatives, the Florida Auditor General, Federal and other granting agencies, the Mayor, City Commissioners, and applicable management, and is not intended to be and should not be used by anyone other than these specified parties.
Miami, Florida March 24, 2017
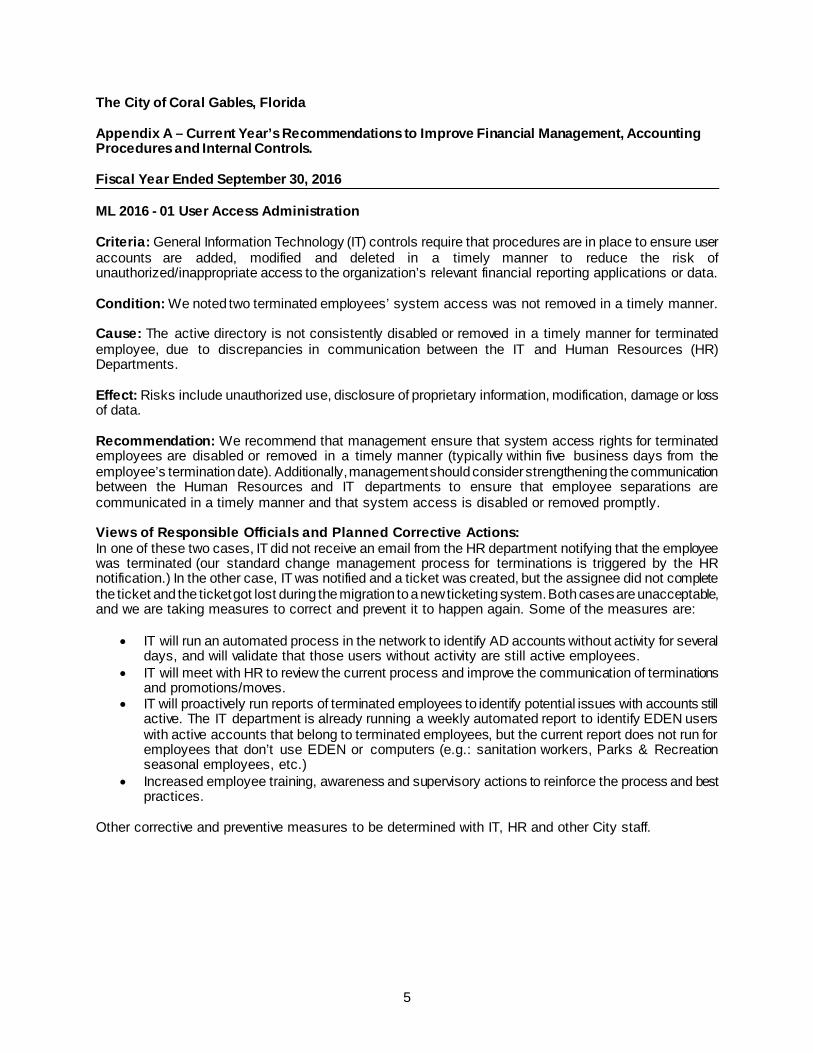
The City of Coral Gables, Florida Appendix A – Current Year’s Recommendations to Improve Financial Management, Accounting Procedures and Internal Controls. Fiscal Year Ended September 30, 2016
5
ML 2016 - 01 User Access Administration Criteria: General Information Technology (IT) controls require that procedures are in place to ensure user accounts are added, modified and deleted in a timely manner to reduce the risk of unauthorized/inappropriate access to the organization’s relevant financial reporting applications or data. Condition: We noted two terminated employees’ system access was not removed in a timely manner. Cause: The active directory is not consistently disabled or removed in a timely manner for terminated employee, due to discrepancies in communication between the IT and Human Resources (HR) Departments. Effect: Risks include unauthorized use, disclosure of proprietary information, modification, damage or loss of data. Recommendation: We recommend that management ensure that system access rights for terminated employees are disabled or removed in a timely manner (typically within five business days from the employee’s termination date). Additionally, management should consider strengthening the communication between the Human Resources and IT departments to ensure that employee separations are communicated in a timely manner and that system access is disabled or removed promptly. Views of Responsible Officials and Planned Corrective Actions: In one of these two cases, IT did not receive an email from the HR department notifying that the employee was terminated (our standard change management process for terminations is triggered by the HR notification.) In the other case, IT was notified and a ticket was created, but the assignee did not complete the ticket and the ticket got lost during the migration to a new ticketing system. Both cases are unacceptable, and we are taking measures to correct and prevent it to happen again. Some of the measures are:
• IT will run an automated process in the network to identify AD accounts without activity for several days, and will validate that those users without activity are still active employees.
• IT will meet with HR to review the current process and improve the communication of terminations and promotions/moves.
• IT will proactively run reports of terminated employees to identify potential issues with accounts still active. The IT department is already running a weekly automated report to identify EDEN users with active accounts that belong to terminated employees, but the current report does not run for employees that don’t use EDEN or computers (e.g.: sanitation workers, Parks & Recreation seasonal employees, etc.)
• Increased employee training, awareness and supervisory actions to reinforce the process and best practices.
Other corrective and preventive measures to be determined with IT, HR and other City staff.

The City of Coral Gables, Florida Appendix A – Current Year’s Recommendations to Improve Financial Management, Accounting Procedures and Internal Controls. Fiscal Year Ended September 30, 2016
6
ML 2016-02 – Capital Asset Management Criteria: Organizations are required to adopt adequate internal controls to properly record, summarize, and report accounting transactions, including those associated with the acquisition and disposition of capital assets, to provide reasonable assurance that assets are properly safeguarded and the financial statements are not materially misstated. Condition: We noted the City did not adhere to their capital asset disposal policy which requires a property disposal form to be completed and approved by the department head. While the City had a policy in place to account for capital asset disposals, the supporting documentation provided for the capital assets disposal that took place during the year, did not have evidence of segregation of duties between the initiator and approver (the department head). Cause: The cause is due to a breakdown in the system of controls resulting from lack of effective supervisory oversight and review of capital asset disposals. Effect: Capital assets represent a significant account balance for the City and improper accounting could result in a material misstatement of the financial statements. In addition, lack of segregation of duties can result in misappropriation of assets. Recommendation: We recommend the City adhere to its internal control policies and procedures to provide reasonable assurance that the capital asset disposals are properly approved and disposed of. Views of Responsible Officials and Planned Corrective Actions: Each year, the City’s Automotive Fleet Management Division performs a fleet utilization review to determine replacement need. Then, in coordination with user departments and the Management & Budget Division of the Finance Department, a vehicle replacement plan is developed and included in the annual budget document as part of the Capital Matrix Funding Program. Surplus vehicles and equipment are auctioned through an authorized auction vendor to ensure independence in the bidding and awarding process of the sales. Although these procedures exist, we acknowledge that documentation of the disposal initiation process as well as segregation of duties can be improved. Furthermore, we recognize that City-wide procedures over capital asset management can be strengthened. As a result, in August 2016, the City retained an external consultant to inventory and tag our capital assets, reconcile them to existing accounting records, and meet with key fixed asset personnel to develop a new property control manual including proper disposal of assets in accordance with best practices. The fixed asset management study has been authorized in order to assist with asset control, future capital budgeting, and financial reporting. The external consultant is in the process of finalizing the results of the inventory count and reconciliation with the accounting records. The “Capital Asset Accounting Policies and Procedures”, being drafted by the consultant, will be reviewed and approved by the Finance Department and will become the City’s formal written policy over capital asset management.

7
Independent Accountant’s Report Honorable Mayor and Members
of the City Commission City of Coral Gables, Florida We have examined the City of Coral Gables, Florida’s (the City) compliance with Section 218.415, Florida Statutes, Local Government Investment Policies during the year ended September 30, 2016. Management is responsible for the City’s compliance with those requirements. Our responsibility is to express an opinion on the City’s compliance based on our examination. Our examination was conducted in accordance with attestation standards established by the American Institute of Certified Public Accountants and, accordingly, included examining, on a test basis, evidence about the City’s compliance with those requirements and performing such other procedures as we considered necessary in the circumstances. We believe that our examination provides a reasonable basis for our opinion. Our examination does not provide a legal determination on the City’s compliance with specified requirements. In our opinion, the City complied, in all material respects, with the aforementioned requirements for the year ended September 30, 2016. This report is intended solely for the information and use of the Florida Auditor General, the Honorable Mayor, Members of the City Commission, the City Manager and applicable management, and is not intended to be and should not be used by anyone other than these specified parties.
Miami, Florida March 24, 2017
