annual energy outlook 2017 - energy information administration · source: eia, annual energy...
TRANSCRIPT

www.eia.govU.S. Energy Information Administration Independent Statistics & Analysis
Annual Energy Outlook 2017
AEO2017 Rollout PresentationJohns Hopkins School of Advanced International StudiesJanuary 5, 2017 | Washington, D.C.
ByAdam Sieminski, Administrator

Key takeaways from AEO2017• With strong domestic production and relatively flat demand, the United States becomes a net
energy exporter over the projection period in most cases
• U.S. crude oil production rebounds from recent lows, driven by continued development of tight oil resources; with consumption flat to down compared to recent history, net crude oil and petroleum product imports as a percentage of U.S. product supplied decline across most cases
• Across most cases, natural gas production increases despite relatively low and stable natural gas prices, supporting higher levels of domestic consumption and natural gas exports; projections are sensitive to resource and technology assumptions
• With modest demand growth, the primary driver for new electricity generation capacity in the Reference case is the retirement of older, less efficient fossil fuel units, largely spurred by the Clean Power Plan (CPP), and the near-term availability of renewable tax credits; even if the CPP is not implemented, low natural gas prices and the tax credits result in natural gas and renewables as the primary sources of new generation capacity; the future generation mix is sensitive to the price of natural gas and the growth in electricity demand
2Adam Sieminski, Johns Hopkins SAIS January 5, 2017

Key takeaways from AEO2017 (continued)• Transportation energy consumption peaks in 2018 in the Reference case because rising fuel
efficiency outweighs increases in total travel and freight movements throughout the projection period
• Despite growth in the number of households and the amount of commercial floorspace, improved equipment and efficiency standards contribute to residential and commercial consumption remaining relatively flat or declining slightly from 2016 to 2040 in the Reference case
• With economic growth and relatively low energy prices, energy consumption in EIA’s three industrial sub-sectors (energy-intensive manufacturing, non-energy-intensive manufacturing, and nonmanufacturing) increases during the projection period across all cases; energy intensity declines in the Reference case and most side cases as a result of technological improvements
3Adam Sieminski, Johns Hopkins SAIS January 5, 2017

Overview
4Adam Sieminski, Johns Hopkins SAIS January 5, 2017

AEO2017 includes side cases with different assumptions of macroeconomic growth, world oil prices, technological progress, and energy policies• Oil prices are primarily driven by global market balances that are mainly influenced by factors external to the NEMS
model; in the High Oil Price case, the price of Brent crude in 2016 dollars reaches $226 per barrel (b) by 2040, compared to $109/b in the Reference case and $43/b in the Low Oil Price case
• In the High Oil and Gas Resource and Technology case, lower costs and higher resource availability than in the Reference case allow for higher production at lower prices; in the Low Oil and Gas Resource and Technology case, more pessimistic assumptions about resources and costs are applied
• The effects of economic assumptions on energy consumption are addressed in the High and Low Economic Growth cases, which assume compound annual growth rates for U.S. gross domestic product of 2.6% and 1.6%, respectively, from 2016–40, compared with 2.2% annual growth in the Reference case
• A case assuming that the Clean Power Plan (CPP) is not implemented can be compared to the Reference case to show how that policy could affect energy markets and emissions
• Although the graphics in this presentation focus on projections through 2040, this AEO is the first projection to include model results through 2050, which are available on the AEO page of the EIA website; EIA welcomes feedback on the assumptions and results from the period 2040–50
5Adam Sieminski, Johns Hopkins SAIS January 5, 2017

Total energy consumptionquadrillion British thermal units
Energy consumption varies minimally across all AEO cases, bounded by the High and Low Economic Growth cases
Source: EIA, Annual Energy Outlook 2017
0
20
40
60
80
100
120
140
1980 1990 2000 2010 2020 2030 2040
2016history projections High Economic
GrowthLow Oil PriceHigh Oil PriceHigh Oil and Gas Resource and TechnologyReference Low Oil and Gas Resource and Technology Low Economic Growth
6Adam Sieminski, Johns Hopkins SAIS January 5, 2017

0
5
10
15
20
25
30
35
40
45
1980 1990 2000 2010 2020 2030 2040
petroleum and other liquidsnatural gas
other renewable energycoalnuclearhydroliquid biofuels
2016history projections
Energy consumption (Reference case)quadrillion British thermal units
Domestic energy consumption remains relatively flat in the Reference case, but the fuel mix changes significantly
Source: EIA, Annual Energy Outlook 2017
7Adam Sieminski, Johns Hopkins SAIS January 5, 2017

0
20
40
60
80
100
120
140
1980 1990 2000 2010 2020 2030 2040
High Oil and Gas Resource and Technology High Oil PriceHigh Economic GrowthReference Low Economic GrowthLow Oil PriceLow Oil and Gas Resource and Technology
2016history projections
Total energy productionquadrillion British thermal units
Energy production ranges from nearly flat in the Low Oil and Gas Resource and Technology case, to continued growth in the High Resource and Technology case
Source: EIA, Annual Energy Outlook 2017
8Adam Sieminski, Johns Hopkins SAIS January 5, 2017

0
10
20
30
40
1980 1990 2000 2010 2020 2030 2040
dry natural gas
crude oil and lease condensate
coalother renewablesnuclearnatural gas plant liquidshydro
2016history projections
Energy production (Reference case)quadrillion British thermal units
United States energy production continues to increase in the Reference case, led by growth in natural gas and renewables
Source: EIA, Annual Energy Outlook 2017
9Adam Sieminski, Johns Hopkins SAIS January 5, 2017

-30
-20
-10
0
10
20
30
40
1980 1990 2000 2010 2020 2030 2040
Low Oil PriceLow Oil and Gas Resource and TechnologyHigh Economic GrowthReference caseLow Economic GrowthHigh Oil PriceHigh Oil and Gas Resource and Technology
2016history projections
net imports
net exports
Net energy trade quadrillion British thermal units
The United States becomes a net energy exporter in most cases as petroleum liquid imports fall and natural gas exports rise
Source: EIA, Annual Energy Outlook 2017
10Adam Sieminski, Johns Hopkins SAIS January 5, 2017

0
5
10
15
20
25
30
35
40
1980 1990 2000 2010 2020 2030 2040
Energy trade (Reference case)quadrillion British thermal units
exports
imports
2016history projections
-10
-5
0
5
10
15
20
25
30
1980 1990 2000 2010 2020 2030 2040
Net energy trade (Reference case)quadrillion British thermal units
petroleumand other liquids
electricitycoal and cokenatural gas
2016history projections
net imports
net exports
The United States becomes a net energy exporter in the Reference case projections as natural gas exports increase and petroleum imports decrease
11Adam Sieminski, Johns Hopkins SAIS January 5, 2017
Source: EIA, Annual Energy Outlook 2017

0
1
2
3
4
5
6
7
1980 1990 2000 2010 2020 2030 2040
2016history projections No Clean Power Plan
High Economic GrowthLow Oil PriceHigh Oil and Gas Resource and TechnologyReference caseHigh Oil PriceLow Oil and Gas Resource and Technology Low Economic Growth
Energy-related carbon dioxide emissionsbillion metric tons of carbon dioxide
Energy related carbon dioxide emissions decline in most AEO cases, with the highest emissions projected in the No Clean Power Plan case
Source: EIA, Annual Energy Outlook 2017
12Adam Sieminski, Johns Hopkins SAIS January 5, 2017

0.0
0.5
1.0
1.5
2.0
2.5
3.0
1980 1990 2000 2010 2020 2030 2040
transportation
electric power
industrial
residential
commercial
2016history projections
0.0
0.5
1.0
1.5
2.0
2.5
3.0
1980 1990 2000 2010 2020 2030 2040
petroleum
natural gas
coal
2016history projections
Source: EIA, Annual Energy Outlook 2017
Reference case energy-related carbon dioxide emissions fall, but at a slower rate than in the recent pastU.S. energy-related carbon dioxide emissions (Reference case)billion metric tons of carbon dioxide billion metric tons of carbon dioxide
13Adam Sieminski, Johns Hopkins SAIS January 5, 2017
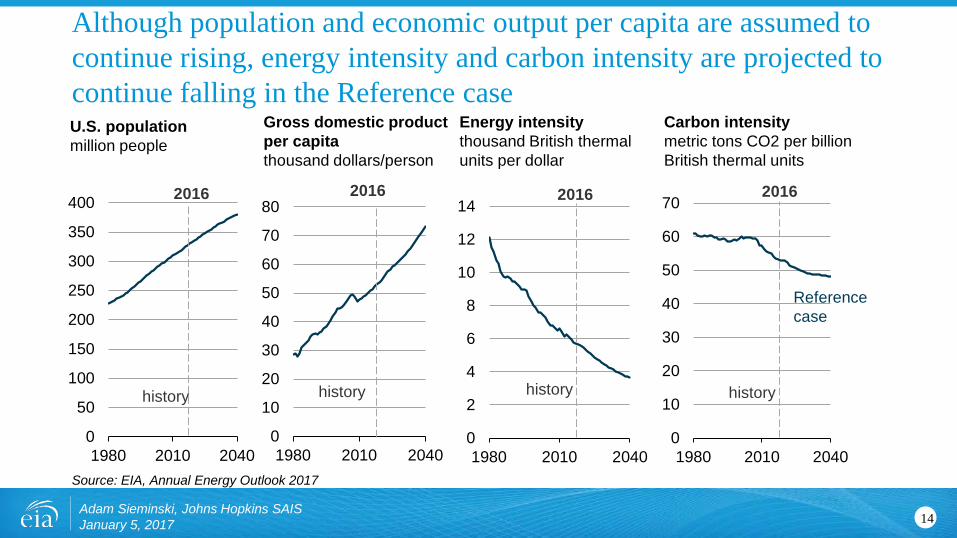
Although population and economic output per capita are assumed to continue rising, energy intensity and carbon intensity are projected to continue falling in the Reference case
0
50
100
150
200
250
300
350
400
1980 2010 2040
U.S. populationmillion people
2016
history
0
10
20
30
40
50
60
70
80
1980 2010 2040
Gross domestic product per capitathousand dollars/person
2016
history
0
2
4
6
8
10
12
14
1980 2010 2040
Energy intensitythousand British thermal units per dollar
2016
history
0
10
20
30
40
50
60
70
1980 2010 2040
Carbon intensitymetric tons CO2 per billion British thermal units
2016
history
Referencecase
Source: EIA, Annual Energy Outlook 2017
14Adam Sieminski, Johns Hopkins SAIS January 5, 2017

Petroleum and other liquids
15Adam Sieminski, Johns Hopkins SAIS January 5, 2017

0
50
100
150
200
250
2000 2010 2020 2030 2040
North Sea Brent oil price2016 dollars per barrel
2016history projections
Source: EIA, Annual Energy Outlook 2017
Reference case oil prices and production rise from current levels, price paths and production levels in the side cases are very different from those in the Reference case
0
2
4
6
8
10
12
14
16
18
2000 2010 2020 2030 2040
2016history projections
Crude oil productionmillion barrels per day
High Oil and Gas Resource and Technology
High Oil PriceReference case
Low Oil PriceLow Oil and Gas Resource and Technology
16Adam Sieminski, Johns Hopkins SAIS January 5, 2017

Tight oil dominates U.S. production in the Reference case, but other types of oil production continue to yield significant volumes
Source: EIA, Annual Energy Outlook 2017
02468
1012141618
2000 2010 2020 2030 2040
Crude oil production million barrels per day
U.S. total
tight oil
non-tight oil
2016history projections
2020 2030 2040
2016projections
2020 2030 2040
2016projections
Low Oil and Gas Resource and Technology
Reference High Oil and Gas Resource and Technology
17Adam Sieminski, Johns Hopkins SAIS January 5, 2017

-40
-20
0
20
40
60
80
2000 2005 2010 2015 2020 2025 2030 2035 2040
Low Oil PriceLow Oil and GasResource and TechnologyReference
High Oil Price
High Oil and GasResource and Technology
net imports
net exports
2016history projections
Petroleum net imports as a percentage of products suppliedpercent
In the High Oil Price and the High Oil and Gas Resource and Technology cases, the United States becomes a net petroleum exporter
Source: EIA, Annual Energy Outlook 2017
18Adam Sieminski, Johns Hopkins SAIS January 5, 2017

0
10
20
30
40
50
2000 2010 2020 2030 2040
Light-duty stock fleet fuel economymiles per gallon
car
fleetaverage
truck
2016history projections
20%
30%
40%
50%
60%
70%
2000 2010 2020 2030 2040
Light-duty vehicle sales sharespercent
truck
car
0%
2016history projections
Source: EIA, Annual Energy Outlook 2017
Average light-duty fuel economy improves in the Reference case, even as the share of light-duty trucks increases
19Adam Sieminski, Johns Hopkins SAIS January 5, 2017

With the second phase of fuel efficiency regulations, medium- and heavy-duty vehicle energy consumption declines over 2027-33 despite continued growth in miles traveled
Source: EIA, Annual Energy Outlook 2017
050
100150200250300350400450
2000 2020 2040
2016history projections
travel indicatorbillion vehicle-miles traveled
0
2
4
6
8
10
12
2000 2020 2040
2016history projections
stock fuel economymiles per gallon
0
1
2
3
4
5
6
7
2000 2020 2040
2016history projections
energy consumptionquadrillion British thermal units
Medium- and heavy-duty vehicle metrics
20Adam Sieminski, Johns Hopkins SAIS January 5, 2017
0
5
10
15
20
25
30
35
2000 2010 2020 2030 2040
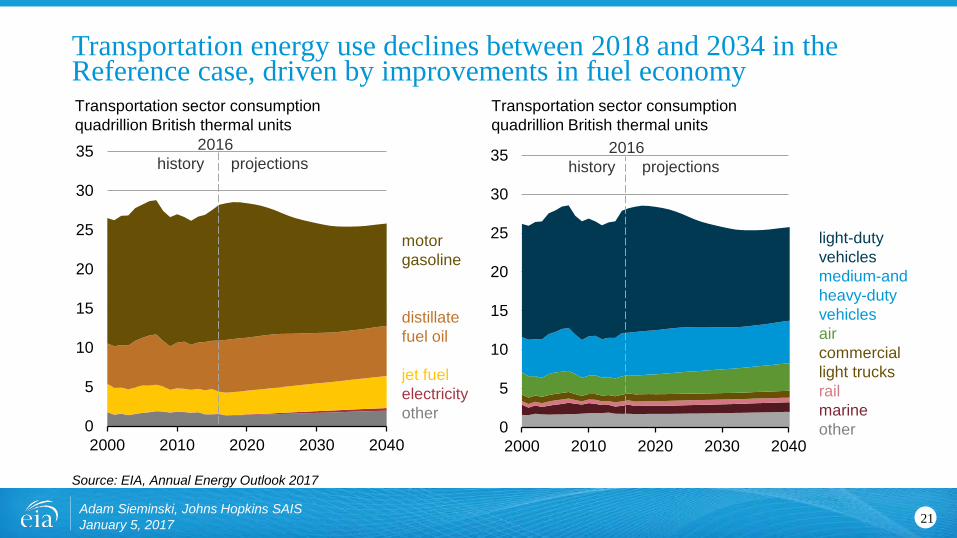
Transportation sector consumption quadrillion British thermal units
2016history projections
motorgasoline
distillatefuel oil
jet fuelelectricityother
0
5
10
15
20
25
30
35
2000 2010 2020 2030 2040
Transportation sector consumptionquadrillion British thermal units
2016history projections
light-duty vehiclesmedium-and heavy-duty vehiclesaircommerciallight trucksrailmarineother
Source: EIA, Annual Energy Outlook 2017
Transportation energy use declines between 2018 and 2034 in the Reference case, driven by improvements in fuel economy
21Adam Sieminski, Johns Hopkins SAIS January 5, 2017

Natural gas
22Adam Sieminski, Johns Hopkins SAIS January 5, 2017

0
10
20
30
40
50
60
2000 2010 2020 2030 2040
U.S. natural gas production by type trillion cubic feet
shale gas and tight oil plays
tight gasother Lower 48 onshoreLower 48 offshoreother
2016history projections
Source: EIA, Annual Energy Outlook 2017
U.S. dry natural gas production is the result of continued development of shale gas and tight oil plays, alternative assumptions cause significant differences
23Adam Sieminski, Johns Hopkins SAIS January 5, 2017
0
10
20
30
40
50
60
2000 2010 2020 2030 2040
Dry natural gas productiontrillion cubic feet
2016history projections High Oil Price
High Oil and Gas Resourceand Technology Reference case Low Oil PriceLow Oil and Gas Resource and Technology

0
20
40
60
80
100
0
5
10
15
20
25
30
35
40
2010 2016 2020 2030 2040
electric power
industrial
transportationcommercial
residential
2016history projections
Natural gas consumption by sector trillion cubic feet billion cubic feet per day
Increasing demand from industrial and electric power markets drive rising domestic consumption of natural gas in the Reference case
Source: EIA, Annual Energy Outlook 2017
24Adam Sieminski, Johns Hopkins SAIS January 5, 2017

Increased natural gas trade is dominated by liquefied natural gas exports in the Reference case
25
-6
-2
2
6
-6
-4
-2
0
2
4
6
8
1980 1990 2000 2010 2020 2030 2040
Natural gas tradetrillion cubic feet
2016history projections
liquefied natural gas (LNG) exports
pipeline exports to CanadaMexico
pipeline imports fromCanadaLNG imports
billion cubic feet per day22
16
10
5
0
-5
-10
-16
Adam Sieminski, Johns Hopkins SAIS January 5, 2017

0
5
10
15
20
25
0
2
4
6
8
10
2000 2010 2020 2030 2040
Liquefied natural gas exportstrillion cubic feet billion cubic feet per day
2016history projections
0
1
2
3
4
5
6
7
8
2000 2010 2020 2030 2040
Oil-to-natural gas price ratioenergy-equivalent terms
2016history projections
Source: EIA, Annual Energy Outlook 2017
U.S. LNG export levels vary across cases and reflect both the level of global demand, as well as by the difference between domestic and global natural gas prices
Reference High and Low Oil and Gas Resource and Technology
High and LowOil Price
26Adam Sieminski, Johns Hopkins SAIS January 5, 2017

0
2
4
6
8
10
12
2000 2010 2020 2030 2040
2016history projections Low Oil and
Gas Resource and TechnologyHigh Oil PriceReference case Low Oil PriceHigh Oil and Gas Resource and Technology
Henry Hub natural gas price2016 dollars per million Btu
Future domestic natural gas prices depend on both domestic resource availability and world energy prices
Source: EIA, Annual Energy Outlook 2017
27Adam Sieminski, Johns Hopkins SAIS January 5, 2017

Electricity
28Adam Sieminski, Johns Hopkins SAIS January 5, 2017

0200400600800
1,0001,2001,4001,6001,800
Electricity use by sector billion kilowatthours
direct use
electricity sales
residential I commercial I Industrial I transportation -2
-1
0
1
2
3
4
5
6
1980 2000 2020 2040
Electricity use growth rate percent growth (three-year rolling average)
2016history projections
Source: EIA, Annual Energy Outlook 2017
Electricity use continues to increase, but the rate of growth remains lower than historic averages in the Reference case
29Adam Sieminski, Johns Hopkins SAIS January 5, 2017

0
500
1,000
1,500
2,000
2,500
1980 1990 2000 2010 2020 2030 2040
U.S. net electricity generation from select fuels billion kilowatthours
natural gas
2016history projections
petroleum
coal
renewableenergy
nuclear
Reference
2020 2030 2040
2016projections
No Clean Power Plan
Source: EIA, Annual Energy Outlook 2017
Fuel prices and current laws and regulations drive growing shares of renewables and natural gas in the electricity generation mix as coal’s share declines over time in the Reference case
30Adam Sieminski, Johns Hopkins SAIS January 5, 2017

Natural gas resource availability affects prices and plays a critical role in determining the mix of coal, natural gas, and renewable generation
Source: EIA, Annual Energy Outlook 2017
31Adam Sieminski, Johns Hopkins SAIS January 5, 2017
2015 2025 2035 2015 2025 2035
Low Oil and Gas Resourceand Technology
High Oil and Gas Resource and Technology
0
500
1,000
1,500
2,000
2,500
1980 1990 2000 2010 2020 2030 2040
U.S. net electricity generation from select fuels billion kilowatthours
natural gas
2016history projections
coal
renewableenergy
Reference

-30
-20
-10
0
10
20
30
40
2005 2010 2015 2020 2025 2030 2035 2040
2016history projections
solarwindoil and gasnuclearothercoal
additions
retirements
Annual electricity generating capacity additions and retirements (Reference case) gigawatts
Lower capital costs and the availability of tax credits boost near-term wind additions and sustain solar additions; whereas coal-fired unit retirements in the Reference case are driven by low natural gas prices and the Clean Power Plan
Source: EIA, Annual Energy Outlook 2017
32Adam Sieminski, Johns Hopkins SAIS January 5, 2017

0
20
40
60
80
100
120
2010 2020 2030 2040
Nuclear electricity generating capacitygigawatts
2016history projections
Reference
-4
-3
-2
-1
0
1
2
3
2015 2020 2025 2030 2035 2040
Year-over-year nuclear capacity changes gigawatts
additions
retirements
assumed upratesnew reactors
actual/announcedretirementsprojectedretirements
Reference
Source: EIA, Annual Energy Outlook 2017
Assumptions about license renewals in AEO2017 increase nuclear retirements, leading to net nuclear capacity decreases
33Adam Sieminski, Johns Hopkins SAIS January 5, 2017

0
200
400
600
800
1,000
1,200
1,400
2000 2010 2020 2030 2040
Coal productionmillion short tons
total
West
Appalachia
Interior
2016history projections
No Clean Power PlanReference
0
200
400
600
800
1,000
1,200
1,400
2000 2010 2020 2030 2040
Coal consumption in electric power sector million short tons
2016history projections
No CleanPower Plan
Reference
Source: EIA, Annual Energy Outlook 2017
Coal production decreases, primarily in the Western region
34Adam Sieminski, Johns Hopkins SAIS January 5, 2017

Buildings and industrial
35Adam Sieminski, Johns Hopkins SAIS January 5, 2017

0 1 2 3 4 5 6
heating
cooling
water heating
lighting
refrigeration
other
Residential sector delivered energy consumptionquadrillion British thermal units
20162040
0 1 2 3 4 5 6
heating
cooling
water heating
lighting
refrigeration
other
Commercial sector delivered energy consumption quadrillion British thermal units
20162040
Source: EIA, Annual Energy Outlook 2017
Energy consumption decreases for most major end uses in the residential and commercial sectors with improved equipment efficiency and standards in the Reference case
36Adam Sieminski, Johns Hopkins SAIS January 5, 2017

0 1 2 3 4
other uses
TVs and PCs
cooking
laundry and dishwashing
refrigerators and freezers
water heating
heating
lighting
cooling 20162040
Residential electricity use per householdthousand kilowatthours per household
Per-household electricity use continues to decline in the Reference case led by efficiency improvements in lighting, cooling, and refrigeration
Source: EIA, Annual Energy Outlook 2017
37Adam Sieminski, Johns Hopkins SAIS January 5, 2017

18
20
22
24
26
28
30
32
34
36
1980 1990 2000 2010 2020 2030 2040
2016history projections
//
High Oil PriceHigh Economic GrowthHigh Oil and Gas Resourceand Technology Reference Low Oil and Gas Resource and TechnologyLow Economic GrowthLow Oil Price
Industrial energy consumptionquadrillion British thermal units
Industrial energy consumption grows in all cases, but is higher in the High Oil Price case and the High Economic Growth cases over most of the projection
Source: EIA, Annual Energy Outlook 2017
38Adam Sieminski, Johns Hopkins SAIS January 5, 2017

2010 2020 2030 2040
Industrial energy consumption quadrillion British thermal units
2016history projections
non-manufacturingother non-energyintensivemetal durablesrefiningbulk chemical feedstockbulk chemical heat & powerfoodiron & steelpaperother energy intensive
Source: EIA, Annual Energy Outlook 2017
Industrial sector energy consumption growth in the Reference case is led by increases in petroleum and natural gas consumption
39Adam Sieminski, Johns Hopkins SAIS January 5, 2017
0
5
10
15
20
25
30
35
1980 2000 2020 2040
Industrial energy consumptionquadrillion British thermal units
2016history projections
coalelectricityrenewables
natural gas
hydrocarbongas liquidspetroleum

For more informationU.S. Energy Information Administration home page | www.eia.gov
Short-Term Energy Outlook | www.eia.gov/steo
Annual Energy Outlook | www.eia.gov/aeo
International Energy Outlook | www.eia.gov/ieo
Monthly Energy Review | www.eia.gov/mer
Today in Energy | www.eia.gov/todayinenergy
40Adam Sieminski, Johns Hopkins SAIS January 5, 2017