annual and end-of-cycle (2015-2018) reports on the …
TRANSCRIPT
ANNUAL ANDEND-OF-CYCLEREPORTS ON THE 2015-2025MASTER PLAN
Sequoias CommunityCollege District
College of the Sequoias
ANNUAL AND END-OF-CYCLE(2015-2018) REPORTSON THE MASTER PLAN
2018


1 2018 Annual and End‐of‐Cycle Reports on the Master Plan
College of the Sequoias
2018 Annual Report on the COS 2015-2025 Master Plan and
2015-2018 Strategic Plan – End of Cycle Report
Sequoias Community College District
College of the Sequoias
Visalia Campus 915 S. Mooney Blvd.
Visalia, CA 93277
Hanford Campus 925 13th Ave.
Hanford, CA 93230
Tulare College Campus 4999 E. Bardsley Ave.
Tulare, CA 93274
2 2018 Annual and End‐of‐Cycle Reports on the Master Plan
Introduction This College of the Sequoias Annual Report on the COS 2015-2025 Master Plan describes progress made toward achieving the goals and objectives documented in the strategic plan. In addition, this End of Cycle Report assesses the progress made toward achieving the goals and objectives of the 2015-2018 Strategic Plan. The COS 2015-2025 Master Plan includes four District Goals. The four District Goals are: I. College of the Sequoias will increase student enrollment relative to population growth and educational and workforce development needs. II. College of the Sequoias will improve the rate at which its students complete degrees, certificates, and transfer objectives. III. College of the Sequoias will strategically tailor and implement academic programs and student services that match the unique needs of its student population and the demands of ongoing changes in workforce development. IV. College of the Sequoias Board of Trustees, administration, faculty, and staff will engage in best practices and staff development to sustain effective operational systems for institutional assessment and continuous improvement. The District identified objectives within each goal for focus in the 2015-2018 Strategic Plan. The District community developed actions and measurable outcomes for each objective. This report includes three parts: 1. Update on the actions completed from Fall 2017 through Spring 2018 related to each objective and the End of Cycle assessments from 2015-2018…………………..……...……………………………………………...……………………………......…Page 3 Purpose: To inform everyone in the District about the work that was completed during the 2017-2018 year and the 2015-2018 planning cycle. 2. Analysis of the District’s movement toward achieving its goals……..……………………..……………….…………………..…...Page 47 Purpose: To assess whether work on the objectives resulted in forward movement toward achievement of the institutional goals in 2017 – 2018. 3. End of Cycle Assessment Results Summary ………...……………………………………………………………..……….……..…Page 52 Purpose: To inform everyone in the District of the progress made in the 2015-2018 planning cycle.
3 2018 Annual and End‐of‐Cycle Reports on the Master Plan
Part 1: Update on the actions completed from Fall 2017 through Spring 2018 related to the objectives in the College of the Sequoias 2015-2018 Strategic Plan. During the development of the Strategic Plan, the District identified specific institutional objectives based on goals from the Master Plan that address current and anticipated challenges. The purpose of the Institutional Goals and corresponding Objectives was to focus the District’s collective energies on successfully meeting those challenges. This is the final progress report on the College of the Sequoias 2015-2018 Strategic Plan. Part 1 of this annual report is a summary of the District’s progress from Fall 2017 through Spring 2018 related to its Institutional Goals and Objectives, in addition to End of Cycle assessments from 2015-2018. Following the format of the College of the Sequoias 2015-2018 Strategic Plan, the institutional goals and objectives are organized according to the four goals: I. College of the Sequoias will increase student enrollment relative to population growth and educational and workforce development needs. II. College of the Sequoias will improve the rate at which its students complete degrees, certificates, and transfer objectives. III. College of the Sequoias will strategically tailor and implement academic programs and student services that match the unique needs of its student population and the demands of ongoing changes in workforce development. IV. College of the Sequoias Board of Trustees, administration, faculty, and staff will engage in best practices and staff development to sustain effective operational systems for institutional assessment and continuous improvement.
4 2018 Annual and End‐of‐Cycle Reports on the Master Plan
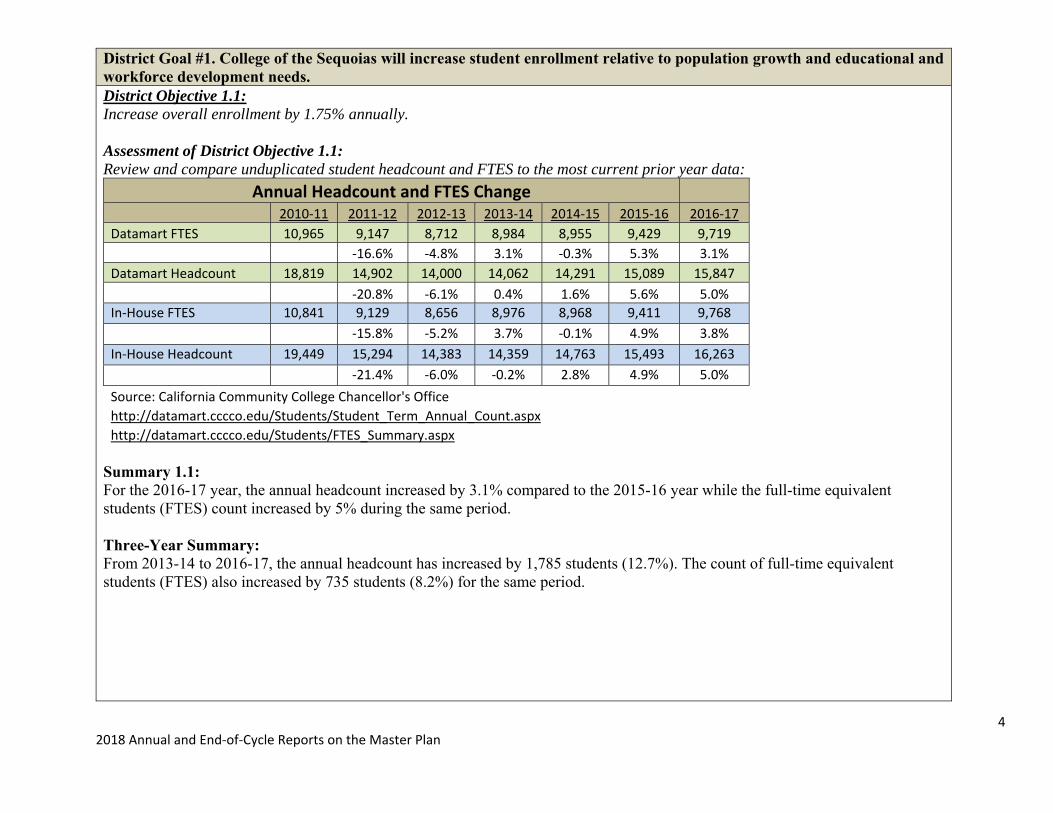
District Goal #1. College of the Sequoias will increase student enrollment relative to population growth and educational and workforce development needs. District Objective 1.1: Increase overall enrollment by 1.75% annually. Assessment of District Objective 1.1: Review and compare unduplicated student headcount and FTES to the most current prior year data:
Annual Headcount and FTES Change 2010‐11 2011‐12 2012‐13 2013‐14 2014‐15 2015‐16 2016‐17 Datamart FTES 10,965 9,147 8,712 8,984 8,955 9,429 9,719 ‐16.6% ‐4.8% 3.1% ‐0.3% 5.3% 3.1% Datamart Headcount 18,819 14,902 14,000 14,062 14,291 15,089 15,847 ‐20.8% ‐6.1% 0.4% 1.6% 5.6% 5.0% In‐House FTES 10,841 9,129 8,656 8,976 8,968 9,411 9,768 ‐15.8% ‐5.2% 3.7% ‐0.1% 4.9% 3.8% In‐House Headcount 19,449 15,294 14,383 14,359 14,763 15,493 16,263 ‐21.4% ‐6.0% ‐0.2% 2.8% 4.9% 5.0% Source: California Community College Chancellor's Office http://datamart.cccco.edu/Students/Student_Term_Annual_Count.aspx
http://datamart.cccco.edu/Students/FTES_Summary.aspx Summary 1.1: For the 2016-17 year, the annual headcount increased by 3.1% compared to the 2015-16 year while the full-time equivalent students (FTES) count increased by 5% during the same period. Three-Year Summary: From 2013-14 to 2016-17, the annual headcount has increased by 1,785 students (12.7%). The count of full-time equivalent students (FTES) also increased by 735 students (8.2%) for the same period.
5 2018 Annual and End‐of‐Cycle Reports on the Master Plan
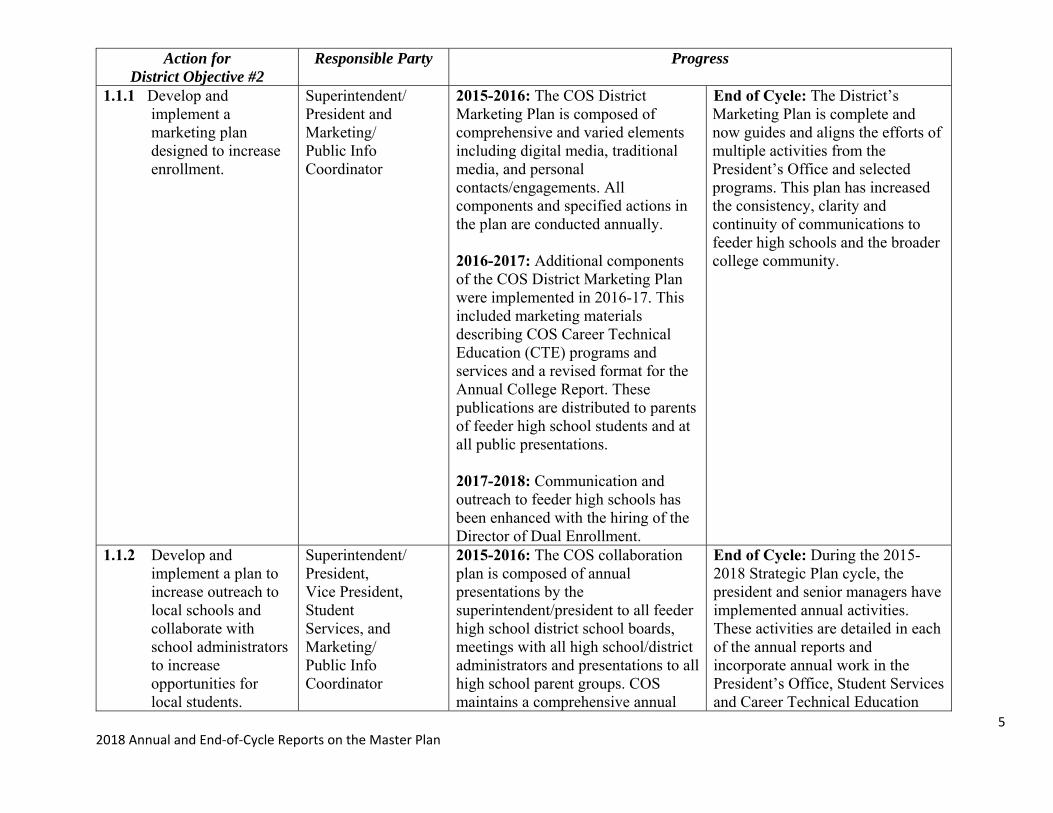
Action for District Objective #2
Responsible Party Progress
1.1.1 Develop and implement a marketing plan designed to increase enrollment.
Superintendent/ President and Marketing/ Public Info Coordinator
2015-2016: The COS District Marketing Plan is composed of comprehensive and varied elements including digital media, traditional media, and personal contacts/engagements. All components and specified actions in the plan are conducted annually. 2016-2017: Additional components of the COS District Marketing Plan were implemented in 2016-17. This included marketing materials describing COS Career Technical Education (CTE) programs and services and a revised format for the Annual College Report. These publications are distributed to parents of feeder high school students and at all public presentations. 2017-2018: Communication and outreach to feeder high schools has been enhanced with the hiring of the Director of Dual Enrollment.
End of Cycle: The District’s Marketing Plan is complete and now guides and aligns the efforts of multiple activities from the President’s Office and selected programs. This plan has increased the consistency, clarity and continuity of communications to feeder high schools and the broader college community.
1.1.2 Develop and implement a plan to increase outreach to local schools and collaborate with school administrators to increase opportunities for local students.
Superintendent/ President, Vice President, Student Services, and Marketing/ Public Info Coordinator
2015-2016: The COS collaboration plan is composed of annual presentations by the superintendent/president to all feeder high school district school boards, meetings with all high school/district administrators and presentations to all high school parent groups. COS maintains a comprehensive annual
End of Cycle: During the 2015-2018 Strategic Plan cycle, the president and senior managers have implemented annual activities. These activities are detailed in each of the annual reports and incorporate annual work in the President’s Office, Student Services and Career Technical Education
6 2018 Annual and End‐of‐Cycle Reports on the Master Plan
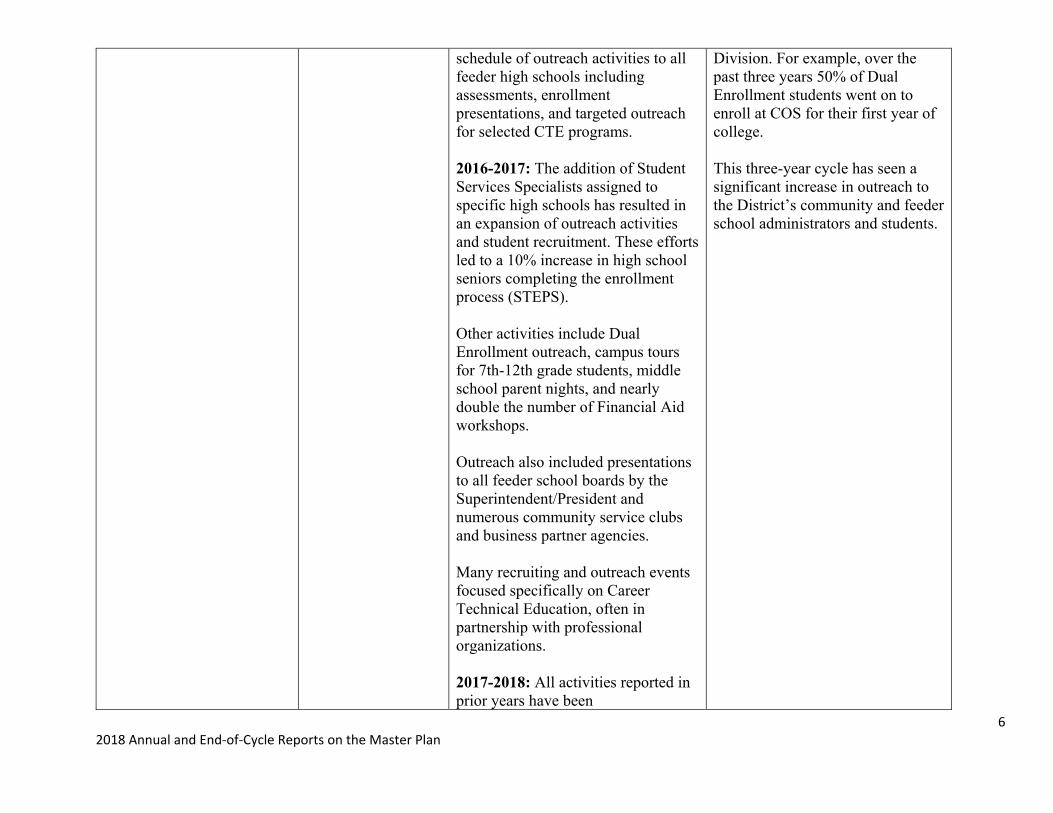
schedule of outreach activities to all feeder high schools including assessments, enrollment presentations, and targeted outreach for selected CTE programs. 2016-2017: The addition of Student Services Specialists assigned to specific high schools has resulted in an expansion of outreach activities and student recruitment. These efforts led to a 10% increase in high school seniors completing the enrollment process (STEPS).
Other activities include Dual Enrollment outreach, campus tours for 7th-12th grade students, middle school parent nights, and nearly double the number of Financial Aid workshops. Outreach also included presentations to all feeder school boards by the Superintendent/President and numerous community service clubs and business partner agencies. Many recruiting and outreach events focused specifically on Career Technical Education, often in partnership with professional organizations. 2017-2018: All activities reported in prior years have been
Division. For example, over the past three years 50% of Dual Enrollment students went on to enroll at COS for their first year of college. This three-year cycle has seen a significant increase in outreach to the District’s community and feeder school administrators and students.
7 2018 Annual and End‐of‐Cycle Reports on the Master Plan
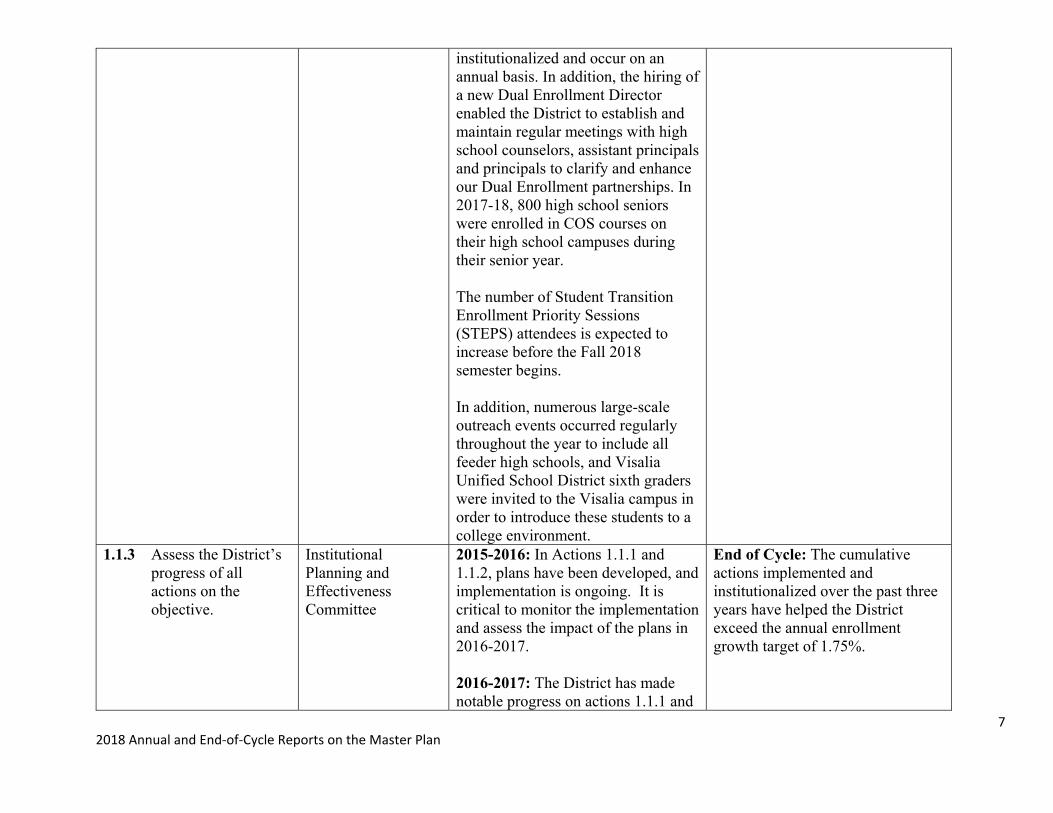
institutionalized and occur on an annual basis. In addition, the hiring of a new Dual Enrollment Director enabled the District to establish and maintain regular meetings with high school counselors, assistant principals and principals to clarify and enhance our Dual Enrollment partnerships. In 2017-18, 800 high school seniors were enrolled in COS courses on their high school campuses during their senior year. The number of Student Transition Enrollment Priority Sessions (STEPS) attendees is expected to increase before the Fall 2018 semester begins. In addition, numerous large-scale outreach events occurred regularly throughout the year to include all feeder high schools, and Visalia Unified School District sixth graders were invited to the Visalia campus in order to introduce these students to a college environment.
1.1.3 Assess the District’s progress of all actions on the objective.
Institutional Planning and Effectiveness Committee
2015-2016: In Actions 1.1.1 and 1.1.2, plans have been developed, and implementation is ongoing. It is critical to monitor the implementation and assess the impact of the plans in 2016-2017. 2016-2017: The District has made notable progress on actions 1.1.1 and
End of Cycle: The cumulative actions implemented and institutionalized over the past three years have helped the District exceed the annual enrollment growth target of 1.75%.

8 2018 Annual and End‐of‐Cycle Reports on the Master Plan
1.1.2. 2017-2018: Additional actions reported in 1.1.1 and 1.1.2 have helped to exceed the target for increased enrollment.
9 2018 Annual and End‐of‐Cycle Reports on the Master Plan
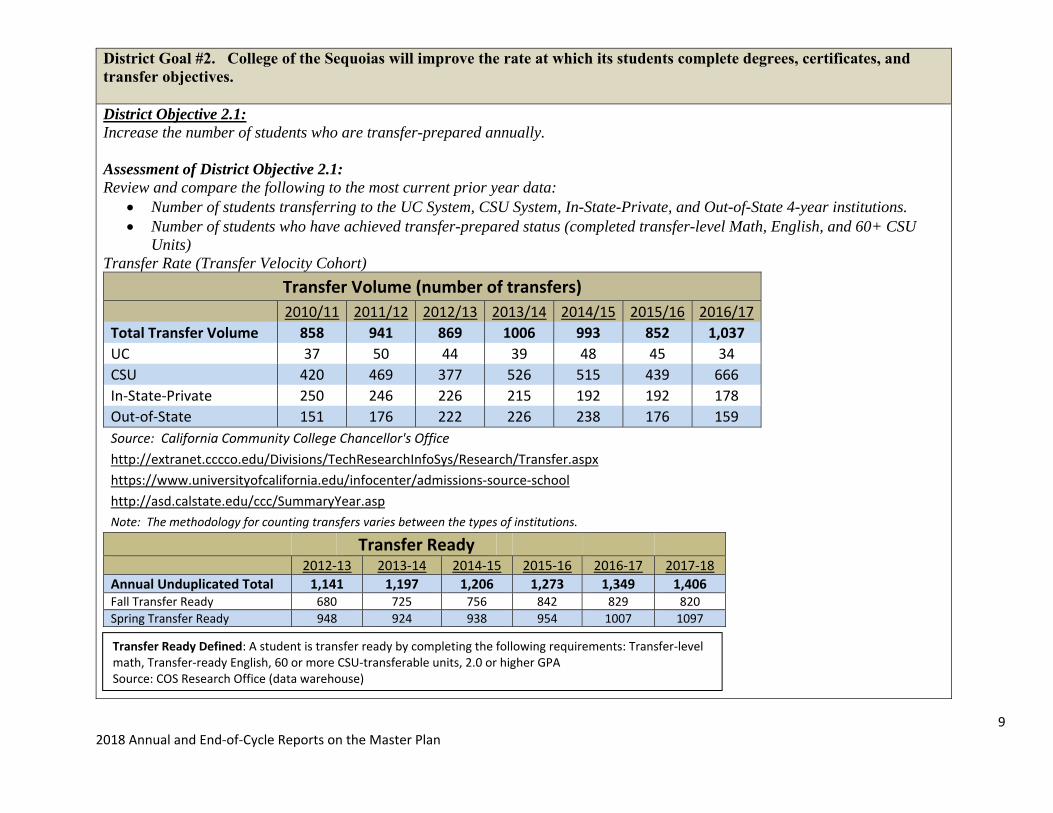
District Goal #2. College of the Sequoias will improve the rate at which its students complete degrees, certificates, and transfer objectives. District Objective 2.1: Increase the number of students who are transfer-prepared annually. Assessment of District Objective 2.1: Review and compare the following to the most current prior year data:
Number of students transferring to the UC System, CSU System, In-State-Private, and Out-of-State 4-year institutions. Number of students who have achieved transfer-prepared status (completed transfer-level Math, English, and 60+ CSU
Units) Transfer Rate (Transfer Velocity Cohort)
Transfer Volume (number of transfers) 2010/11 2011/12 2012/13 2013/14 2014/15 2015/16 2016/17 Total Transfer Volume 858 941 869 1006 993 852 1,037 UC 37 50 44 39 48 45 34 CSU 420 469 377 526 515 439 666 In‐State‐Private 250 246 226 215 192 192 178 Out‐of‐State 151 176 222 226 238 176 159 Source: California Community College Chancellor's Office
http://extranet.cccco.edu/Divisions/TechResearchInfoSys/Research/Transfer.aspx https://www.universityofcalifornia.edu/infocenter/admissions‐source‐school http://asd.calstate.edu/ccc/SummaryYear.asp
Note: The methodology for counting transfers varies between the types of institutions. Transfer Ready
2012‐13 2013‐14 2014‐15 2015‐16 2016‐17 2017‐18 Annual Unduplicated Total 1,141 1,197 1,206 1,273 1,349 1,406 Fall Transfer Ready 680 725 756 842 829 820 Spring Transfer Ready 948 924 938 954 1007 1097
Transfer Ready Defined: A student is transfer ready by completing the following requirements: Transfer‐level math, Transfer‐ready English, 60 or more CSU‐transferable units, 2.0 or higher GPA Source: COS Research Office (data warehouse)

10 2018 Annual and End‐of‐Cycle Reports on the Master Plan
Transfer Velocity
2004/05 Cohort
2005/06 Cohort
2006/07 Cohort
2007/08 Cohort
2008/09 Cohort
2009/10 Cohort
2010/11 Cohort
Annual Unduplicated Total 33% 36% 36% 34% 33% 34% 34% # of Transfers 344 400 518 471 522 504 488 # in Cohort 1,046 1,098 1,440 1,401 1,577 1,466 1,432 Transfer Velocity Cohort: is calculated by evaluating all first time freshmen six years after their entry. Those students who have completed twelve credit units and attempted a transfer level math or English course are included in the Transfer Velocity Cohort. Transfer rates for years three, four, and five are retrospective and cannot be reported until the cohort is finalized at the completion of the sixth year after initial enrollment. Students with multiple college enrollments are reported as members of the Transfer Velocity Cohort for each college attended.
Source: California Community College Chancellor's Office Data Mart http://datamart.cccco.edu/Outcomes/Transfer_Velocity.aspx
Summary 2.1: The volume of students transferring increased from 852 in 2015/16 to 1,037 in 2016/17. Transfer decreases were observed for the UC system, in-state-private and out-of-state colleges. However, the number of students transferring to the CSU system increased a noticeable 52% compared to the prior year. The transfer velocity cohort remained at 34% for the 2010/11 cohort. The number of annual transfer ready students has increased from 1,349 in the 2016/17 year to 1,406 in the 2017/18 year, a 4% increase. Three-Year Summary: Since 2014/15, the volume (number) of students transferring to four-year institutions has increased by 4%. During this time, transfers to the CSU campuses increased by 29% whereas transfers to the UC System decreased by 29%. In-state-private and out-of-state private colleges also experienced transfer decreases by 7% and 33%, respectively. The transfer velocity cohort rate slightly increased from 33% in 2008/09 to 34% in 2010/11. Since 2014/15, the number of students who are transfer ready increased by 17%.
11 2018 Annual and End‐of‐Cycle Reports on the Master Plan
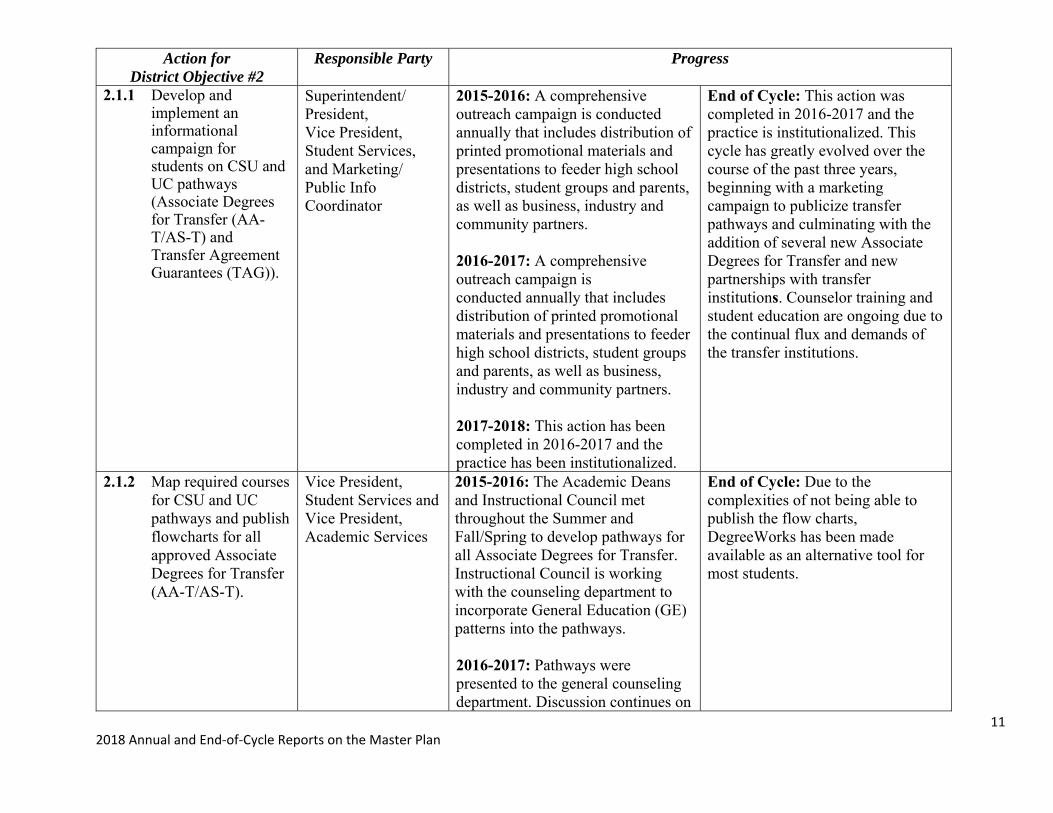
Action for District Objective #2
Responsible Party Progress
2.1.1 Develop and implement an informational campaign for students on CSU and UC pathways (Associate Degrees for Transfer (AA-T/AS-T) and Transfer Agreement Guarantees (TAG)).
Superintendent/ President, Vice President, Student Services, and Marketing/ Public Info Coordinator
2015-2016: A comprehensive outreach campaign is conducted annually that includes distribution of printed promotional materials and presentations to feeder high school districts, student groups and parents, as well as business, industry and community partners. 2016-2017: A comprehensive outreach campaign is conducted annually that includes distribution of printed promotional materials and presentations to feeder high school districts, student groups and parents, as well as business, industry and community partners. 2017-2018: This action has been completed in 2016-2017 and the practice has been institutionalized.
End of Cycle: This action was completed in 2016-2017 and the practice is institutionalized. This cycle has greatly evolved over the course of the past three years, beginning with a marketing campaign to publicize transfer pathways and culminating with the addition of several new Associate Degrees for Transfer and new partnerships with transfer institutions. Counselor training and student education are ongoing due to the continual flux and demands of the transfer institutions.
2.1.2 Map required courses for CSU and UC pathways and publish flowcharts for all approved Associate Degrees for Transfer (AA-T/AS-T).
Vice President, Student Services and Vice President, Academic Services
2015-2016: The Academic Deans and Instructional Council met throughout the Summer and Fall/Spring to develop pathways for all Associate Degrees for Transfer. Instructional Council is working with the counseling department to incorporate General Education (GE) patterns into the pathways. 2016-2017: Pathways were presented to the general counseling department. Discussion continues on
End of Cycle: Due to the complexities of not being able to publish the flow charts, DegreeWorks has been made available as an alternative tool for most students.

12 2018 Annual and End‐of‐Cycle Reports on the Master Plan
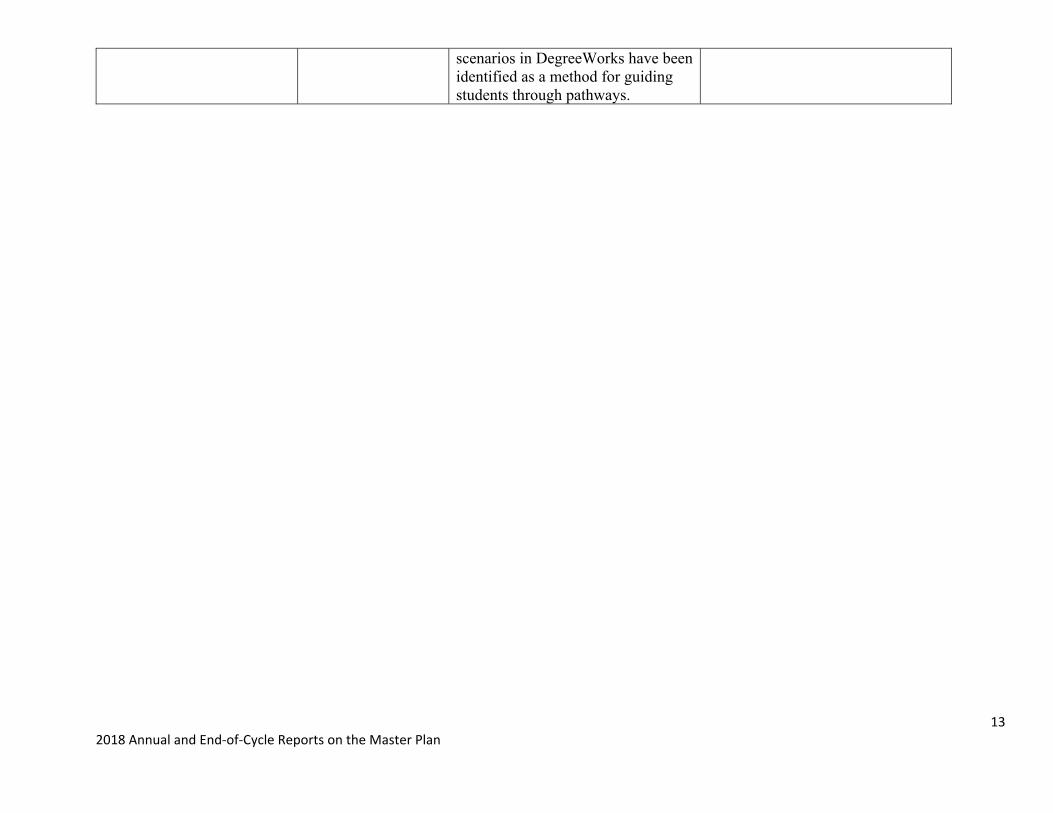
how to best publish pathways. 2017-2018: Counseling division continues to transition to the student education plan (pathway) within DegreeWorks. Students will view their education plan and degree audit within this program. These two functions will work in conjunction to visually demonstrate that courses taken outside of a student’s major will not be applied towards their degree completion. Financial Aid will move to funding students based upon student education plan in DegreeWorks to ensure that students are following coursework necessary for their degree or certificate pathway.
2.1.3 Assess the District’s progress of all actions on the objective.
Institutional Planning and Effectiveness Committee
2015-2016: With the actions of the District marketing plan completed, the District has made significant progress. Dialogue and changes in scheduling practices have occurred as a result of these actions. 2016-2017: While progress has been made in mapping, and outreach is continuing, more direct actions toward getting students transfer-prepared are warranted. 2017-2018: Alternative methods and tools have been explored for mapping pathways. “What if”
End of Cycle: The District has completed action 2.1.1. However, due to the complexities of not being able to publish flow charts, action 2.1.2 was not completed, but an alternative method has been implemented that is helpful for most students.
13 2018 Annual and End‐of‐Cycle Reports on the Master Plan
scenarios in DegreeWorks have been identified as a method for guiding students through pathways.
14 2018 Annual and End‐of‐Cycle Reports on the Master Plan
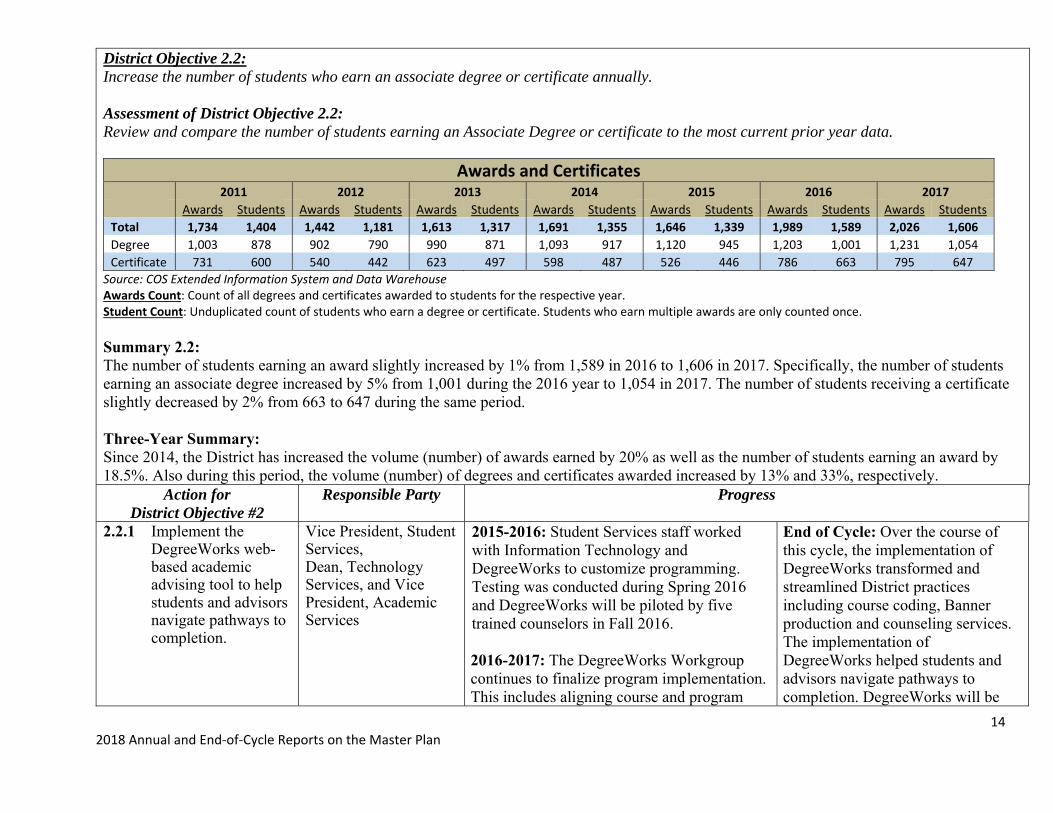
District Objective 2.2: Increase the number of students who earn an associate degree or certificate annually. Assessment of District Objective 2.2: Review and compare the number of students earning an Associate Degree or certificate to the most current prior year data.
Awards and Certificates 2011 2012 2013 2014 2015 2016 2017 Awards Students Awards Students Awards Students Awards Students Awards Students Awards Students Awards Students Total 1,734 1,404 1,442 1,181 1,613 1,317 1,691 1,355 1,646 1,339 1,989 1,589 2,026 1,606 Degree 1,003 878 902 790 990 871 1,093 917 1,120 945 1,203 1,001 1,231 1,054 Certificate 731 600 540 442 623 497 598 487 526 446 786 663 795 647
Source: COS Extended Information System and Data Warehouse Awards Count: Count of all degrees and certificates awarded to students for the respective year. Student Count: Unduplicated count of students who earn a degree or certificate. Students who earn multiple awards are only counted once. Summary 2.2: The number of students earning an award slightly increased by 1% from 1,589 in 2016 to 1,606 in 2017. Specifically, the number of students earning an associate degree increased by 5% from 1,001 during the 2016 year to 1,054 in 2017. The number of students receiving a certificate slightly decreased by 2% from 663 to 647 during the same period. Three-Year Summary: Since 2014, the District has increased the volume (number) of awards earned by 20% as well as the number of students earning an award by 18.5%. Also during this period, the volume (number) of degrees and certificates awarded increased by 13% and 33%, respectively.
Action for District Objective #2
Responsible Party Progress
2.2.1 Implement the DegreeWorks web-based academic advising tool to help students and advisors navigate pathways to completion.
Vice President, Student Services, Dean, Technology Services, and Vice President, Academic Services
2015-2016: Student Services staff worked with Information Technology and DegreeWorks to customize programming. Testing was conducted during Spring 2016 and DegreeWorks will be piloted by five trained counselors in Fall 2016. 2016-2017: The DegreeWorks Workgroup continues to finalize program implementation. This includes aligning course and program
End of Cycle: Over the course of this cycle, the implementation of DegreeWorks transformed and streamlined District practices including course coding, Banner production and counseling services. The implementation of DegreeWorks helped students and advisors navigate pathways to completion. DegreeWorks will be

15 2018 Annual and End‐of‐Cycle Reports on the Master Plan
codes and development of a protocol for Banner/Information Technology/DegreeWorks alignment to accommodate changes to courses and programs. In Spring 2017, a limited number of counselors began testing DegreeWorks, with a planned mid-Spring 2017 full rollout to all counselors. 2017-2018: DegreeWorks was rolled out to all counselors who will utilize the audit feature for Graduation Applications beginning Fall 2017. DegreeWorks will be available to all students by Fall 2018. In addition, the DegreeWorks tutorial video has been included in New Student Orientations and workshops.
enabled by course-to-course equivalence over the next semesters to input courses taken at other colleges, apply units, and clear area towards a student’s program.
2.2.2 Develop an informational campaign and workshops informing students, faculty, and staff about DegreeWorks.
Vice President, Student Services
2015-2016: In March 2016, Student Services staff and faculty scribed catalogs, tested for accuracy, and will clone to live production during the summer. 2016-2017: In Spring 2017, the newly developed electronic education plan user guide was distributed at counseling faculty trainings. In late Spring, DegreeWorks training began for counseling faculty. 2017-2018: DegreeWorks has been added to the 2018-19 catalog under Counseling Services. Staff trainings were conducted in Spring and Summer 2018 and will continue in Fall 2018. In addition, the DegreeWorks tutorial was presented to students in-person during the technology session of student orientations delivered during Giant Days in Spring 2017.
End of Cycle: The user guide for the electronic education planner was distributed at counseling faculty trainings. DegreeWorks was added to the 2018-2019 catalog under Counseling Services. Staff trainings were conducted in Spring and Summer 2018 and will continue in Fall 2018. Student orientation was delivered in Spring 2017.
16 2018 Annual and End‐of‐Cycle Reports on the Master Plan
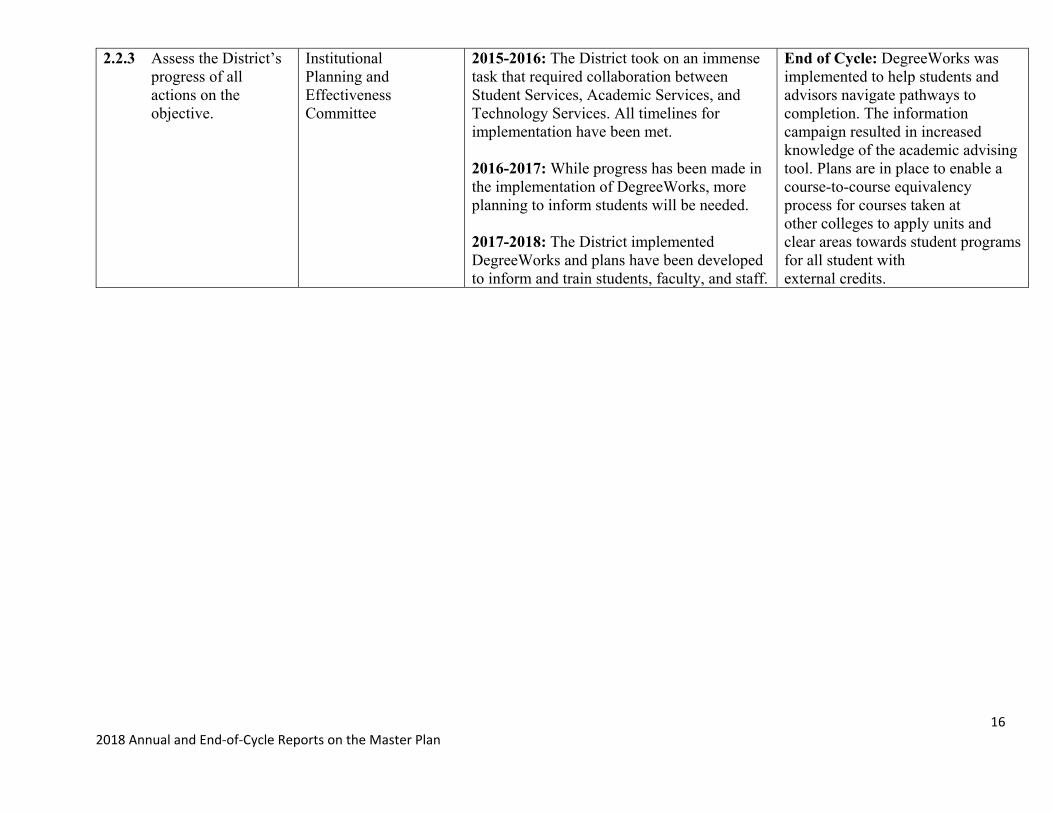
2.2.3 Assess the District’s progress of all actions on the objective.
Institutional Planning and Effectiveness Committee
2015-2016: The District took on an immense task that required collaboration between Student Services, Academic Services, and Technology Services. All timelines for implementation have been met. 2016-2017: While progress has been made in the implementation of DegreeWorks, more planning to inform students will be needed. 2017-2018: The District implemented DegreeWorks and plans have been developed to inform and train students, faculty, and staff.
End of Cycle: DegreeWorks was implemented to help students and advisors navigate pathways to completion. The information campaign resulted in increased knowledge of the academic advising tool. Plans are in place to enable a course-to-course equivalency process for courses taken at other colleges to apply units and clear areas towards student programs for all student with external credits.
17 2018 Annual and End‐of‐Cycle Reports on the Master Plan
District Objective 2.3: Increase course success and completion rates in pre-transfer English, Math, and English as a Second Language courses annually. Assessment of District Objective 2.3: Review and compare the following to the most current prior year data:
Course success rates for English 360, 251, and 261; Math 360, 200, and 230; and all credit English as a Second Language (ESL) courses with a C or above.
Course completion (“retention”) rates for English 360, 251, and 261; Math 360, 200, and 230; and all credit English as a Second Language courses
Success: Pre‐Transfer Math & English Retention: Pre‐Transfer Math & English
Fall 2014
Spring 2015
Fall 2015
Spring 2016
Fall 2016
Spring 2017
Fall 2017
Fall 2014
Spring 2015
Fall 2015
Spring 2016
Fall 2016
Spring 2017
Fall 2017
Pre‐Transfer Total 51% 50% 54% 51% 54% 53% 54%
Pre‐Transfer Total 85% 85% 87% 84% 86% 87% 86%
Success Grades 2,297 2,029 2,621 2,059 2,886 2,234 2,915 Success Grades 3,847 3,470 4,228 3,349 4,575 3,684 4,706 All Grades 4,506 4,080 4,854 4,005 5,299 4,245 5,445 All Grades 4,506 4,080 4,854 4,005 5,299 4,245 5,445 ENGL 251 60% 51% 62% 52% 62% 56% 60% ENGL 251 87% 82% 88% 82% 89% 87% 86% Success Grades 615 468 712 478 786 488 760 Success Grades 892 748 1,013 756 1,117 754 1,085 All Grades 1,029 910 1,151 919 1,260 864 1,265 All Grades 1,029 910 1,151 919 1,260 864 1,265 ENGL 261 37% 34% 55% 51% 56% ENGL 261 81% 72% 89% 89% 88% Success Grades 0 0 10 22 66 41 77 Success Grades 0 0 22 46 107 71 121 All Grades 0 0 27 64 120 80 138 All Grades 0 0 27 64 120 80 138 ENGL 360 51% 56% 61% 50% 59% 50% 57% ENGL 360 88% 91% 91% 85% 88% 84% 88% Success Grades 161 144 196 131 199 126 225 Success Grades 274 235 294 221 295 213 347 All Grades 313 259 323 261 336 254 393 All Grades 313 259 323 261 336 254 393 Credit ESL 81% 75% 71% 75% 88% 83% 85% Credit ESL 95% 90% 93% 86% 92% 90% 94% Success Grades 164 130 115 89 105 77 84 Success Grades 192 156 151 102 108 84 93 All Grades 202 173 162 118 120 93 99 All Grades 202 173 162 118 118 93 99 MATH 230 48% 49% 56% 51% 52% 57% 52% MATH 230 83% 85% 85% 83% 82% 87% 86% Success Grades 497 524 649 501 634 620 649 Success Grades 857 908 981 816 1,013 952 1,069 All Grades 1,034 1,074 1,159 987 1,230 1,095 1,237 All Grades 1,034 1,074 1,159 987 1,230 1,095 1,237 MATH 200 45% 41% 45% 46% 47% 48% 49% MATH 200 84% 85% 89% 83% 87% 87% 86% Success Grades 540 448 575 499 625 543 693 Success Grades 1,005 925 1,124 900 1,163 974 1,213 All Grades 1,193 1,093 1,266 1,079 1,331 1,126 1,415 All Grades 1,193 1,093 1,266 1,079 1,331 1,126 1,415 MATH 360 44% 55% 48% 59% 52% 46% 48% MATH 360 85% 87% 84% 88% 86% 87% 87% Success Grades 320 315 364 339 471 339 427 Success Grades 627 498 643 508 772 636 778 All Grades 735 571 766 577 902 733 898 All Grades 735 571 766 577 902 733 898
Source: COS Extended Information System and Data Warehouse Success Rate: Letter grades A, B, C or P / all grades issued. Plus and minus grades are included. Course Completion (“Retention”) Rate: Letter grades A, B, C, D, F, I, CR, NC, P, NP / all grades issued. Plus and minus grades are included.

18 2018 Annual and End‐of‐Cycle Reports on the Master Plan
Summary 2.3: Overall, the success rate for the specified courses has remained steady at 54% in Fall 2017, the same as the past two Fall terms. The ENGL 261 course success rate slightly increased from 55% in Fall 2016 to 56% in Fall 2017. The completion (retention) rate for ENGL 261 slightly decreased from 89% to 88% during the same period. Although the course success rate for Math 230 remained steady at 52%, the completion (retention) rate increased from 82% in Fall 2016 to 86% in Fall 2017. Three-Year Summary: The overall success rate for basic skills courses has exceeded the 2014-15 success rates by approximately 3% in the fall terms and 1%-3% in the spring terms. In addition, the overall completion (retention) rate for basic skills courses exceeded the 2014-15 completion (rates) by 1% in the fall terms and 2% in the spring terms.
Action for District Objective #2
Responsible Party Progress
2.3.1 Ensure curriculum is aligned within basic skills/ESL disciplines and schedule courses to maximize students’ opportunities to complete the basic skills/ESL sequence in a timely manner.
Dean, Arts/Letters, Curriculum Committee, and Academic Senate
2015-2016: Curriculum alignment between adult education basic skills classes and District basic skills/ESL classes is occurring through the Adult Education Block Grant. The District’s off-site ESL program is now offered in an accelerated model where students can complete the beginning level in one year. Beginning in Fall 2016, ESL courses will be offered at the Hanford Educational Center. 2016-2017: English as a Second Language (ESL) courses were offered at the Hanford Educational Center in Fall 2016 and further expansion of the ESL programs is being discussed. ESL Faculty are in the process of updating all ESL courses and alignment with adult education continues. 2017-2018: The ESL department has completed professional training in redesigning
End of Cycle: As a result of curriculum alignment and improved course sequencing – due to the Mapping Tool – the number of ESL certificates has more than doubled. Integrated Mathematics (IM) curricula offered at most local high schools have created a challenge for mathematics course placements. The Math Division has collected data and has been able to determine course alignments to better gauge placements.

19 2018 Annual and End‐of‐Cycle Reports on the Master Plan
curriculum and exploring placement procedures to be compliant with AB 705. Integrated Mathematics programs offered at local school districts are now aligned to COS math courses. This provides useful information for future class placements.
2.3.2 Design and implement proven best practices for increased basic skills/ESL success and completion (acceleration, prep courses, alternate assessment models).
Dean, Arts/Letter, Deans, Student Services, Academic Senate, Instructional Council, Faculty Enrichment Committee
2015-2016: The District’s off-site ESL program is now offered in an accelerated model where students can complete the beginning level in one year. The accelerated English course, English 261, was offered in Fall 2015 and expanded in Spring 2016. An acceleration work group meets regularly to discuss curriculum, pedagogy, and assessment in conjunction with the California Acceleration Project. A full-time, grant-funded ESL counselor was hired in April 2016. 2016-2017: The accelerated English course (English 261) offerings have increased from one class in Fall 2015 to five classes in the Fall and Spring of 2017. The English acceleration work group continues to meet and discuss curriculum, pedagogy, and assessment in conjunction with the California Acceleration Project. The math acceleration discussions have begun and both math and English faculty continue to attend acceleration workshops. 2017-2018: Math Division held meetings to discuss implications and strategies to align
End of Cycle: The Mathematics Division meets regularly to develop a strategy for reducing basic skills placements. Local meetings and training on basic skills math were organized to learn success models from other colleges. The ESL department implemented and completed several best practices over the three-year period, which resulted in an increase in the number of certificates awarded.
20 2018 Annual and End‐of‐Cycle Reports on the Master Plan
with AB 705. The ESL counselor worked with students seeking ESL coursework by providing one-on-one appointments and workshops. The ESL counselor assisted transitioning non-credit ESL students to credit coursework. The ESL counselor held 1,080 individual student appointments and 201 group appointments by July 2018.
2.3.3 Assess the District’s progress of all actions on the objective.
Institutional Planning and Effectiveness Committee
2015-2016: The District continues to implement acceleration in ESL and English 261. Continued efforts are needed to scale up and support these programs as well as research on accelerated options in Math. 2016-2017: The District continues to implement acceleration in English and English as a Second Language (ESL). Discussions have begun to explore acceleration in math. 2017-2018: The District continues to implement acceleration in English and English as a Second Language. Although the Mathematics Division has aligned curriculum with local high school Integrated Math programs and is planning curricula and placement strategies for upcoming semesters, it has not yet implemented options to accelerate math completion.
End of Cycle: The District continues to make progress. However, due to the challenges posed by AB 705 legislation, neither actions were completed.
21 2018 Annual and End‐of‐Cycle Reports on the Master Plan
District Objective 2.4: Increase Career Technical Education course success rates and program completion annually. Assessment of District Objective 2.4: Review and compare the following to the most current prior year data.
Number of students earning a CTE associate degree Number of students earning a CTE certificate Overall success rates of CTE courses (C or above)
CTE Degrees and
Certificates 2012 2013 2014 2015 2016 2017 2018 Awards Students Awards Students Awards Students Awards Students Awards Students Awards Students Awards Students Total 812 683 909 744 860 714 799 667 1,033 858 1,167 961 1,300 1,077 Degree 335 326 337 320 311 302 330 309 372 355 397 386 463 450 Certificate 477 385 572 448 549 438 469 387 661 542 770 623 837 685
Source: COS Data Warehouse Awards Count: Count of all degrees and certificates awarded to students for the respective year. Student Count: Unduplicated count of students who earn a degree or certificate. Students who earn multiple awards are only counted once.
CTE Success
Rates FALL 2014 SPRING 2015 FALL 2015 SPRING 2016 Fall 2016 Spring 2017 Fall 2017 Success Rate 67% 67% 70% 69% 71% 70% 70% Success Grades 10,639 10,323 12,814 11,206 14,347 11,927 14,262 All Grades 15,974 15,386 18,278 16,184 20,148 17,077 20,308
Source: COS Data Warehouse Success Rate: Letter grades A, B, C or P / all grades issued. Plus and minus grades are included. Summary 2.4: The number of students earning a Career Technical Education associate degree increased by 9% from 355 in 2016 to 386 in 2017. The number of students earning a Career Technical Education certificate has increased by 15% from 542 in 2016 to 623 in 2017. CTE success rates remained steady at 70% for the Spring 2017 and Fall 2017terms. Three-Year Summary: Since 2014, the District has noticeably increased the volume of CTE awards by 36% and the number of students who receive them by 35%.
22 2018 Annual and End‐of‐Cycle Reports on the Master Plan
Action for District Objective #2
Responsible Party Progress
2.4.1 Ensure curriculum is aligned within Career Technical Education discipline and schedule courses to maximize students’ opportunities to complete CTE program sequences in a timely manner.
Dean, Career Technical Education, Provosts, Curriculum Committee, Academic Senate
2015-2016: Course curricula within several Career Technical Education programs were redesigned to better align with employment and transfer expectations. The Industrial Technology sequence was updated to align with transfer to California State University, Fresno. Business and Consumer Family Studies reviewed data resulting in new times for classes, the deletion of sections, and the adding of additional sections. 2016-2017: Programs, including Information Communications Technology and Drafting, have been rescheduled to accommodate concurrently enrolled high school students. The District is currently collaborating with VUSD to engage a regional Automotive Advisory Committee to maximize pathways development and curricular relevancy. Faculty and administration have consulted with industry partners to inform curricular and instructional needs. 2017-2018: Course curricula within several Career Technical Education programs were redesigned to better align with employment and transfer
End of Cycle: Over the past three years, several CTE programs have reevaluated and modified course schedules to be student-friendly. This includes ensuring students can complete in an expeditious manner, arranging courses to accommodate common student work schedules, and sequencing to provide logical progression. This process has been institutionalized and the District will continue work to align CTE programs and schedules so that students can complete the program sequences in a timely manner.
23 2018 Annual and End‐of‐Cycle Reports on the Master Plan
expectations. Welding is re-evaluating the scheduling of courses to better align to industry expectations and maximize opportunities for students to complete a certificate in a single semester. The Industrial Automation curriculum was developed by employers, in collaboration with faculty, to ensure absolute alignment with workforce expectations. Some CTE programs have modified course schedules to accommodate working students. Agriculture programs continue to work with the Course Identification Numbering System (CID) process and coordinate with regional universities to ensure transfer alignment.
2.4.2 Design and implement proven best practices for increased CTE success and completion (linked learning pathways, embedded basic skills).
Dean, Career Technical Education, Provosts
2015-2016: Faculty professional development workshops have been provided and more are planned. Several best practices have been implemented in Automotive Technology, Industrial Maintenance, and Welding. 2016-2017: Contextualized math instruction was embedded in relevant Career Technical Education (CTE) courses. Summer math bridge orientation for Industry and Technical (ITEC) was implemented in Summer 2016. Intrusive career and academic advising by the CTE Student Success Coordinator focuses
End of Cycle: Several CTE programs have incorporated contextualized learning and embedded soft skills into their courses. Collaboration between Student Success and Career Development Coordinators resulted in career and soft skills workshops. Not every CTE program strategically researches and integrates best practices into instruction. Additionally, there is much room for improvement in Career Development, Student Success support, and data-informed modification.
24 2018 Annual and End‐of‐Cycle Reports on the Master Plan
on identifying and engaging high-risk students. Multiple career development, study skills, and essential skills workshops have been offered. Three apprenticeship programs were developed and the District is evaluating additional apprenticeship opportunities with local businesses. 2017-2018: Several COS CTE faculty have participated in the New World of Work training which seeks to embed and contextualize soft skills (basic workplace skills) into CTE courses.
2.4.3 Develop and implement Career Development/ College Prep Program (non- credit) Certificates.
Vice President, Academic Services
2015-2016: Research on how to implement Career Development and College Preparation (CDCP) with Adult Education Consortium funding is ongoing. The Career Development and College Preparation certificate developed for Rehabilitation Aide will be offered Summer 2016. 2016-2017: Research on implementing Career Development and College Preparation (CDCP) with Adult Education Consortium funding is in process. The Physical Therapy Aide Career Development and College Preparedness (CDCP) certificate has been approved and the program will
End of Cycle: Some progress has been made in this area. The Welding program at Visalia Adult School is being planned. Most importantly, this demonstrates viability for future CDCP opportunities.
25 2018 Annual and End‐of‐Cycle Reports on the Master Plan
be offered in summer 2017. 2017-2018: The COS Welding program began the curriculum development and approval process for a CDCP in Welding to be offered at Visalia Adult School. Implementation is anticipated for Fall 2019.
2.4.4 Implement the Sequoias consortium plan for alignment of adult education CTE programs within the region.
Superintendent/ President, Vice President, Academic Services, and Dean, Career Technical Education
2015-2016: We are currently in year one of a three-year grant. The Superintendent continues to co-chair Sequoias Adult Education Consortium. The Vice President of Academic Services co-chairs the task force, and the Career Technical Education Dean serves on the task force and Sequoias Adult Education Consortium. Faculty have been instrumental in the design of sector pathways. Memorandums of Understanding (MOUs) are being developed with the Training Resource Center for curriculum development and implementation of Career Technical Education Basic Skills prep courses and vocational English as a Second Language training. An English as a Second Language counselor was hired in April of 2016. 2016-2017: The Training Resource Center offered Vocational English as
End of Cycle: Implementation and institutionalization of the Sequoias Consortium Plan resulted in pathway development, ESL curriculum alignment, and increased cross-training opportunities for staff. Alignment is ongoing; particularly in non-credit Welding.
26 2018 Annual and End‐of‐Cycle Reports on the Master Plan
a Second Language (VESL) courses and provided technical assistance for aligning placement assessments between the adult schools and College of the Sequoias. A dedicated COS English as a Second Language (ESL) counselor provides strategic support for ESL students. COS staff and administration provide leadership and technical support to adult school programs. Welding and health programs at COS have mapped curriculum and provided support to relevant programs at area adult schools. 2017-2018: COS and the Visalia Adult School are currently working to align Welding curriculum and offer non-credit Welding courses at Visalia Adult School. ESL & VESL (Vocational English as a Second Language) offerings continue to be coordinated across the consortium.
2.4.5 Map high school Linked Learning Pathways programs to COS courses/ programs.
Dean, Career Technical Education
2015-2016: The District is collaborating with Innovate Tulare Kings / Tulare County Office of Education / College and Career Collaborative on Industry Sector Summits to facilitate pathways. The District created grant funded positions (CTE High School Liaison, CTE Grant Manager, and CTE Grant Specialist) to facilitate articulation and Dual Enrollment
End of Cycle: Several CTE programs have participated in pathway mapping summits, dual enrollment discussions, and ancillary events that help connect the District to high school programs and increase student transition. This includes high school and Adult School program mappings.
27 2018 Annual and End‐of‐Cycle Reports on the Master Plan
initiatives, and to assist development of career pathways with local high schools. Faculty and staff are actively participating in pathway training and advisory committees. 2016-2017: The District participated in sector summits held in Education, Information Communication Technology, Culinary and Hospitality to coordinate District programs with high school pathways. The District collected and disseminated pathways for service area high schools to promote strategic Dual Enrollment options. Pathways have been partially mapped in ICT/Digital Media, Business, Health, and Animal Science. 2017-2018: COS continues to participate in Sector Summits. The President, CTE Dean, and several staff provide leadership and participate in Innovate Tulare Kings pathways alignment efforts. Dual Enrollment offerings increased across CTE and non-CTE areas with more offerings in the planning stages.
2.4.6 Assess the District’s progress of all actions on the objective.
Institutional Planning and Effectiveness Committee
2015-2016: In action 2.4.1, some aspects of alignment have occurred and will continue in 2016-17. Action 2.4.3 is in progress and more certificates will be developed.
End of Cycle: Over the three-year cycle, progress has been made including CTE curriculum alignment; modified course schedules; an increase in course success rates, the number of
28 2018 Annual and End‐of‐Cycle Reports on the Master Plan
Action 2.4.4 is moving ahead as planned. While much is being done for action 2.4.5, it was reported that the action itself might be difficult to fully implement. The action may need to be revised to make it more realistic. 2016-2017: Some aspects of alignment have occurred in 2.4.1 and will continue in 2018. Progress has been made in 2.4.2 and will continue. The District has laid groundwork for 2.4.3 so that implementation may begin. Progress has been made in 2.4.4, particularly as the Sequoias Consortium has led to new services for several local high schools. Some mapping has occurred for 2.4.5; however, more work still needs to be done. 2017-2018: Some aspects of alignment have occurred in action 2.4.1 and will continue in 2018. Progress has been made in action 2.4.2 and will continue. The District continues groundwork for action 2.4.3 so that implementation may begin in Fall of 2019. Progress has been made in action 2.4.4, particularly as the Sequoias Consortium is currently working to align the Welding curriculum at Visalia Adult School. Some mapping has occurred for action
students earning a CTE degree or certificate, and the number of CTE degrees and certificates awarded. With the institutionalization of these actions, continued improvements are expected.
29 2018 Annual and End‐of‐Cycle Reports on the Master Plan
2.4.5; however, more work still needs to be done.
30 2018 Annual and End‐of‐Cycle Reports on the Master Plan
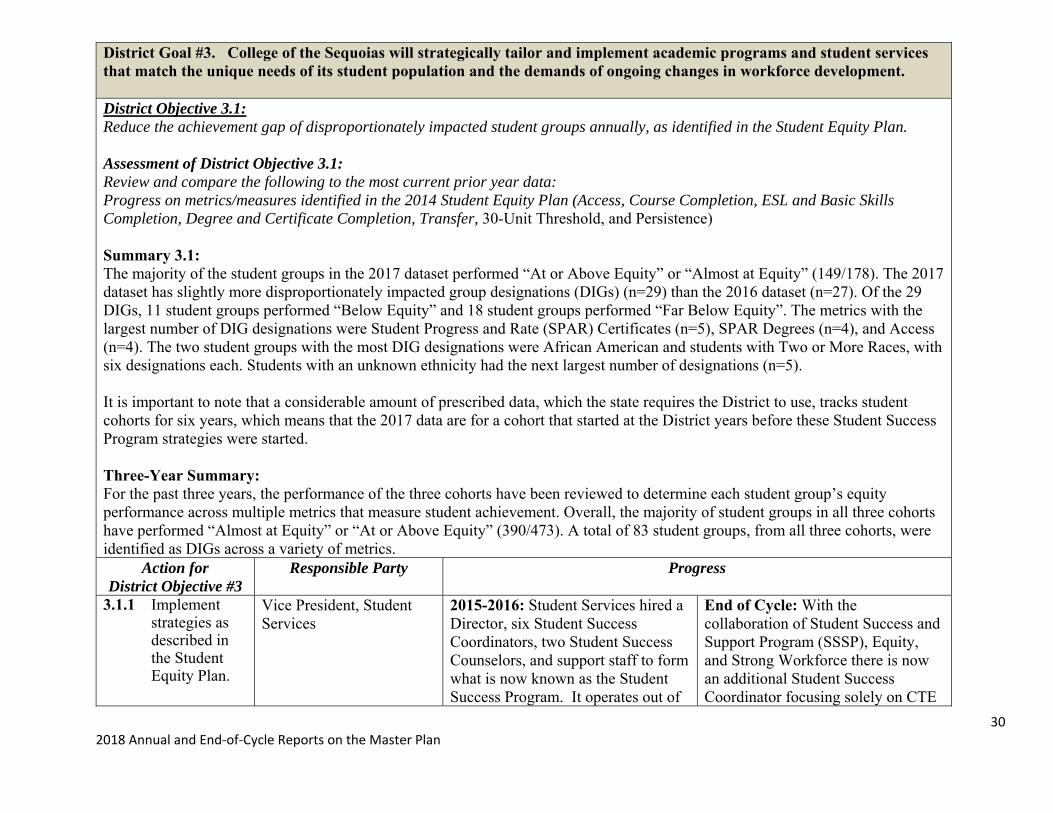
District Goal #3. College of the Sequoias will strategically tailor and implement academic programs and student services that match the unique needs of its student population and the demands of ongoing changes in workforce development. District Objective 3.1: Reduce the achievement gap of disproportionately impacted student groups annually, as identified in the Student Equity Plan. Assessment of District Objective 3.1: Review and compare the following to the most current prior year data: Progress on metrics/measures identified in the 2014 Student Equity Plan (Access, Course Completion, ESL and Basic Skills Completion, Degree and Certificate Completion, Transfer, 30-Unit Threshold, and Persistence) Summary 3.1: The majority of the student groups in the 2017 dataset performed “At or Above Equity” or “Almost at Equity” (149/178). The 2017 dataset has slightly more disproportionately impacted group designations (DIGs) (n=29) than the 2016 dataset (n=27). Of the 29 DIGs, 11 student groups performed “Below Equity” and 18 student groups performed “Far Below Equity”. The metrics with the largest number of DIG designations were Student Progress and Rate (SPAR) Certificates (n=5), SPAR Degrees (n=4), and Access (n=4). The two student groups with the most DIG designations were African American and students with Two or More Races, with six designations each. Students with an unknown ethnicity had the next largest number of designations (n=5). It is important to note that a considerable amount of prescribed data, which the state requires the District to use, tracks student cohorts for six years, which means that the 2017 data are for a cohort that started at the District years before these Student Success Program strategies were started. Three-Year Summary: For the past three years, the performance of the three cohorts have been reviewed to determine each student group’s equity performance across multiple metrics that measure student achievement. Overall, the majority of student groups in all three cohorts have performed “Almost at Equity” or “At or Above Equity” (390/473). A total of 83 student groups, from all three cohorts, were identified as DIGs across a variety of metrics.
Action for District Objective #3
Responsible Party Progress
3.1.1 Implement strategies as described in the Student Equity Plan.
Vice President, Student Services
2015-2016: Student Services hired a Director, six Student Success Coordinators, two Student Success Counselors, and support staff to form what is now known as the Student Success Program. It operates out of
End of Cycle: With the collaboration of Student Success and Support Program (SSSP), Equity, and Strong Workforce there is now an additional Student Success Coordinator focusing solely on CTE
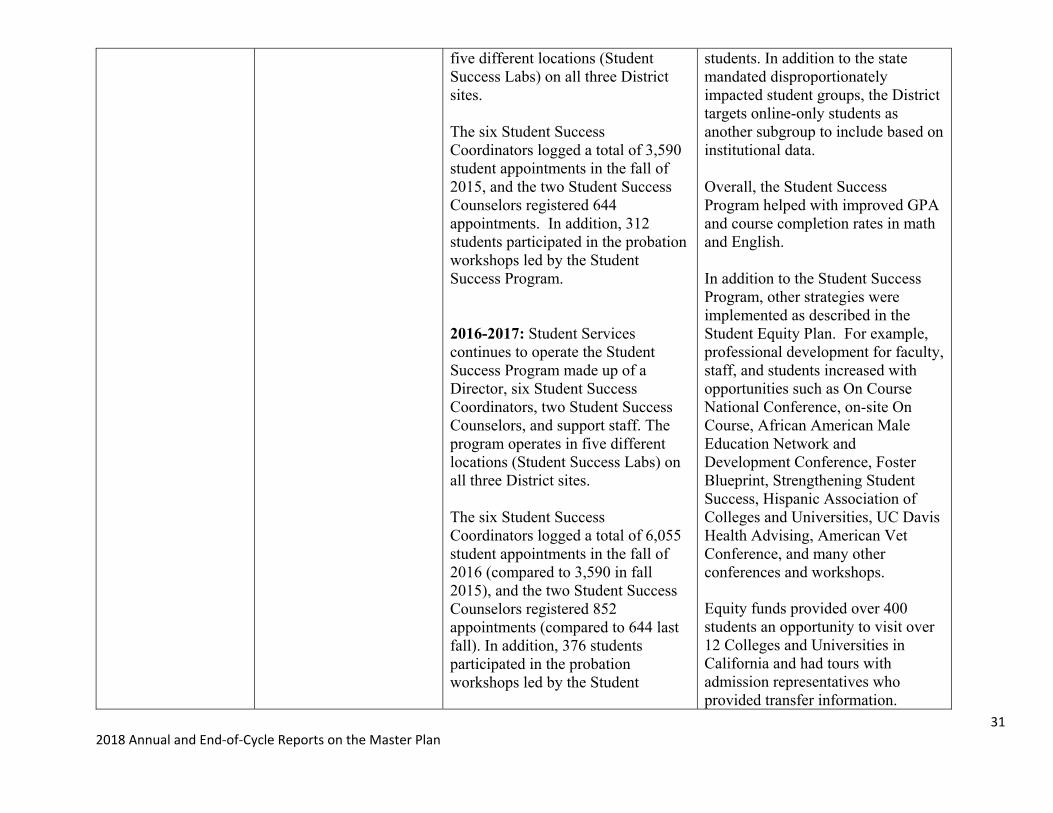
31 2018 Annual and End‐of‐Cycle Reports on the Master Plan
five different locations (Student Success Labs) on all three District sites. The six Student Success Coordinators logged a total of 3,590 student appointments in the fall of 2015, and the two Student Success Counselors registered 644 appointments. In addition, 312 students participated in the probation workshops led by the Student Success Program. 2016-2017: Student Services continues to operate the Student Success Program made up of a Director, six Student Success Coordinators, two Student Success Counselors, and support staff. The program operates in five different locations (Student Success Labs) on all three District sites. The six Student Success Coordinators logged a total of 6,055 student appointments in the fall of 2016 (compared to 3,590 in fall 2015), and the two Student Success Counselors registered 852 appointments (compared to 644 last fall). In addition, 376 students participated in the probation workshops led by the Student
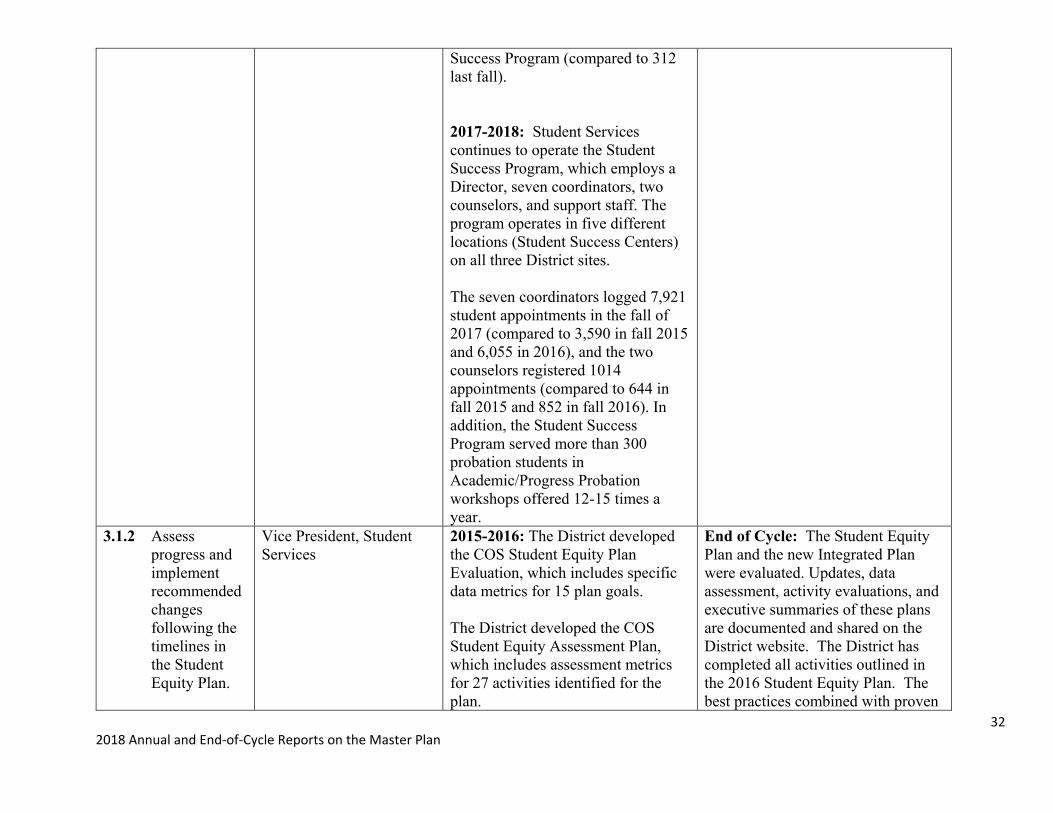
students. In addition to the state mandated disproportionately impacted student groups, the District targets online-only students as another subgroup to include based on institutional data. Overall, the Student Success Program helped with improved GPA and course completion rates in math and English. In addition to the Student Success Program, other strategies were implemented as described in the Student Equity Plan. For example, professional development for faculty, staff, and students increased with opportunities such as On Course National Conference, on-site On Course, African American Male Education Network and Development Conference, Foster Blueprint, Strengthening Student Success, Hispanic Association of Colleges and Universities, UC Davis Health Advising, American Vet Conference, and many other conferences and workshops. Equity funds provided over 400 students an opportunity to visit over 12 Colleges and Universities in California and had tours with admission representatives who provided transfer information.
32 2018 Annual and End‐of‐Cycle Reports on the Master Plan
Success Program (compared to 312 last fall). 2017-2018: Student Services continues to operate the Student Success Program, which employs a Director, seven coordinators, two counselors, and support staff. The program operates in five different locations (Student Success Centers) on all three District sites. The seven coordinators logged 7,921 student appointments in the fall of 2017 (compared to 3,590 in fall 2015 and 6,055 in 2016), and the two counselors registered 1014 appointments (compared to 644 in fall 2015 and 852 in fall 2016). In addition, the Student Success Program served more than 300 probation students in Academic/Progress Probation workshops offered 12-15 times a year.
3.1.2 Assess progress and implement recommended changes following the timelines in the Student Equity Plan.
Vice President, Student Services
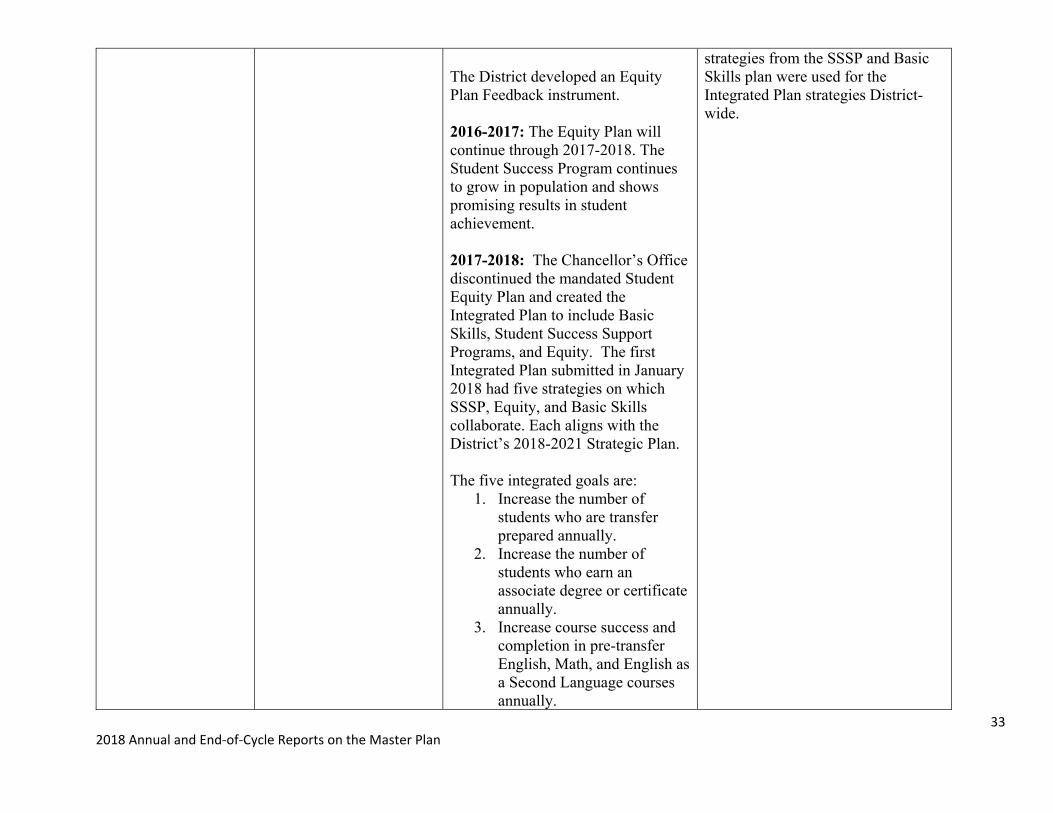
2015-2016: The District developed the COS Student Equity Plan Evaluation, which includes specific data metrics for 15 plan goals. The District developed the COS Student Equity Assessment Plan, which includes assessment metrics for 27 activities identified for the plan.
End of Cycle: The Student Equity Plan and the new Integrated Plan were evaluated. Updates, data assessment, activity evaluations, and executive summaries of these plans are documented and shared on the District website. The District has completed all activities outlined in the 2016 Student Equity Plan. The best practices combined with proven
33 2018 Annual and End‐of‐Cycle Reports on the Master Plan
The District developed an Equity Plan Feedback instrument. 2016-2017: The Equity Plan will continue through 2017-2018. The Student Success Program continues to grow in population and shows promising results in student achievement. 2017-2018: The Chancellor’s Office discontinued the mandated Student Equity Plan and created the Integrated Plan to include Basic Skills, Student Success Support Programs, and Equity. The first Integrated Plan submitted in January 2018 had five strategies on which SSSP, Equity, and Basic Skills collaborate. Each aligns with the District’s 2018-2021 Strategic Plan. The five integrated goals are:
1. Increase the number of students who are transfer prepared annually.
2. Increase the number of students who earn an associate degree or certificate annually.
3. Increase course success and completion in pre-transfer English, Math, and English as a Second Language courses annually.
strategies from the SSSP and Basic Skills plan were used for the Integrated Plan strategies District-wide.
34 2018 Annual and End‐of‐Cycle Reports on the Master Plan
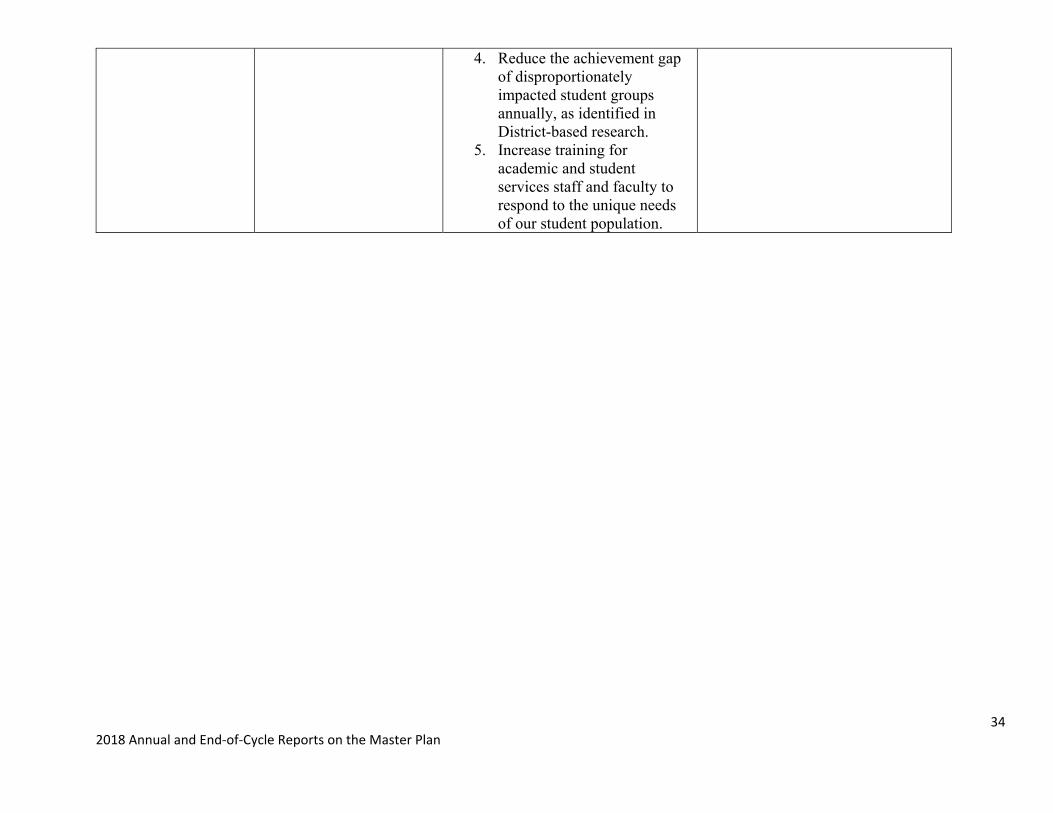
4. Reduce the achievement gap of disproportionately impacted student groups annually, as identified in District-based research.
5. Increase training for academic and student services staff and faculty to respond to the unique needs of our student population.
35 2018 Annual and End‐of‐Cycle Reports on the Master Plan
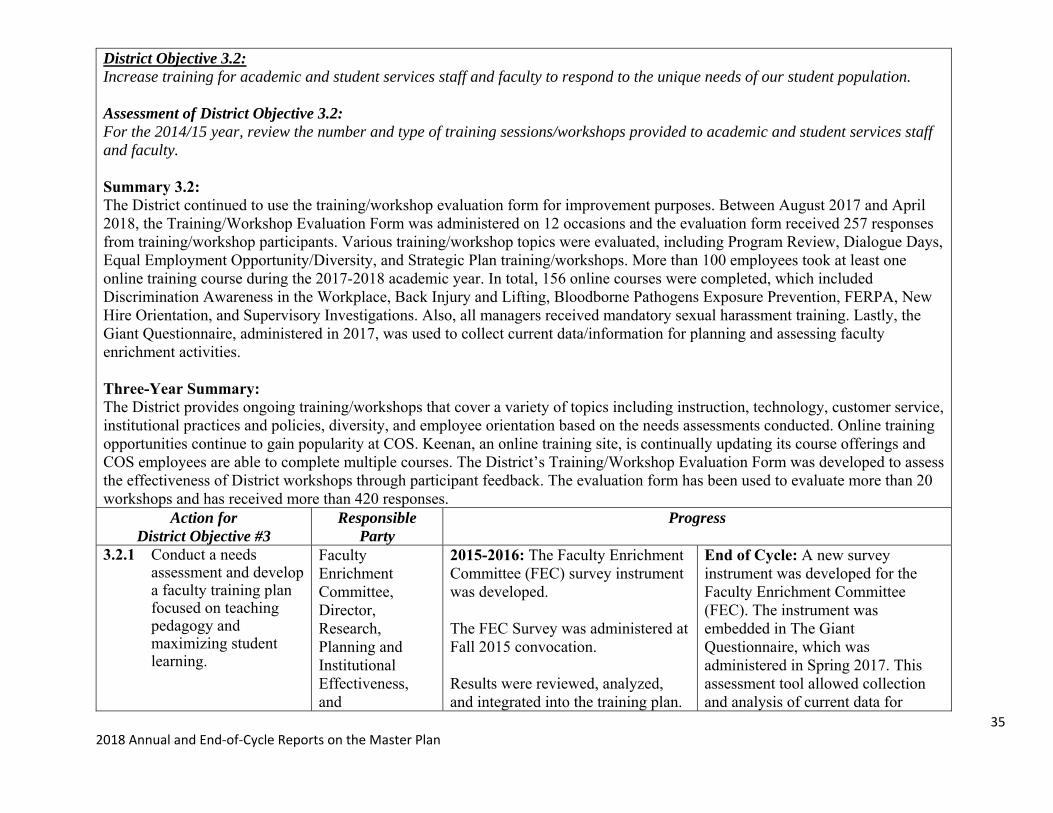
District Objective 3.2: Increase training for academic and student services staff and faculty to respond to the unique needs of our student population. Assessment of District Objective 3.2: For the 2014/15 year, review the number and type of training sessions/workshops provided to academic and student services staff and faculty. Summary 3.2: The District continued to use the training/workshop evaluation form for improvement purposes. Between August 2017 and April 2018, the Training/Workshop Evaluation Form was administered on 12 occasions and the evaluation form received 257 responses from training/workshop participants. Various training/workshop topics were evaluated, including Program Review, Dialogue Days, Equal Employment Opportunity/Diversity, and Strategic Plan training/workshops. More than 100 employees took at least one online training course during the 2017-2018 academic year. In total, 156 online courses were completed, which included Discrimination Awareness in the Workplace, Back Injury and Lifting, Bloodborne Pathogens Exposure Prevention, FERPA, New Hire Orientation, and Supervisory Investigations. Also, all managers received mandatory sexual harassment training. Lastly, the Giant Questionnaire, administered in 2017, was used to collect current data/information for planning and assessing faculty enrichment activities. Three-Year Summary: The District provides ongoing training/workshops that cover a variety of topics including instruction, technology, customer service, institutional practices and policies, diversity, and employee orientation based on the needs assessments conducted. Online training opportunities continue to gain popularity at COS. Keenan, an online training site, is continually updating its course offerings and COS employees are able to complete multiple courses. The District’s Training/Workshop Evaluation Form was developed to assess the effectiveness of District workshops through participant feedback. The evaluation form has been used to evaluate more than 20 workshops and has received more than 420 responses.
Action for District Objective #3
Responsible Party
Progress
3.2.1 Conduct a needs assessment and develop a faculty training plan focused on teaching pedagogy and maximizing student learning.
Faculty Enrichment Committee, Director, Research, Planning and Institutional Effectiveness, and
2015-2016: The Faculty Enrichment Committee (FEC) survey instrument was developed. The FEC Survey was administered at Fall 2015 convocation. Results were reviewed, analyzed, and integrated into the training plan.
End of Cycle: A new survey instrument was developed for the Faculty Enrichment Committee (FEC). The instrument was embedded in The Giant Questionnaire, which was administered in Spring 2017. This assessment tool allowed collection and analysis of current data for

36 2018 Annual and End‐of‐Cycle Reports on the Master Plan
Vice President, Academic Services
Based on faculty and curriculum survey assessments, training was provided to faculty for curriculum, outcomes/assessment, and Blackboard. 2016-2017: A new survey instrument was developed for Faculty Enrichment Committee (FEC). It is designed to collect information for planning and assessing faculty enrichment activities. The survey items are included in The Giant Questionnaire, which was administered in March 2017. 2017-2018: The Giant Questionnaire, which was administered in March 2017, collected and analyzed more current data/information for planning and assessing faculty enrichment activities.
planning and assessing faculty enrichment activities.
3.2.2 Conduct a needs assessment and develop a staff training plan focused on improved customer service to increase student retention and success.
Professional Association of Classified Employees and Senior Management
2015-2016: Based on Management Council/Dean’s Council meetings, department meetings and Administrative Services/Student Services discussions, the decision was made to provide all staff with online training in customer service, conflict management, best business practices, equity/diversity, technology issues, and student safety.
End of Cycle: The District continues to provide ongoing training and workshops that cover a variety of topics including instruction, technology, customer service, institutional practices and policies, diversity, and employee orientation based on the needs assessments conducted. Online training opportunities continue to gain popularity at COS. Keenan, an online training site, is continually updating
37 2018 Annual and End‐of‐Cycle Reports on the Master Plan
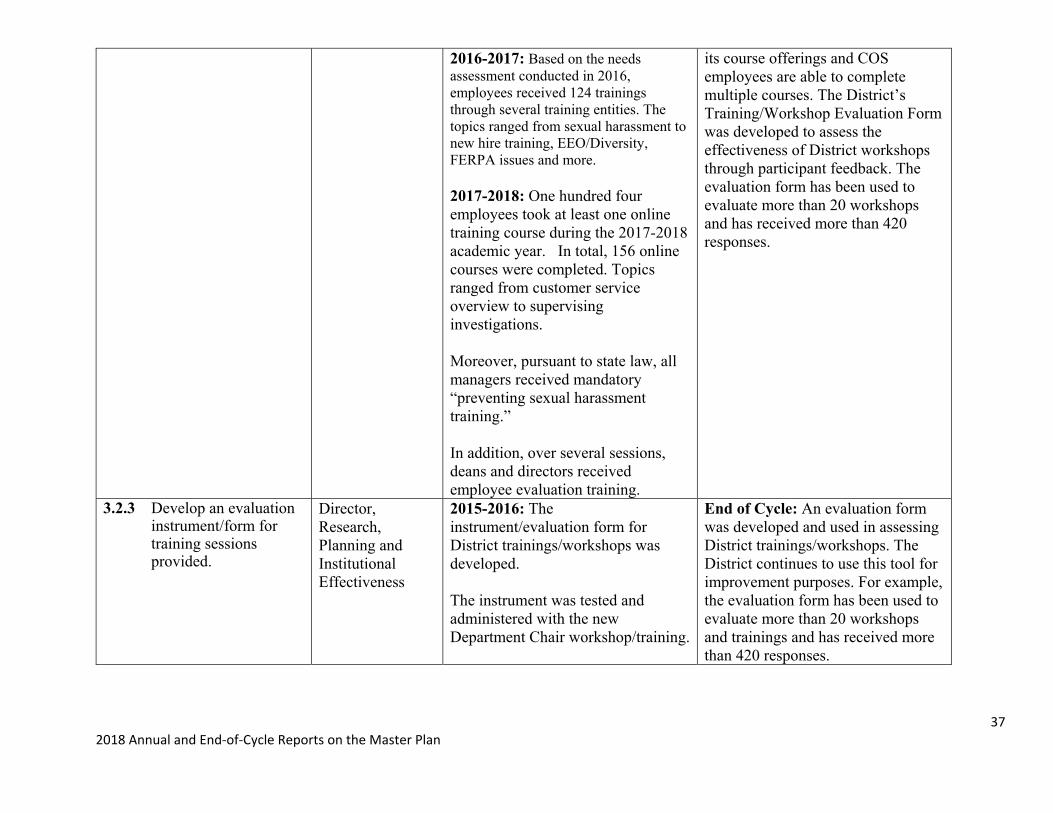
2016-2017: Based on the needs assessment conducted in 2016, employees received 124 trainings through several training entities. The topics ranged from sexual harassment to new hire training, EEO/Diversity, FERPA issues and more. 2017-2018: One hundred four employees took at least one online training course during the 2017-2018 academic year. In total, 156 online courses were completed. Topics ranged from customer service overview to supervising investigations. Moreover, pursuant to state law, all managers received mandatory “preventing sexual harassment training.” In addition, over several sessions, deans and directors received employee evaluation training.
its course offerings and COS employees are able to complete multiple courses. The District’s Training/Workshop Evaluation Form was developed to assess the effectiveness of District workshops through participant feedback. The evaluation form has been used to evaluate more than 20 workshops and has received more than 420 responses.
3.2.3 Develop an evaluation instrument/form for training sessions provided.
Director, Research, Planning and Institutional Effectiveness
2015-2016: The instrument/evaluation form for District trainings/workshops was developed. The instrument was tested and administered with the new Department Chair workshop/training.
End of Cycle: An evaluation form was developed and used in assessing District trainings/workshops. The District continues to use this tool for improvement purposes. For example, the evaluation form has been used to evaluate more than 20 workshops and trainings and has received more than 420 responses.
38 2018 Annual and End‐of‐Cycle Reports on the Master Plan
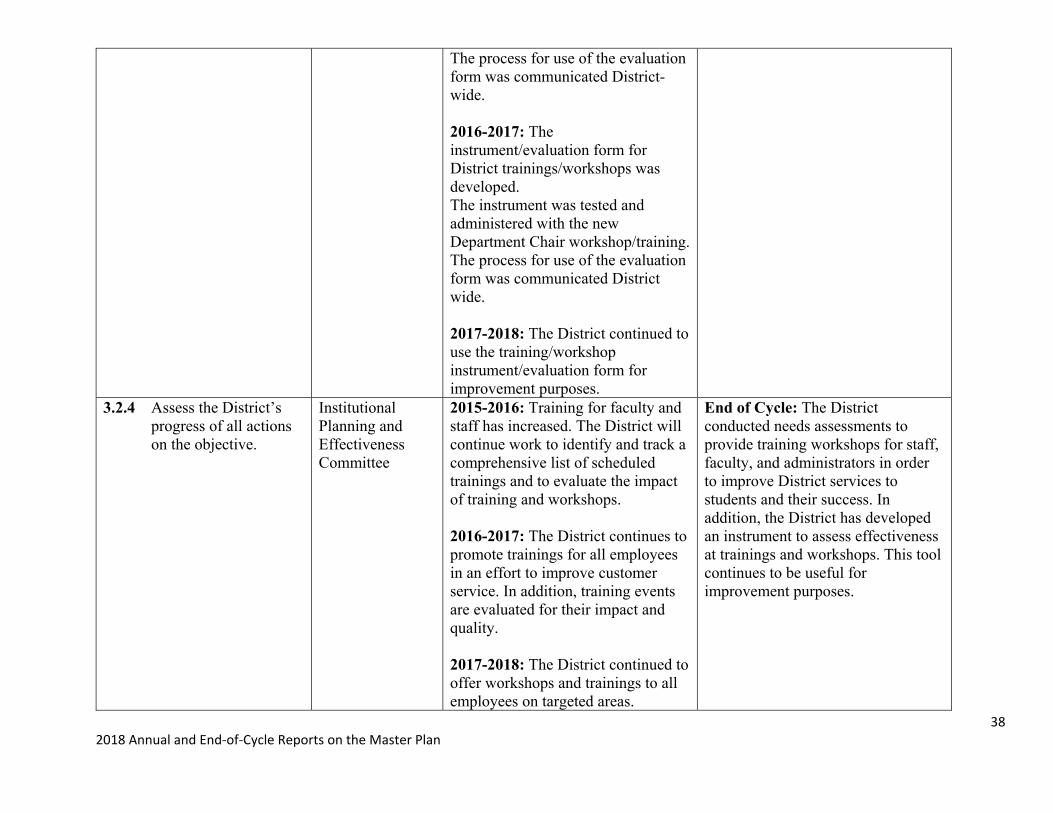
The process for use of the evaluation form was communicated District-wide. 2016-2017: The instrument/evaluation form for District trainings/workshops was developed. The instrument was tested and administered with the new Department Chair workshop/training. The process for use of the evaluation form was communicated District wide. 2017-2018: The District continued to use the training/workshop instrument/evaluation form for improvement purposes.
3.2.4 Assess the District’s progress of all actions on the objective.
Institutional Planning and Effectiveness Committee
2015-2016: Training for faculty and staff has increased. The District will continue work to identify and track a comprehensive list of scheduled trainings and to evaluate the impact of training and workshops. 2016-2017: The District continues to promote trainings for all employees in an effort to improve customer service. In addition, training events are evaluated for their impact and quality. 2017-2018: The District continued to offer workshops and trainings to all employees on targeted areas.
End of Cycle: The District conducted needs assessments to provide training workshops for staff, faculty, and administrators in order to improve District services to students and their success. In addition, the District has developed an instrument to assess effectiveness at trainings and workshops. This tool continues to be useful for improvement purposes.
39 2018 Annual and End‐of‐Cycle Reports on the Master Plan
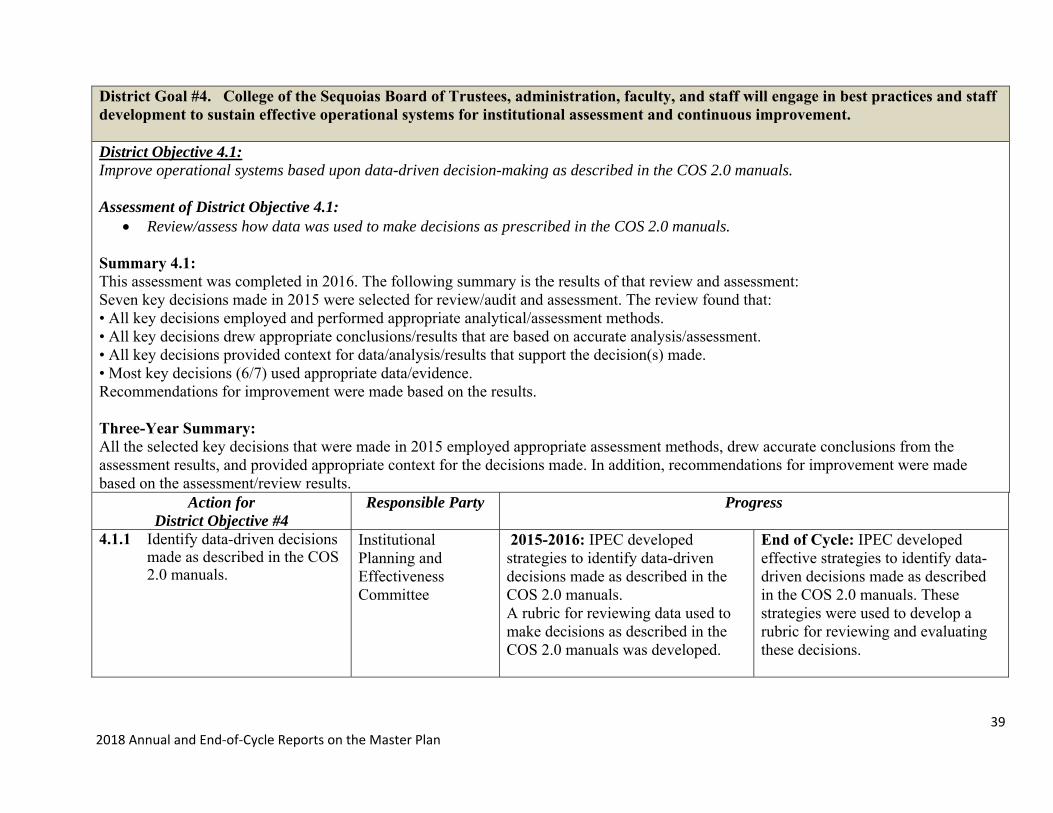
District Goal #4. College of the Sequoias Board of Trustees, administration, faculty, and staff will engage in best practices and staff development to sustain effective operational systems for institutional assessment and continuous improvement. District Objective 4.1: Improve operational systems based upon data-driven decision-making as described in the COS 2.0 manuals. Assessment of District Objective 4.1:
Review/assess how data was used to make decisions as prescribed in the COS 2.0 manuals. Summary 4.1: This assessment was completed in 2016. The following summary is the results of that review and assessment: Seven key decisions made in 2015 were selected for review/audit and assessment. The review found that: • All key decisions employed and performed appropriate analytical/assessment methods. • All key decisions drew appropriate conclusions/results that are based on accurate analysis/assessment. • All key decisions provided context for data/analysis/results that support the decision(s) made. • Most key decisions (6/7) used appropriate data/evidence. Recommendations for improvement were made based on the results. Three-Year Summary: All the selected key decisions that were made in 2015 employed appropriate assessment methods, drew accurate conclusions from the assessment results, and provided appropriate context for the decisions made. In addition, recommendations for improvement were made based on the assessment/review results.
Action for District Objective #4
Responsible Party Progress
4.1.1 Identify data-driven decisions made as described in the COS 2.0 manuals.
Institutional Planning and Effectiveness Committee
2015-2016: IPEC developed strategies to identify data-driven decisions made as described in the COS 2.0 manuals. A rubric for reviewing data used to make decisions as described in the COS 2.0 manuals was developed.
End of Cycle: IPEC developed effective strategies to identify data-driven decisions made as described in the COS 2.0 manuals. These strategies were used to develop a rubric for reviewing and evaluating these decisions.
40 2018 Annual and End‐of‐Cycle Reports on the Master Plan
IPEC utilized the rubric to evaluate the data driven decisions. 2016-2017: IPEC developed strategies to identify data-driven decisions made as described in the COS 2.0 manuals. A rubric for reviewing data used to make decisions as described in the COS 2.0 manuals was developed. IPEC utilized the rubric to evaluate the data driven decisions. 2017-2018: This action was completed in 2016.
4.1.2 Design, develop and provide training on continuous improvement methods, tools, and techniques including the availability and use of data.
Senior Management, Faculty Enrichment Committee, Professional Association of Classified Employees, and Research Office
2015-2016: A new Extended Information System (EIS) Course Success Report, which displays student success rates, withdrawal rates and grade counts by location, instructional method, and CRN, has been developed. User training/workshops will be scheduled. A Management Guide to Approving Data/Research Requests has been developed. The guidelines were discussed with the Dean’s Council. Two training/workshops on availability and effective uses of data were conducted during Fall 2015. A Management Council initiative for 2015-2016 is a series of training in
End of Cycle: The Research Office provided training and consultation on research, data and assessment services to District faculty and staff. In addition, guidelines on effective data requests and conducting surveys and research were developed, presented and disseminated District-wide.
41 2018 Annual and End‐of‐Cycle Reports on the Master Plan
best practices for internal communications and problem solving. The District’s Data/Research Request Form and its workflow system have been updated and improved. The new form has been launched and is in use. 2016-2017: The Research Office provided consultation on research, data and assessment services to District faculty and staff. The Research Office produced, presented and disseminated the guidelines on effective data requests and conducting surveys and research. 2017-2018: The Research Office provided consultation on research, data and assessment services to District faculty and staff.
4.1.3 Assess the District’s progress of all actions on the objective.
Institutional Planning and Effectiveness Committee
2015-2016: Both actions show significant progress towards reaching the objective. Most decisions reviewed used appropriate data/evidence. Sustainability is assured by following the COS 2.0 manuals. Trainings were provided to enhance District-wide focus on continuing improvement and use of data.
End of Cycle: Both actions were completed. A rubric was designed to review data used to make decisions and most decisions reviewed used appropriate date/evidence. Trainings were given on availability and effective use of data. In addition, the surveys administered after the trainings are utilized to enhance future trainings.
42 2018 Annual and End‐of‐Cycle Reports on the Master Plan
2016-2017: Trainings were provided to enhance District-wide focus on continuing improvement and use of data. The results of the surveys administered after the trainings will be utilized to enhance future trainings. 2017-2018: Training/consultation on research data and assessment were provided to District faculty and staff.
43 2018 Annual and End‐of‐Cycle Reports on the Master Plan
District Objective 4.2: Improve the efficiency, effectiveness and communication of human, physical, technological, and financial resources to advance the District Mission. Assessment of District Objective 4.2:
Review and assess the quality of Service Area Outcomes that were established to advance the District’s mission. Summary 4.2: This assessment was completed in 2016. The following summary is the results of that review. Four Service Area Outcomes (SAOs) from four key administrative departments were selected for review/audit and assessment. The review found that: • Most SAOs were specific (3/4), measureable (3/4), and time-bound (3/4). • All SAOs were achievable and relevant. Recommendations for improvement were made based on the results. Three-Year Summary: The four Service Area Outcomes that were selected from key administrative departments for review were found to be achievable and relevant to the District mission and goals. In addition, recommendations for improvement were made based on the review results.
Action for District Objective #4
Responsible Party
Progress
4.2.1 Conduct a needs assessment to identify operational areas for improvement.
Vice President, Administrative Services and Dean of Human Resources
2015-2016: In the spring of 2015, a Student Satisfaction Survey was conducted identifying operational areas of improvement. In addition, operational assessments of needs were conducted within the respective departments to further identify areas for improvement. 2016-2017: This action was completed in 2015-2016. 2017-2018: This action was completed in 2015-2016.
End of Cycle: Needs assessments were completed in 2015-16. These needs assessments were the primary focus of the three-year strategic plan action for improving the efficiency and effectiveness of physical, technological, and financial resources.
4.2.2 Develop Service Area Outcomes based on the
Vice President, 2015-2016: Technology Services continues to enhance wireless access and connectivity
End of Cycle: The District service areas of Human Resources, Fiscal
44 2018 Annual and End‐of‐Cycle Reports on the Master Plan
operational needs assessment.
Administrative Services and Dean of Human Resources
in the common areas and classrooms on all campuses. Facilities plans to create new campus signage to improve wayfinding and building identification. Student Senate club members and faculty advisors will be trained to follow the District’s cash control and fundraising procedures. Student and staff awareness of Food Service offerings will be increased through the use of District information media, campus advertising, and social media. 2016-2017: The 2017 Student Satisfaction Survey and the Giant Questionnaire were administered to all faculty, staff, and students to collect data based on operational needs. This data will be used to establish Service Area Outcomes. 2017-2018: Specific Service Area Outcomes were developed in each administrative service area in 2015-16, and have been carried over each year since, to ensure completion.
Services, Technology Services, and Facilities continue to focus annually on Service Area Outcomes to further the efficiency and effectiveness of each department. These initial SAOs developed as a result of the 2015-16 needs assessments were an instrumental part of this continuing improvement in efficiency and effectiveness.
4.2.3 Implement strategies as documented in service area outcomes.
Vice President, Administrative Services and Dean of Human Resources
2015-2016: An outside consulting firm will assist the District in addressing technology needs in Fall 2016, and implementation of corrective actions will follow. Building signs on the Visalia campus will be in place in 2016-2017. The monument
End of Cycle: The strategies implemented in response to this Strategic Plan Objective and related actions have furthered the efficiency and effectiveness of each department.

45 2018 Annual and End‐of‐Cycle Reports on the Master Plan
directory sign on the Visalia campus will be installed in 2016-2017. The outlying wayfinding signs on the Visalia campus and the directories at Hanford and Tulare are anticipated to be placed in the Spring or Fall of 2017. Fiscal Services administrators have met with Student Senate club representatives and new faculty club advisors to train parties in cash control protocols. Minimal advertising has taken place in Food Services to date. The department is awaiting the hiring of a new Food Services Manager in Summer 2016. 2016-2017: Results from the Service Area Outcomes (SAO) will be used to create strategies to improve service area processes. For example, wireless access and availability was increased based on a survey administered on the Visalia and Hanford campus as part of the SAO process. 2017-2018: Results from Service Area Outcomes (SAO) are used to create strategies to improve service area processes. For example, Fiscal Services has refined cash control procedures and trainings, and has implemented scheduled trainings.se
4.2.4 Assess the District’s progress of all actions on the objective.
Institutional Planning and Effectiveness Committee
2015-2016: The District completed the first action and made progress towards completion on the remaining actions. Most of the Service Area Outcomes reviewed were specific, measurable, achievable,
End of Cycle: All actions are complete and the Service Area Outcome cycle has become institutionalized at College of the Sequoias.
46 2018 Annual and End‐of‐Cycle Reports on the Master Plan
relevant, and time bound. Results of the Student Area Outcomes will be assessed and evaluated in program review upon completion. 2016-2017: The results of the 2017 Student Success Survey and Giant Questionnaire will be used to develop SAOs. The results of the SAOs will be used to improve the service area processes. 2017-2018: Conducting needs assessment, developing SAOs, and implementation and assessment of actions have been institutionalized. It greatly serves the District in the process of continuous improvement.
47 2018 Annual and End‐of‐Cycle Reports on the Master Plan
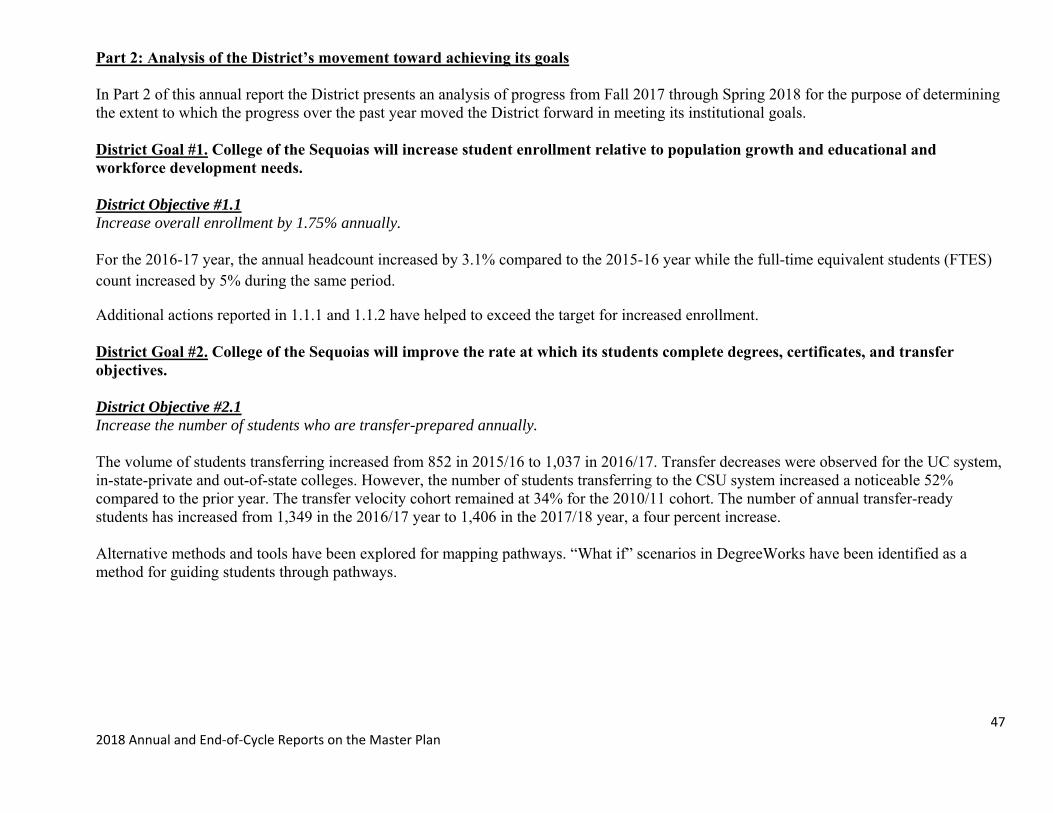
Part 2: Analysis of the District’s movement toward achieving its goals In Part 2 of this annual report the District presents an analysis of progress from Fall 2017 through Spring 2018 for the purpose of determining the extent to which the progress over the past year moved the District forward in meeting its institutional goals. District Goal #1. College of the Sequoias will increase student enrollment relative to population growth and educational and workforce development needs. District Objective #1.1 Increase overall enrollment by 1.75% annually. For the 2016-17 year, the annual headcount increased by 3.1% compared to the 2015-16 year while the full-time equivalent students (FTES) count increased by 5% during the same period.
Additional actions reported in 1.1.1 and 1.1.2 have helped to exceed the target for increased enrollment. District Goal #2. College of the Sequoias will improve the rate at which its students complete degrees, certificates, and transfer objectives. District Objective #2.1 Increase the number of students who are transfer-prepared annually. The volume of students transferring increased from 852 in 2015/16 to 1,037 in 2016/17. Transfer decreases were observed for the UC system, in-state-private and out-of-state colleges. However, the number of students transferring to the CSU system increased a noticeable 52% compared to the prior year. The transfer velocity cohort remained at 34% for the 2010/11 cohort. The number of annual transfer-ready students has increased from 1,349 in the 2016/17 year to 1,406 in the 2017/18 year, a four percent increase. Alternative methods and tools have been explored for mapping pathways. “What if” scenarios in DegreeWorks have been identified as a method for guiding students through pathways.
48 2018 Annual and End‐of‐Cycle Reports on the Master Plan
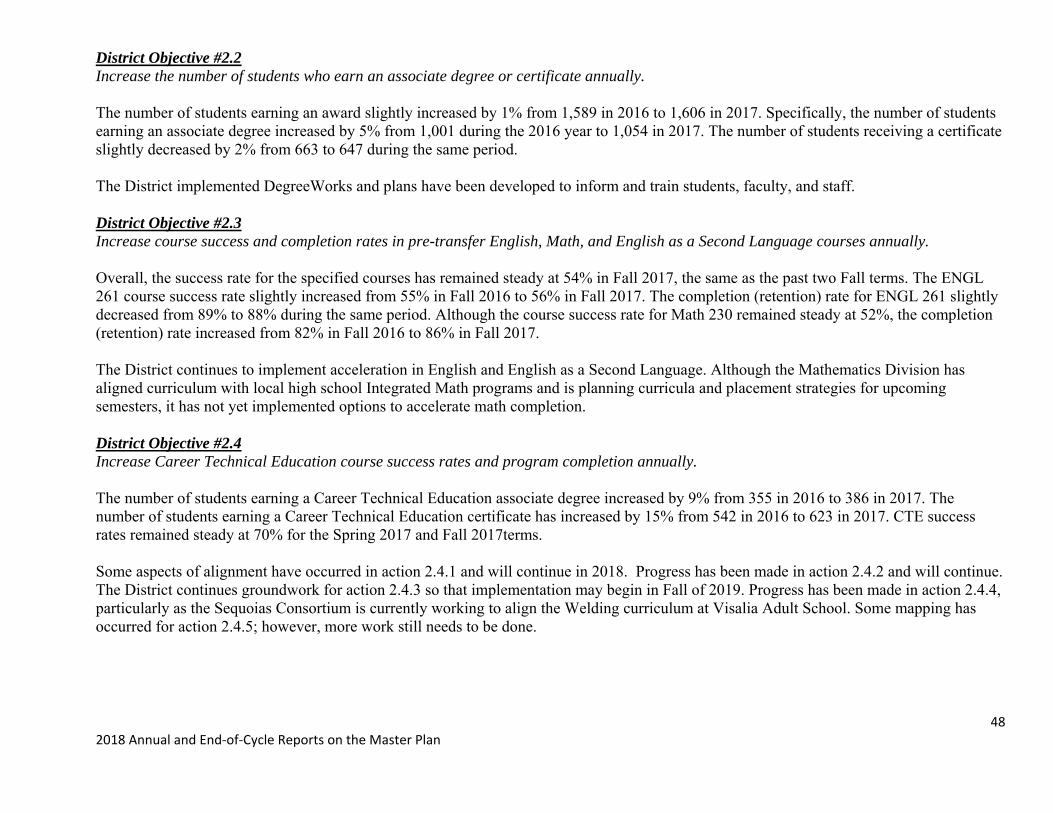
District Objective #2.2 Increase the number of students who earn an associate degree or certificate annually. The number of students earning an award slightly increased by 1% from 1,589 in 2016 to 1,606 in 2017. Specifically, the number of students earning an associate degree increased by 5% from 1,001 during the 2016 year to 1,054 in 2017. The number of students receiving a certificate slightly decreased by 2% from 663 to 647 during the same period. The District implemented DegreeWorks and plans have been developed to inform and train students, faculty, and staff. District Objective #2.3 Increase course success and completion rates in pre-transfer English, Math, and English as a Second Language courses annually. Overall, the success rate for the specified courses has remained steady at 54% in Fall 2017, the same as the past two Fall terms. The ENGL 261 course success rate slightly increased from 55% in Fall 2016 to 56% in Fall 2017. The completion (retention) rate for ENGL 261 slightly decreased from 89% to 88% during the same period. Although the course success rate for Math 230 remained steady at 52%, the completion (retention) rate increased from 82% in Fall 2016 to 86% in Fall 2017. The District continues to implement acceleration in English and English as a Second Language. Although the Mathematics Division has aligned curriculum with local high school Integrated Math programs and is planning curricula and placement strategies for upcoming semesters, it has not yet implemented options to accelerate math completion. District Objective #2.4 Increase Career Technical Education course success rates and program completion annually. The number of students earning a Career Technical Education associate degree increased by 9% from 355 in 2016 to 386 in 2017. The number of students earning a Career Technical Education certificate has increased by 15% from 542 in 2016 to 623 in 2017. CTE success rates remained steady at 70% for the Spring 2017 and Fall 2017terms. Some aspects of alignment have occurred in action 2.4.1 and will continue in 2018. Progress has been made in action 2.4.2 and will continue. The District continues groundwork for action 2.4.3 so that implementation may begin in Fall of 2019. Progress has been made in action 2.4.4, particularly as the Sequoias Consortium is currently working to align the Welding curriculum at Visalia Adult School. Some mapping has occurred for action 2.4.5; however, more work still needs to be done.
49 2018 Annual and End‐of‐Cycle Reports on the Master Plan
District Goal #3. College of the Sequoias will strategically tailor and implement academic programs and student services that match the unique needs of its student population and the demands of ongoing changes in workforce development. District Objective #3.1 Reduce the achievement gap of disproportionately impacted student groups annually, as identified in the Student Equity Plan. The majority of the student groups in the 2017 dataset performed “At or Above Equity” or “Almost at Equity” (149/178). The 2017 dataset has slightly more disproportionately impacted group designations (DIGs) (n=29) than the 2016 dataset (n=27). Of the 29 DIGs, 11 student groups performed “Below Equity” and 18 student groups performed “Far Below Equity”. The metrics with the largest number of DIG designations were Student Progress and Rate (SPAR) Certificates (n=5), SPAR Degrees (n=4), and Access (n=4). The two student groups with the most DIG designations were African American and students with Two or More Races, with six designations each. Students with an unknown ethnicity had the next largest number of designations (n=5).
It is important to note that a considerable amount of prescribed data, which the state requires the District to use, tracks student cohorts for six years, which means that the 2017 data are for a cohort that started at the District years before these Student Success Program strategies were started. The Chancellor’s Office discontinued the mandated Student Equity Plan and created the Integrated Plan to include Basic Skills, Student Success Support Programs, and Equity. The first Integrated Plan submitted in January 2018 had five strategies on which SSSP, Equity, and Basic Skills collaborate. Each aligns with the District’s 2018-2021 Strategic Plan. The five integrated goals are: 1. Increase the number of students who are transfer prepared annually. 2. Increase the number of students who earn an associate degree or certificate annually. 3. Increase course success and completion in pre-transfer English, Math, and English as a Second Language courses annually. 4. Reduce the achievement gap of disproportionately impacted student groups annually, as identified in District-based research. 5. Increase training for academic and student services staff and faculty to respond to the unique needs of our student population.
50 2018 Annual and End‐of‐Cycle Reports on the Master Plan
District Objective #3.2 Increase training for academic and student services staff and faculty to respond to the unique needs of our student population. The District continued to use the training/workshop evaluation form for improvement purposes. Between August 2017 and April 2018, the Training/Workshop Evaluation Form was administered on 12 occasions and the evaluation form received 257 responses from training/workshop participants. Various training/workshop topics were evaluated, including Program Review, Dialogue Days, Equal Employment Opportunity/Diversity, and Strategic Plan training/workshops. More than 100 employees took at least one online training course during the 2017-2018 academic year. In total, 156 online courses were completed, which included Discrimination Awareness in the Workplace, Back Injury and Lifting, Bloodborne Pathogens Exposure Prevention, FERPA, New Hire Orientation, and Supervisory Investigations. Also, all managers received mandatory sexual harassment training. Lastly, the Giant Questionnaire, administered in 2017, was used to collect current data/information for planning and assessing faculty enrichment activities.
The District continued to offer workshops and trainings to all employees on targeted areas.
District Goal #4. College of the Sequoias Board of Trustees, administration, faculty, and staff will engage in best practices and staff development to sustain effective operational systems for institutional assessment and continuous improvement. District Objective #4.1 Improve operational systems based upon data driven decision-making as described in the COS 2.0 manuals. This assessment was completed in 2016. The following summary is the results of that review and assessment: Seven key decisions made in 2015 were selected for review/audit and assessment. The review found that: • All key decisions employed and performed appropriate analytical/assessment methods. • All key decisions drew appropriate conclusions/results that are based on accurate analysis/assessment. • All key decisions provided context for data/analysis/results that support the decision(s) made. • Most key decisions (6/7) used appropriate data/evidence. Recommendations for improvement were made based on the results. Training/consultation on research data and assessment were provided to District faculty and staff.
51 2018 Annual and End‐of‐Cycle Reports on the Master Plan
District Objective #4.2 Improve the efficiency, effectiveness and communication of human, physical, technological, and financial resources to advance the District Mission. This assessment was completed in 2016. The following summary is the results of that review. Four Service Area Outcomes (SAOs) from four key administrative departments were selected for review/audit and assessment. The review found that: • Most SAOs were specific (3/4), measureable (3/4), and time-bound (3/4). • All SAOs were achievable and relevant. Recommendations for improvement were made based on the results. Conducting needs assessment, developing SAOs, and implementation and assessment of actions have been institutionalized. It greatly serves the District in the process of continuous improvement.
52 2018 Annual and End‐of‐Cycle Reports on the Master Plan
Part 3: End of Cycle Assessment Results Summary In Part 3 of this End of Cycle Report the District presents an analysis of progress over the 2015-2018 planning cycle for the purpose of informing everyone in the District of the progress made in the 2015-2018 planning cycle. District Goal #1. College of the Sequoias will increase student enrollment relative to population growth and educational and workforce development needs. District Objective #1.1 Increase overall enrollment by 1.75% annually. From 2013-14 to 2016-17, the annual headcount has increased by 1,785 students (12.7%). The count of full-time equivalent students (FTES) also increased by 735 students (8.2%) for the same period. The cumulative actions implemented and institutionalized over the past three years have helped the District exceed the annual enrollment growth target of 1.75%. District Goal #2. College of the Sequoias will improve the rate at which its students complete degrees, certificates, and transfer objectives. District Objective #2.1 Increase the number of students who are transfer-prepared annually. Since 2014/15, the volume (number) of students transferring to four-year institutions has increased by 4%. During this time, transfers to the CSU campuses increased by 29% whereas transfers to the UC System decreased by 29%. In-state-private and out-of-state private colleges also experienced transfer decreases by 7% and 33%, respectively. The transfer velocity cohort rate slightly increased from 33% in 2008/09 to 34% in 2010/11. Since 2014/15, the number of students who are transfer-ready increased by 17%. The District has completed action 2.1.1. However, due to the complexities of not being able to publish flow charts, action 2.1.2 was not completed, but an alternative method has been implemented that is helpful for most students.
53 2018 Annual and End‐of‐Cycle Reports on the Master Plan
District Objective #2.2 Increase the number of students who earn an associate degree or certificate annually. Since 2014, the District has increased the volume (number) of awards earned by 20% as well as the number of students earning an award by 18.5%. Also during this period, the volume (number) of degrees and certificates awarded increased by 13% and 33%, respectively. DegreeWorks was implemented to help students and advisors navigate pathways to completion. The information campaign resulted in increased knowledge of the academic advising tool. Plans are in place to enable a course-to-course equivalency process for courses taken at other colleges to apply units and clear areas towards student programs for all student with external credits. District Objective #2.3 Increase course success and completion rates in pre-transfer English, Math, and English as a Second Language courses annually. The overall success rate for basic skills courses has exceeded the 2014-15 success rates by approximately 3% in the fall terms and 1%-3% in the spring terms. In addition, the overall completion (retention) rate for basic skills courses exceeded the 2014-15 completion (rates) by 1% in the fall terms and 2% in the spring terms. The District continues to make progress. However, due to the challenges posed by AB 705 legislation, neither actions are completed. District Objective #2.4 Increase Career Technical Education course success rates and program completion annually. Since 2014, the District has noticeably increased the volume of CTE awards by 36% and the number of students who receive them by 35%. Over the three-year cycle, progress has been made including CTE curriculum alignment; modified course schedules; an increase in course success rates, the number of students earning a CTE degree or certificate, and the number of CTE degrees and certificates awarded. With the institutionalization of these actions, continued improvements are expected.

54 2018 Annual and End‐of‐Cycle Reports on the Master Plan
District Goal #3. College of the Sequoias will strategically tailor and implement academic programs and student services that match the unique needs of its student population and the demands of ongoing changes in workforce development. District Objective #3.1 Reduce the achievement gap of disproportionately impacted student groups annually, as identified in the Student Equity Plan. For the past three years, the performance of the three cohorts have been reviewed to determine each student group’s equity performance across multiple metrics that measure student achievement. Overall, the majority of student groups in all three cohorts have performed “Almost at Equity” or “At or Above Equity” (390/473). A total of 83 student groups, from all three cohorts, were identified as DIGs across a variety of metrics. The Student Equity Plan and the new Integrated Plan were evaluated. Updates, data assessment, activity evaluations, and executive summaries of these plans are documented and shared on the District website. The District has completed all activities outlined in the 2016 Student Equity Plan. The best practices combined with proven strategies from the SSSP and Basic Skills plan were used for the Integrated Plan strategies District-wide. District Objective #3.2 Increase training for academic and student services staff and faculty to respond to the unique needs of our student population. The District provides ongoing training/workshops that cover a variety of topics including instruction, technology, customer service, institutional practices and policies, diversity, and employee orientation based on the needs assessments conducted. Online training opportunities continue to gain popularity at COS. Keenan, an online training site, is continually updating its course offerings and COS employees are able to complete multiple courses. The District’s Training/Workshop Evaluation Form was developed to assess the effectiveness of District workshops through participant feedback. The evaluation form has been used to evaluate more than 20 workshops and has received more than 420 responses. The District conducted needs assessments to provide training workshops for staff, faculty, and administrators in order to improve District services to students and their success. In addition, the District has developed an instrument to assess effectiveness at trainings and workshops. This tool continues to be useful for improvement purposes.
55 2018 Annual and End‐of‐Cycle Reports on the Master Plan
District Goal #4. College of the Sequoias Board of Trustees, administration, faculty, and staff will engage in best practices and staff development to sustain effective operational systems for institutional assessment and continuous improvement. District Objective #4.1 Improve operational systems based upon data driven decision-making as described in the COS 2.0 manuals. All the selected key decisions that were made in 2015 employed appropriate assessment methods, drew accurate conclusions from the assessment results, and provided appropriate context for the decisions made. In addition, recommendations for improvement were made based on the assessment/review results. Both actions were completed. A rubric was designed to review data used to make decisions and most decisions reviewed used appropriate date/evidence. Trainings were given on availability and effective use of data. In addition, the surveys administered after the trainings are utilized to enhance future trainings. District Objective #4.2 Improve the efficiency, effectiveness and communication of human, physical, technological, and financial resources to advance the District Mission. The four Service Area Outcomes that were selected from key administrative departments for review were found to be achievable and relevant to the District mission and goals. In addition, recommendations for improvement were made based on the review results. All actions are complete and the Service Area Outcome cycle has become institutionalized at College of the Sequoias.

Office of Research, Planning & Institutional Effectiveness
College of the Sequoias
915 S. Mooney Blvd. Visalia, CA 93277