annie louis & ani nenkova university of pennsylvania
TRANSCRIPT

Annie Louis & Ani Nenkova
University of Pennsylvania

Evaluation using system output
2
Evaluation using only the input
• Predicting when systems would do badly
• Wisdom of the crowds
- all systems‘ output make a great model
• High input-summary similarity = better summary
• Adding pseudo-models to human models
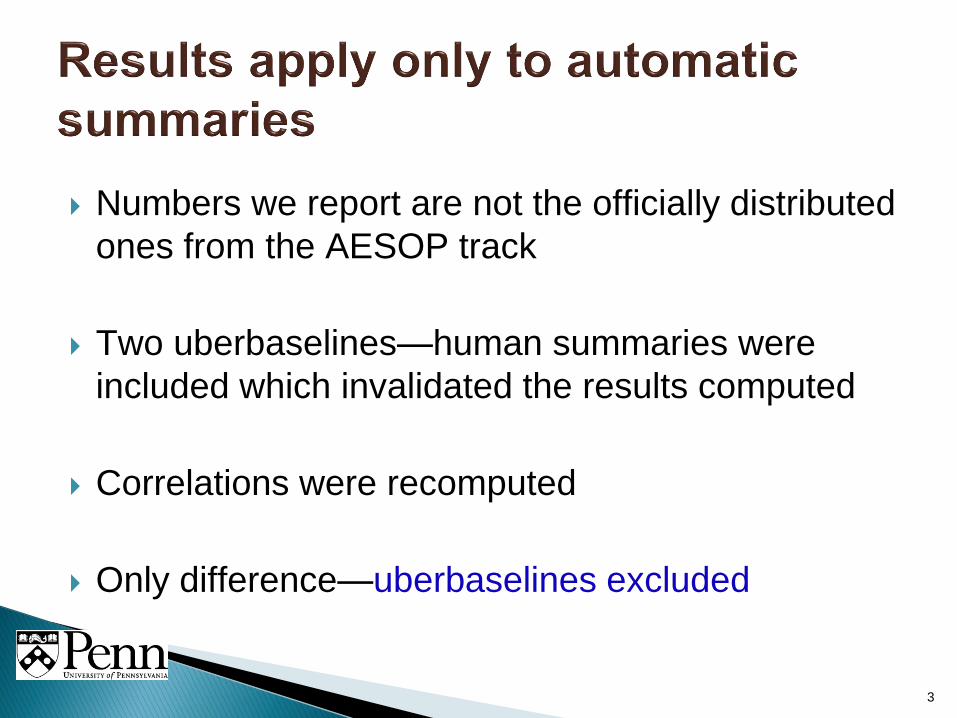
Numbers we report are not the officially distributed
ones from the AESOP track
Two uberbaselines—human summaries were
included which invalidated the results computed
Correlations were recomputed
Only difference—uberbaselines excluded
3

44 multi-document inputs
2 tasks ◦ Query focused
◦ Update
53 automatic systems◦ 52 peers, 1 automatic baseline
2 oracle systems◦ Not used in our work

Pyramid evaluation◦ Multiple human summaries – 4 models in TAC ‘09
◦ Can provide feedback about why a summary is bad
◦ Significant annotation effort
5
Responsiveness scores◦ Combined measure of content and linguistic quality
◦ Direct human judgements
◦ Scale 1 - 10
6
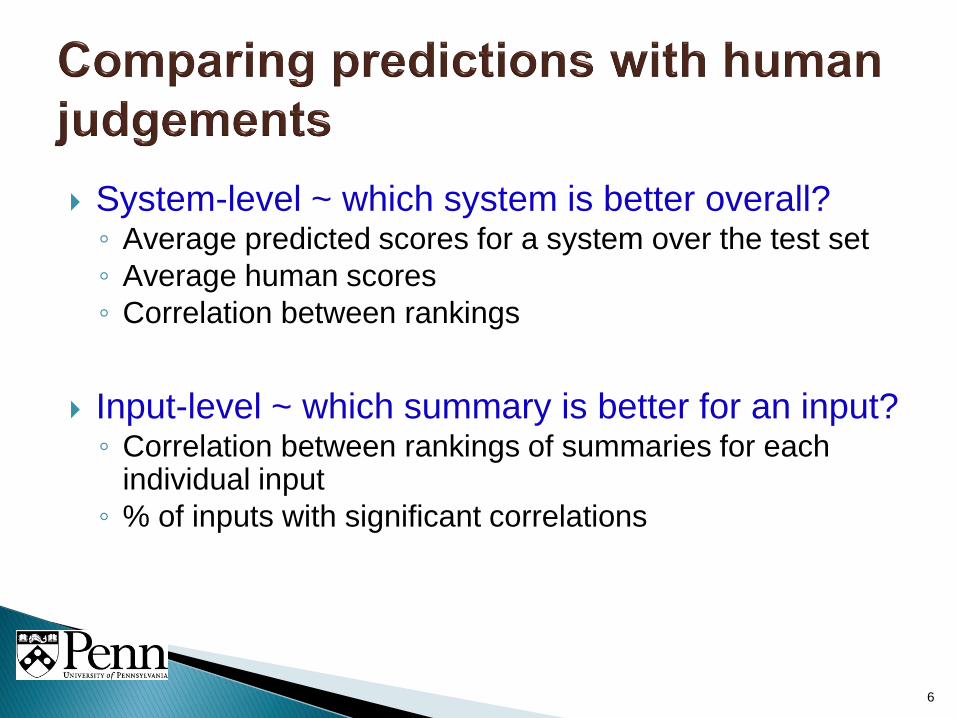
System-level ~ which system is better overall?◦ Average predicted scores for a system over the test set
◦ Average human scores
◦ Correlation between rankings
Input-level ~ which summary is better for an input?◦ Correlation between rankings of summaries for each
individual input
◦ % of inputs with significant correlations

Evaluate content selection using no human
models at all
7

Evaluation on non-standard test sets◦ With no model summaries
Likely to be a good objective function for content
selection
But many ways to measure similarity◦ KL, JS divergence
◦ Cosine similarity
◦ Topic word similarity
◦ Frequency based summary likelihood
8

Analysis of different input-summary similarity
metrics [TAC ‗08, EMNLP ‗09]
9
Top features were highly predictive of human
scores◦ Best correlation at system-level ~ 0.89
Performance varies with different features◦ Best features ~ information-theoretic measures
◦ Worst ~ frequency based metrics

Distance between 2 probability distributions◦ As average KL divergence from their mean distribution
Low divergence ~ better summary quality
10
)]||()||([)||(2
1 ASummKLAInpKLSummInpJS
SummaryandInputofondistributimeanSummInp
A ,2

A range of distributional similarity and other
features◦ KL divergence
◦ JS divergence
◦ Cosine similarity
◦ Topic signature based features
◦ Summary likelihood under a frequency based model
11

12
Pyramid Resp.
JS divergence -0.74 -0.71
Pyramid Resp.
-0.72 -0.61
Query Task Update Task
Regression 0.77 0.67 0.71 0.54
Good content can be predicted from the input
Information-theoretic features provide good
estimates
Best performance on ‘08: JS = 0.89 with pyramid scores

Average system performance on an input can be
predicted with good accuracies
13

Systems ignore properties of individual inputs◦ Very low average performance on certain inputs
14
Input difficulty can be measured by a number of
features [ACL ‗08, EMNLP ‗09]
Can predict when average system performance
will be below the mean value

15
Difficult input◦ Most systems perform poorly
◦ Low average system score
2 classes – easy, difficult◦ Above/below mean average system score
◦ Equal number of inputs in both classes

◦ Large vocabulary size
◦ Fewer descriptive words – hard to identify through
frequency and repetition
◦ Low redundancy between input documents
◦ No clear topic
16
6 significant features
Good accuracies in identifying difficult inputs
10% above baseline

17
All inputs Extremes
Query task 61.36 60.00
Update task 59.09 75.00
Properties of input predictive of average system
performance
Specialized content selection necessary to smooth
out variations
* Extremes –
10 each most
easy and difficult
Trained on DUC
2002-2004

Pseudo-models for summary evaluation
18

Another likely setup on non-standard test sets
Robust system-level rankings on large test sets
RSU4-recall Pyramid Resp.
1 model 0.92 0.80
4 models 0.92 0.79
Query Task
Pyramid Resp.
0.80 0.69
0.85 0.69
Update Task
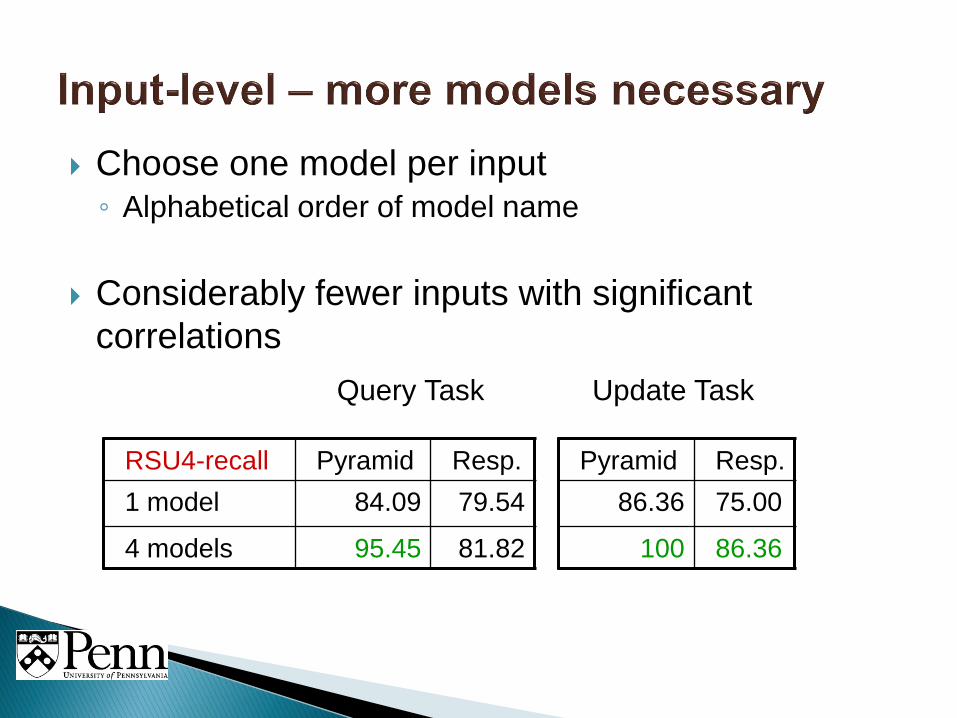
Choose one model per input ◦ Alphabetical order of model name
Considerably fewer inputs with significant
correlations
RSU4-recall Pyramid Resp.
1 model 84.09 79.54
4 models 95.45 81.82
Query Task
Pyramid Resp.
86.36 75.00
100 86.36
Update Task

Related work in Machine translation
One human reference translation
Off-the-shelf systems as pseudo-references
Features to compare other translations with
pseudo-references
Regression based scoring
Improved correlations compared to using a single
human reference

22
Pseudo-model ~ systems predicted to be best
using available model summary
Compute ranks based on the human model
Treat top systems as ―pseudo-models‖

Global◦ System level ranking using RSU4
◦ Select top 3 systems as pseudo-models
Local◦ Use top 3 systems for each input as pseudo-models
Final rankings◦ JS divergence with 1 model + 3 pseudo-models

Improvements for pyramid
Not much gains for responsiveness
On ‘08 data, local selection was better
Global sel. 93.18 79.55
Local sel. 93.18 75.00
93.18 77.27
86.36 79.55
Query Task Update Task
Pyramid Resp.
1 human 84.09 79.54
Pyramid Resp.
86.36 75.00
+ 3
pseudo

Collection of system summaries is useful for
evaluation
25

Similar to the pyramid method ◦ Common content across multiple human summaries
more important
Different systems ~ different content selection
methods◦ Agreement among systems ~ very important content
Collection of system summaries as a model ◦ Indicative of what is important?

Divergence from vocabulary distribution of system
summaries
Collective
vocabulary of all
system summaries
Vocabulary
distribution of
individual system
summary
Low divergence ~ higher scores

System-level Pyramid Resp.
System summaries -0.93 -0.81
Pyramid Resp.
-0.89 -0.79
RSU4 – 4 models 0.92 0.79 0.85 0.69
Query Task Update Task
Percentage of inputs with significant correlations◦ 77 to 90%
Collective knowledge of systems is useful◦ Possibility of system combination for summarization

Based upon system summaries◦ Pseudo-models: help only for pyramid correlations
◦ Collection of system summaries: very indicative of good
content
29
4 methods to predict summary quality that use
very little or no human input
Based upon the input◦ Input-summary similarity: highly predictive
◦ Input difficulty features: predictive of average system
performance

Automatically Evaluating Content Selection in
Summarization without Human Models◦ Annie Louis & Ani Nenkova, EMNLP 2009
Performance Confidence Estimation for Automatic
Summarization◦ Annie Louis & Ani Nenkova, ACL 2009
Summary Evaluation without Human Models◦ Annie Louis & Ani Nenkova, TAC 2008
Can you summarize this? Identifying correlates of input
difficulty for generic multi-document summarization◦ Ani Nenkova & Annie Louis, ACL-HLT 2008
30