annex: projecting progress - overseas development...
TRANSCRIPT

Annex: Projecting progressReaching the SDGs by 2030
Susan Nicolai, Chris Hoy, Tom Berliner and Thomas Aedy
September 2015
developmentprogress.org
Flagship Report
Overseas Development Institute203 Blackfriars RoadLondon SE1 8NJ
The Institute is limited by guaranteeRegistered in England and WalesRegistration no. 661818Charity no. 228248
Contact [email protected]: +44 (0)20 7922 0300
Sign up for our e-newsletterdevelopmentprogress.org/sign-our-newsletter
Follow us on Twittertwitter.com/dev_progress
DisclaimerThe views presented in this paper are those of the author(s) and do not necessarily represent the views of ODI.
© Overseas Development Institute 2015. Readers are encouraged to quote or reproduce material for non-commercial use. For online use, please link to the original resource on the Development Progress website. As copyright holder, ODI requests due acknowledgement and a copy of the publication.
Cover image: Women plough fields to plant corn, Gnoungouya Village, Guinea. © Dominic Chavez for World Bank.
Suggested citiation: Nicolai, S., Hoy, C., Berliner, T. and Aedy, T. (2015) Projecting Progress: Reaching the SDGs by 2030 London: Overseas Development Institute.

Contents
Goal 1 – End poverty in all its forms everywhere (grade B) 6
Goal 2 – End hunger, achieve food security and improved nutrition and promote sustainable agriculture (grade D) 8
Goal 3 – Ensure healthy lives and promote well-being for all at all ages (grade C) 9
Goal 4 – Ensure inclusive and equitable quality education and promote lifelong learning opportunities for all (grade C) 10
Goal 5 – Achieve gender equality and empower all women and girls (grade E) 12
Goal 6 – Ensure availability and sustainable management of water and sanitation for all (grade D) 13
Goal 7 – Ensure access to affordable, reliable, sustainable, and modern energy for all (grade D) 15
Goal 8 – Promote sustained, inclusive and sustainable economic growth, full and productive employment and decent work for all (grade B) 16
Goal 9 – Build resilient infrastructure, promote inclusive and sustainable industrialisation and foster innovation (grade E) 18
Goal 10 – Reduce inequality within and among countries (grade F) 21
Goal 11 – Make cities and human settlements inclusive, safe, resilient and sustainable (grade F) 22
Goal 12 – Ensure sustainable consumption and production patterns (grade F) 25
Goal 13 – Take urgent action to combat climate change and its impacts (grade F) 26
Goal 14 – Conserve and sustainably use the oceans, seas and marine resources for sustainable development (grade F) 28
Goal 15 – Protect, restore and promote sustainable use of terrestrial ecosystems, sustainably manage forests, combat desertification, and halt and reverse land degradation and halt biodiversity loss (grade B) 29
Goal 16 – Promote peaceful and inclusive societies for sustainable development, provide access to justice for all and build effective, accountable and inclusive institutions at all levels (grade C) 31
Goal 17 – Strengthen the means of implementation and revitalise the global partnership for sustainable development (grade C) 33
Annex to Projecting progress – reaching the SDGs by 2030 3

List of figuresAnnex figure 1: Extreme poverty headcount ratio in 2030 (%) (developing world) 7
Annex figure 2: Poverty headcount (millions) (2030) 7
Annex figure 3: Undernourishment (globally) 9
Annex figure 4: Undernourishment (regionally) 9
Annex figure 5: Maternal mortality (globally) 10
Annex figure 6: Maternal mortality (regionally) 10
Annex figure 7: Secondary completion (globally) 11
Annex figure 8: Secondary completion (regionally) 11
Annex figure 9: Prevalence of child marriage (globally) (%) 12
Annex figure 10: Prevalence of child marriage (regionally) (millions) 13
Annex figure 11: Sanitation access (globally) 14
Annex figure 12: Sanitation access (regionally) 14
Annex figure 13: Population without access to electricity (globally) 15
Annex figure 14: Population without access to electricity (regionally) 15
Annex figure 15: LDC average growth (%) 17
Annex figure 16: Growth rate in East Asia & Pacific 17
Annex figure 17: Growth rate in South Asia 18
Annex figure 18: Growth rate in sub-Saharan Africa 18
Annex figure 19: Industrial share of GDP in LDCs (%) 19
Annex figure 20: Industrial share of GDP in South Asia 19
Annex figure 21: Industrial share of GDP in East Asia & Pacific 20
Annex figure 22: Industrial share of GDP in sub-Saharan Africa 20
Annex figure 23: Industrial share of employment (globally) 20
Annex figure 24: Inequality – bottom 40% vs mean 22
Annex figure 25: Developing regions – number of slum dwellers (millions) 23
4 Development Progress Flagship Report
Annex figure 26: Sub-Saharan Africa – number of slum dwellers (millions) 24
Annex figure 27: South-East Asia – number of slum dwellers (millions) 24
Annex figure 28: Latin America and Caribbean – number of slum dwellers (millions) 24
Annex figure 29: South Asia – number of slum dwellers (millions) 24
Annex figure 30: East Asia – number of slum dwellers (millions) 25
Annex figure 31: Global total municipal solid waste generation (total tonnes/day) 26
Annex figure 32: Regional total municipal solid waste generation (tonnes/day) 26
Annex figure 33: Greenhouse gas emissions (global) 27
Annex figure 34: Greenhouse gas emissions (regional) 27
Annex figure 35: Global coral reef degradation 29
Annex figure 36: Regional coral reef degradation 29
Annex figure 37: Deforestation (global) 31
Annex figure 38: Deforestation (regional) 31
Annex figure 39: Violent deaths (globally) 32
Annex figure 40: Violent deaths (regionally) 32
Annex figure 41: Revenue in low and lower-middle income countries 35
Annex figure 42: Revenue in East Asia & Pacific (LICs and LMICs) 35
Annex figure 43: Revenue in South Asia (LICs and LMICs) 35
Annex figure 44: Revenue in sub-Saharan Africa (LICs and LMICs) 35
Annex figure 45: Revenue in Latin America & Caribbean (LICs and LMICs) 36
Annex to Projecting progress – reaching the SDGs by 2030 5
Note: We have not listed the various 'implementation' targets included in the SDG framework, but have referred to them in passing here to explain why they would not have been chosen for projections. They can be found at https://sustainabledevelopment.un.org/post2015/transformingourworld

6 Development Progress Flagship Report
This annex provides an overview of SDG goals and targets with detailed analysis on the 17 targets selected for projections.
Goal 1 – End poverty in all its forms everywhere (grade B)
Targets • 1.1 By 2030, eradicate extreme poverty for all people
everywhere, currently measured as people living on less than $1.25 a day
• 1.2 By 2030, reduce at least by half the proportion of men, women and children of all ages living in poverty in all its dimensions according to national definitions
• 1.3 Implement nationally appropriate social protection systems and measures for all, including floors, and by 2030 achieve substantial coverage of the poor and the vulnerable
• 1.4 By 2030 ensure that all men and women, particularly the poor and the vulnerable, have equal rights to economic resources, as well as access to basic services, ownership, and control over land and other forms of property, inheritance, natural resources, appropriate new technology, and financial services including microfinance
• 1.5 By 2030 build the resilience of the poor and those in vulnerable situations, and reduce their exposure and vulnerability to climate-related extreme events and other economic, social and environmental shocks and disasters
Why focus on Target 1.1?Of the five targets in Goal 1 only one other possesses a clear quantitative target that can be projected against. Other targets discuss frameworks, policies and support, in more abstract terms. The other quantifiable target is 1.2, seeking to reduce by half those living in poverty according to national definitions. However, no projections against this target were identified in the literature review. Such projections would be difficult to produce. On the other hand, many notable projections have been carried out against the US$1.25 poverty line expressed in Target 1.1. The extreme poverty measurement of those living on less than US$1.25 a day has been a key driver of the development industry, its discourse and discussion. This has stimulated many reputable projections and as such it was felt appropriate to highlight in this study.
Basis of projections Several studies have attempted to project the population of people living on less than US$1.25 a day till 2030. We highlight here projections that are commonly cited globally. These are:
• Martin Ravallion (2013) How Long Will It Take To Lift One Billion People Out Of Poverty?
• Jonathan Karver, Charles Kenny and Andy Sumner (2012) MDGs 2.0: What Goals, Targets and Timeframe?
• Laurence Chandy, Natasha Ledlie, Veronika Penciakova (2013) The Final Countdown: Prospects For Ending Extreme Poverty By 2030. Brookings
• Peter Edward and Andy Sumner (2013) The Future Of Global Poverty In A Multi-Speed World: New Estimates Of Scale And Location: 2010-2030
• World Bank (2015) A Measured Approach to Ending Poverty and Boosting Shared Prosperity (projection used: ‘Alternative Four – Based On Household Surveys’)
• World Bank (2015) Poverty Forecasts
GloballyAll the projections identified point to a very similar global future on extreme poverty. All predict that, despite the intentions of Goal 1 and Target 1.1, extreme poverty will not have been fully eradicated by 2030. Moving from a current position of 17% (2011 figures) all projections do at least suggest that the proportion of those living on less than US$1.25 a day will continue to decline strongly. Yet the studies show notable variation in their forecasted poverty totals.
They range from a predicted rate of 3% in Martin Ravallion’s study, to 7.8% in a World Bank report. The average prediction is for 5.33% by 2030. It should be noted that these are headcount ratios for populations in developing countries only.
The target, deemed a realistic goal by the World Bank and many others, appears overly optimistic according to these projections. All the projections are predicting a faster rate of reduction in extreme poverty than was achieved after 1990 (apart from the World Bank Poverty Forecasts, which are predicting almost exactly the same rate as post-1990). Yet these still wouldn’t bring us to the target of zero-poverty.
The projection shows that developing countries would have to progress almost twice as fast on poverty reduction to meet Target 1.1 by 2030, thus producing a B grade.
By regionThe various projections differed in the extent to which they provided detailed regional breakdowns of in-poverty numbers. Three projections provide poverty headcounts in absolute numbers for developing regions. These are displayed in Figure 2.
Ravallion 3%
CGD (Karver et al.) 3.5%
Brookings (Chandy) 5.5%
CGD (Edward/Sumner) 6.5%
World Bank (Shared Prosperity) 7.8%
World Bank (Poverty Forecasts) 5.7%

In all projections, poverty is expected to be concentrated overwhelmingly in sub-Saharan Africa. The projections show 81%-83% of those living on less than US$1.25 a day in 2030 residing in sub-Saharan Africa, up from 41% today. Only two of the three projections show a reduction in the region’s poverty headcount to 2030, and these are not large. The World Bank’s Shared Prosperity report actually projects an increase in the poverty headcount, rising to 471 million people. This would still represent a fall in the proportion living in extreme poverty, given expected population increases.
Center for Global Development’s (CGD) projection, produced by Karver et al., is far more optimistic about South Asia’s poverty figures than the two World Bank projections. The World Bank’s Poverty Forecasts expect East Asia and Pacific poverty to have virtually disappeared by 2030, but this is not predicted by the two other projections, including the other World Bank projection. Projections for Latin America and the Caribbean are similar, all predicting only a small fall in the total number of people living in poverty. It should be said that, whilst differences appear in projected eventual poverty numbers, they are all essentially predicting very similar proportional reductions in each region to 2030.
Key assumptionsBrookings (Chandy et al.):
• assumed growth rates: growth projections for each country to 2030 are provided by the Economist Intelligence Unit.
• distribution of consumption: the distribution is kept unchanged from today in each country to 2030.
CGD (Edward and Sumner, 2013):
• assumed growth rates: growth rates are taken from recent International Monetary Fund (IMF) World Economic Outlook, which provides growth rates for 2010–2017 (growth for 2013-2017 itself a projection). Our paper uses the ‘moderate’ scenario where CGD use the average 2010-2017 growth rate, minus 1% percentage point, projected to 2030.
• distribution of consumption: CGD constructed a new model called the ‘Growth, Inequality and Poverty’ model (GrIP). The GrIP model enables the combination of survey means or National Account means. This approach enables the model to cover more countries than just those in PovcalNet.
World Bank Shared Prosperity report:
• assumed growth rates: this study uses the ‘Alternative Three’ scenario from the report that bases growth rates on household survey data. Average growth rates over the past 10 years are calculated from this survey data and applied to 2030. Where there are gaps in data or problems with comparability across surveys, growth rates are based on national accounts estimates.
• distribution of consumption: the distribution is kept unchanged from today in each country to 2030.
World Bank Poverty Forecasts:
• assumed growth rates: annual predicted growth rates from the World Bank’s Global Economic Prospects (2015) for each country for 2015-17 are applied to household survey
Annex to Projecting progress – reaching the SDGs by 2030 7
Annex figure 1: Extreme poverty headcount ratio in 2030 (%) (developing world)
2000 2010 2020 20301990 2005 2015 202519950
50
40
30
20
10
Popu
latio
n liv
ing
in e
xtre
me
pove
rty (%
)
ActualTarget CGD (Karver et. al)
Ravallion CGD (Edward/Sumner)
Brookings (Chandy) World Bank (Poverty Forecasts)World Bank (Shared Prosperity)
Projections
Source: Chandy et al, 2013; Edward and Sumner, 2013; Karver et al.,
2012; Ravallion, 2013; World Bank, 2013a; World Bank, 2015d
Annex figure 2: Poverty headcount (millions) (2030)
500
400
300
200
100
0Regi
onal
pov
erty
hea
dcou
nt (m
illio
ns) i
n 20
30
Actual (2011)Target
World Bank (Poverty Forecasts)World Bank (Shared Prosperity)
CGD (Karver et. al)
Sub-SaharanAfrica
South Asia
MiddleEast &
North Africa
Latin America& the
Caribbean
East Asiaand thePaci�c
Target = 0
Source: Karver et al., 2012; World Bank, 2013a; World Bank, 2015d

8 Development Progress Flagship Report
data on per capita mean income and expenditure. For 2018-30, growth is placed at the 2015-17 average.
• distribution of consumption: the distribution is kept unchanged from today in each country to 2030. Population growth rates are based on UN country-level projections.
CGD (Karver et. al, 2012):
• assumed growth rates: CGD use IMF World Economic Outlook growth data. They take growth rates from the period 2009-14, minus 1% (as this is the average error historically observed in IMF growth projections) and apply this to incomes to 2030. This paper was produced prior to 2011 poverty data being released, so 2009-14 data are projections, rather than actual data.
• distribution of consumption: the distribution is kept unchanged from today in each country to 2030.
Ravallion (2013):
• Ravallion’s projections are effectively produced in reverse, to see what growth rate would be needed to achieve 3% poverty by 2030. He finds that there would need to be an annual growth rate in household consumption per capita, if using 2008 consumption distribution, of 4.5%. If assuming a 1999 distribution rate, growth would have to be lower, at just 3.4%.
Goal 2 – End hunger, achieve food security and improved nutrition and promote sustainable agriculture (grade D)
Targets • 2.1 By 2030, end hunger and ensure access by all
people, in particular the poor and people in vulnerable situations, including infants, to safe, nutritious and sufficient food all year round
• 2.2 By 2030, end all forms of malnutrition, including achieving, by 2025, the internationally agreed targets on stunting and wasting in children under 5 years of age, and address the nutritional needs of adolescent girls, pregnant and lactating women and older persons
• 2.3 By 2030, double the agricultural productivity and incomes of small-scale food producers, in particular women, indigenous peoples, family farmers, pastoralists and fishers, including through secure and equal access to land, other productive resources and inputs, knowledge, financial services, markets and opportunities for value addition and non-farm employment
• 2.4 By 2030, ensure sustainable food production systems and implement resilient agricultural practices that increase productivity and production, that help maintain ecosystems, that strengthen capacity for adaptation to climate change, extreme weather, drought,
flooding and other disasters and that progressively improve land and soil quality
• 2.5 By 2020, maintain the genetic diversity of seeds, cultivated plants and farmed and domesticated animals and their related wild species, including through soundly managed and diversified seed and plant banks at the national, regional and international levels, and ensure access to and fair and equitable sharing of benefits arising from the utilisation of genetic resources and associated traditional knowledge, as internationally agreed
Why focus on Target 2.1?The ending hunger target lies at the heart of SDG2. Ensuring that everyone in the world has enough food to eat is strongly related to food security, nutrition and agriculture. This target has the most reliable projections available for this goal as the two other quantifiable targets (2.2 and 2.3) are difficult to project. Estimating how malnutrition will be addressed over the next 15 years is incredibly challenging, as rapid progress can occur in short timeframes. In addition, agricultural productivity is not as closely linked to the goal as the ending hunger target.
The indicator selected to measure this target is undernourishment, which is also used to measure MDG Target 1.9. Undernourishment is defined by the UN Food and Agricultural Organisation (FAO) as living below the minimum dietary energy requirement. In other words, consuming less than the minimum number of calories a human needs.
Basis of projections The best available projections of undernourishment are from the FAO, which has responsibility for issues related to hunger, food security, nutrition and agriculture. They project forward current trends in the reduction of undernourishment by assuming that the rate of progress that has occurred over the past couple of decades will continue to 2030 (in terms of the share of developing-world population).
GloballyUndernourishment is expected to continue to decline from around 12% of the developing-world population in 2015 to around 8% by 2030, which is well short of the SDG ‘zero’ target. To meet this target undernourishment would need to fall over three times faster than projected, which is why this goal gets a D grade.
By regionOver the past 25 years there has been a significant reduction in undernourishment in East Asia, whereas levels have largely stagnated in South Asia and sub-Saharan Africa. This is expected to continue so that by 2030 around 80% of the world’s undernourished people will be in South Asia and Sub-Saharan Africa. The figure overleaf

shows that the absolute number of undernourished people in these regions is expected to remain stagnant.
Key assumptionsMinimum number of calories – There is some variation between how countries estimate what the minimum number of calories a human needs should be, especially when it comes to constructing national poverty lines. Whereas the FAO assumes a constant number of calories for all countries, which does not take into account country-specific circumstances such as climate and ethnicity. Therefore the minimum ‘threshold’ that is the basis of the projections does not fully capture variation in people’s experience of hunger in different locations around the world.
How food distribution is estimated – Past trends in how food has been distributed are used to estimate future trends. However this may not be reasonable; rates of undernourishment could decline rapidly at first but as those remaining undernourished are often the hardest to reach, the rate of progress could slow down. This appears to be what has taken place in East Asia over the past two decades. As such this could mean that basing projections on past trends could underestimate levels of undernourishment in 2030.
Goal 3 – Ensure healthy lives and promote well-being for all at all ages (grade C)
Targets • 3.1 By 2030, reduce the global maternal mortality ratio
to less than 70 per 100,000 live births • 3.2 By 2030, end preventable deaths of new-borns and
children under 5 years of age, with all countries aiming to reduce neonatal mortality to at least as low as 12 per
1,000 live births and under-5 mortality to at least as low as 25 per 1,000 live births
• 3.3 By 2030, end the epidemics of AIDS, tuberculosis, malaria and neglected tropical diseases and combat hepatitis, water-borne diseases and other communicable diseases
• 3.4 By 2030, reduce by one third premature mortality from non-communicable diseases through prevention and treatment and promote mental health and well-being
• 3.5 Strengthen the prevention and treatment of substance abuse, including narcotic drug abuse and harmful use of alcohol
• 3.6 By 2020, halve the number of global deaths and injuries from road tra ck accidents
• 3.7 By 2030, ensure universal access to sexual and reproductive healthcare services, including for family planning, information and education, and the integration of reproductive health into national strategies and programmes
• 3.8 Achieve universal health coverage, including financial risk protection, access to quality essential healthcare services and access to safe, effective, quality and affordable essential medicines and vaccines for all
• 3.9 By 2030, substantially reduce the number of deaths and illnesses from hazardous chemicals and air, water and soil pollution and contamination
Why focus on Target 3.1?The maternal mortality target for SDG3 is only directly related to a sub-population of people, however it indirectly reflects the status of healthcare for all. Significantly reducing maternal mortality is likely to require that many parts of the healthcare system are functioning well, from basic healthcare to access to skilled medical personnel in the case of emergencies. Furthermore, this is one of the
Annex to Projecting progress – reaching the SDGs by 2030 9
Annex figure 3: Undernourishment (globally)
2000 2010 2020 20301990 2005 2015 202519950
25
20
15
10
5
Deve
lopi
ng w
orld
pop
ulat
ion
that
is u
nder
nour
ishe
d (%
)
Actual TargetProjection
Source: FAO, 2012
Annex figure 4: Undernourishment (regionally)
2000 2010 2020 20301990 2005 2015 20251995
0
1,000
800
600
400
200
Popu
latio
n (m
illio
ns)
Sub-Saharan Africa Latin America and the CaribbeanSouth Asia East AsiaMiddle East and North Africa
Target = 0
Source: FAO, 2012

10 Development Progress Flagship Report
few targets under this goal that is quantifiable and has a commonly used indicator, which is the Maternal Mortality Ratio (MMR). The MMR measures the number of maternal deaths per 100,000 live births and has been used to track MDG 5. The main other health issue that had as prominent role in the MDGs as maternal mortality is child mortality, for which the language in the SDG target 3.2 was only finalised as this publication was going to print and thus was not considered for review.
Basis of projections The World Health Organisation (WHO), which is the main international organisation in regard to global public health issues, has projected the MMR based on the continuation of past trends. As such it is assumed that the way the MMR has varied in regard to economic and demographic factors will continue into the future.
GloballyThe global MMR is projected to fall to around 150 deaths per 100,000 live births by 2030, which is still more than twice as high as the SDG target. Maternal mortality would have to fall almost three times quicker than projected for the target to be met, which is why this goal reaches a C grade.
By regionMaternal mortality is predicted to fall across all regions but remain very high in Sub-Saharan Africa. Every region will meet the SDG target of reducing the MMR to 70 deaths per 100,000 live births, except South Asia and Sub-Saharan Africa as can be seen in Figure 6.1 Based on
current trends, the MMR in Sub-Saharan Africa would not fall below the global target until after 2100.
Key assumptionsRelationship with economic and demographic variables – The relationship between changes in economic and demographic variables on maternal health underpinning these projections may not hold into the future. Rapid changes with regard to female fertility and subsequently the MMR have occurred in many countries in a timeframe shorter than 15 years, which undermines the precision of projecting over long-term time horizons. In addition, changes in social norms around women participating in the formal labour force could transform past trends in regards to economic opportunities and maternal health.
Technological innovation – Medical advances, especially in relation to contraception, could dramatically decouple past and future trends in maternal health. As such the projections should be considered as the business-as-usual trend in the absence of significant technological innovation.
Goal 4 – Ensure inclusive and equitable quality education and promote lifelong learning opportunities for all (grade C)
Targets • 4.1 By 2030, ensure that all girls and boys complete free,
equitable and quality primary and secondary education leading to relevant and effective learning outcomes
1 HICS – High Income Countries, EAP – East Asia and Pacific, ECA – Eastern Europe and Central Asia, LAC – Latin America and the Caribbean, MENA – Middle East and North Africa, SOA – South Asia, SSA – sub-Saharan Africa.
Annex figure 5: Maternal mortality (globally)
1990 2000 20101995 2005 2015 20252020 20300
400
200
250
300
350
50
100
150
Mat
erna
l dea
ths
per 1
00,0
00 li
ve b
irths
Actual TargetProjection
Source: WHO, 2015
Annex figure 6: Maternal mortality (regionally)
0
500
100
200
300
400
Mat
erna
l dea
ths
per 1
00,0
00 li
ve b
irths
20302015 Target
SSAECA SOALACWorld HICS EAP MENA
Source: WHO, 2015

• 4.2 By 2030, ensure that all girls and boys have access to quality early childhood development, care and pre-primary education so that they are ready for primary education
• 4.3 By 2030, ensure equal access for all women and men to a ffordable and quality technical, vocational and tertiary education, including university
• 4.4 By 2030, substantially increase the number of youth and adults who have relevant skills, including technical and vocational skills, for employment, decent jobs and entrepreneurship
• 4.5 By 2030, eliminate gender disparities in education and ensure equal access to all levels of education and vocational training for the vulnerable, including persons with disabilities, indigenous peoples and children in vulnerable situations
• 4.6 By 2030, ensure that all youth and a substantial proportion of adults, both men and women, achieve literacy and numeracy
• 4.7 By 2030, ensure that all learners acquire the knowledge and skills needed to promote sustainable development, including, among others, through education for sustainable development and sustainable lifestyles, human rights, gender equality, promotion of a culture of peace and nonviolence, global citizenship and appreciation of cultural diversity and of culture’s contribution to sustainable development
Why focus on Target 4.1?This education completion target represents the minimum floor of the ambition reflected in SDG4. Set at the level of secondary completion, this is an essential precondition for other targets under this goal, such as quality tertiary education. While focusing on completion of secondary school does not directly measure quality of education, school attendance is a vital first step in the provision of quality education. Secondary school completion is also more easily measured and there are readily available, reliable projections, unlike for most of the other targets. For example, while Targets 4.2 and 4.3 reflect an important focus on early-childhood development and post-secondary education, there is limited internationally comparable data on these topics. Furthermore, Targets 4.4 and 4.6, which are quantifiable, were still yet to be finalised as this report was being prepared.
Basis of projections The World Bank provides projections on secondary school completion rates produced by the International Institute for Applied Systems Analysis and the Vienna Institute of Demography. Education attainment is projected forward based upon how education has varied in the past depending on changes in economic and demographic factors. As this target relates to achieving universal secondary school completion by 2030, the focus of the projections is on educational attainment for 20- to
24-year-olds in 2035. This cohort should have completed secondary school if the target is met.
GloballyThe share of the population between 20 and 24 years old that has completed secondary education is expected to increase steadily and reach 85% by 2035. This is well below the target of 100% completion. To meet the target, progress would need to be two-and-a-half times faster than projected, which is why it reaches a C grade.
By regionMost regions in the developing world are expected to converge towards a secondary-school completion rate of around 85% by 2030, except Sub-Saharan Africa,
Annex to Projecting progress – reaching the SDGs by 2030 11
Annex figure 7: Secondary completion (globally)
1990 2000 20101995 2005 2015 20252020 2030 20350
100
80
60
40
20
Perc
enta
ge o
f 20-
24 y
r old
s
Actual TargetProjection
Source: Wittgenstein Center, 2015
Annex figure 8: Secondary completion (regionally)
1990 2000 20101995 2005 2015 20252020 2030 20350
100
80
60
40
20
Perc
enta
ge o
f 20-
24 y
r old
s
High-income countries South AsiaLatin America and the CaribbeanEast Asia and the Paci�c
Sub-Saharan AfricaRest of the World
Source: Wittgenstein Center, 2015

12 Development Progress Flagship Report
which is set to remain below 65% (see Figure 8 on page 11). On current trends Sub-Saharan Africa is not set to achieve universal secondary school completion for 20- to 24-year-olds for more than 50 years. Progress is projected to plateau in high-income countries as secondary school completion is expected to only increase from 96% to 97% over the next 15 years.
Key assumptionsThe main assumption underpinning this projection is that past trends will continue, which could be invalid for a number of reasons.
Relationship with economic variables – The relationship between changes in economic variables and education that underpin these projections may not hold into the future. The value of education in the labour market could change significantly in the future as average levels of education increase.
Dependence on population projections – These education-attainment projections are closely linked to UN population projections that may not hold in the future, especially given that there is some evidence to date that suggests population projections predict a faster decline in fertility than has actually occurred.
Hardest-to-reach people remaining – Increasing secondary school completion rates appears to become more difficult as completion approaches 100% as it is necessary to integrate the hardest-to-reach groups, such as ethnic minorities and the geographically isolated. This appears to be reflected in the regional breakdown figure as regions that had higher levels of secondary school completion experienced a slower rate of overall growth. These issues could mean that relying on past trends could overestimate the extent to which increases in secondary school completion is possible.
Goal 5 – Achieve gender equality and empower all women and girls (grade E)
Targets • 5.1 End all forms of discrimination against all women
and girls everywhere • 5.2 Eliminate all forms of violence against all women
and girls in the public and private spheres, including tra-cking and sexual and other types of exploitation
• 5.3 Eliminate all harmful practices, such as child, early and forced marriage and female genital mutilation
• 5.4 Recognise and value unpaid care and domestic work through the provision of public services, infrastructure and social protection policies and the promotion of shared responsibility within the household and the family as nationally appropriate
• 5.5 Ensure women’s full and effective participation and equal opportunities for leadership at all levels of decision-making in political, economic and public life
• 5.6 Ensure universal access to sexual and reproductive health and reproductive rights as agreed in accordance with the Programme of Action of the International Conference on Population and Development and the Beijing Platform for Action and the outcome documents of their review conferences
Why focus on Target 5.3?SDG5 is a very broad goal that relates to a wide range of components of gender equality, whereas this target only focuses on a very specific aspect. However ending child marriage would address an egregious violation of rights and in some contexts is a key step towards gender inequality. Furthermore this is one of only three targets that it is possible to quantify and there is existing data available across a range of countries. Another potential quantifiable target would be 5.2, which focuses on violence against women; however there are significant concerns regarding under-reporting and an existing projection could not be found. The other quantifiable target, 5.6, could be simplified to represent access to contraception; however projections to 2030 on this indicator could not be found.
Basis of projections UNICEF, the world’s leading international organisation advocating for children’s issues, provides some projections regarding the prevalence of child marriage. They define child marriage as being married or in union below 18 years old.
GloballyChild marriage is only projected to fall to around 22% by 2030, which is dramatically short of the target to end child marriage. The prevalence of child marriage would need
Annex figure 9: Prevalence of child marriage (globally) (%)
1990 2000 20101995 2005 2015 20252020 20300
35
5
10
15
20
25
30
20-2
4 yr
old
wom
en w
ho w
ere
mar
ried
befo
re 1
8 (%
)
Actual TargetProjection
Source: UNICEF, 2014
to decline around eight times faster than projected for the current goal to be met, which is why it receives an E grade.
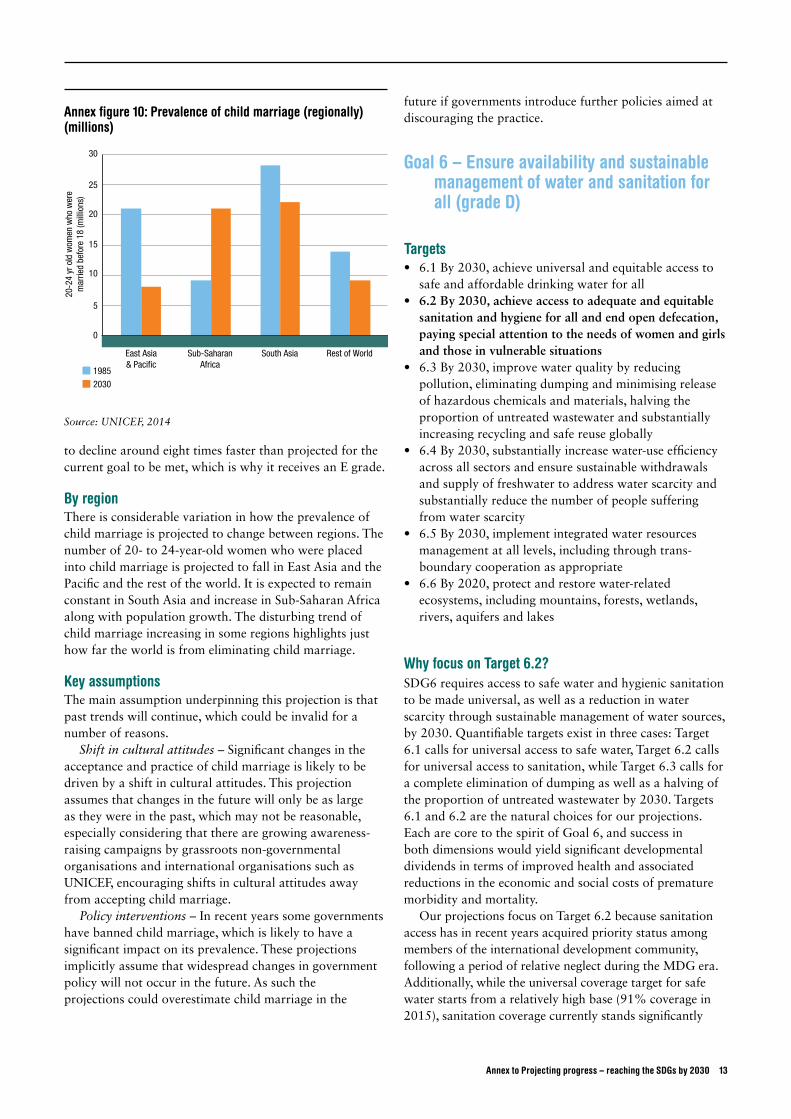
By regionThere is considerable variation in how the prevalence of child marriage is projected to change between regions. The number of 20- to 24-year-old women who were placed into child marriage is projected to fall in East Asia and the Pacific and the rest of the world. It is expected to remain constant in South Asia and increase in Sub-Saharan Africa along with population growth. The disturbing trend of child marriage increasing in some regions highlights just how far the world is from eliminating child marriage.
Key assumptionsThe main assumption underpinning this projection is that past trends will continue, which could be invalid for a number of reasons.
Shift in cultural attitudes – Significant changes in the acceptance and practice of child marriage is likely to be driven by a shift in cultural attitudes. This projection assumes that changes in the future will only be as large as they were in the past, which may not be reasonable, especially considering that there are growing awareness-raising campaigns by grassroots non-governmental organisations and international organisations such as UNICEF, encouraging shifts in cultural attitudes away from accepting child marriage.
Policy interventions – In recent years some governments have banned child marriage, which is likely to have a significant impact on its prevalence. These projections implicitly assume that widespread changes in government policy will not occur in the future. As such the projections could overestimate child marriage in the
future if governments introduce further policies aimed at discouraging the practice.
Goal 6 – Ensure availability and sustainable management of water and sanitation for all (grade D)
Targets • 6.1 By 2030, achieve universal and equitable access to
safe and affordable drinking water for all • 6.2 By 2030, achieve access to adequate and equitable
sanitation and hygiene for all and end open defecation, paying special attention to the needs of women and girls and those in vulnerable situations
• 6.3 By 2030, improve water quality by reducing pollution, eliminating dumping and minimising release of hazardous chemicals and materials, halving the proportion of untreated wastewater and substantially increasing recycling and safe reuse globally
• 6.4 By 2030, substantially increase water-use efficiency across all sectors and ensure sustainable withdrawals and supply of freshwater to address water scarcity and substantially reduce the number of people suffering from water scarcity
• 6.5 By 2030, implement integrated water resources management at all levels, including through trans-boundary cooperation as appropriate
• 6.6 By 2020, protect and restore water-related ecosystems, including mountains, forests, wetlands, rivers, aquifers and lakes
Why focus on Target 6.2?SDG6 requires access to safe water and hygienic sanitation to be made universal, as well as a reduction in water scarcity through sustainable management of water sources, by 2030. Quantifiable targets exist in three cases: Target 6.1 calls for universal access to safe water, Target 6.2 calls for universal access to sanitation, while Target 6.3 calls for a complete elimination of dumping as well as a halving of the proportion of untreated wastewater by 2030. Targets 6.1 and 6.2 are the natural choices for our projections. Each are core to the spirit of Goal 6, and success in both dimensions would yield significant developmental dividends in terms of improved health and associated reductions in the economic and social costs of premature morbidity and mortality.
Our projections focus on Target 6.2 because sanitation access has in recent years acquired priority status among members of the international development community, following a period of relative neglect during the MDG era. Additionally, while the universal coverage target for safe water starts from a relatively high base (91% coverage in 2015), sanitation coverage currently stands significantly
Annex to Projecting progress – reaching the SDGs by 2030 13
Annex figure 10: Prevalence of child marriage (regionally) (millions)
0
30
25
20
15
10
5
20-2
4 yr
old
wom
en w
ho w
ere
mar
ried
befo
re 1
8 (m
illio
ns)
19852030
South Asia Rest of WorldSub-SaharanAfrica
East Asia& Paci�c
Target = 0
Source: UNICEF, 2014

14 Development Progress Flagship Report
lower (68% in 2015), implying that a much greater international effort will be needed to meet the universal target by 2030. Target 6.2 calls on states to provide universal access to adequate sanitation for all, and an end to open defecation. Lack of sanitation is a global health issue of major proportions, accounting for an estimated 10% of the global disease burden, principally through its impact on the prevalence of diarrhoeal diseases (Mara et al., 2010).
Basis of projectionsOECD (2012) uses data from the WHO and UNICEF joint measuring project (JMP), which defines access to improved sanitation as the percentage of the population able to access a sanitation facility that separates human excreta from human contact. ‘Improved’ sanitation facilities include flush or pour-flush toilets (piped into sewer systems, septic tanks or pit latrines), ventilated improved pit (VIP) latrines, pit latrines with slabs or composting toilets. Under their baseline scenario, access to an improved sanitation facility is projected forward based on recent trends in population and economic growth.
GloballyDespite strong economic growth, the projections show a distinct failure to meet the universal coverage target by 2030. On current trends, just 76% of the world’s population will have access to improved sanitation facilities within the next 15 years. The rate of progress would have to be almost four times faster to meet Target 6.2 by 2030, which is why it receives a D grade.
By regionThe OECD break their projections down into the following categories: OECD, BRIICS and a Rest of World (ROW) category. As shown graphically, this breakdown
makes it clear that basic sanitation access is already near-universal among the OECD countries. There is expected to be a significant reduction (38%) in the number of people lacking access to an adequate sanitation facility in Brazil, Russia, India, Indonesia, China and South Africa. By 2030, these BRIICS countries are set to account for 51% of those lacking improved sanitation access, down from an initial share of 62%. This is predicted to be driven by strong growth as well as urbanisation, which can facilitate sanitation provision. Elsewhere, there is projected to be no progress.
Key assumptionsInequality does not improve – Under a baseline scenario there are no major improvements in inequality. Using similar data, Save the Children (2013) shows that improvements in inequality using the Palma ratio (to levels seen in the 1980s) increase the proportion of the population with access to improved sanitation by 7 percentage points by 2030. Drawing on evidence that progress in meeting the MDGs was met fastest among wealthier groups, Save the Children argues that reaching the most marginalised won’t happen without improvements in the distribution of income (Save the Children, 2012).
Governance does not improve – Save the Children’s (2013) projections show that, should governance metrics improve, as measured by the Worldwide Governance Indicator (WGI) for effective government, sanitation access will correspondingly improve. The WGI captures perceptions of public-service quality, civil-service quality and independence, as well as quality of policy implementation (Kaufmann et al., 2010). They project that an extra 4% of the global population could have access to an improved sanitation facility by 2030 if governance improvements are combined with improvements in inequality.
Annex figure 11: Sanitation access (globally)
1990 2000 20101995 2005 2015 20252020 203040
100
70
90
60
80
50
Popu
latio
n w
ith a
cces
s to
impr
oved
san
itatio
n (%
)
Actual TargetProjection
Source: OECD, 2012
Annex figure 12: Sanitation access (regionally)
BRIICSOECD ROW
0
1,800
200
400
600
800
1,000
1,200
1,400
1,600
Popu
latio
n w
ithou
t acc
ess
to a
n im
prov
edsa
nita
tion
faci
lity
(mill
ions
)
20102030
Target = 0
Source: OECD, 2012

Goal 7 – Ensure access to affordable, reliable, sustainable, and modern energy for all (grade D)
Targets • 7.1 By 2030, ensure universal access to affordable,
reliable and modern energy services • 7.2 By 2030, increase substantially the share of
renewable energy in the global energy mix • 7.3 By 2030, double the global rate of improvement in
energy efficiency
Why focus on Target 7.1?SDG7 requires energy access to be made universal, with an emphasis on increasing both the provision of and research into renewable sources of energy. It also requires substantial improvements in energy efficiency. There are a number of candidate quantifiable targets for this goal for which data are available. Target 7.1 demands universal access to affordable, reliable and modern energy services by 2030. Target 7.2 requires renewable sources of energy to increase ‘substantially’ by 2030 as a share of the global energy mix. Target 7.3 calls for a doubling of the rate of improvement in energy efficiency by 2030.
Notwithstanding the critical importance of improvements in renewable sourcing and efficiency gains, Target 7.1 is chosen as it best captures the spirit of Goal 7, whose core focus is on increasing energy access. Additionally, because of the significant developmental dividends associated with increased energy access, success in this goal is linked to success in many of the targets associated with the other SDGs, making projections for this target particularly important to acquiring an understanding of the likelihood of meeting the SDGs as a collective. The indicator chosen for this target is electricity access, with the associated target set at everyone having electricity access by 2030.
Basis of projectionsThe projections are taken from the International Energy Agency’s World Energy Outlook 2013 under their New Policies scenario. This scenario takes into account broad policy commitments made by the international community, such as national pledges to reduce greenhouse gas emissions and articulated plans to phase out fossil energy subsidies. Demographic and economic growth continue as they have in the past.
GloballyWith little improvement expected on today’s starting point of around 1.2 billion people without electricity access, close to 1 billion people are projected to continue to lack access to electricity by 2030.
The UN’s latest population projections show the global population rising from 7.4 billion today, to 8.5 billion by 2030. When held against our energy projections, we find that the proportion of people without access to energy is expected to fall from 16% today to 12% in 2030. Progress would therefore have to be between 3-4 times faster than projected in order to meet the universal energy coverage target (0% without access) by 2030. As a result, Goal 7 is assigned a D grade.
By regionThe regional story is most positive in the case of East and South Asia, where the number of people lacking access to electricity is expected to nearly halve between 2011 and
Annex to Projecting progress – reaching the SDGs by 2030 15
Annex figure 13: Population without access to electricity (globally)
2010 2015 2020 2025 20300
20
15
10
5
Popu
latio
n w
ithou
t acc
ess
to e
lect
ricity
(%)
Actual TargetProjection
Annex figure 14: Population without access to electricity (regionally)
DevelopingAsia
Sub-SaharanAfrica
MiddleEast
LatinAmerica
0
700
600
500
400
300
200
100
Popu
latio
n w
ithou
t acc
ess
to e
lect
ricity
(mill
ions
)
20112030
Target = 0
Source: International Energy Agency, 2012
Source: International Energy Agency, 2012
16 Development Progress Flagship Report
2030, driven mainly by substantial decreases in India. This is alongside relatively significant population growth. Universal access is projected to be met in Latin America by the mid-2020s. In sub-Saharan Africa, however, the number of people without electricity is projected to increase, raising its share of the global total lacking access from less than half in 2011 to two-thirds by 2030.
Key assumptionsFinancing commitment – While the expected level of investment in energy infrastructure in the projections is relatively low, substantial increases in funding could significantly improve the expected rate of progress. The IEA’s World Energy Outlook (2012) estimates the required level of investment at US$979 billion between 2011 and 2030, averaging US$49 billion per year. Given that expected investment in the New Policies scenario stands at US$301 billion, this total would require an additional US$678 billion financing commitment.
Population growth – Expected demographic dynamics have a significant impact on the likelihood of meeting the universal coverage target by 2030. While population projections have improved in accuracy in recent decades, they are still subject to a number of methodological uncertainties and data limitations, especially in the case of developing countries, which can lead them to over- or under-estimate future population trends (O’Neill et al., 2001).
Goal 8 – Promote sustained, inclusive and sustainable economic growth, full and productive employment and decent work for all (grade B)
Targets • 8.1 Sustain per capita economic growth in accordance
with national circumstances, and in particular at least 7% per annum GDP growth in the least-developed countries
• 8.2 Achieve higher levels of productivity of economies through diversification, technological upgrading and innovation, including through a focus on high value-added and labour-intensive sectors
• 8.3 Promote development-oriented policies that support productive activities, decent job creation, entrepreneurship, creativity and innovation, and encourage formalisation and growth of micro-, small- and medium-sized enterprises including through access to financial services
• 8.4 Improve progressively through 2030 global resource efficiency in consumption and production, and endeavour to decouple economic growth from environmental
degradation in accordance with the 10-year framework of programmes on sustainable consumption and production with developed countries taking the lead
• 8.5 By 2030 achieve full and productive employment and decent work for all women and men, including for young people and persons with disabilities, and equal pay for work of equal value
• 8.6 By 2020 substantially reduce the proportion of youth not in employment, education or training
• 8.7 Take immediate and effective measures to secure the prohibition and elimination of the worst forms of child labour, eradicate forced labour, and by 2025 end child labour in all its forms including recruitment and use of child soldiers
• 8.8 Protect labour rights and promote safe and secure working environments of all workers, including migrant workers, particularly women migrants, and those in precarious employment
• 8.9 By 2030 devise and implement policies to promote sustainable tourism which creates jobs, promotes local culture and products
• 8.10 Strengthen the capacity of domestic financial institutions to encourage and to expand access to banking, insurance and financial services for all
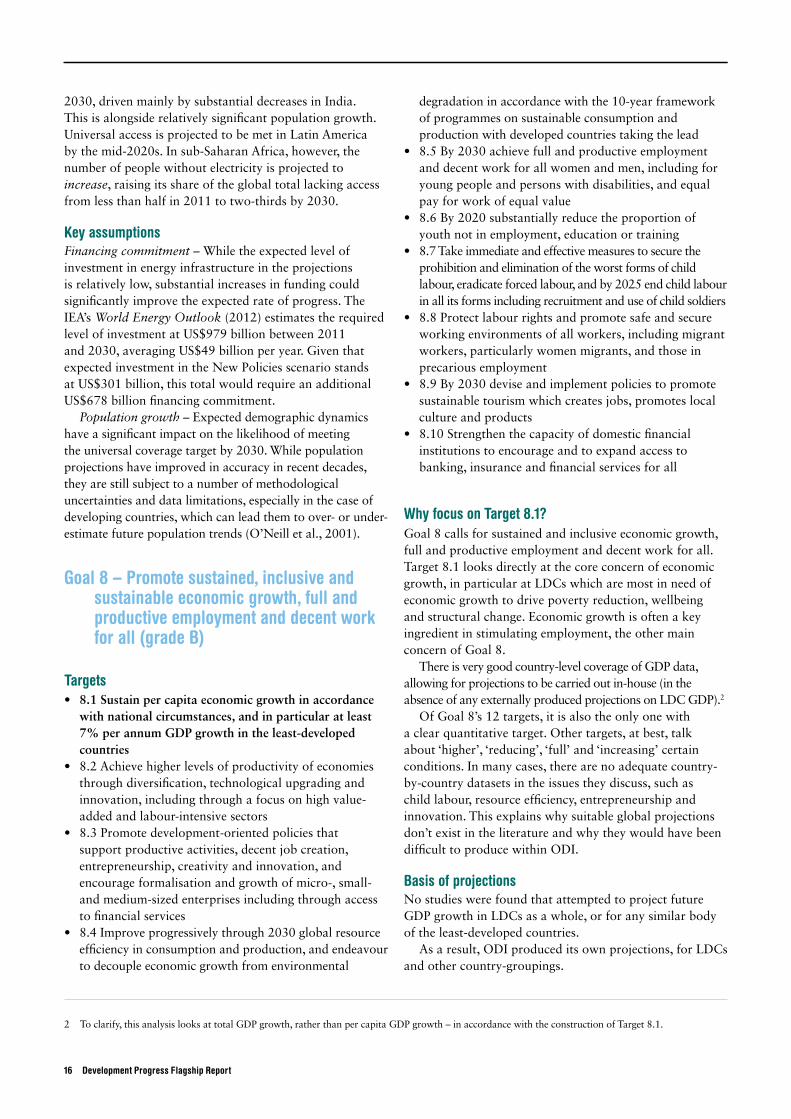
Why focus on Target 8.1? Goal 8 calls for sustained and inclusive economic growth, full and productive employment and decent work for all. Target 8.1 looks directly at the core concern of economic growth, in particular at LDCs which are most in need of economic growth to drive poverty reduction, wellbeing and structural change. Economic growth is often a key ingredient in stimulating employment, the other main concern of Goal 8.
There is very good country-level coverage of GDP data, allowing for projections to be carried out in-house (in the absence of any externally produced projections on LDC GDP).2
Of Goal 8’s 12 targets, it is also the only one with a clear quantitative target. Other targets, at best, talk about ‘higher’, ‘reducing’, ‘full’ and ‘increasing’ certain conditions. In many cases, there are no adequate country-by-country datasets in the issues they discuss, such as child labour, resource efficiency, entrepreneurship and innovation. This explains why suitable global projections don’t exist in the literature and why they would have been difficult to produce within ODI.
Basis of projections No studies were found that attempted to project future GDP growth in LDCs as a whole, or for any similar body of the least-developed countries.
As a result, ODI produced its own projections, for LDCs and other country-groupings.
2 To clarify, this analysis looks at total GDP growth, rather than per capita GDP growth – in accordance with the construction of Target 8.1.

We have used data from the World Bank’s WDI database to analyse recent country-level data on GDP growth.
GloballyODI’s projections suggest that LDCs will fail to meet Target 8.1’s aim of achieving 7% per annum GDP growth. Using three different scenarios for projected GDP growth rates, the target will not be met, even assuming the most optimistic scenario.
The projection shows that LDCs would have to progress slightly faster then current trends to meet Target 8.1 by 2030, thus producing a B grade.
We have produced three scenarios, based on extrapolating historical growth rates averaged over different periods. All three projection scenarios predict relatively similar likely growth rates to 2030. Taking the average of the past 20 years, LDCs could experience an average annual GDP growth rate of just under 5% to 2030. Taking the average of the past 10 years, which includes both the impressive period of pre-crisis growth and the subsequent downturn, LDCs could experience an average annual GDP growth rate of just above 4% to 2030. The five years prior to the global economic crisis of 2008-2009 displayed marginally higher average growth rates, so its annual rate of change is used to produce the ‘best-case scenario’. This projects a likely growth rate of just under 6% per year. This is in comparison to 2013’s recorded average of 3.4%. All three scenarios are short of the intended 7% average. We use the medium-term projection, based on the 10-year trend, forecasting 5% annual growth, as our selected projection.
The target appears over-ambitious. No income-group of countries, whether high-, middle- or low-income, came close to sustaining such growth in the data assessed from 1990-2013. Just twice, in 2004 and 2006, did any income group – upper-middle income countries – achieve an
average GDP growth rate, marginally, above 7%. LDCs did achieve a growth rate above 8% in 1997, but this was brought about mainly by Equatorial Guinea’s 150% growth that year. This exceptional figure pushed up the LDC average by over 2 percentage points.
The historical averages and projections have been produced using a simple weighting of all LDC country rates, year-by-year. This is consistent with Target 8.1, which seeks to ensure that all LDCs achieve a 7% growth rate. The projections above thus do not necessarily represent the experience of the average LDC citizen. Growth rates used here are absolute and not per capita. They do not take into account population changes.
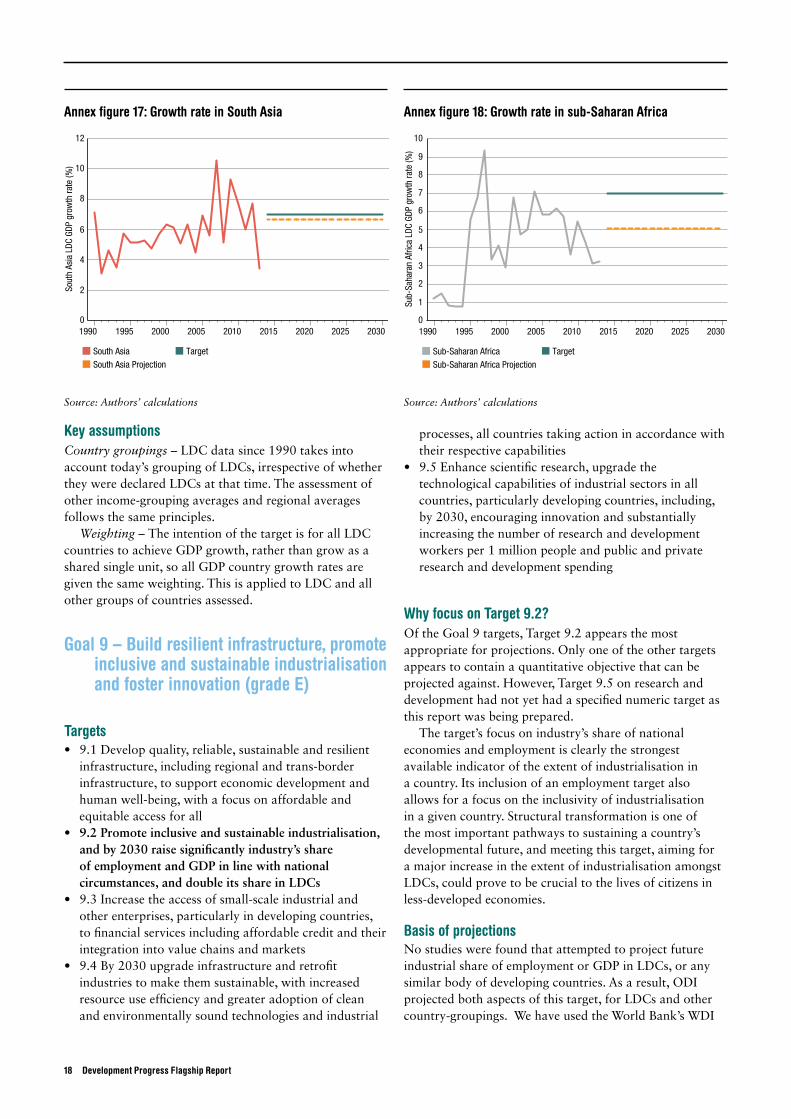
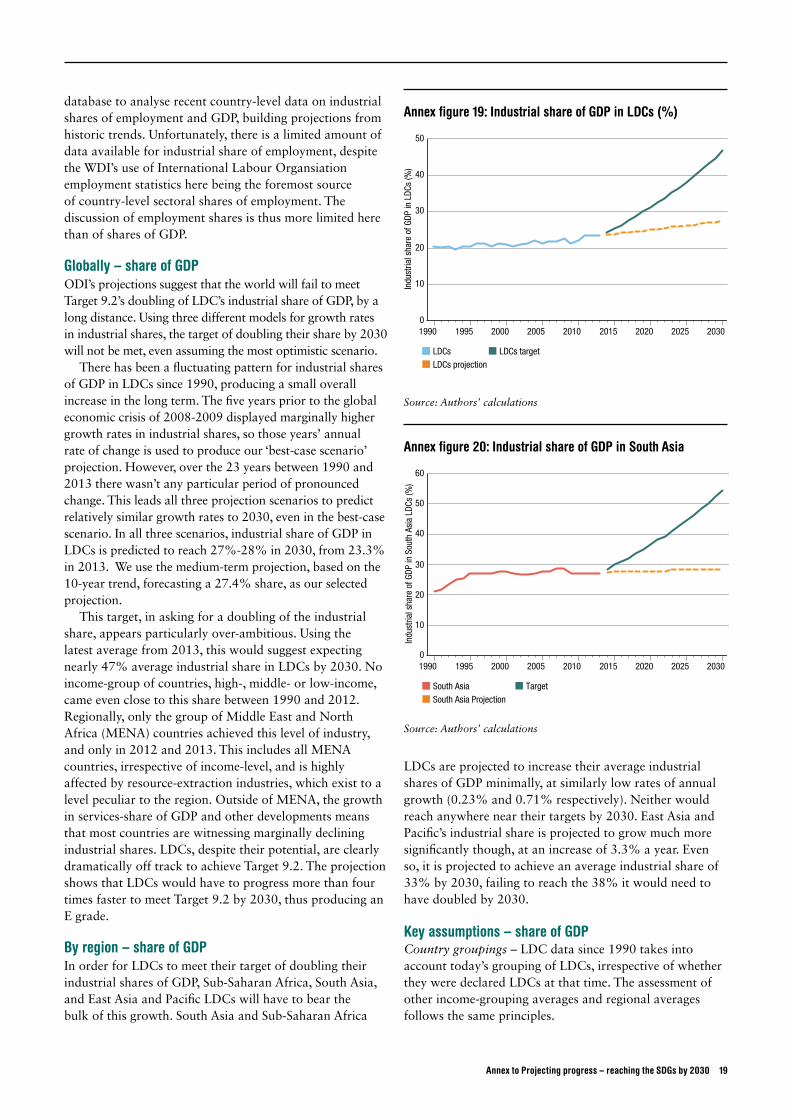
By region There are just two Middle East and North Africa (MENA) LDCs and one Latin American LDC. We have thus concentrated our regional projections for LDCs on Sub-Saharan Africa, South Asia and East Asia and Pacific. As with the overall LDC pattern, average LDC growth rates for each region have fluctuated wildly. This is, in part, because of certain countries experiencing extremely high growth in certain years, boosting regional averages based on just a handful of LDCs.
East Asia and Pacific and Sub-Saharan Africa LDCs are projected to achieve 5% average annual GDP growth to 2030. This is based on average growth rates over the past 10 years (from 2003-13). As such, Equatorial Guinea’s remarkable 150% growth in 1997 does not affect the region’s future projections. South Asia is projected a much higher average annual growth of 6.6%. This brings it near to the SDG target of 7% per annum. At the same time, looking at this group’s performance since 1990, it achieved an average growth rate above 7% just four times in the following 23 years.
Annex to Projecting progress – reaching the SDGs by 2030 17
Annex figure 15: LDC average growth (%)
2000 2010 2020 20301990 2005 2015 202519950
9
3
6
2
5
8
7
1
4
LDC
GDP
grow
th ra
te (%
)
Actual TargetProjection
Source: Authors’ calculations
Annex figure 16: Growth rate in East Asia & Pacific
2000 2010 2020 20301990 2005 2015 20251995
East
Asi
a an
d Pa
ci�c
LDC
GDP
gro
wth
rate
(%)
East Asia and Paci�c TargetEast Asia and Paci�c Projection
0
9
3
6
2
5
8
7
1
4
Source: Authors’ calculations
18 Development Progress Flagship Report
Key assumptionsCountry groupings – LDC data since 1990 takes into account today’s grouping of LDCs, irrespective of whether they were declared LDCs at that time. The assessment of other income-grouping averages and regional averages follows the same principles.
Weighting – The intention of the target is for all LDC countries to achieve GDP growth, rather than grow as a shared single unit, so all GDP country growth rates are given the same weighting. This is applied to LDC and all other groups of countries assessed.
Goal 9 – Build resilient infrastructure, promote inclusive and sustainable industrialisation and foster innovation (grade E)
Targets • 9.1 Develop quality, reliable, sustainable and resilient
infrastructure, including regional and trans-border infrastructure, to support economic development and human well-being, with a focus on affordable and equitable access for all
• 9.2 Promote inclusive and sustainable industrialisation, and by 2030 raise significantly industry’s share of employment and GDP in line with national circumstances, and double its share in LDCs
• 9.3 Increase the access of small-scale industrial and other enterprises, particularly in developing countries, to financial services including affordable credit and their integration into value chains and markets
• 9.4 By 2030 upgrade infrastructure and retrofit industries to make them sustainable, with increased resource use efficiency and greater adoption of clean and environmentally sound technologies and industrial
processes, all countries taking action in accordance with their respective capabilities
• 9.5 Enhance scientific research, upgrade the technological capabilities of industrial sectors in all countries, particularly developing countries, including, by 2030, encouraging innovation and substantially increasing the number of research and development workers per 1 million people and public and private research and development spending
Why focus on Target 9.2?Of the Goal 9 targets, Target 9.2 appears the most appropriate for projections. Only one of the other targets appears to contain a quantitative objective that can be projected against. However, Target 9.5 on research and development had not yet had a specified numeric target as this report was being prepared.
The target’s focus on industry’s share of national economies and employment is clearly the strongest available indicator of the extent of industrialisation in a country. Its inclusion of an employment target also allows for a focus on the inclusivity of industrialisation in a given country. Structural transformation is one of the most important pathways to sustaining a country’s developmental future, and meeting this target, aiming for a major increase in the extent of industrialisation amongst LDCs, could prove to be crucial to the lives of citizens in less-developed economies.
Basis of projections No studies were found that attempted to project future industrial share of employment or GDP in LDCs, or any similar body of developing countries. As a result, ODI projected both aspects of this target, for LDCs and other country-groupings. We have used the World Bank’s WDI
Annex figure 17: Growth rate in South Asia
2000 2010 2020 20301990 2005 2015 202519950
8
6
2
10
12
4
Sout
h As
ia L
DC G
DP g
row
th ra
te (%
)
South Asia TargetSouth Asia Projection
Source: Authors’ calculations
Annex figure 18: Growth rate in sub-Saharan Africa
2000 2010 2020 20301990 2005 2015 20251995
Sub-
Saha
ran
Afric
a LD
C GD
P gr
owth
rate
(%)
Sub-Saharan Africa TargetSub-Saharan Africa Projection
0
10
9
8
7
6
5
4
3
2
1
Source: Authors’ calculations
database to analyse recent country-level data on industrial shares of employment and GDP, building projections from historic trends. Unfortunately, there is a limited amount of data available for industrial share of employment, despite the WDI’s use of International Labour Organsiation employment statistics here being the foremost source of country-level sectoral shares of employment. The discussion of employment shares is thus more limited here than of shares of GDP.
Globally – share of GDPODI’s projections suggest that the world will fail to meet Target 9.2’s doubling of LDC’s industrial share of GDP, by a long distance. Using three different models for growth rates in industrial shares, the target of doubling their share by 2030 will not be met, even assuming the most optimistic scenario.
There has been a fluctuating pattern for industrial shares of GDP in LDCs since 1990, producing a small overall increase in the long term. The five years prior to the global economic crisis of 2008-2009 displayed marginally higher growth rates in industrial shares, so those years’ annual rate of change is used to produce our ‘best-case scenario’ projection. However, over the 23 years between 1990 and 2013 there wasn’t any particular period of pronounced change. This leads all three projection scenarios to predict relatively similar growth rates to 2030, even in the best-case scenario. In all three scenarios, industrial share of GDP in LDCs is predicted to reach 27%-28% in 2030, from 23.3% in 2013. We use the medium-term projection, based on the 10-year trend, forecasting a 27.4% share, as our selected projection.
This target, in asking for a doubling of the industrial share, appears particularly over-ambitious. Using the latest average from 2013, this would suggest expecting nearly 47% average industrial share in LDCs by 2030. No income-group of countries, high-, middle- or low-income, came even close to this share between 1990 and 2012. Regionally, only the group of Middle East and North Africa (MENA) countries achieved this level of industry, and only in 2012 and 2013. This includes all MENA countries, irrespective of income-level, and is highly affected by resource-extraction industries, which exist to a level peculiar to the region. Outside of MENA, the growth in services-share of GDP and other developments means that most countries are witnessing marginally declining industrial shares. LDCs, despite their potential, are clearly dramatically off track to achieve Target 9.2. The projection shows that LDCs would have to progress more than four times faster to meet Target 9.2 by 2030, thus producing an E grade.
By region – share of GDPIn order for LDCs to meet their target of doubling their industrial shares of GDP, Sub-Saharan Africa, South Asia, and East Asia and Pacific LDCs will have to bear the bulk of this growth. South Asia and Sub-Saharan Africa
LDCs are projected to increase their average industrial shares of GDP minimally, at similarly low rates of annual growth (0.23% and 0.71% respectively). Neither would reach anywhere near their targets by 2030. East Asia and Pacific’s industrial share is projected to grow much more significantly though, at an increase of 3.3% a year. Even so, it is projected to achieve an average industrial share of 33% by 2030, failing to reach the 38% it would need to have doubled by 2030.
Key assumptions – share of GDPCountry groupings – LDC data since 1990 takes into account today’s grouping of LDCs, irrespective of whether they were declared LDCs at that time. The assessment of other income-grouping averages and regional averages follows the same principles.
Annex to Projecting progress – reaching the SDGs by 2030 19
Annex figure 20: Industrial share of GDP in South Asia
2000 2010 2020 20301990 2005 2015 202519950
40
30
10
50
60
20
Indu
stria
l sha
re o
f GDP
in S
outh
Asi
a LD
Cs (%
)
South Asia TargetSouth Asia Projection
Annex figure 19: Industrial share of GDP in LDCs (%)
2000 2010 2020 20301990 2005 2015 20251995
Indu
stria
l sha
re o
f GDP
in L
DCs
(%)
LDCs LDCs targetLDCs projection
0
50
40
30
20
10
Source: Authors’ calculations
Source: Authors’ calculations

20 Development Progress Flagship Report
Weighting – The intention of the target is for all LDC countries to achieve industrialisation, rather than for industry to double in LDCs as a shared single unit. Therefore all countries are given the same weighting. This is applied to LDCs and all other groups of countries assessed.
Globally – share of employmentUnfortunately, data on sectoral shares of employment is very limited. We have used the foremost source for statistics on shares of employment – the ILO’s ‘Key Indicators of the Labour Market’ database, via the World Bank’s WDI database. Yet only 45% of all country data-points from 1990-2012 (latest available year of data) are present. Just 7% of LDC country data-points are available.
Looking at LICs and LMICs instead, for which there is at least more data, we can see that industrial share of employment here has not grown since 1990. Fluctuating frequently, it reached a peak of 21% as early as 1997, falling back down in subsequent years before reaching 2012’s position of 20%. The scenarios based on growth rates of the past 10 and 20 years do not thus predict significant growth. The ‘best-case’ scenario, using the growth rate experienced in the five years prior to the economic crisis of 2008, provides a very different projection. Here, annual growth of 6.6% is projected, which gives LICs and LMICs an average industrial share of employment of 63.3%.
However, aside from being extremely far removed from the 10- and 20-year growth model projections, the best-case scenario is extremely unlikely to happen. In 2012, aside from Qatar (with 52%), the top 10 countries with the highest industrial shares of employment in the world have
an average of just 32%. All of these countries are in Eastern Europe. The best-case scenario sees LICs and LMICs reaching this point as soon as 2020. This is a major leap of faith. It would appear that the growth rates achieved prior to the 2008 crisis were a symptom of a specific, distinct growth period that is unlikely to be repeated, certainly over a longer period of time. Additionally, on closer inspection of the data, it appears that a number of countries with particularly low industrial employment shares did not have data for 2006, 2007 or 2008, which artificially increased the LDC average for these years. We thus use
Annex figure 21: Industrial share of GDP in East Asia & Pacific
2000 2010 2020 20301990 2005 2015 20251995
Indu
stria
l sha
re o
f GDP
in E
ast A
sia
and
Paci
�c L
DCs
(%)
East Asia and Paci�c TargetEast Asia and Paci�c Projection
0
45
15
30
10
25
40
35
5
20
Source: Authors’ calculations
Annex figure 22: Industrial share of GDP in sub-Saharan Africa
2000 2010 2020 20301990 2005 2015 20251995
Indu
stria
l sha
re o
f GDP
in S
ub-S
ahar
an A
frica
LDC
s (%
)
Sub-Saharan Africa TargetSub-Saharan Africa Projection
0
50
40
30
20
10
Source: Authors’ calculations
Annex figure 23: Industrial share of employment (globally)
Indu
stria
l sha
re o
f em
ploy
men
t in
LICs
and
LM
ICs
(%)
Actual TargetProjection
0
45
15
30
10
25
40
35
5
20
2000 2010 2020 20301990 2005 2015 20251995
Source: Authors’ calculations

the medium-term projection, based on the 10-year trend, forecasting a 23% share in 2030, as our selected projection.
The projection shows that LDCs would have to progress more than four times faster to meet Target 9.2 by 2030, thus producing an E grade.
The average industrial share of employment, globally, actually declined over the past 22 years. This decline in industrial employment is a well-known trend, in part created by the growth of services, as well as the falling levels of employment required by manufacturing. This makes it even less likely that LDCs, LICs and LMICs can achieve the growth in industrial employment expected by the SDGs.
Goal 10 – Reduce inequality within and among countries (grade F)
Targets • 10.1 By 2030 progressively achieve and sustain income
growth of the bottom 40% of the population at a rate higher than the national average
• 10.2 By 2030 empower and promote the social, economic and political inclusion of all irrespective of age, sex, disability, race, ethnicity, origin, religion or economic or other status
• 10.3 Ensure equal opportunity and reduce inequalities of outcome, including through eliminating discriminatory laws, policies and practices and promoting appropriate legislation, policies and actions in this regard
• 10.4 Adopt policies especially fiscal, wage, and social protection policies and progressively achieve greater equality
• 10.5 Improve regulation and monitoring of global financial markets and institutions and strengthen implementation of such regulations
• 10.6 Ensure enhanced representation and voice of developing countries in decision making in global international economic and financial institutions in order to deliver more effective, credible, accountable and legitimate institutions
• 10.7 Facilitate orderly, safe, regular and responsible migration and mobility of people, including through implementation of planned and well-managed migration policies
Why focus on Target 10.1?Of the Goal 10 targets, Target 10.1 appears the most appropriate for projections. Whereas other targets only seek progress in the inputs that can help reduce inequality, Target 10.1 seeks change in a key indicator that reflects experienced inequality.
Other targets focus on improving regulations, policies and opportunities that can create or reduce inequalities. These are obviously important. Target 10.b, which seeks to ‘encourage ODA and financial flows, including foreign direct investment’ to LDCs, could be suitable for forming projections, focusing on aid and FDI flows to certain
countries. However, no quantitative objective is provided to compare projections against. Available data on aid flows and FDI flows, especially to certain countries, is also disputed. Only Target 10.c has a clear quantitative target (other than Target 10.1) that can be projected against. However, we don’t possess accurate and to-hand data, country-by-country, that could be used to build global, country-level projections. Moreover, this target on remittances is, again, merely a target on one of the many inputs into the fight against inequality, as opposed to an overall reflection on inequality, as Target 10.1 is.
Target 10.1 can be projected against, as there is available country-by-county data, tracking consumption or income growth for the bottom 40% and the national average. This is not the case for other Goal 10 targets. It seeks to achieve a direct reduction in country-level income inequality through growth of domestic ‘bottom 40%’ cohorts outpacing national growth. It thus looks at an actual indicator of inequality as opposed to an input into inequality. It is arguably the most important target contained within the goal and, within Goal 10, will likely be the target that’s most desired by citizens around the world.
Basis of projections No relevant studies were found that attempted to project future bottom 40% growth against national means.
There have been many attempts to predict future changes in income or wealth inequality. However, studies like these have not attempted a comprehensive country-by-country assessment (including all countries of the world, from all stages of development and wealth), focusing on the bottom 40%, as the target intends.
As a result, ODI produced its own projections for the target. We have used data from the World Bank’s PovcalNet database to analyse household surveys.
GloballyCountry-specific averages, for the difference in average annual growth rates between the bottom 40% of the population and the national mean are based on the growth in income or consumption for the bottom 40% and the mean, from the first to the last year, recorded by household surveys.
ODI’s projections suggest that the world, as a whole, will fail Target 10.1’s aim of achieving greater income growth amongst the bottom 40%, compared to the national average. This is assuming both recent and long-term trends are sustained. Both projections based on recent data, from 1998-2012, and longer-term data, 1981-2012, show similar futures of mean averages exceeding the growth of the bottom 40% annually by -0.45% percentage points.
It is important to note that our country growth data was weighted by population to produce the global average. Recent growth data produced a population-weighted average annual national growth rate of 3.8% against a bottom 40% average growth rate of around 3.3%.
Annex to Projecting progress – reaching the SDGs by 2030 21
22 Development Progress Flagship Report
Amongst longer-term country data, this showed 3.0% national growth against 2.5% bottom 40% growth.
The projection shows that the world is projected to increase in inequality, actually regressing from the status quo and thus needing to change direction to make gains toward Target 10.1, thus producing an F grade.
The target appears to imply that all countries should achieve higher growth amongst the bottom 40%. We found that around half of the countries with available data did achieve higher average annual rates of growth for the bottom 40%. 63 of 104 countries (61%) displayed higher bottom 40% growth.
The target also suggests that higher bottom 40% growth should be ‘sustained’. We have only looked at multi-year annual averages. We are unfortunately unable to assess how often (i.e. in how many years) each country achieved higher bottom 40% growth.
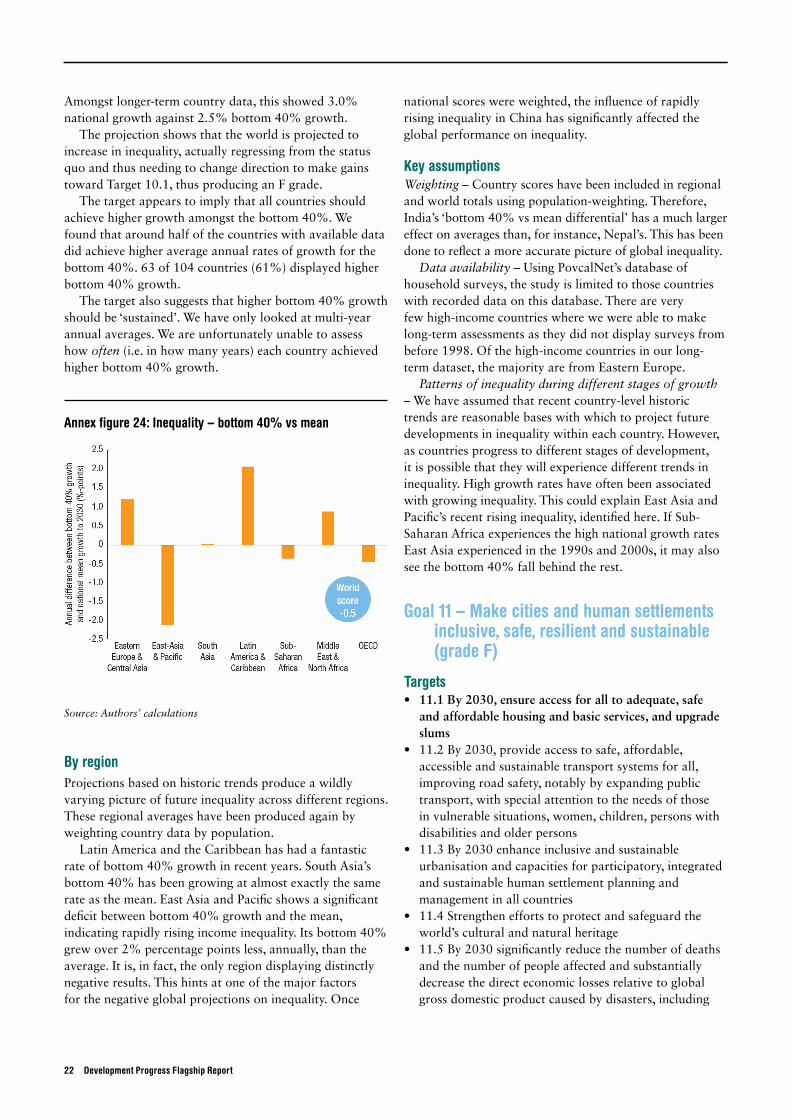
By regionProjections based on historic trends produce a wildly varying picture of future inequality across different regions. These regional averages have been produced again by weighting country data by population.
Latin America and the Caribbean has had a fantastic rate of bottom 40% growth in recent years. South Asia’s bottom 40% has been growing at almost exactly the same rate as the mean. East Asia and Pacific shows a significant deficit between bottom 40% growth and the mean, indicating rapidly rising income inequality. Its bottom 40% grew over 2% percentage points less, annually, than the average. It is, in fact, the only region displaying distinctly negative results. This hints at one of the major factors for the negative global projections on inequality. Once
national scores were weighted, the influence of rapidly rising inequality in China has significantly affected the global performance on inequality.
Key assumptionsWeighting – Country scores have been included in regional and world totals using population-weighting. Therefore, India’s ‘bottom 40% vs mean differential’ has a much larger effect on averages than, for instance, Nepal’s. This has been done to reflect a more accurate picture of global inequality.
Data availability – Using PovcalNet’s database of household surveys, the study is limited to those countries with recorded data on this database. There are very few high-income countries where we were able to make long-term assessments as they did not display surveys from before 1998. Of the high-income countries in our long-term dataset, the majority are from Eastern Europe.
Patterns of inequality during different stages of growth – We have assumed that recent country-level historic trends are reasonable bases with which to project future developments in inequality within each country. However, as countries progress to different stages of development, it is possible that they will experience different trends in inequality. High growth rates have often been associated with growing inequality. This could explain East Asia and Pacific’s recent rising inequality, identified here. If Sub-Saharan Africa experiences the high national growth rates East Asia experienced in the 1990s and 2000s, it may also see the bottom 40% fall behind the rest.
Goal 11 – Make cities and human settlements inclusive, safe, resilient and sustainable (grade F)
Targets • 11.1 By 2030, ensure access for all to adequate, safe
and affordable housing and basic services, and upgrade slums
• 11.2 By 2030, provide access to safe, affordable, accessible and sustainable transport systems for all, improving road safety, notably by expanding public transport, with special attention to the needs of those in vulnerable situations, women, children, persons with disabilities and older persons
• 11.3 By 2030 enhance inclusive and sustainable urbanisation and capacities for participatory, integrated and sustainable human settlement planning and management in all countries
• 11.4 Strengthen efforts to protect and safeguard the world’s cultural and natural heritage
• 11.5 By 2030 significantly reduce the number of deaths and the number of people affected and substantially decrease the direct economic losses relative to global gross domestic product caused by disasters, including
Annex figure 24: Inequality – bottom 40% vs mean
Source: Authors’ calculations

3 http://unhabitat.org/wp-content/uploads/2003/07/GRHSPR1.pdf
water-related disasters, with the focus on protecting the poor and people in vulnerable situations
• 11.6 By 2030, reduce the adverse per capita environmental impact of cities, including by paying special attention to air quality, municipal and other waste management
• 11.7 By 2030, provide universal access to safe, inclusive and accessible, green and public spaces, particularly for women and children, older persons and persons with disabilities
Why focus on Target 11.1?SDG11 calls on states to improve the quality of settlements and to reduce their vulnerabilities to disasters by making the necessary investments in housing, services, waste management and transport infrastructure. Target 11.1 has been chosen because of the central importance of housing infrastructure to quality of life, health and disaster risk-reduction objectives (Gencer, 2013). Improving housing services will thus go part of the way to meeting the other targets in Goal 11.
Continuing with the precedent set by the MDGs, the indicator chosen for this goal is the number of urban slum-dwellers, with the target set that the slum population should not rise above current levels by 2030. This is a conservative target but one that, given the projected pace of urbanisation, will still require substantial investments in infrastructure by municipal authorities over the next 15 years.
Basis of projections In the desk research conducted for this study, there was only one other major study that had attempted to project future slum populations. UN-Habitat projected the total number of people living in slums would increase to around 2 billion by 2030.3 However, this was in 2003, 12 years ago. It makes sense to produce a more up-to-date projection.
Using available data on slum-dweller populations from UN-Habitat’s Global Urban Indicators database, we projected future populations living in slums within developing regions. Slum-population figures in this database cover the period 1990-2012 and are based on data extracted from national-level surveys, censuses and sub-regional surveys. The number of people living in ‘slum-like conditions’ was based on certain criteria including crowding (size of living area), access to services and security of tenure. Corresponding indicators within the assessed surveys provided data on the numbers of people meeting such slum-like conditions, with further modelling work conducted by UN-Habitat to produce regional annual totals. This produces data that aligns with Target 11.1, in that slums that are successfully upgraded should, one hopes, mean people move out and away from these slum-like conditions.
Given the current trend for increasing numbers of slum-dwellers alongside urban growth, we decided to set the quantitative target as simply achieving a reduced slum population by 2030, globally and regionally. The principles and assumptions involved in these projections are discussed below in ‘Key assumptions’.
GloballyODI’s projections show that the world is likely to see increasing slum populations to 2030. This would mean missing our assigned quantitative target of a fall in slum populations by 2030. In all three scenarios, using the trend from 1990-2012 (22-year trend), 2000-2012 (12-year trend) and, the most optimistic scenario, taking the trend from 2005-2010 (5-year best trend), the slum populations in developing regions are expected to rise.
The projection based on the most recent 12 years of data is the most pessimistic, expecting a nearly 40% increase in the global slum population by 2030. Based on data since 1990, we only project only an 18% increase from 2012. The most optimistic projection, based on 2005-2010 performance data, shows only a 12% rise in slum dwellers. Interestingly, our projections produce a far less concerning picture than the projections made by UN-Habitat in 2003, forecasting 2 billion slum dwellers by 2030. Our most pessimistic scenario forecasts just over 1.2 billion slum dwellers by the end of the SDGs.
The projection shows that slum populations are forecasted to increase rather than decrease in coming years. As a result, Target 11.1 is given an F grade projection.
Annex to Projecting progress – reaching the SDGs by 2030 23
Annex figure 25: Developing regions – number of slum dwellers (millions)
0
200
400
600
800
1,000
1,200
1990 1995 2000 2005 2010 2015 2020 2025 2030
Slum
dw
elle
rs (m
illio
ns)
Developing regions TargetDeveloping regions projection
Source: Authors’ calculations

24 Development Progress Flagship Report
By regionFour regions dominate both current and future expected slum populations globally. East Asia, South Asia, Sub-Saharan Africa and Latin America and the Caribbean contain 85% of the world’s current (2012) slum population. We choose therefore to focus on their regional projections here for analysis.
The figure below looks at the region with the largest slum population and the most alarming projections – Sub-Saharan Africa. With over 213 million slum dwellers in 2012, our projection sees this rising to over 360 million by 2030. This is based on the trend since 1990.
The other three regions display a mixed picture for projections. East Asia’s projections are of the most concern, showing significant increases to 2030.
Key assumptionsThe projections produced extrapolate recent trends in the absolute numbers of slum-dwellers. It has not attempted to predict the development of urban populations as a whole, of which slum populations are a by-product. We have also not attempted to ask the more difficult question of projecting the proportion of an urban or national population living in slums. This would require not only forecasting the growth in slum populations but also the growth in urban and national populations. The development of slum populations is inherently a by-product of urban population growth or decline. It was deemed a more consistent task to project growth in slum populations based on recent increases and decreases in total populations as this would involve fewer ‘unknowns’.
Annex figure 28: Latin America and Caribbean – number of slum dwellers (millions)
2000 2010 2020 20301990 2005 2015 202519950
1,400
1,200
1,000
800
600
400
200
Slum
dw
elle
rs (m
illio
ns)
Latin America & Caribbean TargetLatin American & Caribbean projectionAnnex figure 26: sub-Saharan Africa – number of slum
dwellers (millions)
2000 2010 2020 20301990 2005 2015 202519950
400
350
300
250
200
150
100
50
Slum
dw
elle
rs (m
illio
ns)
Sub-Saharan Africa TargetSub-Saharan Africa projection
Source: Authors’ calculations
Annex figure 29: South Asia – number of slum dwellers (millions)
2000 2010 2020 20301990 2005 2015 202519950
250
200
150
100
50
Slum
dw
elle
rs (m
illio
ns)
South Asia TargetSouth Asia projection
Source: Authors’ calculations
Annex figure 27: South-East Asia – number of slum dwellers (millions)
2000 2010 2020 20301990 2005 2015 202519950
100
80
60
40
20
Slum
dw
elle
rs (m
illio
ns)
South-East Asia TargetSouth-East Asia projection
Source: Authors’ calculations
Source: Authors’ calculations
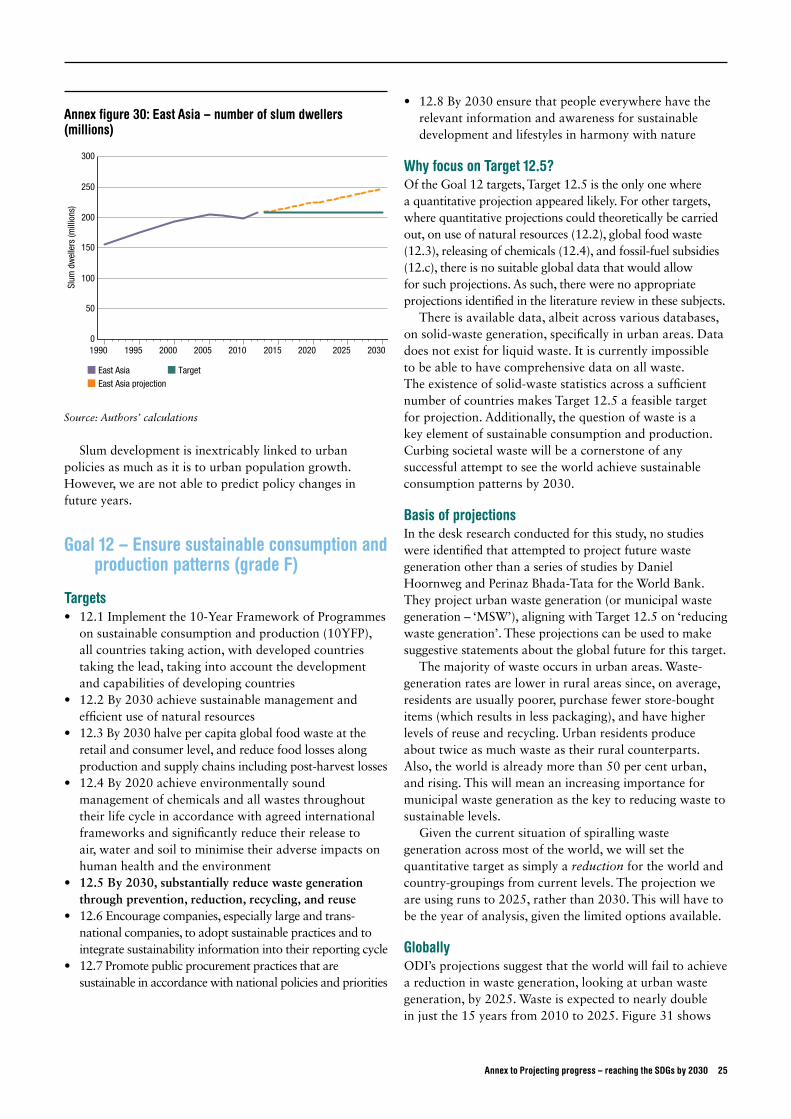
Slum development is inextricably linked to urban policies as much as it is to urban population growth. However, we are not able to predict policy changes in future years.
Goal 12 – Ensure sustainable consumption and production patterns (grade F)
Targets • 12.1 Implement the 10-Year Framework of Programmes
on sustainable consumption and production (10YFP), all countries taking action, with developed countries taking the lead, taking into account the development and capabilities of developing countries
• 12.2 By 2030 achieve sustainable management and efficient use of natural resources
• 12.3 By 2030 halve per capita global food waste at the retail and consumer level, and reduce food losses along production and supply chains including post-harvest losses
• 12.4 By 2020 achieve environmentally sound management of chemicals and all wastes throughout their life cycle in accordance with agreed international frameworks and significantly reduce their release to air, water and soil to minimise their adverse impacts on human health and the environment
• 12.5 By 2030, substantially reduce waste generation through prevention, reduction, recycling, and reuse
• 12.6 Encourage companies, especially large and trans-national companies, to adopt sustainable practices and to integrate sustainability information into their reporting cycle
• 12.7 Promote public procurement practices that are sustainable in accordance with national policies and priorities
• 12.8 By 2030 ensure that people everywhere have the relevant information and awareness for sustainable development and lifestyles in harmony with nature
Why focus on Target 12.5?Of the Goal 12 targets, Target 12.5 is the only one where a quantitative projection appeared likely. For other targets, where quantitative projections could theoretically be carried out, on use of natural resources (12.2), global food waste (12.3), releasing of chemicals (12.4), and fossil-fuel subsidies (12.c), there is no suitable global data that would allow for such projections. As such, there were no appropriate projections identified in the literature review in these subjects.
There is available data, albeit across various databases, on solid-waste generation, specifically in urban areas. Data does not exist for liquid waste. It is currently impossible to be able to have comprehensive data on all waste. The existence of solid-waste statistics across a sufficient number of countries makes Target 12.5 a feasible target for projection. Additionally, the question of waste is a key element of sustainable consumption and production. Curbing societal waste will be a cornerstone of any successful attempt to see the world achieve sustainable consumption patterns by 2030.
Basis of projections In the desk research conducted for this study, no studies were identified that attempted to project future waste generation other than a series of studies by Daniel Hoornweg and Perinaz Bhada-Tata for the World Bank. They project urban waste generation (or municipal waste generation – ‘MSW’), aligning with Target 12.5 on ‘reducing waste generation’. These projections can be used to make suggestive statements about the global future for this target.
The majority of waste occurs in urban areas. Waste-generation rates are lower in rural areas since, on average, residents are usually poorer, purchase fewer store-bought items (which results in less packaging), and have higher levels of reuse and recycling. Urban residents produce about twice as much waste as their rural counterparts. Also, the world is already more than 50 per cent urban, and rising. This will mean an increasing importance for municipal waste generation as the key to reducing waste to sustainable levels.
Given the current situation of spiralling waste generation across most of the world, we will set the quantitative target as simply a reduction for the world and country-groupings from current levels. The projection we are using runs to 2025, rather than 2030. This will have to be the year of analysis, given the limited options available.
GloballyODI’s projections suggest that the world will fail to achieve a reduction in waste generation, looking at urban waste generation, by 2025. Waste is expected to nearly double in just the 15 years from 2010 to 2025. Figure 31 shows
Annex to Projecting progress – reaching the SDGs by 2030 25
Annex figure 30: East Asia – number of slum dwellers (millions)
2000 2010 2020 20301990 2005 2015 202519950
300
250
200
150
100
50
Slum
dw
elle
rs (m
illio
ns)
East Asia TargetEast Asia projection
Source: Authors’ calculations
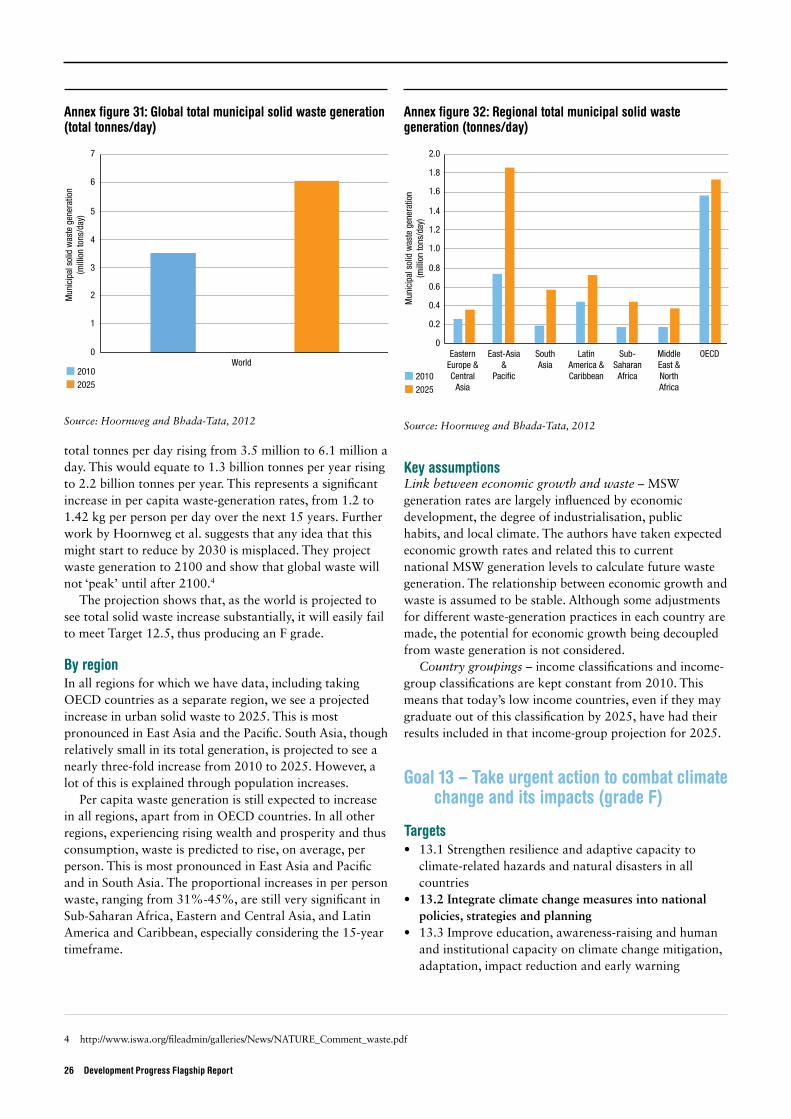
26 Development Progress Flagship Report
total tonnes per day rising from 3.5 million to 6.1 million a day. This would equate to 1.3 billion tonnes per year rising to 2.2 billion tonnes per year. This represents a significant increase in per capita waste-generation rates, from 1.2 to 1.42 kg per person per day over the next 15 years. Further work by Hoornweg et al. suggests that any idea that this might start to reduce by 2030 is misplaced. They project waste generation to 2100 and show that global waste will not ‘peak’ until after 2100.4
The projection shows that, as the world is projected to see total solid waste increase substantially, it will easily fail to meet Target 12.5, thus producing an F grade.
By region In all regions for which we have data, including taking OECD countries as a separate region, we see a projected increase in urban solid waste to 2025. This is most pronounced in East Asia and the Pacific. South Asia, though relatively small in its total generation, is projected to see a nearly three-fold increase from 2010 to 2025. However, a lot of this is explained through population increases.
Per capita waste generation is still expected to increase in all regions, apart from in OECD countries. In all other regions, experiencing rising wealth and prosperity and thus consumption, waste is predicted to rise, on average, per person. This is most pronounced in East Asia and Pacific and in South Asia. The proportional increases in per person waste, ranging from 31%-45%, are still very significant in Sub-Saharan Africa, Eastern and Central Asia, and Latin America and Caribbean, especially considering the 15-year timeframe.
Key assumptionsLink between economic growth and waste – MSW generation rates are largely influenced by economic development, the degree of industrialisation, public habits, and local climate. The authors have taken expected economic growth rates and related this to current national MSW generation levels to calculate future waste generation. The relationship between economic growth and waste is assumed to be stable. Although some adjustments for different waste-generation practices in each country are made, the potential for economic growth being decoupled from waste generation is not considered.
Country groupings – income classifications and income-group classifications are kept constant from 2010. This means that today’s low income countries, even if they may graduate out of this classification by 2025, have had their results included in that income-group projection for 2025.
Goal 13 – Take urgent action to combat climate change and its impacts (grade F)
Targets • 13.1 Strengthen resilience and adaptive capacity to
climate-related hazards and natural disasters in all countries
• 13.2 Integrate climate change measures into national policies, strategies and planning
• 13.3 Improve education, awareness-raising and human and institutional capacity on climate change mitigation, adaptation, impact reduction and early warning
4 http://www.iswa.org/fileadmin/galleries/News/NATURE_Comment_waste.pdf
Annex figure 31: Global total municipal solid waste generation (total tonnes/day)
1
0
7
6
5
4
3
2Mun
icip
al s
olid
was
te g
ener
atio
n(m
illio
n to
ns/d
ay)
World
20252010
Source: Hoornweg and Bhada-Tata, 2012
Annex figure 32: Regional total municipal solid waste generation (tonnes/day)
0
2.0
0.4
0.6
0.8
1.0
1.2
1.4
1.6
1.8
0.2
Mun
icip
al s
olid
was
te g
ener
atio
n(m
illio
n to
ns/d
ay)
20252010
OECDSouthAsia
MiddleEast &NorthAfrica
LatinAmerica &Caribbean
EasternEurope &Central
Asia
East-Asia&
Paci�c
Sub-SaharanAfrica
Source: Hoornweg and Bhada-Tata, 2012
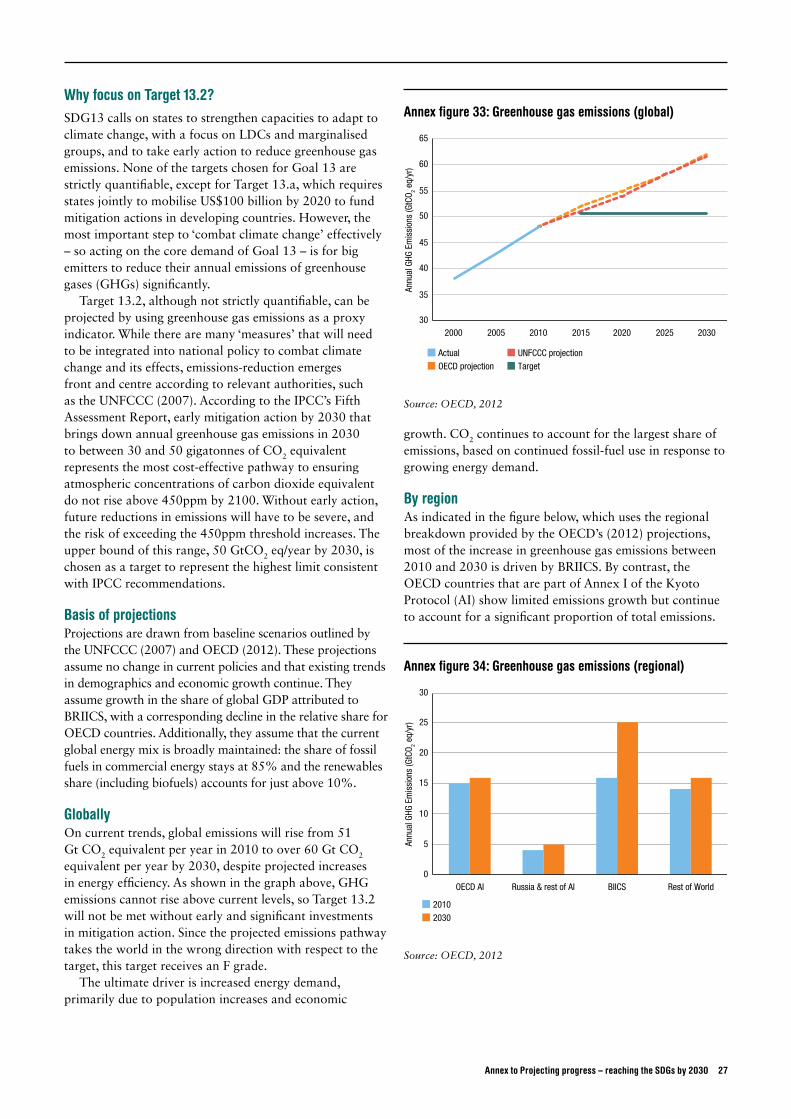
Why focus on Target 13.2?SDG13 calls on states to strengthen capacities to adapt to climate change, with a focus on LDCs and marginalised groups, and to take early action to reduce greenhouse gas emissions. None of the targets chosen for Goal 13 are strictly quantifiable, except for Target 13.a, which requires states jointly to mobilise US$100 billion by 2020 to fund mitigation actions in developing countries. However, the most important step to ‘combat climate change’ effectively – so acting on the core demand of Goal 13 – is for big emitters to reduce their annual emissions of greenhouse gases (GHGs) significantly.
Target 13.2, although not strictly quantifiable, can be projected by using greenhouse gas emissions as a proxy indicator. While there are many ‘measures’ that will need to be integrated into national policy to combat climate change and its effects, emissions-reduction emerges front and centre according to relevant authorities, such as the UNFCCC (2007). According to the IPCC’s Fifth Assessment Report, early mitigation action by 2030 that brings down annual greenhouse gas emissions in 2030 to between 30 and 50 gigatonnes of CO2 equivalent represents the most cost-effective pathway to ensuring atmospheric concentrations of carbon dioxide equivalent do not rise above 450ppm by 2100. Without early action, future reductions in emissions will have to be severe, and the risk of exceeding the 450ppm threshold increases. The upper bound of this range, 50 GtCO2 eq/year by 2030, is chosen as a target to represent the highest limit consistent with IPCC recommendations.
Basis of projectionsProjections are drawn from baseline scenarios outlined by the UNFCCC (2007) and OECD (2012). These projections assume no change in current policies and that existing trends in demographics and economic growth continue. They assume growth in the share of global GDP attributed to BRIICS, with a corresponding decline in the relative share for OECD countries. Additionally, they assume that the current global energy mix is broadly maintained: the share of fossil fuels in commercial energy stays at 85% and the renewables share (including biofuels) accounts for just above 10%.
GloballyOn current trends, global emissions will rise from 51 Gt CO2 equivalent per year in 2010 to over 60 Gt CO2 equivalent per year by 2030, despite projected increases in energy efficiency. As shown in the graph above, GHG emissions cannot rise above current levels, so Target 13.2 will not be met without early and significant investments in mitigation action. Since the projected emissions pathway takes the world in the wrong direction with respect to the target, this target receives an F grade.
The ultimate driver is increased energy demand, primarily due to population increases and economic
growth. CO2 continues to account for the largest share of emissions, based on continued fossil-fuel use in response to growing energy demand.
By regionAs indicated in the figure below, which uses the regional breakdown provided by the OECD’s (2012) projections, most of the increase in greenhouse gas emissions between 2010 and 2030 is driven by BRIICS. By contrast, the OECD countries that are part of Annex I of the Kyoto Protocol (AI) show limited emissions growth but continue to account for a significant proportion of total emissions.
Annex to Projecting progress – reaching the SDGs by 2030 27
Annex figure 33: Greenhouse gas emissions (global)
2010 20152000 2005 2020 2025 203030
65
40
35
50
45
60
55
Annu
al G
HG E
mis
sion
s (G
tCO 2 e
q/yr
)
Actual UNFCCC projectionTargetOECD projection
Source: OECD, 2012
Annex figure 34: Greenhouse gas emissions (regional)
Russia & rest of AIOECD AI Rest of WorldBIICS0
30
25
20
15
10
5Annu
al G
HG E
mis
sion
s (G
tCO 2 e
q/yr
)
20102030
Source: OECD, 2012
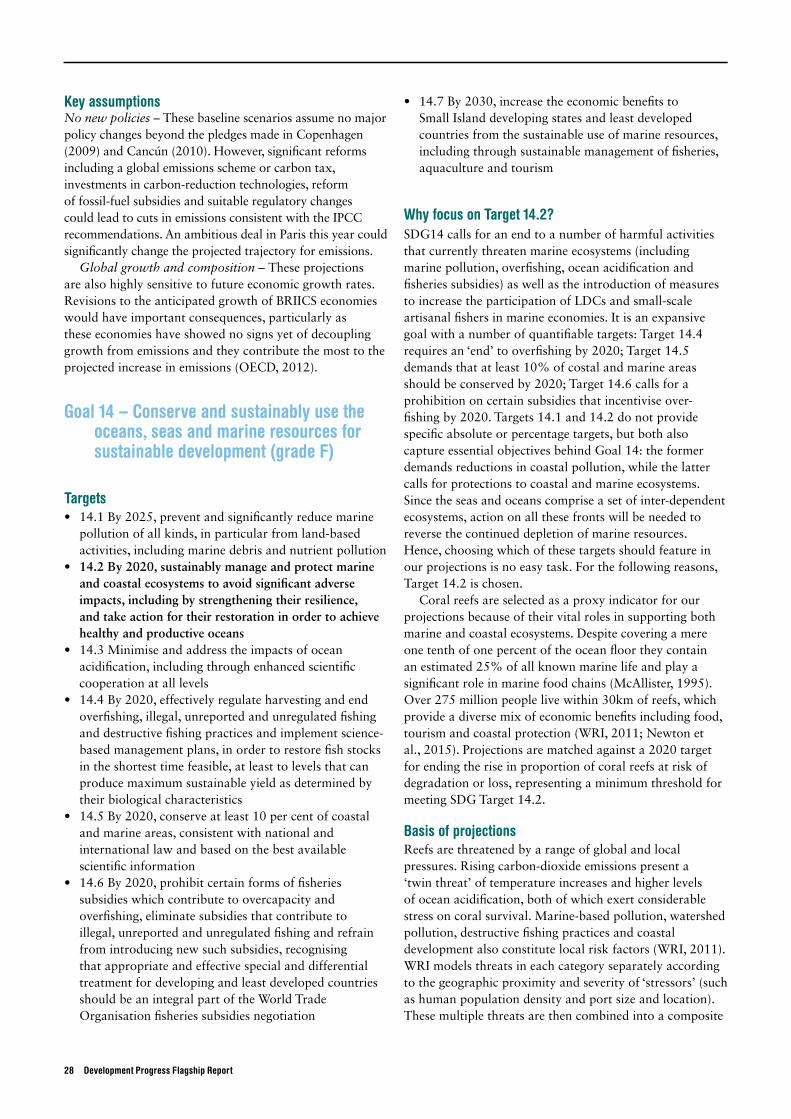
28 Development Progress Flagship Report
Key assumptionsNo new policies – These baseline scenarios assume no major policy changes beyond the pledges made in Copenhagen (2009) and Cancún (2010). However, significant reforms including a global emissions scheme or carbon tax, investments in carbon-reduction technologies, reform of fossil-fuel subsidies and suitable regulatory changes could lead to cuts in emissions consistent with the IPCC recommendations. An ambitious deal in Paris this year could significantly change the projected trajectory for emissions.
Global growth and composition – These projections are also highly sensitive to future economic growth rates. Revisions to the anticipated growth of BRIICS economies would have important consequences, particularly as these economies have showed no signs yet of decoupling growth from emissions and they contribute the most to the projected increase in emissions (OECD, 2012).
Goal 14 – Conserve and sustainably use the oceans, seas and marine resources for sustainable development (grade F)
Targets • 14.1 By 2025, prevent and significantly reduce marine
pollution of all kinds, in particular from land-based activities, including marine debris and nutrient pollution
• 14.2 By 2020, sustainably manage and protect marine and coastal ecosystems to avoid significant adverse impacts, including by strengthening their resilience, and take action for their restoration in order to achieve healthy and productive oceans
• 14.3 Minimise and address the impacts of ocean acidification, including through enhanced scientific cooperation at all levels
• 14.4 By 2020, effectively regulate harvesting and end overfishing, illegal, unreported and unregulated fishing and destructive fishing practices and implement science-based management plans, in order to restore fish stocks in the shortest time feasible, at least to levels that can produce maximum sustainable yield as determined by their biological characteristics
• 14.5 By 2020, conserve at least 10 per cent of coastal and marine areas, consistent with national and international law and based on the best available scientific information
• 14.6 By 2020, prohibit certain forms of fisheries subsidies which contribute to overcapacity and overfishing, eliminate subsidies that contribute to illegal, unreported and unregulated fishing and refrain from introducing new such subsidies, recognising that appropriate and effective special and differential treatment for developing and least developed countries should be an integral part of the World Trade Organisation fisheries subsidies negotiation
• 14.7 By 2030, increase the economic benefits to Small Island developing states and least developed countries from the sustainable use of marine resources, including through sustainable management of fisheries, aquaculture and tourism
Why focus on Target 14.2?SDG14 calls for an end to a number of harmful activities that currently threaten marine ecosystems (including marine pollution, overfishing, ocean acidification and fisheries subsidies) as well as the introduction of measures to increase the participation of LDCs and small-scale artisanal fishers in marine economies. It is an expansive goal with a number of quantifiable targets: Target 14.4 requires an ‘end’ to overfishing by 2020; Target 14.5 demands that at least 10% of costal and marine areas should be conserved by 2020; Target 14.6 calls for a prohibition on certain subsidies that incentivise over-fishing by 2020. Targets 14.1 and 14.2 do not provide specific absolute or percentage targets, but both also capture essential objectives behind Goal 14: the former demands reductions in coastal pollution, while the latter calls for protections to coastal and marine ecosystems. Since the seas and oceans comprise a set of inter-dependent ecosystems, action on all these fronts will be needed to reverse the continued depletion of marine resources. Hence, choosing which of these targets should feature in our projections is no easy task. For the following reasons, Target 14.2 is chosen.
Coral reefs are selected as a proxy indicator for our projections because of their vital roles in supporting both marine and coastal ecosystems. Despite covering a mere one tenth of one percent of the ocean floor they contain an estimated 25% of all known marine life and play a significant role in marine food chains (McAllister, 1995). Over 275 million people live within 30km of reefs, which provide a diverse mix of economic benefits including food, tourism and coastal protection (WRI, 2011; Newton et al., 2015). Projections are matched against a 2020 target for ending the rise in proportion of coral reefs at risk of degradation or loss, representing a minimum threshold for meeting SDG Target 14.2.
Basis of projectionsReefs are threatened by a range of global and local pressures. Rising carbon-dioxide emissions present a ‘twin threat’ of temperature increases and higher levels of ocean acidification, both of which exert considerable stress on coral survival. Marine-based pollution, watershed pollution, destructive fishing practices and coastal development also constitute local risk factors (WRI, 2011). WRI models threats in each category separately according to the geographic proximity and severity of ‘stressors’ (such as human population density and port size and location). These multiple threats are then combined into a composite
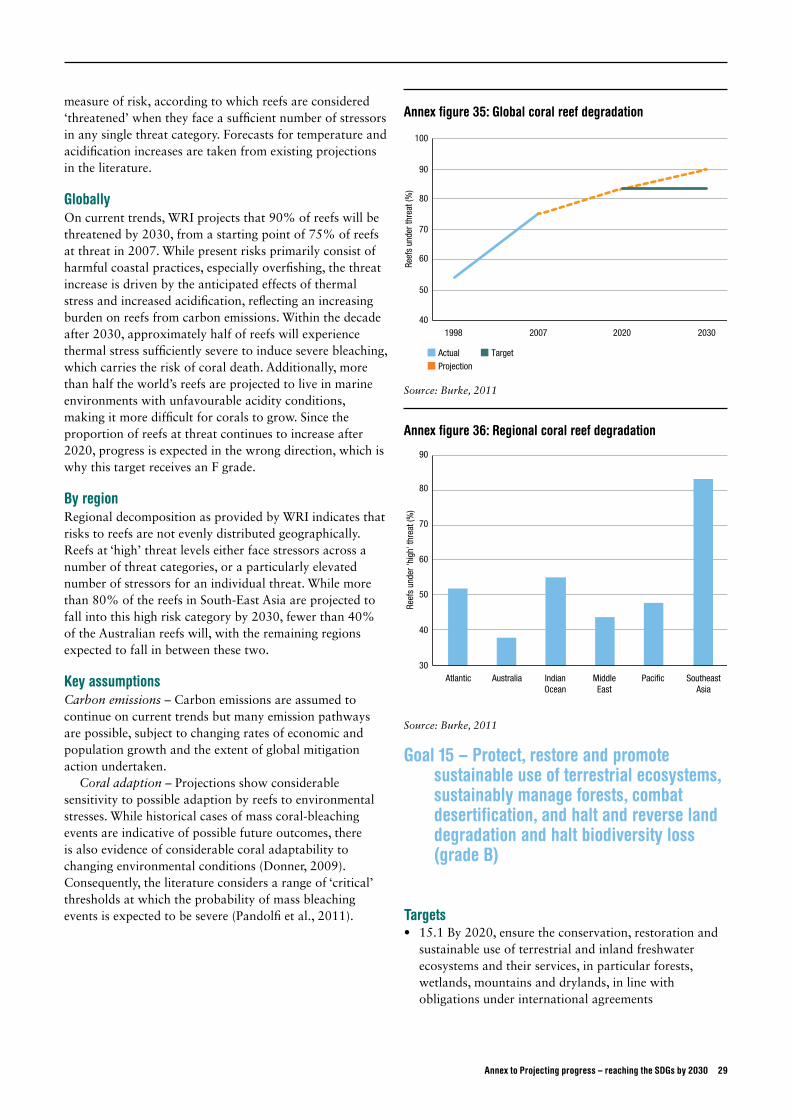
measure of risk, according to which reefs are considered ‘threatened’ when they face a sufficient number of stressors in any single threat category. Forecasts for temperature and acidification increases are taken from existing projections in the literature.
GloballyOn current trends, WRI projects that 90% of reefs will be threatened by 2030, from a starting point of 75% of reefs at threat in 2007. While present risks primarily consist of harmful coastal practices, especially overfishing, the threat increase is driven by the anticipated effects of thermal stress and increased acidification, reflecting an increasing burden on reefs from carbon emissions. Within the decade after 2030, approximately half of reefs will experience thermal stress sufficiently severe to induce severe bleaching, which carries the risk of coral death. Additionally, more than half the world’s reefs are projected to live in marine environments with unfavourable acidity conditions, making it more difficult for corals to grow. Since the proportion of reefs at threat continues to increase after 2020, progress is expected in the wrong direction, which is why this target receives an F grade.
By regionRegional decomposition as provided by WRI indicates that risks to reefs are not evenly distributed geographically. Reefs at ‘high’ threat levels either face stressors across a number of threat categories, or a particularly elevated number of stressors for an individual threat. While more than 80% of the reefs in South-East Asia are projected to fall into this high risk category by 2030, fewer than 40% of the Australian reefs will, with the remaining regions expected to fall in between these two.
Key assumptionsCarbon emissions – Carbon emissions are assumed to continue on current trends but many emission pathways are possible, subject to changing rates of economic and population growth and the extent of global mitigation action undertaken.
Coral adaption – Projections show considerable sensitivity to possible adaption by reefs to environmental stresses. While historical cases of mass coral-bleaching events are indicative of possible future outcomes, there is also evidence of considerable coral adaptability to changing environmental conditions (Donner, 2009). Consequently, the literature considers a range of ‘critical’ thresholds at which the probability of mass bleaching events is expected to be severe (Pandolfi et al., 2011).
Goal 15 – Protect, restore and promote sustainable use of terrestrial ecosystems, sustainably manage forests, combat desertification, and halt and reverse land degradation and halt biodiversity loss (grade B)
Targets • 15.1 By 2020, ensure the conservation, restoration and
sustainable use of terrestrial and inland freshwater ecosystems and their services, in particular forests, wetlands, mountains and drylands, in line with obligations under international agreements
Annex to Projecting progress – reaching the SDGs by 2030 29
Annex figure 35: Global coral reef degradation
20071998 2020 203040
100
90
80
70
60
50
Reef
s un
der t
hrea
t (%
)
Actual TargetProjection
Annex figure 36: Regional coral reef degradation
Australia IndianOcean
MiddleEast
Paci�c SoutheastAsia
Atlantic30
90
50
40
60
80
70
Reef
s un
der '
high
' thr
eat (
%)
Source: Burke, 2011
Source: Burke, 2011

30 Development Progress Flagship Report
• 15.2 By 2020, promote the implementation of sustainable management of all types of forests, halt deforestation, restore degraded forests and substantially increase afforestation and reforestation globally
• 15.3 By 2020, combat desertification, restore degraded land and soil, including land affected by desertification, drought and floods, and strive to achieve a land degradation-neutral world
• 15.4 By 2030, ensure the conservation of mountain ecosystems, including their biodiversity, in order to enhance their capacity to provide benefits that are essential for sustainable development
• 15.5 Take urgent and significant action to reduce the degradation of natural habitats, halt the loss of biodiversity and, by 2020, protect and prevent the extinction of threatened species
• 15.6 Ensure fair and equitable sharing of the benefits arising from the utilisation of genetic resources and promote appropriate access to such resources
• 15.7 Take urgent action to end poaching and trafficking of protected species of flora and fauna and address both demand and supply of illegal wildlife products
• 15.8 By 2020, introduce measures to prevent the introduction and significantly reduce the impact of invasive alien species on land and water ecosystems and control or eradicate the priority species
• 15.9 By 2020, integrate ecosystem and biodiversity values into national and local planning, development processes, poverty reduction strategies and accounts
Why focus on Target 15.2?SDG15 is an expansive goal that includes a number of environmental targets relating to the regeneration and conservation of soil quality, land and water ecosystems, biodiversity and forest cover. It also calls on states to strengthen governance mechanisms to tackle better the illicit trading of protected species of flora and fauna. Only a few of these targets are quantifiable: Target 15.2 calls on the international community to ‘halt’ deforestation, Target 15.5 calls on states to do the same regarding biodiversity loss, and Target 15.7 calls for an ‘end’ to poaching. Targets 15.1 and 15.3, while important to the spirit of Goal 15, do not provide quantifiable indicators. Target 15.2, the deforestation target, is chosen as our quantifiable target for the reasons set out below.
Firstly, forest cover is chosen as a proxy indicator for Goal 15 because of the diversity of roles played by forests in preserving ecosystems including: habitat provision, water regulation, erosion prevention and carbon sequestration. Additionally, direct harvesting of forest products by rural families is estimated to provide more than 50% of total consumption and household needs in some parts of the developing world (MEA, 2005). Maintaining healthy forest cover is thus critical to success in many of the other targets included in Goal 15: combatting soil degradation,
preserving biodiversity and existing ecosystems, and harbouring resources useful for rural communities.
Secondly, projections that exist in the literature for some of the other targets are problematic. The OECD produces a set of projections for biodiversity loss through to 2030, but its measure of biodiversity (mean species abundance) imperfectly captures the various channels through which biodiversity is valuable or productive for human purposes. Projections by DARA consider the likely increase in population affected by desertification, but their projections forecast that a very small share of the world population (10 million people) will be at risk of desertification by 2030.
While Target 15.2 has a number of requirements, it is only the requirement to ‘halt’ deforestation that is readily quantifiable. The target used against our projections is thus for deforestation to have plateaued by 2020: that is, for forest cover to be either growing or constant (at 2020 levels) from 2020 onwards.
Basis of projectionsThe OECD’s (2012) Environmental Outlook to 2050 projections are used to obtain anticipated forest cover in 2030, according to their baseline scenario. The model takes into account expected changes in land use and management (such as the conversion of forest into agricultural land for bioenergy or crop production) as well as expected growth in the use of planted forests for wood production. Additionally, it models natural expansion in areas of abandoned agricultural land and existing forest.
GloballyAccording to the baseline projection, forest cover is growing by 2020. From a starting share of 31.0% of land, forest cover is projected to have recovered the majority of the expected decline between 2010 and 2020 – to reach 30.7% by 2030. The initial period of decline is driven by continued conversion of land for use in agricultural production. The expected growth after 2020 is accounted for by natural as well as human-induced expansion through regeneration, restoration, reforestation and afforestation, including plantations, and by 2050 is predicted to have risen above 2010 levels. This projection is consistent with a slowing historical trend in deforestation over the past 20 years: annual forest loss fell from 160,000 km2 in the 1990s to 130,000 km2 in the 2000s (FAO, 2010). Taken as a global whole, the world is thus very close to being on track to meet the deforestation target from 2020 onwards, which is why this target receives a B grade.
Whereas total forest cover is set to increase by 2020, primary forest cover is expected to decrease continuously year-on-year. Primary forests are native forests in which ecological processes are not significantly disturbed. Since biodiversity is concentrated in primary forest, the slowdown in the decrease of total forest cover (which is largely a result of planting activities) does not detract from a continued loss of biodiversity in forest ecosystems.

By regionRegional decomposition uses the categories provided by the OECD’s (2012) projections: OECD, BRIICS (including Indonesia) and ROW. While the OECD and large emerging economies (Brazil, Russia, India, Indonesia, China and South Africa) are expected to see an increase in projected forest cover by 2030, forest cover is still set to decline in the rest of the world due to growing demand for agricultural land. Increases in the former are underpinned by the deliberate creation of plantation forests to meet increasing wood and paper demand.
Key assumptionsData reliability – The OECD (2012) projections use historical data taken from FAO’s Forest Resource Assessment (FRA) (2010), which is collected from self-reported figures provided by governments that have received criticism in the literature (Grainger, 2007). These figures have also been called into question by recent studies based on satellite data, according to which the rate of deforestation actually increased between 1990 and 2010 – the FRA figures by contrast report a decrease (Kim et al., 2015). Accordingly, the OECD projections may overstate the projected increase in forest cover.
Global growth – World GDP growth is extrapolated from past trends. Rising global incomes are expected to exert pressure on forest land through increases in demand for agricultural production. Since expected global growth is particularly sensitive to increases in the BRIICS economies, about which there is considerable uncertainty, slower growth than projected is possible, with a corresponding reduction in the encroachment into forest land for agricultural purposes.
Protected areas – The baseline scenario assumes no change in the proportion of forest area under protection. However, if the international community acts on the target set in Nagoya (2010) by the Convention on Biological Diversity for 17% protected areas by 2020, then pressure on forests from land encroachment might be expected to diminish, subject to whether the locations chosen for protection are forested and could be considered at risk without protected status.
Climate-change policy – The projections are sensitive to assumptions made about the likelihood of certain policy changes linked to climate-change mitigation. For example, the pressure of deforestation from the conversion of forest land into bioenergy crop production may increase if bioenergy expansion forms part of a concerted global mitigation effort.
Goal 16 – Promote peaceful and inclusive societies for sustainable development, provide access to justice for all and build effective, accountable and inclusive institutions at all levels (grade C)
Targets • 16.1 Significantly reduce all forms of violence and
related death rates everywhere • 16.2 End abuse, exploitation, trafficking and all forms
of violence against and torture of children • 16.3 Promote the rule of law at the national and
international levels and ensure equal access to justice for all
Annex to Projecting progress – reaching the SDGs by 2030 31
Annex figure 37: Deforestation (global)
2005 20102000 20202015 2025 203029.5
32.0
31.5
31.0
30.5
30.0
Tota
l for
este
d la
nd (%
)
Actual TargetProjection
Source: OECD, 2012
Annex figure 38: Deforestation (regional)
BRIICSOECD ROW800
1,800
1,600
1,400
1,200
1,000
Tota
l for
est c
over
(mill
ions
of h
ecat
res)
20102030
Source: OECD, 2012

32 Development Progress Flagship Report
• 16.4 By 2030, signifi cantly reduce illicit financial and arms flows, strengthen the recovery and return of stolen assets and combat all forms of organised crime
• 16.5 Substantially reduce corruption and bribery in all their forms
• 16.6 Develop effective, accountable and transparent institutions at all levels
• 16.7 Ensure responsive, inclusive, participatory and representative decision-making at all levels
• 16.8 Broaden and strengthen the participation of developing countries in the institutions of global governance
• 16.9 By 2030, provide legal identity for all, including birth registration
• 16.10 Ensure public access to information and protect fundamental freedoms, in accordance with national legislation and international agreements
Why focus on Target 16.1?This goal touches on numerous crosscutting issues related to justice and governance, while this target only focuses on a specific aspect of these issues. However reducing deaths from violence is a fundamental part of this goal and an important outcome of most of the other targets. Furthermore, this target lends itself to forward projection, more so than the other targets, which are more difficult to quantify. The two other targets that could potentially be quantified are 16.4 about transnational crime, and 16.9, which could be simplified to focus solely on birth registration. The challenge with Target 16.4 is that the magnitude of transnational crime, particularly illicit financial flows, is highly debated, and reliable projections to 2030 could not be found. While projecting Target 16.9 and just focusing on birth registration is considered to be less central to the overarching goal than violent deaths.
Basis of projections WHO projects violent deaths forward based on the continuation of past trends in regards to individual (e.g. murder) and collective (e.g. war) forms of violence. Violent deaths are assumed to vary with changes in economic and demographic factors, as has been the case in the past.
GloballyViolent deaths as a share of total deaths are set to decline somewhat over the next 15 years; however the decline falls short of a reasonable interpretation of a ‘significant’5
reduction, especially considering that the total number of violent deaths is projected to remain constant at around 550,000 people a year. Progress would need to be around two-and-a-half times faster for a 50% reduction in the rate of violent deaths to occur, which is why this target receives a C grade.
By regionViolent deaths are projected to rise in Latin America and the Caribbean, Sub-Saharan Africa and high-income countries, and to fall in other regions as can be seen in the figure below. Even in East Asia and Pacific, where the greatest reduction is expected to be made, if current trends continue it would take until the end of the century before the total number of violent deaths would halve.
5 For illustrative purposes, significant is defined as a 50% reduction in the figure above.
Annex figure 40: Violent deaths (regionally)
0
180
20
40
60
80
100
120
140
160
Thou
sand
s of
peo
ple
20302015
East Asia& Paci�c
Rest ofWorld
Latin America& Caribbean
Sub-SaharanAfrica
South Asia High-incomecountries
Source: WHO, 2015
Annex figure 39: Violent deaths (globally)
2000 2015 20300
1.2
1.0
0.8
0.6
0.4
0.2
Shar
e of
tota
l dea
ths
(%)
Actual TargetProjection
Source: WHO, 2015

Key assumptionsThe main assumption underpinning this projection is that past trends will continue, which could be invalid for a number of reasons.
Dependence on population projections – These projections are closely linked to population projections that may not hold in the future, especially if fertility rates continue at higher levels than was factored into the population projections.
Technological innovation – Increased access to and lower cost of weapons could dramatically decouple past and future trends in violent deaths. As such the projections should be considered as the business-as-usual trend in the absence of significant technological innovation.
Politics and policies – Government policies regarding warfare, civil unrest and interpersonal violence will have a significant impact on these projections. Departures from recent trends in policies could lead to significantly different outcomes in 2030.
Goal 17 – Strengthen the means of implementation and revitalise the global partnership for sustainable development (grade C)
TargetsFinance
• 17.1 Strengthen domestic resource mobilisation, including through international support to developing countries, to improve domestic capacity for tax and other revenue collection
• 17.2 Developed countries to implement fully their ODA commitments, including to provide 0.7% of GNI in ODA to developing countries of which 0.15-0.20% to least-developed countries
• 17.3 Mobilise additional financial resources for developing countries from multiple sources
• 17.4 Assist developing countries in attaining long-term debt sustainability through coordinated policies aimed at fostering debt financing, debt relief and debt restructuring, as appropriate, and address the external debt of highly indebted poor countries (HIPC) to reduce debt distress
• 17.5 Adopt and implement investment promotion regimes for LDCs
Technology
• 17.6 Enhance North-South, South-South and triangular regional and international cooperation on and access to science, technology and innovation, and enhance knowledge sharing on mutually agreed terms, including through improved coordination among existing
mechanisms, particularly at UN level, and through a global technology facilitation mechanism when agreed
• 17.7 Promote development, transfer, dissemination and diffusion of environmentally sound technologies to developing countries on favourable terms, including on concessional and preferential terms, as mutually agreed
• 17.8 Fully operationalise the Technology Bank and STI (Science, Technology and Innovation) capacity building mechanism for LDCs by 2017, and enhance the use of enabling technologies in particular ICT
Capacity-building
• 17.9 Enhance international support for implementing effective and targeted capacity building in developing countries to support national plans to implement all sustainable development goals, including through North-South, South-South, and triangular cooperation
Trade • 17.10 Promote a universal, rules-based, open, non-
discriminatory and equitable multilateral trading system under the WTO including through the conclusion of negotiations within its Doha Development Agenda
• 17.11 Increase significantly the exports of developing countries, in particular with a view to doubling the LDC share of global exports by 2020
• 17.12 Realise timely implementation of duty-free, quota-free market access on a lasting basis for all least developed countries consistent with WTO decisions, including through ensuring that preferential rules of origin applicable to imports from LDCs are transparent and simple, and contribute to facilitating market access
Systemic issues: Policy and institutional coherence
• 17.13 Enhance global macroeconomic stability including through policy coordination and policy coherence
• 17.14 Enhance policy coherence for sustainable development • 17.15 Respect each country’s policy space and
leadership to establish and implement policies for poverty eradication and sustainable development
Systemic issues: Multi-stakeholder partnerships
• 17.16 Enhance the global partnership for sustainable development complemented by multi-stakeholder partnerships that mobilise and share knowledge, expertise, technologies and financial resources to support the achievement of sustainable development goals in all countries, particularly developing countries
• 17.17 Encourage and promote effective public, public-private, and civil society partnerships, building on the experience and resourcing strategies of partnerships
Annex to Projecting progress – reaching the SDGs by 2030 33

34 Development Progress Flagship Report
Systemic issues: Data, monitoring and accountability
• 17.18 By 2020, enhance capacity building support to developing countries, including for LDCs and SIDS, to increase significantly the availability of high-quality, timely and reliable data disaggregated by income, gender, age, race, ethnicity, migratory status, disability, geographic location and other characteristics relevant in national contexts
• 17.19 By 2030, build on existing initiatives to develop measurements of progress on sustainable development that complement GDP, and support statistical capacity building in developing countries
Why focus on target 17.1?Goal 17 describes multiple aspects of international cooperation, including in the areas of finance, technology, trade, capacity-building, partnerships, policies and data. This makes it rather difficult to choose a target that is representative of the goal.
Of all the 19 targets, only two explicitly express quantitative targets. Target 17.11 aims for LDCs to double their share of global exports by 2020. This focus on trade and its importance to development is useful; however, it would appear a secondary concern to the overarching intentions of the goal. Public resources and aid (Targets 17.1 and 17.2) are our main means for launching direct interventions in development. Trade is a vital, but more indirect, way of stimulating development.
Target 17.2 requests that advanced economies commit to spending 0.7% on aid as a proportion of their GNI. Unfortunately we were unable to find any projections that forecasted future aid delivery, country-by-country. Expenditure on aid can fluctuate dramatically, subject to changes in national politics and policies. This has prevented any serious attempts to project future aid spending. This impedes our own abilities to project against Target 17.2.
Target 17.1 seeks to strengthen domestic-resource mobilisation. Following the discussions at the recent Financing for Development conference in Addis Ababa (July 2015), the global consensus around the need to improve domestic-resource mobilisation in developing countries is extremely clear. Its centrality to implementing sustainable development and its reliance on global partnerships (such as collaborative efforts to prevent tax avoidance) means that Target 17.1 appears to be the ideal target to focus on within Goal 17. With future aid revenues unclear and an increasing onus on developing countries to finance their own development, projecting future resource mobilisation provides an extremely useful insight into the likely capacity for future development efforts.
The target is interpreted here as a call to increase public revenues as a percentage of GDP, amongst poorer, developing nations. The adopted quantitative target here, in the absence of one in the current draft outcome
document for the adoption of the SDGs, is for 20% growth by 2030. This is both an ambitious and realistic aim, one which would, assuming continued GDP growth in poorer countries (see Goal 8 projections, above), provide significant increases in public resources available for sustainable development.
Basis of projections In the desk research conducted for this study, we identified that the IMF’s Fiscal Monitor forecasts government revenue as a percentage of GDP to 2020. This thus aligns with the intention of forecasting domestic-resource mobilisation. In order to utilise the IMF’s study, we adopted their projections, based on staff assessments of current and future fiscal policy, and apply their forecasted rates of change in public domestic revenues on towards 2030.
ODI have assessed LICs and LMICs. These countries possess the greatest onus to improve public-revenue generation. Given that all these countries will be expected to make progress on resource mobilisation, we have taken a simple average of all LICs and LMICs to create the low and lower- middle-income country average. ODI has assessed thus Low and Lower Middle Income countris as the onus is on these countries to improve public revenue generation. IMF data shows that average revenue generation for LICs is just 20% of GDP and for LMICs, it is 24% of GDP. At the same time, many Upper Middle Income countries already generate public revenue, as a share of GDP, at rates higher than many High Income countries (Brazil and Turkey being notable examples).
ODI took the IMF’s forecasted average annual rate of change from 2015-2020 for this group of countries and continued this trend on to 2030. This provides a picture of what the ‘average revenue as a percentage of GDP’ will be in LICs and LMICs in 2030.
GloballyAverage government revenue amongst LICs and LMICs is projected to rise from 22.1% of GDP in 2015 to 24.3% in 2030 – just under a 10% rise over 15 years. This is significant but just under half of the targeted progress to 2030. Given that revenues for this group in recent years have fluctuated without significant change, achieving and sustaining a 10% increase by 2030 would represent a moderate success. However, given the extremely high demands for public spending for various development targets in the coming years, this would still represent an unsatisfactory increase in public revenues amongst developing countries. As a point of comparison, the same IMF data shows that UMICs have an average government revenue of 28%, as a percentage of GDP, and HICs have an average of 40% of GDP in 2015.
The projection shows that these countries would have to progress just over two times faster to meet Target 17.1 by 2030, thus giving a C grade projection.

By regionThere is a great deal of variation across regional LICs and LMICs, both in their current positions on revenue and in their future projections. Whilst South Asian LICs and LMICs have generally only collected 15% of their GDP, Latin American and Caribbean LICs and LMICs collect around 26%. This represents a huge difference in public resources generated. Sub-Saharan Africa and East Asia and Pacific LICs and LMICs are in between, collecting 20% and 23% respectively.
Going forward, South Asia is projected to more than exceed its target, reaching 24% growth by 2030. However, this would only bring it to the revenue levels (as a percentage of GDP) collected by Sub-Saharan Africa
today and far below other regions. Sub-Saharan Africa is projected to reach the target of 20% proportional growth. East Asia and Pacific is only projected to see moderate proportional growth of 5%. Latin America and Caribbean LICs and LMICs are projected no growth at all, with revenues as a percentage of GDP almost completely stable in future years. This would still leave this group of countries with the largest revenue share of 26.4% of GDP in 2030.
Key assumptionsReliability of stated fiscal plans – Projections for immediate years are based on officially announced national budgets, adjusted for differences in the macroeconomic assumptions and projected fiscal returns expected by national
Annex to Projecting progress – reaching the SDGs by 2030 35
Annex figure 41: Revenue in low and lower-middle income countries
2010 2020 20302005 2015 20250
30
25
20
15
10
5
Gove
rnm
ent r
even
ue a
s a
shar
e of
GDP
(%)
Low and Lower Middle Income countries TargetLow and Lower Middle Income countries projection
Source: Authors’ calculations
Annex figure 42: Revenue in East Asia & Pacific (LICs and LMICs)
2010 2020 20302005 2015 20250
30
25
20
15
10
5
Gove
rnm
ent r
even
ue a
s a
shar
e of
GDP
(%)
East Asia and Paci�c TargetEast Asia and Paci�c projection
Source: Authors’ calculations
Annex figure 43: Revenue in South Asia (LICs and LMICs)
2010 2020 20302005 2015 20250
30
25
20
15
10
5
Gove
rnm
ent r
even
ue a
s a
shar
e of
GDP
(%)
South Asia TargetSouth Asia projection
Annex figure 44: Revenue in sub-Saharan Africa (LICs and LMICs)
2010 2020 20302005 2015 20250
30
25
20
15
10
5
Gove
rnm
ent r
even
ue a
s a
shar
e of
GDP
(%)
Sub-Saharan Africa TargetSub-Saharan Africa projection
Source: Authors’ calculations
Source: Authors’ calculations

36 Development Progress Flagship Report
governments and IMF staff. Longer-term projections (to 2020) surround policy measures at the country level that IMF staff have judged are likely to be implemented. The stated intentions of national governments on fiscal matters thus need to be trusted when building such projections. When IMF staff have insufficient information to assess national revenue plans, they have assumed an unchanged structural balance.
Growth projections – Revenue-to-GDP projections not only need to forecast changes in revenue collection, they also need to take into account or project future GDP themselves. The IMF have used their own projections for GDP growth to 2020, to relate to revenue projections. In many cases, an added complication is that government projections on GDP and how this relates to their fiscal plans may differ.
Extending forward IMF’s predicted trends – The IMF projections used here only relate to the years leading up to 2020. ODI has taken the average annual rate of change projected by the IMF to 2020 and extended this forward onto countries to 2030. We have thus assumed that changes taking place in revenue collection up to 2020 will continue on to 2030.
Annex figure 45: Revenue in Latin America & Caribbean (LICs and LMICs)
2010 2020 20302005 2015 20250
35
30
25
20
15
10
5
Gove
rnm
ent r
even
ue a
s a
shar
e of
GDP
(%)
Latin America & Caribbean TargetLatin America & Caribbean projection
Source: Authors’ calculations


Overseas Development Institute 203 Blackfriars Road London SE1 8NJ
Tel: +44 (0)20 7922 0300 Email: [email protected]
facebook.com/developmentprogressproject twitter.com/dev_ progress
Figures by Steven Dickie and Sean Willmott.
Designed by Soapbox, www.soapbox.co.uk
This is one of a series of Development Progress research reports. Development Progress is a four-year research project which aims to better understand, measure and communicate progress in development. Building on an initial phase of research across 24 case studies, this second phase continues to examine progress across countries and within sectors, to provide evidence for what’s worked and why over the past two decades.
This publication is based on research funded by the Bill & Melinda Gates Foundation. The findings and conclusions contained within are those of the authors and do not necessarily reflect positions or policies of the Bill & Melinda Gates Foundation.
ODI is the UK’s leading independent think tank on international development and humanitarian issues. Further ODI materials are available at odi.org.uk
developmentprogress.org