annex 3 - brighton-hove.gov.uk · average rate of residential development achieved in the city over...
TRANSCRIPT
Annex 3Housing Implementation Strategy
Brighton & Hove City Plan Part One
March 2016

Annex 3 Housing Implementation Strategy
Revised September 2014

1. Introduction
1.1 The National Planning Policy Framework (NPPF) seeks a significant boost in housing supply. At paragraph 47, local authorities are instructed to undertake a number of specific actions and measures to ensure achieving the planned supply of new housing. One of these is to set out a ‘housing implementation strategy’. The guidance states that local planning authorities should:
‘for market and affordable housing, illustrate the expected rate of housing delivery through a housing trajectory for the plan period and set out a housing implementation strategy for the full range of housing describing how they will maintain delivery of a five-year supply of housing land to meet their housing target’ (para.47, fifth bullet point).
1.2 In Brighton & Hove, the housing trajectory anticipates the delivery of market and affordable housing over the plan period and both will count towards meeting the city’s planned housing target. In many instances, new affordable housing is provided as a percentage or ‘quota’ of the total amount of housing proposed on (otherwise) market housing sites. Given the degree of uncertainty regarding future funding mechanisms for the delivery of affordable housing it is difficult to anticipate with any accuracy the delivery of affordable housing provision over the full plan period. The housing trajectory therefore indicates a minimum target level of affordable housing that the council’s planning policies are aimed at achieving. Annual residential monitoring will provide the mechanism to track progress on this and to keep the target under review (see also Annex 1 to City Plan: Implementation and Monitoring Framework).
1.3 This paper gives an overview of the level of housing proposed for delivery in the City Plan followed by an outline of the approach to managing housing delivery over the plan period.
2. City Plan - Housing Overview
2.1 The City Plan for Brighton & Hove sets a housing provision target of 13,200 new homes over the plan period 2010 – 2030. This equates to an annual average provision of 660 net additional dwellings (see City Plan Policy CP1)

2.2 The housing target set for the city in the City Plan has been informed by a series of technical background evidence studies regarding the city’s objectively assessed housing requirements (the overall demand and need for new housing); and a series of Strategic Housing Land Availability Assessment studies (SHLAAs) which have been used to establish realistic assumptions about the suitability, availability and deliverability of land identified with potential for new housing. The 2014 SHLAA Update reports an overall citywide ‘capacity’ for around 13,200 dwellings over the plan period to 2030. This includes:
Identified sites of 6+ units with potential for around 10,550 dwellings; Small identified sites with an extant planning permission and assessed as likely to achieve approximately 765 dwellings; Broad locations for development which offer potential for a further 640 units (250 at Shoreham Harbour and 390 through
longer term Housing Revenue Account Estates Masterplan/Renewal); Development projected from small unidentified/windfall development across the plan period at approx.1250 dwellings
2.3 The City Plan housing target of 13,200 represents a significant boost in planned housing supply when compared to the average rate of residential development achieved in the city over the last 15 years which was 540 dwelling per annum (see Appendix A). This was a timescale which spanned both a prolonged period of housing boom and more recently a downturn in the housing market associated with economic recession. Although the planned housing target does not meet the city’s objectively assessed housing requirements in full (18,000 – 24,000); given the city’s genuine and significant constraints to growth ( being located between the sea to the south and the South Downs National Park to the north), the housing target is considered ambitious but also realistic, robust and deliverable.
Spatial distribution of housing supply
2.4 In terms of spatial distribution, the strategy for housing delivery reflects the overall spatial strategy for the City Plan and seeks to concentrate a significant amount of new residential development within the most accessible areas of the city and those with the most capacity. The eight Development Areas identified in the Plan account for 45% of the planned level of new housing delivery for the city. Within the Development Areas, the City Plan makes strategic allocations to secure the delivery of some 3235 new dwellings (see spatial policies DA2 – DA8). In other parts of the city, there are also significant opportunities for new residential development: for example through regeneration and redevelopment opportunities, conversions and changes of use and through
some development on identified urban fringe sites1. This will help to promote and secure the establishment of mixed and sustainable communities. Development will be required to respect the local character and distinctiveness of neighbourhoods (see SA6 and CP14 Housing Density).
Components of housing land supply
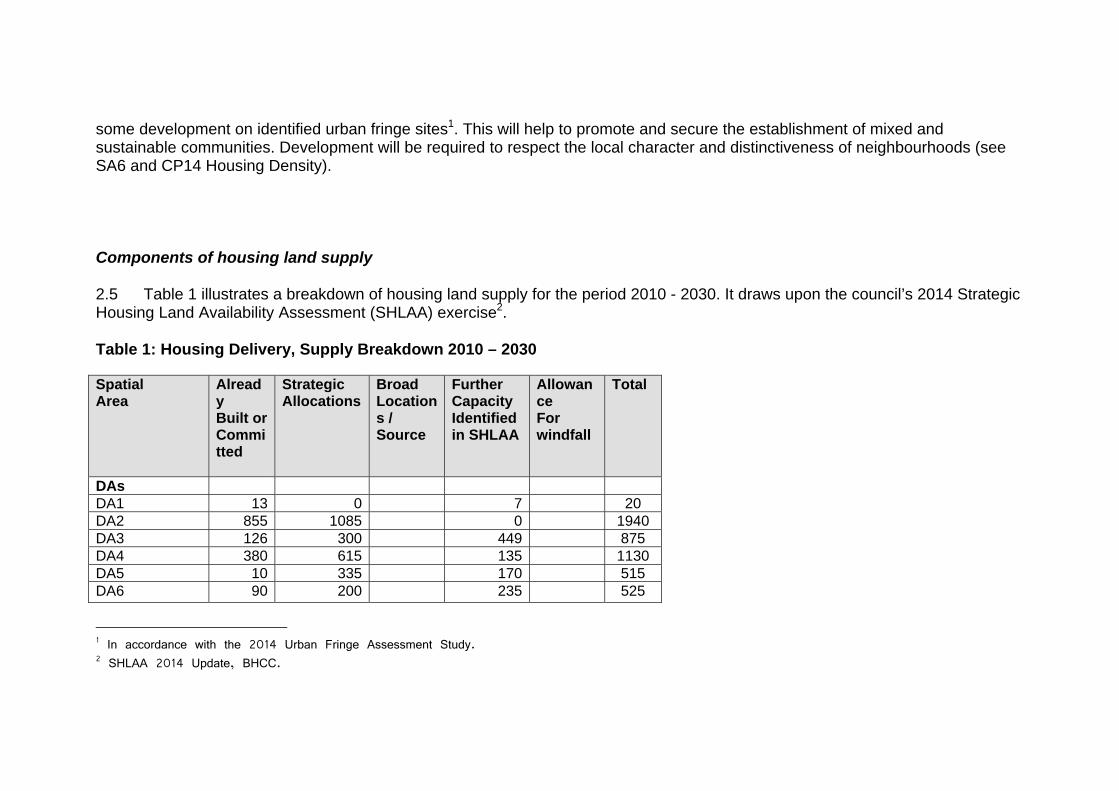
2.5 Table 1 illustrates a breakdown of housing land supply for the period 2010 - 2030. It draws upon the council’s 2014 Strategic Housing Land Availability Assessment (SHLAA) exercise2.
Table 1: Housing Delivery, Supply Breakdown 2010 – 2030
Spatial Area
Already Built or Committed
Strategic Allocations
Broad Locations / Source
Further Capacity Identified in SHLAA
Allowance For windfall
Total
DAs DA1 13 0 7 20 DA2 855 1085 0 1940 DA3 126 300 449 875 DA4 380 615 135 1130 DA5 10 335 170 515 DA6 90 200 235 525
1 In accordance with the 2014 Urban Fringe Assessment Study. 2 SHLAA 2014 Update, BHCC.

DA7 0 700 0 700 DA8 52 248 300 DA Total
1525 3235 250 995 6005
Rest of City a) Built up
area b) Urban
Fringe
1450 400 390 1890
1060
4130
1060
Small id. Sites
765 765
Small Windfall
1250 1250
Total 3740 3635 640 3945 1250 13210
2.6 The table illustrates that approximately 3,740 dwellings have already either been built since 2010 or are currently committed for development in terms of either having an extant planning permission or an allocation in the 2005 Brighton & Hove Local Plan. The City Plan makes strategic site allocations to achieve a further 3635 dwellings across the city. Further capacity is identified for an additional 4585 dwellings and appropriate site allocations will need to be made in Part 2 of the City Plan (Development Policies and Site Allocations). These ‘identified sources’ comprise approximately 90% of the overall housing target to 2030.

2.7 Development from small windfall3 sites will also contribute to land supply throughout the course of the plan period. An allowance of 1250 units has been assumed for small windfall site development over the plan period to 2030.
2.8 In summary, the City Plan sets a housing target to achieve at least 13,200 additional dwellings over the plan period 2010 – 2030. A significant proportion of this delivery will be secured within the plan’s eight Development Areas. Residential developmentacross the rest of the city will also make a significant contribution to overall housing delivery.
3. Housing Supply Trajectory and Five Year Supply
3.1 Over the last 15 years the average rate of house building in Brighton & Hove has been approximately 540 dwellings per annum (see Appendix A). More recently, rates of housing delivery in the city have been far lower than this reflecting the impacts of economic recession and the associated housing market downturn. The key factors affecting build rates have been the costs of development finance and increased construction costs together with significant changes in funding for new affordable housing development. This has meant that a number of developments and regeneration schemes in the city have been delayed or put on hold. This is reflected particularly in the last 3 to 4 years residential monitoring figures for housing completions (see Appendix A) The net dwelling completion figure for 2010/11 was just 283 units, the lowest recorded housing completion figure in the city for 20 years.
3.2 The expected rate of housing delivery over the Plan period is illustrated through a ‘housing trajectory’. This illustrates the housing development that has already been built in the city since 2010 and that which is currently anticipated over the rest of the plan period. The housing trajectory will be monitored and updated on an annual basis through the council’s annual Authority Monitoring Report (AMR) and also through roll forward and further reviews of the Strategic Housing Land Availability Assessment (SHLAA) for the city. The most up to date trajectory reflects the 2014 SHLAA position (September 2014). The updated housing delivery trajectory reflects the following key factors:
3 Windfall sites are sites which have not been specifically identified as available in the Local Plan process. They normally comprise previously-developed sites that have unexpectedly become available.

The effects of economic recession which have particularly impacted upon housing delivery rates in the early years of theplan period and are continuing to constrain the recovery of the housing market within the city; although there are signs of animprovement. This has resulted in a significant ‘shortfall’ of delivery against planned housing requirements.
The particular impact the recession has had on the ability to bring forward some of the larger, more complex developmentsites within the city; many of which are large scale flatted types of development; some of which are mixed use strategicdevelopment schemes that require significant investment and longer lead in and build out times.
The loss of a number of identified general housing sites to student housing proposals for which there is a strong currentmarket demand and a good development return; and
A revised assessment of annual outputs on identified housing sites, again reflecting impacts of economic recession andgenerally more flatted formats of development in the city.
3.3 Importantly, the amended housing trajectory indicates there is sufficient overall ‘capacity’ within the city to meet the City Plan proposed housing target of 13,200 new dwellings by 2030.
3.4 The planned housing target for the city implies an annual average rate of 660 dwellings per annum over the plan period. At present, the 2014 housing trajectory indicates that delivery over the first ten years of the plan period (from 2010 to 2019/20) may be lower than this, due to the very low level of residential completions achieved 2010 -2014, reflecting the impacts of economic recession and the fact that further time is required for full market recovery. Post adoption of the Plan (2015), delivery rates from 2014 to 2019 are anticipated to achieve the planned delivery average of around 660 units per annum but will not be sufficient to address the shortfall of housing delivery accruing in the early plan years. Between 2019/20 and 2024 delivery rates are expected to significantly increase with delivery coming through from a number of the city’s key strategic development sites which will make a major contribution towards housing supply and address the shortfall from earlier years. For the period 2024 -2030, housing delivery is again currently anticipated to exceed the planned average delivery rate of 660 units per annum. Development from small windfall sites and other sources of windfall (e.g. changes of use from office to residential through permitted development) is anticipated to supplement this supply over the plan period to 2030.
Five year housing land supply position
3.5 Taking account of the most up to date housing trajectory position and the key factors which have been impacting upon housing delivery in the city (as outlined above), it is possible to establish a reasonable and realistic basis upon which to calculate the city’s five year land supply requirement (see Appendix B).
3.6 Appendix B illustrates three options against which to calculate the five year supply requirement. The first option (A) assumes the shortfall of housing delivery in the period 2010 – 2014 is all addressed in the next five year supply period (2014 – 2019). This method is sometimes referred to as the ‘Sedgefield’ approach and is the favoured approach indicated in the National Planning Practice Guidance. The second option (B) assumes that the shortfall is addressed across the full plan period at a uniform annualised rate; this is the residual or ‘Liverpool’ approach. The third option (C) links the five year supply requirement to the updated housing trajectory to reflect up to date and realistic assumptions regarding housing delivery including market signals and the latest information from developers, agents and landowners regarding anticipated delivery rates.
3.7 The approach advocated for Brighton & Hove is the third option (C) which makes realistic provision for the ongoing process of market recovery and reflects the particular nature of housing supply in the city e.g. large scale flatted forms of development and more complex urban regeneration mixed use schemes) which have longer lead in and build out times. This approach is considered a more realistic basis against which to calculate the five year housing land supply requirements.
3.8 The National Planning Policy Guidance (NPPG, March 2014), under the heading Methodology – Stage 5, states that: ‘Local planning authorities should aim to deal with any undersupply within the first five years of the plan period where possible’. The housing trajectory clearly indicates that meeting the accumulated shortfall/undersupply since 2010 in the current five year supply period 2014 – 2019 is simply not possible as it would require an unrealistic step change in delivery rates.
3.9 The council’s position takes account of the following factors:
a) the size of the current shortfall;b) the current development pipeline;c) the nature of key delivery sites in the city; andd) the scale of house-building required relative to that in past buoyant market conditions
a) The size of the current shortfall
3.10 The total number of net completions achieved in the period 2010-2014 was 1402 dwellings (350 dwellings on average per annum). This is just 53% of the planned requirement based on an implied annual average requirement of 660 dwellings per annum and gives a present ‘shortfall’ of 1238 dwellings (2640 – 1402 = 1238).
3.11 This shortfall has arisen due to a range of factors associated with the national economic recession (2007/8) and how it has impacted locally on the city’s housing market. Of particular significance is the fact that most of the city’s major development sites are brownfield sites proposed for mixed use development with flatted formats of residential development which have been particularly hard hit by the costs of construction and development finance which has adversely impacted upon scheme viability in recent times.
3.12 Annex B, Option A illustrates that to address this shortfall over the first five years (2014 – 2019), would require an annual housing delivery target rate of 953 dwelling units. Such a step change in housing delivery is simply not practicable or attainable. Average delivery over the last five year period has been just 356 dwellings (see Appendix A) and to expect an increased delivery rate to 953 dwellings per annum is not realistic.
3.13 Annex B, Option B illustrates that to address the accrued shortfall over the remaining plan period at a uniform (annualised) residual rate would require an annualised housing delivery target rate of at least 774 dwellings over the next five years (including a 5% supply buffer in accordance with the NPPF). Again, this would prove extremely challenging and may not be realistic when compared to the housing trajectory which anticipates an average rate of 674 dwellings achieved over this period.
3.14 Annex B, Option C illustrates that to address the accrued shortfall over the remaining plan period and taking account of anticipated delivery timescales as indicated in the housing trajectory would imply a five year supply requirement of approximately 3538 dwelling units or 707 units per annum (again including a 5% buffer). This still represents a challenging requirement but, given the range of positive planning and regeneration measures being put into place by the council and its work with developers and stakeholders, is a requirement that should be achievable.
b) The current development ‘pipeline’.

3.15 Monitoring of residential development activity demonstrates that as at 1.4.14 there were 614 dwelling units under construction; of which 108 were on small sites and 506 were on larger sites4. Additional supply (e.g. residential units achieved through the prior approval process regarding change of use from office to residential (permitted development rights) and additional small scale windfall development) is likely to supplement this supply and gives an indication of the likely housing delivery in the year 2014/15. This is broadly in line with the latest housing trajectory; but it also demonstrates that none of the accrued shortfall will be addressed in that year.
3.16 In terms of sites with planning permission, but not yet started, current residential monitoring shows that there were 696 units with planning permission5 as at 1.4.14; 173 on small sites and 523 on large sites. It’s likely that although some of the smaller development sites could start and complete in the year 2014/15 (and thereby adding to delivery in 2014/15) most of the sites with planning permission will not yield completed units until at least years 2, 3 or 4 of the five year supply period. Other schemes will also come forward, gain consent and commence development over this period. Current data therefore supports the anticipated trajectory which indicates an average of 6556 units across the 2014 – 2019 supply period.
3.17 The 2014 SHLAA and updated trajectory also identifies that other suitable sites are coming forward; many of which are at the pre-application stage or have been assessed as suitable for housing (or mixed use development). Although these sites can be supported in principle, in terms of timescales for their development, there is a need to account for time required to gain planning permission and then time to then convert permissions into completions.
c) The nature of key delivery sites in the city.
3.18 Many of the city’s key housing delivery sites are either large scale flatted forms of development (e.g. at the Brighton Marina DA2) and/or mixed use regeneration schemes delivering new housing alongside other key citywide needs (e.g. a new higher education college at Pelham Street (DA4), a new university library and other education and student accommodation at Circus
4 Annual residential monitoring exercise 2013/2014. These figures do not include the Outer Harbour Scheme at the Marina which is not envisaged to contribute to supply in 2014/15. 5 As above. 6 This figure excludes any allowance for additional windfall arising from e.g. permitted development rights, changes of use from office to residential or garden land development.

Street (DA5), a new school and employment space at Toads Hole Valley (DA7), a new sports centre for the King Alfred redevelopment in Hove ). Inevitably, this means that such schemes may have considerable lead-in times and that the timing of the housing delivery element of such schemes will be dependent upon the overall timing and phasing of the entire development scheme. Essentially this is why the housing trajectory indicates that housing delivery (as in completions) on many of these sites is unlikely to be seen until the mid plan period and also why it is difficult to bring forward these schemes any earlier in the plan period.
d) The scale of house-building needed relative to that in past buoyant market conditions.
3.19 Looking at past performance of housing delivery over longer term timescales can give an indication of market potential. Appendix A provides time series data regarding residential development in the city over the last 20 years. Over that time, in only two five year periods (1991/2 – 1995/6 and 2001/2 – 2005/6) did the average rate of residential development exceed the planned average rate of housing delivery now being proposed in the City Plan. This clearly demonstrates that housing delivery is cyclical and follows economic cycles (see housing delivery chart at Appendix A).
3.20 It also demonstrates that the City Plan is planning for a significant boost to housing supply in accordance with the NPPF and that this will be challenging given recent and ongoing housing market difficulties. The approach being sought towards the management of housing supply does not seek to suppress the city’s housing supply; it simply reflects a realistic basis upon which to manage housing land supply over the plan period. The City Council will seek to bring forward sites as soon as is possible (see sections 5-7 below). In terms of the NPPF support for the council’s position, the guidance emphasises that local planning authorities have to be ‘realistic’, both in terms of the release of housing sites ‘to provide a realistic prospect of achieving the planned supply’ (paragraph 47) and in relation to the assumptions used in SHLAAs (paragraph 159), as well as more broadly: ‘Local Plans should be aspirational but realistic’ (paragraph 154).
3.21 The 5 year land supply position is therefore set out as Option C, Appendix B. This demonstrates that, for the 2014 –2019 five year supply period, there is a sufficient 5 year supply of housing in accordance with NPPF requirements.
3.22 Positive planning measures will be required to ensure that sites come forward for development as anticipated in the trajectory (see section 7 below) and, that wherever possible, sites are brought forward more readily where this is a realistic,

practicable and feasible option. This is in order to ensure the timely provision of required infrastructure and to maintain a healthy five year supply of deliverable sites.


Housing Trajectory Table Revised 2014
2010
/11
2011
/12
2012
/13
2013
/14
2014
/15
2015
/16
2016
/17
2017
/18
2018
/19
2019
/20
2020
/21
2021
/22
2022
/23
2023
/24
2024
/25
2025
/26
2026
/27
2027
/28
2028
/29
2029
/30
Affordable Housing Delivery (estimate of 30% per annum from 197 197 197 197 197 257 257 257 257 257 214 214 214 214 214 214
Completions (Affordable Housing) 8 66 103 163
Identified Supply (Market Element) 458 458 458 338 338 499 499 499 499 499 413 413 413 413 413 413
Completions (Market Element) 275 243 271 273
Small Unidentified Supply (Small windfall allowance) 0 0 0 120 120 100 100 100 100 100 85 85 85 85 85 85
Total Supply (includes windfall) 283 309 374 436 655 655 655 655 655 856 856 856 856 856 712 712 712 712 712 712
City Plan Annual Target (13,200) 660 660 660 660 660 660 660 660 660 660 660 660 660 660 660 660 660 660 660 660
5 year supply from the anticipated date of
adoption6-10 year supply 11 to 17 year supply
Pre anticipated date of City Plan
adoption

3.23 The SHLAA and the consequent housing trajectory is largely based upon identified sites of 6+ units. Small site development (sites up to 5 units) makes a significant contribution to the total amount of residential development achieved in the city7 and will continue to count towards meeting the overall housing target and ongoing five year land supply requirements. The NPPF allows for the inclusion of an allowance for windfall sites in the five-year supply where local planning authorities have compelling evidence that such sites have consistently become available in the local area and will continue to provide a reliable source of supply. Small site windfall development across the plan period has therefore factored into the housing trajectory as it is considered likely supplement development achieved on the larger sites.
3.24 The housing trajectory also illustrates the amount of affordable housing anticipated to come forward over the plan period. Affordable housing anticipated is illustrated as a minimum target of 30% of overall housing delivery. Given the sliding scale of affordable housing requirements set out in Policy CP20 of the City Plan and the fact that, in reality, not all schemes will deliver these targets in full, a 30% estimate of overall delivery is considered realistic. This is also consistent with recent development trends.
3.25 A significant proportion of housing delivery will be dependent upon the private sector for delivery but other stakeholders will also have an important part to play in helping sites to come forward for development. This includes Registered Providers active in the city, Housing Co-operatives and the council itself as land owner and in the form of estate regeneration programmes.
4. Risk assessment of obstacles and constraints for housing delivery4.1 The SHLAA process already provides for an assessment of the risks associated with site delivery. Identified risks might include, for example, policy constraints, infrastructure requirements, legal or ownership constraints and/or marketing and viability constraints and these are reflected in the assessment’s potential phasing of development in relation to site delivery. In accordance with SHLAA good practice guidance, sites are evaluated in terms of suitability, availability and achievability. Sites that are severely constrained and do not offer reasonable prospect of development over the plan period do not form part of the identified housing supply.
7 36% of all residential development over the last 10 years has been through small site development.

4.2 The SHLAA is a dynamic process and will, through regular residential monitoring, be reviewed at least annually to ensure the most up to date and relevant site information is incorporated for each identified site and followed through into an updated housing trajectory.
4.3 The main identified risk to housing delivery in Brighton & Hove is any further delay in the recovery of economic conditions and how this continues to impact upon the construction industry locally and the city’s housing market. Site viability has been identified as an issue affecting many of the city’s major development sites. Some developers have sought to renegotiate policy requirements including levels of affordable housing, standards for sustainable buildings, the development mix and/or to renegotiate terms of S106 agreements to address viability. Whilst viability issues have constrained or delayed the delivery of a number of sites, the council’s latest Combined Policy Viability Study (September 2014) indicates that the property market (particularly prime office space and residential) has improved over the last 12 months and the outlook is identified as being likely to further improve over the medium term.
4.4 The risk of housing delivery being constrained by any lack of infrastructure is considered to be generally very low. However, where there is any element of uncertainty in relation to the delivery of infrastructure then that will be identified in the Infrastructure Delivery Plan.
5. Engagement with house builders and key stakeholders
5.1 The council recognises the importance of engagement with key stakeholders and local communities throughout the preparation of its City Plan (and the former Core Strategy preparation up to Publication and Submission stage).
5.2 The process of, and approach to, engagement is set out in the council’s adopted Statement of Community Involvement (SCI). In addition, the council maintains a Consultation Database with contact details of all interested parties (e.g. developers, private landowners, agents, businesses, community groups, etc). The council’s Consultation Statement sets out further details regarding the process of consultation on the various preparation stages of the City Plan and how consultation and engagement has helped to shape the policies and overall approach.
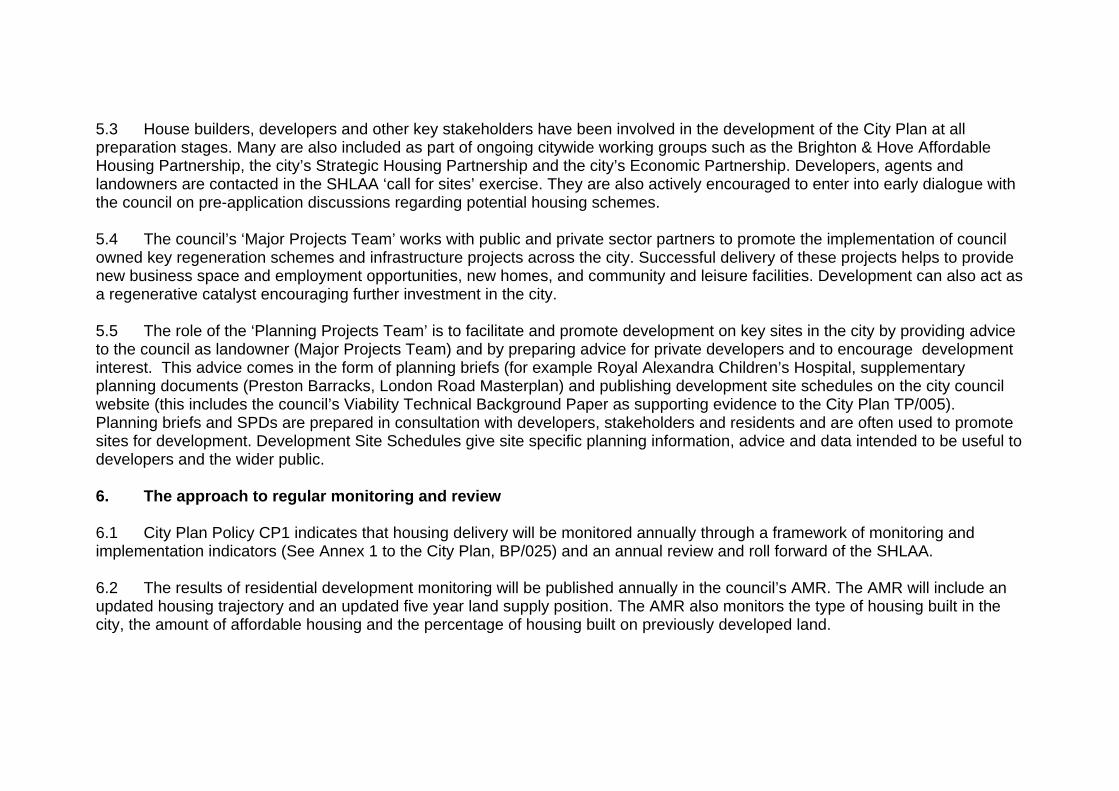
5.3 House builders, developers and other key stakeholders have been involved in the development of the City Plan at all preparation stages. Many are also included as part of ongoing citywide working groups such as the Brighton & Hove Affordable Housing Partnership, the city’s Strategic Housing Partnership and the city’s Economic Partnership. Developers, agents and landowners are contacted in the SHLAA ‘call for sites’ exercise. They are also actively encouraged to enter into early dialogue with the council on pre-application discussions regarding potential housing schemes.
5.4 The council’s ‘Major Projects Team’ works with public and private sector partners to promote the implementation of council owned key regeneration schemes and infrastructure projects across the city. Successful delivery of these projects helps to provide new business space and employment opportunities, new homes, and community and leisure facilities. Development can also act as a regenerative catalyst encouraging further investment in the city.
5.5 The role of the ‘Planning Projects Team’ is to facilitate and promote development on key sites in the city by providing advice to the council as landowner (Major Projects Team) and by preparing advice for private developers and to encourage development interest. This advice comes in the form of planning briefs (for example Royal Alexandra Children’s Hospital, supplementary planning documents (Preston Barracks, London Road Masterplan) and publishing development site schedules on the city council website (this includes the council’s Viability Technical Background Paper as supporting evidence to the City Plan TP/005). Planning briefs and SPDs are prepared in consultation with developers, stakeholders and residents and are often used to promote sites for development. Development Site Schedules give site specific planning information, advice and data intended to be useful to developers and the wider public.
6. The approach to regular monitoring and review
6.1 City Plan Policy CP1 indicates that housing delivery will be monitored annually through a framework of monitoring and implementation indicators (See Annex 1 to the City Plan, BP/025) and an annual review and roll forward of the SHLAA.
6.2 The results of residential development monitoring will be published annually in the council’s AMR. The AMR will include an updated housing trajectory and an updated five year land supply position. The AMR also monitors the type of housing built in the city, the amount of affordable housing and the percentage of housing built on previously developed land.

7. Circumstances in which specific management actions may be taken and an indication of such management actions
7.1 The AMR will be used to closely monitor housing delivery performance in the city. It has already been noted that completions over the last 3 to 4 years have been significantly below average levels and that this is strongly related to the impacts of ongoing economic recession and a slow down in house building rather than to any shortage of sites for development.
7.2 Underperformance in any single year may not require immediate intervention but indications of prolonged underperformance has implications for the city’s five year land supply position and longer term implications in terms of achieving the City’s planned housing target for new housing provision over the plan period. The current housing trajectory together with Appendix B indicates that a five year supply can be demonstrated and that the city’s housing requirement for 13,200 new homes by 2030 is achievable. Annex 1 (BP/025) to the City Plan sets out a monitoring and implementation framework. This identifies appropriate targets and trigger points to enable Policy CP1 to be effectively implemented over the plan period.
7.3 A number of specific development management actions are already underway to assist sites coming forward for development (see Viability Background Paper for detail TP/005). These measures include:
Production of detailed Planning Briefs and/or area based Supplementary Planning Documents to increase certainty todevelopers of sites progressing through the planning process;
As part of the preparation of Planning Briefs, the indication of different development scenarios to accommodate differentviability scenarios.
Pre-application discussions with developers, landowners and their agents to increase certainty in the developmentmanagement process;
Flexible application of policy and S106 requirements where scheme viability and deliverability issues have been clearly androbustly demonstrated (see recession measures below);
Renegotiation of S106 requirements where market conditions have demonstrably affected scheme viability since planningpermission secured (see measures below).

Recession Measures
7.4 There is recognition that in certain circumstances s106 planning obligation requirements may impact on the viability and deliverability of a development. The Council has been responsive to the need for flexibility in the early years of the Plan to reflect market conditions and has negotiated with developers in such situations.
7.5 In response to the economic downturn, in early 2010, the Council introduced a range of temporary ‘recession’ relief measures that prioritised and allowed for reductions in certain types of s106 planning obligations where issues of viability / deliverability were raised. These temporary measures provide flexibility on securing provision towards necessary infrastructure provision in order to enable development to be acceptable and to proceed in a timely manner. The temporary relief measures were reviewed in 2014 and revoked January 2015. The measures had included:
Free of charge pre-application advice service; Deferring or allowing for phased payment of contributions on major schemes, or deferred of payment of contributions or
provision of infrastructure to a later date in the development or on occupation of the development; Reduction in the type and level of contributions being sought by suspending requirements for financial contributions to
sustainable building and nature conservation; Waiving “indexation” on financial contributions so that infrastructure payments due are not updated to current prices; Changing the threshold level at which sustainable transport contributions are sought so that a lesser percentage of
developments would be liable. Suspending seeking financial contributions towards Sustainable Buildings and Nature Conservation measures.
Contributions will instead focus on securing best quality development design.
7.6 Other actions to ensure site delivery occurs in a timely manner also include:
Programme of work for Part 2 of City Plan (Site Allocations and Development Management Policies) to give greater certaintyto sites and enable additional development sites to be put forward and assessed;
Where applicable, to seek public sector intervention and prepare bids for funding streams through the Homes andCommunities Agency to assist with housing delivery, e.g. Estates Regeneration Programme, Local Growth Fund, BuildersFinance Fund.
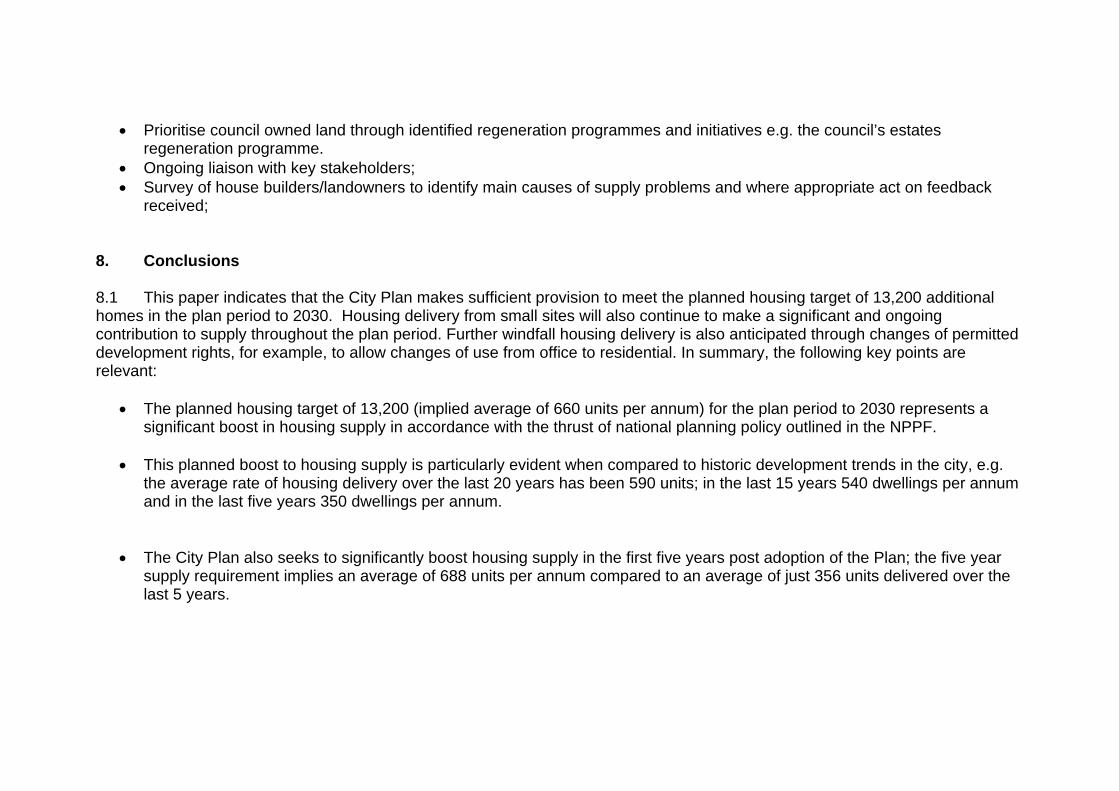
Prioritise council owned land through identified regeneration programmes and initiatives e.g. the council’s estatesregeneration programme.
Ongoing liaison with key stakeholders; Survey of house builders/landowners to identify main causes of supply problems and where appropriate act on feedback
received;
8. Conclusions
8.1 This paper indicates that the City Plan makes sufficient provision to meet the planned housing target of 13,200 additional homes in the plan period to 2030. Housing delivery from small sites will also continue to make a significant and ongoing contribution to supply throughout the plan period. Further windfall housing delivery is also anticipated through changes of permitted development rights, for example, to allow changes of use from office to residential. In summary, the following key points are relevant:
The planned housing target of 13,200 (implied average of 660 units per annum) for the plan period to 2030 represents asignificant boost in housing supply in accordance with the thrust of national planning policy outlined in the NPPF.
This planned boost to housing supply is particularly evident when compared to historic development trends in the city, e.g.the average rate of housing delivery over the last 20 years has been 590 units; in the last 15 years 540 dwellings per annumand in the last five years 350 dwellings per annum.
The City Plan also seeks to significantly boost housing supply in the first five years post adoption of the Plan; the five yearsupply requirement implies an average of 688 units per annum compared to an average of just 356 units delivered over thelast 5 years.
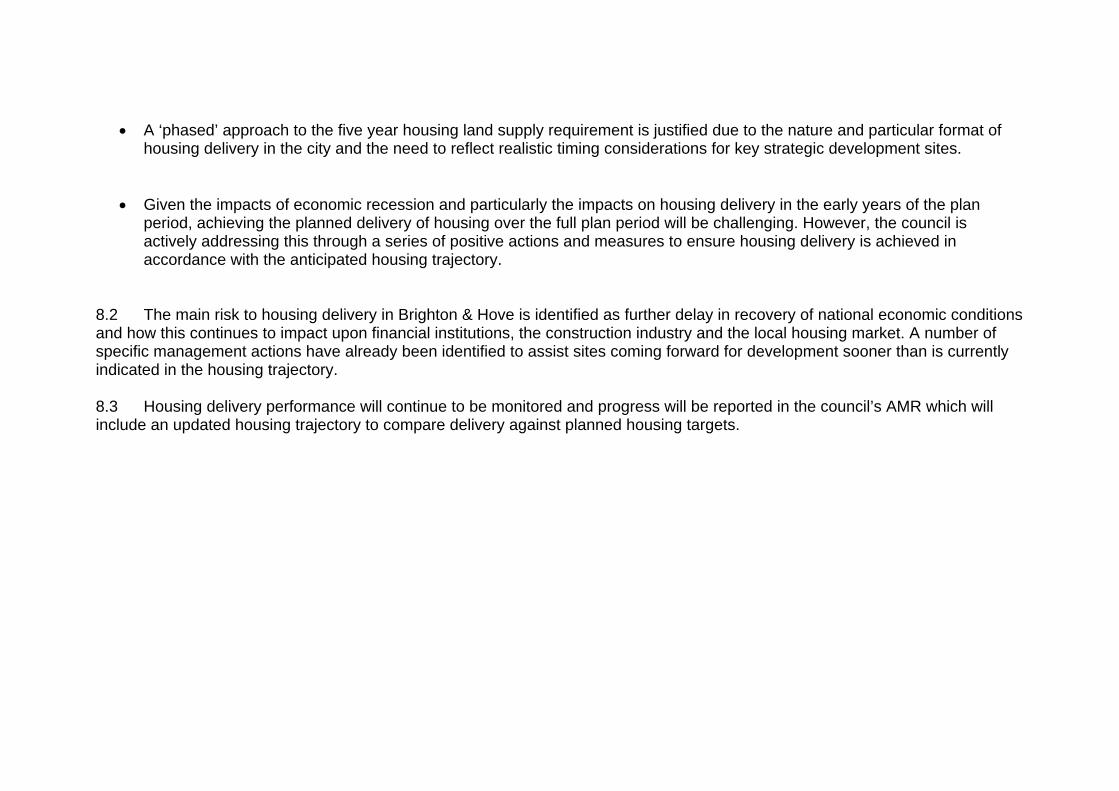
A ‘phased’ approach to the five year housing land supply requirement is justified due to the nature and particular format ofhousing delivery in the city and the need to reflect realistic timing considerations for key strategic development sites.
Given the impacts of economic recession and particularly the impacts on housing delivery in the early years of the planperiod, achieving the planned delivery of housing over the full plan period will be challenging. However, the council isactively addressing this through a series of positive actions and measures to ensure housing delivery is achieved inaccordance with the anticipated housing trajectory.
8.2 The main risk to housing delivery in Brighton & Hove is identified as further delay in recovery of national economic conditions and how this continues to impact upon financial institutions, the construction industry and the local housing market. A number of specific management actions have already been identified to assist sites coming forward for development sooner than is currently indicated in the housing trajectory.
8.3 Housing delivery performance will continue to be monitored and progress will be reported in the council’s AMR which will include an updated housing trajectory to compare delivery against planned housing targets.

HIS: Annex A
Total Residential Completions in Brighton & Hove 1991/2 – 2013/14
Year Residential Completions
5 year average
1991/2 837 7911992/3 4301993/4 10171994/5 4411995/6 12291996/97 458 4491997/98 4961998/99 4231999/00 4072000/01 4592001/02 960 6792002/03 6082003/04 6842004/05 6022005/06 5392006/07 797 5502007/08 5672008/09 7212009/10 3802010/11 2832011/12 309 3732012/13 3742013/14 436

Total (23 years) 13,457 585 BHCC Residential Monitoring.
Average of last 5 years 356 Average of last 10 years 501 Average of last 15 years 542 Average of last 20 years 559

Residential Completions by large and small sites
Large (6+) Small (<6 units)
Total
2001/2 636 324 9602002/3 250 358 6082003/4 522 162 6842004/5 388 214 6022005/6 226 313 5392006/7 515 282 7972007/8 410 157 5672008/9 572 149 7212009/10 269 111 3802010/11 135 148 2832011/12 144 165 309 2012/2013 262 112 3742013/2014 340 96 436Source: BHCC residential monitoring
Small site development (all): Last 5 year annual average = 126 Last 10 year annual average = 175

Total Residential Completions in Brighton & Hove 1991/92 - 2013/14
0
200
400
600
800
1000
1200
1400
1991
/9219
92/93
1993
/9419
94/95
1995
/9619
96/97
1997
/9819
98/99
1999
/0020
00/01
2001
/0220
02/03
2003
/0420
04/05
2005
/0620
06/07
2007
/0820
08/09
2009
/1020
10/11
2011
/1220
12/13
2013
/14
Year
Net
Com
plet
ions
5 Year Average Residential Completions

Appendix B: Five year land supply requirement
Option A: Accommodating shortfall within first five years (post adoption)
A Housing target for the plan period (2010 – 2030) 13,200 B Annual housing target across plan period (A/20
years) 660
C Five-year target, no adjustment (B x 5) 3,300 D Shortfall of housing provision from earlier in the
plan period (requirement (2640) less completions (1402))
1238
E Five year target incorporating shortfall (C+D) 4,538 F Buffer (5%) 227 G Five year target incorporating buffer (E+F) 4,765 H Annual target for next 5 years (2014 – 2019)
(G/5) 953
I Current expected deliverable supply 2014/15 – 2018/19
a) Supply identified in 2014 SHLAA8
b) Other windfall9 sources (pdr)c) Other small site development (non pdl)10
3441
3276 110 55
J Gap (G-I) -1324 K Years supply equivalent to (I/H): 3.6 years supply
8 2014 SHLAA, September 2014, Summary Tables, Table 7, 1-5 Year Supply 9 2014 SHLAA, Table F, Other Windfall, permitted development rights e.g. change of use office to residential. 10 2014 SHLAA, Table E, Small Site Development, greenfield garden development.

Option B: Accommodating shortfall over full plan period to 2030 on an annualised (residual) basis.
A Housing target for the plan period (2010 – 2030) 13,200 B Completions 2010 – 2014 1,402 C Residual housing target 2014 – 2030 (A-B) 11,798 D Annualised housing target 2014 – 2030 (C/16) 737 E Five year target, no adjustment (D x 5) 3685 F Buffer (5%) 184 G Five year requirement incorporating buffer
(E+F) 3869
H Annual target for next 5 years (2014 – 2019) (G/5)
774
I Current expected deliverable supply 2014/15 – 2018/19
d) Supply identified in 2014 SHLAAe) Other windfall sources (pdr)f) Other small site development (non pdl)
3441
3276 110 55
J Gap (G-I) 428 K Years supply equivalent to (I/H): 4.4 years supply
Option C: Accommodating shortfall over full plan period to 2030 taking account of housing trajectory
A Housing target for the plan period (2010 – 2030) 13,200 B Completions 2010 – 2014 1,402 C Residual housing target 2014 – 2030 (A-B) 11,798
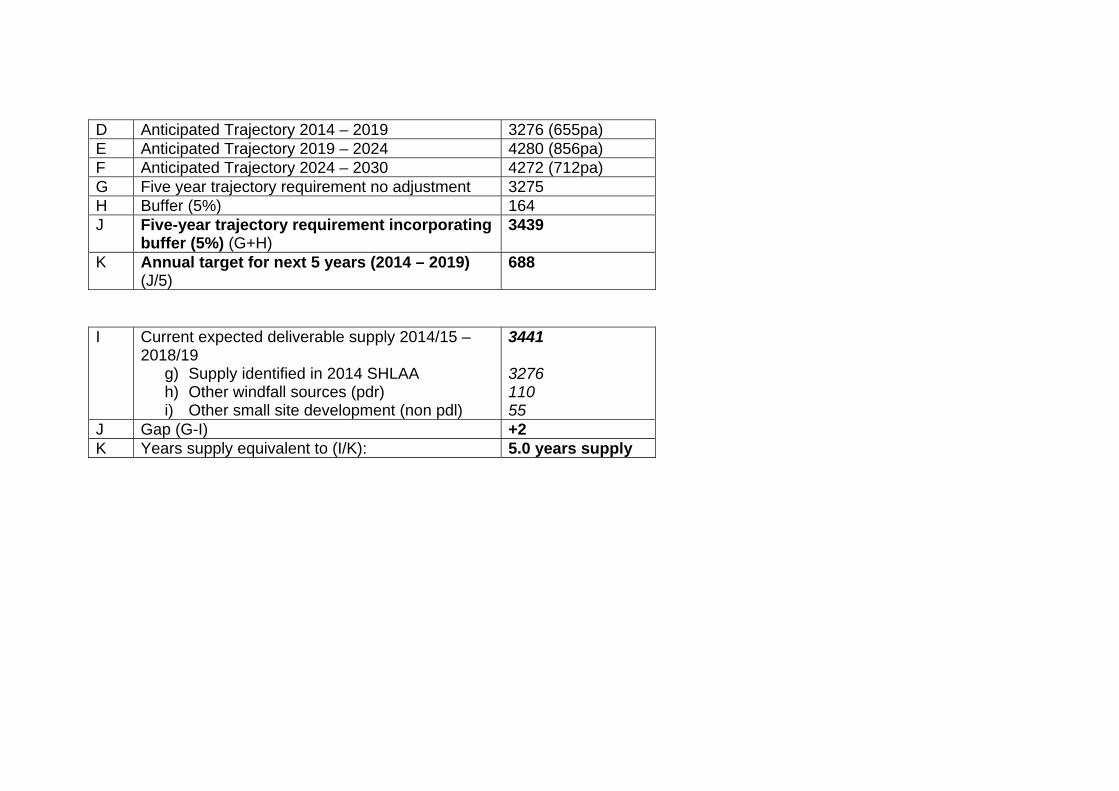
D Anticipated Trajectory 2014 – 2019 3276 (655pa) E Anticipated Trajectory 2019 – 2024 4280 (856pa) F Anticipated Trajectory 2024 – 2030 4272 (712pa) G Five year trajectory requirement no adjustment 3275 H Buffer (5%) 164 J Five-year trajectory requirement incorporating
buffer (5%) (G+H) 3439
K Annual target for next 5 years (2014 – 2019) (J/5)
688
I Current expected deliverable supply 2014/15 – 2018/19
g) Supply identified in 2014 SHLAAh) Other windfall sources (pdr)i) Other small site development (non pdl)
3441
3276 110 55
J Gap (G-I) +2 K Years supply equivalent to (I/K): 5.0 years supply

