and its challenges - quebec.ca
TRANSCRIPT
EXTENSIVE PUBLIC SERVICESCONSTRAINED LEEWAYAND EMERGING CHALLENGES
Advisory Committee on the Economyand Public Finances
québec And Its ChAllEngEs
1
do
Cu
mE
nt

EXTENSIVE PUBLIC SERVICESCONSTRAINED LEEWAYAND EMERGING CHALLENGES
Advisory Committee on the Economyand Public Finances
québec And Its ChAllEngEs
1doCumEnt

QUÉBEC AND ITS CHALLENGES - Document 1EXTENSIVE PUBLIC SERVICESCONSTRAINED LEEWAYAND EMERGING CHALLENGES
Legal deposit - Bibliothèque et Archives nationales du QuébecDecember 2009ISBN 978-2-550-57838-3 (Print)ISBN 978-2-550-57839-0 (PDF)
© Gouvernement du Québec, 2009
MESSAGE FROM THE MINISTER
On October 27, 2009, in conjunction with the fall update on the economy and public finances, I announced the establishment of an advisory committee comprising recognized experts to reflect with me on the key economic policies and the means to be adopted to get out of the recession, develop our economy’s potential and restore fiscal balance.
Pierre Fortin, Robert Gagné, Luc Godbout and Claude Montmarquette make up the committee, which I am jointly chairing with Robert Gagné.
The next budget must allow the government to undertake the most appropriate initiatives in order to pursue the course that we have followed until now to foster economic growth and consolidate public finances. We must, therefore, make the right decisions. The committee’s deliberations and discussions stemming from pre-budget consultations will help us to achieve this end.
Getting to the heart of the matter
Above all, I have asked the committee members to get to the heart of the matter and to focus on the facts. A discussion of Québec’s economy and public finances raises basic questions concerning our public services, the delivery of such services and the best means of funding them.
Over the years, Québec has established numerous government-funded services. We have created a significant social safety net that reflects Quebecers’ values. The current recession is spurring us to fully understand the contents of this basket of services, examine the requisite funding and make enlightened choices in this regard.
The Advisory Committee on the Economy and Public Finances, made up of respected academics devoted to the public interest, is, I am convinced, the appropriate forum through which to pinpoint the key questions that we must face in the short and medium terms.
I also expect the committee to propose possible solutions likely to arouse widespread support among all Quebecers.
Message from the Minister I

A committee co-chaired by the Minister
I wished to co-chair this committee, which is a rather unusual step, since I wanted to be closely associated with the analyses and reflection in which it engages in the coming weeks.
However, I want to make it clear that my presence as co-chair of the committee in no way hampers its deliberations. The Advisory Committee on the Economy and Public Finances will enjoy the broadest leeway to formulate the analyses and proposals that it deems to be relevant.
These analyses and proposals will be those of an advisory committee, which I will examine and discuss with my government colleagues in order to determine the appropriate follow-up.
However, by acting as co-chair of the committee, I am reserving the privilege of participating regularly in the committee’s discussions and monitoring, step by step, an initiative that is intended, above all, to ensure the well-being and prosperity of Québec society.
An important contribution to public debate
It is my hope that Quebecers will be receptive to the committee’s assessment of the financial and economic situation and its observations. My aim is for them to contribute significantly to public debate.
This assessment and the attendant proposals will provide me with a valuable basis for reflection, which I will analyze in conjunction with the 2010-2011 pre-budgetary consultations.
This first document stemming from the committee’s deliberations should illustrate the approach adopted while making accessible to the public at large its initial findings.
Raymond Bachand
Minister of Finance
Extensive public services, II constrained leeway, and emerging challenges
Table of contents III
TTAABBLLEE OOFF CCOONNTTEENNTTSS
MESSAGE FROM THE MINISTER............................................................................... I
SUMMARY...........................................................................................................1
INTRODUCTION .....................................................................................................5
EXTENSIVE PUBLIC SERVICES, CONSTRAINED LEEWAY, AND NEW CHALLENGES TO BE MET.........................................................................................9
1. EXTENSIVE PUBLIC SERVICES.........................................................................11
2. MORE LIMITED WEALTH CURTAILS THE ABILITY TO PAY.......................................19
3. CONSEQUENCE: QUÉBEC COLLECTS MORE TAX, BUT IS DEEPER IN DEBT ......................................................................................................23
4. OUR LEEWAY IS LIMITED, EVEN AS NEW CHALLENGES ARISE ...............................39
CONCLUSION .....................................................................................................49
THE COMMITTEE’S FUTURE WORK .........................................................................51
APPENDIX 1 – MEMBERS OF THE ADVISORY COMMITTEE ON THE ECONOMY AND PUBLIC FINANCES.....................................................53
APPENDIX 2 – ADDITIONAL INFORMATION..............................................................55
APPENDIX 3 – TOTAL TAX REVENUES – QUÉBEC, ONTARIO AND OECD COUNTRIES.........................................................................59


Tables V
TTAABBLLEESS
TABLE 1 Discrepancy in program spending between Québec and Ontario .............15
TABLE 2 Factors of economic growth.........................................................................44
TABLE 3 Reconciliation between budgetary data and data of the Statistics Canada financial management system .......................................................57
TABLE 4 Difference in spending between Québec and Ontario normalized to Québec’s population.................................................................................58


Charts VII
CCHHAARRTTSS
CHART 1 Discrepancy in program spending between Québec and Ontario .............12
CHART 2 Change in the discrepancy in program spending between Québec and Ontario....................................................................................................13
CHART 3 Change in the discrepancy in program spending between Québec and Ontario....................................................................................................14
CHART 4 Per capita GDP – calendar year 2008 ........................................................19
CHART 5 Change in real GDP per capita, 1981-2008 ...............................................20
CHART 6 Program spending net of federal transfers – 2008-2009 .........................21
CHART 7 Total tax revenues - 2006 ............................................................................24
CHART 8 Relative size of personal income tax - 2006...............................................25
CHART 9 Relative size of corporate taxes - 2006.......................................................26
CHART 10 Taxes on goods and services - 2006...........................................................27
CHART 11 The Québec government’s budgetary balance from 1978-1979 to 2013-2014....................................................................................................30
CHART 12 Debt representing accumulated deficits from 1978-1979 to 2013-2014....................................................................................................31
CHART 13 Gross debt of the Canadian provinces as at March 31, 2009 ..................32
CHART 14 Québec government spending 2009-2010 ................................................34
CHART 15 Debt service of the Consolidated Revenue Fund........................................35
CHART 16 Debt service and revenue from the Québec sales tax................................36
CHART 17 Gross debt as at March 31, 2009 ...............................................................37
CHART 18 Change in health, education and other departmental spending from 1980-1981 to 2009-2010 ..................................................................41
CHART 19 Projection of health and social services spending .....................................42
CHART 20 Spending on health per capita by the Québec government by age – 2007...........................................................................................................43
CHART 21 Change in the population age 15 to 64 ......................................................45
CHART 22 Change in the number of workers per retired person ................................45
CHART 23 Change in the population age 15 to 64 between 2010 and 2030 ...........46
CHART 24 Amount of investments in infrastructures including the road network..........................................................................................................47
CHART 25 Change in spending relating to public infrastructure investments (capital repayment and interest)..................................................................48
CHART 26 Total tax revenues – 2006...........................................................................59


Summary 1
SUMMARY
In conjunction with the 2010-2011 pre-budgetary consultation, the Minister of Finance has appointed an independent committee of experts comprising Pierre Fortin, Robert Gagné, Luc Godbout and Claude Montmarquette. The Minister is co-chairing the committee with Robert Gagné.
The Minister’s presence as co-chair leaves the committee full scope in its deliberations. The Minister will analyze the committee’s proposals and discuss the appropriate follow-up with his government colleagues.
In keeping with the approach that it has decided to follow, the Advisory Committee on the Economy and Public Finances will make public an initial document in which it defines the question that the Minister of Finance has asked it to examine. This document hinges on four observations.
Extensive public services
The first observation concerns the scope of the public services that the Québec government funds. In 2008-2009, if Québec were to offer Quebecers the basket of services that the Ontario government funds, it would reduce its expenditures by $17.5 billion1. This means that the Québec government funds 26% more public services than Ontario does.
This discrepancy is not new but it has widened over the past decade. This growing per-capita gap is apparent in each of the four major program spending categories, i.e. health, education, the family and social services, and other expenditures.
The committee intends to heighten public awareness of this first basic reality.
⎯ In relation to Ontario, Québec offers a more extensive basket of services.
⎯ Public funding for a given service is proportionally higher in Québec than in Ontario, where users pay in the form of fees a bigger share of these services.
1 Appendix 2 shows the methodology used to calculate differences in spending.

More limited wealth curtails the ability to pay
The extent of the public services that the Québec government offers reflects collective choices that Quebecers have made based on certain values. The problem stems from making such choices although our ability to pay is more limited than elsewhere.
⎯ In 2008, Québec ranked seventh among the Canadian provinces in terms of per capita GDP.
⎯ That same year, Québec’s per capita GDP was 14% lower than per capita GDP in Ontario.
Even when the contribution of federal transfers is considered, Québec spends more than the other provinces.
We are thus creating less wealth than most of the other provinces although public funding of services is higher in Québec than elsewhere.
The result is that Québec levies more tax and is deeper in debt
The consequence of these two realities is twofold.
Québec levies more tax
A comparison of the entire range of taxes that Québec levies in relation to those levied by our key partners reveals that compulsory fiscal levies are higher in Québec than in Ontario, the rest of Canada and the United States. They also exceed the average in the G7 nations and in the OECD countries.
Our leeway is especially constrained as regards personal taxation. We have no leeway in relation to the rest of North America from the standpoint of corporate taxes. As for consumption taxes, Québec lies mid-way between Europe and North America.
Québec has accumulated deficits
These high fiscal levies have been insufficient to cover the entire cost of our public services. We have thus had to resort to deficits whose accumulation makes up the debt. Québec’s total debt, on which the interest we must pay is calculated, now stands at $150 billion. Two-thirds of which, that is $100 billion, is “bad debt” that is not offset by assets.
Extensive public services, 2 constrained leeway, and emerging challenges

Québec is the most indebted province in Canada. As of March 31, 2009, gross debt accounted for 50% of our GDP, compared with 30% in Ontario and just over 24% in the rest of Canada.
The size of the debt induces the committee to make three observations that it wishes to draw to Quebecers’ attention.
⎯ First, debt service will exceed 9% of government spending in 2009-2010, equivalent to one-quarter of the health care budget. Debt service will account for nearly 14% of government expenditures in 2013-2014.
⎯ Second, we are using a growing fraction of our own-source revenues to cover debt service. In 2009-2010, nearly 60% of the QST collected was used to pay for debt service. Accordingly, fiscal balance has become very vulnerable. A rise of 1% in interest rates would cause debt service ultimately to grow by $1.5 billion, thus exerting additional pressure on taxes.
⎯ Third, our additional margin of indebtedness is very limited.
Our leeway is constrained at a time when new challenges are emerging
These observations take on another dimension when we look to the future: in the coming years, indeed, very soon, Québec will face new challenges in respect of which our leeway is extremely constrained.
We are facing three challenges.
⎯ Like all developed nations, we must assume the steadily growing cost of health care, which will accelerate as the population ages.
⎯ The second challenge stems from the impact of demographic changes on economic growth. In the coming years, the ageing population will deprive us of valuable economic growth points.
With demographic changes, a source of economic growth is thus in the process of drying up. To meet this demographic challenge, Québec will have no other choice than to the rely on the other two factors of growth by increasing labour market participation and enhancing productivity, i.e. output per hour worked.
⎯ The third challenge arises from infrastructure funding: we have initiated a process of catching up in the repair and modernization of infrastructure. This necessary process is increasing the debt.
Summary 3

Extensive public services, 4 constrained leeway, and emerging challenges
Conclusion
The committee notes that we are reaching the limits of the choices that Quebecers are demanding. Our financial position is worrisome. The challenges that Québec is facing are real, immediate and significant. We must make choices and act.
This is the direction that the approach the committee is proposing pursues.
The choices to which the committee refers should aim for:
⎯ a level of public spending commensurate with our ability to pay;
⎯ efficient taxation that does not jeopardize our economic development;
⎯ debt that is under control, whose size does not mortgage our children’s choices.
In other words, these choices should, in the long run, lead to balanced public finances for Québec, allowing future generations to make their own choices, which is the very definition of sustainable development.
The committee’s impending deliberations
In accordance with the plan that it has adopted, the Advisory Committee on the Economy and Public Finances will pursue its analyses and reflections by attempting to answer two series of questions:
⎯ Can we spend more effectively? Can we better fund public services? (Document 2)
⎯ In the short term, and in addition to returning to balanced budgets, what must we do to ensure quicker economic recovery? In the medium and long terms, how can we stimulate wealth creation? What initiatives must be launched to this end to increase output per hour worked (productivity) and labour force participation? At the conclusion of these deliberations and reflections, what options can we elaborate concerning revenues, expenditures and the debt? (Document 3)

Introduction 5
INTRODUCTION
On October 27, 2009, the government initiated the 2010-2011 pre-budgetary consultation when it unveiled the Economic and Financial Update.2 The government indicated at that time that this consultation would focus on two key problems:
⎯ the resumption of growth and major medium- and long-term economic policies in order to create the wealth necessary to fund public services;
⎯ the means to be implemented to return to balanced budgets by 2013-2014 and to control the debt by the year 2025.
In conjunction with this consultation, the Minister of Finance announced that he was appointing an independent committee of experts comprising Pierre Fortin, Robert Gagné, Luc Godbout and Claude Montmarquette, which he would co-chair with Robert Gagné.
Mandate of the committee
The committee’s mandate set by the Minister essentially encompasses two components:
⎯ in the economic sphere, the committee will “examine the course of actions to be taken to accelerate the recovery and ensure that Québec’s economy remains competitive and creates wealth in the medium and long term”;
⎯ in the realm of public finances, the committee will “examine the list of actions to favour a return to balanced budgets as stipulated by 2013-2014 and bolster public finances in the medium term”.
The committee wishes to immediately specify the spirit in which it is broaching the mandate that the Minister of Finance has assigned to it.
⎯ The committee is separate from the government, even though the Minister of Finance is acting as co-chair of the committee. At the very beginning of this document, the Minister stressed, moreover, the committee’s independence, which will give the proposals formulated the desired interest and credibility.
⎯ The committee is launching its deliberations using as a frame of reference the legislation initiated by the government adopted by the National Assembly concerning debt reduction3 and fiscal balance.4
2 Update on Québec’s Economic and Financial Situation, October 27, 2009, ministère des
Finances. 3 Act to reduce the debt and establish the Generations Fund, R.S.Q., c. R-2.2.0.1. 4 Balanced Budget Act, R.S.Q., c. E-12.00001.

Extensive public services, 6 constrained leeway, and emerging challenges
⎯ Moreover, the committee wishes to specify that it is seeking to foster reflection on themes that have already been subject to extensive analyses and discussions.
The committee is referring, in particular, to four reports requested in 2007 by then Minister of Finance Monique Jérôme-Forget. What is more, the committee members were directly involved in the elaboration of three of these reports.5
The committee is also referring to the measures that the government announced to restore fiscal balance when it tabled the 2009-2010 Budget.6
5 The Report of the Task Force on Tax Assistance for the Resource Regions and the New
Economy – On Equal Terms (the Gagné report), the Report of the Task Force on Business Investment – Québec Welcomes Investment (the Fortin report), and the Report of the Task Force on Fees for Public Services – The Right Fees to Live Better Together (Montmarquette report). The fourth report referred to is the Report of the Task Force on the Funding of the Health System – Getting Our Money’s Worth (Castonguay report).
6 2009-2010 Budget, Budget Plan, Section A – The Government’s Economic and Fiscal Policy Directions, ministère des Finances, March 2009.
Mandate of the Advisory Committee on the Economy and Public Finances
Under the mandate that the Minister of Finance has assigned to it, the Advisory Committee on the Economy and Public Finances is being asked to:
– Propose an approach to implement measures aimed at ensuring a prompt return to sustainable economic growth and the funding of quality public services accessible to everyone.
– More specifically, in the economic sphere, the committee is being asked to:
▪ Take stock of the initiatives to be emphasized and the appropriate approach to accelerate economic recovery and ensure that Québec is competitive and creates wealth in the medium and long terms, bearing in mind, in particular, the impact of demographic changes and the need to ensure that all regions benefit from economic development.
▪ In this respect, it must also specify the means of enhancing productivity both in the private and public sectors.
– From the standpoint of public finances, the committee has a mandate to:
▪ Take stock of priority initiatives and the appropriate approach to restore fiscal balance, anticipated in 2013-2014, and bolster public finances in the medium term, while:
○ ensuring funding for quality public services, especially in the health and education sectors;
○ enabling Québec to acquire adequate, updated infrastructure;
○ reducing for future generations the debt burden, which is already excessive;
○ obtaining the leeway necessary to ensure the development of the economy so that it remains competitive.
The committee will deliberate from November 2009 to February 2010, i.e. until the elaboration of the 2010-2011 Budget.
The ministère des Finances will support the committee’s deliberations.

The committee’s approach
The committee wishes its deliberations to be integrated into the overall pre-budgetary consultation process. To this end, it has decided to adopt a three-stage approach (each stage will lead to the publication of a separate document). This document marks the outcome of the first of the three stages. The other two documents will be made public between now and the tabling of the 2010-2011 Budget.
Defining the question
At the outset, the committee intends to define the question by taking stock by means of examples of the current state of public finances.
This situation can be summarized very simply: we are spending more than we are earning and are, consequently, getting into debt, and for amounts much greater than our capital investments. We are experiencing a situation that we would not accept at the individual level. The question that arises is simple: can a society accept over the long term such an imbalance without putting at risk its future development?
The title of the first document summarizes the situation, such as the committee members have analysed it:
⎯ The Québec government offers extensive public services.
⎯ Québec has constrained leeway to fund such services.
⎯ Québec is contending with this difficult situation at a time when new challenges are looming on the horizon. Among these challenges, mention should be made of the impact of demographic changes, which will reduce in the future our economic growth and exacerbate pressure on public spending.
The committee members believe that Québec has almost exhausted its leeway. The committee is concerned by the urgency of acting: we must not wait for constraints to compel us to intervene. We must make choices before others do so in our stead.
Introduction 7

Extensive public services, 8 constrained leeway, and emerging challenges
Focus on expenditures and revenues
During the second stage, the committee will reflect on possible measures pertaining to expenditures and revenues. The second document will thus present policy directions geared to answering two questions:
⎯ Can we spend more effectively?
⎯ Can we better fund public services?
Create wealth, propose options to the government
The first two stages will reveal that we are probably spending too much, that we can spend more effectively and better fund public services, and that we are not creating enough wealth.
The third stage in the approach that the committee has adopted will consist in reflecting on the creation of wealth and proposing options to the government concerning the economy and public finances.
In the third document, the committee will attempt to answer the following questions:
⎯ In the short term, and in addition to restoring fiscal balance, what must we do to ensure quicker economic recovery?
⎯ In the medium and long terms, how can we stimulate wealth creation? What initiatives must be launched to this end to increase output per hour worked and labour force participation?
⎯ At the conclusion of these deliberations and reflections, what options can we elaborate concerning revenues, expenditures and the debt? The committee will specify these options with a paramount concern for ensuring economic growth and wealth creation, without for all that minimizing the other missions of the State.
EXTENSIVE PUBLIC SERVICES, CONSTRAINED LEEWAY, AND NEW CHALLENGES TO BE MET
With this first theme, the advisory committee is broaching the context of public finances in which Québec is developing.
Four observations, around which the first document is structured, characterize this context:
⎯ The public services offered to Quebecers are extensive, in keeping with society’s collective choices and the values that underpin these choices.
⎯ However, our ability to pay is more limited than elsewhere. Federal transfers only partly equalize the ability to deliver public services from one province to the next.
⎯ Consequently, Québec must levy more tax. Over the years, that has not been enough and Québec has had to go deeper into debt than the others, not only to fund its capital investments, but especially to pay for current spending (“the groceries”).
⎯ We have thus reduced our leeway at the very time that new challenges are looming on the horizon, linked to health care costs, the impact of demographic changes on economic growth, the need to be more productive, and catching up in respect of infrastructure.
We must thus display imagination and find appropriate responses that protect that values we cherish, despite increasingly constrained leeway.
Extensive public services, constrained leeway, and new challenges to be met 9


Extensive public services 11
1. EXTENSIVE PUBLIC SERVICES
To ascertain the extent of the public services that the Québec government offers Quebecers, the committee has decided to compare Québec’s public spending with that in Ontario, our main economic partner. The committee obtained similar results when it instead compared Québec with the rest of Canada.
The extent of our public services can be readily illustrated by means of a few figures.
Higher public spending than in Ontario
In 2008-2009, public spending in Québec (provincial and municipal expenditures) reached $86.1 billion. The committee has noted that if Québec were to offer Quebecers the basket of services that the Ontario government funds, it would reduce its expenditures by $17.5 billion.7
7 To make this comparison, public spending in Ontario was adjusted in light of Québec prices
and wages, then recalculated to take into account the populations of Québec and Ontario. Appendix 2 shows the methodology used to calculate differences in spending.

Public funding in Québec is 26% higher than in Ontario
That means that Québec funds 26% more in public services than Ontario, i.e. the relation between the amount of sending in Québec ($86.1 billion) and the amount of spending corresponding to the basket of services publicly funded in Ontario ($68.6 billion).
CHART 1 Discrepancy in program spending between Québec and Ontario1
Consolidated provincial and municipal governments, 2008-2009
(Billions of dollars)
86.1
68.6
Level of public spending in Québec Level of public spending according to the basketof services publicity funded in Ontario
$17.5 billion
1 Discrepancy between actual spending in Québec and publicly funded expenditures in Ontario adjusted to the cost of producing public services in Québec (prices and wages) standardized in respect of the Québec population.
Source: Data from the Statistics Canada financial management system adjusted by the ministère des Finances du Québec.
Extensive public services, 12 constrained leeway, and emerging challenges

The discrepancy is not new
The discrepancy between the funding of public services in Québec and Ontario is not new. However, the committee notes that it has widened over the past decade and that it now applies to substantially all of the services offered, regardless of their nature.
Since 1988-1989, the gap in public spending between Québec and Ontario has more than tripled, from $5.6 billion to $17.5 billion.
CHART 2 Change in the discrepancy in program spending between Québec and Ontario1
Consolidated provincial and municipal governments, 1988-1989 to 2008-2009 (Millions of dollars)
5 5824 044
7 481
9 500
12 871
17 511
1988-1989 1993-1994 1998-1999 2003-2004 2006-2007 2008-2009
1 Discrepancy between actual spending in Québec and publicly funded expenditures in Ontario adjusted to the cost of producing public services in Québec (prices and wages) standardized in respect of the Québec population.
Source: Data from the Statistics Canada financial management system adjusted by the ministère des Finances du Québec.
Extensive public services 13

A discrepancy found in all expenditure groupings
This growing per-capita gap is apparent in each of the four major program spending categories, i.e. health, education, the family and social services, and other expenditures.
CHART 3 Change in the discrepancy in program spending between Québec and Ontario1
Consolidated provincial and municipal governments – 1988-1989 to 2008-2009 (In 2008 dollars per capita)
80
350 52
1 816
0
546
56572
3 1 02
5
28
765
1 26
9
707
1 16
1
2 25
9
-135
-15617
5
42153
107 22
9
247
193
198
Health Education Family and socialservices
Other Total
1988-89 1993-94 1998-99 2003-04 2008-09
2 3
4
5
1 Discrepancy between actual spending in Québec and publicly funded expenditures in Ontario adjusted to the cost of producing public services in Québec (prices and wages) standardized in respect of the Québec population.
2 This function encompasses hospital care, general medical care programs and drugs, and other services such as laboratories, ambulance services and institutions for the mentally ill.
3 This function encompasses elementary and secondary education, technical and vocational training, postsecondary education provided by universities, Cegeps and other institutions, student financial assistance, off-the-job and on-the-job worker training and retraining, the administration of the department, and payments made to private agencies.
4 Social services include social aid, nursing homes, handicapped centres, drug and alcohol addiction treatment centres, legal aid, home care, childcare services, and family assistance programs (including tax credits).
5 Public spending not classified elsewhere: general government services, protection of individuals and property, transportation and communications, resource conservation and industrial development, the environment, recreation and culture, labour, employment and immigration, housing, regional planning and development and research establishments.
Source: Data from the Statistics Canada financial management system adjusted by the ministère des Finances du Québec.
Extensive public services, 14 constrained leeway, and emerging challenges

The main discrepancies observed
For 2008-2009, it is germane to specify the spending discrepancies pinpointed according to the main sectors in which public services are offered.
TABLE 1 Discrepancy in program spending between Québec and Ontario1 Consolidated provincial and municipal governments – 2008-2009
Program spending in
Québec
Program spending in Québec according to the basket of services funded publicly in
Ontario Discrepancy
Sector (Millions of dollars) (Millions of dollars) (Millions of dollars)
Health 23 170 21 637 1 533
Education 16 727 15 231 1 496
Family and social services 15 005 9 525 5 480
Other
Transportation and communications
8 231 4 202 4 029
Justice and protection 4 921 5 477 − 556
Industrial development and resources 3 647 1 802 1 845
General services 3 524 2 391 1 133
Environment 3 349 2 885 464
Recreation and culture 3 014 2 106 908
Industrial accidents 2 042 1 694 348
Housing 1 094 996 98
Regional planning and development 586 317 269
Labour, employment and immigration
388 126 262
Research establishments 383 17 366
Other (expenditures not classified elsewhere) 0 162 − 162
TOTAL – PROGRAM SPENDING 86 082 68 571 17 511
1 Discrepancy between actual spending in Québec and publicly funded expenditures in Ontario adjusted to the cost of producing public services in Québec (prices and wages) standardized in respect of the Québec population.
Source: Data from the Statistics Canada financial management system adjusted by the ministère des Finances du Québec.
Extensive public services 15

Extensive public services, 16 constrained leeway, and emerging challenges
The data presented reveal that five sectors, i.e. the family and social services, transportation and communications, industrial development and resources, health and education alone account for a discrepancy of $14.4 billion, equivalent to 82% of the overall gap.
The committee wishes to make the following comments on these five sectors:
⎯ The biggest discrepancy, i.e. $5.5 billion in 2008-2009, has been noted in the family and social services sector, which can be explained easily.
— In the realm of the family, Québec has gradually implemented the most generous family policy in Canada.8 In 2005-2006, annual subsidies paid per childcare service space stood at $4 600 in Québec, compared with $3 300 in Canada as a whole and $2 300 in Ontario.
— Another reason for this discrepancy is found in the social services sector. Québec differs markedly from Ontario and the rest of Canada from the standpoint of the method of ownership of spaces in residential and long-term care centres.
– In 2006-2007, 77% of approved beds in Québec belonged to the province, none belonged to the municipalities, and 23% were privately owned.
– The same year, 25% of approved beds in Canada belonged to the provinces, 8% belonged to the municipalities, and 67% were privately owned. In the case of Ontario, again in 2006-2007, the province did not own any beds, the municipalities owned 20%, and 80% of the beds were privately owned.
⎯ After the family and social services, the second biggest discrepancy between Québec and Ontario occurs in the transportation sector. In 2008-2009, public funding in Québec in respect of transportation was $4.0 billion higher than such funding in Ontario. This situation is attributable both to greater needs in relation to the population (the Québec network is more extensive than the Ontario network), and to the very rapid catching up that the Quebec government has achieved in recent years.
As we will see later, these new needs stemming from accelerated investment in infrastructure are one of the challenges that Québec must meet in the future from the standpoint of public finances.
⎯ The third biggest discrepancy is attributable to expenditures effected in respect of industrial development and resources.
8 See Status Report on Québec’s Family Policy, 2009-2010 Budget, ministère des Finances.
Extensive public services 17
— In this instance, most of the discrepancy between Québec and Ontario stems from tax credits, tax holidays and specific measures defined in order to support scientific research and experimental development, investment, the new economy and the regions.
— The discrepancy between Québec and Ontario can also be explained by subsidies, that are more generous in Québec. These subsidies mainly benefit the agriculture sector.
⎯ In the health sector, the discrepancy between Québec and Ontario amounts to $1.5 billion. This gap is relatively small in relation to the scope of the expenditures in question, even though Québec offers more services than Ontario does, as the Québec drug insurance plan illustrates.
⎯ In the education sector, the discrepancy between Québec and Ontario amounts to $1.5 billion. It stems entirely from the higher expenditures that Québec assumes at the postsecondary level, essentially because the Québec government covers a portion of the tuition fees that students in the other provinces pay.
A first reality
The committee wishes to heighten Quebecers’ awareness of a first basic reality: the Québec government offers extensive public services, which has led to a significant discrepancy in public funding in relation to Ontario. For this reason, the public funding that Québec assumes exceeds by one-quarter the public funding that Ontario assumes.
⎯ In relation to Ontario, Québec offers a more extensive basket of services.
⎯ Public funding for a given service is proportionally higher in Québec than in Ontario, where users pay through fees a bigger share of these services.


2. MORE LIMITED WEALTH CURTAILS THE ABILITY TO PAY
The figures presented earlier thus confirm the extent of the public services that the Québec government offers Quebecers, which reflects the latters’ collective choices, based on certain values.
The problem stems from making such choices although our ability to pay is more limited than elsewhere. Québec is creating less wealth than Ontario and most of the other provinces, although it more extensively funds public services.
It would be erroneous to claim that federal transfers rectify this imbalance: Québec assumes more extensive expenditures than the other provinces even when the contribution made by federal transfers is subtracted.
Québec is not as rich as most of the Canadian provinces
The latest data concerning wealth creation are completely unambiguous on this point: Québec is not as rich as most of the Canadian provinces. CHART 4 Per capita GDP – calendar year 2008 (Dollars)
62 656
45 150
36 63538 979 36 503
80 997
42 147
33 159
45 440
61 758
AB SK NL ON BC MB QC NB NS PEI
Provincial average:$47 896
Sources: Provincial economic accounts, quarterly population data from Statistics Canada and calculations of the ministère des Finances du Québec.
More limited wealth curtails the ability to pay 19

In 2008, Québec ranked seventh among the Canadian provinces in terms of per capita GDP, i.e. per capita income on which Québec taxes are levied. Only New Brunswick, Nova Scotia and Prince Edward Island ranked below Québec in this respect.
That same year, Québec’s per capita GDP was 14% lower than per capita GDP in Ontario.
A persistent discrepancy
This situation is not new. Between 1981 and 2008, the wealth gap between Québec and Ontario fell slightly but maintained the same order of magnitude (17% in 1981, 19% in 1991, 18% in 2001, and 14% in 2008).
CHART 5 Change in real GDP per capita, 1981-2008 (Dollars)
12 2
94
21 9
54
31 3
16 38 9
79
14 8
73
27 1
39
38 1
37 45 4
40
14 5
23
24 4
45
35 7
22
48 0
111981 1991 2001 2008
Québec Ontario Canada
Source: Statistics Canada.
The Québec government assumes most of the discrepancy between revenues and expenditures
We are creating less wealth than most of the other provinces although public funding of services is higher in Québec than elsewhere.
The committee has questioned the role that federal transfers play in bridging this gap between expenditures and the revenues available to fund them.
Federal transfers are intended partially to equalize between the provinces the ability to deliver comparable public services.
Extensive public services, 20 constrained leeway, and emerging challenges

Even when the contribution of federal transfers is considered, Québec spends more than the other provinces. Accordingly, this additional spending is not funded by federal transfers.
This is apparent when program spending in the provinces net of federal transfers is calculated. Such expenditures are, in fact, highest in Québec as a percentage of GDP: program spending net of federal transfers accounts for 22.5% of GDP in Québec, as against 18.5% in Ontario and 18.3% in Canada as a whole.
CHART 6 Program spending net of federal transfers – 2008-2009 Provincial and municipal governments (as a percentage of GDP)
22.5
19.7 19.7 19.418.5
14.2
7.2
16.816.917.6
QC BC PEI NB ON MB SK NS AB NL
Provincial average: 18.3%
Sources: Modified financial management system data and calculations by the ministère des Finances du Québec, December 2009.
As we shall see in the following section, Québec funds its additional spending by means of taxes and by incurring debt.
More limited wealth curtails the ability to pay 21


3. CONSEQUENCE: QUÉBEC COLLECTS MORE TAX, BUT IS DEEPER IN DEBT
Compared to Ontario, Québec spends more on funding its services. Québec’s ability to pay is also more limited.
The consequences are twofold:
⎯ Québec has chosen to collect more tax;
⎯ and Québec is deeper in debt than Ontario and the other provinces.
Consequence: Québec collects more tax, but is deeper in debt 23

Extensive public services, 24 constrained leeway, and emerging challenges
Québec collects more tax
As with the extent of our public services, a few figures illustrate the amount we pay in tax.
CHART 7 Total tax revenues - 2006 (as a percentage of GDP)
28.0%
32.7%
35.5%
38.2%
35.6%
35.9%OECD average
G7 average
United States
Canada (excl. Qc)
Ontario
Québec
Sources: OECD and ministère des Finances du Québec.
Considering all taxes collected in Québec compared to the situation among our major partners, we see that compulsory tax levies are higher in Québec than in Ontario, the rest of Canada and the United States. These compulsory levies represent just over 38% of our GDP, compared with 36% in Ontario, 33% in the rest of Canada, and 28% in the United States.
Compulsory tax levies are also higher in Québec than the average of G7 countries and of OECD countries (36% in both cases).9
9 Appendix 3 contains a chart showing the percentage of total tax revenues compared to GDP in
2006 for each OECD member country.

Fiscal leeway that is especially limited for personal taxation
In the case of personal taxation, and despite the efforts of recent years, we remain among the most heavily taxed. Personal income tax (federal and provincial) represents just over 14% of our GDP, compared with 13% in Ontario, 12% in the rest of Canada, 10% in the United States and 9% in both the G7 and OECD countries.
That means we have very little leeway, compared to our competitors, to further increase the amount of personal income tax.
CHART 8 Relative size of personal income tax - 2006 (as a percentage of GDP)
9.1%
9.4%
10.2%
11.8%
14.1%
13.1%
OECD average
G7 average
United States
Canada (excl. Qc)
Ontario
Québec
Sources: OECD and ministère des Finances du Québec.
Consequence: Québec collects more tax, but is deeper in debt 25

Corporate taxes: no leeway compared to the rest of North America.
Our leeway as far as corporate taxes, which include the tax on corporate profits, tax on capital, as well as payroll taxes, is also limited when we examine the situation in North America. The level of taxation in Québec is the highest in North America: corporate taxes represent just over 9% of our GDP, compared with 8% in Ontario and 7% in the rest of Canada and the United States.
This situation is attributable to the relatively high level of payroll taxes collected in Québec, especially the contribution to the Health Services Fund, whereas Québec has made a considerable effort to reduce taxes on investment.
Indeed, corporations are more heavily taxed in the G7 and OECD countries as a whole.
CHART 9 Relative size of corporate taxes - 20061 (as a percentage of GDP)
9.5%
7.7%
6.7%
7.1%
9.7%
9.2%
OECD average
G7 average
United States
Canada (excl. Qc)
Ontario
Québec
1 Includes the tax on corporate profits, tax on capital, as well as payroll taxes (employer shares). Sources: OECD and ministère des Finances.
Extensive public services, 26 constrained leeway, and emerging challenges

Consumption taxes: half-way between Europe and North America
Lastly, when it comes to consumption taxes, Québec is half-way between its North American neighbours and its European partners.
⎯ Taxes on goods and services are high compared to the rest of North America, and the disparity is at times substantial. Consumption taxes represent just over 9% of our GDP, compared with 8% in the rest of Canada and less than 5% in the United States.
⎯ The level of consumption taxes collected in Québec is higher than the G7 average, but a little lower than the average for OECD countries.
CHART 10 Taxes on goods and services - 2006 (as a percentage of GDP)
8.0%
8.7%
9.4%
8.4%
4.7%
10.3%OECD average
G7 average
United States
Canada (excl. Qc)
Ontario
Québec
Sources: OECD and ministère des Finances.
Consequence: Québec collects more tax, but is deeper in debt 27
Québec has accumulated deficits
The taxes collected in Québec to fund public services are among the highest in the developed countries. However, they have not been enough to cover the all the costs of these services. Accordingly, we have had to run deficits, whose accumulation makes up the debt. The debt is thus a deferral of tax to the future.
Québec’s debt: $150 billion, of which two thirds is “bad debt”
Québec’s debt now stands at $150 billion. That is what is called the “gross debt”.
When this debt is reduced by the assets we hold, for example, an interest in a government corporation or a freeway, the result corresponds to accumulated deficits. This debt is estimated at $100 billion and is bad debt.
It was not incurred to finance assets. It results from deficits accumulated as a result of spending on “groceries”. We see then that Québec must finance a debt two third of which consists of deferred current expenses that were not paid for when they were incurred.
The important point is that Québec’s gross debt, on which the interest we must pay is calculated, now stands at $150 billion, and that two thirds of that amount is bad debt for which there are no offsetting assets.
Extensive public services, 28 constrained leeway, and emerging challenges

Concepts of Debt Used by the Québec Government
Gross debt
The gross debt corresponds to the total of the consolidated direct debt (debt contracted on financial markets), the net liability for the retirement plans and the net employee future benefits liability. The balance of the Generations Fund is subtracted from this amount.
Net debt
The concept of net debt represents the debt that was used to finance non-financial assets (capital assets, net investment in the networks, inventories and pre-paid expenses) and the accumulated deficits. It is obtained by subtracting the government’s financial assets (value of the government’s investments in its government corporations, accounts receivable and long-term investments) from the gross debt.
Debt representing accumulated deficits
The debt representing accumulated deficits corresponds to the total of all the deficits and surpluses accumulated in the past by the Québec government. It is obtained by subtracting non-financial assets from the net debt (capital assets).
Debt representing accumulated deficits as at March 31, 2009 (Millions of dollars)
Gross debt 151 385
Less: financial assets, net of other liabilities − 22 159
Net debt 129 226
Less: non-financial assets − 30 767
DEBT REPRESENTING ACCUMULATED DEFICITS1 98 459
As a % of GDP 32.4
1 After taking the stabilization reserve into account.
Consequence: Québec collects more tax, but is deeper in debt 29

Many deficits, surplus very rarely
Normally, advantage should have been taken of periods of expansion to significantly reduce the size of the debt accumulated during periods of recession. Over a long period, at least part of the amounts added to the debt during recessions would have been repaid during periods of expansion.
That is not what happened. Since the end of the 1970s, Québec has almost never posted a surplus, despite returning to zero deficits.
CHART 11 The Québec government’s budgetary balance from 1978-1979 to 2013-2014 (as a percentage of GDP)
-3.1% in2013-141
-4.8% in1980-81
-1.6% in2009-10
0.2% in2000-01
-3.4% in1994-95
-6
-5
-4
-3
-2
-1
0
1
78-7
9
80-8
1
82-8
3
84-8
5
86-8
7
88-8
9
90-9
1
92-9
3
94-9
5
96-9
7
98-9
9
00-0
1
02-0
3
04-0
5
06-0
7
08-0
9
10-1
1
12-1
3
With the Plan to return to balanced budgets
Return to balanced budgets
13-1
4
Year of recession
1 Assuming program spending growth of 4.6% per year from 2010-2011 to 2013-2014, i.e. the average growth over the last seven years.
In particular, during the period of expansion, the budget remained balanced without allocating significant surpluses to debt repayment. Essentially, the available surpluses were used to increase spending and therefore public services. In addition, taxes were cut in certain instances to avoid falling too far behind with regard to tax competitiveness: in this case, we see that our choices were dictated in part by outside constraints.
Extensive public services, 30 constrained leeway, and emerging challenges

CHART 12 Debt representing accumulated deficits from 1978-1979 to 2013-2014 (as a percentage of GDP)
31.3%
23.3% in1988-89
34.2%in 2009-10
42.1%in 1998-99
19.6%in 1980-81
39.2%
78-79 82-83 86-87 90-91 94-95 98-99 02-03 06-07 10-11
With Plan to return to balanced budgetsWithout Plan to return to balanced budgets
13-14
Accounting reforms of 1997-98and 2006-07
Lastly, since the end of the 1970s, Québec’s debt has grown faster than wealth creation.
⎯ Calculated as a percentage of GDP, the debt representing accumulated deficits rose from just under 20% in 1980-1981 to a peak of 42% in 1998-1999.
⎯ Since then, the period of expansion has enabled the debt load compared to GDP to decline to just over 34% in 2009-2010. This decline is attributable essentially to growth in GDP, since no significant surplus has been allocated to debt repayment.
⎯ At the end of the last period of expansion, our debt level compared to GDP is higher than it was in 1988-1989, at the end of the previous period of expansion.
⎯ Without the Plan to return to balanced budgets, the debt representing accumulated deficits would reach 39.2% of GDP in 2013-2014.
Consequence: Québec collects more tax, but is deeper in debt 31

Québec is the most indebted province in Canada
The accumulation of past deficits has made Québec the most indebted province in Canada.
As at March 31, 2009, the gross debt represented practically 50% of our GDP, compared with 30% in Ontario and just over 24% in the rest of Canada. The calculation in this case was made using the gross debt, since that is the debt that must be funded and on which interest payable is calculated.
CHART 13 Gross debt of the Canadian provinces as at March 31, 2009 (as a percentage of GDP)
49.9
35.1 33.230.1 28.4 26.6
23.9
4.2
16.6
19.8
QC NS NL ON MB NB PEI BC SK AB
Canadian average excluding Québec:
24.2%1
1 As at March 31, 2008. Source: Ministère des Finances du Québec.
Extensive public services, 32 constrained leeway, and emerging challenges

The debt burden is cause for concern
Our debt burden is cause for concern for a number of reasons. The committee wants to lay out the main ones here.
⎯ Québec already bears the heaviest public debt of any region on the North American continent.
⎯ Public borrowings consume a portion of national savings, leaving less to fund investment in the rest of the economy.
⎯ Debt service that grows consistently creates a growing gap between what we pay in taxes and what we receive in public services, contributing to mounting frustration among taxpayers.
⎯ Future generations are being asked to pay the cost of public services offered to current generations.
⎯ Public finances become vulnerable to the least variation in interest rates (1% of $150 billion = $1.5 billion per year).
⎯ There is a danger that an indebted government may become a slave to the diktats of rating agencies and providers of funds, as was the case in 1996.
Consequence: Québec collects more tax, but is deeper in debt 33

Three observations concerning the size of the debt
The size of the debt leads the committee to make three observations it wishes to bring to the public’s attention.
⎯ First, debt service takes up a large share of our expenditure budget.
In 2009-2010, debt service will exceed 9% of government spending, i.e. just over $6 billion. That corresponds to one quarter of the health budget, or nearly half the education budget, or the equivalent of the budget of 14 departments.
CHART 14 Québec government spending 2009-2010 (as a percentage of budgetary expenditure)
40.7
21.819.1
9.1 9.2
Health Education 6 departments 14 otherdepartments
Debt service1
2
1 Including the following departments: Emploi et Solidarité sociale: 6.4%; Transports: 4.2%; Famille et Aînés: 3.1%; Affaires municipales: 2.8%; Sécurité publique: 1.6%; Justice: 1.0%.
2 Including the following departments: Agriculture, Pêcheries et Alimentation; Conseil du trésor et Administration gouvernementale; Conseil exécutif; Culture, Communications et Condition féminine; Développement durable, Environnement et Parcs; Développement économique, Innovation et Exportation; Finances (excluding debt service); Immigration et Communautés culturelles; Relations internationales; Ressources naturelles et Faune; Revenu; Services gouvernementaux; Tourisme and Travail.
Source: Conseil du trésor du Québec, 2009-2010 Expenditure Budget.
Extensive public services, 34 constrained leeway, and emerging challenges

From 2009-2010 to 2013-2014, debt service will rise by more than 50%. It will then account for nearly 14% of government revenue.
CHART 15 Debt service of the Consolidated Revenue Fund (as a percentage of total revenue)
15.2
13.8
9.9
11.6
13.0
8
10
12
14
16
18
1999-00 2001-02 2003-04 2005-06 2007-08 2009-10 2011-12 2013-14
Forecasts
Source: Ministère des Finances du Québec, Sound public finances to protect our values, autumn 2009.
Consequence: Québec collects more tax, but is deeper in debt 35

⎯ Second, we apply a growing fraction of our own-source revenue to service the debt. Those resources are not available to fund public services.
In 2009-2010, nearly 60% of the money collected on account of the QST is used to service the debt.
In 2013-2014, 72% of the QST will be used to service the debt – even with the one point rise in the QST that will apply as of January 2011.
CHART 16 Debt service and revenue from the Québec sales tax (Millions of dollars)
Source: Ministère des Finances du Québec, Sound public finances to protect our values, autumn 2009.
10 618
13 536
9 768
6 154
2009-2010 2013-2014
Debt service QST revenue
58% of the QST 72% of the QST
Extensive public services, 36 constrained leeway, and emerging challenges

⎯ Third and last, Québec’s margin for additional debt is very limited to maintain its credit rating and avoid having to pay even higher interest rates on markets.
By comparison, Ontario’s additional debt margin is $117 billion. That means that Ontario’s debt would have to grow by $117 billion before its debt as a percentage of its GDP was equivalent to Québec’s.
CHART 17 Gross debt as at March 31, 2009 (as a percentage of GDP)
49.9%
30.1%
Québec Ontario
$117 billion
Source: Ministère des Finances du Québec, Budget Plan, 2009-2010 Budget, p. D.14 and calculations of the ministère des Finances du Québec.
Consequence: Québec collects more tax, but is deeper in debt 37


4. OUR LEEWAY IS LIMITED, EVEN AS NEW CHALLENGES ARISE
The figures we have just shown illustrate a worrisome situation.
The size of our public expenditures, the limits of our ability to pay, the weight of our tax system and the size of our debt take on a whole new dimension when we look to the future: over the coming years, and in fact fairly quickly, Québec will face new challenges in light of which our leeway seems especially limited.
There are three such challenges:
⎯ Like all developed countries, we must assume that health costs will continue to rise. This growth will be accelerated by the aging of the population.
⎯ The second challenge results from the impact of demographic changes on economic growth. The aging of the population will cost us valuable points of economic growth over the coming years.
⎯ The third challenge stems from the financing of infrastructures: we have begun to make up for lost ground in repairing and modernizing infrastructures. This necessary process is causing the debt to grow even faster.
Our leeway is limited even as new challenges arise 39

Extensive public services, 40 constrained leeway, and emerging challenges
Rising health costs
The first challenge is in fact not new, and affects all developed countries. In 2008, the Castonguay Report described its chief aspects.10
The rise in health costs is essentially due to the combination of a number of factors – increased needs, rising drug costs and the introduction of new technologies.
10 Report of the Task Force on the Funding of the Health System – Getting Our Money’s Worth.
Our leeway is limited even as new challenges arise 41
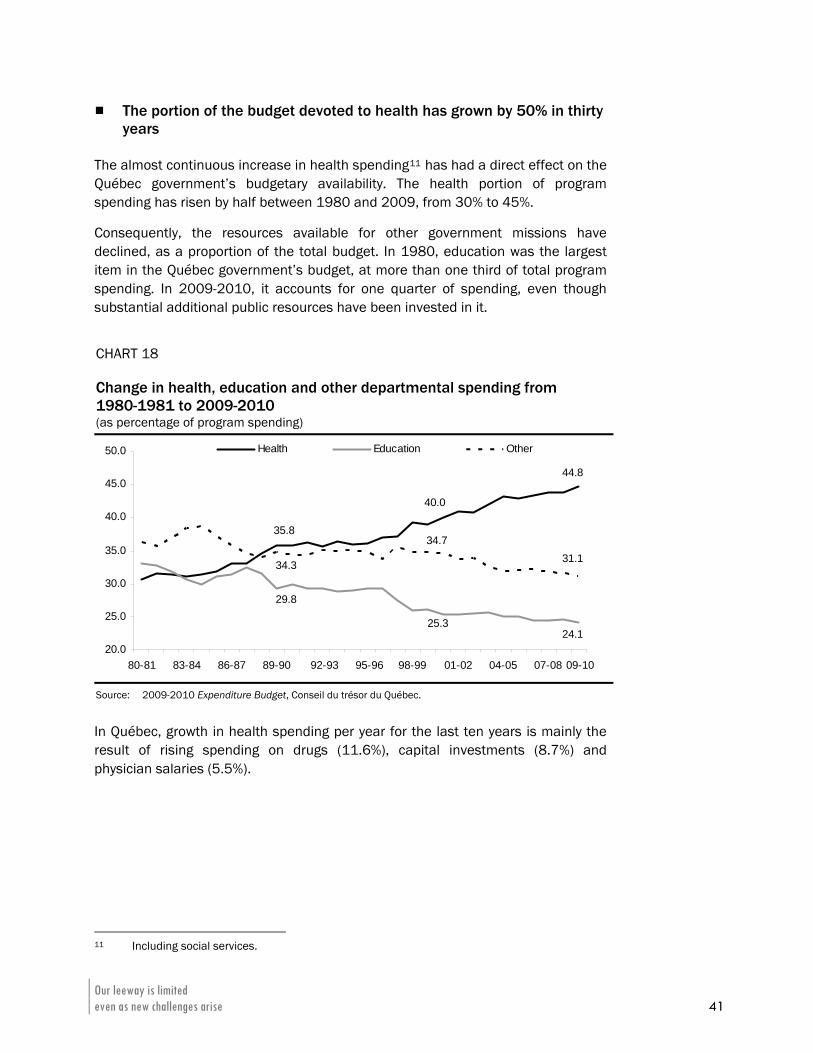
The portion of the budget devoted to health has grown by 50% in thirty years
The almost continuous increase in health spending11 has had a direct effect on the Québec government’s budgetary availability. The health portion of program spending has risen by half between 1980 and 2009, from 30% to 45%.
Consequently, the resources available for other government missions have declined, as a proportion of the total budget. In 1980, education was the largest item in the Québec government’s budget, at more than one third of total program spending. In 2009-2010, it accounts for one quarter of spending, even though substantial additional public resources have been invested in it.
CHART 18 Change in health, education and other departmental spending from 1980-1981 to 2009-2010 (as percentage of program spending)
35.8
40.0
44.8
29.8
25.324.1
34.3
34.731.1
20.0
25.0
30.0
35.0
40.0
45.0
50.0
80-81 83-84 86-87 89-90 92-93 95-96 98-99 01-02 04-05 07-08
Health Education Other
09-10
Source: 2009-2010 Expenditure Budget, Conseil du trésor du Québec.
In Québec, growth in health spending per year for the last ten years is mainly the result of rising spending on drugs (11.6%), capital investments (8.7%) and physician salaries (5.5%).
11 Including social services.

A $31-billion gap in twenty years
According to an estimate in the Castonguay Report and since updated, if nothing is done, health spending in 2030-2031 will be $31 billion more than what Québec would normally have to fund from growth in economic activity.
CHART 19 Projection of health and social services spending (Billions of current dollars)
52 860
87 801
26 872 41 079
56 475
09-10 12-13 15-16 18-19 21-22 24-25 27-28 30-31
Health spending at 5.8%Health spending at the economy's forecast grow th rate of 3.6%
$ -31billion
$ -12 billion
Sources: 2009-2010 Budget Plan and projection by the ministère des Finances du Québec.
Extensive public services, 42 constrained leeway, and emerging challenges

The impact of the aging of the population
The challenge of rising health costs takes on a whole new dimension with the aging of the population. Because of ongoing demographic changes, there will be more old people in the short and medium term, and health spending rises with age.
CHART 20 Spending on health per capita by the Québec government by age – 2007 (Dollars)
5 771
1 019 873 1 321 2 296
6 020
11 855
23 833
0-1 1-4 5-14 15-44 45-64 65-74 75-84 85 +
Source: Canadian Institute for Health Information (2009).
Our leeway is limited even as new challenges arise 43

The impact of demographic changes on economic growth
The effect of demographic changes is not restricted to health costs. They will also have a profound impact on our ability to create wealth.
A source of economic growth is drying up
In the past, demography played a major role in Québec’s economic growth.
⎯ During the period 1981-2008, the demographic profile of Québec’s population accounted for almost one third of economic growth – the balance corresponding to labour market participation and productivity.
⎯ Beginning in 2015, Québec’s demographic profile will reduce expected economic growth. If nothing is done, the gains expected from labour market participation and productivity will not be sufficient to maintain economic growth at the level of the last thirty years – despite a fairly optimistic outlook concerning these two factors of economic growth.
TABLE 2 Factors of economic growth (percentage points)
Average
1981-2008 2010 2015 2020 2025
GDP growh 2.0 1.7 1.8 1.6 1.4
Demographic profile1 0.6 0.4 − 0.1 − 0.3 − 0.2
Labour market2 0.6 − 0.2 0.7 0.7 0.4
Productivity3 0.8 1.5 1.2 1.2 1.2
1 Population age 15 to 64. 2 Number of workers as a percentage of the population age 15 to 64. 3 Real GDP per worker. Source: Projection by ministère des Finances du Québec.
Extensive public services, 44 constrained leeway, and emerging challenges
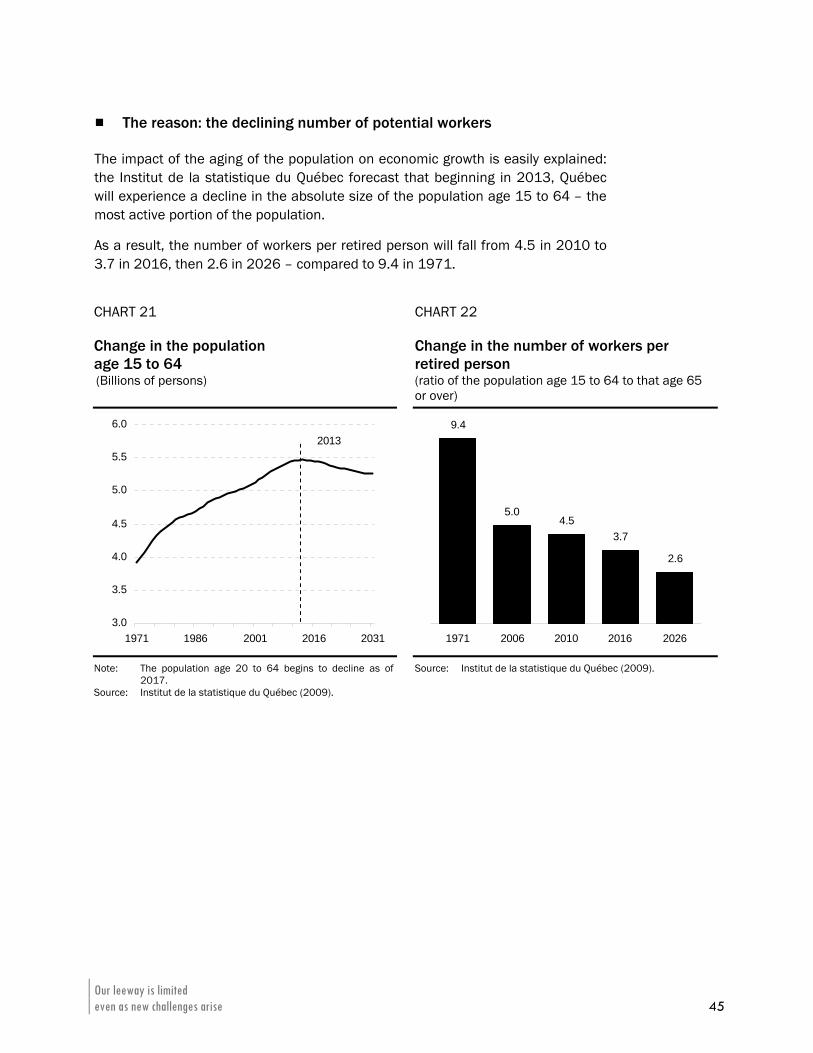
The reason: the declining number of potential workers
The impact of the aging of the population on economic growth is easily explained: the Institut de la statistique du Québec forecast that beginning in 2013, Québec will experience a decline in the absolute size of the population age 15 to 64 – the most active portion of the population.
As a result, the number of workers per retired person will fall from 4.5 in 2010 to 3.7 in 2016, then 2.6 in 2026 – compared to 9.4 in 1971.
CHART 21 Change in the population age 15 to 64
CHART 22 Change in the number of workers per retired person
(Billions of persons) (ratio of the population age 15 to 64 to that age 65 or over)
3.0
3.5
4.0
4.5
5.0
5.5
6.0
1971 1986 2001 2016 2031
2013
9.4
5.04.5
3.7
2.6
1971 2006 2010 2016 2026
Note: The population age 20 to 64 begins to decline as of 2017.
Source: Institut de la statistique du Québec (2009).
Source: Institut de la statistique du Québec (2009).
Our leeway is limited even as new challenges arise 45

By way of comparison, Ontario and the United States will experience an increase in the number of potential workers, because their demography is more robust than ours.
CHART 23 Change in the population age 15 to 64 between 2010 and 2030 (percent)
-3.3
9.6 9.8
Québec Ontario United States
Note: For the United States, population age 16 to 64. Sources: U.S. Census Bureau, Ontario Ministry of Finance, Institut de la statistique du Québec.
The only possible response
To meet this demographic challenge, Québec will have no choice but to rely on the other two factors of growth:
⎯ by increasing labour market participation – which means that labour market participation will have to grow among the 15-64 and 65 or over age groups;
⎯ by improving productivity, i.e. output per hour of work.
Extensive public services, 46 constrained leeway, and emerging challenges

Financing of infrastructures
The third challenge we face stems from the financing of infrastructures: in recent years, Québec has begun the process of catching up, made necessary because of repeated delays in repairing and modernizing infrastructures.
Catching up very quickly
Québec will catch up very quickly: between 2005-2006 and 2009-2010, investments in infrastructures have more than doubled, from $4 billion to nearly $9 billion.
CHART 24 Amount of investments in infrastructures including the road network (Billions of dollars)
0.5 0.7 0.7 0.7 0.9 1.4 0.9 0.9 1.2 1.4 1.72.7
1.7 1.51.8
2.1 2.4 2.62.7 2.8
3.3
4.0
3.3
5.6
1.51.6
1997-98 1999-00 2001-02 2003-04 2005-06 2007-08 2009-10
Health, education, municipalinfrastructures and other
Investments in the road netw ork
1
2.1 2.4 2.2 2.22.7
3.5 3.3 3.53.9 4.2
5.0
6.7
8.9
1 Culture, social housing, research and justice. Source: Ministère des Finances du Québec.
Our leeway is limited even as new challenges arise 47

Future growth of financing costs
This catch-up process has mitigated the effects of the economic recession and financial crisis of 2008: Québec fared better than most of its partners, largely because of the substantial public investments already incurred to improve infrastructures.
However, this catching-up has resulted in additional growth in the debt and therefore the cost of financing it. Since the beginning of this decade, such spending has grown consistently, almost doubling between 1999-2000 and 2009-2010.
CHART 25 Change in spending relating to public infrastructure investments (capital repayment and interest) (Billions of dollars)
1 Culture, social housing, research and justice. Source: Ministère des Finances du Québec.
0.2 0.2 0.3 0.3 0.4 0.3 0.4 0.5 0.6 0.7 0.8 1.1
1.81.9
2.22.5
2.6 2.62.8
2.93.1
3.0
1.1
3.4
2.32.0
1997-98 1999-00 2001-02 2003-04 2005-06 2007-08 2009-10
Health, education, municipalinfrastructures and other
Investments in the road netw ork
2.22.0
2.22.5 2.7 2.8
3.0 3.13.4
3.63.9
4.14.5
1
Extensive public services, 48 constrained leeway, and emerging challenges

CONCLUSION
The observations made by the advisory committee on the economy and public finances and presented in this initial document, can be summed up in a few figures:
⎯ Québec funds 26% more public services than Ontario.
⎯ Québec’s GDP is 14% less than Ontario’s.
⎯ We have chosen to collect more taxes and go deeper into debt than elsewhere, mostly to fund current spending (“the groceries”).
⎯ Québec’s debt now stands at $150 billion, of which two thirds consists of “bad debt”, corresponding to accumulated deficits.
⎯ We allocate almost 60% of the money collected on account of the QST to debt service.
⎯ We are increasingly vulnerable to interest rate fluctuations.
⎯ We are exposed more than ever to fluctuations in federal transfers.
⎯ Despite this heavy debt load, we have not invested sufficiently in infrastructures, which is now forcing us to catch up quickly.
We are reaching the limits
The situation we find ourselves in stems from a very simple reason: for many decades, successive governments have focused their efforts on meeting the population’s growing demand for public services.
The problem is that we are now reaching the limits of the choices demanded by the population.
Over time, our leeway has become increasingly narrow even as new challenges have emerged, namely rising health costs, the impact of demographic changes on wealth creation and catching up with regard to infrastructures.
Conclusion 49

Extensive public services, 50 constrained leeway, and emerging challenges
Making choices and acting on them
Our financial position is worrisome. The challenges Québec must face are real, immediate and major. It is necessary to make choices and act on them.
We must not allow ourselves to be placed in a situation where constraints force us to take a certain direction, where the necessary choices are made by others rather than us.
That is the essence of the approach the committee is proposing.
The choices the committee refers to should target:
⎯ a level of public spending compatible with our ability to pay;
⎯ an efficient tax system that does not jeopardize our economic development;
⎯ debt that is under control, whose size does not mortgage our children’s choices.
In other words, these choices should, in the long run, lead to balanced public finances for Québec, allowing future generations to make their own choices, which is the very definition of sustainable development.

THE COMMITTEE’S FUTURE WORK In accordance with its plan, the Advisory Committee on the Economy and Public Finances will continue its work of study and analysis to answer two series of questions:
⎯ Can we spend more effectively? Can we better fund our public services? (Document 2)
⎯ In the short term, and in addition to returning to balanced budgets, what must we do to secure economic recovery more quickly? In the medium and long term, how can we stimulate wealth creation? What initiatives must be taken to that end to increase output per hour of work (productivity) and labour force participation? When our work is done, what options can we develop concerning revenue, spending and the debt? (Document 3)
The committee’s future work 51


APPENDIX 1 – MEMBERS OF THE ADVISORY COMMITTEE ON THE ECONOMY AND PUBLIC FINANCES
Robert Gagné (co-chairman)
With a doctorate in economics from the Université de Montréal, Robert Gagné is a professor at HEC Montréal and the director of the Centre sur la productivité et la prospérité.
Robert Gagné specializes in applied econometrics, industrial organization and public policy. In recent years, Robert Gagné chaired the Task Force on Tax Assistance for the Resource Regions and the New Economy and co-chaired the Advisory Committee on the Fiscal Imbalance of the Council of the Federation.
In 2002, Mr. Gagné was appointed a regular member of the Centre interuniversitaire sur le risque, les politiques économiques et l’emploi (CIRPÉE). Since 1999 Robert Gagné has been a Fellow of the Centre interuniversitaire de recherche en analyse des organisations (CIRANO). He has focused on researching issues relating to business productivity, resource optimization and issues relating to the transportation sector.
Pierre Fortin (member)
Pierre Fortin holds a doctorate in economics from the University of California, Berkeley, and a master’s in mathematics from the Université de Montréal.
He is professor emeritus in the economics department of the Université du Québec à Montréal (UQÀM). His research focuses chiefly on economic growth, monetary and budgetary policy, social policy and the economy of Canada and Québec.
He is a member of the Royal Society of Canada and of the science council of the Canadian Institute for Advanced Research. He has been President of the Canadian Economics Association, a member of the panel of economic advisors of the Minister of Finance of Canada and senior economic advisor to the Premier of Québec.
Appendix 1 – members of the advisory committee on the economy and public finances 53

Extensive public services, 54 constrained leeway, and emerging challenges
Luc Godbout (member)
Luc Godbout holds a doctorate from the Université Paul-Cézanne-Aix-Marseille III. He is an associate professor at the Université de Sherbrooke.
He specializes in taxation and public finance. In recent years, he has, in particular, been a member of the Task Force on Tax Assistance for the Resource Regions and the New Economy, in addition to contributing to the Commission on the Fiscal Imbalance.
Luc Godbout is also a researcher with the Research Chair in Taxation and Public Finance of the Université de Sherbrooke. His research has focused in particular on the consequences of the aging of the population on Québec’s public finances. Since 2006, Luc Godbout has co-directed four books published by the Presses de l’Université Laval. He is the author of a monthly column, “les public finances sous la loupe” published by La Tribune.
Claude Montmarquette (member)
Claude Montmarquette holds a doctorate in economics from the University of Chicago. He currently holds the Bell - Caisse de dépôt et placement du Québec chair in experimental economics at the Université de Montréal, as professor emeritus.
Claude Montmarquette is the President and CEO of the Centre interuniversitaire de recherche en analyse des organisations (CIRANO), where he heads the public policy research group. Claude Montmarquette has been a guest professor at many foreign universities and is a regular participant at a large number of conferences and seminars around the world.

APPENDIX 2 – ADDITIONAL INFORMATION
The universe of the financial management system and the adjustments of the ministère des Finances du Québec
The major differences between the financial management system of Statistics Canada and the accounting plan of budgetary data deserve mention:
⎯ capital investments are considered current spending;
⎯ the convention of gross data is used (expenses are not deducted from receipts);
⎯ refundable tax credits on personal income, as well as tax credits on corporate profits are included in the various expenditure categories;
⎯ colleges and universities; municipalities, school boards; public organizations with regulatory powers (like the CSST), special funds (excluding the QPP) and health and social services establishments are included in the financial management system.
While the consolidated data of the financial management system represent a substantial standardization effort of the public sector, the ministère des Finances du Québec believes it is necessary to remove four items from them to make them even more comparable from one province to another:
⎯ the revenue and expenditure of unfunded pension plans;
⎯ the revenue and expenditure of the SAAQ that have no counterpart in the other provinces (SAAQ trustee);
⎯ the amount of federal transfers for recipient provinces covered by an agreement: agreements on labour market development; Canada-Québec agreements on immigration; agreement on the administration of the goods and services tax; agreement on the federal youth allowance program;
⎯ sales of goods and services by the public administration to the public.
Table 3 presents a reconciliation between budgetary data and data of the Statistics Canada financial management system.
Appendix 2 – Additional information 55

Why include municipalities?
From one province to another, there are significant differences in the sharing of the delivery of services between provincial and municipal administrations.
For example, in 2008, the health and social services spending covered by municipal administrations amounted to $7.9 billion in Ontario, compared with only $132 million in Québec.
Adjustment factors for differences in the cost of living
For health, the indicator reflects the average weekly remuneration of employees in physicians’ offices, the average hourly wage of full-time employees in the health sector and relative retail price indices excluding housing in large Canadian cities.
For primary and secondary education, the indicator reflects the average weekly remuneration of employees of primary and secondary schools and relative retail price indices excluding housing in large Canadian cities.
For housing, the indicator is directly tied to Statistics Canada’s relative indices of retail prices of housing services among large Canadian cities.
For other sectors, the indicator reflects the average hourly remuneration of fixed-salary employees in the economy as a whole and relative retail price indices excluding housing in large Canadian cities.
Table 4 shows the difference in spending between Québec and Ontario normalized to Québec’s population with and without adjustment for differences in production costs (prices and wages) of public services.
Extensive public services, 56 constrained leeway, and emerging challenges

TABLE 3 Reconciliation between budgetary data and data of the Statistics Canada financial management system (Millions of dollars)
Québec 2008-2009 Spending
Consolidated totals according to budget papers1 69 502
Addition to the FMS universe1 4 611
Conversion from the net base to the gross base 5 695
– Refundable tax credits 5 070
– Youth allowance 625
Other adjustment 3 900
– Capital investments recorded as current expenditures 3 842
– Depreciation − 1 437
– Other 1 495
Total on FMS base – general provincial administration 83 708
Additional public administration components 7 316
– Health and social services institutions 19 704
– Universities and colleges 8 489
– Unfunded pension plans 6 402
– Transactions between components of the provincial public adm. − 27 279
Total on FMS base - provincial public administrations 91 024
Addition of municipal administrations 16 467
– Municipalities and school boards 27 120
– Transactions between provincial and municipal public adm. − 10 653
Total FMS – consolidated provincial and municipal public adm. 107 491
Adjustments by the MFQ − 11 284
– Unfunded pension plans − 4 343
– Société de l'assurance automobile − 1 113
– Federal-provincial agreements − 1 642
– Sales of goods and services to the public − 4 186
Modified FMS data – total spending 96 207
– Debt service − 10 125
Modified FMS data – program spending 86 082
1 Includes notably le Fonds de santé et de sécurité au travail (CSST); le Fonds de l’assurance automobile (SAAQ) and consolidated organizations (net additions and deductions).
Sources: Statistics Canada financial management system and ministère des Finances du Québec, Budget Plan, 2009-2010 Budget, table J-10.
Appendix 2 – Additional information 57
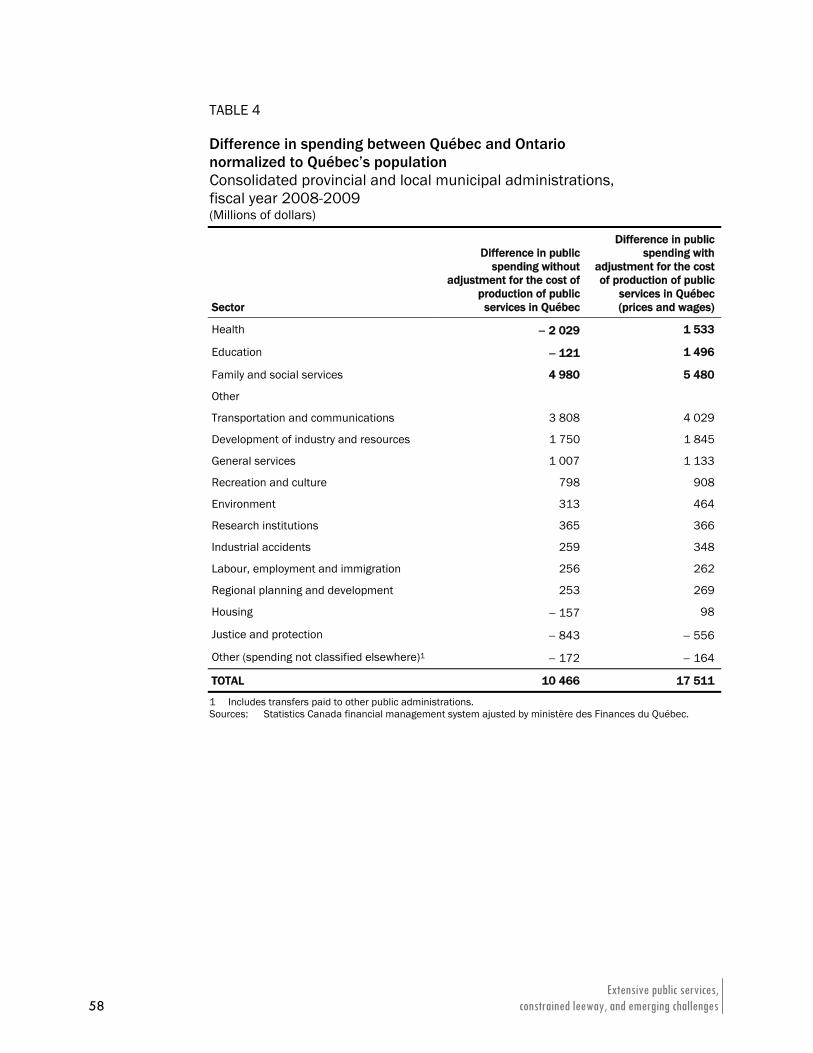
Extensive public services, 58 constrained leeway, and emerging challenges
TABLE 4 Difference in spending between Québec and Ontario normalized to Québec’s population Consolidated provincial and local municipal administrations, fiscal year 2008-2009 (Millions of dollars)
Sector
Difference in public spending without
adjustment for the cost of production of public
services in Québec
Difference in public spending with
adjustment for the cost of production of public
services in Québec (prices and wages)
Health − 2 029 1 533
Education − 121 1 496
Family and social services 4 980 5 480
Other
Transportation and communications 3 808 4 029
Development of industry and resources 1 750 1 845
General services 1 007 1 133
Recreation and culture 798 908
Environment 313 464
Research institutions 365 366
Industrial accidents 259 348
Labour, employment and immigration 256 262
Regional planning and development 253 269
Housing − 157 98
Justice and protection − 843 − 556
Other (spending not classified elsewhere)1 − 172 − 164
TOTAL 10 466 17 511
1 Includes transfers paid to other public administrations. Sources: Statistics Canada financial management system ajusted by ministère des Finances du Québec.
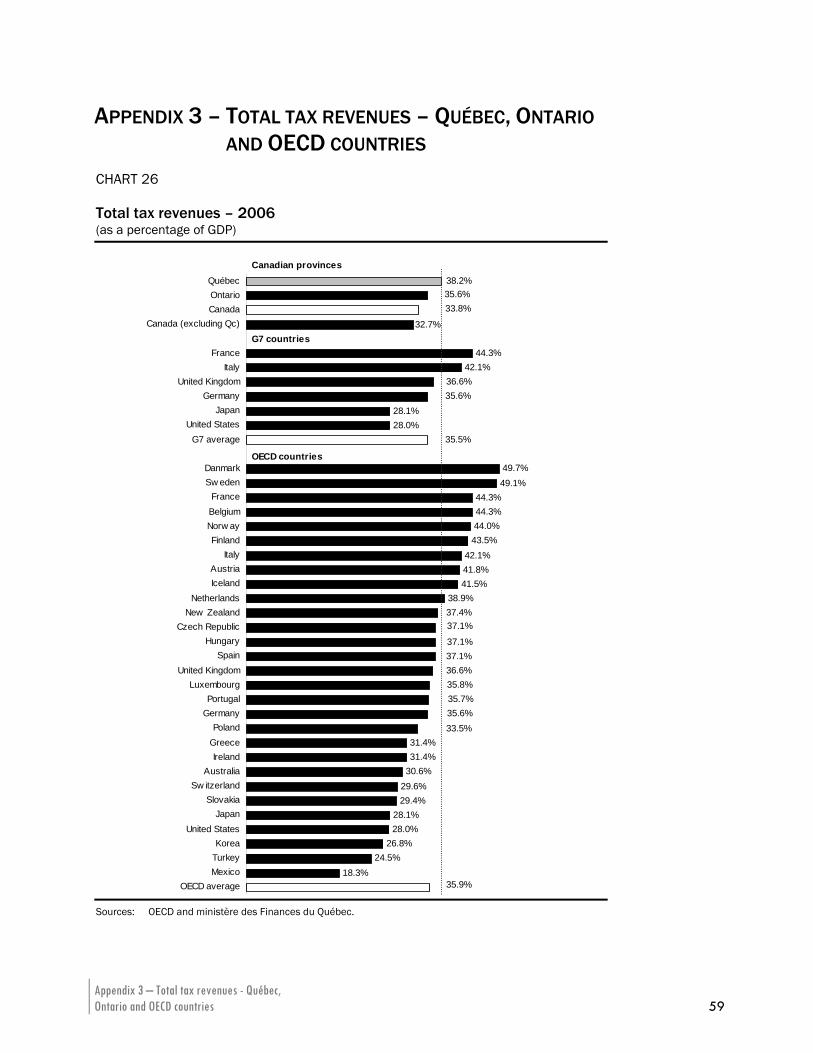
APPENDIX 3 – TOTAL TAX REVENUES – QUÉBEC, ONTARIO AND OECD COUNTRIES
CHART 26 Total tax revenues – 2006 (as a percentage of GDP)
18.3%
26.8%28.0%
29.6%
38.9%41.5%41.8%
43.5%
44.3%44.3%
28.0%28.1%
42.1%44.3%
37.1%37.1%
37.1%
33.5%35.6%
44.0%
49.1%49.7%
35.7%35.8%36.6%
32.7%
33.8%35.6%38.2%
42.1%
35.9%
31.4%30.6%
28.1%
24.5%
29.4%
31.4%
36.6%35.6%
35.5%
37.4%
OECD averageMexicoTurkeyKorea
United StatesJapan
SlovakiaSw itzerland
AustraliaIreland
GreecePoland
GermanyPortugal
LuxembourgUnited Kingdom
SpainHungary
Czech RepublicNew Zealand
NetherlandsIcelandAustria
ItalyFinland
Norw ayBelgiumFrance
Sw edenDanmark
G7 averageUnited States
JapanGermany
United KingdomItaly
France
Canada (excluding Qc)CanadaOntarioQuébec
Canadian provinces
G7 countries
OECD countries
Sources: OECD and ministère des Finances du Québec.
Appendix 3 – Total tax revenues - Québec, Ontario and OECD countries 59


EXTENSIVE PUBLIC SERVICESCONSTRAINED LEEWAYAND EMERGING CHALLENGES
Advisory Committee on the Economyand Public Finances
québec And Its ChAllEngEs
1
do
Cu
mE
nt