anatomy of the agn in ngc 5548
TRANSCRIPT

Astronomy & Astrophysics manuscript no. mcappi˙ms c© ESO 2016April 8, 2016
Anatomy of the AGN in NGC 5548VIII. XMM-Newton’s EPIC detailed view of an unexpected variable multilayer
absorberM. Cappi1, B. De Marco2, G. Ponti2,1, F. Ursini3,4, P.-O. Petrucci4,5, S. Bianchi3, J.S. Kaastra6,7,8, G.A. Kriss9,10, M.
Mehdipour6,11, M. Whewell11, N. Arav12, E. Behar13, R. Boissay14, G. Branduardi-Raymont11, E. Costantini8, J.Ebrero15, L. Di Gesu8, F.A. Harrison16, S. Kaspi13, G. Matt3, S. Paltani14, B.M. Peterson17,18, K.C. Steenbrugge19, and
D.J. Walton16,20
1 INAF-IASF Bologna, Via Gobetti 101, I-40129 Bologna, Italy2 Max-Planck-Institut fur extraterrestrische Physik, Giessenbachstrasse, D-85748 Garching, Germany3 Dipartimento di Matematica e Fisica, Universita degli Studi Roma Tre, via della Vasca Navale 84, 00146 Roma, Italy4 Univ. Grenoble Alpes, IPAG, F-38000 Grenoble, France5 CNRS, IPAG, F-38000 Grenoble, France6 SRON Netherlands Institute for Space Research, Sorbonnelaan 2, 3584 CA Utrecht, the Netherlands7 Department of Physics and Astronomy, Universiteit Utrecht, P.O. Box 80000, 3508 TA Utrecht, the Netherlands8 Leiden Observatory, Leiden University, PO Box 9513, 2300 RA Leiden, the Netherlands9 Space Telescope Science Institute, 3700 San Martin Drive, Baltimore, MD 21218, USA
10 Department of Physics and Astronomy, The Johns Hopkins University, Baltimore, MD 21218, USA11 Mullard Space Science Laboratory, University College London, Holmbury St. Mary, Dorking, Surrey, RH5 6NT, UK12 Department of Physics, Virginia Tech, Blacksburg, VA 24061, USA13 Department of Physics, Technion-Israel Institute of Technology, 32000 Haifa, Israel14 Department of Astronomy, University of Geneva, 16 Ch. d’Ecogia, 1290 Versoix, Switzerland15 European Space Astronomy Centre, P.O. Box 78, E-28691 Villanueva de la Canada, Madrid, Spain16 Cahill Center for Astronomy and Astrophysics, California Institute of Technology, Pasadena, CA 91125, USA17 Department of Astronomy, The Ohio State University, 140 W 18th Avenue, Columbus, OH 43210, USA18 Center for Cosmology & AstroParticle Physics, The Ohio State University, 191 West Woodruff Ave., Columbus, OH 43210, USA19 Instituto de Astronomıa, Universidad Catolica del Norte, Avenida Angamos 0610, Casilla 1280, Antofagasta, Chile20 Jet Propulsion Laboratory, California Institute of Technology, 4800 Oak Grove Drive, Pasadena, CA 91109, USA
Preprint online version: April 8, 2016
ABSTRACT
In 2013 we conducted a large multi-wavelength campaign on the archetypical Seyfert 1 galaxy NGC 5548. Unexpectedly, this usuallyunobscured source appeared strongly absorbed in the soft X-rays during the entire campaign, and signatures of new and strongoutflows were present in the almost simultaneous UV HST/COS data. Here we carry out a comprehensive spectral analysis of allavailable XMM-Newton observations of NGC 5548 (precisely 14 observations from our campaign plus 3 from the archive, for atotal of ∼763 ks) in combination with three simultaneous NuSTAR observations. We obtain a best-fit underlying continuum modelcomposed by i) a weakly varying flat (Γ∼1.5-1.7) power-law component; ii) a constant, cold reflection (FeK + continuum) component;iii) a soft excess, possibly due to thermal Comptonization; and iv) a constant, ionized scattered emission-line dominated component.Our main findings are that, during the 2013 campaign, the first three of these components appear to be partially covered by a heavyand variable obscurer located along the line of sight (LOS) that is consistent with a multilayer of cold and mildly ionized gas. Wecharacterize in detail the short timescale (mostly ∼ks-to-days) spectral variability of this new obscurer, and find it is mostly due to acombination of column density and covering factor variations, on top of intrinsic power-law (flux and slope) variations. In addition,our best-fit spectrum is left with several (but marginal) absorption features at rest-frame energies ∼6.7-6.9 keV and ∼8 keV, as well asa weak broad emission line feature redwards of the 6.4 keV emission line. These could indicate a more complex underlying model, e.g.a P-Cygni-type emission profile if allowing for a large velocity and wide-angle outflow. These findings are consistent with a picturewhere the obscurer represents the manifestation along the LOS of a multilayer of gas, also in multiphase, that is likely outflowing athigh speed, and simultaneously producing heavy obscuration and scattering in the X-rays, and broad absorption features in the UV.
Key words. Galaxies: active – X-rays: galaxies – Galaxies: individual: NGC 5548
1. Introduction
Unified models of active galactic nuclei (AGN) have “histori-cally” been proposed as a static unifying view based on a puta-
Send offprint requests to: M. Cappie-mail: [email protected]
tive dusty molecular torus where type 1 AGN are seen face-on,thereby typically unabsorbed and bright, while type 2 sourcesare seen edge-on, thus typically obscured and faint (Antonucci &Miller 1985). However in recent years, an ever increasing num-ber of type 1 Seyfert galaxies/AGN (up to 20-30% of limitedsamples) have shown a significant amount of absorption clearly
1
arX
iv:1
604.
0177
7v1
[as
tro-
ph.H
E]
6 A
pr 2
016

M. Cappi et al.: X. An unexpected, heavy, multilayer and variable absorber in NGC 5548
at odds with the source’s optical classifications (Bassani et al.1999; Cappi et al. 2006; Panessa et al. 2009; Merloni et al. 2014).Such complex, often variable, absorbing structures seem to callfor a revision of the static version of Unified models into a morecomplex, maybe dynamical, structure (e.g. Murray et al. 1995;Elvis 2000; Proga 2007).
On the one hand, ionized absorbers (so-called warm ab-sorbers, WA) are nowadays routinely observed as blue-shiftednarrow and broadened absorption lines in the UV and X-rayspectra of a substantial (certainly greater than 30%) fraction ofAGN and quasars (e.g. Blustin et al. 2005; Piconcelli et al. 2005;McKernan et al. 2007; Ganguly & Brotherton 2008). These ab-sorption systems span a wide range of velocities and physicalconditions (distance, density, ionization state), and may havetheir origin in an AGN-driven wind, sweeping up the interstellarmedium, or thermally driven from the molecular torus (Blustinet al 2005) and outflowing at hundreds to few thousands km/s(see Crenshaw, Kraemer & George 2003 and Costantini 2010for reviews on the subject). Even more powerful outflows (theso-called ultra fast outflows, UFOs), so highly ionized that theironly bound transitions left are for Hydrogen- and Helium-likeiron detectable only at X-ray energies, seem to be present in30-40% of local radio-quiet and radio-loud AGN, with outflowspeeds of up to ∼0.3c (Pounds et al. 2003a; Tombesi et al. 2010,2013, 2014; Gofford et al. 2013). Both WAs and UFOs phe-nomena have been seen to vary on both short (hours-days) andlong (months-years) time-scales (Cappi 2006) for various plau-sible reasons such as variations in either the photoionization bal-ance, or the absorption column density and/or covering fraction(Risaliti et al. 2005; Reeves et al. 2014).
On the other hand, there is also mounting evidence for thepresence of large columns of additional neutral or mildly ion-ized gas along the LOS to not only type 2 Seyfert galaxies(e.g. Turner et al. 1997, 1998) but also type 1 and intermedi-ate Seyferts (e.g., Malizia et al. 1997, Pounds et al. 2004; Milleret al. 2007; Bianchi et al. 2009; Turner et al. 2009; Risaliti et al.2010; Lobban et al. 2011; Marchese et al. 2012; Longinotti et al.2009, 2013; Reeves et al., 2013; Walton et al. 2014; Miniutti etal. 2014; Rivers et al. 2015). In some cases, the columns are solarge that astronomers have called these sources “changing look”(i.e. sources changing from being absorbed by a Compton thinto a Compton thick column density). From the pioneering worksof Risaliti et al. (Risaliti, Elvis & Nicastro, 2002; Risaliti et al.2005) on a few interesting sources such as the Seyfert 1 NGC1365, to detailed studies on an increasing number of sources andon systematic studies of larger samples (Markowitz, Krumpe& Nikutta 2014; Torricelli-Ciamponi et al. 2014; Tatum et al.2013), evidence has accumulated for the importance of large,complex, and variable neutral absorption also in type 1 Seyfertgalaxies. Current interpretations for this cold circumnuclear gasare clumpy molecular tori (Krolik & Begelman 1988, Markowitzet al. 2014; Honig 2013), absorption from inner and/or outerBLR clouds (Risaliti et al. 2009), or accretion disc outflows(Elitzur & Shlosman ’06; Proga 2007; Sim et al. 2008).
NGC 5548 (z=0.017) is one of the X-ray brightest (2–10 keVflux of ∼2–5×10⁻¹¹ erg cm−2 s−1), and most luminous (L2−10keV∼ 1 − 3 × 1044 erg/s) Seyfert 1 galaxies known. As such, itis one of the best-studied example of a Seyfert 1 galaxy andhas been observed by all major satellites since it entered theAriel V high galactic latitude source catalog(Cooke et al. 1978).NGC 5548 exhibits all the typical components seen in type 1Seyfert galaxies, that is: a steep (Γ ∼1.8-1.9) power-law spec-trum plus a reflection component with associated FeK line, asoft-excess emerging below a few keV, evidence for warm ion-
ized gas along the LOS, and typical soft X-ray variability asshown in the CAIXAvar sample by Ponti et al. (2012a). Recently,detailed studies of either the time-average or variability proper-ties of the WA, the reflection component, and the soft-excesscomponent have been made using either low- (CCD-type) orhigher-(grating-type) energy resolution instrumentation avail-able from Chandra, XMM-Newton and Suzaku (Pounds et al.2003; Steenbrugge et al., 2003, 2005; Crenshaw et al., 2003;Andrade-Velazquez et al. 2010; Krongold et al. 2010; Liu et al.2010; Brenneman et al. 2012; McHardy et al. 2014).
In 2013, our team conducted a long multi-satellite observingcampaign on NGC 5548. The campaign is introduced in detailin Mehdipour et al. (2015) (hereafter Paper I). The main resultsfrom the campaign, the simultaneous appearance of an excep-tional obscuring event in the X-rays and a broad absorption line(BAL) structure in the UV, are presented in Kaastra et al. (2014)(hereafter Paper 0). The shadowing effects of this UV BAL andX-ray obscurer on the larger-scale “historical” UV narrow ab-sorption lines and WA are presented in Arav et al. 2014 (here-after Paper II). The high energy properties of the source dur-ing, and before, the campaign are shown in Ursini et al. (2015)(hereafter Paper III), while the study of a short-timescale flaringevent that happened in September 2013 and which triggered aChandra LETG observation is addressed in Di Gesu et al. (2015)(hereafter Paper IV), together with the analysis of the WA short-term variability during this event. The time-averaged soft X-rayline-dominated RGS spectrum is presented and modelled in de-tail in Whewell et al. (2015) (hereafter Paper V). For the longer-term timescales, the historical source behavior is presented inEbrero et al. (2016) (hereafter Paper VI), while the full Swiftmulti-year monitoring is presented in Mehdipour et al (2016)(hereafter Paper VII).
Here, we focus on the detailed model characterization ofthe obscurer, and of its spectral variability, by making use ofall available EPIC (pn+MOS) spectra (during and before thecampaign) and simultaneous NuSTAR observations (Sect. 2). Wealso incorporate in our modeling the results from the papersmentioned above obtained during the campaign and which werebased on other instruments and satellites, such as RGS spectra,HST/COS spectra, and Swift long-term light-curves. This allowsus to draw a comprehensive and self-consistent understanding ofthe obscurer properties (Sect. 4). We then attempt to place con-straints on the location and physical origin of the various com-ponents required by our model (Sect. 5). Values of H0=70 kms−1 Mpc−1, and ΩΛ=0.73 are assumed throughout, and errors arequoted at the 90% confidence (∆χ2 = 2.71) for 1 parameter ofinterest, unless otherwise stated.
2. Observations and Data Reduction
NGC 5548 was observed by the XMM-Newton EPIC instru-ments on 17 separate occasions, for a total cleaned exposuretime of ∼763 ks (see Table 1). The first three (archival) observa-tions were performed once in December 2000 and twice in July2001. The remaining 14 observations were all part of the 2013multi wavelength campaign (Paper 0 and Paper I). 12 observa-tions were performed during the summer 2013, one five monthslater, in December 2013, and the last one in February 2014. Thespacing was intended so in order to sample different timescalesin a rough logarithmic spacing, i.e. multiple on short (days)timescales, and more sparse on longer (months) timescales. Afull description of the numerous observations performed duringthe campaign, from space and ground observatories, is given inPaper I.
2

M. Cappi et al.: X. An unexpected, heavy, multilayer and variable absorber in NGC 5548
Table 1. Summary of NGC 5548 XMM-Newton (pn) and NuSTAR observations
Obs. Obs. ID Start–End Datea Exposureb Fc(0.5−2) Fd
(2−10) Fe(10−30)
Archival Data (2000-2001)A1 0109960101 2000 Dec 24–25 16.1 17.2 32.8 -A2 0089960301 2001 Jul 09–10 56.7 20.9 40.3 -A3 0089960401 2001 Jul 12–12 18.9 28.7 50.8 -Multiwavelength Campaign (2013)M1 0720110301 2013 Jun 22–22 35.4 1.14 15.3 -M2 0720110401 2013 Jun 30–30 38.1 3.59 33.0 -M3 0720110501 2013 Jul 07–08 38.9 2.16 23.9 -M4N 0720110601 2013 Jul 11–12 37.4 3.66 35.8 -. . . . . 60002044002/3∗ 2013 Jul 11–12 51.4 3.66 35.8 51.0
M5 0720110701 2013 Jul 15–16 37.5 2.62 29.9 -M6 0720110801 2013 Jul 19–20 37.1 2.38 30.5 -M7 0720110901 2013 Jul 21–22 38.9 2.28 26.3 -M8N 0720111001 2013 Jul 23–24 37.5 2.21 27.9 -. . . . . 60002044005∗ 2013 Jul 23–24 49.5 2.21 27.9 45.0
M9 0720111101 2013 Jul 25–26 32.1 3.14 33.2 -M10 0720111201 2013 Jul 27–28 38.9 3.01 32.4 -M11 0720111301 2013 Jul 29–30 35.3 2.76 29.6 -M12 0720111401 2013 Jul 31–Aug 01 36.1 2.28 26.2 42.8M13N 0720111501 2013 Dec 20–21 38.2 2.08 24.9 -. . . . . 60002044008∗ 2013 Dec 20–21 50.1 2.08 24.9 -
M14 0720111601 2014 Feb 04–05 38.8 3.96 27.2 -a Observation Start–End Datesb Net exposure time, after corrections for screening and deadtime, in ks.c Observed flux in the 0.5-2 keV band, in units of 10−12 erg cm−2 s−1
d Observed flux in the 2-10 keV band, in units of 10−12 erg cm−2 s−1
e Observed flux in the 10-30 keV band, in units of 10−12 erg cm−2 s−1
∗ NuSTAR observations simultaneous to the XMM-Newton observations
The EPIC data were reduced using the standard softwareSAS v. 14 (de la Calle, 2014) and the analysis was carried outusing the HEASoft v. 6.14 package1.
After filtering for times of high background rate, and correc-tion for the live time fraction (up to 0.7 for the pn in small win-dow mode), the useful exposure times were typically between 30and 50 ks per observation (see Table 1). The EPIC pn and MOScameras were operated in the “small window” mode with thethin filter applied for all observations, except for the first threearchival observations (A1-3) for which the MOS 1 camera wasoperated in timing mode, thus the MOS1 was not used for thisanalysis.
Using the epatplot command of the SAS, we checked thepattern distributions of the collected events and found that: i)pile-up was not significant (less than few %) in the pn data atthis level of source flux (and notably during the campaign whenthe source was heavily absorbed), thus we considered both sin-gle and double events as per standard procedure and calibrations;ii) the pattern distribution in the pn deviates significantly below0.4 keV w.r.t. model predictions, thus we did not consider thedata below 0.4 keV in the present analysis. We note that this isslightly different from our previous analysis reported in Papers0, III, and IV, in which we always used data down to 0.3 keV.We estimate that the effect of this slightly different choice oflow-energy cut-off should be nevertheless largely within statisti-cal errors of the present and previous analysis. Given the signifi-cantly lower effective area of the MOS detectors, and for clarityand simplicity, we only report here the results obtained from thepn data and used the MOS data for consistency checks only.
1 http://heasarc.gsfc.nasa.gov/docs/software/lheasoft/
Source counts were extracted from a circular region of 40arcsec radius, while the background counts were extracted froma nearby source-free and gap-free area of the detector of the samesize. The size of the small window being less than 4.5′×4.5′,both source and background were similarly affected by the in-strumental Ni and Cu Kα lines at 7.3-7.6 keV and 7.8-8.2 keV,respectively, thereby their effects are cancelled.
Finally, we anticipate that all the Fe K line measurements(see Sect. 4.1.2 below) obtained with the pn spectra during thecampaign, but not in the earlier archival data, presented a sys-tematic (and more or less constant) blueshift and broadening ofthe energy scale response by ∆E∼+30-40 eV and σ(E) ∼40-50eV, respectively, when compared to the MOS and/or NuSTAR in-dependent results. These shifts, albeit being modest, were nev-ertheless statistically significant and present with either singleand double or single-only events, and despite our use of the lat-est CTI correction files (CCFv45, released in November 2014)and analysis procedure as described in Smith et al. (2014). Toinvestigate this further, we performed a detailed analysis of thespectral energy scale by comparing our results for different in-struments (MOS1, MOS2, pn, and NuSTAR), using different pat-tern selections (from single-only to single+double events), andapplying different CTI response correction files (from CCF v27to v45) which were released in 2013 and 2014. We also com-pared our results with the energy and width obtained for the AlKline (at 1486 eV) and the MnK doublet (at 5895 and 6489 eV) ofthe calibration source during a ∼70 ks CALCLOSED observa-tion performed in 2013, August 31st, i.e. shortly after the cam-paign and thus representative of the absolute energy scale of theinstrument at that time. From this analysis, we attributed bothblueshift and broadening to a remaining (admittedly small) un-
3

M. Cappi et al.: X. An unexpected, heavy, multilayer and variable absorber in NGC 5548
110
S(0.
4−2
keV)
A1 A2 A3 M1 M2 M3 M4N M5 M6 M9 M10M11 M121
25
H(2
−10
keV)
M7 M8N M13N M14
0 2×10⁵ 4×10⁵ 6×10⁵ 8×10⁵
10.
20.
52
H/S
Time (s)
Fig. 1. Background subtracted XMM-Newton pn light curves of NGC 5548 calculated for the soft (S) 0.4-2 keV energy band (top),the hard (H) 2-10 keV energy band (middle) and their hardness ratios H/S (bottom). Vertical dashed lines indicate when observationswere interrupted along the years.
certainty in the long-term degradation of the EPIC pn CTI asmentioned in the calibration technical notes of Guainazzi et al.(2014) and Smith et al. (2014). In the following of the analysis,we thus took into account these systematic shifts and broaden-ings by using the zashift and gsmooth command in XSPECin order to correct for this remaining uncertainty (see also Sect.4.1.2).
We also used data from three (out of 4) NuSTAR observa-tions, those which were simultaneous to the XMM-Newton ob-servations, namely the 4th, 8th and 13th observations of the XMM-Newton campaign (see Table 1). A comprehensive analysis ofthe high-energy continuum, combining all available NuSTAR,INTEGRAL and previous BeppoSAX and Suzaku observationsis presented in Paper III. We followed their same procedurefor the NuSTAR data reduction that is we used the standardpipeline (nupipeline) of the NuSTAR Data Analysis Software(nustardas, v1.3.1; part of the heasoft distribution as of ver-sion 6.14) to reduce the data, and used the calibration files fromthe NuSTAR caldb v20130710. The spectra were then extractedfrom the cleaned event files using the standard tool nuproductsfor each of the two hard X-ray telescopes aboard NuSTAR, whichhave corresponding focal plane modules A and B (FPMA andFPMB). The spectra from FPMA and FPMB were analyzedjointly, but were not combined. Finally, the spectra were groupedsuch that each spectral bin contains at least 50 counts.
3. Timing Analysis
Soft (0.4-2 keV) and hard (2-10 keV) band light curves of NGC5548 are shown in Fig. 1 (top and middle panels, respectively)with a time bin of 2000 s. Hardness ratios (bottom panel) arealso reported to highlight any spectral variations of the source.The light curves include the 3 archival (year 2000-2001) ob-servations, and the 14 observations of the multifrequency cam-paign (year 2013-2014), with each observation separated by ver-tical dotted lines. Within the single observations (including timescales of < few tens of ks) we observe only low/moderate fluxvariations (less than 20-30 percent of the average flux). However,much stronger flux variations (>50 percent) occur between thedifferent observations, on the time scales sampled by the cam-paign and longer (i.e. up to years, if we consider also the threearchival XMM-Newton observations).
As already presented in Papers 0 and I, the hardness ratiosshow a significant spectral hardening which characterizes the2013-2014 campaign, when compared to the 2000-2001 archivaldata. The source does not show any significant spectral variationwithin each (∼ half a day long) observation, besides a hint ofspectral softening during the last observation. The lack of signif-icant short-term spectral variability justifies our spectral analysisapproach below (Sect. 4) of averaging the spectra observation byobservation.
To better characterize the distribution of variability power asa function of energy band we computed the fractional root meansquared (rms) variability amplitude (Fvar; Nandra et al. 1997,
4

M. Cappi et al.: X. An unexpected, heavy, multilayer and variable absorber in NGC 5548
1 100.5 2 5
00
.10
.20
.3
Fv
ar
Energy (keV)
2 ks < Short T < 25 ks
45 ks < Long T < 20 Ms
Fig. 2. Fractional variability (rms) spectra of NGC 5548 calcu-lated over long (45-2000 ks, top curve) timescales, i.e. longerthan observations durations, but shorter than overall campaign,and over short (2-25 ks, bottom curve) timescales, i.e. longerthan minimum time bin but shorter than shortest observation du-ration.
Vaughan et al. 2003, Ponti et al. 2004, Ponti 2007) on both short(hours) and long (days-to-months) timescales. The former is ob-tained by extracting light curves of the single pn observations,with a time bin of 2 ks, and averaging the Fvar computed fromeach of them. The latter is obtained by taking the average countrates of each observation and computing the Fvar over the entirecampaign, thus sampling timescales going from ∼ 45 ks up to 20Ms. The light curves are extracted in different energy channels,the width of the channels ensuring the number of counts20 pertime and energy bin. Results are shown in Fig. 2. The Fvar shows,in a clear and model-independent way, that the peak of variabil-ity power (∼30 percent) lies in the energy band between 1 and5 keV, and most of the variability occurs on the long-timescales.This shape is very similar to what is typically observed also inother Seyfert galaxies (Ponti 2007). Remarkably, a narrow fea-ture is very clearly observed here at the energy of the Fe Kαline, strongly suggesting the presence of a constant (on long-timescales) reflection component.
It is worth noting that, despite being very low (few percents),the Fvar of the short-timescales is significantly different fromzero. We verified that this residual variability is most likely tobe ascribed to red-noise leakage effects (e.g. Uttley et al. 2002),rather than to intrinsic, short-term variability of the source. Inother words, variability over timescales slightly longer than themaximum sampled timescale (limited by the duration of the ob-servation) has introduced slow rising and falling trends acrossthe light curve of the single observations, which have contributedto its short-timescale variance. As a consequence, variabilitypower from long-timescales has been transferred to the short-timescales. Variability studies on even longer timescales thanthose presented here (using Swift light curves) are presented inMcHardy et al (2014) and Paper VII.
4. Spectral Analysis
Within each observation, the source varied only very weakly ei-ther in flux (top and medium panels of Fig. 1) or in spectralshape (bottom panel of Fig. 1), as found also from the very lowFvar value when calculated on short-timescales (Fig. 2). We thusextracted the mean pn spectra for each of the 17 observations,grouping the data to a maximum of 10 channels per energy res-olution element and 30 counts per channel to apply the χ2 mini-mization statistics. In all following fits, the Galactic column den-sity was fixed at the value of NHgal = 1.55 × 1020 cm−2 (Dickey& Lockman 1990), and abundances were taken from Lodders(2003).
Fig. 3 shows the overall XMM-Newton spectra during all ob-servations (1-17) which clearly show the strong absorption thatis affecting all the 0.3-10 keV spectra during the 2013 cam-paign (obs. 4-17, in color) when compared to the 2000-2001archival unabsorbed spectra (obs. 1-3, in black). Fig. 4 furtherillustrates the complex and strongly energy dependent variabil-ity of the source during the campaign: the top two panels showthe large and complex variability in the soft 0.4-2 keV (top leftpanel) and hard 2-7 keV (top right panel). The two bottom panelsshow the reduction in variability going from lower (7-10 keV)to higher (10-30 keV) energies. Because of the heavy and vari-able absorption affecting the source, the spectrum is very com-plex and model parameters (such as the photon index Γ, the ab-sorption column densities and their covering factors) are oftenstrongly degenerate. Moreover, during the unobscured, archivalobservations (A1→3) the source shows a very significant, mod-erately strong, soft-excess (see e.g. Pounds et al. 2003b) whichis however not easy to detect during the monitoring campaign(M1→14) because of the heavy obscuration.
To overcome, or minimize, the above limitations we de-cided to proceed in the following way: First, we used the threeXMM-Newton spectra for which NuSTAR was simultaneouslyavailable, and used data at first only above 4 keV, in order toobtain the best possible constraints on the underlying sourcecontinuum components, in particular the reflection component.Second, we considered also the data below 4 keV, using all in-formations from previous papers of this series and from litera-ture, and combine also the information at soft X-rays obtainedfrom the archival XMM-Newton observations. These two differ-ent steps and studies (Sect. 4.1 and Sect. 4.2) are preliminary andcrucial to then best characterize the obscurer variability using thewhole dataset of XMM-Newton observations.
4.1. Hard (>4 keV) X-ray Band: Underlying Continuum andConstant Reflection Component
4.1.1. The three XMM-Newton+NuSTAR simultaneousobservations
As mentioned above, we first considered only the data in the 4–79 keV interval where the data are less sensitive to the precisemodeling of the obscurer, in an attempt to minimize degenera-cies induced by the absorbers. XMM-Newton and NuSTAR spec-tra were fitted individually for each of the 3 simultaneous obser-vations, with the same model but letting all parameters free tovary, except for the normalizations of the two NuSTAR modules(FPMA/B) which were kept tied together. For plotting purposesonly, and to better identify any systematic deviation from the fits,the spectra were then grouped together (using the setplot groupcommand in XSPEC) and color-coded with pn spectra in blackand NuSTAR spectra in red. Cross-normalization values among
5

M. Cappi et al.: X. An unexpected, heavy, multilayer and variable absorber in NGC 5548
1 100.5 2 5
0.01
0.11
10
coun
ts sï1
keVï
1
Energy (keV)
Archival Observa.ons 1) 24/12/2000 2) 09/07/2001 3) 12/07/2001
New Monitoring Campaign 4) 22/06/2013 11) 23/07/2013 5) 30/06/2013 12) 25/07/2013 6) 07/07/2013 13) 27/07/2013 7) 11/07/2013 14) 29/07/2013 8) 15/07/2013 15) 31/07/2013 9) 19/07/2013 16) 20/12/2013 10) 21/07/2013 17) 04/02/2014
Fig. 3. The 0.4-10 keV spectra of NGC5548 obtained with the EPIC pn during the three archival observations (black) and duringthe 14 observations of the 2013 summer campaign (color). Observations are summarized in Table 1.
0.5 1 1.5 2
0.5
11
.52
cou
nts
s−1
keV
−1
Energy (keV)2 3 4 5 6 7
0.2
0.4
0.6
0.8
1
cou
nts
s−1
keV
−1
Energy (keV)
7 8 9 10
0.0
50
.10
.15
cou
nts
s−1
keV
−1
Energy (keV)10 15 20 25 30
00
.01
0.0
20
.03
0.0
4
cou
nts
s−1
keV
−1
Energy (keV)
Fig. 4. X-ray spectra obtained during the campaign (M1→M14, including the simultaneous M4N, M8N and M13N NuSTAR obser-vations plotted above 10 keV) plotted on linear scales, and with the same factor of ∼10 extension range (from bottom to top) in they-axis scale intensities. These are shown to illustrate the important and complex variability as a function of energy up to 2 keV, andits gradual reduction above 2 keV, and up to 30 keV.6

M. Cappi et al.: X. An unexpected, heavy, multilayer and variable absorber in NGC 5548
different instruments (FPMA vs FPMB vs pn) were always leftfree to vary but these were never larger than a few percent, typi-cally 2-3 %, in line with the expectations (Madsen et al. 2015).
Fig. 5 shows the ratios (between ∼4-50 keV) obtained froma fit of the 4-79 keV spectra with a single non-absorbed power-law model (with Γ ∼ 1.3− 1.5). Low energy curvature, a narrowline at ∼ 6.4 keV and a high energy hump between 10-30 keVare readily seen in the data (see Fig. 5, Top). We thus addeda cold absorption column density plus a gaussian emission lineand a continuum reflection model (pexrav in XSPEC). Despitethe possible presence of additional absorption feature(s) between7-8 keV (see Fig 5, bottom panel, and following analysis in Sect.4.5), the use of a more complex absorber, either partially cover-ing or ionized, was not required here when fitting the continuumabove 4 keV, likely because of the strongly curved low energycut-off which requires a substantially cold absorber to be mod-eled, with NH'4–7×1022 cm−2 (Table 2).
Best-fit parameters obtained from XMM-Newton only werein very good agreement (typically within a 1-σ error) with thoseobtained with NuSTAR only, except for a mildly flatter slope (by∆Γ∼0.1) required for XMM-Newton wrt NuSTAR. We choose totie, within each observation, all parameters obtained from bothinstruments, except for letting their cross-normalizations andphoton index free to vary (to take into account the remaining cal-ibration uncertainties), but report here and below values of pho-ton indices and fluxes obtained for the pn only in order to allowbetter comparison with observations without the NuSTAR simul-taneous data. Best-fit values for the 3 observations are reportedin Table 2. These values are consistent with those obtained byPapers III and IV.
Given the neutral energy for the Fe K line, its narrow width,and its constant intensity, the line is consistent with being pro-duced by reflection from a cold and distant reflector (see Sect.5.1 for further discussion). This is consistent with our analysisbelow (Sect. 4.1.2) using the whole set of XMM-Newton obser-vations. This agrees also with our previous (model-independent)findings based on the source fractional variability amplitude(Sect. 3). The line equivalent width (EW∼70-110 eV) withrespect to the underlying continuum reflection (R∼0.56-0.91,see Table 2) is consistent with the line being produced by aplane parallel neutral Compton thick reflector, and solar abun-dance, thus we decide to choose for simplicity the XSPEC modelpexmon (Nandra et al. 2007) which gives a self-consistent de-scription of both the neutral Fe Kα line and the Compton reflec-tion continuum. This model also self-consistently generates theFe Kβ, Ni Kalpha and Fe Kα Compton shoulder expected froma Compton-thick reflecting medium. Following the results pre-sented in Paper III, we assumed, and fixed, the parameters ofthe intrinsic continuum illuminating the reflection slab to typi-cal values of Γ=1.9, Ec=300 keV, inclination=30 deg and solarabundances. With this model, we obtained the best-fit parame-ters listed in Table 2. These values are in agreement with thoseshown in Paper III.
From now on in this analysis these values will be referredto as our baseline underlying continuum model. Moreover, mo-tivated by the fact that the line intensity did not vary signifi-cantly (neither in intensity nor in energy) during the other 14observations available (see Sect. 4.1.2), we decided to freeze thereflection component to the average value obtained from the 3XMM-Newton + NuSTAR simultaneous observations, i.e. a nor-malization at 1 keV of 5.7×10⁻³ photons keV−1 cm−2 s−1, alsoin agreement with Paper III.
105 200.81
1.21.4
1.6
ratio
Energy (keV)
XMM-‐Newton (pn) NuSTAR
Data/M
odel
Energy (keV)
4 6 8 10
0.8
11.
21.
4
Data
/Mod
el
Energy (keV)
10−3
0.01
keV
2 (P
ho
ton
s cm
−2
s−1
keV
−1 )
105 200.8
0.9
1
1.1
1.2
Ra
tio
Energy (keV)
Fig. 5. (Top): Data are plotted as the ratio to a single power-law contin-uum model fitted to the grouped observations M4N, M8N, and M13Nwith XMM-Newton (black) and NuSTAR (red) simultaneous data. As in-dicated by the arrows, going from low to high energies, one can clearlynote the presence of: a sharp low-energy cut-off, a narrow Fe K lineat ∼6.4 keV, some absorption feature(s) between 7-8 keV, and a highenergy hump between 10-30 keV. (Middle): Same as Top panel, butzoomed between 4 and 10 keV. (Bottom): Best-fit spectrum, model andratios plotted between 4-50 keV (see Sect. 4.1.1 for details).
7

M. Cappi et al.: X. An unexpected, heavy, multilayer and variable absorber in NGC 5548
0.01
5×10⁻³
0.02
ke
V2 (
Ph
oto
ns c
m−2 s
−1 k
eV
−1)
4 6 8 10
0.95
1
1.05
Ra
tio
Energy (keV)
Fig. 6. The 4-10 keV band spectrum obtained from the individual fit-ting of all the 17 XMM-Newton spectra, and the data/model ratios,grouped in a single dataset.
4.1.2. The whole 17 XMM-Newton observations
Given the above results, we thus proceeded in our analysis byadding to the previous observations (M4N, M8N, and M13N)the other 14 available XMM-Newton observations, including the3 archival observations and the remaining 11 from the 2013 cam-paign. The spectra were first considered, again, only above 4 keVand focusing on the properties of the Fe K line and reflectioncomponent before and during the campaign.
Following the previous analysis, we first fitted all the 17XMM-Newton spectra with a single, cold, absorber plus anFe Kα line, plus a pexrav continuum reflection model. Thissimple model yielded a good characterization of all XMM-Newton spectra, as demonstrated by the grouped spectrumshown in Fig. 6. The time-series for the Fe K line parame-ters during all 17 observations are shown in Fig. 7. We notethat the line energy during the campaign was slightly higher('6.43±0.01 keV) than during the first 3 archival observations('6.39±0.01 keV), and was also systematically higher than theenergy '6.40±0.01 keV obtained using only the MOS data. Asdiscussed in Sect. 2, we attribute the energy shift, and slightbroadening, of the FeK line to remaining CTI response degra-dation that has not properly been accounted for.
The line is consistent with being constant in intensity dur-ing all the 17 observations (Fig 7, bottom panel), i.e. not onlyduring the campaign, but also after comparison with the (∼13years) earlier archival observations. Overall, in agreement withour earlier findings based on the fractional variability (Sect. 3),this analysis readily demonstrates that the Fe K line emission isneutral, narrow, and most importantly constant in time. We thuschoose again to model both line and continuum using the self-consistent cold reflection model pexmon, and fit all data with thereflection intensity fixed at its average value (5.7×10⁻³ photons
6.35
6.4
6.45
A1 A2 A3 M1 M2 M3 M4N M5 M6 M7N M8 M9 M10 M11 M12 M13N M14
Res
t Ene
rgy
(keV
)
0
0.02
0.04
0.06
0.08
Line
Wid
th σ
(keV
)
5 10 15
2×10⁻⁵
3×10⁻⁵
4×10⁻⁵
Observation Number
Line
Inte
nsity
Fig. 7. Time series of the FeK line best-fit parameters: Rest-frame en-ergy (top, black) in keV, line width (middle, red) in keV, and line inten-sity (bottom, green) in photons cm−2 s−1 in the line. Best-fit values and1-sigma (68%) errors for a fit with a constant value are shown.
keV−1 cm−2 s−1) obtained in Sect. 4.1.1, and freezing then thezashift parameter to its best-fit value. We note that this simpleanalysis readily shows that, during the campaign, the photon in-dex was flatter (Γ∼1.5-1.7) than typically found during either the3 archival observations or historically in this source (Γ∼ 1.7-1.9,e.g. Dadina 2007), and despite allowing in the fit for large ab-sorption column densities with values between log NH ∼ 22-23cm−2.
4.2. Soft (<4 keV) X-ray Band: Warm Absorber, IntrinsicSoft-Excess and Scattered Component
As mentioned above, the soft (E<4 keV) X-ray spectrum ofthis source is known to be rather complex. Historically, it isknown to require at least two components to be properly mod-eled, such as a complex, multi-temperature warm absorber, plusan intrinsic soft X-ray emission component (commonly called“soft-excess”). In this part of the spectrum, we require at leastone additional component, a soft scattered component, in orderto be consistent with earlier and present observations. We brieflyaddress below the evidence and need for each of these three com-ponents, even before considering the complex (and variable) ob-scurer found during the campaign, and which will be discussedonly afterwards.
Warm Absorber: Following the analysis of Paper 0, we haveadded into our model a constant column density warm absorbermodel calculated from the same SED as discussed in Papers I
8

M. Cappi et al.: X. An unexpected, heavy, multilayer and variable absorber in NGC 5548
and II. This component absorbs only the baseline underlyingcontinuum model, and not the soft emission lines introduced be-low (which are already corrected for absorption from the WA,as discussed below), and it accounts for the historical multicomponents highly ionized warm absorber that is clearly seenwhen the source is in its typical unobscured state (Kaastra et al.2002, 2004; Steenbrugge et al. 2003, 2005; Krongold et al. 2010;Andrade-Velazquez et al. 2010; Paper VI). Absorption from thiswarm absorber component was clearly detected during the unob-scured archival observations and, given the pn low energy reso-lution, its six WA ionization components could be approximatedby only two warm absorber ionization components with ioniza-tion parameters2 log ξ'1–2.7 erg cm s−1 and low column density(log NH'21–22 cm−2) consistently with previous literature re-sults (Krongold et al. 2010). The effect of this multi-componentWA is less visible, but still significant, on the spectra during thecampaign, when the source is highly obscured (see the transmis-sion curve of this component in Fig. S3 of Paper 0). FollowingPaper 0 and II, we also know from the UV spectra that the kine-matics of the warm absorber has not changed over the last 16years, and Paper VI shows that all historical data on NGC5548are consistent with a multi-component WA which is assumed tovary in response to changes in the underlying flux level only. Forthe obscured states, we thus kept the warm absorber parametersfrozen at their average value found by Paper 0, and calculated us-ing an ionization balance which assumes illumination from theaverage obscured SED.
Soft-Excess Intrinsic Emission: NGC5548 is known to have aclear and strong soft-excess intrinsic continuum (see e.g. Kaastra& Barr 1989, Kaastra et al. 2000, 2002, Steenbrugge et al. 2003,2005). Even if there is no direct evidence for the presence of thissame soft-excess during the campaign, because of the strong ob-scuration, it is important to model it to our best to reduce as muchas possible the parameter degeneracies in our following analysisof the multilayer obscurer variability (see Sect. 4.3.2). We thusperformed a re-analysis of the 3 XMM-Newton archival observa-tions (A1→A3), when the source was in its typical unobscuredstate. We first used the same baseline model (Power-law plusreflection component) as for the high energy part of the spec-trum (Sect. 4.1.1) and the above warm absorber affecting onlythe lower energies. We confirm the results obtained by Pounds etal. (2003b) whom analyzed the XMM-Newton spectra of A2+A3to simultaneous data from the MECS+PDS onboard BeppoSAX:a weak soft excess is seen, after allowing for the over-lying ab-sorption, as a smooth upward curvature in the X-ray continuumbelow ∼2 keV. Unlike Pounds et al. (2003b), we do not attempthere to test different models3 for the soft-excess component, nortry to constrain in detail its shape nor intensity during A1→A3.This would be beyond the scope of this paper. Instead, we choosea Comptonization model, which is able to describe the soft X-raycontinuum in a way that is consistent with the source UV-to-softX-ray properties seen before, during, and after the campaign, asshown in Paper VII. In fact, the long-term and broad-band UV-to-soft X-ray analyses presented in Papers I and VII using Swiftdata indicate a correlation between the far UV and soft-X-rayemission, suggesting the presence of an intrinsic emission com-
2 The ionization parameter ξ is defined here as ξ ≡ LnH r2 where L is
the luminosity of the ionising source over the 13.6 eV–infinity band inerg s−1, nH the hydrogen density in cm−3 and r the distance between theionised gas and the ionising source in cm.
3 The soft-excess could be modeled by Pounds et al. (2003b) by ei-ther two black-body models, a single-temperature Comptonized thermalemission or enhanced highly ionized reflection from an accretion disc.
ponent linking the UV to the soft-X-rays, similar to the one mea-sured in Mrk509 (Mehdipour et al. 2011, Petrucci et al. 2013),and possibly due to thermal Comptonization. We thus include inour fits the same thermal Comptonization model (Comptt) as inPaper I, fixing the shape at the best-fit values found in Paper VII,but letting its normalization to be a free parameter in our fits. Asimilar approach was taken in Paper IV, but fixing the normal-ization to the value expected adopting the correlation measuredby Paper I and VII.
Scattered Component: We include in all our models a softscattered component to account for the narrow emission linesthat are clearly detected in the higher resolution data availablefrom the RGS instruments between 0.3-2 keV in the obscuredstates. We make use of the results obtained from the detailedanalysis of Paper V. Their analysis shows that the RGS spectrumis clearly dominated by narrow emission lines (see their Fig. 1),and that these are consistent with being constant in flux duringthe whole campaign. We therefore prefer to use here, and in-clude in our model, the average best-fit model obtained in PaperV using the whole 770 ks RGS stacked spectrum, rather thanuse the lower-statistics observation by observation, and have todeal with cross-instrument calibration issues (but see Paper IVfor addressing some of these issues). This average emission linemodel was calculated using the spectral synthesis code Cloudy(version 13.03; Ferland et al. 2013), the unabsorbed SED cal-culated in Paper I and was used as a fixed table model in thefit in XSPEC. It reproduces well, and self-consistently, all thenarrow emission lines, including the He-like triplets of Neon,Oxygen and Nitrogen, the radiative recombination continuum(RRC) features, and the (Thomson electron) scattered contin-uum seen in the RGS spectrum (see Fig. 6 in Paper V). Thebest-fit parameters of the emitting gas are log ξ =1.45 ± 0.05erg cm s−1, log NH = 22.9 ± 0.4 cm−2 and log vturb = 2.25 ±0.5 km s−1. The emission model also requires, and includes, ab-sorption from at least one of the six components of the warmabsorber found by previous analyses of these and historical data(see Paper V for more details). For the purposes of the presentbroad-band modeling, this same Cloudymodel was extended upto E∼80 keV which corresponds to the high energy limit of theNuSTAR spectral band, by accounting for Compton and resonantscattering up to these higher energies and including the expectedweak FeK emission lines produced by this Compton thin layerof gas. The contribution from this component to the broad-bandmodel is shown in the unfolded spectrum of Fig. 8 (dashed redline in panel e). Its contribution to the soft (0.5-2 keV) X-rayflux is ∼1.8×10⁻¹³ erg cm−2 s−1, and corresponds to about 8%of the total soft X-ray flux, while in the hard (2-10 keV) bandit is ∼4.8×10⁻¹³ erg cm−2 s−1 (i.e. ∼2% of the total flux, and afactor of ∼ 3 lower than the reflection component). As discussedin Paper V, this component is consistent with being producedby (photo-ionized) scattered emission from a distant narrow lineregion (NLR) at a distance of ∼14 pc from the central source.
4.3. Total (0.4-78 keV) X-ray band: The multilayerobscurer(s)
4.3.1. The Three XMM-Newton+NuSTAR simultaneousobservations
We proceeded by fitting now the whole data down to 0.4 keVstarting again with the three XMM-Newton+NuSTAR simultane-ous observations only in order to obtain a best-fit model overthe full energy band available. As for the previous analysis, wefit the 3 observations independently, but using the same model
9

M. Cappi et al.: X. An unexpected, heavy, multilayer and variable absorber in NGC 5548
Table 2. Hard (4–79 keV) X-ray continuum emission (XMM-Newton +NuSTAR observations): Power-law plus Reflection Models
“Phenomenological” reflection model (Cutoff-PL + Fe Kα emission line + pexrav)Obs. Obs. NH Γ Ec Energy1 EW2 Int.3 R (Ω/2π) Anorm χ2/νN. Name (×1022 cm−2) (keV) (keV) (eV) (×10−5) (×10−3)7 M4N 4.1±0.5 1.74±0.04 >313 6.35±0.02 69±9 3.0 0.56 5.9+0.9
−1.3 3535/347111 M8N 7.2+0.5
−1.0 1.75±0.06 >212 6.38±0.02 83±10 3.0 0.65 6.2+1.1−1.4 3535/3471
16 M13N 5.8+0.6−1.2 1.60±0.04 129+48
−30 6.42±0.02 110±10 3.7 0.91 5.9+1.0−0.5 3535/3471
“Physical and self-consistent” reflection model (Cutoff-PL + pexmon)Obs. Obs. NH Γ Ec R (Ω/2π) Anorm χ2/νN. Name (×1022 cm−2) (keV) (×10−3)7 M4N 3.8±0.7 1.73±0.02 >310 0.51 5.4±0.5 1234/1157
11 M8N 5.5±0.8 1.63±0.05 157+153−54 0.79 6.0±0.5 1178/1157
16 M13N 5.7±1.2 1.60±0.06 123+109−41 0.95 6.2±0.5 1153/1157
(1) Emission line rest-frame energy centroid, in units of keV; (2) Emission line rest-frame equivalent width, in units of eV. The width of the line was fixed to σ=0.1keV (see text for details); (3) 2–10 keV flux in units of 10−11 erg s−1 cm−2
Table 3. XMM-Newton +NuSTAR observations: 0.4–79 keV best-fit model (Cutoff-PL + Soft-excess Comptt emission + pexmon +Scattered component + two partially covering ionized obscurers)
Obs. Obs. Γ log NH,1 Cf1 log ξ1 log NH,2 Cf2 log ξ2 Acomptt χ2red(χ2/ν)
N. Name (cm−2) (erg cm s−1) (cm−2) (erg cm s−1)7 M4N 1.56±0.01 22.13±0.01 0.87±0.01 <-0.2 >23.1 0.21+0.02
−0.06 ≡-1 30.8+21.6−2.9 1.15(1555/1348)
11 M8N 1.60±0.05 22.37±0.03 0.87±0.02 0.75+0.08−0.41 23.2±0.09 0.44±0.05 ≡-1 21.4+14.3
−12.3 1.03(1392/1348)16 M13N 1.54±0.06 22.35±0.04 0.87±0.01 0.50+0.18
−0.81 23.2±0.09 0.46±0.05 ≡-1 64.2+26.5−14.3 1.02(1371/1348)
Table 4. Whole XMM-Newton and XMM-Newton+NuSTAR observations: 0.4–10 keV best-fit model (Cutoff-PL + Soft-excessComptt emission + pexmon + Scattered component + two partially covering ionized obscurers)
Obs. Obs. Γ log NH,1 Cf1 log ξ1 log NH,2 Cf2 log ξ2 Acomptt χ2red(χ2/ν)
N. Name (cm−2) (erg cm s−1) (cm−2) (erg cm s−1)1 A1 1.76±0.02 21.38±0.04 ≡1 1.07±0.16 21.82±0.17 ≡1 2.69+0.07
−0.15 72.2±5.8 1.25(528/423)2 A2 1.79±0.02 21.32±0.03 ≡1 1.05±0.09 22.02±0.07 ≡1 2.72±0.04 58.3±4.0 2.14(904/423)3 A3 1.82±0.02 21.33±0.04 ≡1 1.10±0.11 21.82+0.13
−0.20 ≡1 2.70+0.05−0.19 92.5±7.5 1.40(593/423)
4 M1 1.57±0.07 22.71±0.06 0.84±0.02 <0.66 >23.1 0.44+0.08−0.16 ≡-1 <6.6 1.23(520/423)
5 M2 1.61±0.07 22.17±0.03 0.87±0.03 0.57+0.03−0.16 >23.1 0.19±0.02 ≡-1 7.8+2.3
−2.3 1.41(596/423)6 M3 1.44±0.08 22.28±0.07 0.78±0.04 <2.5 >23.4 <0.24 ≡-1 <11.5 1.12(473/423)7 M4N 1.56±0.07 22.13±0.01 0.87±0.01 <-0.2 >23.1 0.21+0.02
−0.06 ≡-1 30.8+21.6−2.9 1.15(1555/1348)
8 M5 1.67±0.07 22.30±0.03 0.94±0.02 0.61+0.14−0.18 23.33±0.11 0.31±0.09 ≡-1 69.8+25.3
−33.8 1.14(482/423)9 M6 1.55±0.07 22.35±0.05 0.88±0.03 0.02+0.55
−0.02 23.11+0.18−0.42 0.22±0.09 ≡-1 23.3+21.6
−12.6 1.25(530/423)10 M7 1.55±0.08 22.27±0.05 0.89±0.03 0.67+0.10
−0.26 23.30±0.13 0.37±0.10 ≡-1 26.01+19.7−13.5 1.16(492/423)
11 M8N 1.60±0.05 22.37±0.03 0.87±0.02 0.75+0.08−0.41 23.2±0.09 0.44±0.05 ≡-1 21.4+14.3
−12.3 1.03(1392/1348)12 M9 1.70±0.07 22.29±0.03 0.93±0.02 0.77+0.06
−0.12 23.31+0.09−0.12 0.33±0.08 ≡-1 84.1+68.3
−42.3 1.08(458/423)13 M10 1.67±0.07 22.28±0.02 0.94±0.02 0.62±0.11 23.36±0.09 0.32±0.08 ≡-1 127.0±48 1.17(503/423)14 M11 1.57±0.08 22.23±0.04 0.91±0.03 0.57+0.15
−0.24 23.26+0.11−0.17 0.30±0.09 ≡-1 74.8+47.2
−26.8 1.15(488/423)15 M12 1.54±0.08 22.29±0.05 0.87±0.04 0.54+0.23
−0.54 23.28+0.12−0.16 0.35±0.07 ≡-1 30.5+19.6
−13.4 1.12(475/423)16 M13N 1.54±0.07 22.35±0.04 0.87±0.01 0.50+0.18
−0.81 23.2±0.09 0.46±0.05 ≡-1 64.2+26.5−14.3 1.02(1371/1348)
17 M14 1.61±0.06 22.01±0.05 0.89±0.02 0.85±0.03 >23.39 0.17±0.07 ≡-1 67.7±13.2 1.43(605/423)
and grouping the XMM-Newton spectra together, and then theNuSTAR spectra together. The grouping is intended to maxi-mize the statistical deviations (and residuals) from the adoptedmodel, thereby helping to identify any missing model compo-nent/feature that would be present in all three spectra, but notincluded in the model. Following the results discussed above,
we incorporate in our broad band model the following emissioncomponents:
i) a power-law continuum;ii) a cold and constant reflection component (Sect. 4.1.1);
iii) a (soft) thermal Comptonization emission model (Sect. 4.2);iv) a scattered emission-line dominated component (Sect. 4.2);
10

M. Cappi et al.: X. An unexpected, heavy, multilayer and variable absorber in NGC 5548
1 100.80.9
11.1
1.2
Ratio
Energy (keV)
Single Obscurer: Full Cov. + Neutrala)
χ2 = 13831
1 100.91
1.1
Ratio
Energy (keV)
Single Obscurer: Full Cov. + Ionized b)χ2 = 5254
1 100.90.9
51
1.05
1.1
Ratio
Energy (keV)
Single Obscurer: Partial Cov. + Ionized c)χ2 = 4502
1 100.90.9
51
1.05
1.1
Ratio
Energy (keV)
Double Obscurers: 2 Partial Cov. 1 Ionized d)χ2 = 4301
10−6
10−5
10−4
10−3
0.01
ke
V2 (
Ph
oto
ns c
m−2 s
−1 k
eV
−1)
1 10
0.9
1
1.1
ratio
Energy (keV)
e)
Fig. 8. Data-to-model ratios (panels a-d) of the 3 XMM-Newton+NuSTAR observations for different models (see text fordetails), and plot of the unfolded best-fit spectrum of the groupedspectra (panel e).
v) the de-ionized WA, as given in Paper 0 (Sect. 4.2), and;vi) up to two new absorbing column densities (called “ob-
scurer” components hereinafter, following the name givenby Paper 0 to distinguish them from the WA component) toaccount for the heavy and complex obscuration seen in thespectra.
It should be noted that the obscurer is covering only thepower-law continuum plus the thermal Comptonization emis-sion, while it is not covering either the reflection continuum northe scattered components. We started with one single neutral andfully covering obscurer, then left its ionization parameter free tovary, then its covering factor, and then both parameters. We thenadded a second obscurer along the LOS, and repeated the pro-cedure until a best-fit was found, checking that every additionalmodel parameter was statistically required (using the F-test sta-tistical test). Some of the data-to-model residuals obtained dur-ing this procedure are shown in Fig. 8 (panels a-e).
Large residuals are obtained when fitting the obscurer witha single, fully covering, either neutral absorber (panel a) or anionized one (panel b). We made numerous attempts to fit theobscurer with a single, fully covering, ionized absorber using ei-ther a “standard” SED for the source (typical of when the sourcewas in its unabsorbed state) or an “obscured” SED (typical ofthe source absorbed state during the campaign) as input for ourCloudy table model. No matter the SED chosen and the widerange of parameters used in these fits (log ξ ∼ 0.1–4 erg cm s−1,log NH ∼20-24 cm−2), a single fully covering ionized obscureris clearly inadequate (panel b of Fig. 8) in producing simultane-ously the smooth curvature below 4 keV, followed by the upwardemission below 1 keV. Actually, very little difference betweenthe two SEDs were recorded in fitting the pn data, in either thebest-fit parameters or residuals obtained. Much better fits andresiduals were instead obtained when allowing for the obscurerto be partially covering the source (panel c), yielding coveringfactors of C f ,1 ∼ 0.84-0.94.
We then proceeded to add a second, independent, absorbingcolumn density covering the same underlying continuum, andagain contributing to explain the “flat” low-energy curvature be-tween 1-4 keV. The fit improvement was substantial (∆χ2 ∼200)and we reached satisfactory fits (χ2
ν ∼1-1.2) with a double ob-scurer partially covering the source, with C f ,2 ∼ 0.2-0.4, and forwhich we let the ionization parameter of the lowest column den-sity to be free to vary (Fig. 8, panel d). Best-fit values are givenin Table 3 and indicate that, based on this first analysis of the 3XMM-Newton+NuSTAR observations, the obscurer is better de-scribed by at least two different column densities, one of whichmildly ionized and the other one essentially cold, which bothpartially cover the source (Fig. 8, panels d and e). Using the samebest-fit model, we will then attempt to fit each of the remainingXMM-Newton observations individually in order to understandwhich of the obscurer parameter(s) is driving the complex vari-ability (Sect. 4.3.2).
We note that despite our efforts to use physically well mo-tivated and sophisticated models (such as Cloudy), and applythese to all sets of observational data available during the cam-paign (from the UV to the hard X-rays, i.e. papers I to VII ofthis series) in a consistent picture, we are left with residualsof emission/absorption line-like features below 1 keV, around2 keV, and around 6 keV. Albeit being rather weak (typically afew eV equivalent width), they are statistically significant, ow-ing to the great statistics (> 1 million counts in total) achievedwhen grouping the 3 XMM-Newton+NuSTAR spectra. We ad-dress these one by one. The residuals around 2 keV are probably
11

M. Cappi et al.: X. An unexpected, heavy, multilayer and variable absorber in NGC 5548
to be ascribed to remaining systematic calibration uncertaintiesdue to the detector quantum efficiency at the Si K-edge (1.84keV) and mirror effective area at the Au M-edge (∼2.3 keV).This was also found in Papers 0, III and IV, and it was decidedthere to cut this part of the spectrum out, also to avoid inconsis-tencies with the RGS spectra which suffered less from such cal-ibration effects. Features at energies lower than ∼1.5 keV couldbe modeled by a combination of a few narrow absorption and/oremission lines at energies around ∼0.5-0.6 keV and 1-1.1 keV,and EW variable between ∼8-15 eV, depending on the line andobservation considered. We estimate that the origin of these fea-tures could be ascribed to either remaining uncertainties in theCTI-energy scale at low energies in the pn data, that we knowwere important during these observations, or to an improper (orapproximate) modeling of the emission and absorption lines. Inthe latter case, uncertainties may be ascribed to the use of theaverage best-fit models for the warm absorber and the scatteredcomponent (see Fig. 6 of Paper V), as well as a too approximatecalculation for the Fe UTA atomic structures (at ∼ 0.7-0.8 keV,Behar et al. 2001) in the Cloudy models. Also a different intrin-sic broadening and/or blueshift of either the warm absorber, thescattered component and/or the obscurer itself, which the currentpn data does not allow to properly constrain, may play a role aswell here. Lastly, the possible origin of the remaining features ataround 6-7 keV will be addressed below (Sect. 4.5) after inves-tigation of also all the remaining XMM-Newton observations.
4.3.2. The Whole 17 XMM-Newton observations: Variabilityof the multi-layer obscurer
We then applied to the whole set of 17 observations the best-fitmodel obtained for the 3 XMM-Newton + NuSTAR simultane-ous observations (Sect. 4.3.1), i.e. including a constant soft scat-tered component, a constant warm absorber, a constant reflectioncomponent, plus two absorbing column densities which partiallyobscure the primary power-law continuum plus the Comptt soft-excess component. Each observation was fitted independentlyletting the parameters of the two ionized absorber(s), the powerlaw (its photon index and normalization), and the normalizationof Comptt free to vary.
Best-fit values obtained for all the 17 observations are shownin Table 4, and indicate that each observation was well describedby the above best-fit model, where the obscurer is a combinationof one mildly ionized (log ξ1 ∼ 0.5-0.8), almost totally covering(Cf1 ∼0.8-0.9) the source with a column density of log NH1 ∼
22.2-22.7 cm−2, plus one cold/neutral (log ξ2 always less than0.2, thus fixed at -1) absorber with a larger column of log NH1∼ 23.2-23.4 cm−2, partially covering (Cf2 ∼0.2-0.4) the source.We note that during the first 3 archival observations, when thesource was unobscured, the best-fit parameters of our Cloudymodels converged into a two-component warm absorber solu-tion that is consistent with the values reported by the Suzaku data(Krongold et al. 2010), and which were considered a good ap-proximation, at low energy resolution, of the multi-temperaturewarm absorber detected in grating Chandra and XMM-Newtonspectra (Andrade-Velazquez et al. 2010, Steenbrugge et al. 2005,Paper VI). During the campaign, our best-fit values are overallin agreement with the average values found by Paper 0 and theindependent measurements from Di Gesu et al. (2015), exceptfor the much larger value of ξ1 found here with respect to Paper0 and Paper IV, who found a log ξ1 = -1.2±0.08. There are mul-tiple possible reasons for this apparent discrepancy. First, ouranalysis is performed observation-by-observation and accountsfor the strong soft X-ray spectral variability, while our earlier
5 10 15
10−115×1
0−12
Flux (7
−10 ke
V)
Observation Number
a)
5 10 15
1.41.6
1.8
Γ
Observation Number
b)
5 10 152121.
522
22.5
23
log N H1
Observation Number
c)
5 10 150.60.7
0.80.9
1
Cf 1
Observation Number
d)
5 10 15−10
12
log ξ 1
Observation Number
e)
5 10 152122
2324
logN H2
Observation Number
f)
5 10 15
00.5
1
Cf 2
Observation Number
h)
Fig. 9. Interesting spectral fit parameters evolution versus the obser-vation number (where, for better clarity, the archival observations aremarked in black, while those from the campaign in red). From topto bottom: Power law flux between 7-10 keV, Γ, log NH1, Cf1, log ξ1,log NH2, Cf2, and log ξ2 versus the observation number.
12

M. Cappi et al.: X. An unexpected, heavy, multilayer and variable absorber in NGC 5548
analysis in Paper 0 reported the time-average values, and PaperIV fixed their ionization parameters to the average values ob-tained in Paper 0. Second, we used Cloudy and the latest resultsfrom Paper V to model the ionized absorbers/emitters, while pre-vious analysis in Paper 0 and Paper IV used the xabs model inSPEX. This may have introduced some systematic differences, inparticular in modeling the RRC and Fe-UTA (see also Paper V).Finally, as mentioned above (Sect. 4.3.1), weak but statisticallysignificant residuals are left below ∼ 1 keV, and between 1.8-2.5keV, which may be attributed to remaining calibration uncertain-ties of the pn spectra. In Papers 0 and III, the first were fittedby adding a few emission and absorption lines in the averagespectra, while the latter energy band was excluded in their anal-ysis. We tested on the three XMM-Newton+NuSTAR spectra thatadding a few ad-hoc emission and/or absorption lines would in-deed contribute to decrease the ionization parameter ξ1 down tovalues (∼0.3) where it becomes rather unconstrained and degen-erate with the other parameters, though maintaining an overallbest-fit substantially unchanged. We thus attribute to at least oneof the above reasons the apparent discrepancy in ξ1 which shouldnot however have any implication on the analysis below whichfocuses on the variability, i.e. the relative intensity, of the mostintense features measured observation by observation. But westress that the absolute value of this parameter must be consid-ered model-and calibration-dependent, thus poorly constrained,by the present analysis.
To further compare with Papers I, IV and VII, we tried alsoto either i) fix the intensity of the Comptonization componentto those values predicted from the measured UV flux, and fol-lowing the UV-soft-X correlation found as given in Paper VIIor ii) to link any of the free parameters (Γ, NH1, Cf1, NH2, Cf2,Acomptt) listed in Table 4 to a same constant value. The fits al-ways returned significantly worse statistical values (by at least∆χ2 > 10) in at least a few observations, supporting the need forall those free parameters. The drawback being here that in someobservations the model is clearly over-fitting the data and yieldspoorly constrained parameters (e.g. during M3).
We then investigated the time evolution of all those param-eters left free to vary, searching also for trends and correlationsamong them. In the top of Fig.9, we plot the 7-10 keV flux lightcurve, since the flux in this energy band should have very lit-tle, if any, sensitivity to the obscuration. Interestingly, the sourcefluxes between 7-10 keV during the archival observations (first3 observations), the average historical values (Paper VI), andduring the campaign (last 14 observations) are all comparablewithin a factor of ∼2. Moreover, except for observation M3,which shows the flattest of all photon index measurements (Γ∼1.44), all other values of the photon index are within the lowerand higher limits (i.e. 1.54-1.79, see Table 3) found from the3 XMM-Newton + NuSTAR broad-band fits, i.e. should reallybe indicative of the intrinsic power-law continuum underlyingshape. This readily suggests that most of the flux and spectralvariability seen at lower energies can be ascribed to the obscureritself, with only little changes in the intrinsic continuum flux andshape. This is confirmed in panels b) to h) of Fig. 9 which showthe time variability of the most interesting best-fit parameters ofthe two obscurer(s) as a function of the observation number. Thisis also confirmed by our model-independent analysis and mod-eling of the fractional variability shown below. Overall, we findonly weak (though statistically significant) variations of the ion-ization parameter ξ1, while ξ2 is consistent with being ∼0 (i.e.neutral gas) since the start of the campaign, from observationM1. We note that given the complexity of the multi-componentspectral model used here, we did not find any single parameter
1.4 1.6 1.80.6
0.7
0.8
0.9
1
Cf1
Photon Index (Γ)
a)
5×10⁻¹² 10−11
1.4
1.6
1.8
Phot
on In
dex
(Γ)
Flux (7−10 keV)
b)
Fig. 10. (Panel a) Spectral fit parameters Γ versus Cf1 (panel a) and(Panel b) Γ versus power law F7−10keV (panel b). Archival observationsare marked in black, while those from the campaign in red.
that could be considered to be responsible, alone, for most of theobserved spectral variability, but several parameters combined toproduce the complex spectral variability shown below.
We have then looked for trends and correlations among allthe best-fit parameters listed in Fig. 9. We find only one weak,but significant, correlation between Cf1 and Γ, with Cf1 ' 0.5 ×Γ + 0.1 for a Pearson linear correlation coefficient of 0.94, cor-responding to a chance probability of <10−5 (see Fig. 10, panela). The correlation also remains significant after deleting the3 archival observations (correlation coefficient of 0.86, chanceprobability value of 8×10⁻⁵). Why would the covering factor,which is a geometrical factor, depend on the power-law intrinsicshape? This is certainly puzzling, and will be addressed later inthe discussion (Sect. 5.2). Another possibility could be thoughthat the correlation is driven by an intrinsic degeneracy of themodel parameters. A quantitative estimate of this effect wouldrequire extensive simulations involving complex models that arebeyond the scope of this paper, but this caveat should be kept inmind. Finally, a general trend (but not a correlation) is also found(see Fig. 10, panel b) where the source appears to be systemat-ically intrinsically flatter during the (absorbed) campaign thanduring the archival (unabsorbed) observations. Also this pointwill be briefly discussed in Sect. 5.2.
4.4. Modeling of the XMM-Newton Fvar spectrum
We used the best fit spectral models during the campaign anddescribed in Sect. 4.3.2 to derive the corresponding Fvar spectra(Fmodel
var in the following), which we compared with the observedFvar spectrum of the campaign shown in Fig. 2 and Fig. 11 in
13

M. Cappi et al.: X. An unexpected, heavy, multilayer and variable absorber in NGC 5548
an attempt to single out the main parameters responsible for theobserved spectral variability.
We first checked whether our best fit model can reproducethe Fvar spectrum correctly by letting all the parameters of themodel vary within the corresponding range of best fit valueslisted in Table 4. The Fmodel
var curve is shown as a red dottedline in Fig. 11. The good agreement between the theoreticaland the observed Fvar demonstrates, as expected given the Fvarcalculation definition, that our best fit spectral model is able toreproduce the correct flux variability at each energy. To obtainthe Fmodel
var curve, the excess variance has been normalized by thetotal flux (which includes also the contribution from constantcomponents) as a function of energy. This explains the netdecrease of variability in the soft band and at ∼6.4 keV, wherethe constant soft scattered component (Sect. 4.2) and the narrowFeK emission line (Sect. 4.1.2) give significant contributions.
Fig. 12 shows the theoretical Fmodelvar spectra obtained by
varying just one parameter of the best fit model (or a combi-nation of parameters, normalization and index, in the case ofthe power law) and leaving all the others fixed to the best fitvalues of observation M7, chosen as a reference for its similarityto the average values. The variable parameter spans the 14best fit values listed in Table 4. These curves show the energydistribution of the variability power of the main parameters ofthe model. We note that the only components contributing tothe soft band variability are the normalization of the intrinsicsoft excess (Acomptt), and the covering fraction of the mildlyionized obscurer(Cf1). On the other hand, the main parameterscontributing to the variability above ∼1 keV are the columndensity of the mildly ionized obscurer, NH1, and the power lawnormalization and spectral index. Interestingly, the Fvar obtainedby varying only the NH1 parameter is characterized by a shapevery similar to the observed Fvar, with a peak at 1-1.5 keVand a sharp drop in the soft band. We note also that the coldercomponent of the obscurer (NH2 and Cf2) brings only weakvariability power, and mostly concentrated between 2-4 keV.
We verified whether variations of the NH1 parameter, plusvariations of the normalization of the power law alone (i.e. with-out variation of Γ, the corresponding Fvar being then constantover the entire energy range), can account for most of the ob-served variability above ∼1 keV. To this aim we combined thetheoretical Fvar curves obtained by varying the NH1 parameteronly, and the power law flux in the energy range 7-10 keV (seeFig. 13). The 7-10 keV energy range was chosen (rather than thenormalization at 1 keV, as given by XSPEC fits) so as to betterconstrain the intrinsic variations of the power law normalizationand avoid spurious contribution from other parameters (see Fig.12). Fig. 13 shows that most of the observed variability at E>1keV can be explained by variations of NH1 and power law nor-malization/flux. The residual variability in the soft band mightbe attributed either to the Comptt component and/or the cover-ing fraction of the mildly ionized obscurer.
A similar model-independent analysis is presented in PaperVII for the whole Swift long-term monitoring, which do probetypically longer timescales of variability than here, i.e. 10 daysup to ∼ 5 months. For those periods when the Swift monitor-ing included also the XMM-Newton campaign, the Fvar recordedby Swift was consistent in shape with the XMM-Newton one,although with significantly lower statistical quality. Swift wasnot sensitive enough to constrain variations in column density,which was thus fixed at a constant value of 1.2×1022 cm−2 asobtained from the time-averaged data presented in Paper 0, and
Fig. 11. Modelling of the Fvar spectrum using best-fit model and best-fitparameters of Table 4.
Nh1
Cf1
AcompTT
Cf2
Nh2
Apow , !
Fig. 12. Spectral decomposition of the different model componentscontributing to the total Fvar spectrum.
Nh1
Apow
Fig. 13. Spectral decomposition varying only the column density of thecomponent 1 of the obscurer and the power-law normalization between7-10 keV (see text for details).
most of the spectral variability was attributed to variations of thecovering fraction of the obscurer only. Moreover, the signatureof the NH1 variability, the very sharp “drop” below ∼ 1 keV inthe pn Fvar spectrum, was not apparent in the Swift data either.
14

M. Cappi et al.: X. An unexpected, heavy, multilayer and variable absorber in NGC 5548
Given the lower S/N data and the longer timescales probed bySwift, we consider their results in agreement with the more de-tailed ones presented here.
4.5. Additional emission and absorption complexities in theFe K energy band
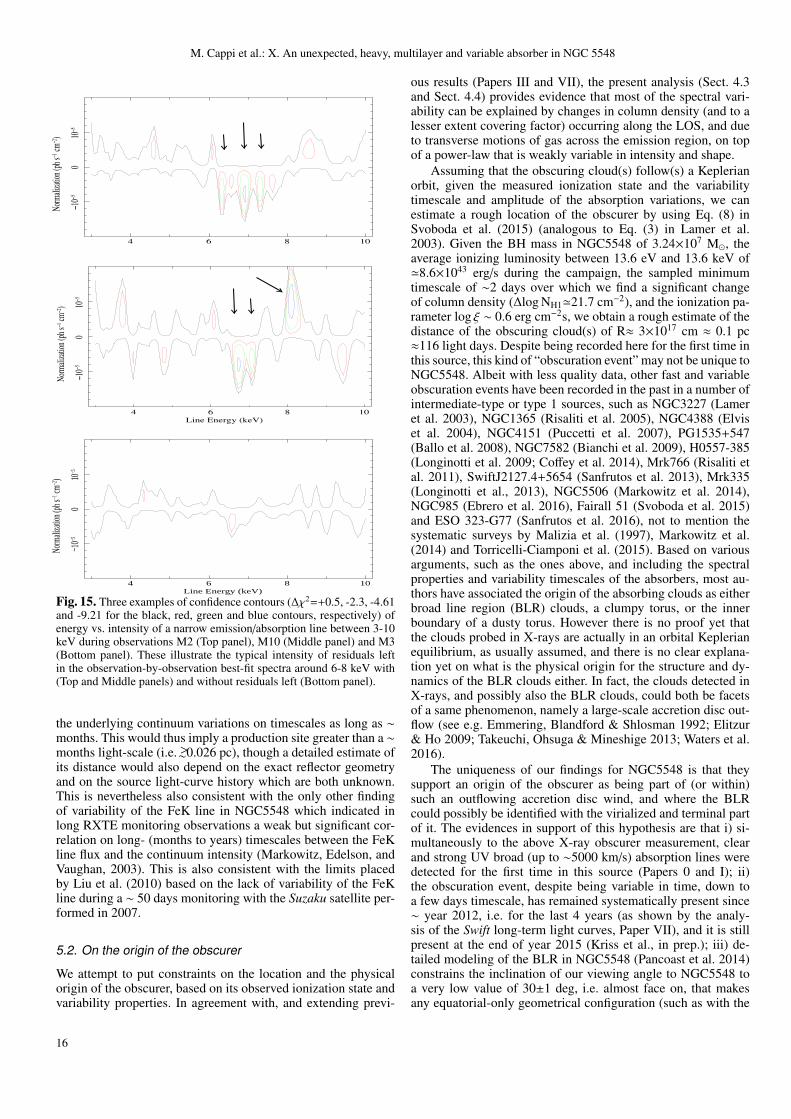
As mentioned above (Sect. 4.3), after reaching a best-fit broad-band model of the 3 XMM-Newton + NuSTAR observations, weare still left with additional, albeit weak, features in the Fe K en-ergy band, namely one moderately broad emission line featurebelow 6 keV, and a set of at least two absorption features, around6.7-6.9 keV and ∼ 8 keV (see Fig. 14). As shown in Fig. 14, thesefeatures are seen in both pn (black) and NuSTAR (red), the latterhaving lower energy resolution but greater effective area than thepn at energies above 7-8 keV. The 6.7-6.9 keV feature was de-tected also in the MOS, while at higher energies the MOS statis-tics are not sufficient to either confirm or disprove the 8 keV lineas well. The features are also seen, and at the same significance,if the background is not subtracted from the source+backgroundspectra. F-tests indicate that both absorption lines are significant(at >99%), with ∆χ2 ∼ 25-30 and EW ∼15-20 eV, each. A care-ful investigation of these features in the other 14 single XMM-Newton observations indicates, however, that none of them re-mains always significant during the campaign. Absorption fea-tures between 6.4-7.1 keV are seen in ∼10 out of the 17 obser-vations, while the emission below 6 keV and the feature around8 keV are seen only in a handful of observations. In all cases,their EWs and statistical significance are low, typically <∼ 20 eVand ∆χ2 between 3 and 10, each. To illustrate further these re-maining features, three examples of residuals obtained duringobservations M2, M10 and M3 are shown in Fig. 15, where con-fidence contours (∆χ2=+0.5, -2.3, -4.61 and -9.21 for the black,red, green and blue contours, respectively) are shown for a nar-row emission/absorption feature “scanned” through the best-fitspectra.
There could be several different explanations for these re-maining weak features, including either a wrong, or incomplete,modeling of the complex underlying continuum which includesseveral emission lines in the FeK band from both the reflec-tion and scattered components, or some weak contribution fromthe pn background which has some strong emission lines athigh energies. Another obvious explanation could be the pres-ence of an additional outflowing absorption component, at sucha high ionization state to contribute only/mostly with FeXXV(He-α and He-β) and FeXXVI (Ly-α and Ly-β) absorption lines.Alternatively, both these remaining blueshifted absorption fea-tures and red-shifted emission features could be signatures of asame Fe P-Cygni type emission and absorption profile originat-ing in an outflowing, highly ionized wind (Dorodnitsyn 2010;Hagino et al. 2015; Gardner & Done, 2015; Nardini et al. 2015).Finally, another possibility for the 6 keV emission line couldbe a (yet unmodelled) contribution from a weak, and signifi-cantly redshifted and broadened reflection component. Overall,given the weakness and marginal statistical significance of anyof these additional emission and absorption complexities, we re-frain here attempting to model them with either a proper physicalwind model (which would include the expected P-Cygni FeKline profile) or a relativistically blurred reflection model sincethese would go beyond the scope of this paper, and the qualityof these datasets.
10−4
10−3
0.01
ke
V2 (
Ph
oto
ns c
m−2 s
−1 k
eV
−1)
0.9
1
1.1
ratio
3 4 5 6 7 8 9 10
−5
0
5
10
15
sig
n(d
ata
−m
od
el) ×
∆
χ2
Energy (keV)
a)
b)
c)
Fig. 14. The 3-10 keV band unfolded spectrum obtained from the spec-tra of the 3 XMM-Newton (black) + NuSTAR (in red) simultaneousobservations. spectra (panel a), the data/model ratio (panel b) and theresiduals in units of ∆χ2 (panel c).
5. Discussion
5.1. On the origin of the reflector
A first estimate on the location of the Fe K emitting region canbe obtained directly from the measured line width of the Fe Kαemission line. After proper correction for the pn CTI (which pro-duced both energy shift and broadening of the line, see Sect. 2),we obtain an upper-limit of 2340 km/s on the line width, namelyvFWHM <
∼ 5500 km s−1. Thus, assuming Keplerian motion, R ∼GMBH/v2, where we define the velocity width as v=
√3
2 vFWHM.For an estimated black hole mass of NGC5548 of MBH ∼ 3.24×10⁷ M (Pancoast et al. 2015), this corresponds to R > 1.89 ×1016 cm (0.006 pc, or light days). We note that this limit is con-sistent with the upper values in the velocity found for the UVbroad absorption line components (Paper 0), consistent with apossible common origin.
The limits obtained from the lack of variability of the lineintensity, despite some weak, but significant variability in the 7-10 keV illuminating component, place even stronger constraintson the minimum distance of the Fe K reflector from the source.We note that the model-independent Fvar spectrum clearly showsweaker line variability compared to the underlying continuumvariability, indicating that the FeK line line does not follow
15
M. Cappi et al.: X. An unexpected, heavy, multilayer and variable absorber in NGC 5548
4 6 8 10
−10−5
010−
5
Norm
alizatio
n (ph
s−1 cm−2
)
Line Energy (keV)
4 6 8 10
−10−5
010−
5
Norm
alizatio
n (ph
s−1 cm
−2)
Line Energy (keV)
4 6 8 10
−10−5
010
−5
Norm
aliza
tion (
ph s−1
cm−2
)
Line Energy (keV)
Fig. 15. Three examples of confidence contours (∆χ2=+0.5, -2.3, -4.61and -9.21 for the black, red, green and blue contours, respectively) ofenergy vs. intensity of a narrow emission/absorption line between 3-10keV during observations M2 (Top panel), M10 (Middle panel) and M3(Bottom panel). These illustrate the typical intensity of residuals leftin the observation-by-observation best-fit spectra around 6-8 keV with(Top and Middle panels) and without residuals left (Bottom panel).
the underlying continuum variations on timescales as long as ∼months. This would thus imply a production site greater than a ∼months light-scale (i.e. >∼0.026 pc), though a detailed estimate ofits distance would also depend on the exact reflector geometryand on the source light-curve history which are both unknown.This is nevertheless also consistent with the only other findingof variability of the FeK line in NGC5548 which indicated inlong RXTE monitoring observations a weak but significant cor-relation on long- (months to years) timescales between the FeKline flux and the continuum intensity (Markowitz, Edelson, andVaughan, 2003). This is also consistent with the limits placedby Liu et al. (2010) based on the lack of variability of the FeKline during a ∼ 50 days monitoring with the Suzaku satellite per-formed in 2007.
5.2. On the origin of the obscurer
We attempt to put constraints on the location and the physicalorigin of the obscurer, based on its observed ionization state andvariability properties. In agreement with, and extending previ-
ous results (Papers III and VII), the present analysis (Sect. 4.3and Sect. 4.4) provides evidence that most of the spectral vari-ability can be explained by changes in column density (and to alesser extent covering factor) occurring along the LOS, and dueto transverse motions of gas across the emission region, on topof a power-law that is weakly variable in intensity and shape.
Assuming that the obscuring cloud(s) follow(s) a Keplerianorbit, given the measured ionization state and the variabilitytimescale and amplitude of the absorption variations, we canestimate a rough location of the obscurer by using Eq. (8) inSvoboda et al. (2015) (analogous to Eq. (3) in Lamer et al.2003). Given the BH mass in NGC5548 of 3.24×10⁷ M, theaverage ionizing luminosity between 13.6 eV and 13.6 keV of'8.6×1043 erg/s during the campaign, the sampled minimumtimescale of ∼2 days over which we find a significant changeof column density (∆log NH1'21.7 cm−2), and the ionization pa-rameter log ξ ∼ 0.6 erg cm−2s, we obtain a rough estimate of thedistance of the obscuring cloud(s) of R≈ 3×1017 cm ≈ 0.1 pc≈116 light days. Despite being recorded here for the first time inthis source, this kind of “obscuration event” may not be unique toNGC5548. Albeit with less quality data, other fast and variableobscuration events have been recorded in the past in a number ofintermediate-type or type 1 sources, such as NGC3227 (Lameret al. 2003), NGC1365 (Risaliti et al. 2005), NGC4388 (Elviset al. 2004), NGC4151 (Puccetti et al. 2007), PG1535+547(Ballo et al. 2008), NGC7582 (Bianchi et al. 2009), H0557-385(Longinotti et al. 2009; Coffey et al. 2014), Mrk766 (Risaliti etal. 2011), SwiftJ2127.4+5654 (Sanfrutos et al. 2013), Mrk335(Longinotti et al., 2013), NGC5506 (Markowitz et al. 2014),NGC985 (Ebrero et al. 2016), Fairall 51 (Svoboda et al. 2015)and ESO 323-G77 (Sanfrutos et al. 2016), not to mention thesystematic surveys by Malizia et al. (1997), Markowitz et al.(2014) and Torricelli-Ciamponi et al. (2015). Based on variousarguments, such as the ones above, and including the spectralproperties and variability timescales of the absorbers, most au-thors have associated the origin of the absorbing clouds as eitherbroad line region (BLR) clouds, a clumpy torus, or the innerboundary of a dusty torus. However there is no proof yet thatthe clouds probed in X-rays are actually in an orbital Keplerianequilibrium, as usually assumed, and there is no clear explana-tion yet on what is the physical origin for the structure and dy-namics of the BLR clouds either. In fact, the clouds detected inX-rays, and possibly also the BLR clouds, could both be facetsof a same phenomenon, namely a large-scale accretion disc out-flow (see e.g. Emmering, Blandford & Shlosman 1992; Elitzur& Ho 2009; Takeuchi, Ohsuga & Mineshige 2013; Waters et al.2016).
The uniqueness of our findings for NGC5548 is that theysupport an origin of the obscurer as being part of (or within)such an outflowing accretion disc wind, and where the BLRcould possibly be identified with the virialized and terminal partof it. The evidences in support of this hypothesis are that i) si-multaneously to the above X-ray obscurer measurement, clearand strong UV broad (up to ∼5000 km/s) absorption lines weredetected for the first time in this source (Papers 0 and I); ii)the obscuration event, despite being variable in time, down toa few days timescale, has remained systematically present since∼ year 2012, i.e. for the last 4 years (as shown by the analy-sis of the Swift long-term light curves, Paper VII), and it is stillpresent at the end of year 2015 (Kriss et al., in prep.); iii) de-tailed modeling of the BLR in NGC5548 (Pancoast et al. 2014)constrains the inclination of our viewing angle to NGC5548 toa very low value of 30±1 deg, i.e. almost face on, that makesany equatorial-only geometrical configuration (such as with the
16

M. Cappi et al.: X. An unexpected, heavy, multilayer and variable absorber in NGC 5548
BLR or torus structures) difficult to reconcile with this data. Thiswould instead favor more polarly directed components such asthose found in MHD-driven outflows (Blandford & Payne 1982;Fukumura et al. 2014), or vertically expanded super-critical out-flows (Takeuchi, Ohsuga, & Mineshige, 2013), although thissource definitely is not a super-critical system.
Intriguingly, we find no particular property of the source dur-ing our multi-frequency campaign that could help us understandthe origin, and reason, for the onset of this long-lasting obscura-tion event. For example the measured luminosities at UV, softand hard X-rays are absolutely in line with historical valuesfor this source. The only unusual property we found is that thephoton index of the underlying power law appears to be sys-tematically and significantly flatter compared to historical val-ues (Γ ∼ 1.7 − 1.9) for this source, even considering only thedata above 7 keV where the effect of any residual absorptionleft should be negligible. This may be indicative of a particularionization state, or physical phenomenon, that favors the forma-tion of an outflow from the accretion disc. The apparent state-dependence of winds in Galactic binaries where they seem tobe preferentially detected when in their (steeper) high-soft state(e.g. Ponti et al. 2012b) would suggest that this is not the casethough.
We also find a significant correlation between Cf1 and thephoton index Γ (ect. 4.3.2 and Fig. 10), that would be puz-zling if not related to remaining parameter degeneracies in thefit procedure. Still, to explain it, one possibility could be thatwe are witnessing changes in the corona geometry which arelinked to its cooling rate, and/or vice-versa. For example, as-suming a disk-corona geometry similar to the one assumed forMrk 509 (Petrucci et al. 2013), with an outer accretion disk andan inner corona (within rcor). An increase of Macc could plau-sibly produce a decrease of rcor (due to e.g. disk recondensa-tion, e.g. Meyer-Hofmeister & Meyer (2006)), thereby reducethe size of the corona, and thus increase the effective Cf of theobscurer. At the same time, the higher Macc would also increasethe source UV flux, producing an increase of cooling in the X-ray corona, and then a softening of the X-ray spectrum. Thiswould also be consistent with the “softer when brighter” behav-ior of this source, as previously found in Papers III and VII. Inturn, the higher Macc would also allow to explain the higheroutflow rate, as expected for most disc-wind models (Elitzur& Ho 2009, Nicastro 2000), and predicts that the width of theBLR becomes narrower with respect to historical measurements(Nicastro 2000).
6. Conclusions
The XMM-Newton monitoring campaign performed in the sum-mer of 2013 revealed NGC5548 in a heavily obscured state(Paper 0). This obscuration was unexpected because this source,often taken as an example of a prototypical Seyfert 1 galaxy, hadnever been found strongly absorbed within the last 40-50 yearsof observations (Paper VI).
Here we have focused on the analysis of the EPIC pn data,the one which clearly shows the obscuration of the X-ray spec-tra and the three archival XMM-Newton observations, and alsocombined the simultaneous NuSTAR data which were availableduring 3 of the 17 XMM-Newton observations. Very importantlyfor our analysis, we took advantage of our previous papers onthis campaign, i.e. Papers 0 to VII, to obtain a best-fit modelthat is consistent, and physically well motivated, taking into ac-count all available informations from the many datasets of thecampaign (including RGS data, Swift, and HST/COS).
The main results of our spectral analysis have been the fol-lowing:
– A best-fit is found, first based on the 3 XMM-Newton +NuSTAR observations, and then applied to all 17 XMM-Newton observations which includes: i) a power law con-tinuum with Γ ∼ 1.5-1.7; ii) a cold and constant reflec-tion component that produces a narrow Fe K emission lineplus Compton hump; iii) a soft-excess modeled by thermalComptonization and contributing only below ∼ 1 keV; iv) ascattered emission line component dominating the RGS en-ergy band; v) a constant, multi temperature warm absorber,consistent with its historical values, after accounting for de-ionization due to the obscurer itself; and vi) a multilayer ob-scurer at mild-to-neutral ionization state, and with at leasttwo components which partially cover the source. This ob-scurer is in addition to the multi component warm absorberthat is always present in this source (Paper VI).
– The Fe K line properties (energy, width, equivalent widthand intensity) are consistent with being part of a reflectioncomponent that is produced by a cold reflecting medium lo-cated at distances greater than ∼ 0.006 pc (∼ 7 light days)from the source.
– The intrinsic high energy continuum did not vary strongly(neither in flux nor in shape) during the observations, imply-ing that most of the soft X-ray variations can be ascribed tochanges in the properties of the new obscurer(s) found alongthe LOS to NGC5548.
– The curvature of the continuum at lower energies and itsvariability clearly require a complex and intrinsically vari-able multi-layer absorber. From the analysis of the spec-tral variability, we find a satisfactory explanation in termsof variability of mostly its column density, and to a lesserextent covering factor.
– Consistent with previous results, the picture that has emergedsuggests the presence of a large-scale/elongated (persistentover years) but inhomogeneous absorbing structure appear-ing along the LOS of NGC5548. We argue that the full(multi-frequency and multi-epoch) data favor an origin in anaccretion disc wind.
– Unfortunately, we could not constrain the velocity of the X-ray obscurer directly from the X-ray data, but its appearancesimultaneous to the UV broad absorption lines (with v up to∼5000 km/s) makes a strong case in favor of a direct physicalassociation between the two, coherent with Paper 0.
Finally, we have also shown (Sect. 4.5) marginal evidence foradditional emission and absorption features around the FeK en-ergy band, indicating further complexities in either the reflectingor absorbing media in this source. These could be related to anadditional outflowing component, potentially at an even higherionization state and velocity than measured here. Given the littlestatistical significance of these features, summed to the complex-ity of the multiple component model and to the calibration uncer-tainties of the present dataset, we have not discussed these to agreat extent. Overall, these observations and theoretical modelshave reached a level at which we are really pushing the lim-its to the calibration uncertainties, which are hard to resolve.Certainly, a better understanding of the obscurer origin and prop-erties would benefit from more sensitive and higher energy res-olution as foreseen with the future Athena Space Observatory.
Acknowledgements. This paper is based on observations obtained with theXMM-Newton satellite, an ESA funded mission with contributions by ESAMember States and USA. MC and SB acknowledges financial support from the
17
M. Cappi et al.: X. An unexpected, heavy, multilayer and variable absorber in NGC 5548
Italian Space Agency under grant ASI-INAF I/037/12/P1. GP acknowledges sup-port via an EU Marie Curie Intra- European fellowship under contract no. FP-PEOPLE-2012-IEF- 331095.
This work is based on observations obtained with XMM- Newton, an ESAscience mission with instruments and contributions directly funded by ESAMember States and the USA (NASA). This research has made use of data ob-tained with the NuSTAR mission, a project led by the California Institute ofTechnology (Caltech), managed by the Jet Propulsion Laboratory (JPL) andfunded by NASA. We thank the International Space Science Institute (ISSI) inBern for their support and hospitality. SRON is supported financially by NWO,the Netherlands Organization for Scientific Research. M.M. acknowledges sup-port from NWO and the UK STFC. This work was supported by NASA throughgrants for HST program number 13184 from the Space Telescope ScienceInstitute, which is operated by the Association of Universities for Research inAstronomy, Incorporated, under NASA contract NAS5-26555. M.C. acknowl-edges financial support from contracts ASI/INAF n.I/037/12/0 and PRIN INAF2011 and 2012. P.-O.P. acknowledges financial support from the CNES andfrom the CNRS/PICS. K.C.S. acknowledges financial support from the FondoFortalecimiento de la Productividad Cientfica VRIDT 2013. E.B. received fund-ing from the EU Horizon 2020 research and innovation programma under theMarie Sklodowska-Curie grant agreement n. 655324, and from the iCOREprogram of the Planning and Budgeting Committee (grant number 1937/12).S.B., G.M. and A.D.R. acknowledge INAF/PICS financial support. G.M. andF.U. acknowledge financial support from the Italian Space Agency under grantASI/INAF I/037/12/0-011/13. B.M.P. acknowledges support from the US NSFthrough grant AST-1008882. G.P. acknowledges support via an EU Marie CurieIntra-European fellowship under contract no. FP-PEOPLE-2012- IEF-331095and Bundesministerium fur Wirtschaft und Technologie/Deutsches Zentrum furLuft- und Raumfahrt (BMWI/DLR, FKZ 50 OR 1408). F.U. acknowledges PhDfunding from the VINCI program of the French-Italian University. M.W. ac-knowledges the support of a PhD studentship awarded by the UK STFC.
ReferencesAndrade-Velazquez, M., Krongold, Y., Elvis, M., et al. 2010, ApJ, 711, 888Antonucci, R. R. J., & Miller, J. S. 1985, ApJ, 297, 621Arav, N., Chamberlain, C., Kriss, G. A., et al. 2015, A&A, 577, A37 (Paper II)Ballo, L., Giustini, M., Schartel, N., et al. 2008, A&A, 483, 137Bassani, L., Dadina, M., Maiolino, R., et al. 1999, ApJS, 121, 473Behar, E., Sako, M., & Kahn, S. M. 2001, ApJ, 563, 497Bianchi, S., Piconcelli, E., Chiaberge, M., et al. 2009, ApJ, 695, 781Blandford, R. D., & Payne, D. G. 1982, MNRAS, 199, 883Blustin, A. J., Page, M. J., Fuerst, S. V., Branduardi-Raymont, G., & Ashton,C. E. 2005, A&A, 431, 111Brenneman, L. W., Elvis, M., Krongold, Y., Liu, Y., & Mathur, S. 2012, ApJ,744, 13Cappi, M., Panessa, F., Bassani, L., et al. 2006, A&A, 446, 459Cappi, M. 2006, Astronomische Nachrichten, 327, 1012Coffey, D., Longinotti, A. L., Rodrıguez-Ardila, A., et al. 2014, MNRAS, 443,1788Cooke, B. A., Ricketts, M. J., Maccacaro, T., et al. 1978, MNRAS, 182, 489Costantini, E. 2010, Space Sci. Rev., 157, 265Crenshaw, D. M., Kraemer, S. B., & George, I. M. 2003, ARA&A, 41, 117Crenshaw, D. M., Kraemer, S. B., Gabel, J. R., et al. 2003, ApJ, 594, 116Dadina, M. 2007, A&A, 461, 1209de la Calle, I., 2014, ‘Users Guide to the XMM-Newton Science AnalysisSystem”, Issue 11.0 (ESA: XMM-Newton SOC).Dickey, J. M., & Lockman, F. J. 1990, ARA&A, 28, 215Di Gesu, L., Costantini, E., Ebrero, J., et al. 2015, A&A, 579, A42 (Paper IV)Dorodnitsyn, A. V. 2010, MNRAS, 406, 1060Ebrero, J., Kriss, G. A., Kaastra, J. S., & Ely, J. C. 2016, A&A, 586, A72Ebrero, J., Kaastra, J. S., Kriss, G. A., et al. 2016, A&A, 587, A129 (Paper VI)Elitzur, M., & Shlosman, I. 2006, ApJ, 648, L101Elitzur, M., & Ho, L. C. 2009, ApJ, 701, L91Elvis, M. 2000, ApJ, 545, 63Elvis, M., Risaliti, G., Nicastro, F., et al. 2004, ApJ, 615, L25Emmering, R. T., Blandford, R. D., & Shlosman, I. 1992, ApJ, 385, 460Ferland, G. J., Porter, R. L., van Hoof, P. A. M., et al. 2013, Rev. MexicanaAstron. Astrofis., 49, 137Fukumura, K., Tombesi, F., Kazanas, D., et al. 2014, ApJ, 780, 120Ganguly, R., & Brotherton, M. S. 2008, ApJ, 672, 102Gardner, E., & Done, C. 2015, MNRAS, 448, 2245Gofford, J., Reeves, J. N., Tombesi, F., et al. 2013, MNRAS, 430, 60Guainazzi, M., on behalf of the EPIC consortium, 2014, ‘XMM-NewtonCalibration Technical Note” XMM-SOC-CAL-TN-0018 (ESA: XMM-NewtonSOC).Hagino, K., Odaka, H., Done, C., et al. 2015, MNRAS, 446, 663
Hoenig, S. F. 2013, arXiv:1301.1349Kaastra, J. S., & Barr, P. 1989, A&A, 226, 59Kaastra, J. S., Mewe, R., Liedahl, D. A., Komossa, S., & Brinkman, A. C. 2000,A&A, 354, L83Kaastra, J. S., Steenbrugge, K. C., Raassen, A. J. J., et al. 2002, A&A, 386, 427Kaastra, J. S., Steenbrugge, K. C., Crenshaw, D. M., et al. 2004, A&A, 422, 97Kaastra, J. S., Kriss, G. A., Cappi, M., et al. 2014, Science, 345, 64 (Paper 0)Krolik, J. H., & Begelman, M. C. 1988, ApJ, 329, 702Krongold, Y., Elvis, M., Andrade-Velazquez, M., et al. 2010, ApJ, 710, 360Liu, Y., Elvis, M., McHardy, I. M., et al. 2010, ApJ, 710, 1228Lamer, G., Uttley, P., & McHardy, I. M. 2003, MNRAS, 342, L41Lobban, A. P., Reeves, J. N., Miller, L., et al. 2011, MNRAS, 414, 1965Lodders, K. 2003, ApJ, 591, 1220Longinotti, A. L., Bianchi, S., Ballo, L., de La Calle, I., & Guainazzi, M. 2009,MNRAS, 394, L1Longinotti, A. L., Krongold, Y., Kriss, G. A., et al. 2013, ApJ, 766, 104Madsen, K. K., Furst, F., Walton, D. J., et al. 2015, ApJ, 812, 14Malizia, A., Bassani, L., Stephen, J. B., Malaguti, G., & Palumbo, G. G. C.1997, ApJS, 113, 311Marchese, E., Braito, V., Della Ceca, R., Caccianiga, A., & Severgnini, P. 2012,MNRAS, 421, 1803Markowitz, A., Edelson, R., & Vaughan, S. 2003, ApJ, 598, 935Markowitz, A. G., Krumpe, M., & Nikutta, R. 2014, MNRAS, 439, 1403McHardy, I. M., Cameron, D. T., Dwelly, T., et al. 2014, MNRAS, 444, 1469Mehdipour, M., Branduardi-Raymont, G., Kaastra, J. S., et al. 2011, A&A, 534,A39Mehdipour, M., Kaastra, J. S., Kriss, G. A., et al. 2015, A&A, 575, A22 (PaperI)Mehdipour, M., Kaastra, J. S., Kriss, G. A., et al. 2016, arXiv:1602.03017(Paper VII)Merloni, A., Bongiorno, A., Brusa, M., et al. 2014, MNRAS, 437, 3550McKernan, B., Yaqoob, T., & Reynolds, C. S. 2007, MNRAS, 379, 1359Meyer-Hofmeister, E., & Meyer, F. 2006, A&A, 449, 443Miller, L., Turner, T. J., Reeves, J. N., et al. 2007, A&A, 463, 131Miniutti, G., Sanfrutos, M., Beuchert, T., et al. 2014, MNRAS, 437, 1776Murray, N., Chiang, J., Grossman, S. A., & Voit, G. M. 1995, ApJ, 451, 498Nandra, K., George, I. M., Mushotzky, R. F., Turner, T. J., & Yaqoob, T. 1997,ApJ, 476, 70Nandra, K., O’Neill, P. M., George, I. M., & Reeves, J. N. 2007, MNRAS, 382,194Nardini, E., Reeves, J. N., Gofford, J., et al. 2015, Science, 347, 860Nicastro, F. 2000, ApJ, 530, L65Pancoast, A., Brewer, B. J., Treu, T., et al. 2014, MNRAS, 445, 3073Pancoast, A., Brewer, B. J., Treu, T., et al. 2015, MNRAS, 448, 3070Panessa, F., Bassani, L., Cappi, M., et al. 2006, A&A, 455, 173Piconcelli, E., Jimenez-Bailon, E., Guainazzi, M., et al. 2005, A&A, 432, 15Petrucci, P.-O., Paltani, S., Malzac, J., et al. 2013, A&A, 549, A73Ponti, G., Cappi, M., Dadina, M., & Malaguti, G. 2004, A&A, 417, 451Ponti, G. 2007, Ph.D. Thesis, University of BolognaPonti, G., Papadakis, I., Bianchi, S., et al. 2012a, A&A, 542, A83Ponti, G., Fender, R. P., Begelman, M. C., et al. 2012b, MNRAS, 422, 11Pounds, K. A., Reeves, J. N., King, A. R., et al. 2003a, MNRAS, 345, 705Pounds, K. A., Reeves, J. N., Page, K. L., et al. 2003b, MNRAS, 341, 953Pounds, K. A., Reeves, J. N., Page, K. L., & O’Brien, P. T. 2004, ApJ, 616, 696Proga, D. 2007, ApJ, 661, 693Puccetti, S., Fiore, F., Risaliti, G., et al. 2007, MNRAS, 377, 607Risaliti, G., Elvis, M., & Nicastro, F. 2002, ApJ, 571, 234Risaliti, G., Bianchi, S., Matt, G., et al. 2005, ApJ, 630, L129Risaliti, G., Salvati, M., Elvis, M., et al. 2009, MNRAS, 393, L1Risaliti, G., Elvis, M., Bianchi, S., & Matt, G. 2010, MNRAS, 406, L20Risaliti, G., Nardini, E., Salvati, M., et al. 2011, MNRAS, 410, 1027Rivers, E., Risaliti, G., Walton, D. J., et al. 2015, ApJ, 804, 107Reeves, J. N., Porquet, D., Braito, V., et al. 2013, ApJ, 776, 99Reeves, J. N., Braito, V., Gofford, J., et al. 2014, ApJ, 780, 45Sanfrutos, M., Miniutti, G., Agıs-Gonzalez, B., et al. 2013, MNRAS, 436, 1588Sanfrutos, M., Miniutti, G., Krongold, Y., Agıs-Gonzalez, B., & Longinotti,A. L. 2016, MNRAS, 457, 510Sim, S. A., Long, K. S., Miller, L., & Turner, T. J. 2008, MNRAS, 388, 611Smith, M.J.S., Stuhlinger, M., Saxton, R.D., Freyberg, M.J., 2014, ‘XMM-Newton CCF Release Note” XMM-CCF-REL-323 (ESA: XMM-NewtonSOC).Steenbrugge, K. C., Kaastra, J. S., de Vries, C. P., & Edelson, R. 2003, A&A,402, 477Steenbrugge, K. C., Kaastra, J. S., Crenshaw, D. M., et al. 2005, A&A, 434,569Svoboda, J., Beuchert, T., Guainazzi, M., et al. 2015, A&A, 578, A96Takeuchi, S., Ohsuga, K., & Mineshige, S. 2013, PASJ, 65,Tatum, M. M., Turner, T. J., Miller, L., & Reeves, J. N. 2013, ApJ, 762, 80
18

M. Cappi et al.: X. An unexpected, heavy, multilayer and variable absorber in NGC 5548
Tombesi, F., Cappi, M., Reeves, J. N., et al. 2010, A&A, 521, A57Tombesi, F., Cappi, M., Reeves, J. N., et al. 2013, MNRAS, 430, 1102Tombesi, F., Tazaki, F., Mushotzky, R. F., et al. 2014, MNRAS, 443, 2154Torricelli-Ciamponi, G., Pietrini, P., Risaliti, G., & Salvati, M. 2014, MNRAS,442, 2116Turner, T. J., George, I. M., Nandra, K., & Mushotzky, R. F. 1997, ApJ, 488,164Turner, T. J., George, I. M., Nandra, K., & Mushotzky, R. F. 1998, ApJ, 493,91Turner, T. J., Miller, L., Kraemer, S. B., Reeves, J. N., & Pounds, K. A. 2009,ApJ, 698, 99Ursini, F., Boissay, R., Petrucci, P.-O., et al. 2015, A&A, 577, A38 (Paper III)Uttley, P., McHardy, I. M., & Papadakis, I. E. 2002, MNRAS, 332, 231Vaughan, S., Edelson, R., Warwick, R. S., & Uttley, P. 2003, MNRAS, 345,1271Walton, D. J., Risaliti, G., Harrison, F. A., et al. 2014, ApJ, 788, 76Waters, T., Kashi, A., Proga, D., et al. 2016, arXiv:1601.05181Whewell, M., Branduardi-Raymont, G., Kaastra, J. S., et al. 2015, A&A, 581,A79 (Paper V)
19