ananlysis of productivity and efficiency in msrtc
TRANSCRIPT
MPRAMunich Personal RePEc Archive
Ananlysis of productivity and efficiencyin MSRTC
Manisha Karne and Anand Venkatesh
Department of Economics, University of Mumbai
June 2003
Online at http://mpra.ub.uni-muenchen.de/14292/MPRA Paper No. 14292, posted 27. March 2009 03:16 UTC
DEPARTMENT OF ECONOMICS
ANALYSIS OF PRODUCTIVITY AND EFFICIENCY IN MSRTC
BY
Manisha Karne Anand Venkatesh
WORKING PAPER UDE 10/6/2003 SEPTEMBER 2003
UNIVERSITY OF MUMBAI
id26560671 pdfMachine by Broadgun Software - a great PDF writer! - a great PDF creator! - http://www.pdfmachine.com http://www.broadgun.com

DEPARTMENT OF ECONOMICS UNIVERSITY OF MUMBAI
Vidyanagari, Mumbai 400 098.
Documentation Sheet Title:
ANALYSIS OF PRODUCTIVITY AND EFFICIENCY IN MSRTC
Author(s): Manisha Karne
External Participation: Anand Venkatesh
WR No.: UDEl0/6/2003 Date of Issue: September 2003
Contents: 24 P,6T,1 F, 21 R. No. of Copies: 100
Abstract Maharashtra State Road Transport Corporation (MSRTC) has been
instrumental in providing access and connectivity across the entire state of Maharashtra. Over the last few years, due to a variety of factors, particularly competition from the private sector, MSRTC's financial performance has shown a marked deterioration. After the financial turnaround of Karnataka State Road Corporation when it was split in to four smaller organizations, the same solution was suggested by many for large corporations like MSRTC. In this paper, we examine the issue of splitting MSRTC into smaller regions to find out whether it would actually help in its financial recovery. Also, we examine the possibility of improvement in financial profitability by means of enhanced input productivity.
Key Words: State Road Transport Corporations, Scale Economies, Technical Efficiency, Total Factor Productivity. JELCode(s): R41

ANALYSIS OF PRODUCTIVITY AND EFFICIENCY IN MSRTC
Manisha Karne Anand Venkatesh
1. INTRODUCTION
In India Road Transport Corporation Act was passed by parliament in 1950.This Act advocated nationalization of passenger road transport undertakings operating in various Indian states. Under the auspices of the above Act many states nationalised their passenger road transport services and thus State Road Transport Corporations (SRTCs) were formed.
Currently, State Road Transport corporations (SRTCs) find themselves plagued by several problems, partly external but largely self-inflicted. With declining financial support from both Central and State Governments after liberalisation and in the wake of intense competition from private operators, these organisations have had to largely fend for themselves. A popularly held hypothesis has been that many of these organisations are oversized and hence splitting of these organisations into smaller organisations could vastly improve their physical productivity and hence financial performance. This idea has gained further ground after the dramatic turnaround of Karnataka State Road Transport Corporation (KnSRTC) after it had been split into smaller organisations. Through this paper, we intend to examine whether splitting of a large organisation like MSRTC into smaller corporations would actually lead to improved financial performance. We also examine how efficiently is MSRTC using the input combinations available at its disposal given the current operating environment. 2. A Brief History of MSRTC
The process of Nationalization in the road passenger transportation sector started immediately after Independence, when the Central Government introduced the legislation for the purpose sometime in 1948, which resulted in bringing on the Statute Book in 1950- the Road Transport Corporation (RTC) Act. In December 1949,Bombay State decided to set up a single Corporation for the whole state under the Road Transport

Corporation Act,1948, which was later constituted under the Road Transport Corporation Act, 1950. Nationalization of passenger road transport services in the State started in June 1948, initially as a departmental undertaking with a fleet of 35 buses operating on the Poona-Ahmednagar and allied routes, which later were handed over to the statutory corporation viz., Bombay State Road Transport Corporation (BSRTC). This corporation in 1961 emerged as the Maharashtra State Transport Corporation (MSRTC), which is today the second largest (after APSRTC) passenger road transport organization in the country.
Consequent to the bifurcation of the erstwhile Bombay State with effect from 1st May 1960, the Bombay Reorganization Act, 1960, made provision for the corresponding bifurcation of the erstwhile Bombay State Road Transport Corporation between the two state of Maharashtra and Gujarat. After bifurcation and with the approval of the Central Government, a notification was issued in June 1961, merging the Maharashtra State Road Transport Corporation, the State Transport Marathwada and the Provincial Transport Services, Nagpur formally with effect from 1st July 1961. Simultaneously, the jurisdiction of the Maharashtra State Transport Corporation (MSRTC) came to cover the entire State of Maharashtra.
Maharashtra is one of the few States where passenger transportation has been completely nationalized. MSRTC carried out an ambitious expansion plan by laying down the principle of linking each and every village by bus service. MSRTC's principal slogan is "Where there is a road there is a bus service". This approach has been responsible for extensive route network in the entire state of Maharashtra. MSRTC has made significant contribution by creating a good road transport infrastructure for developing the rural economy in the state. A brief profile of MSRTC is provided in Appendix I. 3. PROBLEMS CURRENTLY FACED BY MSRTC MSRTC is currently facing several problems due to which its financial profitability has been adversely affected. The problems facing MSRTC are briefly discussed below: � Falling load factors due to competition: Even though MSRTC operates
along 100% nationalized routes in Maharashtra state, it faces competition

from private bus and maxicab operators who operate stage carriage services in a clandestine manner posing as contract carriage operators. Since these operators compete with MSRTC only along its high-density routes, MSRTCs load factors have fallen along these routes thereby affecting its financial performance.
Table 1: Decline in load factors of Regions of MSRTC
As can be seen from Table 1, there has been a steep decline in load factors for .11 regions of MSRTC, from around 70% in 1994-95 to nearly 60% in 2001 -02. � Excessive Governmental Control: In the RTC Act (1950), guidelines were
laid for the control mechanism between the RTCs and the Government.While RTCs were allowed to tap various avenues of finance to fulfil their investment requirements, the same required approval from the respective State Governments. A major problem with this clause was that State Governments were keen to use RTCs as a tool to further their political interests rather than facilitate their financial autonomy. Moreover, the Act stipulated that even in matters related to recruitment, State Governments would have a major say. Most significantly RTCs did not even possess pricing autonomy. Failure to comply with Government orders meant heavy penalties to the RTCs.Thus, this flawed control mechanism between State Governments and RTCs was, to a large extent, responsible for the deteriorating financial health of these RTCs.
� High rates of passenger taxes:Since RTCs were corporations, they were required to pay tax to the state in form of passenger tax, motor vehicle tax and so forth. The passenger tax rates in 2000-01 have been effectively
Region Year Aurangabad Mumbai Nagpur Pune Nashik Amravati
1994-95 69.25 71.44 70.26 70.14 75.85 67.53 1995-96 72.36 73.15 74.38 72.59 75.45 69.89 1996-97 71.75 73.26 75.5 72.26 71.73 68.23 1997-98 65.93 69.47 66.7 67.16 68.84 61.60 1998-99 64.50 68.15 63.13 65.40 68.84 60.78 1999-00 62.48 66.03 59.73 65.43 65.71 57.96 2000-01 58.26 63.63 56.02 60.91 61.45 53.97 2001-02 57.89 65.24 56.19 61.33 61.09 54.27
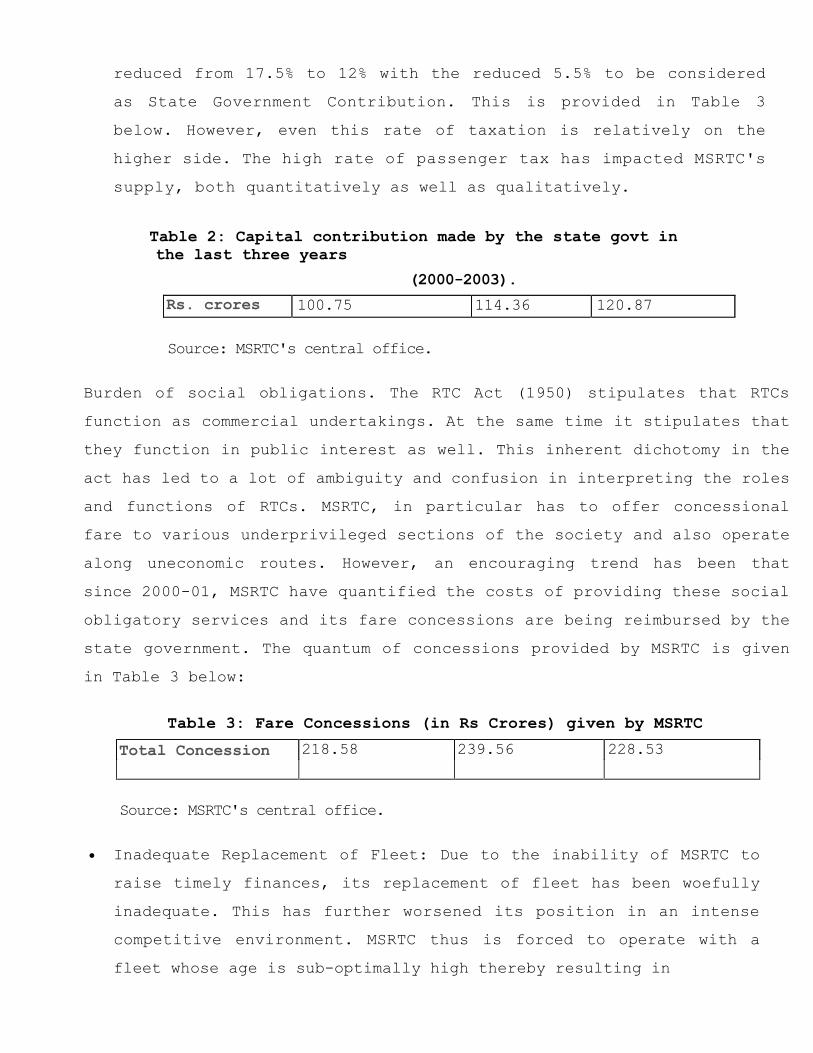
reduced from 17.5% to 12% with the reduced 5.5% to be considered as State Government Contribution. This is provided in Table 3 below. However, even this rate of taxation is relatively on the higher side. The high rate of passenger tax has impacted MSRTC's supply, both quantitatively as well as qualitatively.
Table 2: Capital contribution made by the state govt in the last three years
(2000-2003).
Source: MSRTC's central office.
Burden of social obligations. The RTC Act (1950) stipulates that RTCs function as commercial undertakings. At the same time it stipulates that they function in public interest as well. This inherent dichotomy in the act has led to a lot of ambiguity and confusion in interpreting the roles and functions of RTCs. MSRTC, in particular has to offer concessional fare to various underprivileged sections of the society and also operate along uneconomic routes. However, an encouraging trend has been that since 2000-01, MSRTC have quantified the costs of providing these social obligatory services and its fare concessions are being reimbursed by the state government. The quantum of concessions provided by MSRTC is given in Table 3 below:
Table 3: Fare Concessions (in Rs Crores) given by MSRTC
Source: MSRTC's central office.
Inadequate Replacement of Fleet: Due to the inability of MSRTC to raise timely finances, its replacement of fleet has been woefully inadequate. This has further worsened its position in an intense competitive environment. MSRTC thus is forced to operate with a fleet whose age is sub-optimally high thereby resulting in
Year 2000-01 2001-02 2002-03 Rs. crores 100.75 114.36 120.87
Year 2000-01 2001-02 2002-03 Total Concession 218.58 239.56 228.53
frequent breakdowns. The inadequacy of the replacement policy can be clearly seen from the fact that MSRTC's fleet strength has grown by a mere 2.5% from 1997-98 to 2002-03.
� Vertically Integrated Organisation: Like most of the other RTCs, MSRTC chose to operate as a vertically integrated enterprise by owning and managing all allied activities apart from its core activity of providing public passenger bus transportation. Over a period of time it owned and operated a large number of depots, workshops, terminals, bus body building units, tyre retreading plants and so forth. The weak financial situation of MSRTC made the maintenance of these assets all the more difficult. Owning and operating these allied activities, which had been justified on the grounds of lack of specialisation in the country, no longer has any economic rationale in the post liberalisation era of specialisation. However, the strong labour unions of MSRTC, apart from a general reluctance to outsourcing has resulted in MSRTC concentrating its attention needlessly on activities it could have outsourced at a lower cost and hence reduced its operating cost, particularly personnel cost which constitutes a relatively large share of 42% in total costs. This would have also reduced the Staff Bus ratio, which currently stands at a relatively high level of 6.28 in 2002-03
4. OBJECTIVES OF THE STUDY The objectives of the study are as given below:
� To examine whether changes in firm size would improve physical productivity and hence, financial performance
� To examine the possibility of improvements in physical productivity and the impact of the same on financial performance.
� To compute Technical Efficiency (TE) and changes in the same for all regions of MSRTC. Also, changes m Total Factor Productivity (TFP) for all regions of MSRTC would be computed.
5. METHODOLOGY ADOPTED FOR THE STUDY 5.1 Methodology For Projections of Profits/losses of Regions of MSRTC.
The financial performance of any region of MSRTC, to a considerable extent, depends on its physical performance that in turn is determined by the efficiency of operations and policy related variables. (Sriraman, 1999) In this section the methodology for analysing the financial performance of six regions of MSRTC for the year 2001-02 is elaborated.
The physical performance measures of the regions are reflected through the major supply level parameters like Feet utilisation (FU), Vehicle utilisation (VU), Fuel efficiency (KMPL) & staff Bus Ratio (SBR), while the Load factor (LF) is a demand factor. The average fare charged to the passengers is taken as a policy variable that is exogenously fixed. The model disaggregates the cost in terms of fixed and variable costs. The fixed cost components are depreciation, interest, and motor vehicle tax. The variable cost components are the personnel cost, diesel cost, other material cost, passenger tax, miscellaneous taxes, and miscellaneous cost.
As the data on physical and financial parameters is compiled at the corporation level in MSRTC, the data for different regions for the sample data period 1995-1996 to 2001-2002 is based on region-wise budget evaluation. The model is specified in Microsoft excel format. Other details pertaining to the model are given in Appendix II. The study made an attempt to find economies of scale for the regions to examine the need for breaking-up the regions in to smaller ones. Scale in the economic sense is the range of output over which a production establishment produces. A large scale means that the firm size is aligned so as to produce large quantities of output, and a small scale implies exactly the reverse. In short, it refers to the economic size of production, or in other words "Firm Size". Economies of scale are experienced when the long run total cost increases at a diminishing rate or long run average cost is falling. Firms will try to choose scales of production that fully encompass economies of scale, but not scales so large that plants encounter diseconomies of scale. In economic terms, firms have incentives to build plants that are of minimum efficient scale. This is the plant size at which economies of scale are fully realized. Economies of scale are often measured in terms cost �output
6

elasticity. In the context of passenger road transport by varying the fleet size for every region, an attempt is made to find out the impact of changing the fleet size economies of scale by using the concept of cost-output elasticity (Ec) which is used to calculate the index of economies of scale (SCI). The cost output elasticity is defined as the percentage change in the cost of production resulting from a one percent increase in output. Symbolically, it can be written as Ec = (△C/C)/( △PKM/PKM) (1)
Where Ec stands for Cost Output Elasticity C is total cost for the region △C is the change in the total cost
PKM is passenger kms. (The Output parameter) The Scale Economies Index is defined as SCI=1-EC
If the value of SCI=O then there are no scale economies. If the value of SCI is positive, then there are increasing scale economies. If the value of SCI is negative, then there are decreasing scale economies. In the context of the bus industry, it is necessary to specify what exactly is meant by Short-run and Long-run Costs. From conventional theory, it is known that operating along Long-run cost curve means changing all factors proportionally i.e. increasing firm size while operating along Short-run cost curve means making more intensive use of existing capacity. In the Indian context changing firm size means changing the capital stock while operating in the short-run means keeping the stock of capital fixed. For a bus transport undertaking, the basic unit of capital is a bus. Thus, increasing output by changing the fleet strength implies change in long-run costs whereas increasing the output by keeping fleet size fixed implies change in short-run costs. 5.2. Measurement of Technical Efficiency and TFP in MSRTC Technical efficiency reflects the ability of a firm to obtain maximal output from a given set of inputs. This can be explained by a simple example involving firms, which use two
7

inputs (x1 and X2) to produce a single output (y) under the assumption of constant returns to scale. Knowledge of the unit isoquant of fully efficient firms permits the measurement of technical efficiency. Input oriented technical efficiency can be diagrammatically explained with the help of Figure I below.
The isoquant of the fully efficient firm, in other words, the "Efficiency Frontier" is represented by the unit isoquant SS'. If a given firm uses quantities of inputs defined by point P, to produce a unit of output, the technical inefficiency of that firm could be represented by distance QP, which is the amount by which all inputs could be proportionally reduced without reduction in output. This is expressed in percentage terms by the ratio QP/OP, which represents the percentage by which all inputs need to be reduced to achieve technically efficient production. The technical efficiency (TE) of a firm operating with input combination at P is measured by the ratio
TE = OQ/OP = 1 -QP/OP 1/()
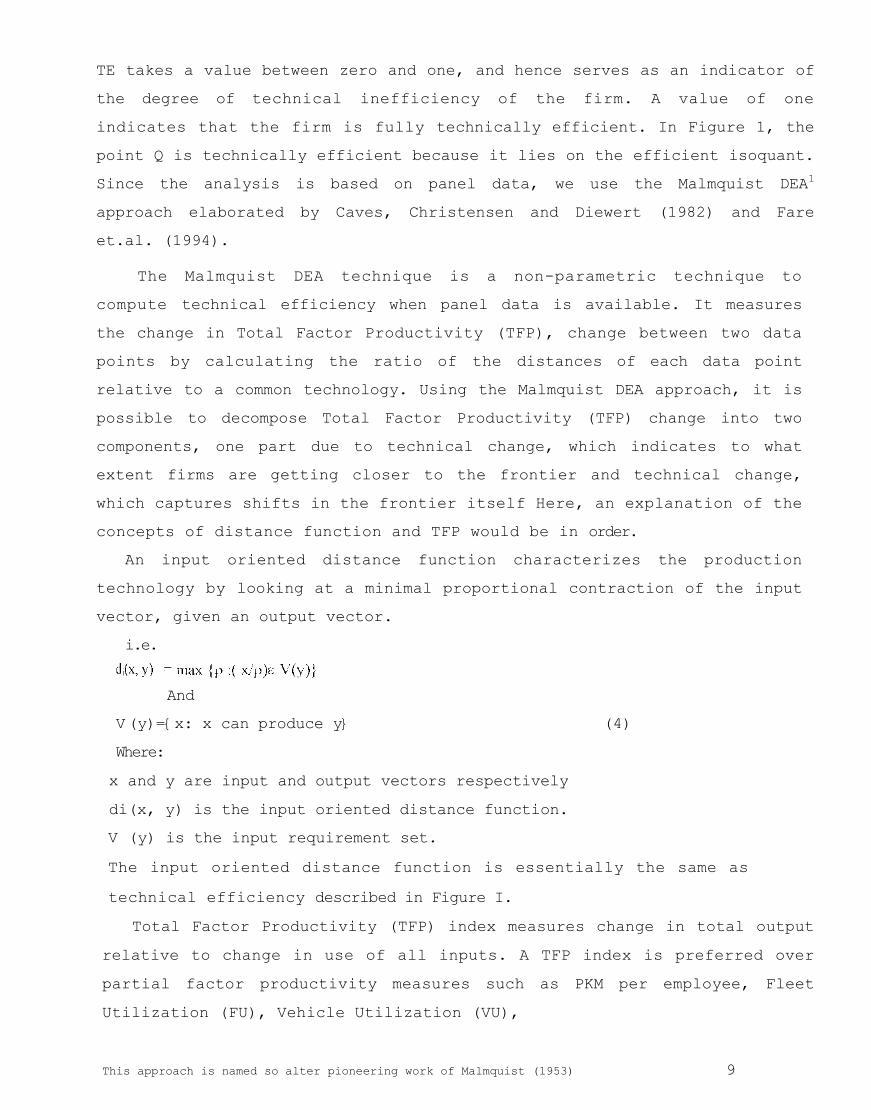
TE takes a value between zero and one, and hence serves as an indicator of the degree of technical inefficiency of the firm. A value of one indicates that the firm is fully technically efficient. In Figure 1, the point Q is technically efficient because it lies on the efficient isoquant. Since the analysis is based on panel data, we use the Malmquist DEA1
approach elaborated by Caves, Christensen and Diewert (1982) and Fare et.al. (1994).
The Malmquist DEA technique is a non-parametric technique to compute technical efficiency when panel data is available. It measures the change in Total Factor Productivity (TFP), change between two data points by calculating the ratio of the distances of each data point relative to a common technology. Using the Malmquist DEA approach, it is possible to decompose Total Factor Productivity (TFP) change into two components, one part due to technical change, which indicates to what extent firms are getting closer to the frontier and technical change, which captures shifts in the frontier itself Here, an explanation of the concepts of distance function and TFP would be in order.
An input oriented distance function characterizes the production technology by looking at a minimal proportional contraction of the input vector, given an output vector.
i.e. (».
And V (y)={x: x can produce y} (4) Where: x and y are input and output vectors respectively di(x, y) is the input oriented distance function. V (y) is the input requirement set. The input oriented distance function is essentially the same as technical efficiency described in Figure I.
Total Factor Productivity (TFP) index measures change in total output relative to change in use of all inputs. A TFP index is preferred over partial factor productivity measures such as PKM per employee, Fleet Utilization (FU), Vehicle Utilization (VU),
This approach is named so alter pioneering work of Malmquist (1953) 9

etc since partial measures are likely to provide a misleading picture of performance . TFP index for two period�s' and't' is defined as:
In TFPst= In (Output index/ Input index) ' (5)
Following Fare et. al. (1994), the Malmquist (input oriented) TFP change between period �s�(the base period) and period 't' (the current period) is given by:
where: ys and yt represent vector of outputs in period s and t respectively xs and xt represent vector of inputs in period s and t respectively
represents the distance from the period 't' observation to the period V technology. A value of m; greater than one will indicate positive TFP growth from period V to period 'f while a value less than one indicates a TFP decline.
An equivalent way of writing the TFP index given in eq.6 is:
(7)
Where the ratio outside the square bracket measures the change in the input oriented measure of technical efficiency between periods V and 't' i.e. the efficiency change is equivalent to the ratio of technical efficiency in period 't' to the technical efficiency in period Y. The remaining part of the equation 7 is a measure of technical change. It is the geometric mean of the shift in technology between two periods, evaluated at ys and also at yt. Thus the terms in equation 7 are:
and
Partial factor productivity indicators are provided in Appendix IIIB. The two periods'(s and t) TFP indices are equivalent only if technology is Hicks input neutral i.e. di (x, y)= A(t)dj(x,y). we take the geometric mean to avoid the necessity to either impose this restriction or arbitrarily choose one of the two indices as done by Caves, Christensen and Diewert (1982)
10

Technical change =
The DEA estimation using Malmquist technique involves estimation of the four distance functions in eq.7 by mathematical programming and subsequently, computation of TFP change using either 6 or 7.
6. FINDINGS FROM THE STUDY 6.1.Effect of Firm Size on Performance As mentioned earlier, effects of changes in firm size were measured by changing the fleet strength incrementally. Thus the degree of responsiveness of long run total costs to changes in fleet, in other words the cost elasticities and hence scale economies were measured for all regions of MSRTC. The values are as reported in Table 4.
Table 4: Cost Elasticities and Scale Economies for Regions of MSRTC (2001-2002)
From the above table, one seriously questions the rationale behind splitting of MSRTC into smaller regions without changing the organisational structure. The simulation exercise indicated that there was still a long way to go for the economies of scale to be fully exploited.
6.2.Analysis of Technical Efficiency and Total Factor Productivity Using the Malmquist DEA technique as outlined above, we computed Technical Efficiency (TE) scores for all the regions of MSRTC for the year 2001-02 and also change in the TE score with reference to the previous year's i.e 2000-01 production frontier. The results are summarized in Table 5 below 11
Region Cost Elasticity(Ec) Scale Economy (1-Ec)
Aurangabad 0.60 0.40 Nashik 0.57 0.43 Nagpur 0.57 0.43 Amravati 0.55 0.45 Mumbai 0.55 0.45 Pune 0.57 0.43
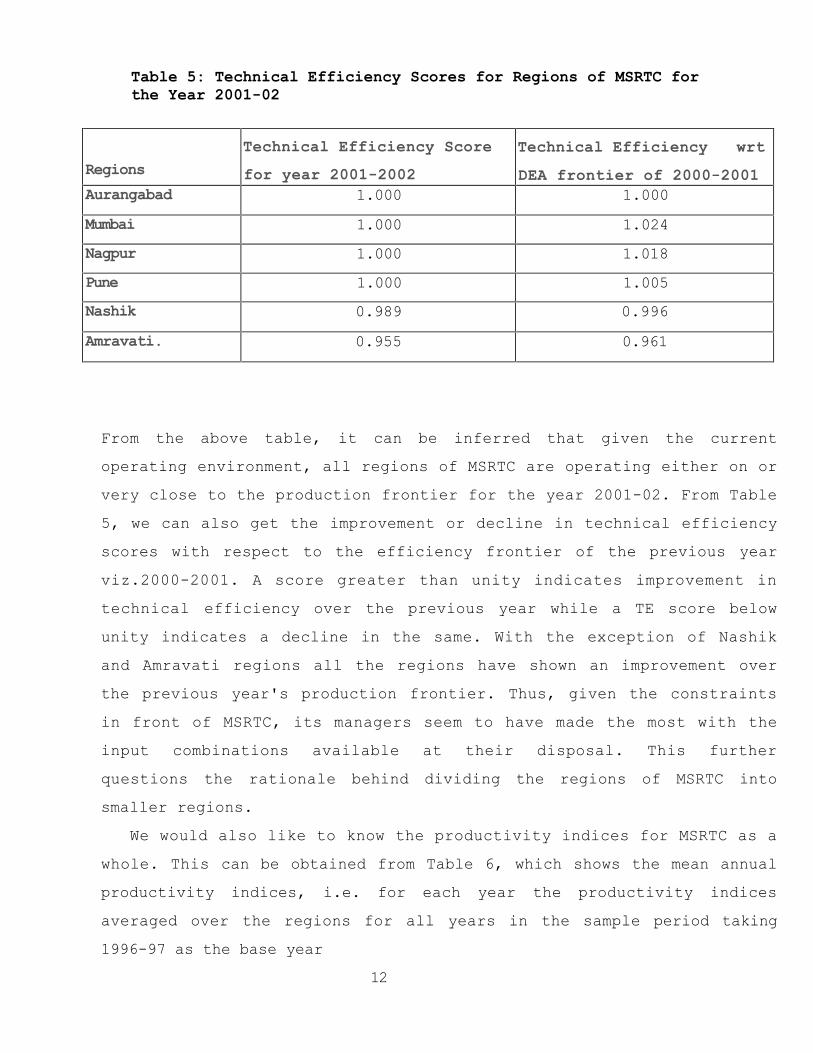
Table 5: Technical Efficiency Scores for Regions of MSRTC for the Year 2001-02
From the above table, it can be inferred that given the current operating environment, all regions of MSRTC are operating either on or very close to the production frontier for the year 2001-02. From Table 5, we can also get the improvement or decline in technical efficiency scores with respect to the efficiency frontier of the previous year viz.2000-2001. A score greater than unity indicates improvement in technical efficiency over the previous year while a TE score below unity indicates a decline in the same. With the exception of Nashik and Amravati regions all the regions have shown an improvement over the previous year's production frontier. Thus, given the constraints in front of MSRTC, its managers seem to have made the most with the input combinations available at their disposal. This further questions the rationale behind dividing the regions of MSRTC into smaller regions.
We would also like to know the productivity indices for MSRTC as a whole. This can be obtained from Table 6, which shows the mean annual productivity indices, i.e. for each year the productivity indices averaged over the regions for all years in the sample period taking 1996-97 as the base year
12
Regions Technical Efficiency Score for year 2001-2002
Technical Efficiency wrt DEA frontier of 2000-2001
Aurangabad 1.000 1.000 Mumbai 1.000 1.024 Nagpur 1.000 1.018 Pune 1.000 1.005 Nashik 0.989 0.996 Amravati. 0.955 0.961

Table 6: Malmquist Productivity Indices for Annual regional Means (Base Year= 1996-97)
From the above table, we can see that from the base year of 1996-97, there has been an improvement in TFP by 1.1%, which can at best be described as marginal. There have been negligible improvements in Technical Efficiency as well as Technical Change. This leads us towards the inference that while managers have made the most of the quality and quantity of inputs at their disposal there has been no effort worth mentioning on the part of the policy makers to enable MSRTC to embrace cost-minimising technology. However, recent trends of adopting fuel-efficient and high technology Volvo buses could be termed as steps in the right direction.
6.3. Potential for Improvement Using Existing Capacity The physical parameters for all regions of MSRTC were analysed. The
purpose behind this was to examine the impact of increase in physical productivity on financial performance. Findings from Region-wise analysis of financial profitability vis-a-vis physical productivity are presented in the sub-sections below: 6.3.1. Aurangabad Region
Aurangabad region of MSRTC has experienced a steep decline in load factor during the sample period, from 72.36% in 1995-96 to around 58% in 2001-02. Based on fare levels of 41 paise 2001-02, the Region was making losses to the extent of Rs
Year Efficiency Change
Technical Change
TFP Change
1996-97 1.000 1.000 1.000 1997-98 0.996 0.937 0.933 1998-99 1.007 0.970 0.977 1999-2000 0.965 1.049 1.013 2000-2001 1.047 0.887 0.929 2001-2002 1.002 1.009 1.011

36 Crores. Restoring the load factor to around 63% and improving the fuel efficiency (indicated by Kilometers Per Litre or KMPL) from the current 4.71 to 5 gives a profit of around Rs 9 Crores. This is quite possible as the region was operating at the recommended load factor during 1999-2000.
6.3.2.Nashik Region Nashik Region too has experienced pronounced decline in load factor during the sample period from 75% in 1995-96 to around 61% in 2001-02. At the 2001-02 fare levels of 43 paise it experienced losses worth 37 crores. It was observed that a gradual increase in load factors to 66%, along with improvements in KMPL and vehicle utilisation from their 2001-02 levels to 5 and 314 kms respectively could financially turn around the region keeping the real fares fixed at 2001-02 levels. 6.3.3.Nagpur Region Nagpur region shows encouraging results as far as physical parameters are concerned. It has a high KMPL of 5.35 in 2001-02. It has also been subject to falling load factors.We can see that improving load factors to 62% keeping other factors at fixed levels results in financial profits for Nagpur region. 6.3.4.Amravati Region Like Nagpur Region, the physical parameters of Amravati region seem to reflect good maintenance practices. However, what seems to be a matter of grave concern is a decline in load factors during the last four years. Even though the analysis shows that a load factor of around 69% could turn around the region financially, this is easier said than done. Thus urgent measures have to be taken to revitalise demand in this region. 6.3.5. Mumbai Region The Mumbai region of MSRTC consists of many high-density corridors of the corporation and hence is subject to intense competition. To its credit, the region has managed to retain a relatively high load factor of 65%. This is again a region that requires immediate attention to stimulate demand, as it should be expected to generate high revenue. It is observed that at the 2001-02 fare levels, it is making a loss of around 35 crores. From the simulation exercise it is discovered that improving

vehicle utilisation from the current 300.8 km to 310 km, raising the load factor to 68% and improving KMPL from the current level of 4.28 to around 4.9 could see the region turn around financially. Another point to note with regards Mumbai is the relatively high percentage of dead kilometres (1.46%). Perhaps, relocation of depots and terminals, which again is not an easy task in a city like Mumbai, could address this issue.
6.3.6. Pune Region Pune Region again has some high-density corridors of MSRTC. In 2001-02, the region made a financial loss of Rs.46 crores. Our analysis reveals that improvement in Vehicle utilisation to 310 km from the current 300 km, load factor from 61.33% to 66% and KMPL marginally from 4.78 to 4.85 makes the region financially profitable. Like Mumbai, Pune region too could find ways and means to reduce its dead kilometre percentage.
7. POLICY RECOMMENDATIONS: Based on the findings of our study and an understanding of the overall
working of MSRTC, the following recommendations can be made for improved physical and financial performance of MSRTC:
� From the empirical analysis, one notices increasing returns to scale prevailing in all the six regions of MSRTC.This presence of long run economies of scale may also have vary important policy implications. Further, the regions seem to make optimal use of their inputs. The review of the operational parameters for MSRTC reveals that the main problems facing this organization are falling load factor, deteriorating quality of service due inadequate replacement of fleet, customer dissatisfaction and losses due to non-adoption of cost-minimising techniques.
� MSRTC would do well not to blindly follow the successful decentralization exercise followed by KnSRTC. After 1996-97, KnSRTC was divided into four smaller organisations viz. NWKnSRTC, NEKnSRTC, BMTC and KnSRTC4, which remained the apex body. It must be understood that the main reason for success of KnSRTC's success was a favourable control-mechanism between
� See glossary for expansion of these acronyms

KnSRTC and the Karnataka state government. The state Government drastically reduced KnSRTC's tax rates and more importantly, did not obstruct their reforms aimed at ensuring greater transparency and efficiency right from the depot, level. The labour unions were cleverly managed and the organisations went in for outsourcing of non-core activities. This was particularly true for BMTC, which not only outsourced buses, but also officials' personal drivers, security, and the like, thereby drastically reducing personnel costs. Unless MSRTC is able to undertake an exercise similar to this, any attempt at simply creating smaller regions from the existing regions is bound to end in futility as far as enhanced financial performance is concerned.
� In fact our simulation exercise shows that the situation may not be as alarming as it appears. All that regions of MSRTC have to do is to concentrate on improving load factors and restoring the same to their 1999-2000 levels. This may not be too difficult an exercise as what is mainly required is effective demand management in the form of good routing and scheduling policies, providing a variety of services to the passengers and improving conditions of bus terminals many of which are indeed in a pathetic state.Effective branding of services as done by KnSRTC's corporations would also be a step in the right direction. Though on paper these measures appear as straightforward management challenges, for some strange reason, there seems to be very little will, both from the policy makers as well as on the part of managers of MSRTC to actually try out new things. Unless this problem is treated as an emergency and dealt with at the earliest, any restructuring exercise will, at best, have only cosmetic appeal.
� As depots are real operating units, greater involvement in policy-making at the depot level will show better results, as proved by Rajasthan's experience.In case of RSRTC which too had a highly centralised organisational structure earlier, there was progressive improvement in physical parameters when reorganization was introduced in 1990.There was devolution of power to depot level and to inculcate competition across depots, each depot was designated as a 'profit centre' and incentives were given for successful achievements of the physical and financial targets set for the depots.Due to this novel scheme, the performance of
RSRTC improved substantially. We believe this kind of reorganisation is urgently required for MSRTC.
� There should be greater flexibility in pricing for MSRTC Having a uniform fare structure throughout the organisation may not be a very wise move.As commonly perceived, it may not even be equitable. MSRTC should carefully study the demand pattern for its services and price them accordingly. For instance, it could have differential pricing for diurnal and nocturnal services, seasonal pricing mechanism,etc.This kind of pricing mechanism could lead to welfare maximisation at the same time proving to be financially viable or in other words, comply with the requirement of Ramsey pricing mechanism.
� MSRTC should follow Automatic Fare Revision mechanism. The prices of few key inputs should be monitored and changes in their prices should automatically be fed into fares. This would be preferred to keeping fare levels fixed for three to four years and then following the same with a steep fare hike which could lead to erosion of passenger traffic. Such a mechanism needs to be worked out in detail.
� The simulation exercise undertaken by us could be treated as a preliminary attempt to evolve guidelines and norms for providing financial assistance to regions and depots of RTCs. If a region, division or a depot depending on the level of disaggregation is found to be operating at optimal levels as far as some key physical parameters are concerned and yet makes financial losses, then the region should be considered eligible for receiving financial assistance.
� The regions are affected by falling load factor but at the same time possess economies of scale. So in view of the rising demand for passenger road transport services, the option of hiring buses from private operators can be given a serious thought. The augmentation of fleet through hiring buses from the private bus operators would help the regions consolidate their positions by exploiting the economies of scale.A carefully designed incentive scheme for the private operators is needed for success of such a scheme as adopted by UPSRTC and KNSRTC in the recent period.
� Some regions of MSRTC would do well to improve their fuel efficiency. It has been shown particularly in APSRTC that apart from technical factors, even
� 17

sensitising staff and crew regarding adoption of good operating, maintenance and driving practises could lead to improvements in fuel and oil economy. To conclude, a step to restructure the present organisational structure of MSRTC will be fruitful if and only if such a step is followed by effective demand management, autonomy in pricing policy, adoption of cost effective technology and devolution of power to the divisions and depots so as to make MSRTC financially viable and serve the cause effectively i.e. to provide an efficient, adequate, economical and properly co-coordinated transport service for which it was established.
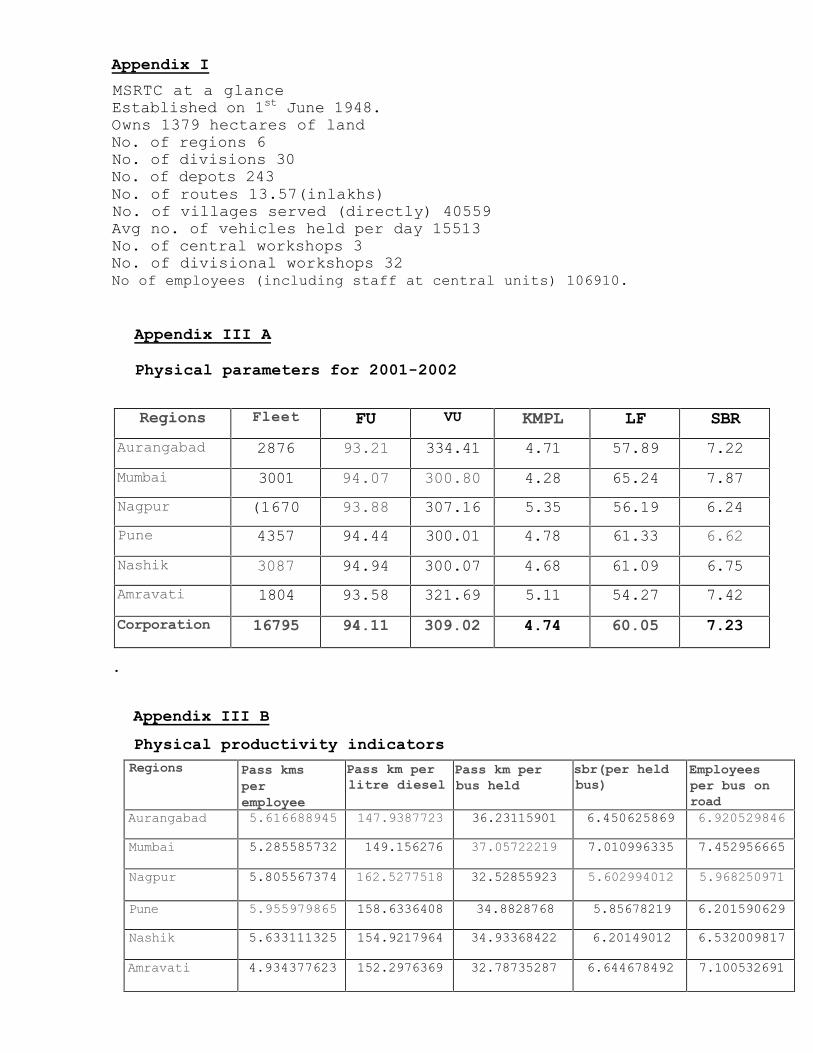
Appendix I MSRTC at a glance Established on 1st June 1948. Owns 1379 hectares of land No. of regions 6 No. of divisions 30 No. of depots 243 No. of routes 13.57(inlakhs) No. of villages served (directly) 40559 Avg no. of vehicles held per day 15513 No. of central workshops 3 No. of divisional workshops 32 No of employees (including staff at central units) 106910.
Appendix III A
Physical parameters for 2001-2002
.
Appendix III B Physical productivity indicators
Regions Fleet FU VU KMPL LF SBR Aurangabad 2876 93.21 334.41 4.71 57.89 7.22 Mumbai 3001 94.07 300.80 4.28 65.24 7.87 Nagpur (1670 93.88 307.16 5.35 56.19 6.24 Pune 4357 94.44 300.01 4.78 61.33 6.62 Nashik 3087 94.94 300.07 4.68 61.09 6.75 Amravati 1804 93.58 321.69 5.11 54.27 7.42 Corporation 16795 94.11 309.02 4.74 60.05 7.23
Regions Pass kms per employee
Pass km per litre diesel
Pass km per bus held
sbr(per held bus)
Employees per bus on road
Aurangabad 5.616688945 147.9387723 36.23115901 6.450625869 6.920529846
Mumbai 5.285585732 149.156276 37.05722219 7.010996335 7.452956665
Nagpur 5.805567374 162.5277518 32.52855923 5.602994012 5.968250971
Pune 5.955979865 158.6336408 34.8828768 5.85678219 6.201590629
Nashik 5.633111325 154.9217964 34.93368422 6.20149012 6.532009817
Amravati 4.934377623 152.2976369 32.78735287 6.644678492 7.100532691

dddd
Base Year Figures Actuals Estimates Actuals REVENUES Estimates Actuals Buses Held 4314 Buses on Road 4030.1388 4030.1388 Traffic Rev.(Rs.lakhs) 52605.3304 52088.849 %fleet 25.80606578 Fleet Utilisn.(%) 93.42 Effe(Bus)_Kms. 4371.519767 4328.6 Tr. Rev/buskm(paise) 1203.36481 1203.364806 Vehicle Utilisn.(Kms.) 297.18 Dead Kms. 44.58950163 44.15 Ntraff. Rev.(Rs.lakhs) 976.66 976.66 KMPL 4.79 Gross Kms. 4416.109269 4372.75 Total Rev.(Rs.lakhs) 53581.99037 53065.509 Load Factor (%) 65 Diesel Consmn. 92194.34799 92350.107 Tot. Rev/buskm(pse) 1225.7062236 1225.92776 Dead Km. 1.02 Pass. Kms. 150996.6643 149514.1726 COSTS Av.Fare (Rs.) 0.348387368 Pers.Cost(Rs.lakh) 17100.456 17100.456 Diesel Rate (Rs.} 14.4 Diesel Cost(Rs.lakh) 13275.98611 14415.767 Diesel Wkshp. Ot.Mat.Cost(Rs.lakh) 2739.047081 2712.155 Capacity 53.14 Pass.Tax (Rs.lakh) 8087.279252 8007.878 Av.Wage/emp(Rs.) 59518.6842 Misc.Taxes(Rs.lakh) 2826.6 2826.6 Staff Strength 28731.24 Misc.(Rs.lakhs) 101.02 101.022 St.Govt.Cont.(Rs.cr) Tot.Var.Cost(Rs.lakh) 44130.38844 45163.878 %loans 136772148.1 3197.4 Cent.Gov.Con(Rs,cr). Pass.Tax Rate 15.37349769 lnterest(Rs.lakhs) 235.658411 interest on others 0 Av.Wt.fare (paise) 34.8387368 Oth.Mat.Rate 5.206786197 Depr.(Rs.lakhs) 5026.456 depr per bus 124815.6 deprtot(est)) 5030.24192 Staff/Bus Ratio 6.66 MVtaxperbus(Rs.) 1084.677793 MV Tax (Rs.lakhs) 467.93 467.93 O.Taxbuses(Rs.lakh) 0 cost rec ratio actual 0.98532828 ToT.Fix.Cost(Rs.lakh) 5733.83034 8691.786 cost rec ratio estimated 1.074557903 Total Costs(Rs.lakhs) 49864.2188 53855.664 V.Cost/bkm(paise) 1009.49763 1043.383034 F.Cost/bkm(paise) 131.1633171 200.7990112 Var. cost/Tot. Cost(%) 88.5011127 83.86096215 T. Cost/bkm(paise) 1140.660947 1244.182045 Fix.Cost/Tot.cost(%) 11.4988873 16.13903785 Pr/lo onTr.Rev(rslakh) 2741.111595 -1766.815 Pr/loonTotRev(rslakh) 3717.771595 -790.155 P/lon Trrev/bkm(pse) 62.7038591 -40.817239 P/lonTorev/bkm(pse) 85.04528844 -18.2542855 Cost/pass.km. 0.33023391 0.360204408 Breakeven fare
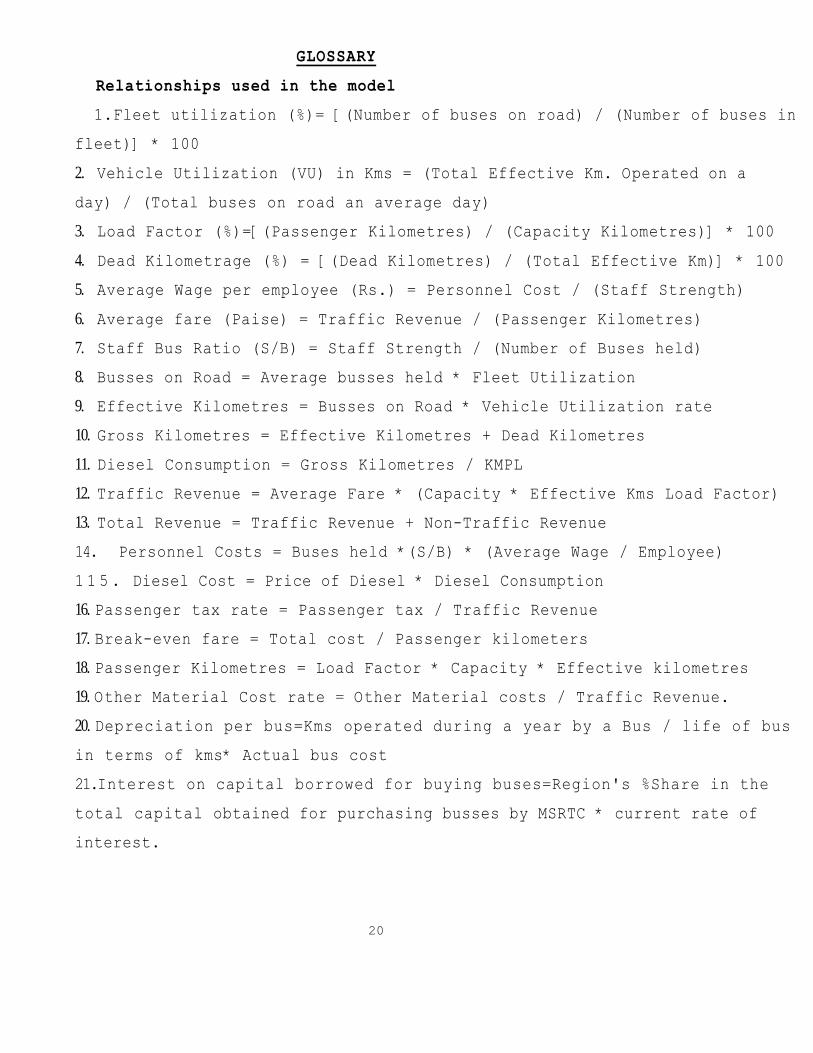
GLOSSARY Relationships used in the model
1.Fleet utilization (%)= [(Number of buses on road) / (Number of buses in fleet)] * 100 2. Vehicle Utilization (VU) in Kms = (Total Effective Km. Operated on a day) / (Total buses on road an average day) 3. Load Factor (%)=[(Passenger Kilometres) / (Capacity Kilometres)] * 100 4. Dead Kilometrage (%) = [(Dead Kilometres) / (Total Effective Km)] * 100 5. Average Wage per employee (Rs.) = Personnel Cost / (Staff Strength) 6. Average fare (Paise) = Traffic Revenue / (Passenger Kilometres) 7. Staff Bus Ratio (S/B) = Staff Strength / (Number of Buses held) 8. Busses on Road = Average busses held * Fleet Utilization 9. Effective Kilometres = Busses on Road * Vehicle Utilization rate 10. Gross Kilometres = Effective Kilometres + Dead Kilometres 11. Diesel Consumption = Gross Kilometres / KMPL 12. Traffic Revenue = Average Fare * (Capacity * Effective Kms Load Factor) 13. Total Revenue = Traffic Revenue + Non-Traffic Revenue 14. Personnel Costs = Buses held *(S/B) * (Average Wage / Employee) 1 1 5 . Diesel Cost = Price of Diesel * Diesel Consumption 16. Passenger tax rate = Passenger tax / Traffic Revenue 17. Break-even fare = Total cost / Passenger kilometers 18. Passenger Kilometres = Load Factor * Capacity * Effective kilometres 19. Other Material Cost rate = Other Material costs / Traffic Revenue. 20. Depreciation per bus=Kms operated during a year by a Bus / life of bus in terms of kms* Actual bus cost 21.Interest on capital borrowed for buying buses=Region's %Share in the total capital obtained for purchasing busses by MSRTC * current rate of interest.
20
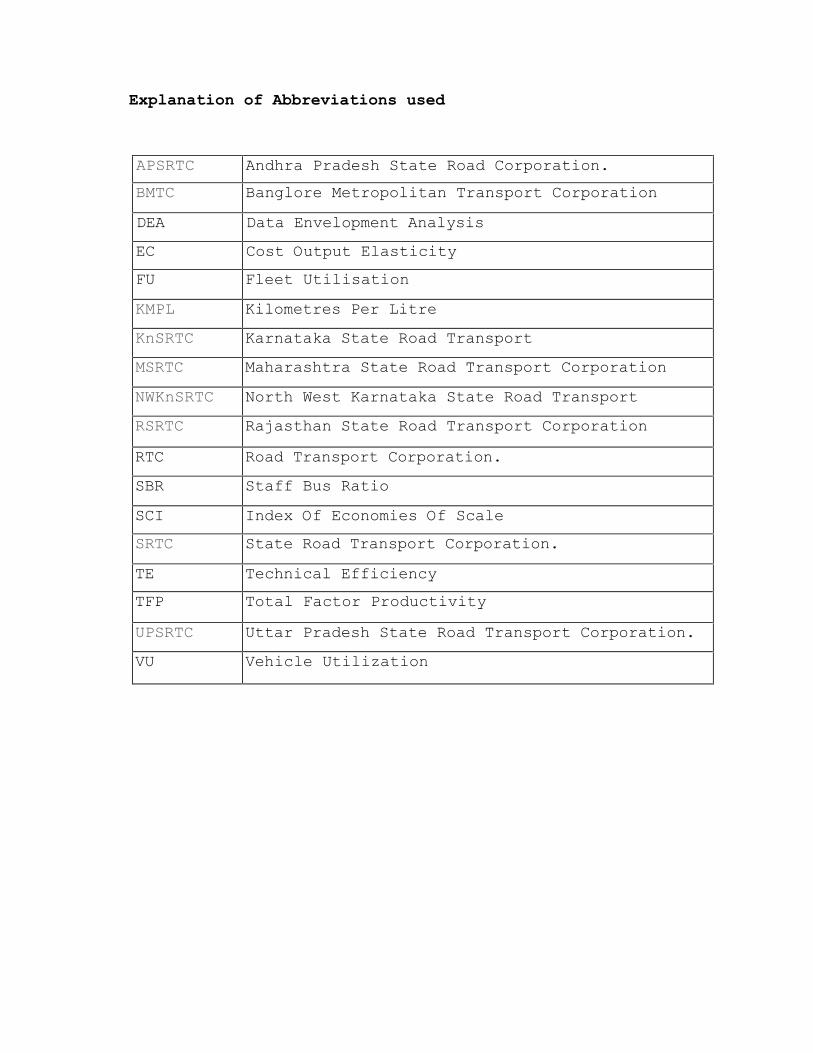
Explanation of Abbreviations used
APSRTC Andhra Pradesh State Road Corporation. BMTC Banglore Metropolitan Transport Corporation DEA Data Envelopment Analysis EC Cost Output Elasticity FU Fleet Utilisation KMPL Kilometres Per Litre KnSRTC Karnataka State Road Transport MSRTC Maharashtra State Road Transport Corporation NWKnSRTC North West Karnataka State Road Transport RSRTC Rajasthan State Road Transport Corporation RTC Road Transport Corporation. SBR Staff Bus Ratio SCI Index Of Economies Of Scale SRTC State Road Transport Corporation. TE Technical Efficiency TFP Total Factor Productivity UPSRTC Uttar Pradesh State Road Transport Corporation. VU Vehicle Utilization
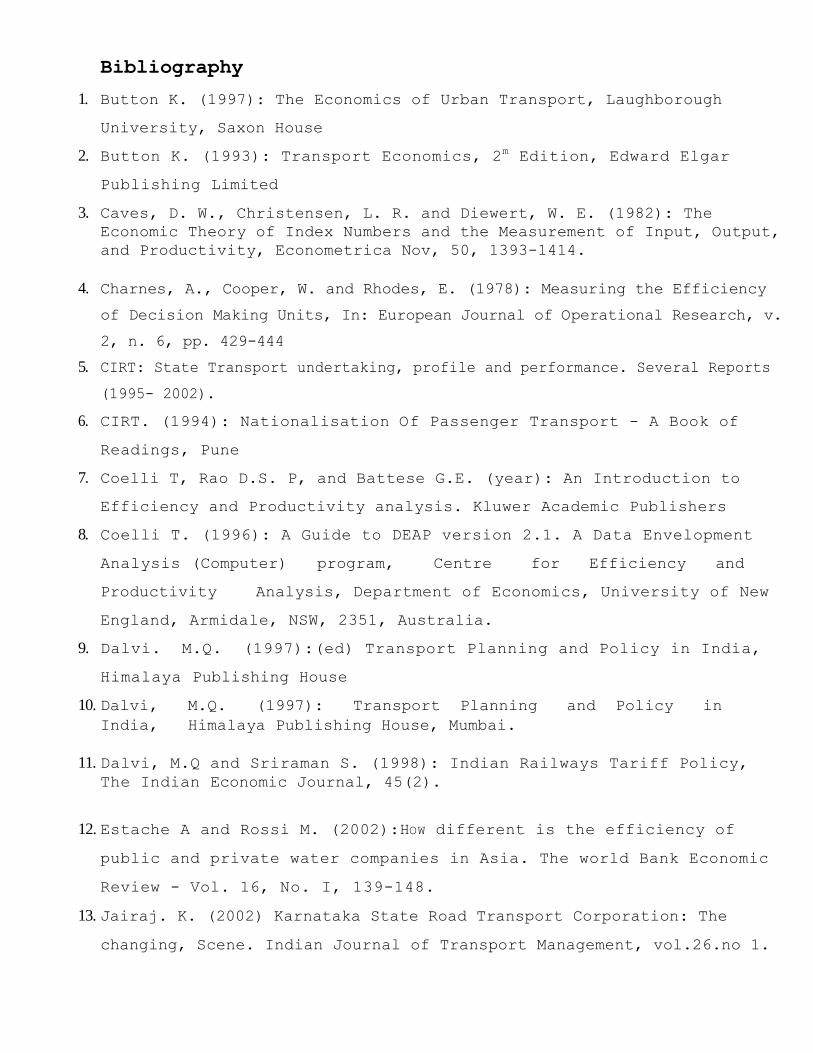
Bibliography 1. Button K. (1997): The Economics of Urban Transport, Laughborough
University, Saxon House 2. Button K. (1993): Transport Economics, 2m Edition, Edward Elgar
Publishing Limited 3. Caves, D. W., Christensen, L. R. and Diewert, W. E. (1982): The
Economic Theory of Index Numbers and the Measurement of Input, Output, and Productivity, Econometrica Nov, 50, 1393-1414.
4. Charnes, A., Cooper, W. and Rhodes, E. (1978): Measuring the Efficiency of Decision Making Units, In: European Journal of Operational Research, v. 2, n. 6, pp. 429-444
5. CIRT: State Transport undertaking, profile and performance. Several Reports (1995- 2002).
6. CIRT. (1994): Nationalisation Of Passenger Transport - A Book of Readings, Pune
7. Coelli T, Rao D.S. P, and Battese G.E. (year): An Introduction to Efficiency and Productivity analysis. Kluwer Academic Publishers
8. Coelli T. (1996): A Guide to DEAP version 2.1. A Data Envelopment Analysis (Computer) program, Centre for Efficiency and Productivity Analysis, Department of Economics, University of New England, Armidale, NSW, 2351, Australia.
9. Dalvi. M.Q. (1997):(ed) Transport Planning and Policy in India, Himalaya Publishing House
10. Dalvi, M.Q. (1997): Transport Planning and Policy in India, Himalaya Publishing House, Mumbai.
11. Dalvi, M.Q and Sriraman S. (1998): Indian Railways Tariff Policy, The Indian Economic Journal, 45(2).
12. Estache A and Rossi M. (2002):HOW different is the efficiency of public and private water companies in Asia. The world Bank Economic Review - Vol. 16, No. I, 139-148.
13. Jairaj. K. (2002) Karnataka State Road Transport Corporation: The changing, Scene. Indian Journal of Transport Management, vol.26.no 1.

14. Kilam R. (2000): Institution building for Public transportation System: Financial Perspective. Indian Journal of Transport Management Vol 24,1-6 15. Martin S. (year): Industrial Economics, Economic Analysis And Public policy, I Macmillan Publishing Company. 16. Misra A. (2000): Fleet Augmentation in STUs A strategic Alternative Vol. 24, no.4, April 2000, IJTM, 17. Padam S. (1990): Bus Transport- in India,Ajanta Publication 18. Pindyck R. S. and Rubenfield D. L. (2003): Micro Economics, 5th edition Prentice I Hall India New Delhi 19. Singh S. K. (2001): Economics of Density, Economics and Relative Efficiency: A I case Study of STUs. Working paper 2, Centre for Trans Policy and Economics,C1RT 20. Sriraman S. (1999): State Transport Corporations In India. Final Report I submitted to The Eleventh Finance Commmission, Government of India. 21. Turnbull P. (1998): Regulation, Deregulation or Re-regulation of Transport. Discussion Paper No. 4. Symposium on the Social and Urban Consequences of Technical Development, Deregulation and privatisation of transport.