analyzing water resources in a monsoon-driven … · paul d. wagner hydrogeography and climatology...
TRANSCRIPT

Paul D. Wagner Hydrogeography and Climatology Research Group2010 International SWAT Conference, Seoul5. August 2010
University of CologneInstitute of Geography
Analyzing water resources in a monsoon-driven environment –
an example from the Indian Western Ghats
Paul D. Wagner1, Shamita Kumar2, Peter Fiener1 and Karl Schneider1
1 Hydrogeography and Climatology Research Group, Institute of Geography, University of Cologne, Germany2 Institute of Environment Education & Research, Bharati Vidyapeeth University, Pune, India
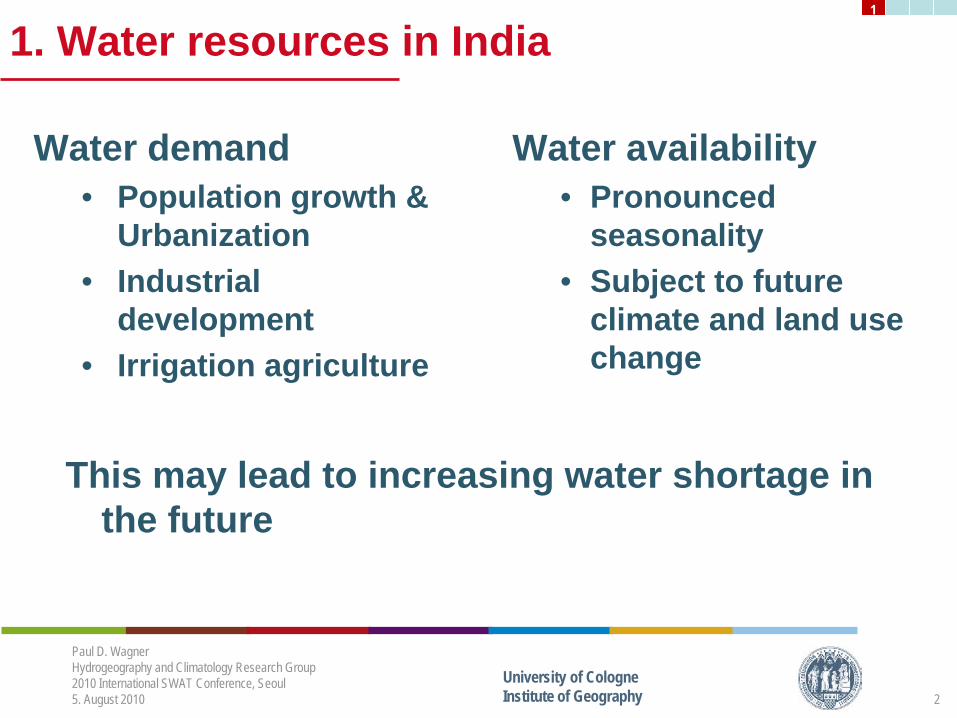
1. Water resources in India
Water availability• Pronounced
seasonality• Subject to future
climate and land usechange
Paul D. Wagner Hydrogeography and Climatology Research Group 2010 International SWAT Conference, Seoul5. August 2010
University of CologneInstitute of Geography
Water demand• Population growth &
Urbanization• Industrial
development• Irrigation agriculture
This may lead to increasing water shortage in the future
2
1
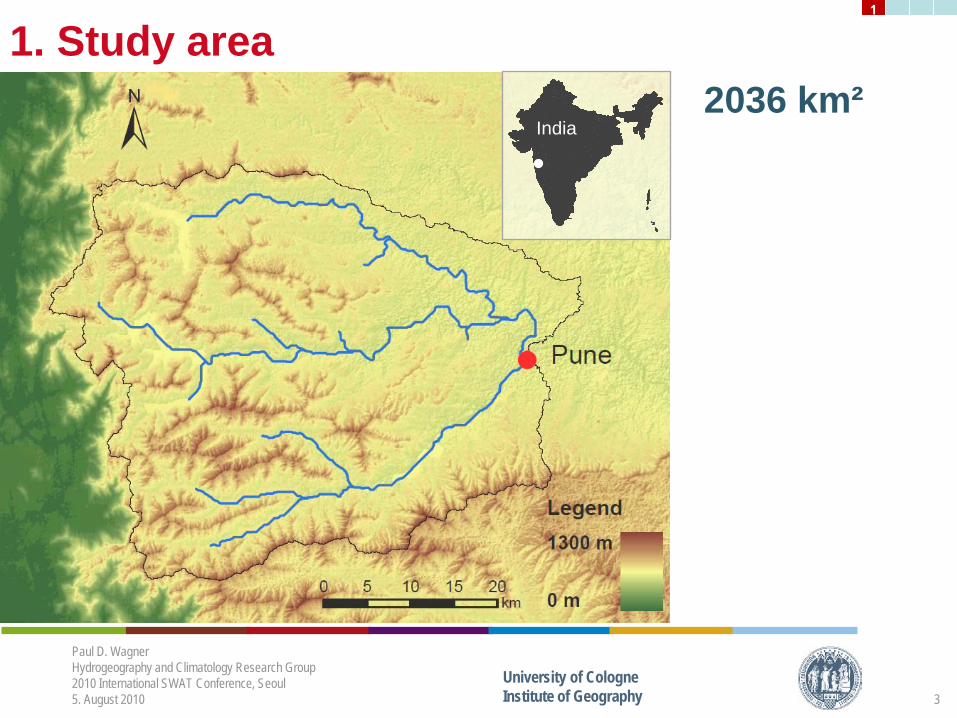
1. Study area
Paul D. Wagner Hydrogeography and Climatology Research Group 2010 International SWAT Conference, Seoul5. August 2010
University of CologneInstitute of Geography
2036 km²
3
India
1

India
1. Study area
Paul D. Wagner Hydrogeography and Climatology Research Group 2010 International SWAT Conference, Seoul5. August 2010
University of CologneInstitute of Geography
• Population growth & Urbanization
• Industrial development
• Irrigation agriculture
• Pronouncedseasonality ofrainfall
2036 km²
4
1

India
1. Study area
Paul D. Wagner Hydrogeography and Climatology Research Group 2010 International SWAT Conference, Seoul5. August 2010
University of CologneInstitute of Geography
• Population growth & Urbanization
• Industrial development
• Irrigation agriculture
• Pronouncedseasonality ofrainfall
2036 km²
5
1
India
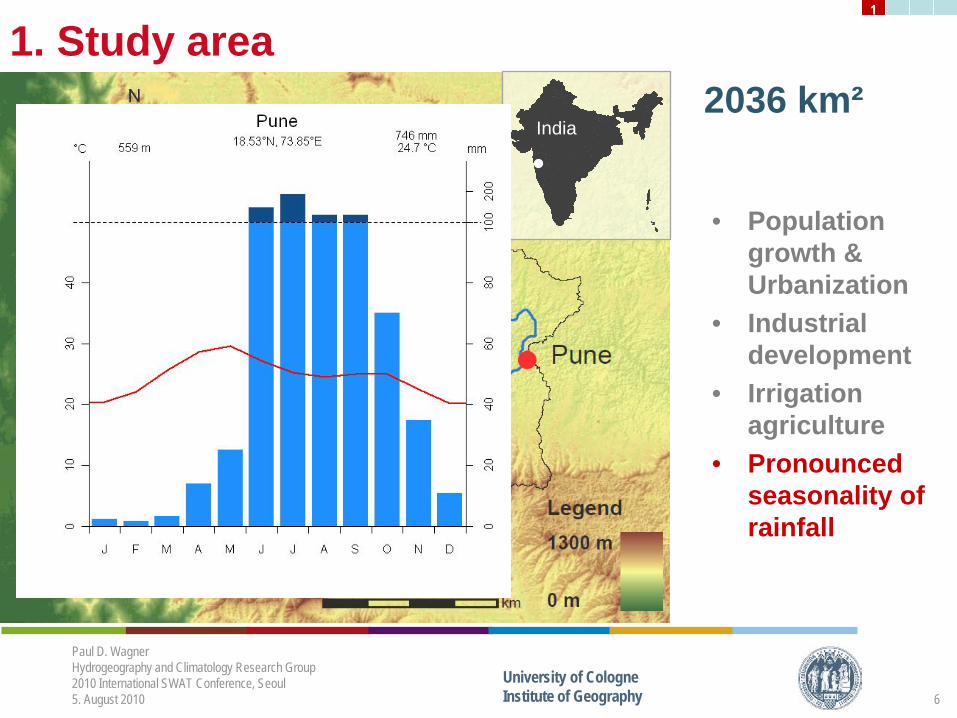
1. Study area
Paul D. Wagner Hydrogeography and Climatology Research Group 2010 International SWAT Conference, Seoul5. August 2010
University of CologneInstitute of Geography
• Population growth & Urbanization
• Industrial development
• Irrigation agriculture
• Pronouncedseasonality ofrainfall
2036 km²
6
1

2. Materials and Methods
Assessment of impacts of land use change on evapotranspiration
Methodology• 2 models based on a general (GEN) and a
current (CUR) land use map• Use of freely available data from international
archives and remote sensing• Utilization of SWAT (2005) with default values
where possiblePaul D. Wagner Hydrogeography and Climatology Research Group 2010 International SWAT Conference, Seoul5. August 2010
University of CologneInstitute of Geography 7
2

2. DEM and soil map
Paul D. Wagner Hydrogeography and Climatology Research Group 2010 International SWAT Conference, Seoul5. August 2010
University of CologneInstitute of Geography
FAO soil map of the world• 2 soil types• Parameters adapted
from Immerzeel et al 2008
Sandy clay loam
Clay
ASTER DEM• 30 m resolution• Corrected for water
surfaces
8
2

2. Land use maps
Paul D. Wagner Hydrogeography and Climatology Research Group 2010 International SWAT Conference, Seoul5. August 2010
University of CologneInstitute of Geography
CUR: derived from LISS-III data
GEN: data adapted fromHansen et al. 1998
9
2

2. Weather data
Paul D. Wagner Hydrogeography and Climatology Research Group 2010 International SWAT Conference, Seoul5. August 2010
University of CologneInstitute of Geography
Daily rainfall data interpolatedfrom 4 stations using
• Linear trend of elevationand mean daily rainfall
• Inverse distance weightingfor daily residuals
All other parameters used fromPune weather station, sub-basin specific adjustment of• Temperature values
(using elevation)• Relative humidity (using
temperature)
10
2

2. Model setup
• 18 sub-basins, 3 slope classes• 250 HRUs (GEN) and 610 HRUs (CUR)• Crop rotation for the two main seasons (Kharif and
Rabi season)• Heat units adjusted to growing periods of local crops• Irrigation from reaches, triggered by plant water
demand• No representation of man-made structures like
reservoirs and canals• No model calibration• Simulation period 2000 – 2007, 7 years used for
analysisPaul D. Wagner Hydrogeography and Climatology Research Group 2010 International SWAT Conference, Seoul5. August 2010
University of CologneInstitute of Geography 11
2

3. Model performance
Runoff Coefficients (Q/P)• GEN 0.61• CUR 0.63• Reference: Upper Krishna 0.68
Paul D. Wagner Hydrogeography and Climatology Research Group 2010 International SWAT Conference, Seoul5. August 2010
University of CologneInstitute of Geography 12
3
LAI
LAI development of rice-wheat rotationCrop year 2004/05
Development of leaf area index (LAI)• Rainy season: reasonable• Dry season:
• discontinuous, due to water and temperature stress or• too low, due to dormancy (forests)

3. Land use comparison
• Difference in cropland (+ 7.6 %)• Difference in urban land (+ 8.8 %) • Difference of semi-natural vegetation (- 15.2 %)• Results in part linked to land use change and to
different level of detail of the two land use maps
Paul D. Wagner Hydrogeography and Climatology Research Group 2010 International SWAT Conference, Seoul5. August 2010
University of CologneInstitute of Geography
Land use General CurrentForest 8.5 % 20.6 %Shrubland 74.8 % 26.6 %Grassland 1.9 % 22.8 %Water 6.9 % 5.8 %Mixed Cropland 3.6 % 11.2 %Urban 4.3 % 13.1 %
13
3

3. Impact of land use changes on ET
• No eminent differences on the catchmentscale
• Land use specific differences of ET rates
Paul D. Wagner Hydrogeography and Climatology Research Group 2010 International SWAT Conference, Seoul5. August 2010
University of CologneInstitute of Geography 14
3

0
20
40
60
80
100
120
140
JUN JUL AUG SEP OCT NOV DEC JAN FEB MAR APR MAY
ET [mm]
Grassland Mixed Cropland Rice-Wheat Rotation
3. Grassland -> Cropland (+ 7.6 %)
Paul D. Wagner Hydrogeography and Climatology Research Group 2010 International SWAT Conference, Seoul5. August 2010
University of CologneInstitute of Geography
Monthly land use specific ET rates for the crop year 2004/05 (CUR model)
kharif season rabi season
15
3

3. Grassland -> Urban land (+ 8.8 %)
Paul D. Wagner Hydrogeography and Climatology Research Group 2010 International SWAT Conference, Seoul5. August 2010
University of CologneInstitute of Geography
0
20
40
60
80
100
120
140
JUN JUL AUG SEP OCT NOV DEC JAN FEB MAR APR MAY
ET [mm]
Urban land Grassland
Monthly land use specific ET rates for the crop year 2004/05 (CUR model)
kharif season rabi season
16
3

3. Impact of land use change on ET
Paul D. Wagner Hydrogeography and Climatology Research Group 2010 International SWAT Conference, Seoul5. August 2010
University of CologneInstitute of Geography
• Difference in cropland (+ 7.6 %) -> higher ET• Difference in urban land (+ 8.8 %) -> lower ET• Compensatory effects on the catchment scale• High water demand from irrigated cropland
during dry (rabi) season• Sugarcane shows the highest ET rates
17
3
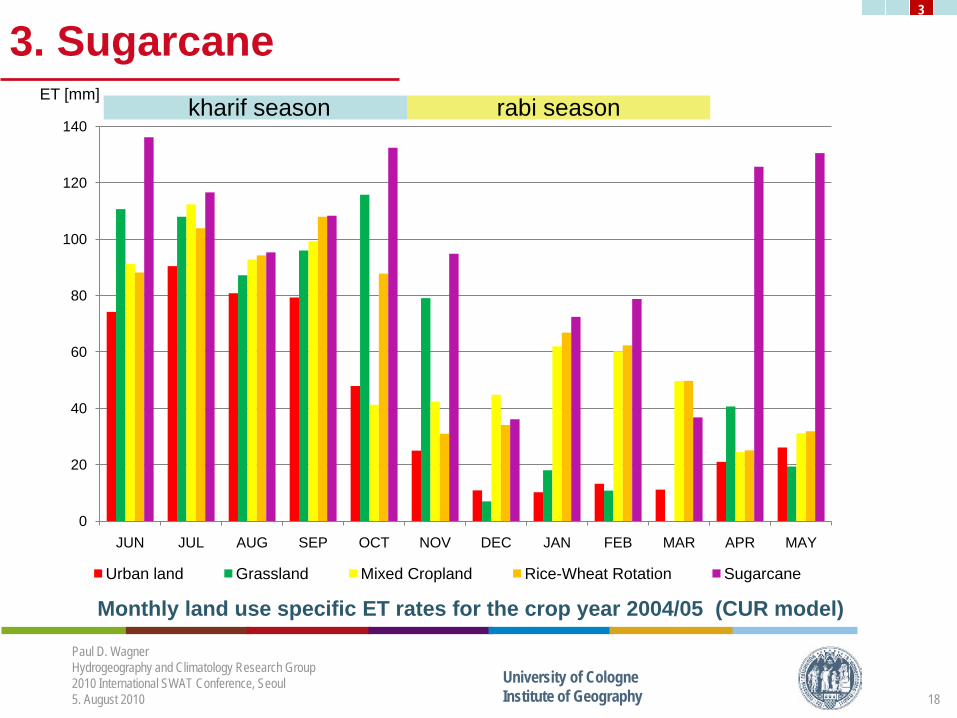
3. Sugarcane
Paul D. Wagner Hydrogeography and Climatology Research Group 2010 International SWAT Conference, Seoul5. August 2010
University of CologneInstitute of Geography
0
20
40
60
80
100
120
140
JUN JUL AUG SEP OCT NOV DEC JAN FEB MAR APR MAY
ET [mm]
Urban land Grassland Mixed Cropland Rice-Wheat Rotation Sugarcane
Monthly land use specific ET rates for the crop year 2004/05 (CUR model)
kharif season rabi season
18
3

3. Impact of land use change on ET
Paul D. Wagner Hydrogeography and Climatology Research Group 2010 International SWAT Conference, Seoul5. August 2010
University of CologneInstitute of Geography
• Difference in cropland (+ 7.6 %) -> higher ET• Difference in urban land (+ 8.8 %) -> lower ET• Compensatory effects on the catchment scale• High water demand of irrigated cropland during
dry (rabi) season• Sugarcane shows the highest ET rates, but
covers only 0.8 % of the study area
19
3

4. Conclusion
Impact of land use changes on ET• No impact on the catchment scale due to
compensatory effects of ET from different landuses
• Possible impact on the sub-catchment scale
High water demand of crops during dry season• High ET rates from croplands• Particularly sugarcane (downstream cultivation)
Paul D. Wagner Hydrogeography and Climatology Research Group 2010 International SWAT Conference, Seoul5. August 2010
University of CologneInstitute of Geography 20
4
4. Conclusion
Land use changes• Increase of urban land is the only reliable
observed land use change• Higher percentage of cropland possibly
results from higher level of detail
High resolution data is needed forfurther investigation
Paul D. Wagner Hydrogeography and Climatology Research Group 2010 International SWAT Conference, Seoul5. August 2010
University of CologneInstitute of Geography 21
4
4. Future work
• Derivation of detailed land use maps fromhistorical satellite scenes
• Derivation of crop rotations from multi-temporal satellite data
• Shift or deactivation of dormancy periodin SWAT
• More accurate representation of soil andgroundwater parameters by model calibration
• Implementation of reservoirs
Paul D. Wagner Hydrogeography and Climatology Research Group 2010 International SWAT Conference, Seoul5. August 2010
University of CologneInstitute of Geography 22
4

Thank you very much for your attention!
Questions welcome…
Paul D. Wagner Hydrogeography and Climatology Research Group 2010 International SWAT Conference, Seoul5. August 2010
University of CologneInstitute of Geography
We gratefully acknowledge support by a grant from theGerman National Academic Foundation.
We would like to thank IMD Pune, GroundwaterDepartment Pune, Department of Agriculture Pune,NRSC Hyderabad and USGS for supplying environmentaldata, good cooperation and discussions.