analyzing the ability of modified yeast to ferment xylose to
TRANSCRIPT
DDB 1111
Analyzing the Ability of Modified Yeast to
Ferment Xylose to Ethanol
An attempt to increase the ethanol yield from the fermentation of
pentoses for the purposes of fuel use.
A Major Qualifying Project submitted to the faculty of Worcester Polytechnic Institute in partial fulfillment of the requirements for the Degree of Bachelor of Science
Submitted by: Stephanie Carcieri Elizabeth Clardy Neda Seher Zahid Submitted to: Project Advisor: Prof. David Dibiasio
April 27, 2010
i
Abstract Ethanol fermented from biomass is a significant alternative fuel source, but the current process
of fermenting corn is not sustainable. Lignocellulose has been considered an alternative biomass, yet
difficulties remain in breaking down the material and fully fermenting it. One major obstacle is the
presence of xylose and other pentose sugars which are not fermented by the standard microorganism
used, S. cerevisiae. This project studied a modified strain of yeast and its ability to ferment xylose. It was
determined that the modified yeast is capable of using xylose as long as some glucose is also present.
The yeast performed optimally when greater than 50% of the substrate used was glucose. Additionally,
it was found that the modified yeast grew at half the rate that the wild yeast did.

ii
Acknowledgments The team would like to thank advisor Professor David DiBiasio, and co-advisor Professor William
Clark. In addition, specials thanks is given to Professor Reeta Prusty Rao and graduate student Jeff
Swana for allowing the team to work with their modified strain of yeast.

iii
Table of Contents Abstract .......................................................................................................................................................... i
Acknowledgments ......................................................................................................................................... ii
Table of Figures ............................................................................................................................................. v
Table of Tables ............................................................................................................................................. vi
Table of Equations ....................................................................................................................................... vi
Executive Summary ..................................................................................................................................... vii
Introduction .................................................................................................................................................. 1
Background ................................................................................................................................................... 5
Pretreatment and Hydrolysis .................................................................................................................... 5
Sugars Used in Ethanol Fermentation ...................................................................................................... 9
Microorganisms Used in Cellulosic Ethanol Fermentation ..................................................................... 10
Xylose and Pentose Utilization ............................................................................................................ 10
Recombinant S. cerevisiae for Xylose Fermentation .......................................................................... 12
Methodology ............................................................................................................................................... 14
Preparation of Media .............................................................................................................................. 14
Inoculation .............................................................................................................................................. 14
Measuring Cell Count and Ethanol Concentration ................................................................................. 15
Run 1 ....................................................................................................................................................... 16
Runs 2 and 3 ............................................................................................................................................ 17
Run 4 ....................................................................................................................................................... 17
Results and Discussion ................................................................................................................................ 19
Experiment 1 ........................................................................................................................................... 19
Experiments 2 and 3 ............................................................................................................................... 21
Cell Growth ......................................................................................................................................... 21
Ethanol Production ............................................................................................................................. 25
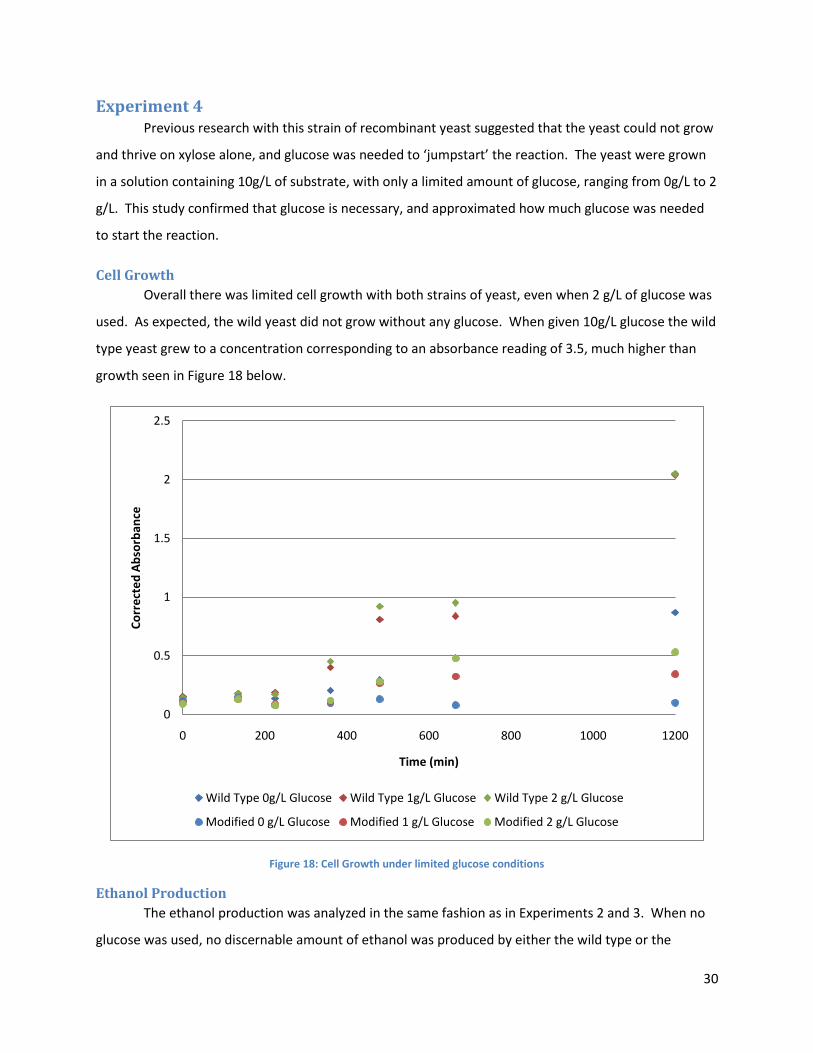
Experiment 4 ........................................................................................................................................... 30
Cell Growth ......................................................................................................................................... 30
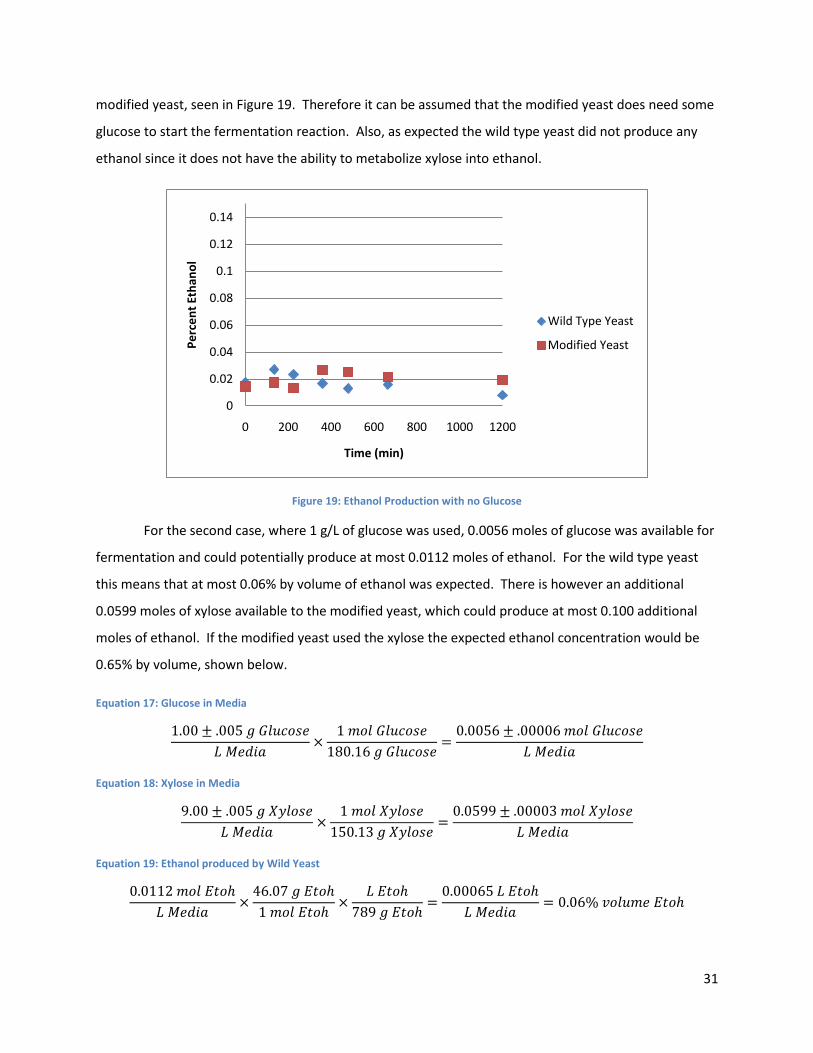
Ethanol Production ............................................................................................................................. 30
Conclusions and Recommendations ........................................................................................................... 34
References .................................................................................................................................................. 36

iv
Appendix A: Raw Data Collected ................................................................................................................ 39
Appendix B: Rate Determination Figures .................................................................................................... 48
v
Table of Figures Figure 1: Reaction Pathway of Cellulose into Glucose. Provided by Reference Answers. ........................... 6
Figure 2: Molecular structure of lignocelluloses. Provided by Electregy Revolution Coproation. ............... 6
Figure 3: Lignin surrounds hemicelluloses and cellulose in a plant cell wall. Provided by The International
FEW Biomass Magazine. ............................................................................................................................... 7
Figure 4: An overview of the process from lignocellulose to biofuels. Provided by the International
Journal of Biological Studies. ........................................................................................................................ 8
Figure 5: A comparison of the two metabolic pathways. Provided by The International FEW Biomass
Magazine. .................................................................................................................................................... 11
Figure 6: Spec 20D Calibration Curve .......................................................................................................... 15
Figure 7: Standard Curve for GC Area to Percent Ethanol .......................................................................... 16
Figure 8: Growth rate for the 4 types of yeast given 20g/L Glucose .......................................................... 19
Figure 9: Cell Growth Comparing strains of yeast with 10g/L Glucose and 10g/L Xylose .......................... 20
Figure 10: Ethanol Production comparing strains of yeast with 10g/L Glucose and 10g/L Xylose............. 21
Figure 11: Cell Growth in 10g/L of Glucose ................................................................................................ 22
Figure 12: Cell Growth in 6g/L Glucose and 4 g/L Xylose ........................................................................... 23
Figure 13: Cell Growth in 4 g/L Glucose and 6g/L Xylose ........................................................................... 23
Figure 14: Reaction rate for Wild Yeast with all Glucose ............................................................................ 24
Figure 15: Ethanol Production using all Glucose ........................................................................................ 25
Figure 16: Ethanol Production using 6g/L glucose and 4g/L xylose ............................................................ 27
Figure 17: Ethanol Production using 4 g/L glucose and 6 g/L xylose .......................................................... 29
Figure 18: Cell Growth under limited glucose conditions ........................................................................... 30
Figure 19: Ethanol Production with no Glucose ......................................................................................... 31
Figure 20: Ethanol Production with 1 g/L Glucose and 9g/L Xylose ........................................................... 32
Figure 21: Ethanol Production with 2 g/L Glucose and 8 g/L Xylose .......................................................... 33
Figure 22: Comparing the Modified Yeast's performance at various substrate concentrations ................ 34
vi
Table of Tables Table 1: Summary of LTC genes .................................................................................................................. 12
Table 2: Summary of Run 1 ......................................................................................................................... 17
Table 3: Summary of Runs 2 and 3 ............................................................................................................. 17
Table 4: Summary of Run 4 ......................................................................................................................... 18
Table 5: Growth Rate Comparison .............................................................................................................. 24
Table of Equations Equation 1: Moles of Glucose ..................................................................................................................... 25
Equation 2: Ethanol Produced .................................................................................................................... 25
Equation 3: Ethanol Yield for Wild Type Yeast and 10 g/L glucose............................................................. 26
Equation 4: Ethanol Yield for Modified Yeast and 10 g/L glucose .............................................................. 26
Equation 5: Glucose in Media ..................................................................................................................... 26
Equation 6: Xylose in Media........................................................................................................................ 26
Equation 7: Ethanol produced by Wild Yeast ............................................................................................. 26
Equation 8: Ethanol produced by Modified Yeast ...................................................................................... 26
Equation 9: Ethanol Yield for Wild Type Yeast and 6 g/L glucose, 4 g/L xylose .......................................... 28
Equation 10: Ethanol Yield for Modified Yeast and 6 g/L glucose, 4 g/L xylose ......................................... 28
Equation 11: Glucose in Media ................................................................................................................... 28
Equation 12: Xylose in Media ..................................................................................................................... 28
Equation 13: Ethanol produced by Wild Yeast ........................................................................................... 28
Equation 14: Ethanol produced by Modified Yeast .................................................................................... 28
Equation 15: Ethanol Yield for Wild Type Yeast and 4 g/L glucose, 6 g/L xylose ........................................ 29
Equation 16: Ethanol Yield for Modified Yeast and 4 g/L glucose, 6 g/L xylose ......................................... 29
Equation 17: Glucose in Media ................................................................................................................... 31
Equation 18: Xylose in Media ..................................................................................................................... 31
Equation 19: Ethanol produced by Wild Yeast ........................................................................................... 31
Equation 20: Ethanol produced by Modified Yeast .................................................................................... 32
Equation 21: Glucose in Media ................................................................................................................... 32
Equation 22: Xylose in Media ..................................................................................................................... 32
Equation 23: Ethanol produced by Wild Yeast ........................................................................................... 32
Equation 24: Ethanol produced by Modified Yeast .................................................................................... 33
vii
Executive Summary America’s dependence on foreign fossil fuels has been at the front of newspaper headlines and
political discussions for many years. In addition, the environmental effects of such wide spread use of
fossil fuels has encouraged many to seek alternative resources. Liquid fuels are particularly important in
the transportation industry, and one promising alternative is ethanol fermented from biomass. The
biomass can be grown on American soil, reducing foreign dependence. Another benefit is that the net
carbon emissions from the combustion of this ethanol is zero, since the source of the carbon is biomass.
These two critical factors have given great weight to value of this fuel. The main argument against the
current ethanol fermentation process is the use of corn as the feedstock. Corn is a staple in the
American food industry and an increased demand for corn has many worried that the food source will
become strained. Additionally, the energy required to produce ethanol from corn is much greater than
the energy in fuel.
One alternative to corn is lignocellulose. Lignocellulose is a complex compound containing
lignin, cellulose, and hemicellulose. The current problems surrounding the use of this material are
twofold. First, the lignin is not useable in the fermentation process, so the cellulose must be separated
from it. Lignin, however, is tough and resistant to chemical and biological processes to break it down.
Better forms of hydrolysis, the process that breaks down this complex structure into basic sugars, are
required before the alternative can be economically viable. The second problem surrounds the sugars
that are produced during hydrolysis. Corn is made up almost entirely of glucose, a six carbon chain
sugar. S. cerevisiae is a strain of yeast commonly used to ferment glucose into ethanol, as it ferments
this sugar efficiently and quickly. However, unlike corn, cellulose is comprised of both glucose and
xylose, a five carbon chain sugar. S. cerevisiae cannot metabolize xylose, and therefore a substantial
amount of available material is not converted to ethanol and the fuel yield is decreased. This decreases
the ratio of energy returned to energy put into the process, so much that the process is no longer
considered a viable solution. If the xylose could also be fermented to ethanol the process has the ability
to provide a sustainable energy source for The United States.
The strain of S. cerevisiae studied in this report was genetically altered to allow it to metabolize
xylose as well as glucose. A total of nine genes were added from a different microorganism that can
ferment xylose, but cannot survive in an ethanol environment. In addition, an inhibitory gene found in
S. cerevisiae was deleted. The ability of this modified strain of yeast to ferment xylose and a
viii
combination of glucose and xylose was observed. In order to do so, both the wild type and the modified
yeast were grown in media containing various ratios of glucose and xylose. The growth rate of each
type of yeast and the ethanol concentration were monitored over time and compared.
It was first discovered that the modified yeast had a slower growth rate than the wild type
yeast. While this is not necessarily an issue, it does mean that the rate of ethanol production is slower,
which could impact an industrial process. It was also noted that the modified yeast does not use glucose
as efficiently as wild type yeast. This is expected, as the metabolic pathway of this yeast has been
altered. The modified yeast did successfully ferment xylose, a finding confirmed by material balances.
When a 60/40 glucose to xylose ratio was used, the modified yeast performed much greater than the
wild type yeast in ethanol production.
It was also determined that the modified yeast required some of the substrate to be glucose.
This was expected because glucose is the preferred sugar for cell growth in most organisms, as this is a
very energy intensive process. When grown on only xylose, both the wild type yeast and the
recombinant strain failed to produce any ethanol. The strains were also compared under very low
concentrations of glucose; both performed similarly. It was not until the glucose concentration reached
60 percent that the modified yeast performed better than the wild type yeast. However, as many types
of cellulosic material contain ratios similar to this, this is not a foreseeable problem.
The performance of this strain of yeast was only compared under one type of reactor
conditions. Altering the temperature, pH, and other variables may improve the performance and
ethanol yield. Additionally, only xylose was studied in this experiment, though other pentose sugars
such as arabinose are also present in the lignocelluloses material. It would be important to study the
recombinant strain’s ability to ferment these other sugars, as their conversion to ethanol increases the
overall yield. A separate study regarding the hydrolysis of the lignocelluloses material is also required
before the process can become a sustainable energy option.

1
Introduction Biofuels have the potential to be fully integrated within the U.S energy portfolio and can thus
enable the goals for energy security and greenhouse gas reduction to be achieved. [1] America’s
national security, economy, and environment are at great risk due to a high dependence on fossil fuels.
[2] The United States consumes twenty five percent of the world’s total oil production. [2] Additionally,
tens of billions of dollars are spent annually in order to import oil from unstable regions of the world. [2]
Thus, energy needs are prominent and biofuels can be used to amend the existent national reliance on
oil. [2]
Fuels that are made from living organisms or from metabolic by-products such as organic or
food wastes are known as biofuels. [4] Biofuels are energy carriers which store energy drawn from
biomass. [6] Some forms of biomass and their respective sources includes food, fiber, and wood process
residues from the industrial sector, in addition to energy crops, short-rotation crops, agricultural waste,
and residues from the forestry sector. [6] These varying forms of biomass can be used to produce
electricity, heat, and other forms of bioenergy.
There must be greater than eighty percent of renewable materials within a fuel in order for it to
be considered a biofuel. [4] Renewable energy comes from resources that are replaced at a rate
comparable to the consumption rate, and thus have sustainable benefits over fossil fuels such as
petroleum and coal. [4] Additionally, biofuels are considered carbon neutral due to the fact that the
carbon released during combustion is equal to the carbon captured by the biomass during the plants’
life cycle. [5]
Biomass has been used to generate biofuels in the United States since the beginning of the
twentieth century. Interest in them increased dramatically as a result of the fuel crisis in the 1970’s;
however, after the oil market stabilized, research funding sharply declined. Recently, the production of
ethanol for the purposes of biofuels has greatly increased due to the diminishing supply of fossil fuels,
and this has had an immense impact on U.S agriculture. [7] More than two billion bushels of corn
annually are being used for ethanol production. Due to this large quantity for the purposes of biofuel
production, a prevailing “food versus fuel” debate has come about. [7]
Due to the increasing demand for renewable fuels, there is a great deal of pressure on the
agricultural sector since both the food processors and biofuel producers must compete for the same
crop. [8] Various raw materials used in the production of biofuels such as corn, sugarcane, and soybeans
are a source of food for millions of people. [8] As a result of this conflicting demand of both industries,

2
the food versus fuel debate has surfaced and includes an argument as to whether or not people will go
hungry and a food shortage will result due to the high demand for biofuels. [7] There is a dispute
between ethanol producers and the food industry that claims food costs will substantially rise and crop
availability will decrease due to the increasingly high use of corn for biofuel production. [10]
The main argument of the food industries that is used against ethanol producers includes the
fact that corn, which could feed the hungry, is instead being used to produce ethanol. [7] However, on
the contrary, a minimal volume of U.S corn is exported to the undernourished populations around the
world. [7] Information collected by the Food and Agricultural Organization of the United Nations (FAO)
reports that ten countries with the highest percentile of undernourished populations, only receive less
than .01 percent of U.S corn exports. By contrast, fifty five percent of U.S corn exports are sent to
wealthy nations in the Organization for Economic Cooperation and Development (OECD). [7]
On the other hand, there is a real concern that biofuel production will have a negative impact in
countries with high levels of food insecurity. The high demand for biofuels in wealthy countries could
hinder national food production. [7]
Food companies claim that the rising corn prices are a result of the high demand for ethanol;
therefore, they must raise the prices of corn-containing products and other meat and dairy products
obtained from grain-fed animals. [10] A spokeswoman for the American Pop Corn Company, Tracy
Boever, argues that although the company is not holding anyone responsible for the higher prices, “the
fact remains that there are only so many acres of land and the popcorn industry, along with others, are
competing for those acres.”1 Thus, there exists a competition for corn between ethanol and food
industries, who feels that it is being negatively impacted by ethanol production.
From a political standpoint, Democrats, Republicans, the White House, and U.S Congress all
support an immense expansion of the biofuel industry. On January 23, 2009, President George W. Bush
called for 35 billion gallons of renewable fuels annually in his State of the Union address. This amount
translates to an equivalent of fifteen percent of gasoline burned in cars and trucks. Furthermore, the
U.S. Congress is contemplating measures that would call for sixty billion gallons of renewable fuel by the
year 2030. [9] This number is significant, showing the importance of research into renewable resources
such as bioethanol.
Bioethanol production is possible from low cost materials including lignocellulose and other
agricultural remains. Agricultural remains include corn stover, wheat straw, and rice straw, and
processing by-products such as corn fiber, rice hulls, and sugarcane bagasse. [11] Additionally, specific
1 [10]
3
energy crops can be grown. One example is switch grass, a low costing sugar source that can be
implemented towards the production of biofuels. Lignocellulosic biomass is then converted to
fermentable sugars for the production of biofuels; however, many problems currently exist both on a
technical and economic level. [11]
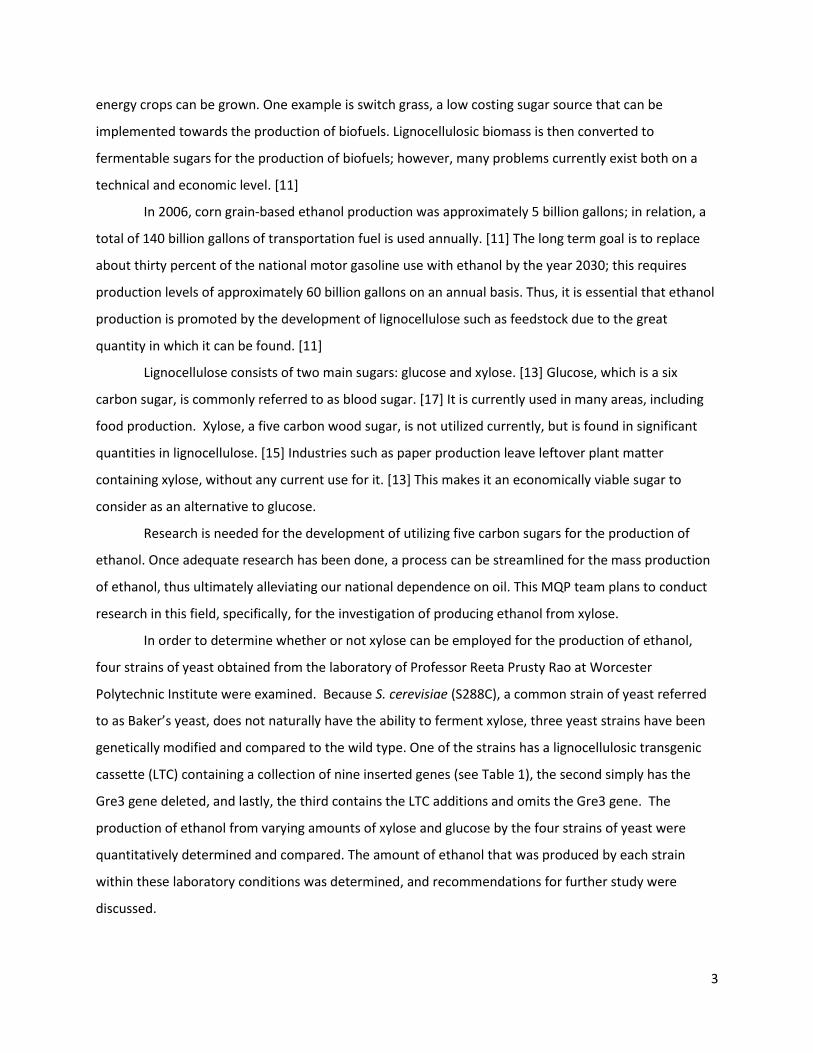
In 2006, corn grain-based ethanol production was approximately 5 billion gallons; in relation, a
total of 140 billion gallons of transportation fuel is used annually. [11] The long term goal is to replace
about thirty percent of the national motor gasoline use with ethanol by the year 2030; this requires
production levels of approximately 60 billion gallons on an annual basis. Thus, it is essential that ethanol
production is promoted by the development of lignocellulose such as feedstock due to the great
quantity in which it can be found. [11]
Lignocellulose consists of two main sugars: glucose and xylose. [13] Glucose, which is a six
carbon sugar, is commonly referred to as blood sugar. [17] It is currently used in many areas, including
food production. Xylose, a five carbon wood sugar, is not utilized currently, but is found in significant
quantities in lignocellulose. [15] Industries such as paper production leave leftover plant matter
containing xylose, without any current use for it. [13] This makes it an economically viable sugar to
consider as an alternative to glucose.
Research is needed for the development of utilizing five carbon sugars for the production of
ethanol. Once adequate research has been done, a process can be streamlined for the mass production
of ethanol, thus ultimately alleviating our national dependence on oil. This MQP team plans to conduct
research in this field, specifically, for the investigation of producing ethanol from xylose.
In order to determine whether or not xylose can be employed for the production of ethanol,
four strains of yeast obtained from the laboratory of Professor Reeta Prusty Rao at Worcester
Polytechnic Institute were examined. Because S. cerevisiae (S288C), a common strain of yeast referred
to as Baker’s yeast, does not naturally have the ability to ferment xylose, three yeast strains have been
genetically modified and compared to the wild type. One of the strains has a lignocellulosic transgenic
cassette (LTC) containing a collection of nine inserted genes (see Table 1), the second simply has the
Gre3 gene deleted, and lastly, the third contains the LTC additions and omits the Gre3 gene. The
production of ethanol from varying amounts of xylose and glucose by the four strains of yeast were
quantitatively determined and compared. The amount of ethanol that was produced by each strain
within these laboratory conditions was determined, and recommendations for further study were
discussed.

4
Small-scale research for the production of ethanol from xylose will contribute to the overall,
large scale research demand and as a result, the potential for a streamlined process on an industrial
scale for the production of biofuels can be evaluated. Variables in the bioreactor include temperature,
pH, mixing rate, and substrate and protein concentrations. A higher temperature can increase the rate
of the reaction; however it cannot exceed the temperature in which yeast can survive. As with most
biological processes, the reaction will only move forward in a specific pH range, though this
microorganism naturally creates the proper pH environment. A well-mixed reactor allows yeast to come
in contact with substrate, increasing the rate of the reaction. It is necessary for excess proteins to be
provided to ensure proper cell growth, allowing for complete substrate fermentation. By conducting
such research, the potential to expand this into an economically viable and efficient industrial process
holds promise.
5
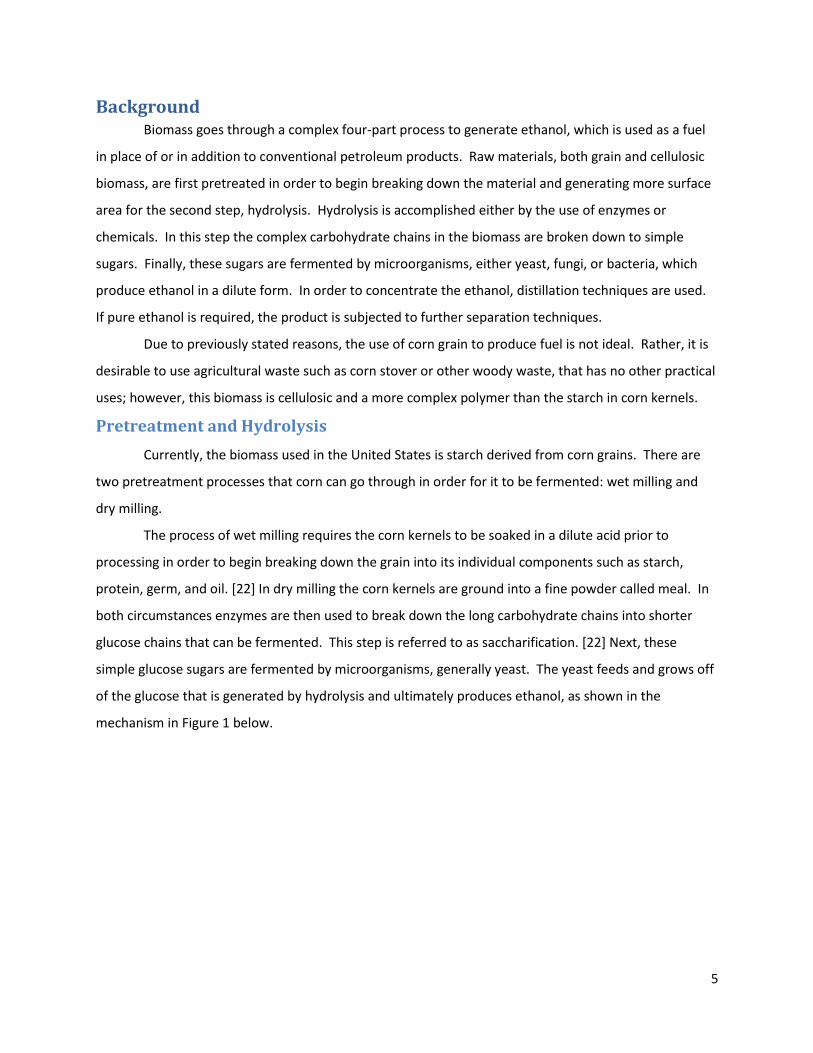
Background Biomass goes through a complex four-part process to generate ethanol, which is used as a fuel
in place of or in addition to conventional petroleum products. Raw materials, both grain and cellulosic
biomass, are first pretreated in order to begin breaking down the material and generating more surface
area for the second step, hydrolysis. Hydrolysis is accomplished either by the use of enzymes or
chemicals. In this step the complex carbohydrate chains in the biomass are broken down to simple
sugars. Finally, these sugars are fermented by microorganisms, either yeast, fungi, or bacteria, which
produce ethanol in a dilute form. In order to concentrate the ethanol, distillation techniques are used.
If pure ethanol is required, the product is subjected to further separation techniques.
Due to previously stated reasons, the use of corn grain to produce fuel is not ideal. Rather, it is
desirable to use agricultural waste such as corn stover or other woody waste, that has no other practical
uses; however, this biomass is cellulosic and a more complex polymer than the starch in corn kernels.
Pretreatment and Hydrolysis
Currently, the biomass used in the United States is starch derived from corn grains. There are
two pretreatment processes that corn can go through in order for it to be fermented: wet milling and
dry milling.
The process of wet milling requires the corn kernels to be soaked in a dilute acid prior to
processing in order to begin breaking down the grain into its individual components such as starch,
protein, germ, and oil. [22] In dry milling the corn kernels are ground into a fine powder called meal. In
both circumstances enzymes are then used to break down the long carbohydrate chains into shorter
glucose chains that can be fermented. This step is referred to as saccharification. [22] Next, these
simple glucose sugars are fermented by microorganisms, generally yeast. The yeast feeds and grows off
of the glucose that is generated by hydrolysis and ultimately produces ethanol, as shown in the
mechanism in Figure 1 below.
6
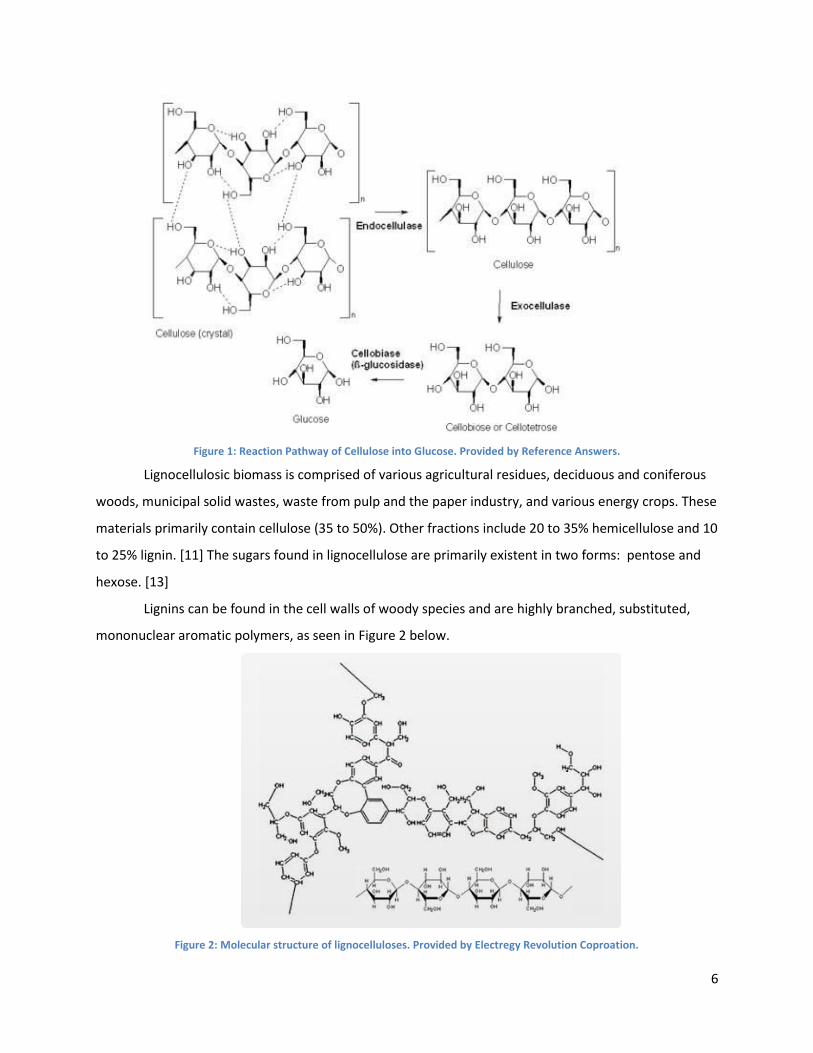
Figure 1: Reaction Pathway of Cellulose into Glucose. Provided by Reference Answers.
Lignocellulosic biomass is comprised of various agricultural residues, deciduous and coniferous
woods, municipal solid wastes, waste from pulp and the paper industry, and various energy crops. These
materials primarily contain cellulose (35 to 50%). Other fractions include 20 to 35% hemicellulose and 10
to 25% lignin. [11] The sugars found in lignocellulose are primarily existent in two forms: pentose and
hexose. [13]
Lignins can be found in the cell walls of woody species and are highly branched, substituted,
mononuclear aromatic polymers, as seen in Figure 2 below.
Figure 2: Molecular structure of lignocelluloses. Provided by Electregy Revolution Coproation.

7
Lignin found in biomass tends to bind to surrounding cellulose fibers and form a lignocellulosic
complex. The lignin surrounds the more usable hemicellulose and cellulose material and is difficult to
break into, see Figure 3.
Figure 3: Lignin surrounds hemicelluloses and cellulose in a plant cell wall. Provided by The International FEW Biomass Magazine.
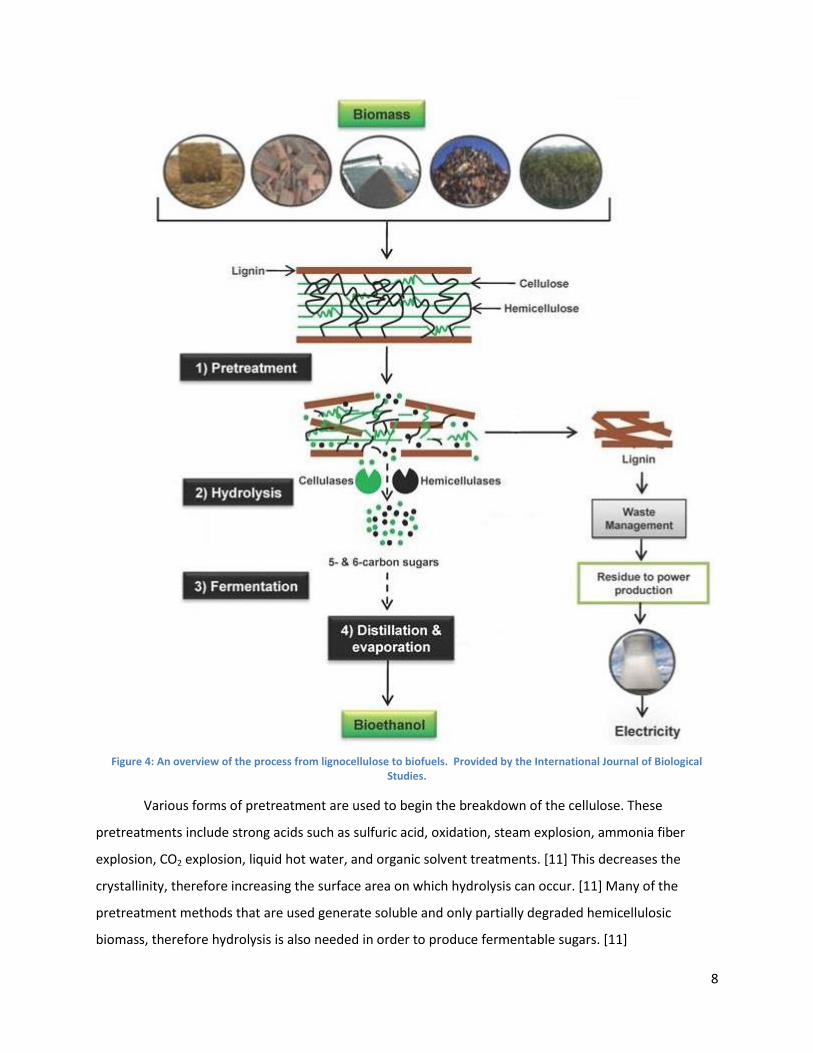
Similar to corn, a two-step process is needed to break down the biomass before the sugars can
be used for fermentation. A broad overview of this process can be seen in Figure 4 below. The
lignocellulosic complex is resistant to microbial systems and chemical agents, making it difficult to break
down. [12]
8
Figure 4: An overview of the process from lignocellulose to biofuels. Provided by the International Journal of Biological Studies.
Various forms of pretreatment are used to begin the breakdown of the cellulose. These
pretreatments include strong acids such as sulfuric acid, oxidation, steam explosion, ammonia fiber
explosion, CO2 explosion, liquid hot water, and organic solvent treatments. [11] This decreases the
crystallinity, therefore increasing the surface area on which hydrolysis can occur. [11] Many of the
pretreatment methods that are used generate soluble and only partially degraded hemicellulosic
biomass, therefore hydrolysis is also needed in order to produce fermentable sugars. [11]
9
Hydrolosis can be accomplished by the use of enzymes or chemicals to further decompose
starch or cellulose to simple sugars. [23] Enzymatic hydrolysis is performed by the use of the enzymes
endo- 1,4-Beta-glucanase, exo- 1,2-Beta-glucanase, and B-glucosidase. [11] The step of cellulose
hydrolysis is a prominent element of the total production cost of ethanol from lignocellulosic material.
[11] Alternatively, chemical hydrolysis can be used. Acid hydrolysis is becoming more popular due to its
lower cost and greater effectiveness then enzymatic hydrolysis. [24] The lignocellulosic material is
subjected to strong concentrations of hydrochloric or sulfuric acid in order to begin the break down and
separation of materials. [24]
There are currently many economical and technical problems associated with the conversion of
lignocellulosic biomass to fermentable sugars. [11] In order to successfully enable fermentation, it would
be essential to develop an effective pretreatment of the lignocellulose and have efficient enzyme
conversion to fermentable sugars. [11]
Sugars Used in Ethanol Fermentation Ethanol fermentation is performed by converting sugars to make ethanol and carbon dioxide.
[14] Other byproducts can also be produced, depending on the sugars that are present and the
microorganisms that are used for fermentation. The most common type of sugar found in corn is
hexose, and both pentose and hexose are found in significant quantities in lignocellulosic material. [14]
Pentose is a monosaccharide, or simple sugar, with five carbon atoms. [15] A large percentage
of the sugars found in lignocellulose is xylose, or wood sugar, which is composed of a pentose with an
aldehyde functional group. [16] Xylose and arabinose, another aldopentose, is found primarily in the
hemicellulosic part of the plant. It is frequently found as a waste product of the papermaking industry,
thus making it desirable as an economic energy source for ethanol production. [16]
Hexose is a monosaccharide like pentose, however it contains six carbon atoms. [17] Glucose is
a common form of hexose containing an aldehyde group, just as xylose. Two stereoisomers, L-glucose
and D-glucose, exist. Only D-glucose, or dextrose, is found in nature however. It is also known as blood
sugar or corn sugar and is found in the cellulosic part of biomass along with smaller amounts of
mannose, galactose, and rhamnose. Glucose is readily available and is a major energy source for most
organisms, including humans, which leads to the concern of both the cost and use of valuable food
resources. [17]
10
Microorganisms Used in Cellulosic Ethanol Fermentation
The microorganisms used for fermenting ethanol can be yeast or bacteria. Each has its
strengths and weaknesses in their abilities to ferment different types of sugars. Bacteria are a
prokaryotic, meaning they lack the cell nuclei that can be found in eukaryotic cells such as yeast. [30]
There are several strains of bacteria that are used in ethanol fermentation and they are distinguished by
the sugars they ferment and the products that result from fermentation.
Clostridium thermocellum can successfully convert cellulose directly into ethanol without
needing a saccarification step beforehand. [30] However, the downside to using this bacterium is that it
produces a low ethanol yield due to the production of byproducts such as lactate, acetate, and formate.
Zymomonas mobilis is another type of bacteria that surpasses yeast in ethanol yield and tolerance. [31]
Neither bacterium however is able to naturally ferment xylose although, a variant of Z. mobilis that can
ferment certain pentoses has been developed. Unfortunately, this bacterium has a lower tolerance than
yeast to inhibitory compounds produced during the hydrolosis of lignocellulose; this results in a lower
ethanol yield on an industrial scale. [31]
Yeast is currently the most popular method for converting cellulosic sugars into ethanol. The
most common type of yeast used is Saccharomyces cerevisiae, also known as Brewer’s yeast or Baker’s
yeast. [19] S. cerevisiae is a popular choice because it has a relatively high tolerance to ethanol and
inhibitor compounds and furthermore, can produce high ethanol yields from glucose. Similar to most
bacteria, this yeast is unable to ferment xylose and other pentose sugars at this time. [19] Pichia stipitis
is another yeast in the same family as Brewer’s yeast that has the highest ability of any yeast to directly
ferment xylose into ethanol. [20] Additionally, it is capable of both aerobic and anaerobic fermentation,
meaning it is able to do so both with and without the presence of oxygen. S. cerevisiae, on the other
hand, can only ferment in an anaerobic environment. In spite of this, the downside to P. Stipitis is its
low tolerance to ethanol that results in restrictions to industrialization of the process.
Xylose and Pentose Utilization
S. cerevisiae is preferred for fermentation because of its high tolerance to ethanol in comparison
to other microorganisms. [25] In addition, it is highly efficient at metabolizing hexose sugars like glucose;
however, its use of pentose is restricted. [11] New strains of yeast are essential to meet the needs of the
biofuels industry, especially due to the fact that S. cerevisiae is incapable of utilizing xylose. This
underlying challenge poses great limits and boundaries upon which biomass can be used to produce
ethanol from xylose found in inexpensive, economically viable feedstock. [11]
11
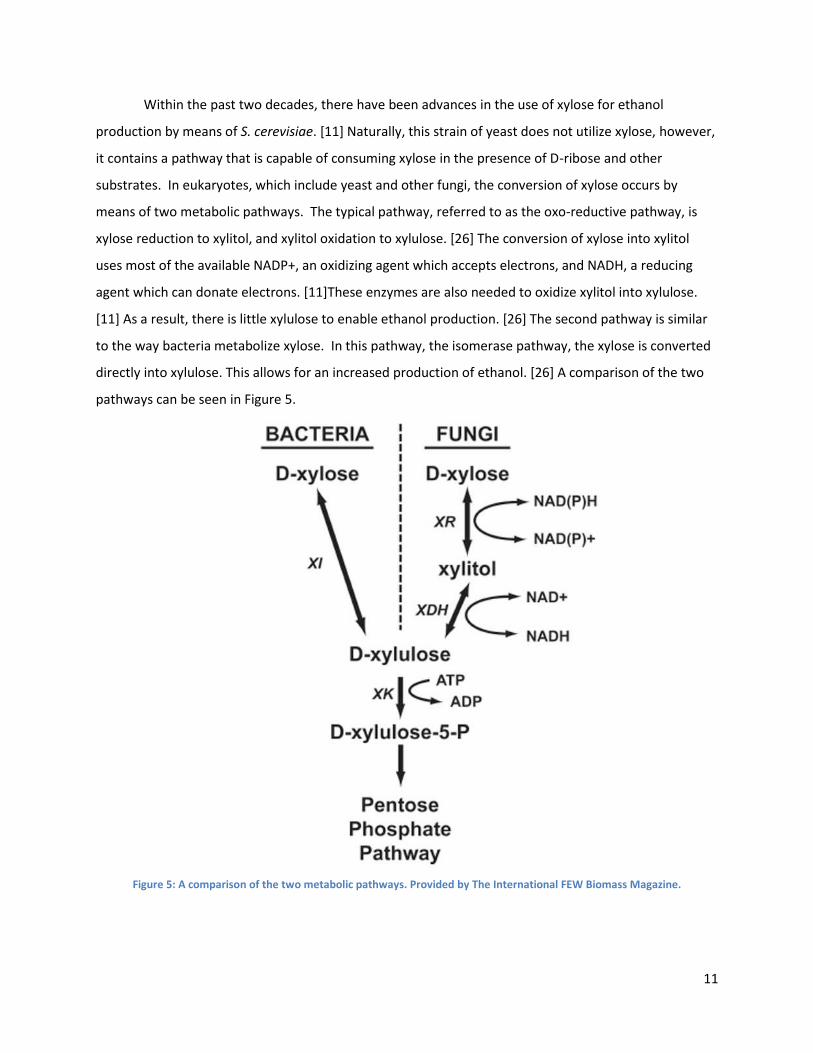
Within the past two decades, there have been advances in the use of xylose for ethanol
production by means of S. cerevisiae. [11] Naturally, this strain of yeast does not utilize xylose, however,
it contains a pathway that is capable of consuming xylose in the presence of D-ribose and other
substrates. In eukaryotes, which include yeast and other fungi, the conversion of xylose occurs by
means of two metabolic pathways. The typical pathway, referred to as the oxo-reductive pathway, is
xylose reduction to xylitol, and xylitol oxidation to xylulose. [26] The conversion of xylose into xylitol
uses most of the available NADP+, an oxidizing agent which accepts electrons, and NADH, a reducing
agent which can donate electrons. [11]These enzymes are also needed to oxidize xylitol into xylulose.
[11] As a result, there is little xylulose to enable ethanol production. [26] The second pathway is similar
to the way bacteria metabolize xylose. In this pathway, the isomerase pathway, the xylose is converted
directly into xylulose. This allows for an increased production of ethanol. [26] A comparison of the two
pathways can be seen in Figure 5.
Figure 5: A comparison of the two metabolic pathways. Provided by The International FEW Biomass Magazine.

12
Recombinant S. cerevisiae for Xylose Fermentation
Current research is examining several ways to increase the efficiency of processing five carbon
sugars found in cellulosic biomass. One solution to this problem is being developed by Stephen Hughes
at the ARS National Center for Agricultural Utilization Research in Illinois. [27] He has developed a new
strain of yeast where xylose is used by the yeast as the required substrate to grow and reproduce,
without oxygen. Because the xylose is supporting the growth of the yeast, all of the glucose present can
be converted into ethanol. [27] In 1993, the first genetically modified yeast strain to ferment both kinds
of sugars was produced, but the fermentation rates remained low. [28]
Several universities, including Worcester Polytechnic Institute, have researched genetically
modifying S. cerevisiae so that it can ferment xylose into ethanol at higher fermentation rates. [29] Two
genes found in P. stipitis, XYL1 and XYL2, were introduced to S. cerevisiae, as well as xylose isomerase,
which is an enzyme that catalyzes the metabolization of xylose. An endogenous gene in S. cerevisiae
that is involved in the pentose phosphate pathway was up-regulated. The combination of the genes and
others is known as the lignocellulosic transgenic cassette, or LTC, see Table 1.
Table 1: Summary of LTC genes
Gene Source Organism Protein Purpose
Xyl1 Pichia stipitis Xylose Reductase
(XR) Reduces D-xylose to xylitol.
Xyl2 Pichia stipitis Xylulose
reductase/Xylitol dehydrogenase
Oxidizes xylitol to D-xylulose
Xyl3 (XKS1)
Pichia stipitis Xylulokinase Converts D-xylulose to D-xylulose-5-P
XylA Streptomyces diastaticus
Xylose Isomerase Converts D-xylose to D-xylulose
Tal1 Saccharomyces cerevisiae
Transaldolase Increase flux through the pentose phosphate pathway
Stl1 Pichia stipitis Sugar Transporter
Like protein Xylose uptake
AraA Salmonella typhimurium
L-arabinose isomerase
Converts L-arabinose to L-ribulose
AraB Salmonella typhimurium
L-ribulokinase Converts L-ribulose to L-ribulose-5-P
AraD Bacillus subtilis L-ribulose-5-
phosphate 4-epimerase
Converts L-ribulose-5-P to D-xylulose-5-P
Together, they increase the expression of the genes that allow the yeast to convert the sugar
into an intermediate that can be fed into glycolysis. Lastly, an aldose reductase found in S. cerevisiae,

13
referred to as Gre3, was removed, as this enzyme inhibits the process. The Gre3 gene is involved in the
production of xylitol, which as discussed previously is detrimental to the process. This recombinant
yeast strain should allow for the fermentation of both pentose and hexose and therefore result in a
higher ethanol yield. [29]

14
Methodology
In these experiments, four different strains of yeast and their ability to utilize xylose were
investigated. Specifically, the strains of yeast that were studied include: a wild-type S. cerevisiae (S288C),
the wild-type with a collection of nine genes that have been added, a wild-type with a Gre3 gene
deletion, and lastly the strain with both the nine genes added as well as the deletion of the Gre3 gene.
This collection of nine genes is involved in xylose and arabinose metabolism and is referred to as the
lignocellulosic transgenic cassette (LTC).
Four runs were conducted in these experimentations over a period of approximately two
months, with each individual run containing varying substrate (sugar) concentrations. The purpose was
to determine the trend that exists when the different strains of yeast utilize the varying amounts of
glucose and xylose that it is supplied to them.
Preparation of Media The media was prepared by mixing 1 liter of water with 10 grams of bacto-peptone and 5 grams
of yeast extract. While 20 grams of sugar was added to this mixture in the first run, thereafter 10 grams
of sugar was added instead to allow for faster fermentation times. The ratio of glucose to xylose was
varied in each experimental run. 250 ml of the media was then transferred into each of six shake flasks
labeled A-F and capped with a sponge top. Media containing 10 g/L of glucose was prepared to use as
an inoculation media. All media was autoclaved for 15 minutes immediately following its preparation in
order to sterilize it and insure that no other microorganisms were present during fermentation.
Inoculation 5 ml of the inoculation media was transferred into each of six culture tubes that had previously
been autoclaved and labeled A-F corresponding to the respective shake flasks. One to two colonies of
yeast were added to each tube, and capped with a sponge top. The colonies were transferred from the
petri dish to the liquid media using sterilized toothpicks. These culture tubes were then placed in the
shake bath and maintained at a temperature of 31±1°C for 48±4 hours. This process allowed the
colonies to begin growing, with the assumption that the culture tubes reached full saturation at 48
hours, meaning no more cells could grow in that media.
After 48 hours, the contents of each culture tube were transferred via a pipette to the
respective 250ml shake flask. At this time, time zero samples were taken and the flasks were placed in
the shake bath and maintained at 31±1°C. The shake speed was set so that the mixing was visible. The
flasks remained in the shaker for the duration of the run, about 48 hours.

15
Measuring Cell Count and Ethanol Concentration Roughly every one to two hours a 1ml sample was taken from each flask to determine cell
density and a 3 ml sample was taken to determine ethanol content. In order to determine cell density a
Milton Roy Spectronic 20D instrument was used with a tungsten lamp at a wavelength of 600 nm.
Before measuring the samples, the concentration range where a linear relationship existed between
concentration and absorbance was determined. A culture tube with inoculation media and a colony of
wild type yeast was allowed to come to full saturation. This was then diluted with deionized water to
various known concentrations, assuming the full saturation to be a concentration of 1. Each dilution
was measured in the Spec 20D and the absorbance read. The concentration was plotted against the
absorbance and the linear range was noted. As seen in Figure 6 below, absorbance readings below
0.250 comply with Beer’s Law and maintain a linear relationship with concentration.
Figure 6: Spec 20D Calibration Curve
Each sample taken from the shake flasks were placed in a clean glass test tube and diluted with
deionized water until the Spec 20D reading was close to or below 0.250. Before each use the instrument
was zeroed with deionized water. A minimum of 3 ml was required to be in the test tube for an
accurate reading, so the minimum dilution used was 1 ml sample to 3 ml total. The dilution factor and
absorbance reading were noted. A corrected absorbance was determined by multiplying the actual
reading by the dilution ratio, this was then plotted against time.
The 3 ml samples taken to determine ethanol concentration were first centrifuged until the
solids fell to the bottom and the solution became transparent. A pipette was used to transfer the
transparent solution off of the top, which was then filtered using 0.2 nm syringe filters and placed in a 4
y = 2.8251x + 0.066R² = 0.9995
0.000
0.050
0.100
0.150
0.200
0.250
0.300
0.350
0.400
0.450
0.500
0.000 0.100 0.200 0.300 0.400 0.500 0.600
Ab
sorb
acn
e R
ead
ing
Concentration
16
ml drum vial and sealed. ½ ml of the filtered solution was diluted with 24.5 ml of water for a 1/50
dilution ratio before being run through a Perkin Elmer gas chromatograph. This dilution was done to
reduce the chance of any residual cell particles left in the sample entering the GC column. Every sample
was run through the GC twice and an average area was calculated.
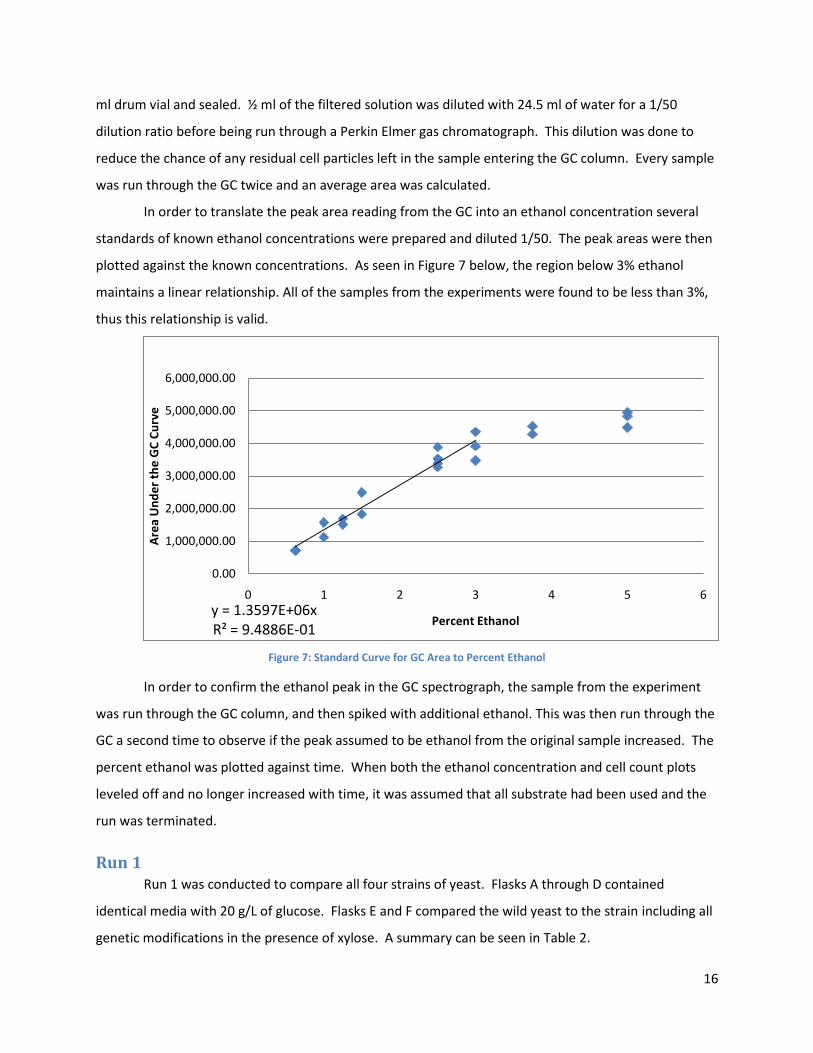
In order to translate the peak area reading from the GC into an ethanol concentration several
standards of known ethanol concentrations were prepared and diluted 1/50. The peak areas were then
plotted against the known concentrations. As seen in Figure 7 below, the region below 3% ethanol
maintains a linear relationship. All of the samples from the experiments were found to be less than 3%,
thus this relationship is valid.
Figure 7: Standard Curve for GC Area to Percent Ethanol
In order to confirm the ethanol peak in the GC spectrograph, the sample from the experiment
was run through the GC column, and then spiked with additional ethanol. This was then run through the
GC a second time to observe if the peak assumed to be ethanol from the original sample increased. The
percent ethanol was plotted against time. When both the ethanol concentration and cell count plots
leveled off and no longer increased with time, it was assumed that all substrate had been used and the
run was terminated.
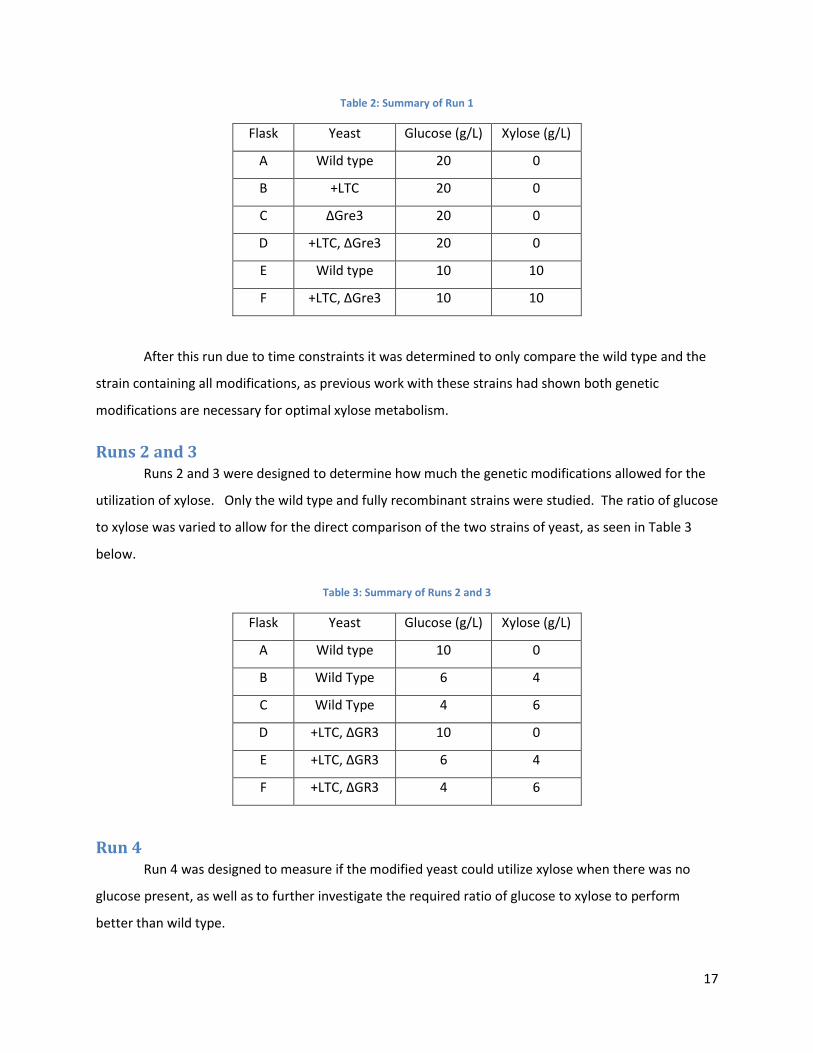
Run 1 Run 1 was conducted to compare all four strains of yeast. Flasks A through D contained
identical media with 20 g/L of glucose. Flasks E and F compared the wild yeast to the strain including all
genetic modifications in the presence of xylose. A summary can be seen in Table 2.
y = 1.3597E+06xR² = 9.4886E-01
0.00
1,000,000.00
2,000,000.00
3,000,000.00
4,000,000.00
5,000,000.00
6,000,000.00
0 1 2 3 4 5 6
Are
a U
nd
er
the
GC
Cu
rve
Percent Ethanol
17
Table 2: Summary of Run 1
Flask Yeast Glucose (g/L) Xylose (g/L)
A Wild type 20 0
B +LTC 20 0
C ΔGre3 20 0
D +LTC, ΔGre3 20 0
E Wild type 10 10
F +LTC, ΔGre3 10 10
After this run due to time constraints it was determined to only compare the wild type and the
strain containing all modifications, as previous work with these strains had shown both genetic
modifications are necessary for optimal xylose metabolism.
Runs 2 and 3 Runs 2 and 3 were designed to determine how much the genetic modifications allowed for the
utilization of xylose. Only the wild type and fully recombinant strains were studied. The ratio of glucose
to xylose was varied to allow for the direct comparison of the two strains of yeast, as seen in Table 3
below.
Table 3: Summary of Runs 2 and 3
Flask Yeast Glucose (g/L) Xylose (g/L)
A Wild type 10 0
B Wild Type 6 4
C Wild Type 4 6
D +LTC, ΔGR3 10 0
E +LTC, ΔGR3 6 4
F +LTC, ΔGR3 4 6
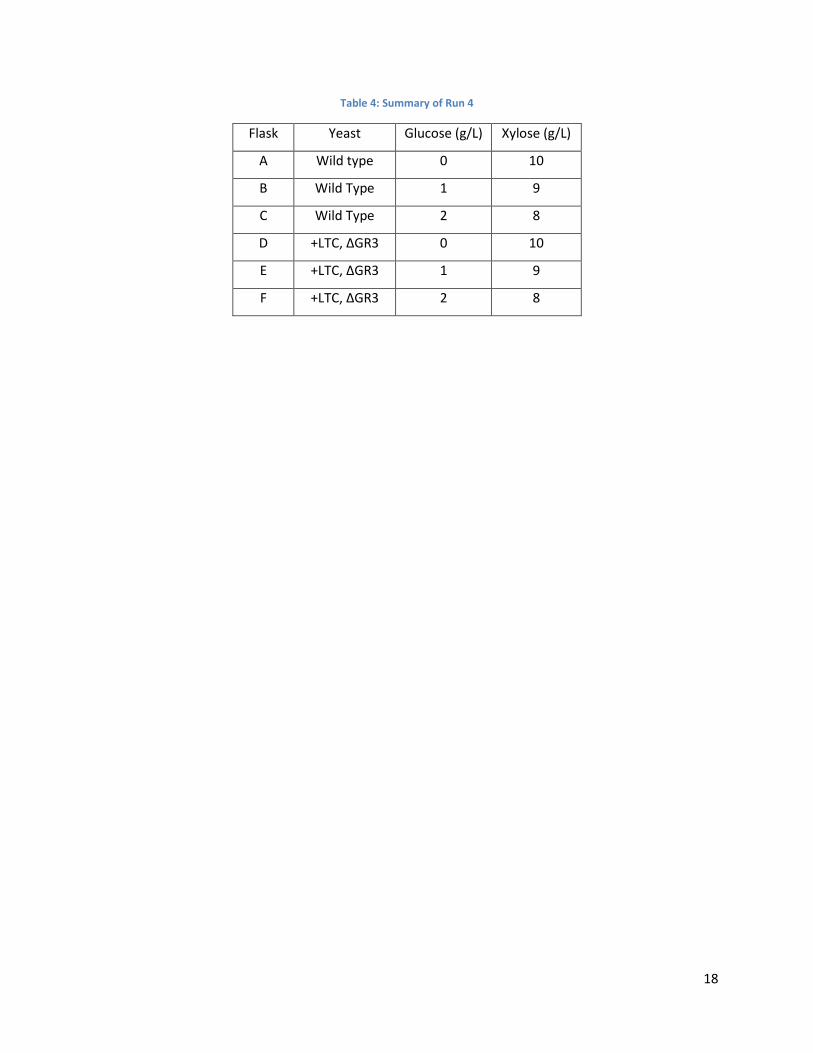
Run 4 Run 4 was designed to measure if the modified yeast could utilize xylose when there was no
glucose present, as well as to further investigate the required ratio of glucose to xylose to perform
better than wild type.
18
Table 4: Summary of Run 4
Flask Yeast Glucose (g/L) Xylose (g/L)
A Wild type 0 10
B Wild Type 1 9
C Wild Type 2 8
D +LTC, ΔGR3 0 10
E +LTC, ΔGR3 1 9
F +LTC, ΔGR3 2 8
19
Results and Discussion Four experiments in total were performed, each comparing wild type S. cerevisiae to S.
cerevisiae with different genetic modifications. As detailed in the background, these modifications are
removal of the gre3 gene which can inhibit metabolism into ethanol, addition of nine genes to aid in
xylose metabolism, and both of these modifications together. The first experiment concentrated on
comparing each genetic modification to each other as well as the wild type. The second, third and
fourth experiments then focused on comparison of the wild type to the yeast with both genetic
modifications, using different combinations of xylose and glucose.
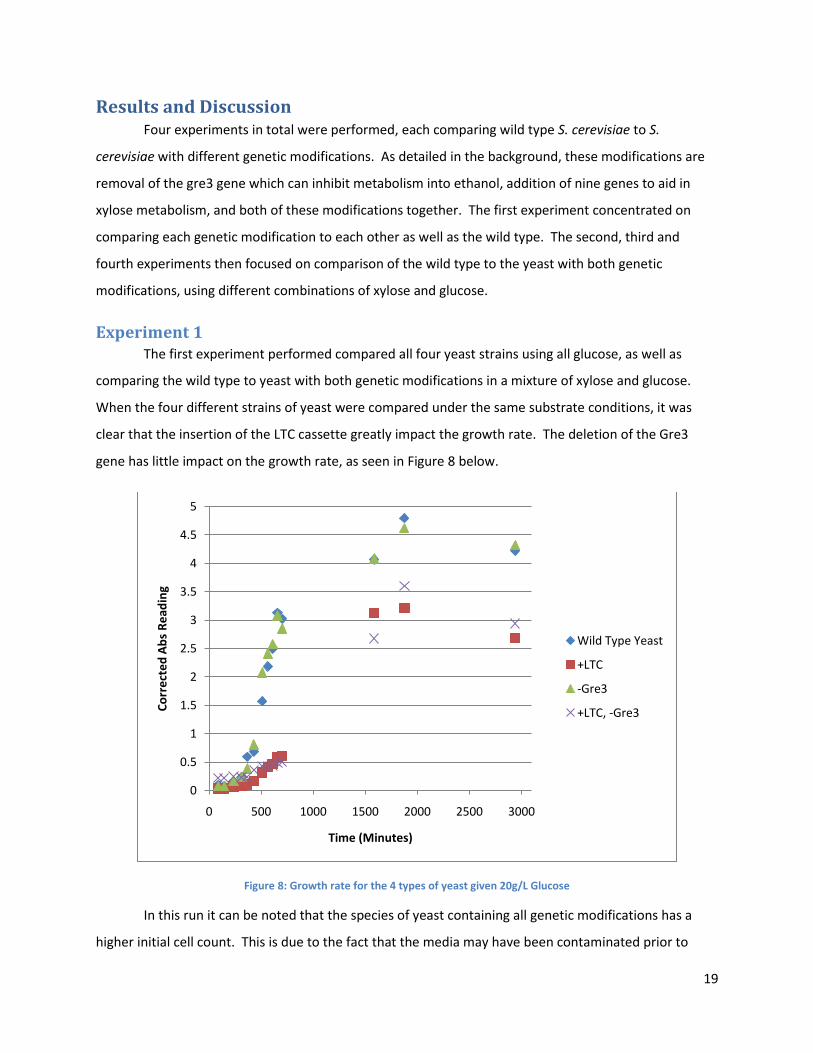
Experiment 1 The first experiment performed compared all four yeast strains using all glucose, as well as
comparing the wild type to yeast with both genetic modifications in a mixture of xylose and glucose.
When the four different strains of yeast were compared under the same substrate conditions, it was
clear that the insertion of the LTC cassette greatly impact the growth rate. The deletion of the Gre3
gene has little impact on the growth rate, as seen in Figure 8 below.
Figure 8: Growth rate for the 4 types of yeast given 20g/L Glucose
In this run it can be noted that the species of yeast containing all genetic modifications has a
higher initial cell count. This is due to the fact that the media may have been contaminated prior to
0
0.5
1
1.5
2
2.5
3
3.5
4
4.5
5
0 500 1000 1500 2000 2500 3000
Co
rre
cte
d A
bs
Re
adin
g
Time (Minutes)
Wild Type Yeast
+LTC
-Gre3
+LTC, -Gre3
20
autoclaving, as evidenced by a slightly cloudy solution. In this run insufficient data was collected to
accurately report on the ethanol production. At this time, the rate of the reaction was unknown which
resulted in a lack of sampling during exponential growth.
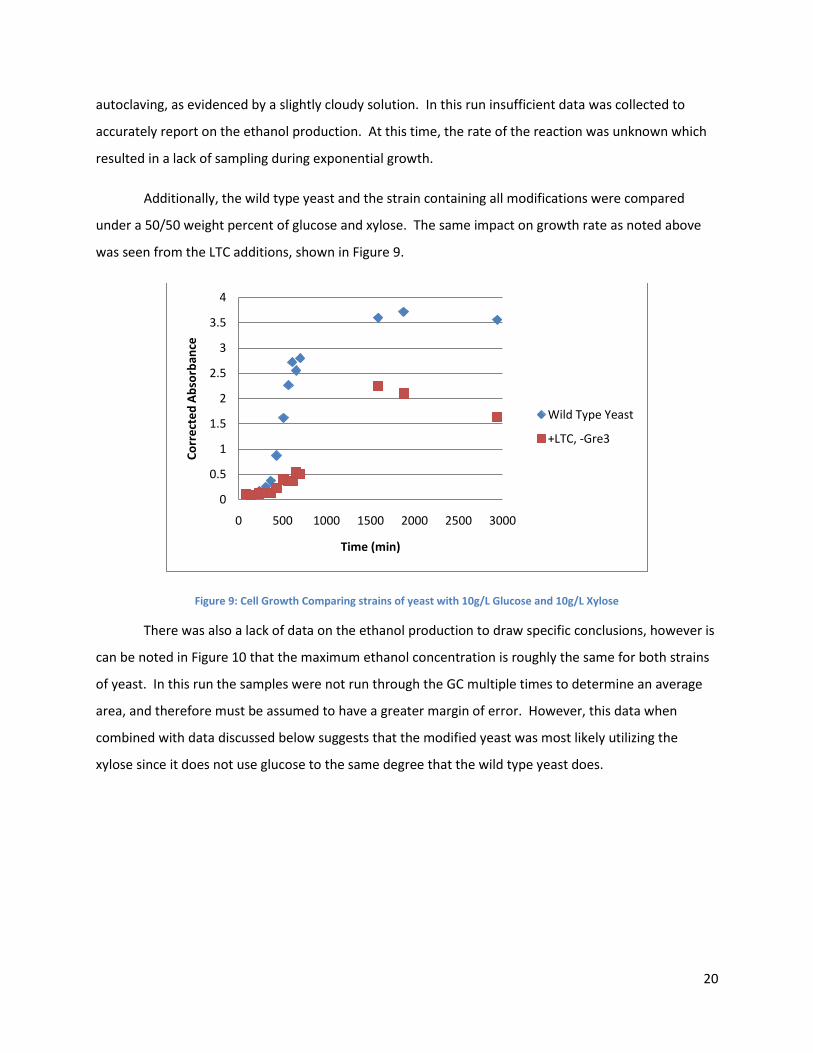
Additionally, the wild type yeast and the strain containing all modifications were compared
under a 50/50 weight percent of glucose and xylose. The same impact on growth rate as noted above
was seen from the LTC additions, shown in Figure 9.
Figure 9: Cell Growth Comparing strains of yeast with 10g/L Glucose and 10g/L Xylose
There was also a lack of data on the ethanol production to draw specific conclusions, however is
can be noted in Figure 10 that the maximum ethanol concentration is roughly the same for both strains
of yeast. In this run the samples were not run through the GC multiple times to determine an average
area, and therefore must be assumed to have a greater margin of error. However, this data when
combined with data discussed below suggests that the modified yeast was most likely utilizing the
xylose since it does not use glucose to the same degree that the wild type yeast does.
0
0.5
1
1.5
2
2.5
3
3.5
4
0 500 1000 1500 2000 2500 3000
Co
rre
cte
d A
bso
rban
ce
Time (min)
Wild Type Yeast
+LTC, -Gre3

21
Figure 10: Ethanol Production comparing strains of yeast with 10g/L Glucose and 10g/L Xylose
Experiments 2 and 3 Experiments 2 and 3 were run identically, comparing the strain of yeast containing both genetic
modifications to the wild type yeast under various concentrations of glucose and xylose. The cell growth
was monitored using the Spec 20D. When directly compared to the wild yeast, the modified yeast had a
delayed exponential growth phase and never reached the same concentration level as the wild yeast. In
all cases, the wild yeast began the exponential growth phase at about 400 minutes after being
introduced to the media. The modified yeast, however, did not begin this phase until about 600
minutes. In both cases, the yeast began leveling off at about 1000 minutes, suggesting that all substrate
had been used. The maximum ethanol concentration is also seen at this time.
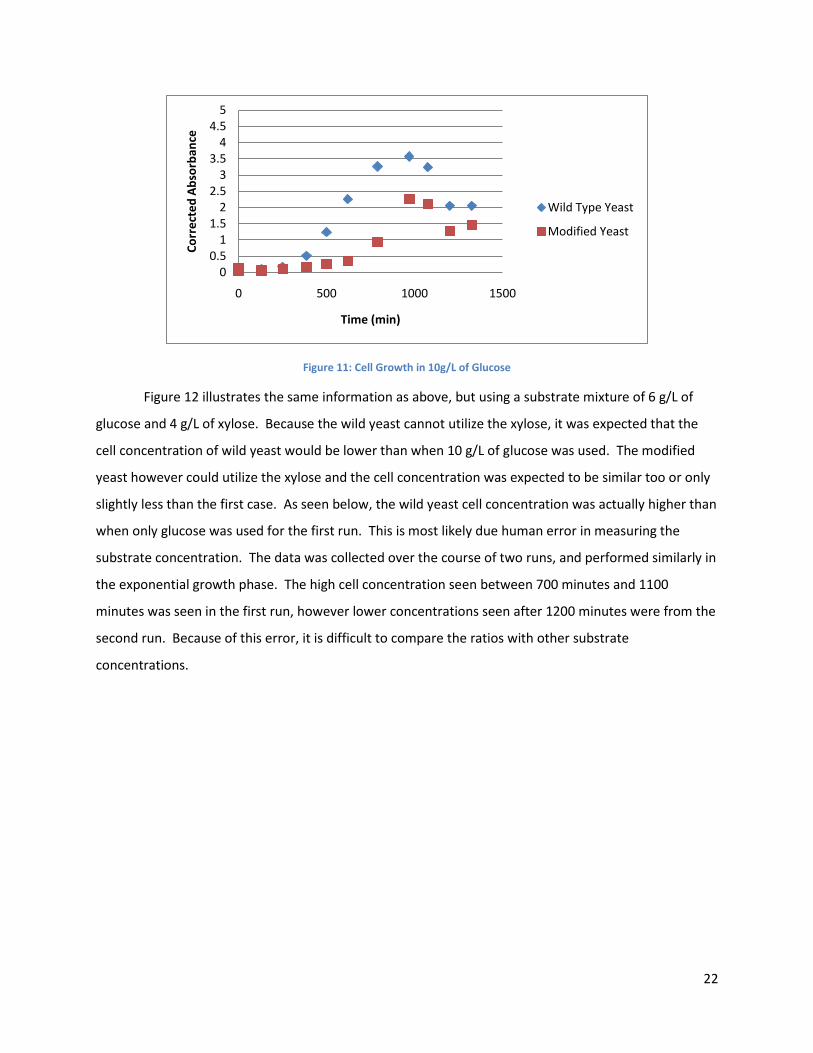
Cell Growth
A seen in Figure 11 below, the wild yeast reached a concentration corresponding to an
absorbance reading of 3.5. Typically, the absorbance readings would be correlated to the dry weight of
the cells; this was not done in this study due to equipment constraints and because the trend was
determined important, not the actual cell count. The modified yeast however reached a maximum at a
concentration corresponding to a reading of 2.3, or about two thirds of the concentration of the wild
yeast.
0
0.1
0.2
0.3
0.4
0.5
0.6
0 500 1000 1500 2000 2500 3000
% E
than
ol
Time (min)
Wild Type Yeast
+LTC, -Gre3
22
Figure 11: Cell Growth in 10g/L of Glucose
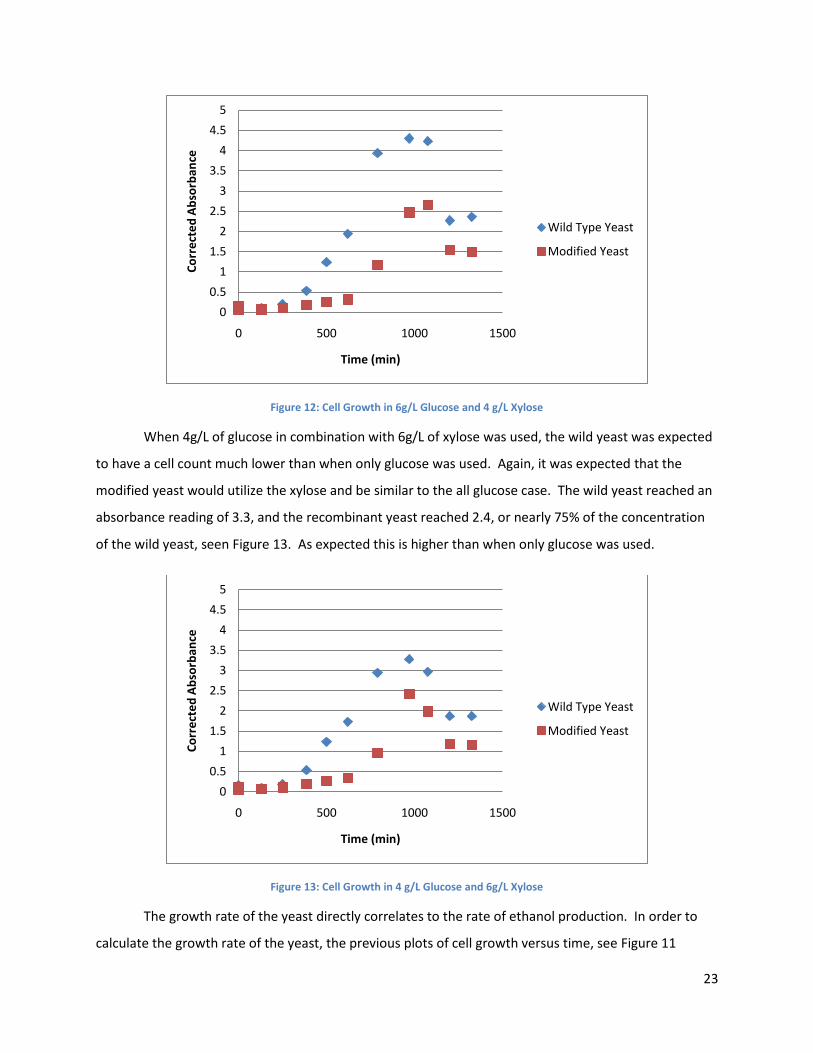
Figure 12 illustrates the same information as above, but using a substrate mixture of 6 g/L of
glucose and 4 g/L of xylose. Because the wild yeast cannot utilize the xylose, it was expected that the
cell concentration of wild yeast would be lower than when 10 g/L of glucose was used. The modified
yeast however could utilize the xylose and the cell concentration was expected to be similar too or only
slightly less than the first case. As seen below, the wild yeast cell concentration was actually higher than
when only glucose was used for the first run. This is most likely due human error in measuring the
substrate concentration. The data was collected over the course of two runs, and performed similarly in
the exponential growth phase. The high cell concentration seen between 700 minutes and 1100
minutes was seen in the first run, however lower concentrations seen after 1200 minutes were from the
second run. Because of this error, it is difficult to compare the ratios with other substrate
concentrations.
00.5
11.5
22.5
33.5
44.5
5
0 500 1000 1500
Co
rre
cte
d A
bso
rban
ce
Time (min)
Wild Type Yeast
Modified Yeast
23
Figure 12: Cell Growth in 6g/L Glucose and 4 g/L Xylose
When 4g/L of glucose in combination with 6g/L of xylose was used, the wild yeast was expected
to have a cell count much lower than when only glucose was used. Again, it was expected that the
modified yeast would utilize the xylose and be similar to the all glucose case. The wild yeast reached an
absorbance reading of 3.3, and the recombinant yeast reached 2.4, or nearly 75% of the concentration
of the wild yeast, seen Figure 13. As expected this is higher than when only glucose was used.
Figure 13: Cell Growth in 4 g/L Glucose and 6g/L Xylose
The growth rate of the yeast directly correlates to the rate of ethanol production. In order to
calculate the growth rate of the yeast, the previous plots of cell growth versus time, see Figure 11
0
0.5
1
1.5
2
2.5
3
3.5
4
4.5
5
0 500 1000 1500
Co
rre
cte
d A
bso
rban
ce
Time (min)
Wild Type Yeast
Modified Yeast
0
0.5
1
1.5
2
2.5
3
3.5
4
4.5
5
0 500 1000 1500
Co
rre
cte
d A
bso
rban
ce
Time (min)
Wild Type Yeast
Modified Yeast
24
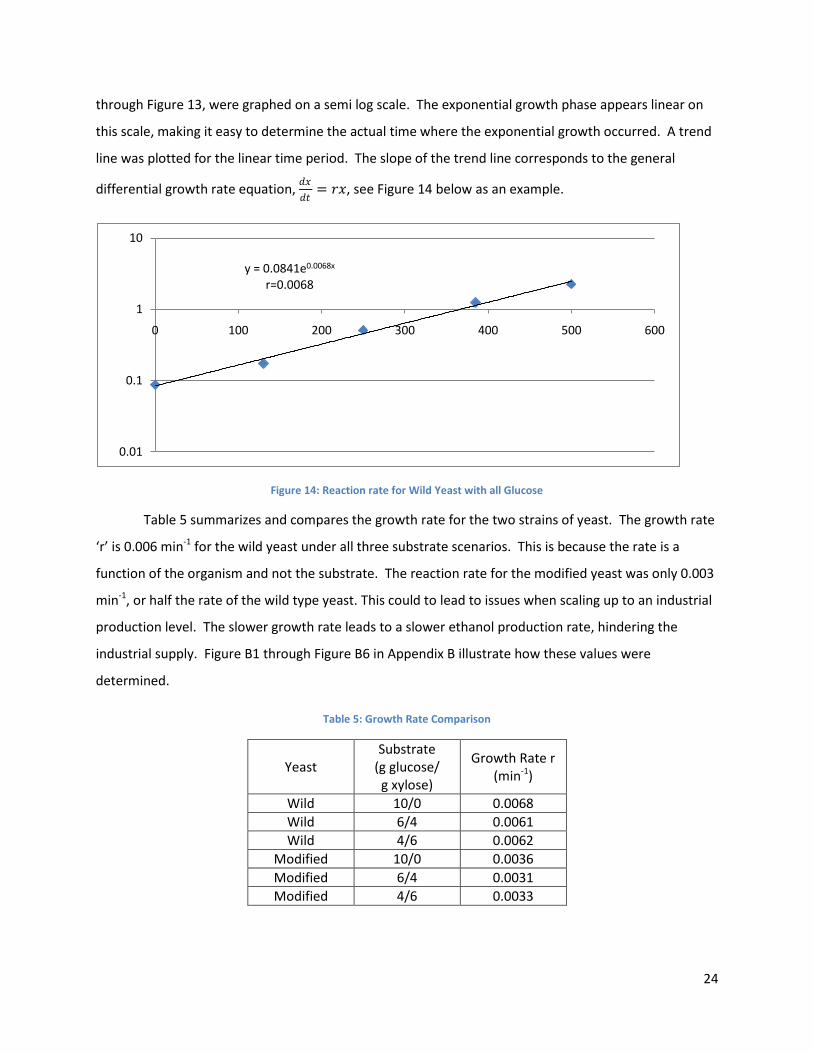
through Figure 13, were graphed on a semi log scale. The exponential growth phase appears linear on
this scale, making it easy to determine the actual time where the exponential growth occurred. A trend
line was plotted for the linear time period. The slope of the trend line corresponds to the general
differential growth rate equation, 𝑑𝑥
𝑑𝑡= 𝑟𝑥, see Figure 14 below as an example.
Figure 14: Reaction rate for Wild Yeast with all Glucose
Table 5 summarizes and compares the growth rate for the two strains of yeast. The growth rate
‘r’ is 0.006 min-1 for the wild yeast under all three substrate scenarios. This is because the rate is a
function of the organism and not the substrate. The reaction rate for the modified yeast was only 0.003
min-1, or half the rate of the wild type yeast. This could to lead to issues when scaling up to an industrial
production level. The slower growth rate leads to a slower ethanol production rate, hindering the
industrial supply. Figure B1 through Figure B6 in Appendix B illustrate how these values were
determined.
Table 5: Growth Rate Comparison
Yeast Substrate
(g glucose/ g xylose)
Growth Rate r (min-1)
Wild 10/0 0.0068
Wild 6/4 0.0061
Wild 4/6 0.0062
Modified 10/0 0.0036
Modified 6/4 0.0031
Modified 4/6 0.0033
y = 0.0841e0.0068x
r=0.0068
0.01
0.1
1
10
0 100 200 300 400 500 600
25
Ethanol Production
Next, the actual amount of ethanol produced in each case was compared. 10.00 g/L of glucose
corresponds to 0.0555 molarity of glucose, as seen in Equation 1.
Equation 1: Moles of Glucose
10.00 ± .005𝑔 𝐺𝑙𝑢𝑐𝑜𝑠𝑒
𝐿 𝑀𝑒𝑑𝑖𝑎×
1 𝑚𝑜𝑙 𝐺𝑙𝑢𝑐𝑜𝑠𝑒
180.16 𝑔 𝐺𝑙𝑢𝑐𝑜𝑠𝑒=
0.0555 ± 0.00006 𝑚𝑜𝑙 𝐺𝑙𝑢𝑐𝑜𝑠𝑒
𝐿 𝑀𝑒𝑑𝑖𝑎
The glucose fermentation reaction 𝐶6𝐻12𝑂6 → 2𝐶2𝐻5𝑂𝐻 + 2𝐶𝑂2 shows that 2 moles of
ethanol are produced from every mole of glucose. This means that at most, 0.111 moles of ethanol, or
0.6% ethanol by volume can be produced. It is not expected that this much ethanol will be produced as
some of it is used for cell production and some is converted to carbon dioxide and other compounds.
Equation 2: Ethanol Produced
0.111 𝑚𝑜𝑙 𝐸𝑡𝑜ℎ
𝐿 𝑀𝑒𝑑𝑖𝑎×
46.07 𝑔 𝐸𝑡𝑜ℎ
1 𝑚𝑜𝑙 𝐸𝑡𝑜ℎ×
𝐿 𝐸𝑡𝑜ℎ
789 𝑔 𝐸𝑡𝑜ℎ=
0.00648 𝐿 𝐸𝑡𝑜ℎ
𝐿 𝑀𝑒𝑑𝑖𝑎= 0.6% 𝑣𝑜𝑙𝑢𝑚𝑒 𝐸𝑡𝑜ℎ
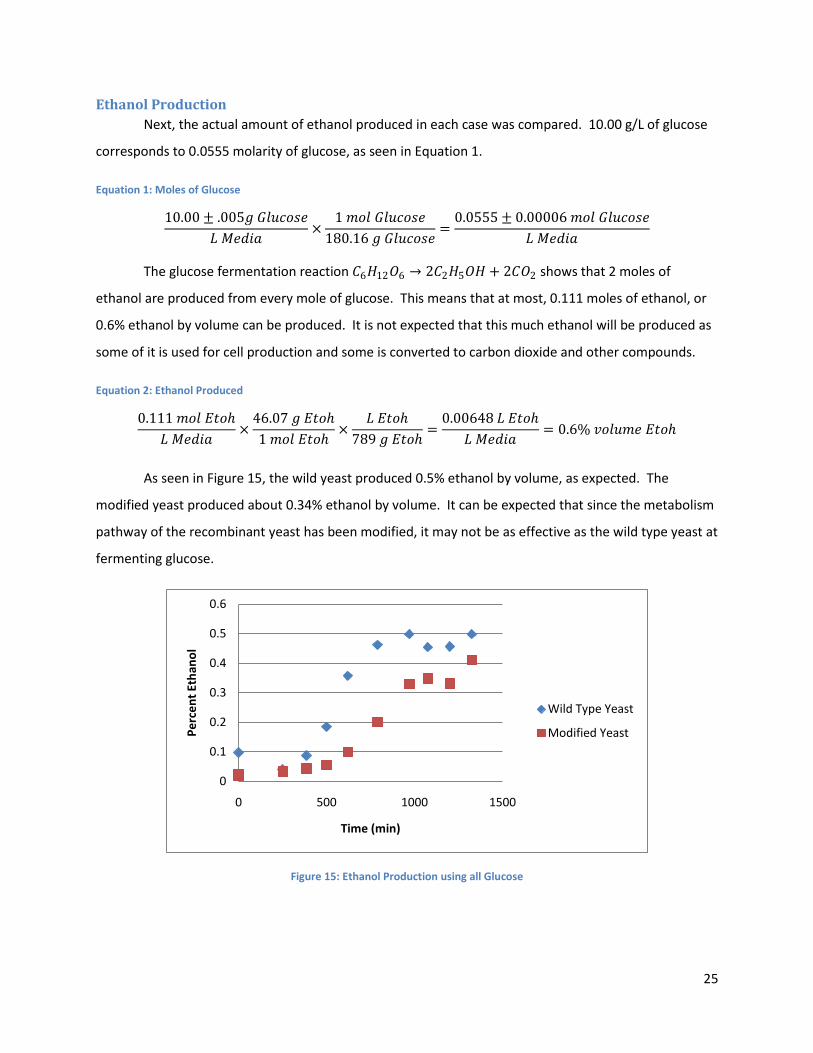
As seen in Figure 15, the wild yeast produced 0.5% ethanol by volume, as expected. The
modified yeast produced about 0.34% ethanol by volume. It can be expected that since the metabolism
pathway of the recombinant yeast has been modified, it may not be as effective as the wild type yeast at
fermenting glucose.
Figure 15: Ethanol Production using all Glucose
0
0.1
0.2
0.3
0.4
0.5
0.6
0 500 1000 1500
Pe
rce
nt
Eth
ano
l
Time (min)
Wild Type Yeast
Modified Yeast
26
The ethanol yield was then determined. The wild typed yeast produced 0.395 grams of ethanol
per gram of substrate, as seen in Equation 3 below. The modified yeast however only had a yield of
0.268 g ethanol per gram of substrate, as seen in Equation 4.
Equation 3: Ethanol Yield for Wild Type Yeast and 10 g/L glucose
. 005 𝐿 𝐸𝑡𝑜ℎ
𝐿 𝑀𝑒𝑑𝑖𝑎×
1 𝐿 𝑀𝑒𝑑𝑖𝑎
10 𝑔 𝐺𝑙𝑢𝑐𝑜𝑠𝑒×
789 𝑔 𝐸𝑡𝑜ℎ
1 𝐿 𝐸𝑡𝑜ℎ=
0.395 𝑔 𝐸𝑡𝑜ℎ
𝑔 𝐺𝑙𝑢𝑐𝑜𝑠𝑒
Equation 4: Ethanol Yield for Modified Yeast and 10 g/L glucose
. 0034 𝐿 𝐸𝑡𝑜ℎ
𝐿 𝑀𝑒𝑑𝑖𝑎×
1 𝐿 𝑀𝑒𝑑𝑖𝑎
10 𝑔 𝐺𝑙𝑢𝑐𝑜𝑠𝑒×
789 𝑔 𝐸𝑡𝑜ℎ
1 𝐿 𝐸𝑡𝑜ℎ=
0.268 𝑔 𝐸𝑡𝑜ℎ
𝑔 𝐺𝑙𝑢𝑐𝑜𝑠𝑒
For the second case there was 0.0333 moles of glucose available and 0.0266 moles of xylose, as
calculated in Equation 5 and Equation 6.
Equation 5: Glucose in Media
6.00 ± .005 𝑔 𝐺𝑙𝑢𝑐𝑜𝑠𝑒
𝐿 𝑀𝑒𝑑𝑖𝑎×
1 𝑚𝑜𝑙 𝐺𝑙𝑢𝑐𝑜𝑠𝑒
180.16 𝑔 𝐺𝑙𝑢𝑐𝑜𝑠𝑒=
0.0333 ± .00006 𝑚𝑜𝑙 𝐺𝑙𝑢𝑐𝑜𝑠𝑒
𝐿 𝑀𝑒𝑑𝑖𝑎
Equation 6: Xylose in Media
4.00 ± .005 𝑔 𝑋𝑦𝑙𝑜𝑠𝑒
𝐿 𝑀𝑒𝑑𝑖𝑎×
1 𝑚𝑜𝑙 𝑋𝑦𝑙𝑜𝑠𝑒
150.13 𝑔 𝑋𝑦𝑙𝑜𝑠𝑒=
0.0266 ± .00003 𝑚𝑜𝑙 𝑋𝑦𝑙𝑜𝑠𝑒
𝐿 𝑀𝑒𝑑𝑖𝑎
The xylose fermentation reaction 3𝐶5𝐻10𝑂5 → 5𝐶2𝐻5𝑂𝐻 + 5𝐶𝑂2 shows that there is a 3:5
mole ratio of xylose to ethanol. This means that 0.0666 moles of ethanol can potentially be produced
from the glucose and 0.0443 moles of ethanol formed from the xylose. This means that at most 0.39%
volume of ethanol can be expected from the wild yeast and 0.65% volume ethanol can be expected from
the modified yeast, as seen below.
Equation 7: Ethanol produced by Wild Yeast
0.0666 𝑚𝑜𝑙 𝐸𝑡𝑜ℎ
𝐿 𝑀𝑒𝑑𝑖𝑎×
46.07 𝑔 𝐸𝑡𝑜ℎ
1 𝑚𝑜𝑙 𝐸𝑡𝑜ℎ×
𝐿 𝐸𝑡𝑜ℎ
789 𝑔 𝐸𝑡𝑜ℎ=
0.00389 𝐿 𝐸𝑡𝑜ℎ
𝐿 𝑀𝑒𝑑𝑖𝑎= 0.39% 𝑣𝑜𝑙𝑢𝑚𝑒 𝐸𝑡𝑜ℎ
Equation 8: Ethanol produced by Modified Yeast
(0.0666 + .0443) 𝑚𝑜𝑙 𝐸𝑡𝑜ℎ
𝐿 𝑀𝑒𝑑𝑖𝑎×
46.07 𝑔 𝐸𝑡𝑜ℎ
1 𝑚𝑜𝑙 𝐸𝑡𝑜ℎ×
𝐿 𝐸𝑡𝑜ℎ
789 𝑔 𝐸𝑡𝑜ℎ=
0.00648 𝐿 𝐸𝑡𝑜ℎ
𝐿 𝑀𝑒𝑑𝑖𝑎= 0.65% 𝑣𝑜𝑙𝑢𝑚𝑒 𝐸𝑡𝑜ℎ
These determinations rely on the assumption that wild yeast does not utilize any xylose, and the
modified yeast consumes all of the glucose and xylose. As seen in Figure 16 below, the modified yeast
produces about 0.51% ethanol by volume. This value is very reasonable, as the recombinant yeast does

27
not fully utilize the glucose to the extent that the wild yeast did, shown in Experiment 1. The modified
yeast produced about 78.5% of the maximum amount of ethanol. The modified yeast also produced
more ethanol then would be possible if only the glucose was used, confirming that the yeast is utilizing
the xylose.
The wild type yeast produced ethanol in excess of the expected amount. However, as discussed
previously, there was most likely a human error in substrate measurements. When taken into
consideration with the higher than expected cell growth, the high concentration of ethanol is
reasonable. The lower ethanol concentration value seen in Figure 16 at 1100 minutes is under 4% and
should be taken as the maximum. This value is from Experiment 3, where no significant errors were
expected. Higher values after 800 minutes are from Experiment 2, most likely from previously discussed
errors.
Figure 16: Ethanol Production using 6g/L glucose and 4g/L xylose
The ethanol yield was again determined. The total amount of substrate used was again 10
grams, however in this case it was a combination of glucose and xylose. The wild yeast only utilized the
glucose, and therefore has a much lower yield then the modified yeast as seen in Equation 9 and
Equation 10 below.
0
0.1
0.2
0.3
0.4
0.5
0.6
0 500 1000 1500
Pe
rce
nt
Eth
ano
l
Time (min)
Wild Type Yeast
Modified Yeast

28
Equation 9: Ethanol Yield for Wild Type Yeast and 6 g/L glucose, 4 g/L xylose
. 0035 𝐿 𝐸𝑡𝑜ℎ
𝐿 𝑀𝑒𝑑𝑖𝑎×
1 𝐿 𝑀𝑒𝑑𝑖𝑎
10 𝑔 𝑆𝑢𝑏𝑠𝑡𝑟𝑎𝑡𝑒×
789 𝑔 𝐸𝑡𝑜ℎ
1 𝐿 𝐸𝑡𝑜ℎ=
0.276 𝑔 𝐸𝑡𝑜ℎ
𝑔 𝐺𝑙𝑢𝑐𝑜𝑠𝑒
Equation 10: Ethanol Yield for Modified Yeast and 6 g/L glucose, 4 g/L xylose
. 0051 𝐿 𝐸𝑡𝑜ℎ
𝐿 𝑀𝑒𝑑𝑖𝑎×
1 𝐿 𝑀𝑒𝑑𝑖𝑎
10 𝑔 𝑆𝑢𝑏𝑠𝑡𝑟𝑎𝑡𝑒×
789 𝑔 𝐸𝑡𝑜ℎ
1 𝐿 𝐸𝑡𝑜ℎ=
0.402 𝑔 𝐸𝑡𝑜ℎ
𝑔 𝐺𝑙𝑢𝑐𝑜𝑠𝑒
For the third case, 4 g/L glucose and 6 g/L xylose, there are 0.0222 moles of glucose and 0.0340
moles of xylose available, shown below.
Equation 11: Glucose in Media
4.00 ± .005 𝑔 𝐺𝑙𝑢𝑐𝑜𝑠𝑒
𝐿 𝑀𝑒𝑑𝑖𝑎×
1 𝑚𝑜𝑙 𝐺𝑙𝑢𝑐𝑜𝑠𝑒
180.16 𝑔 𝐺𝑙𝑢𝑐𝑜𝑠𝑒=
0.0222 ± .00006 𝑚𝑜𝑙 𝐺𝑙𝑢𝑐𝑜𝑠𝑒
𝐿 𝑀𝑒𝑑𝑖𝑎
Equation 12: Xylose in Media
6.00 ± .005 𝑔 𝑋𝑦𝑙𝑜𝑠𝑒
𝐿 𝑀𝑒𝑑𝑖𝑎×
1 𝑚𝑜𝑙 𝑋𝑦𝑙𝑜𝑠𝑒
150.13 𝑔 𝑋𝑦𝑙𝑜𝑠𝑒=
0.0340 ± .00003 𝑚𝑜𝑙 𝑋𝑦𝑙𝑜𝑠𝑒
𝐿 𝑀𝑒𝑑𝑖𝑎
This means that 0.0444 moles of ethanol can potentially be produced from glucose and 0.0567
moles of ethanol from xylose. At most 0.26% volume of ethanol can be expected from the wild yeast
and 0.59% volume ethanol can be expected from the modified yeast when using the same assumptions
regarding sugar metabolism previously stated. This is shown in Equation 13 and Equation 14 below.
Equation 13: Ethanol produced by Wild Yeast
0.0444 𝑚𝑜𝑙 𝐸𝑡𝑜ℎ
𝐿 𝑀𝑒𝑑𝑖𝑎×
46.07 𝑔 𝐸𝑡𝑜ℎ
1 𝑚𝑜𝑙 𝐸𝑡𝑜ℎ×
𝐿 𝐸𝑡𝑜ℎ
789 𝑔 𝐸𝑡𝑜ℎ=
0.00259 𝐿 𝐸𝑡𝑜ℎ
𝐿 𝑀𝑒𝑑𝑖𝑎= 0.26% 𝑣𝑜𝑙𝑢𝑚𝑒 𝐸𝑡𝑜ℎ
Equation 14: Ethanol produced by Modified Yeast
(0.0444 + .0567) 𝑚𝑜𝑙 𝐸𝑡𝑜ℎ
𝐿 𝑀𝑒𝑑𝑖𝑎×
46.07 𝑔 𝐸𝑡𝑜ℎ
1 𝑚𝑜𝑙 𝐸𝑡𝑜ℎ×
𝐿 𝐸𝑡𝑜ℎ
789 𝑔 𝐸𝑡𝑜ℎ=
0.00590 𝐿 𝐸𝑡𝑜ℎ
𝐿 𝑀𝑒𝑑𝑖𝑎= 0.59% 𝑣𝑜𝑙𝑢𝑚𝑒 𝐸𝑡𝑜ℎ
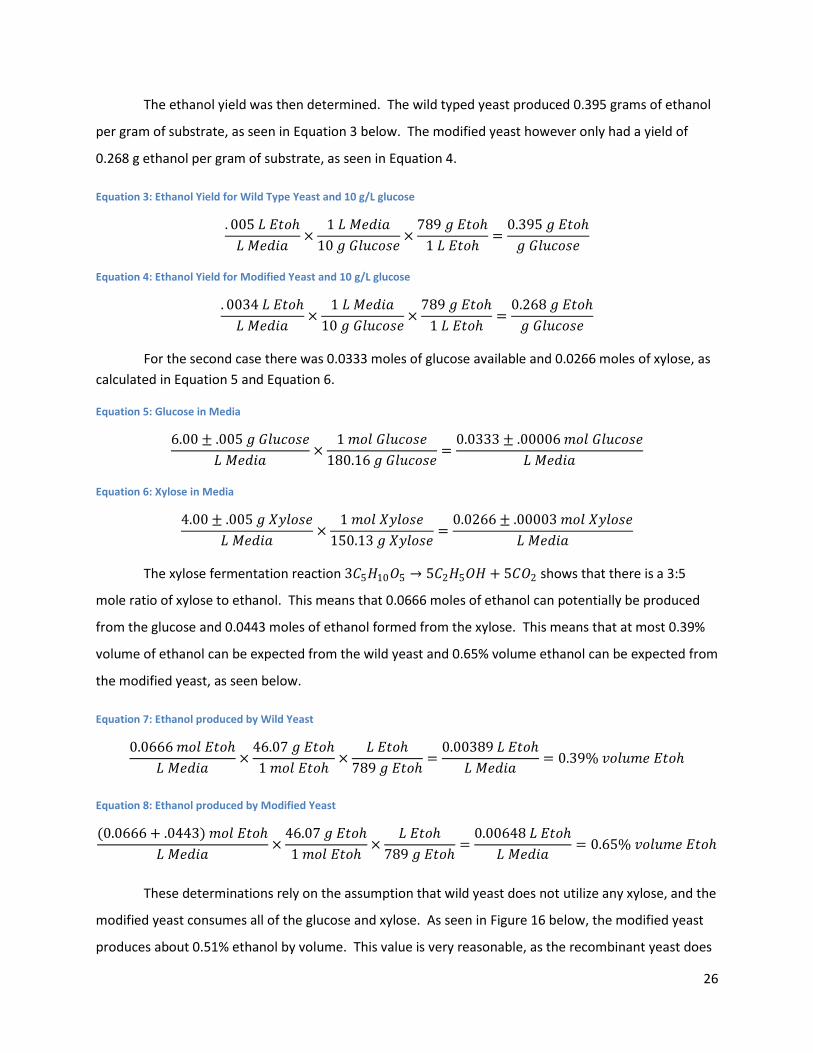
As seen in Figure 17, the wild yeast produced around 0.3% volume ethanol. While this is higher
than expected it is close to the expected value and can be assumed to be within the margin of error.
The modified yeast however only produced 0.35% by volume of ethanol. This is only 59.3% of the
maximum amount as compared to the 78.5% seen in the previous case. This would suggest that this
strain of yeast utilizes the xylose even less efficiently then it utilizes the glucose.
29
Figure 17: Ethanol Production using 4 g/L glucose and 6 g/L xylose
The ethanol yield was much lower for this substrate ratio. The wild yeast again only utilized the
glucose, and therefore a much lower yield was expected. The modified yeast should have utilized both
the glucose and xylose and should have maintained a higher ethanol yield, but it does not seem to use
the xylose to the same degree with the smaller amount of glucose available. See Equation 15and
Equation 16below.
Equation 15: Ethanol Yield for Wild Type Yeast and 4 g/L glucose, 6 g/L xylose
. 003 𝐿 𝐸𝑡𝑜ℎ
𝐿 𝑀𝑒𝑑𝑖𝑎×
1 𝐿 𝑀𝑒𝑑𝑖𝑎
10 𝑔 𝑆𝑢𝑏𝑠𝑡𝑟𝑎𝑡𝑒×
789 𝑔 𝐸𝑡𝑜ℎ
1 𝐿 𝐸𝑡𝑜ℎ=
0.237 𝑔 𝐸𝑡𝑜ℎ
𝑔 𝐺𝑙𝑢𝑐𝑜𝑠𝑒
Equation 16: Ethanol Yield for Modified Yeast and 4 g/L glucose, 6 g/L xylose
. 0035 𝐿 𝐸𝑡𝑜ℎ
𝐿 𝑀𝑒𝑑𝑖𝑎×
1 𝐿 𝑀𝑒𝑑𝑖𝑎
10 𝑔 𝑆𝑢𝑏𝑠𝑡𝑟𝑎𝑡𝑒×
789 𝑔 𝐸𝑡𝑜ℎ
1 𝐿 𝐸𝑡𝑜ℎ=
0.276 𝑔 𝐸𝑡𝑜ℎ
𝑔 𝐺𝑙𝑢𝑐𝑜𝑠𝑒
The higher than expected values for the wild type yeast may also suggest that it is utilizing the
xylose to some small degree. Wild type yeast may have the ability to utilize xylose for cell growth,
leaving additional glucose for ethanol fermentation. Further studies would have to be conducted to
confirm this theory. Also, there is a small amount of ethanol at time zero, but this amount is not
determinable within the margin of error and is therefore assumed to be zero. This ethanol is generated
in the inoculation tubes prior to the beginning of the experiment.
-0.1
6E-16
0.1
0.2
0.3
0.4
0.5
0.6
0 500 1000 1500
Pe
rce
nt
Eth
ano
l
Time (min)
Wild Type Yeast
Modified Yeast
30
Experiment 4 Previous research with this strain of recombinant yeast suggested that the yeast could not grow
and thrive on xylose alone, and glucose was needed to ‘jumpstart’ the reaction. The yeast were grown
in a solution containing 10g/L of substrate, with only a limited amount of glucose, ranging from 0g/L to 2
g/L. This study confirmed that glucose is necessary, and approximated how much glucose was needed
to start the reaction.
Cell Growth
Overall there was limited cell growth with both strains of yeast, even when 2 g/L of glucose was
used. As expected, the wild yeast did not grow without any glucose. When given 10g/L glucose the wild
type yeast grew to a concentration corresponding to an absorbance reading of 3.5, much higher than
growth seen in Figure 18 below.
Figure 18: Cell Growth under limited glucose conditions
Ethanol Production
The ethanol production was analyzed in the same fashion as in Experiments 2 and 3. When no
glucose was used, no discernable amount of ethanol was produced by either the wild type or the
0
0.5
1
1.5
2
2.5
0 200 400 600 800 1000 1200
Co
rre
cte
d A
bso
rban
ce
Time (min)
Wild Type 0g/L Glucose Wild Type 1g/L Glucose Wild Type 2 g/L Glucose
Modified 0 g/L Glucose Modified 1 g/L Glucose Modified 2 g/L Glucose
31
modified yeast, seen in Figure 19. Therefore it can be assumed that the modified yeast does need some
glucose to start the fermentation reaction. Also, as expected the wild type yeast did not produce any
ethanol since it does not have the ability to metabolize xylose into ethanol.
Figure 19: Ethanol Production with no Glucose
For the second case, where 1 g/L of glucose was used, 0.0056 moles of glucose was available for
fermentation and could potentially produce at most 0.0112 moles of ethanol. For the wild type yeast
this means that at most 0.06% by volume of ethanol was expected. There is however an additional
0.0599 moles of xylose available to the modified yeast, which could produce at most 0.100 additional
moles of ethanol. If the modified yeast used the xylose the expected ethanol concentration would be
0.65% by volume, shown below.
Equation 17: Glucose in Media
1.00 ± .005 𝑔 𝐺𝑙𝑢𝑐𝑜𝑠𝑒
𝐿 𝑀𝑒𝑑𝑖𝑎×
1 𝑚𝑜𝑙 𝐺𝑙𝑢𝑐𝑜𝑠𝑒
180.16 𝑔 𝐺𝑙𝑢𝑐𝑜𝑠𝑒=
0.0056 ± .00006 𝑚𝑜𝑙 𝐺𝑙𝑢𝑐𝑜𝑠𝑒
𝐿 𝑀𝑒𝑑𝑖𝑎
Equation 18: Xylose in Media
9.00 ± .005 𝑔 𝑋𝑦𝑙𝑜𝑠𝑒
𝐿 𝑀𝑒𝑑𝑖𝑎×
1 𝑚𝑜𝑙 𝑋𝑦𝑙𝑜𝑠𝑒
150.13 𝑔 𝑋𝑦𝑙𝑜𝑠𝑒=
0.0599 ± .00003 𝑚𝑜𝑙 𝑋𝑦𝑙𝑜𝑠𝑒
𝐿 𝑀𝑒𝑑𝑖𝑎
Equation 19: Ethanol produced by Wild Yeast
0.0112 𝑚𝑜𝑙 𝐸𝑡𝑜ℎ
𝐿 𝑀𝑒𝑑𝑖𝑎×
46.07 𝑔 𝐸𝑡𝑜ℎ
1 𝑚𝑜𝑙 𝐸𝑡𝑜ℎ×
𝐿 𝐸𝑡𝑜ℎ
789 𝑔 𝐸𝑡𝑜ℎ=
0.00065 𝐿 𝐸𝑡𝑜ℎ
𝐿 𝑀𝑒𝑑𝑖𝑎= 0.06% 𝑣𝑜𝑙𝑢𝑚𝑒 𝐸𝑡𝑜ℎ
0
0.02
0.04
0.06
0.08
0.1
0.12
0.14
0 200 400 600 800 1000 1200
Pe
rce
nt
Eth
ano
l
Time (min)
Wild Type Yeast
Modified Yeast

32
Equation 20: Ethanol produced by Modified Yeast
(0.0112 + .100) 𝑚𝑜𝑙 𝐸𝑡𝑜ℎ
𝐿 𝑀𝑒𝑑𝑖𝑎×
46.07 𝑔 𝐸𝑡𝑜ℎ
1 𝑚𝑜𝑙 𝐸𝑡𝑜ℎ×
𝐿 𝐸𝑡𝑜ℎ
789 𝑔 𝐸𝑡𝑜ℎ=
0.00649 𝐿 𝐸𝑡𝑜ℎ
𝐿 𝑀𝑒𝑑𝑖𝑎= 0.65% 𝑣𝑜𝑙𝑢𝑚𝑒 𝐸𝑡𝑜ℎ
As seen in Figure 20 however, the modified yeast performed nearly the same as the wild type
yeast, producing 0.06% ethanol by volume. This suggests that both types of yeast use the glucose and
were not able to utilize the xylose.
Figure 20: Ethanol Production with 1 g/L Glucose and 9g/L Xylose
The same analysis for 2 g/L of glucose concluded that 0.0111 moles of glucose can produce
0.0222 moles of ethanol, and 0.0533 moles of xylose can produce 0.0888 moles of ethanol. This would
allow for the wild type yeast to produce 0.13% ethanol by volume and the modified yeast to produce
0.65% ethanol by volume, shown below.
Equation 21: Glucose in Media
2.00 ± .005 𝑔 𝐺𝑙𝑢𝑐𝑜𝑠𝑒
𝐿 𝑀𝑒𝑑𝑖𝑎×
1 𝑚𝑜𝑙 𝐺𝑙𝑢𝑐𝑜𝑠𝑒
180.16 𝑔 𝐺𝑙𝑢𝑐𝑜𝑠𝑒=
0.0111 ± .00006 𝑚𝑜𝑙 𝐺𝑙𝑢𝑐𝑜𝑠𝑒
𝐿 𝑀𝑒𝑑𝑖𝑎
Equation 22: Xylose in Media
8.00 ± .005 𝑔 𝑋𝑦𝑙𝑜𝑠𝑒
𝐿 𝑀𝑒𝑑𝑖𝑎×
1 𝑚𝑜𝑙 𝑋𝑦𝑙𝑜𝑠𝑒
150.13 𝑔 𝑋𝑦𝑙𝑜𝑠𝑒=
0.0533 ± .00003 𝑚𝑜𝑙 𝑋𝑦𝑙𝑜𝑠𝑒
𝐿 𝑀𝑒𝑑𝑖𝑎
Equation 23: Ethanol produced by Wild Yeast
0.0222 𝑚𝑜𝑙 𝐸𝑡𝑜ℎ
𝐿 𝑀𝑒𝑑𝑖𝑎×
46.07 𝑔 𝐸𝑡𝑜ℎ
1 𝑚𝑜𝑙 𝐸𝑡𝑜ℎ×
𝐿 𝐸𝑡𝑜ℎ
789 𝑔 𝐸𝑡𝑜ℎ=
0.00130 𝐿 𝐸𝑡𝑜ℎ
𝐿 𝑀𝑒𝑑𝑖𝑎= 0.13% 𝑣𝑜𝑙𝑢𝑚𝑒 𝐸𝑡𝑜ℎ
-0.01
0.01
0.03
0.05
0.07
0.09
0.11
0.13
0.15
0 200 400 600 800 1000 1200
Pe
rce
nt
Eth
ano
l
Time (min)
Wild Type Yeast
Modified Yeast

33
Equation 24: Ethanol produced by Modified Yeast
0.0222 + .0888 𝑚𝑜𝑙 𝐸𝑡𝑜ℎ
𝐿 𝑀𝑒𝑑𝑖𝑎×
46.07 𝑔 𝐸𝑡𝑜ℎ
1 𝑚𝑜𝑙 𝐸𝑡𝑜ℎ×
𝐿 𝐸𝑡𝑜ℎ
789 𝑔 𝐸𝑡𝑜ℎ=
0.00648 𝐿 𝐸𝑡𝑜ℎ
𝐿 𝑀𝑒𝑑𝑖𝑎= 0.65% 𝑣𝑜𝑙𝑢𝑚𝑒 𝐸𝑡𝑜ℎ
However, as seen in Figure 21, the same situation occurs where the modified yeast performs
similarly to the wild type yeast. Both types produce about 0.1% ethanol by volume.
Figure 21: Ethanol Production with 2 g/L Glucose and 8 g/L Xylose
-0.01
0.01
0.03
0.05
0.07
0.09
0.11
0.13
0.15
0 200 400 600 800 1000 1200
Pe
rce
nt
Eth
ano
l
Time (min)
Wild Type Yeast
Modified Yeast
34
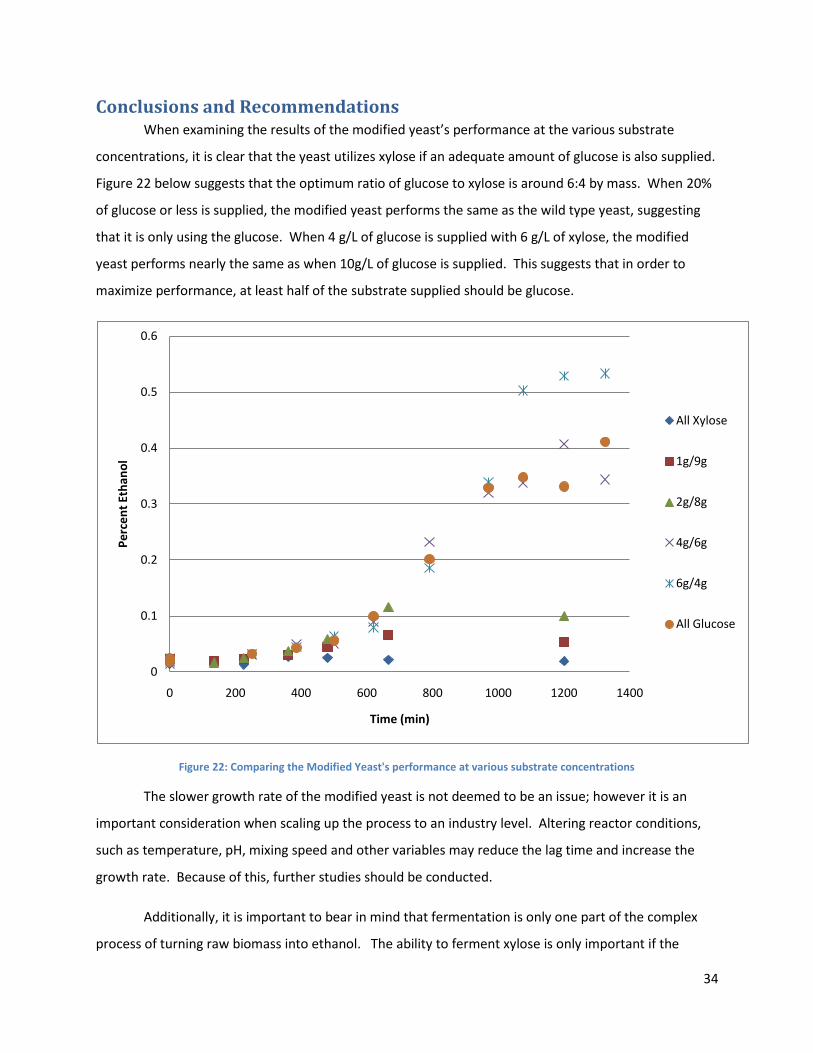
Conclusions and Recommendations When examining the results of the modified yeast’s performance at the various substrate
concentrations, it is clear that the yeast utilizes xylose if an adequate amount of glucose is also supplied.
Figure 22 below suggests that the optimum ratio of glucose to xylose is around 6:4 by mass. When 20%
of glucose or less is supplied, the modified yeast performs the same as the wild type yeast, suggesting
that it is only using the glucose. When 4 g/L of glucose is supplied with 6 g/L of xylose, the modified
yeast performs nearly the same as when 10g/L of glucose is supplied. This suggests that in order to
maximize performance, at least half of the substrate supplied should be glucose.
Figure 22: Comparing the Modified Yeast's performance at various substrate concentrations
The slower growth rate of the modified yeast is not deemed to be an issue; however it is an
important consideration when scaling up the process to an industry level. Altering reactor conditions,
such as temperature, pH, mixing speed and other variables may reduce the lag time and increase the
growth rate. Because of this, further studies should be conducted.
Additionally, it is important to bear in mind that fermentation is only one part of the complex
process of turning raw biomass into ethanol. The ability to ferment xylose is only important if the
0
0.1
0.2
0.3
0.4
0.5
0.6
0 200 400 600 800 1000 1200 1400
Pe
rce
nt
Eth
ano
l
Time (min)
All Xylose
1g/9g
2g/8g
4g/6g
6g/4g
All Glucose

35
xylose can be obtained from the raw materials. Better hydrolysis methods are required for the process
to become sustainable and further research in this area is required.
36
References 1. Simon, Karl. Perspective on Biofuels in the United States. Rep. EPA Office of
Transportation and Air Quality, 2005
2. Greene, Nathanael. How Biofuels Can Help End America's Oil Dependence. Tech. Natural
Resources Defense Council, Dec. 2004. Web. 11 Apr. 2010.
<http://www.bio.org/ind/GrowingEnergy.pdf>.
3. US Department of Energy. Energy from Biofuels: The Greening of America. US
Department of Energy, 2008. Print.
4. "Biofuels." Alternative Energy. Web. 11 Apr. 2010.
<http://www.alternative-energy-news.info/technology/biofuels/>.
5. “Biofuels.” Combustion Analysis. Web. 1 Apr. 2010.
<http://www.habmigern2003.info/biogas/biofuels.html>
6. "Liquid Biofuels for Transport: Prospects, Risks and Opportunities." GreenFacts - Facts
on Health and the Environment. Web. 12 Apr. 2010.
<http://www.greenfacts.org/en /biofuels/l-3/1-definition.htm>
7. Muller, Mark, Tammy Yelden, and Heather Schoonover. Food versus Fuel in the United
States Can Both Win in the Era of Ethanol? ATP Environment and Agriculture Program,
2007.
8. “Food-VS-Fuel Debate”. Bioenergy Wiki. National Wildlife Federation. Web. 22 April
2010.
<http://www.bioenergywiki.net/Food-versus-fuel_debate>
9. "Food vs. Fuel." Business Week. 5 Feb. 2007. Web. 11 Apr. 2010.
<http://www.businessweek.com/magazine/content/07_06/b4020093.htm>
10. LORENTZEN, AMY. "Ethanol Makers Join Food Vs. Fuel Debate." The Washtington Post.
The Washington Post. 2 Aug. 2007. Web. 11 Apr. 2010.
<http://www.washingtonpost.com/wp-dyn/content/article/2007/08/02
/AR2007080200249.html>.
11. Klass, Donald L., Caroline S. Harwood, and Arnold Demain. Bioenergy. Washington, DC:
ASM Press, 2008. Print.
12. Klass, Donald L. Biomass for Renewable Energy, Fuels, and Chemicals. San Diego, CA:
Academic Press, 1998. Print.
13. Carroll, A. and Somerville C. “Cellulosic Biofuels” Annual Review of Plant Biology 2009,
60 pp. 165-182.
14. "Bacteria - The Role Of Bacteria In Fermentation." Science Rank. 2008. Web. 11 Apr.
2010.
<http://science.jrank.org/pages/710/Bacteria-role-bacteria-in-fermentation.html>.
15. The Merck Index: An Encyclopedia of Chemicals, Drugs, and Biologicals (11th ed.),
Merck, 1989
37
16. Andrew Carroll and Chris Somerville “Cellulosic Biofuels” Annual Review of Plant Biology
2009, Vol. 60, pp. 165-182.
17. McMurry, John E. (1988), Organic Chemistry (2nd ed.), Brooks/Cole, p. 866
18. Demers, A., Doane, R., Guzman, S., and Pagano, R. (2009) “Enzymatic Hydrolysis of
Cellulosic Biomass.” Worcester Polytechnic Institute, Chemical Engineering. Worcester:
WPI.
19. DiIorio, A. A. (1986). “Ethanol Production by an Isogenic Series of Saccharomyces
Cerevisiae.” Worcester Polytechnic Institute, Biotechnology. Worcester: WPI.
20. Jeffries, T.W., et al. (March 2007). "Genome sequence of the lignocellulose-
bioconverting and xylose-fermenting yeast Pichia stipitis". Nature Biotechnology 25:
319–326
21. Eliasson et al., “Anaerobic Xylose Fermentation by Recombinant Saccharomyces
cerevisiae Carrying XYL1, XYL2, and XKS1 in Mineral Medium in Chemostat Cultures.”
Applied and Environmental Microbiology, 2000
22. Fuel Ethanol Production. (2009, 19-October). Retrieved 2009, 2-11 from US
Department of Energy: Genomic Science Program:
<http://genomicsgtl.energy.gov/biofuels/ethanolproduction.shtml>
23. “Enzymatic Hydrolysis” Biofuel Industries. Cogeneration Technologies Company. Web.
22 March 2010. <http://www.cogeneration.net/enzymatic_hydrolysis.htm>
24. Chamy R.; Illanes A.; Aroca G.; Nunez L. “Acid Hydrolysis of Sugar Beet Pulp.”
Bioresource Technology 50 149-152.
<http://cat.inist.fr/?aModele=afficheN&cpsidt=3416235>
25. Jean-Luc Legras, Didier Merdinoglu, Jean-Marie Cornuet and Francis Karst. (2007.).
"Bread, beer and wine: Saccharomyces cerevisiae diversity reflects human history".
Molecular Ecology 16 (10): 2091–2102
26. Karhumaa et al., “Comparison of the xylose reductase-xylitol dehydrogenase and the
xylose isomerase pathways for xylose fermentation by recombinant Saccharomyces
cerevisiae.” Microbial Cell Factories, 2007
27. Perry, A. (2009,28-July). New Yeasts Could Help Fast-Track Biofuel Production.
Retrieved 2009, 2-11 from USDA: Agricultural Research Service:
<www.ars.usda.gov/is/pr/2009/090728.htm>
28. Purdue Yeast Makes Ethanol from Agricultural Waste More Effectively. (2004, 29-
June). Retrieved 11 February 2009.
<http://www.innovations-report.com/html/reports/energy_engineering/report-
30711.html>
29. Swana, J. (2009, November). Personal interview.
30. “The Role Of Bacteria In Fermentation.” Science Encyclopedia. Web. 15 April 2010.
<http://science.jrank.org/pages/710/Bacteria-role-bacteria-in-fermentation.html>

38
31. Gunasekaran P.; and Chandra Raj, K. “Ethanol Fermentation Technology – Zymomonas
Mobilis.” Madurai Kamaraj University, Microbial Technology. Madurai.
<http://www.ias.ac.in/currsci/jul10/articles14.htm>

39
Appendix A: Raw Data Collected
Table A1: Experiment 1 Raw Data
Time Flask Dilution Abs Corrected Abs
Area
85 A 3 0.034 0.102
85 B 3 0.013 0.039
85 C 3 0.027 0.081
85 D 3 0.075 0.225
85 E 3 0.032 0.096
85 F 3 0.038 0.114
145 A 3 0.027 0.081
145 B 3 0.013 0.039
145 C 3 0.026 0.078
145 D 3 0.072 0.216
145 E 3 0.03 0.09
145 F 3 0.032 0.096
235 A 3 0.048 0.144
235 B 3 0.023 0.069
235 C 3 0.056 0.168
235 D 3 0.082 0.246
235 E 3 0.058 0.174
235 F 3 0.041 0.123
310 A 3 0.079 0.237
310 B 3 0.028 0.084
310 C 3 0.079 0.237
310 D 3 0.076 0.228
310 E 3 0.084 0.252
310 F 3 0.043 0.129
365 A 3 0.199 0.597 2.0500E+05
365 B 3 0.035 0.105 5.7480E+05
365 C 3 0.129 0.387 1.5636E+05
365 D 3 0.08 0.24 5.1088E+04
365 E 3 0.124 0.372 1.2698E+05
365 F 3 0.043 0.129 8.5823E+00
430 A 3 0.228 0.684
430 B 3 0.057 0.171
430 C 3 0.27 0.81
430 D 3 0.12 0.36
430 E 3 0.291 0.873
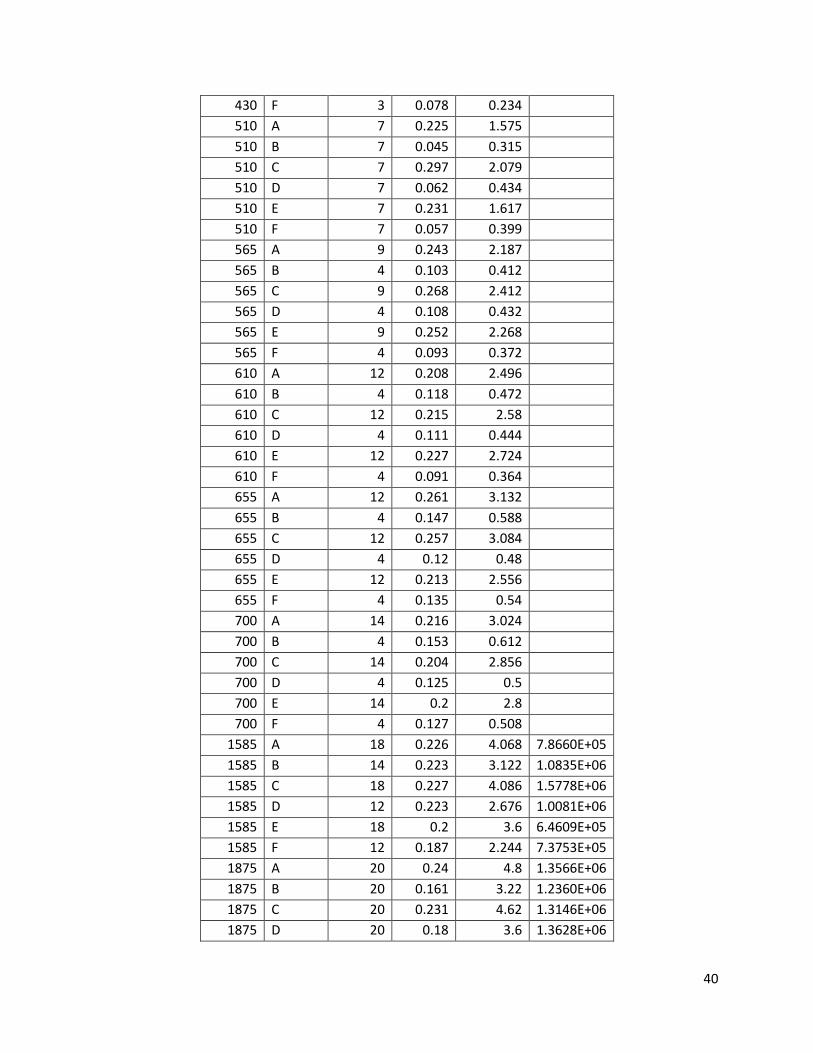
40
430 F 3 0.078 0.234
510 A 7 0.225 1.575
510 B 7 0.045 0.315
510 C 7 0.297 2.079
510 D 7 0.062 0.434
510 E 7 0.231 1.617
510 F 7 0.057 0.399
565 A 9 0.243 2.187
565 B 4 0.103 0.412
565 C 9 0.268 2.412
565 D 4 0.108 0.432
565 E 9 0.252 2.268
565 F 4 0.093 0.372
610 A 12 0.208 2.496
610 B 4 0.118 0.472
610 C 12 0.215 2.58
610 D 4 0.111 0.444
610 E 12 0.227 2.724
610 F 4 0.091 0.364
655 A 12 0.261 3.132
655 B 4 0.147 0.588
655 C 12 0.257 3.084
655 D 4 0.12 0.48
655 E 12 0.213 2.556
655 F 4 0.135 0.54
700 A 14 0.216 3.024
700 B 4 0.153 0.612
700 C 14 0.204 2.856
700 D 4 0.125 0.5
700 E 14 0.2 2.8
700 F 4 0.127 0.508
1585 A 18 0.226 4.068 7.8660E+05
1585 B 14 0.223 3.122 1.0835E+06
1585 C 18 0.227 4.086 1.5778E+06
1585 D 12 0.223 2.676 1.0081E+06
1585 E 18 0.2 3.6 6.4609E+05
1585 F 12 0.187 2.244 7.3753E+05
1875 A 20 0.24 4.8 1.3566E+06
1875 B 20 0.161 3.22 1.2360E+06
1875 C 20 0.231 4.62 1.3146E+06
1875 D 20 0.18 3.6 1.3628E+06
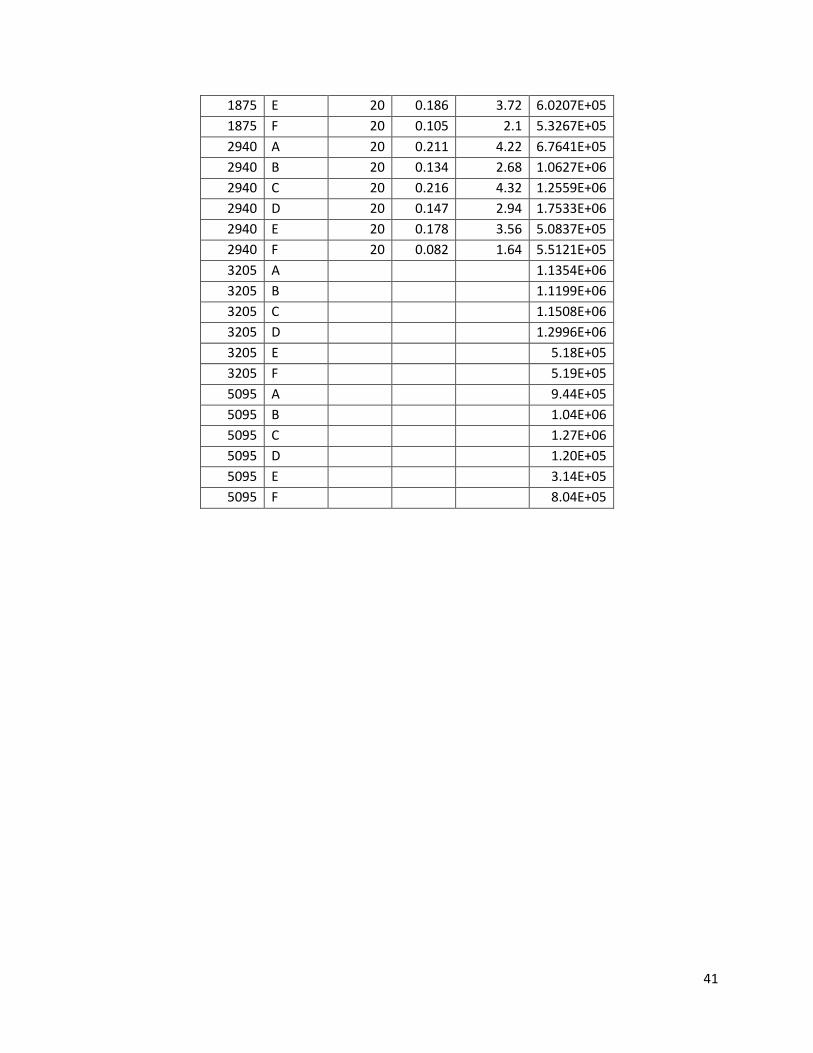
41
1875 E 20 0.186 3.72 6.0207E+05
1875 F 20 0.105 2.1 5.3267E+05
2940 A 20 0.211 4.22 6.7641E+05
2940 B 20 0.134 2.68 1.0627E+06
2940 C 20 0.216 4.32 1.2559E+06
2940 D 20 0.147 2.94 1.7533E+06
2940 E 20 0.178 3.56 5.0837E+05
2940 F 20 0.082 1.64 5.5121E+05
3205 A 1.1354E+06
3205 B 1.1199E+06
3205 C 1.1508E+06
3205 D 1.2996E+06
3205 E 5.18E+05
3205 F 5.19E+05
5095 A 9.44E+05
5095 B 1.04E+06
5095 C 1.27E+06
5095 D 1.20E+05
5095 E 3.14E+05
5095 F 8.04E+05

42
Table A2: Experiment 2 Raw Data
Time Flask Dilution Abs Corrected Abs
Area 1 Area 2 Avg Area
0 A 3 0.042 0.126 1.1999E+05 1.4458E+05 1.3229E+05
790 A 12 0.272 3.264 6.2311E+05 6.3292E+05 6.2802E+05
970 A 16 0.223 3.568 6.7863E+05 6.7673E+05 6.7768E+05
1075 A 18 0.18 3.24 5.3250E+05 7.0358E+05 6.1804E+05
1200 A 18 0.114 2.052 5.3197E+05 7.0844E+05 6.2021E+05
1325 A 18 0.114 2.052 8.0104E+05 5.5408E+05 6.7756E+05
2520 A 18 0.129 2.322 4.0674E+05 4.9845E+05 4.5259E+05
0 B 3 0.05 0.15 3.8662E+04 6.0476E+04 4.9569E+04
790 B 16 0.246 3.936 7.1735E+05 7.9761E+05 7.5748E+05
970 B 18 0.239 4.302 7.6462E+05 7.2260E+05 7.4361E+05
1075 B 18 0.235 4.23 4.4842E+05 4.9793E+05 4.7317E+05
1200 B 18 0.126 2.268 6.6550E+05 7.4797E+05 7.0674E+05
1325 B 18 0.131 2.358 6.4227E+05 6.6811E+05 6.5519E+05
2520 B 18 0.169 3.042 5.4169E+05 5.6031E+05 5.5100E+05
0 C 3 0.051 0.153 1.7731E+04 5.5637E+04 3.6684E+04
790 C 16 0.184 2.944 4.8391E+05 3.8365E+05 4.3378E+05
970 C 18 0.182 3.276 4.7773E+05 4.9270E+05 4.8522E+05
1075 C 18 0.165 2.97 3.4649E+05 3.9139E+05 3.6894E+05
1200 C 18 0.104 1.872 5.8888E+05 5.3081E+05 5.5984E+05
1325 C 18 0.104 1.872 3.7520E+05 4.3213E+05 4.0366E+05
2520 C 18 0.131 2.358 3.6197E+05 3.7461E+05 3.6829E+05
0 D 3 0.04 0.12 2.5129E+04 4.0487E+04 3.2808E+04
790 D 16 0.059 0.944 2.5673E+05 2.9105E+05 2.7389E+05
970 D 10 0.227 2.27 4.4495E+05 4.5023E+05 4.4759E+05
1075 D 10 0.21 2.1 4.9924E+05 4.4823E+05 4.7373E+05
1200 D 10 0.127 1.27 4.8997E+05 4.1043E+05 4.5020E+05
1325 D 18 0.081 1.458 5.8311E+05 5.3521E+05 5.5916E+05
2520 D 18 0.084 1.512 5.8095E+05 5.8441E+05 5.8268E+05
0 E 3 0.047 0.141 3.4761E+04 1.4242E+04 2.4502E+04
790 E 8 0.147 1.176 2.7735E+05 2.2857E+05 2.5296E+05
970 E 10 0.247 2.47 4.6444E+05 4.5841E+05 4.6143E+05
1075 E 10 0.265 2.65 7.1468E+05 6.5304E+05 6.8386E+05
1200 E 10 0.154 1.54 6.7390E+05 7.6530E+05 7.1960E+05
1325 E 11 0.136 1.496 5.9944E+05 8.4989E+05 7.2467E+05
2520 E 10 0.182 1.82 6.8173E+05 7.2830E+05 7.0501E+05
0 F 3 0.041 0.123 1.5921E+04 3.9221E+04 2.7571E+04
790 F 8 0.121 0.968 3.4520E+05 2.8719E+05 3.1619E+05
970 F 10 0.242 2.42 4.6517E+05 4.0499E+05 4.3508E+05
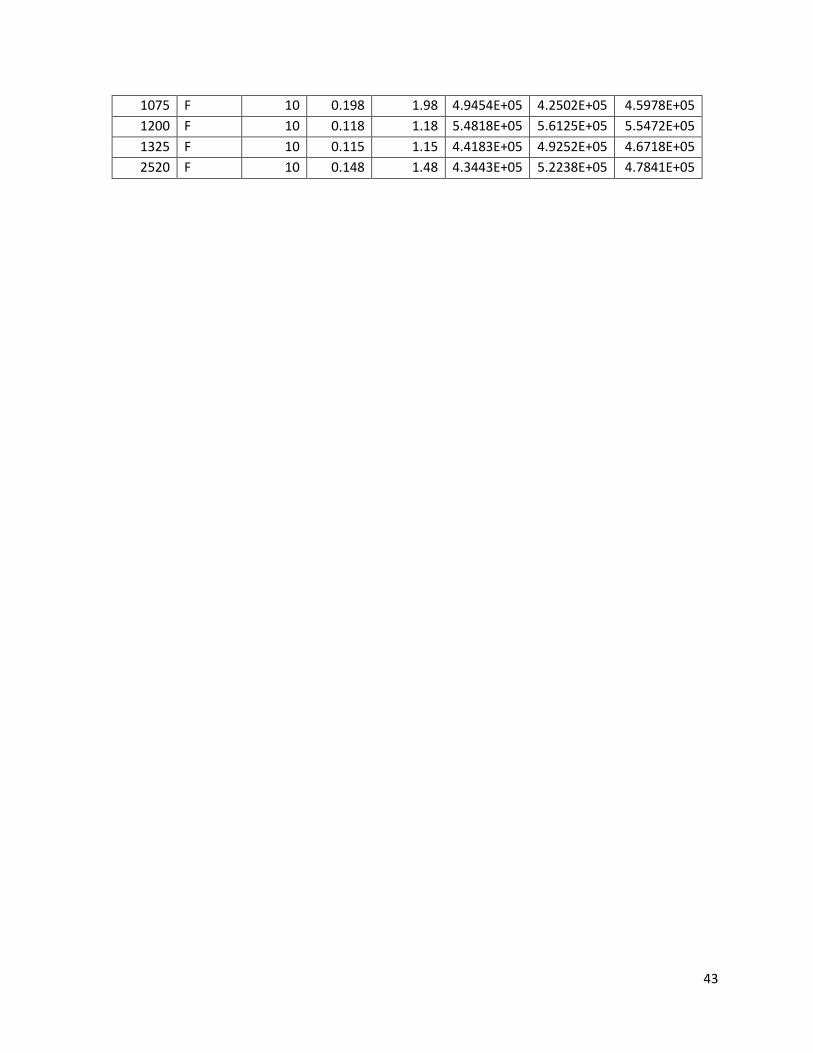
43
1075 F 10 0.198 1.98 4.9454E+05 4.2502E+05 4.5978E+05
1200 F 10 0.118 1.18 5.4818E+05 5.6125E+05 5.5472E+05
1325 F 10 0.115 1.15 4.4183E+05 4.9252E+05 4.6718E+05
2520 F 10 0.148 1.48 4.3443E+05 5.2238E+05 4.7841E+05

44
Table A3: Experiment 3 Raw Data
Time Flask Dilution Abs Corrected Abs
Area 1 Area 2 Avg Area
0 A 3 0.026 0.078 9.52412E+03 1.10109E+04 1.02675E+04
0 B 3 0.032 0.096 1.03272E+04 1.11613E+04 1.07443E+04
0 C 3 0.021 0.063 1.11138E+04 9.46819E+03 1.02910E+04
0 D 3 0.018 0.054 1.45232E+04 1.07742E+04 1.26487E+04
0 E 3 0.022 0.066 1.22140E+04 9.38738E+03 1.08007E+04
0 F 3 0.019 0.057 1.03722E+04 1.24427E+04 1.14075E+04
130 A 3 0.029 0.087
130 B 3 0.035 0.105
130 C 3 0.031 0.093
130 D 3 0.02 0.06
130 E 3 0.023 0.069
130 F 3 0.022 0.066
250 A 3 0.058 0.174 1.78128E+04 1.07643E+04 1.42886E+04
250 B 3 0.067 0.201 1.29752E+04 1.32443E+04 1.31098E+04
250 C 3 0.063 0.189 9.22814E+03 8.74381E+03 8.98598E+03
250 D 3 0.033 0.099 9.93513E+03 1.21125E+04 1.10238E+04
250 E 3 0.035 0.105 1.18795E+04 6.49746E+03 9.18848E+03
250 F 3 0.035 0.105 6.61523E+03 1.05336E+04 8.57442E+03
385 A 3 0.17 0.51 1.63152E+04 1.37649E+04 1.50401E+04
385 B 3 0.178 0.534 1.49557E+04 2.50697E+04 2.00127E+04
385 C 3 0.177 0.531 2.75014E+04 2.67064E+04 2.71039E+04
385 D 3 0.057 0.171 3.21404E+04 1.77974E+04 2.49689E+04
385 E 3 0.06 0.18 1.67839E+04 1.78590E+04 1.73215E+04
385 F 3 0.066 0.198 1.97082E+04 2.66662E+04 2.31872E+04
500 A 6 0.207 1.242 9.63544E+03 1.78099E+04 1.37227E+04
500 B 6 0.206 1.236 2.29226E+04 1.73316E+04 2.01271E+04
500 C 6 0.206 1.236 9.28056E+03 2.26545E+04 1.59675E+04
500 D 3 0.086 0.258 1.93416E+04 2.97073E+04 2.45245E+04
500 E 3 0.085 0.255 1.35420E+04 2.46699E+04 1.91060E+04
500 F 3 0.087 0.261 2.01210E+04 6.29347E+03 1.32072E+04
620 A 10 0.226 2.26 2.70344E+04 8.61377E+03 1.78241E+04
620 B 10 0.194 1.94 0.00000E+00 3.53408E+04 1.76704E+04
620 C 10 0.173 1.73 3.13643E+04 2.48246E+04 2.80945E+04
620 D 3 0.115 0.345 1.13838E+04 7.10440E+03 9.24410E+03
620 E 3 0.105 0.315 1.11881E+04 1.76565E+04 1.44223E+04
620 F 3 0.113 0.339 1.29814E+04 3.81548E+04 2.55681E+04
1400 A 14 0.216 3.024 1.65422E+04 2.23620E+04 1.94521E+04
1400 B 14 0.194 2.716 2.57875E+04 6.59937E+03 1.61934E+04
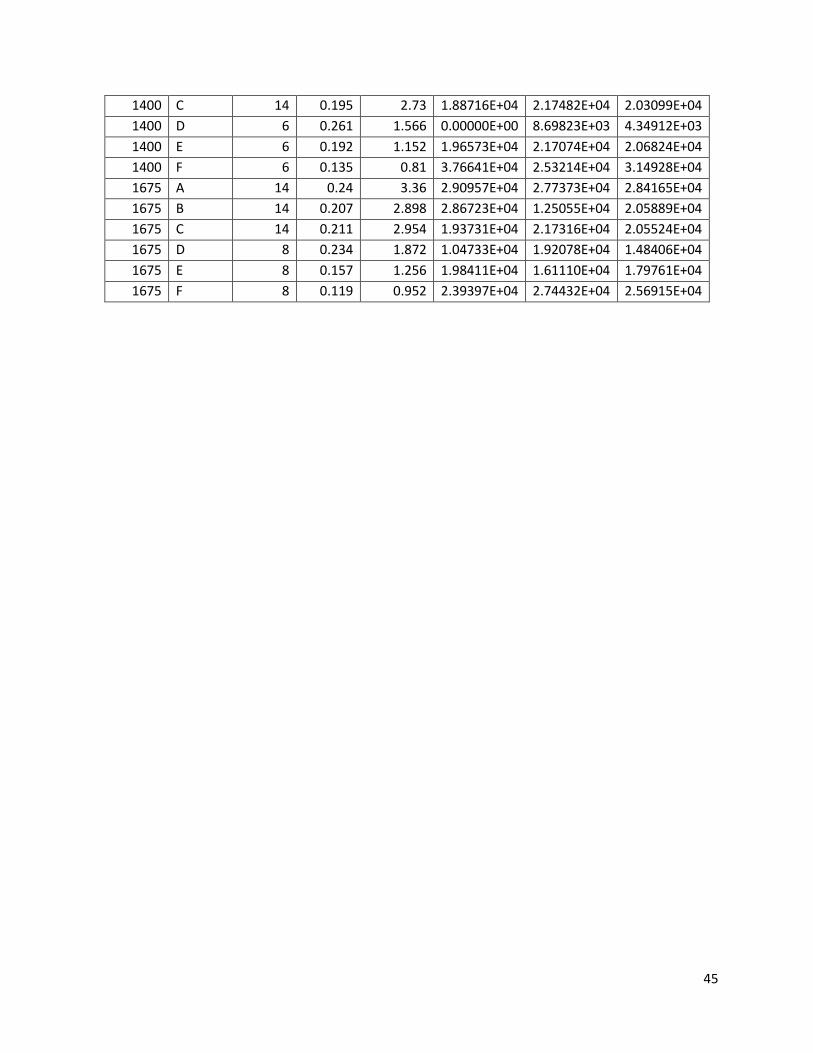
45
1400 C 14 0.195 2.73 1.88716E+04 2.17482E+04 2.03099E+04
1400 D 6 0.261 1.566 0.00000E+00 8.69823E+03 4.34912E+03
1400 E 6 0.192 1.152 1.96573E+04 2.17074E+04 2.06824E+04
1400 F 6 0.135 0.81 3.76641E+04 2.53214E+04 3.14928E+04
1675 A 14 0.24 3.36 2.90957E+04 2.77373E+04 2.84165E+04
1675 B 14 0.207 2.898 2.86723E+04 1.25055E+04 2.05889E+04
1675 C 14 0.211 2.954 1.93731E+04 2.17316E+04 2.05524E+04
1675 D 8 0.234 1.872 1.04733E+04 1.92078E+04 1.48406E+04
1675 E 8 0.157 1.256 1.98411E+04 1.61110E+04 1.79761E+04
1675 F 8 0.119 0.952 2.39397E+04 2.74432E+04 2.56915E+04

46
Table A4: Experiment 4 Raw Data
Time Flask Dilution Abs Corrected
Abs
Area 1 Area 2 Avg Area
0 A 4 0.037 0.148 2.27552E+04 2.52468E+04 2.40010E+04
0 B 4 0.038 0.152 2.34963E+04 1.73782E+04 2.04373E+04
0 C 4 0.036 0.144 2.64155E+04 3.42807E+04 3.03481E+04
0 D 4 0.030 0.12 1.37378E+04 2.53479E+04 1.95429E+04
0 E 4 0.025 0.1 1.72987E+04 4.46414E+04 3.09701E+04
0 F 4 0.023 0.092 3.67985E+04 3.13896E+04 3.40941E+04
135 A 4 0.039 0.156 3.00791E+04 4.33652E+04 3.67222E+04
135 B 4 0.044 0.176 4.63234E+04 3.50169E+04 4.06702E+04
135 C 4 0.045 0.18 5.91663E+04 6.71292E+04 6.31478E+04
135 D 4 0.036 0.144 3.26454E+04 1.47182E+04 2.36818E+04
135 E 4 0.033 0.132 2.42199E+04 2.79093E+04 2.60646E+04
135 F 4 0.033 0.132 2.52584E+04 1.97976E+04 2.25280E+04
225 A 4 0.034 0.136 3.01786E+04 3.35689E+04 3.18738E+04
225 B 4 0.047 0.188 3.21309E+04 4.27197E+04 3.74253E+04
225 C 4 0.043 0.172 5.42012E+04 4.93622E+04 5.17817E+04
225 D 4 0.020 0.08 1.69458E+04 1.94781E+04 1.82120E+04
225 E 4 0.022 0.088 3.06118E+04 3.12453E+04 3.09286E+04
225 F 4 0.020 0.08 2.67421E+04 4.22461E+04 3.44941E+04
360 A 4 0.051 0.204 2.20667E+04 2.34617E+04 2.27642E+04
360 B 4 0.100 0.4 7.64535E+04 8.20171E+04 7.92353E+04
360 C 4 0.113 0.452 1.12506E+05 1.02341E+05 1.07424E+05
360 D 4 0.024 0.096 3.11680E+04 4.15264E+04 3.63472E+04
360 E 4 0.028 0.112 4.62284E+04 3.58087E+04 4.10186E+04
360 F 4 0.030 0.12 4.95208E+04 5.14017E+04 5.04613E+04
480 A 4 0.073 0.292 2.30097E+04 1.24721E+04 1.77409E+04
480 B 8 0.101 0.808 8.29353E+04 6.91218E+04 7.60286E+04
480 C 4 0.230 0.92 9.98401E+04 8.37599E+04 9.18000E+04
480 D 4 0.033 0.132 3.61997E+04 3.26995E+04 3.44496E+04
480 E 4 0.067 0.268 6.85592E+04 5.18496E+04 6.02044E+04
480 F 4 0.070 0.28 6.63198E+04 9.31909E+04 7.97554E+04
665 A 4 0.120 0.48 1.51330E+04 2.81833E+04 2.16582E+04
665 B 4 0.209 0.836 7.10874E+04 5.94965E+04 6.52920E+04
665 C 4 0.238 0.952 1.39508E+05 1.30522E+05 1.35015E+05
665 D 4 0.020 0.08 2.45214E+04 3.43466E+04 2.94340E+04
665 E 4 0.081 0.324 8.23113E+04 9.82056E+04 9.02585E+04
665 F 4 0.119 0.476 1.54499E+05 1.61480E+05 1.57990E+05
1200 A 4 0.217 0.868 1.52274E+04 6.34819E+03 1.07878E+04
1200 B 8 0.255 2.04
1200 C 8 0.256 2.048 8.07992E+04 6.68932E+04 7.38462E+04
1200 D 4 0.025 0.1 2.62145E+04 2.61004E+04 2.61575E+04
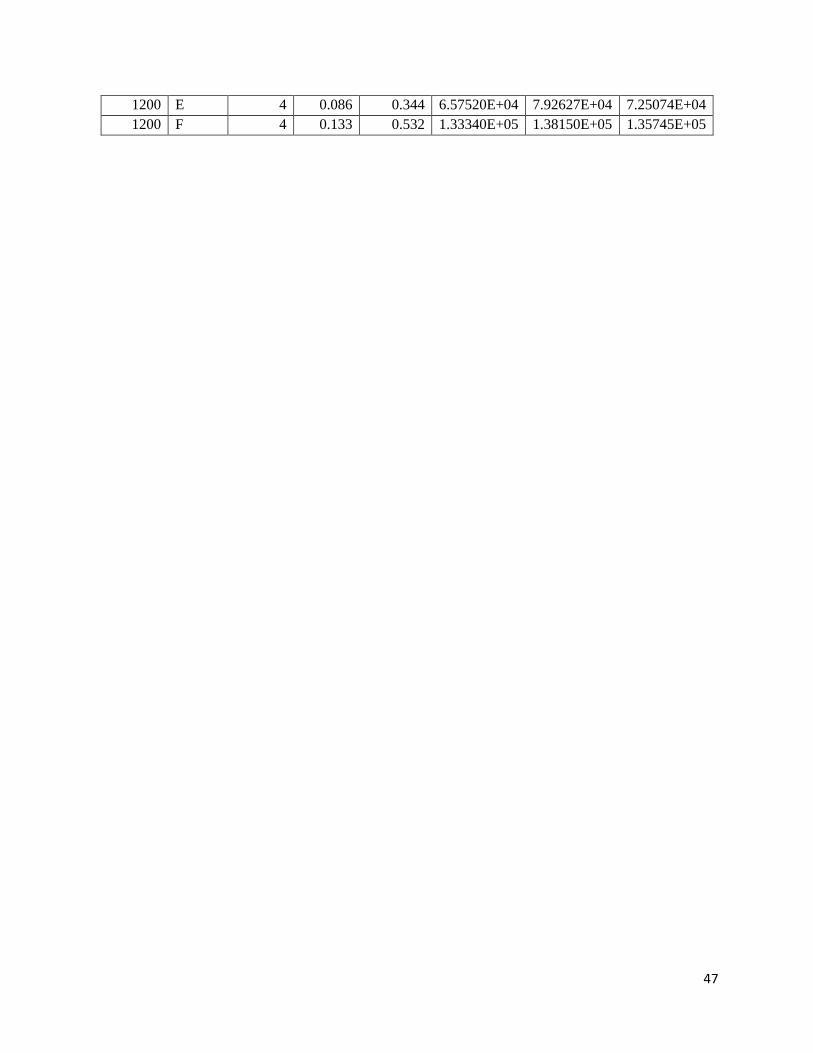
47
1200 E 4 0.086 0.344 6.57520E+04 7.92627E+04 7.25074E+04
1200 F 4 0.133 0.532 1.33340E+05 1.38150E+05 1.35745E+05
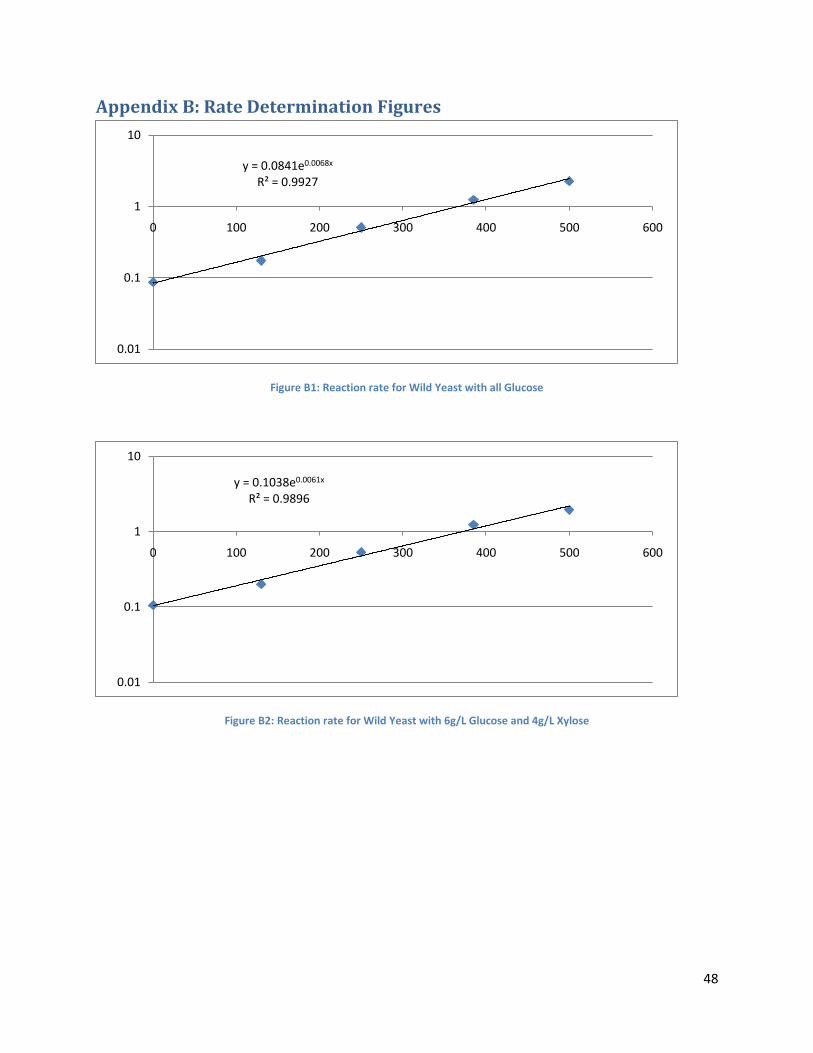
48
Appendix B: Rate Determination Figures
Figure B1: Reaction rate for Wild Yeast with all Glucose
Figure B2: Reaction rate for Wild Yeast with 6g/L Glucose and 4g/L Xylose
y = 0.0841e0.0068x
R² = 0.9927
0.01
0.1
1
10
0 100 200 300 400 500 600
y = 0.1038e0.0061x
R² = 0.9896
0.01
0.1
1
10
0 100 200 300 400 500 600
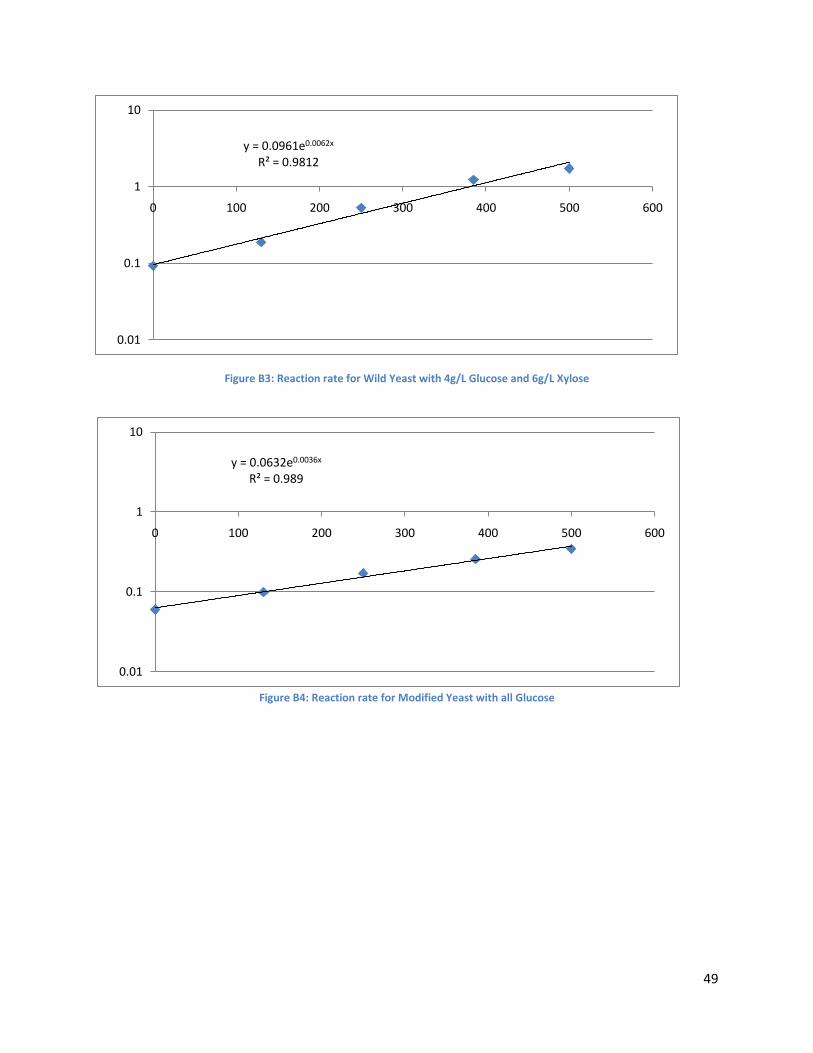
49
Figure B3: Reaction rate for Wild Yeast with 4g/L Glucose and 6g/L Xylose
Figure B4: Reaction rate for Modified Yeast with all Glucose
y = 0.0961e0.0062x
R² = 0.9812
0.01
0.1
1
10
0 100 200 300 400 500 600
y = 0.0632e0.0036x
R² = 0.989
0.01
0.1
1
10
0 100 200 300 400 500 600

50
Figure B5: Reaction rate for Modified Yeast with 6g/L Glucose and 4g/L Xylose
Figure B6: Reaction rate for Modified Yeast with 4g/L Glucose and 6g/L Xylose
y = 0.0725e0.0031x
R² = 0.9798
0.01
0.1
1
10
0 100 200 300 400 500 600
y = 0.0709e0.0033x
R² = 0.9695
0.01
0.1
1
10
0 100 200 300 400 500 600