analyzing and visualizing criminal network dynamics: a case study
TRANSCRIPT
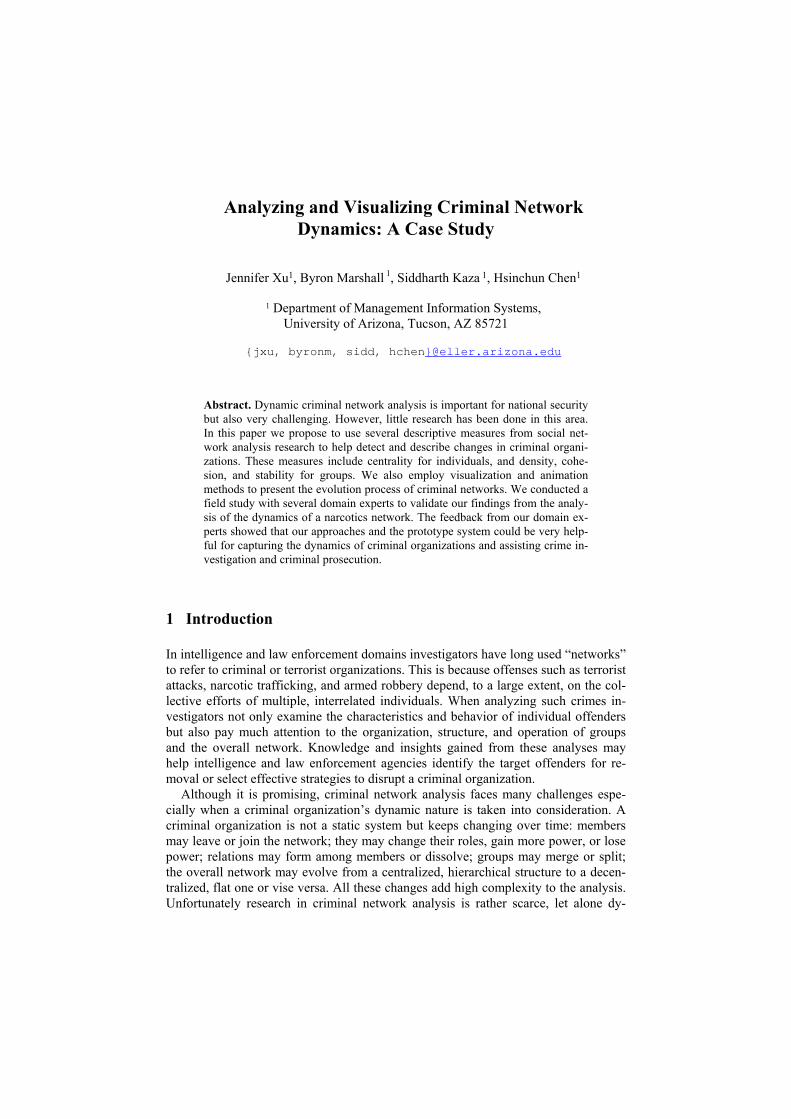
Analyzing and Visualizing Criminal Network Dynamics: A Case Study
Jennifer Xu1, Byron Marshall 1, Siddharth Kaza 1, Hsinchun Chen1
1 Department of Management Information Systems, University of Arizona, Tucson, AZ 85721
{jxu, byronm, sidd, hchen}@eller.arizona.edu
Abstract. Dynamic criminal network analysis is important for national security but also very challenging. However, little research has been done in this area. In this paper we propose to use several descriptive measures from social net-work analysis research to help detect and describe changes in criminal organi-zations. These measures include centrality for individuals, and density, cohe-sion, and stability for groups. We also employ visualization and animation methods to present the evolution process of criminal networks. We conducted a field study with several domain experts to validate our findings from the analy-sis of the dynamics of a narcotics network. The feedback from our domain ex-perts showed that our approaches and the prototype system could be very help-ful for capturing the dynamics of criminal organizations and assisting crime in-vestigation and criminal prosecution.
1 Introduction
In intelligence and law enforcement domains investigators have long used “networks” to refer to criminal or terrorist organizations. This is because offenses such as terrorist attacks, narcotic trafficking, and armed robbery depend, to a large extent, on the col-lective efforts of multiple, interrelated individuals. When analyzing such crimes in-vestigators not only examine the characteristics and behavior of individual offenders but also pay much attention to the organization, structure, and operation of groups and the overall network. Knowledge and insights gained from these analyses may help intelligence and law enforcement agencies identify the target offenders for re-moval or select effective strategies to disrupt a criminal organization.
Although it is promising, criminal network analysis faces many challenges espe-cially when a criminal organization’s dynamic nature is taken into consideration. A criminal organization is not a static system but keeps changing over time: members may leave or join the network; they may change their roles, gain more power, or lose power; relations may form among members or dissolve; groups may merge or split; the overall network may evolve from a centralized, hierarchical structure to a decen-tralized, flat one or vise versa. All these changes add high complexity to the analysis. Unfortunately research in criminal network analysis is rather scarce, let alone dy-

namic network analysis. It is a pressing need to identify appropriate methodologies and techniques to capture dynamic patterns of criminal networks, thereby aiding crime investigation and disruptive strategy selection.
In this paper we propose to employ several quantitative methods and measures from the area of social network analysis (SNA) to study the dynamics of criminal networks. These measures and methods can be used to detect and describe the changes in network members’ individual characteristics and social roles (e.g., leader and gatekeeper) and capture the dynamic patterns of group membership and structure. In addition, we employ the animation method to visualize the evolution of a criminal network in terms of its changes in members, relations, groups, and the overall struc-ture. In order to evaluate the usefulness of the proposed quantitative methods and the visualization approach, we conducted a field study and asked domain experts to vali-date the findings from our analysis of the evolution of a narcotics network.
The remainder of this paper is organized as follows. Section 2 briefly introduces the research background. Section 3 reviews SNA literature regarding the methods and visualization techniques for analysis of network dynamics. Section 4 proposes the quantitative methods and visualization approach. The evaluation results from the field study are presented in Section 5. Section 6 concludes the paper and discusses future research directions.
2 Research Background
A criminal network is primarily a social network in which individuals connect with one another through various relations such as kinship, friendship, and co-workers. Research has recognized SNA as a promising methodology to analyze the structural properties of criminal networks [5, 22, 23, 26, 35]. SNA was originally used in soci-ology research to extract patterns of relationships between social actors in order to discover the underlying social structure [38, 39]. A social network is often treated as a graph in which nodes represent individual members and links represent relations among the members. The structural properties of a social network can be described and analyzed at four levels: node, link, group, and the overall network. SNA provides various measures, indexes, and approaches to capture these structural properties quantitatively.
There have been some empirical studies that use SNA methods to analyze criminal or terrorist networks. For instance, based on archival data, Baker and Faulkner ana-lyzed the structure of an illegal network depicting a price-fixing conspiracy in the heavy electrical equipment industry. They find that individual centrality in the net-work, as measured by degree, betweenness, and closeness [17], is an important pre-dictor of an individual’s possible prosecution [1]. Krebs relied on open source data and studied the terrorist network centering around the 19 hijackers in 9/11 events. He found that Mohamed Atta, who piloted the first plane that crashed into the World Trade Center, had the highest degree and acted as the ring leader of the network [23]. Xu and Chen employed clustering, centrality measures, blockmodeling, and multidi-mensional scaling (MDS) approaches from SNA to study criminal networks based on

crime incident data [41]. The system they developed can also visualize a network and its groups.
However, all these studies are static analysis in which data is collected at a single point in time and the snapshot of a criminal network is generated and studied. The dynamics in network nodes, links, groups, and the structure are ignored. How does an individual acquire a central position in a network and gain more power over time? Do relations between individuals become stronger or weaker? How does a group’s mem-bership or structure change? What do these changes imply about the future of the network? With a static point of view, many of these important questions regarding the development and evolution of criminal networks remain unanswered.
In order to address these questions we propose to use a set of methods and meas-ures from SNA to describe and capture patterns of changes in criminal networks. In addition, visualization and animation are used to present network dynamics.
3 Literature Review
In this section we review related SNA research about dynamic network analysis and visualization.
3.1 Analyzing Social network Dynamics
Recently, the research on social network dynamics has received increasing attention. However, there has not been a consensus on what analytical methods to use [4, 14, 27]. Research uses various methods, measures, models, and techniques to study net-work dynamics. Doreian and Stokman classified existing approaches into three cate-gories: descriptive, statistical, and simulation methods [15]. Descriptive Methods. The purpose of descriptive analysis is often to detect structural changes in social networks and test how well a sociologic theory is supported by empirical data. With descriptive methods, structural properties of a social network are measured by various metrics and indexes and compared across time to describe the dynamics in nodes, links, or groups in the network. Little research has been found which studied the dynamics at the overall network level.
Node level measures often focus on changes in individuals’ centrality, influence, and other characteristics. To study how an individual’s social position relates to his or her technology adoption behavior, Burkhardt and Brass studied a communication network of 94 employees of an organization at four time points after a new computer-ized information system was deployed [3]. They found that the centrality (degree and closeness) and power of early adopters of new technology increased over time. Using Newcomb’s classic longitudinal data [28], Nakao and Romney measured the “posi-tional stability” of 17 new members in a fraternity during a 15-week period [27]. For each week, these individuals were mapped into a two-dimensional MDS diagram based on their relational strength. As individuals may change their positions over time, the lengths of their paths of movement were calculated with a short path indicat-

ing a high positional stability. The positional stability index was used to examine how popular and unpopular individuals differ in the speed with which they found their appropriate social groups. In the area of citation analysis where an author citation network is treated as a social network, centrality type metrics have been used to trace the dynamics of authors’ influence on a scientific discipline. For example, an author citation network in information science during 1972-1995 was studied in [40]. A centrality index is calculated based on an author’s mean number of co-citations with other authors. This index is used to reflect the changes in the author’s influence over time.
Link stability in terms of link breaking and replacement rate was analyzed in sev-eral inter-organizational network studies. Ornstein examined the interlocking rela-tions among the 100 largest Canadian companies between 1946-1977 [30]. He calcu-lated the percentage of relations that were previously broken but later restored and used that to test whether the network was dominated by planned liaisons. Similarly, Fennema and Schijf used “chance of restoration” to identify a stable set of interlock-ing relations among companies across several countries [16].
To describe group level dynamics, research has focused on group stability and group balance processes. To analyze group balance processes, Doreian and Kapuscin-ski used Newcomb’s fraternity data [28] to measure relation reciprocity, transitivity, and imbalance across the 15 weeks [14]. Results for each week were then plotted to study the trend of group balance over time. Group stability is defined in Nakao and Romney’s study as the similarity between the two sociomatrices representing the same group at two different points of time [27]. In citation analysis, Small proposes a “Cluster Stability Index”, which is defined as the number of common elements in two clusters divided by the total number of elements in the two clusters [32]. By calculat-ing this index between two similar clusters in two successive time periods, it is possi-ble to quantify the stability or continuity of a scientific field as represented by a group of authors [2]. Statistical Methods. Statistical analysis of social network dynamics aims not only at detecting and describing network changes but also at explaining why these changes occur. With statistical methods, structural changes are assumed to result from some stochastic processes of network effects such as reciprocity, transitivity, and balance [34]. In this type of analysis, links are modeled as random variables that can be in different states (e.g., positive, negative, or neutral) at different time. The purpose is to examine which network effect fits the empirical data and better accounts for the ob-served structural changes.
Discrete or continuous Markov models are often used in statistical analysis. The most important property of a Markov model is that the future state of a process is dependent only on the current state but not on any previous state [25, 33, 34]. The process is governed by a transition matrix, which contains the conditional probabili-ties of changing from the initial state to the current state, and the intensity matrix whose elements are transition rates [19, 25]. For example, Leenders used continuous time Markov models to examine three effects (gender similarity, reciprocity, and proximity) on children’s choices of friendship over time [25]. By comparing the three resulting models’ goodness-of-fit, he found that gender similarity was the most im-

portant criterion for children to choose a friend. Snijders applied a continuous time Markov model to Newcomb data [28] and found that both reciprocity and balance have significant effects on the structural changes in the fraternity network [33]. The advantage of Markov models is that they can be statistically tested. However, it is often difficult to estimate the parameters of the models.
Simulation Methods. Unlike descriptive or statistical methods, which examine social network dynamics quantitatively, simulation methods rely on multi-agent technology to analyze network dynamics. In this method, members in a social network are often modeled and implemented as computer agents who have the abilities to behave and make decisions based on certain criteria. The collective behaviors of all members in a network will determine how the network evolves from one structure to another.
Several SNA studies have employed simulation methods. For example, Hummon uses agent-based simulation to study how individuals’ social choices of establishing or ceasing a relationship with others affect the structure of a network [20]. The basic assumption is that maintaining a relationship has its associated costs and benefits and individuals aim to maximize their utilities by altering their relationships with others. A social network will keep changing until the joint utility of all members is maxi-mized. Carley et al. use multi-agent technology to simulate the evolution of covert networks such as terrorist groups [4]. Moreover, using a multi-agent system called DYNET, they can perform a “what-if” analysis to anticipate how a network adapts to environmental changes such as the removal of a central member [4, 5, 13]. A simula-tion model can be a powerful tool predicting a network’s future. However it often oversimplifies the behavior and decision-making of humans and may not be able to model the complex reality of social networks.
Some SNA research, especially citation analysis, has employed visualization tech-niques to study network dynamics. This approach relies on visual presentations of social networks and is quite different from the descriptive, statistical, and simulation methods.
3.2 Visualizing Social Network Dynamics
With the visualization approach a social network is portrayed at different points in time and a series of network portrayals are compared across time to find the structural changes. In citation network analysis the purpose of visualization is often to detect shifts in research focus and paradigms [32, 40], track emergent research trends [6, 12], and find evolving patterns of a scientific domain [2, 7, 8, 29].
To visualize a social network, an appropriate layout algorithm must be chosen to assign locations to nodes. Traditionally, multidimensional scaling (MDS) was used to project a social network onto a two dimensional display based on the proximity be-tween nodes [29, 32, 37, 40]. The algorithm arranges nodes so that similar nodes or strongly linked nodes are close to each other and different nodes or weakly linked nodes are far from each other. For example, to examine the dynamics of information science research between 1972-1995, White and McCain employ MDS to project 100 researchers onto three maps corresponding to three 8-year segments [40]. By compar-

ing the locations of the same author in different maps they trace the paradigm shifts in information sciences during the 24-year period. Small [32] and Sullivan [36] propose to use MDS to generate the locations of documents based on document co-citation frequencies and use the “attitude” to represent a document’s citation frequency. The result is a “contour map” in which documents on the same contour line have the same citation density. Comparing the yearly contour maps for 1970-1974, Small identified the paradigm shifts in collagen research [32]. Recently a network layout algorithm called spring embedder algorithm [18, 21] has gained increasing popularity. This algorithm treats a network as an energy system in which nodes are connected by springs containing energy. Nodes attract and repulse one another until the energy in the system is minimized. The spring embedder algorithm can be combined with the Pathfinder network scaling algorithm [9], which reduces the number of links by find-ing the shortest path between nodes, to generate a tree-link network representation [6-9, 11]. Some other layout algorithms including simple triangulation method [24] have also been used in citation analysis network visualization [31].
With the development of computer technology, some visualization tools have been developed to show the evolution of citation networks. For example, Chen and Carr [7] generate a series of citation networks using the spring embedder algorithm and the pathfinder algorithm. They then use animation to visually present the evolution of the hypertext research field between 1989-1998. Moreover, their visualization tool incor-porates several visual cues to present the changes of other network characteristics [6-8, 10]. For example, nodes representing authors are color-coded so that authors with the same research specialty receive the same color. They also attach a citation bar to each node in a three-dimensional display to present citation rate change of an author from year to year.
Research in these dynamic SNA studies provides a good foundation for criminal network dynamics analysis. Although the purpose of analyzing criminal network dynamics is not to test theories, the methods, measures, and models from SNA can help detect and describe structural changes, extract the patterns of these changes, and even predict the future activities and structure of criminal organizations.
4 Research Methods
In our research a criminal network is represented as an undirected, weighted graph in which each link receives a weight based on the frequency that the two involved crimi-nals commit crimes together [41]. The link weight then represents the relational strength between two criminals. In this paper we propose to use several descriptive measures and the animation approach to analyze and visualize criminal network dy-namics over time.

4.1 Descriptive Approaches
As reviewed previously, a criminal network can change in its nodes, links, groups, and even the overall structure. In this paper, we focus on the detection and description of node level and group level dynamics. Node level measures. As criminals establish new relations or break existing rela-tions with others their social positions, roles, and power may change accordingly. These node dynamics resulting from relation changes can be captured by a set of centrality measures from SNA. Centrality is often used to indicate the importance of a member within a group or a network. Various centrality measures have been pro-posed and they have different interpretations and implications. Freeman defines the three most popular centrality measures: degree, betweenness, and closeness [17].
Degree measures how active a particular node is. It is defined as the number of di-rect links a node k has. An individual with a high degree could be the leader or “hub” in his group or the network. However, degree is not a reliable indicator of leadership role in criminal networks [41]. We therefore use this measure to only represent an individual’s activeness. Considering that a group or network may change its size over time we use a normalized degree measure [38]:
kin
kiakC
n
inormD ≠
−=
∑= ,
1
),()( 1 (1)
where n is the total number of nodes in a group or a network and a(i, k) is a binary variable indicating whether a link exists between nodes i and k.
Betweenness measures the extent to which a particular node lies between other nodes in a network or a group. The betweenness of a node k is defined as the number of geodesics (shortest paths between two nodes) passing through it. An individual with high betweenness may act as a gatekeeper or “broker” in a network for smooth communication or flow of goods (e.g., drugs). A gatekeeper criminal should often be targeted for removal because the removal may destablize a criminal network or even cause it to fall apart [5]. Again, considering group or network size, we define normal-ized betweenness as:
kin
kgkC
n
iij
n
jnormB ≠
−=
∑∑<
1
)()( (2)
where indicates whether the shortest path between two other nodes i and j
passes through node k.
)(kgij
Closeness is the sum of the length of geodesics between a particular node k and all the other nodes in a network. It actually measures how far away one node is from other nodes and sometimes is called “farness” [1]. It indicates how easily an individ-ual connects to other members. The normalized closeness is defined as:

kiCC
CkilkC
cc
c
n
inormC ≠
−
−=
∑=
minmax
min),()( 1 (3)
where l is the length of the shortest path connecting nodes i and k. C),( ki cmin and Ccmax are the minimum and maximum lengths of the shortest paths respectively. When calculating the closeness, a link weight needs to be converted to a length using logarithmic transformation [42]:
)ln(wl −= The values of these three normalized centrality measures range from 0 to 1. For a
particular individual, each centrality measure will be calculated at different points of time to capture its change.
Group level measures. Criminal groups are not random sets of individuals but relatively tight units in which members have denser and stronger relations with one another. There are a variety of indexes in SNA for measuring the structural properties of social groups. We chose three measures (link density, group cohesion, and cluster stability) to detect and describe network dynamics at group level. Each measure has its specific implication to criminal network investigation.
Link density measures how complete a group is in terms of the relations among its members. It is defined as the proportion of the maximum possible number of links that actually exist among all group members [38]:
)1(
),(2
−=
∑∑<
nn
jiaDensity
n
i
n
j (4)
where n is the size of the group and a(i, j) is a binary variable indicating whether a link exists between nodes i and j. Members in a dense group have relations to a large number of other group members. When the density achieves 1, a group becomes a clique where each member connects with every other member. Communication and collaboration are easier for members in a dense group and this may imply more effi-cient planning and execution of offenses in criminal networks. However, a dense group may also be vulnerable because when one member is caught he or she may release critical information about many other group members [23].
A group is a cohesive group if, on average, its members have stronger relations with members in the same group than with individuals outside of the group [38]. A group cohesion measure is defined as the average link strength within the group di-vided by the average link strength with outsiders [38]:
)(
),()1(
),(
nNN
jiwnn
jiw
CohesionGi Gj
Gi Gj
−
−=
∑ ∑
∑ ∑
∈ ∉
∈ ∈
(5)

where n is the group size; N is the network size; G represents the group’s node set; w(i,j) is the weight of the link between nodes i and j. A group is considered cohesive if the cohesion value exceeds 1. Members in a cohesive criminal group tend to have higher loyalty and are less likely to be recruited to other groups.
For a specific group both density and cohesion can be calculated and compared across different points of time.
Group stability measures how well a group maintains its membership over time. We use the cluster stability index introduced by Small [32] because a group can be treated as a cluster of nodes. It is calculated based on the overlapping membership of a group at two different points of time. We define the stability of group G from time t1 to t2 as:
||||
21
21
UI
tt
tt
GGGG
Stability = (6)
4.2 Animation Approaches
In addition to quantitative analysis of the dynamics of criminal networks, we use the animation approach to present the changes of a network visually. In our previous study we developed a prototype system that can perform structural analysis and visu-alization of static criminal networks. The system is able to partition a network into groups, calculate centrality for group members, and uses the blockmodeling approach [38] to capture patterns of interactions between groups [41]. The system employs MDS to visualize a network on a two-dimensional display based on the weights of links between individual criminals. Moreover, several visual cues are used to repre-sent structural network properties. For example, the thickness of a link represents the strength of the relation; the size of a circle representing a group is proportional to the number of members in that group.
In this study we add an animation function to the system. Several new visual cues are combined with the animation.
Node location. With MDS, node locations on the display are determined by the link weights between nodes. As link weights change, MDS will assign different loca-tions to the same node from time to time. Alteration in node locations will add a high cognitive load to users because they must compare different MDS layouts to track the nodes [8]. To address this problem, we calculate node locations based on link weights cumulated from all past incidents and rely on the changes of the thickness of links to represent the link weight change.
Node size. A criminal may commit more or fewer crimes at different times. To visualize the activeness change of a criminal, we make node size proportional to the number of crimes an offender commits in a specific year. A user can see whether a criminal becomes more or less active over time by watching the node size change.
Link darkness. A link exists between two criminals when they commit a crime to-gether. In our previous system the thickness of a link indicates the relational strength between two criminals. However, relational strength cannot capture the time frame of a link. Two criminals who have not recently committed crimes together but often co-

committed crimes previously may appear to have a strong link. To reflect the recency of a relation, we change the darkness of the link over time. As a result, a darker link represents a more recently formed relation and a faded link represents an older rela-tion.
In our system the animation of network evolution is controlled by a time slider. When a user adjusts the time slider, he or she can visualize the network while nodes change their sizes and links change their thickness and darkness. In addition, the system can perform network partition, blockmodeling, and centrality calculation at the specified point of time. By comparing the network at different points of time, a user can visually detect the changes in nodes, links, groups, and overall structure. Figure 1 shows an example of a narcotics network in 1994 and 2002. It can be seen that this network has changed not only in its nodes and links but also in its structure1.
Fig. 1. The narcotics network and its reduced structures in 1994 and 2002. A node represents an individual. A line represents a relation. The thickness of a line repre-
sents the relational strength. A group is represented by a circle labeled with the leader’s name. The size of a circle is proportional to the number of members in the
1 All criminal names in this paper are scrubbed for data confidentiality.

group. (A) The network in 1994. (B) The reduced structure of the network in 1994. (C) The network in 2002. (D) The reduced structure of the network in 2002.
5 Evaluation
We conducted a field study to evaluate the usefulness of our proposed methods and to answer the following research questions:
• Can the descriptive measures for nodes capture the dynamics in network members’ roles and activeness?
• Can the descriptive measures for groups capture the dynamics in criminal groups?
• Can the animation provide an intuitive and useful presentation of the dy-namics of a criminal network over time?
• Will the measures and visualization be useful for crime investigation? In our previous study we performed a static analysis on a narcotics network which
was called “Meth World” because most of the network members committed crimes related to methamphetamines [41]. In this study we obtained a list of 103 major crimi-nals in the Meth World from the Gang Unit Sergeant at the Tucson Police De-partment and generated a network consisting of 924 criminals surrounding these major offenders. These offenders committed 11,074 crimes ranging from theft and aggravated assault to drug offences from 1983 to 2002. Because these major offend-ers had long-term relationships established when they were in high schools we calcu-lated link weights for each year based on crime incidents that had occurred up to that year. A series of yearly networks were then generated beginning from 1994, when the Sergeant started investigating this criminal network.
Several domain experts, including the Sergeant, evaluated our analytical findings and the system’s visualization features. We summarize the results as follows.
• Simple indicators of individual characteristics can reflect the changes in
individual criminal’s activity level. In this study we focused on the behavior of the leaders of the major Math World groups, William Baker and Robert White. They were correctly identified by our sys-tem in our previous study [41]. These two criminals had been involved in drug of-fenses since mid-1990s. Over time, they formed two groups and obtained leadership in their own groups. For each criminal, we represented his individual characteristics based on the number of crimes he committed and the number of relations in each year. These two measures are somewhat correlated. The correlations are 0.89 and 0.69 for William Baker and Robert White, respectively. This implies that William Baker tended to commit crimes more often with others than Robert White. Also no-tice that the number of relations is the number of people an offender commits crimes with. It is an absolute degree value based on yearly incident data and is different from the normalized degree in equation (1). Figure 2 presents the curves of the individual characteristics for the two criminals.

William Baker
0
2
4
6
8
10
12
14
1994 1995 1996 1997 1998 1999 2000 2001 2002
Year
Valu
e
# of Crimes # of relations
a. Changes in individual characteristics of William Baker
Robert White
05
1015
2025
1994 1995 1996 1997 1998 1999 2000 2001 2002
Year
Valu
e
# of Crimes # of Relations
b. Changes in individual characteristics of Robert White
Fig. 2. Changes in individual characteristics of the two group leaders in Meth World
According to Figure 2 (a), William Baker was not a very active offender initially.
He committed only a few crimes and had few relations with others in 1994. He be-came more active in 1995. His two curves drop to zero in 1996. According to our experts, William Baker was prosecuted and imprisoned during 1996. After he was released in 1997, he committed an increasing number of crimes from year to year until he was imprisoned again in 2000. Figure 2 (b) presents the behavioral trace of

Robert White. Unlike William Baker, he was very active initially. His curves drop to zero or a very low level in 1995, 1998, and 2002, when he was put into prison.
Comparing the two figures, we found that these two leaders’ activeness alternated in turn over time. As one offender was put into prison and left the network temporar-ily, the other became very active. For example, William Baker committed few crimes while Robert was active in 1994. However, when Robert White’s curves drop to zero, William Baker committed more crimes. Based on the experts’ experience, this is because they always competed for the leadership of the whole network. In addition, a similar pattern was found for the two leaders: after they were released from prison, they became increasingly active until they were caught again. (See the curves for William Baker during 1996-2000 and the curves for Robert White during 1995-1998.)
• Descriptive measures of centrality can reflect the changes in individual
criminal’s roles. Considering the long-term relations among the members in Meth World, we did not base individual centrality on yearly incident data but calculated the accumulative centrality. For example, the degree of a criminal in 1995 actually measures the num-ber of relations he had established by 1995 rather than the number of relations that occurred in the single year of 1995.
To capture the changes in individual’s network roles we charted the curves of three normalized centrality measures based on equations (1)-(3) for the two group leaders. For easier interpretation and comparison among the three centrality measures, we subtracted the closeness in equation (3) from 1 so that a higher closeness indicated a higher easiness connecting to other group members.
William Baker
0
0.1
0.2
0.3
0.4
0.5
0.6
0.7
0.8
0.9
1993 1994 1995 1996 1997 1998 1999 2000 2001 2002 2003
Year
Value
Degree Betweenness Closeness
a. Changes in William Baker’s centrality

Robert White
0
0.2
0.4
0.6
0.8
1
1.2
1993 1994 1995 1996 1997 1998 1999 2000 2001 2002 2003
Year
Valu
e
Degree Betweenness Closeness
b. Changes in Robert White’s centrality
Fig. 3. Changes in individual roles measured by centrality for the two group leaders
Figure 3(a) indicates that William Baker’s centrality in terms of degree and be-tweenness decreased from 1995-1997, quickly increased in 1998, and has slowly decreased since then. His closeness presents a similar pattern by 1998. After 1998, the closeness curve proceeded totally differently from the other two centrality curves and increased quickly while degree and betweenness decreased after 2000. This im-plies that it had been easier for him to connect to other members while maintaining only a few relations with another member who had high degree or betweenness [3]. The advantage of this strategy is that he could maintain leadership while avoiding connecting with many other people so that he could reduce the chance of being caught by police. It was found from the data that William Baker connected with an-other person who had a higher degree and betweenness recently. The experts con-firmed that William Baker used that person to control other members. Unlike William Baker, the three centrality curves for Robert White are fairly consistent.
Based on the analysis of the two leaders’ behavioral patterns, it seems that they tend to commit fewer crimes and reduce contacts with other group members as time progresses. However they may still maintain their leadership by connecting to other active criminals. Such a prediction was confirmed when, during 2003, the two leaders started to hide behind others in the network.
• Descriptive measures of density, cohesion, and stability reflect the dy-
namics in criminal groups. Based on equations (4)-(6), we calculated the density, cohesion, and stability for the two groups which the two leaders belong to respectively. Figure 4 presents the changes in the two groups’ density over time.

Density
0
0.05
0.1
0.15
0.2
0.25
1993 1994 1995 1996 1997 1998 1999 2000 2001 2002 2003
Year
Valu
e
William Baker's Group Robert White's Group
Fig. 4. Changes in group density
For both groups the curves show a decreasing trend in group density over time. There is one peak in William Baker’s group in 1998 and one peak in Robert White’s group in 1996. Such a peak implies a high density followed by a low density. As mentioned previously, a dense group may be subject to a high vulnerability because of a caught member’s release of critical information to police. According to the ex-perts, when a member from such a dense group was caught police officers could often find in his car or house a phone book which contained contact information for many other group members. The police could than take effective strategies to catch these group members. As a result the group density would drop dramatically.
Interestingly, the density curves of the two groups increase and decrease alter-nately. This again confirms the experts’ observation that the two groups always com-peted for members and leadership.
The dynamics in group cohesion also present similar patterns with a decreasing trend for both groups and an alternate pattern between groups (See Figure 5). This implies that group members tend to have fewer and weaker connections with other group members and the groups become less cohesive over time. According to the experts, as more people join Meth World, people have tried to form their own groups and gain leadership.

Cohesion
0
10
20
30
40
50
60
70
80
1994 1995 1996 1997 1998 1999 2000 2001 2002 2003
Year
Valu
e
William Baker's Group Robert White's Group
Fig. 5. Changes in group cohesion
We also charted the stability changes for each group over time, as shown in Figure
6. Robert White’s curve dropped dramatically from 1995-1996. This corresponds to the fact that he was put into prison in 1995 and many members left this group. After he was released in 1996, the group stability increased and exceeded William Baker’s group after the 1997-1998 period. This is because Robert was a quite violent person and his group members learned that they might be killed if they left the group. As a result, his group tends to be more stable over time. In contrast, William was relatively mild. His group stability increased during 1994-1997 period even though he was put into prison during 1996.
Stability
00.10.20.30.40.50.60.7
1994-1995
1995-1996
1996-1997
1997-1998
1998-1999
1999-2000
2000-2002
Year
Valu
e
"William Baker's Group" Robert White's Group
Fig. 6. Changes in group stability

• Visualization and animation features provide a useful and intuitive pres-entation of criminal network dynamics.
The animation and the various visual cues, such as node size and location, link thick-ness and darkness, make it easier to observe the changes in individuals and their rela-tions. More importantly, the system could perform network partition and blockmodel-ing dynamically so that the changes in groups and the overall network could also be presented. For example, Figure 1 shows that the network initially consisted of several isolated groups in 1994 but had evolved into a two-group structure in 2002. Our ex-perts believed that such a system would provide a useful assistance to crime investi-gation and prediction. It could help investigators share their personal knowledge and experience about criminal networks and also help prosecutors present in court the history and evolution of criminal organizations.
6 Concluding Remarks and Future Work
Dynamic criminal network analysis is important for national security but also very challenging. Little research has been done in this area. In this paper we proposed using several descriptive measures from social network analysis research to help detect and describe changes in criminal organizations. These measures include cen-trality for individuals, and density, cohesion, and stability for groups. We also employ visualization and animation methods to present the evolution process of criminal networks. The feedback from our domain experts in the field study showed that our approaches and the prototype system could be very helpful for capturing the dynam-ics of criminal organizations and assisting crime investigation and criminal prosecu-tion.
Future work on dynamic criminal network analysis will be done in the following directions:
Employ more advanced methods and approaches to analyzing network dynamics. In this study, we use only descriptive measures from SNA research. These measures are relatively straightforward and simple and can only detect and describe the changes without revealing the mechanisms that lead to the changes. With statistical SNA models such as Markov models and simulation methods, it might be possible to generate some criminal network models based on criminology, psychology, cognitive, and behavioral theories that explain the dynamics.
Incorporate data from multiple sources and perform cross-jurisdictional analysis on criminal networks. We currently rely only on crime incident data from the local police department. It would be beneficial to include data from other sources such as courts, prisons, and customs. The combined data set will provide more complete and accurate information about criminal organizations.

7 Acknowledgements
This project has primarily been funded by the National Science Foundation (NSF), Digital Government Program, “COPLINK Center: Information and Knowledge Man-agement for Law Enforcement,” #9983304, July, 2000-June, 2003 and the NSF Knowledge Discovery and Dissemination (KDD) Initiative. We would like to thank the members at the University of Arizona Artificial Intelligence Lab for their support and assistance during the entire project development and evaluation processes. We also appreciate important analytical comments and suggestions from the Tucson Po-lice Department personel: Sergeant Mark Nisbet of the Gang Unit, Detective Tim Petersen, and others.
References
1. Baker, W.E. & R.R. Faulkner (1993). The social organization of conspiracy: Illegal net-works in the heavy electrical equipment industry. American Sociological Review, 58(12), 837-860.
2. Braam, R.R., H.F. Moed, & A.F.J. van Raan (1991). Mapping of science by combined co-citation and word analysis ii: Dynamical aspects. Journal of American Society of Informa-tion Science, 42(4), 252-266.
3. Burkhardt, M.E. & D.J. Brass (1990). Changing patterns or patterns of change: The effects of a change in technology on social network structure and power. Administrative Science Quarterly, 35, 104-127.
4. Carley, K.M., et al. (2003). Destabilizing dynamic covert networks. In Proceedings of the 8th International Command and Control Research and Technology Symposium. Washington DC., VA.
5. Carley, K.M., J. Lee, & D. Krackhardt (2002). Destabilizing networks. Connections, 24(3), 79-92.
6. Chen, C. & L. Carr (1999). Trailblazing the literature of hypertext: Author co-citation analysis (1989-1998). In Proceedings of the 10th ACM Conference on Hypertext and Hy-permedia.
7. Chen, C. & L. Carr (1999). Visualizing the evolution of a subject domain: A case study. In Proceedings of IEEE Symposium on Information Visualization (INFOVIS '99).
8. Chen, C., et al. (2002). Visualizing and tracking the growth of competing paradigms: Two case studies. Journal of American Society of Information Science and Technology, 53(8), 678-689.
9. Chen, C., J. Kuljis, & R.J. Raul (2001). Visualizing latent domain knowledge. IEEE Trans-actions on Systems, Man, and Cybernetics--Part C: Applications and Reviews, 31(4), 518-529.
10. Chen, C. & R.J. Paul (2001). Visualizing a knowledge domain's intellectual structure. IEEE Computer, 34(3), 65-71.
11. Chen, C., R.J. Paul, & B. O'Keefe (2001). Fitting the jigsaw of citation: Information visualization in domain analysis. Journal of American Society of Information Science and Technology, 52(4), 315-330.
12. Culnan, M.J. (1986). The intellectual development of management information sys-tems, 1972-1982: A co-citation analysis. Management Science, 32(2), 156-172.
13. Dombroski, M.J. & K.M. Carley (2002). Netest: Estimating a terrorist network's structure. Computational & Mathematical Organization Theory, 8, 235-241.

14. Doreian, P., et al. (1997). A brief history of balance through time, in Evolution of social networks, P. Doreian & F.N. Stokman (eds.). Gordon and Breach: Australia. 129-147.
15. Doreian, P. & F.N. Stokman (1997). The dynamics and evolution of social networks, in Evolution of social networks, P. Doreian & F.N. Stokman (eds.). Gordon and Breach: Australia. 1-17.
16. Fennema, M. & H. Schijf (1978/79). Analyzing interlocking directories: Theory and methods. Social Networks, 1, 297-332.
17. Freeman, L.C. (1979). Centrality in social networks: Conceptual clarification. Social Networks, 1, 215-240.
18. Fruchterman, T.M.J. & E.M. Reingold (1991). Graph drawing by force-directed placement. Software--Practice & Experience, 21(11), 1129-1164.
19. Hallinan, M.T. (1978/79). The process of friendship formation. Social Networks, 1, 193-210.
20. Hummon, N.P. (2000). Utility and dynamic social networks. Social Networks, 22, 221-249.
21. Kamada, T. & S. Kawai (1989). An algorithm for drawing general undirected graphs. Information Processing Letters, 31(1), 7-15.
22. Klerks, P. (2001). The network paradigm applied to criminal organizations: Theoreti-cal nitpicking or a relevant doctrine for investigators? Recent developments in the nether-lands. Connections, 24(3), 53-65.
23. Krebs, V.E. (2001). Mapping networks of terrorist cells. Connections, 24(3), 43-52. 24. Lee, R.C.T., J.R. Slagle, & H. Blum (1977). A triangulation method for the sequen-
tial mapping of points from n-space to two-space. IEEE Transactions on Computers, 26, 288-292.
25. Leenders, R. (1997). Evolution of friendship and best friendship choices, in Evolution of social networks, P. Doreian & F.N. Stokman (eds.). Gordon and Breach: Australia.
26. McAndrew, D. (1999). The structural analysis of criminal networks, in The social psychology of crime: Groups, teams, and networks, offender profiling series, iii, D. Canter & L. Alison (eds.). Aldershot: Dartmouth.
27. Nakao, K. & A.K. Romney (1993). Longitudinal approach to subgroup formation: Re-analysis of newcomb's fraternity data. Social Networks, 15, 109-131.
28. Newcomb, T.M. (1961). The acquaintance process, ed. Series. New York: Holt, Rinehart, & Winston.
29. Noyons, E.C.M. & A.F.J.v. Raan (1998). Monitoring scientific developments from a dynamic perspective: Self-organized structuring to map neural network research. Journal of American Society of Information Science, 49(1), 68-81.
30. Ornstein, M.D. (1982). Interlocking directorates in canada: Evidence from replace-ment patterns. Social Networks, 4, 3-25.
31. Small, H. (1999). Visualizing science by citation mapping. Journal of American Society of Information Science, 50(9), 799-813.
32. Small, H.G. (1977). A co-citation model of a scientific specialty: A longitudinal study of collagen research. Social Studies of Science, 7, 139-166.
33. Snijders, T.A.B. (1997). Stochastic actor-oriented models for network change, in Evolution of social networks, P. Doreian & F.N. Stokman (eds.). Gordon and Breach: Aus-tralia.
34. Snijders, T.A.B. (2001). The statistical evaluation of social network dynamics. Socio-logical Methodology, 31, 361-395.
35. Sparrow, M.K. (1991). The application of network analysis to criminal intelligence: An assessment of the prospects. Social Networks, 13, 251-274.
36. Sullivan, D., D.H. White, & E.J. Barboni (1997). Co-citation analyses of science: An evaluation. Social Studies of Science, 7, 223-240.

37. van den Besselaar, P. & L. Leydesdorff (1996). Mapping change in scientific special-ties: A scientometric reconstruction of the development of artificial intelligence. Journal of American Society of Information Science, 47(6), 415-436.
38. Wasserman, S. & K. Faust (1994). Social network analysis: Methods and applica-tions, ed. Series. Cambridge: Cambridge University Press.
39. Wellman, B. (1988). Structural analysis: From method and metaphor to theory and substance, in Social structures: A network approach, B. Wellman & S.D. Berkowitz (eds.). Cambridge University Press: Cambridge.
40. White, H.D. & K.W. McCain (1998). Visualizing a discipline: An author co-citation analysis of information science, 1972-1995. Journal of American Society of Information Science and Technology, 49(4), 327-355.
41. Xu, J. & H. Chen (2003). Untangling criminal networks: A case study. In Proceed-ings of NSF/NIJ Symposium on Intelligence and Security Informatics (ISI'03). Tucson, AZ.
42. Xu, J. & H. Chen (Forthcoming). Fighting organized crime: Using shortest-path algorithms to identify associations in criminal networks. Decision Support Systems.