analytical research on skills for export trade envisioning
TRANSCRIPT

Analytical Research on Skills for Export Trade
Envisioning Future of Oilseeds and Horticulture Sectors
Protea Ryalls
Blantyre
July 28, 2015

Presentation Outline Background
Problem analysis
Sector profile and characteristics
Sector envisioning
Conclusion and recommendations
The end
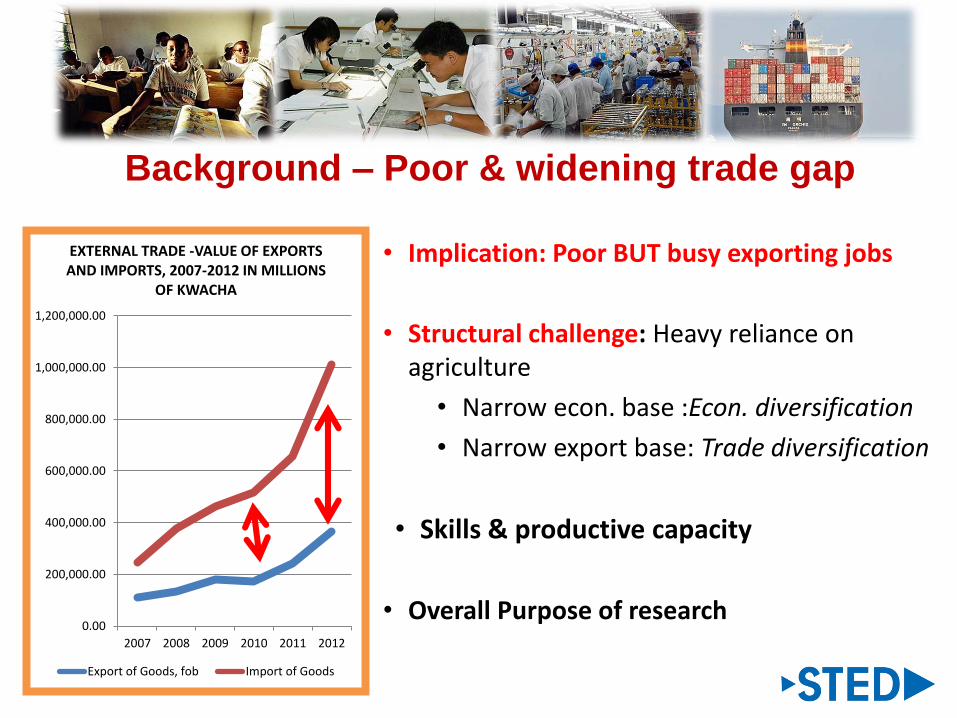
Background – Poor & widening trade gap
• Implication: Poor BUT busy exporting jobs
• Structural challenge: Heavy reliance on agriculture
• Narrow econ. base :Econ. diversification
• Narrow export base: Trade diversification
• Skills & productive capacity
• Overall Purpose of research0.00
200,000.00
400,000.00
600,000.00
800,000.00
1,000,000.00
1,200,000.00
2007 2008 2009 2010 2011 2012
EXTERNAL TRADE -VALUE OF EXPORTS AND IMPORTS, 2007-2012 IN MILLIONS
OF KWACHA
Export of Goods, fob Import of Goods

Background: Sector Description
•Oilseeds = Sunflower, groundnuts and soya
• raw and semi-raw commodities
• value addition products
» NES & cotton ????
• Horticulture = Malawi’s wide variety of fruits, vegetables and
flowers
• NES puts horticulture as part of agro-processing sub-sector under the manufactures sector
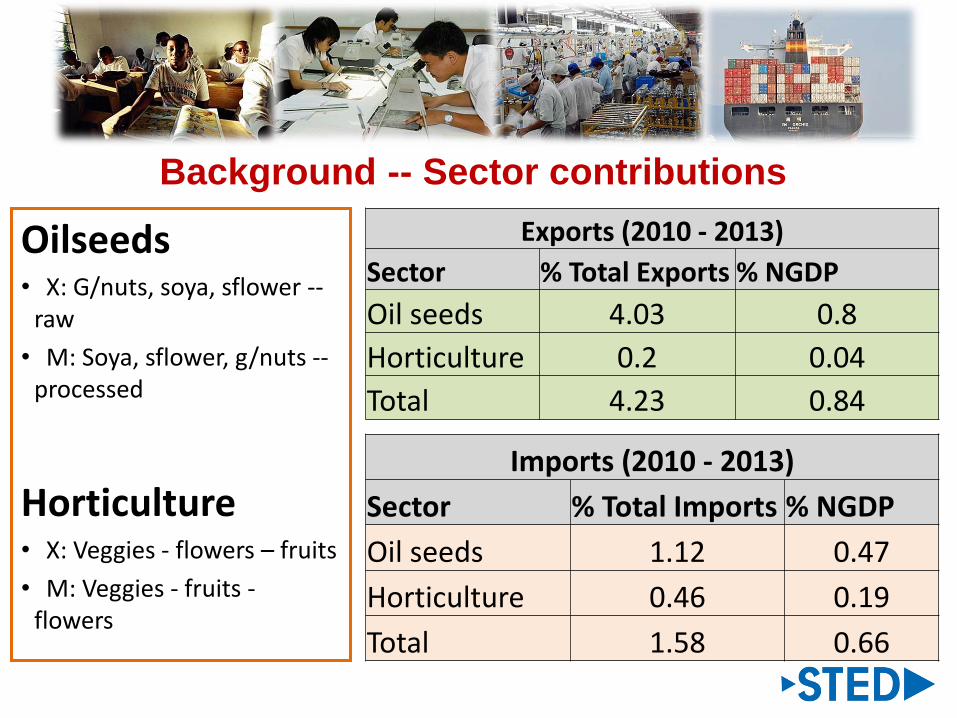
Background -- Sector contributions
Exports (2010 - 2013)
Sector % Total Exports % NGDP
Oil seeds 4.03 0.8
Horticulture 0.2 0.04
Total 4.23 0.84
Imports (2010 - 2013)
Sector % Total Imports % NGDP
Oil seeds 1.12 0.47
Horticulture 0.46 0.19
Total 1.58 0.66
Oilseeds• X: G/nuts, soya, sflower --
raw
• M: Soya, sflower, g/nuts --processed
Horticulture• X: Veggies - flowers – fruits
• M: Veggies - fruits -flowers

Background -- Global perspective• Increasing trend of (selected) oilseeds
exports (2010 and 2014)• Exporting regional countries: Malawi
(0.06%) in 3rd position after RSA (0.4%) and Tanzania (0.2%)
• Steady increase since 2010 -- Malawi, Tanzania and Mozambique
• Increasing trend of (selected) horticulture exports (2010 and 2014)
• Exporting regional countries: Malawi (0.03%) in 4th position after RSA (1.2%), Tanzania (0.13%) and Mozambique (0.06%)
• Steady increase: Malawi and South Africa
0
100000000
200000000
300000000
2010 2011 2012 2013 2014
Global Horticulture Export Trend (2010-2014)
(US$'000)
0
50000000
100000000
150000000
2010 2011 2012 2013 2014
Global Oil Seed Export Trend (2010-2014)
(US$'000)

Sector Envisioning : 3 Scenarios (STED Guide)
Scenario 1: Business as Usual Existing parameters -- market growth, pricing and
competition
• No actions -- existing growth path, existing products and markets
Scenario 2: Same but More• Step up efforts to export more of existing products to
same and similar markets
Scenario 3: Sector upgrade• Add more elements to upgrade the sectors
• existing products and markets more new products to more new markets
1. Where are we now and do we stay there?
2. Where do we want to be?
3. H
ow
can w
e get
the
re?

Envisioning the oil seeds sector
(i) Business as Usual• Existing growth path: From 3.13% (2006 – 2011, DTIS -
2014) to 4.03% (2010 – 2013, NSO)
• Existing products: Largely in raw form (97%, 2010 – 2013)
• Existing markets: Mostly local and regional (SADC)
• Finding: Scenario inconsistent with the NES vision
(ii) Same but More• Step up efforts to export more of existing products to same
and similar markets -- NES short-term strategy -- Scale up production, improve quality and pricing of the oil seeds

More oil seeds to same markets possible!
Production possibilities• Some oil seeds easily scalable, widely grown and adaptable to
numerous environments -- gnuts
• Possibility to link farmers and processors -- processed products
Market possibilities• Increasing local demand (soya; sunflower) & import substitution
(soya/gnuts/ processed products – cooking oil, soaps)
• Existing (sunflower) & growing regional markets (soya/gnuts)
• No tariffs or significant non-tariff barriers by regional countries
• Competitors (Argentina, China and the United States) face a 9.4% tariff barrier to export to RSA (gnuts)

Limitations to more oil seeds to same markets…..Production limitations• Low productivity (soya/gnuts)
• Low and fluctuating smallholder production (Soya/sunflower)
Market limitations• Competition in regional market (soya/gnuts/processed)
• Unstable regional demand (soya)
• 10% tariff barrier in Tanzania (Malawi 99%, gnuts)
• Finding: Scenario also inconsistent with the NES vision• Small size of local and regional market
• Regional dd varies dramatically from one year to the next
(iii) Sector upgrade for more products and markets
• Upgrade sector find and export more new products to more new markets -- Scale up high-value processing of the oil seeds
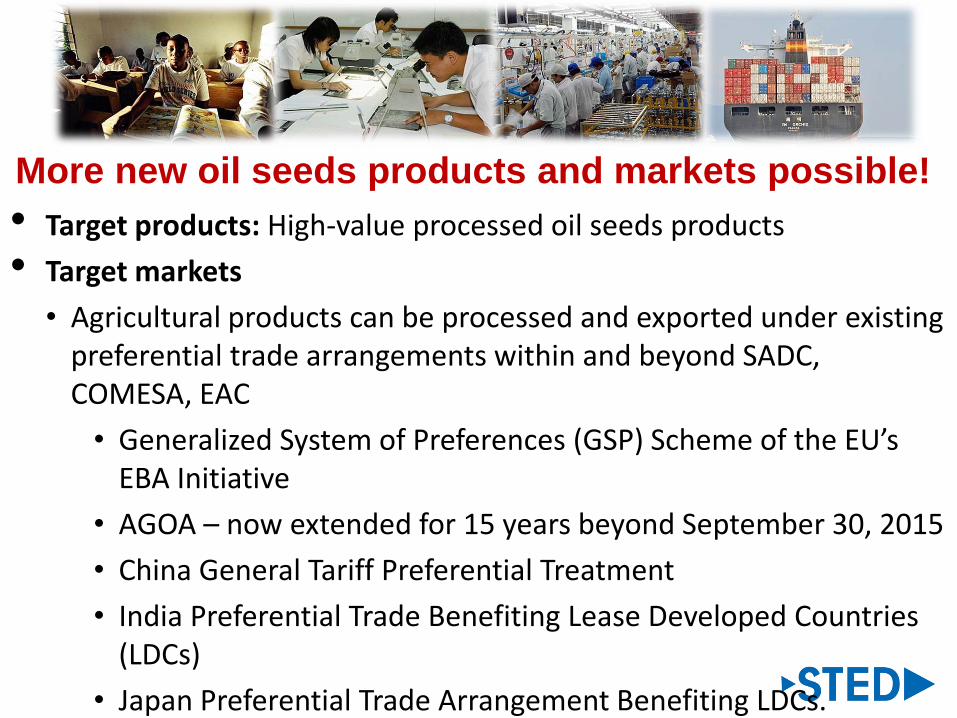
More new oil seeds products and markets possible!
• Target products: High-value processed oil seeds products
• Target markets
• Agricultural products can be processed and exported under existing preferential trade arrangements within and beyond SADC, COMESA, EAC
• Generalized System of Preferences (GSP) Scheme of the EU’s EBA Initiative
• AGOA – now extended for 15 years beyond September 30, 2015
• China General Tariff Preferential Treatment
• India Preferential Trade Benefiting Lease Developed Countries (LDCs)
• Japan Preferential Trade Arrangement Benefiting LDCs.
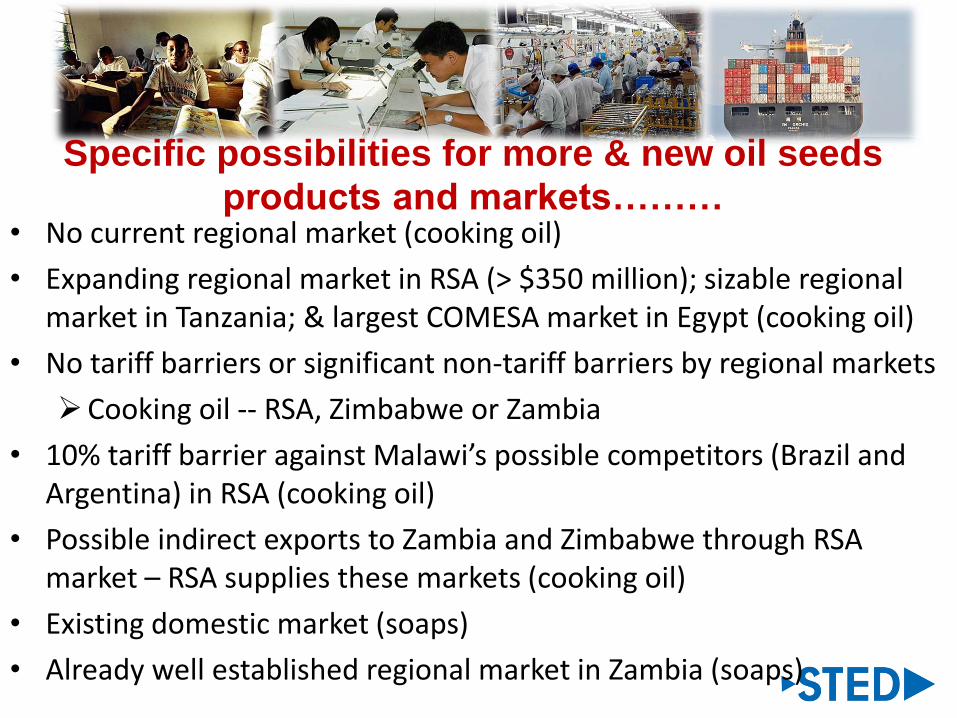
Specific possibilities for more & new oil seeds products and markets………
• No current regional market (cooking oil)
• Expanding regional market in RSA (> $350 million); sizable regional market in Tanzania; & largest COMESA market in Egypt (cooking oil)
• No tariff barriers or significant non-tariff barriers by regional markets
Cooking oil -- RSA, Zimbabwe or Zambia
• 10% tariff barrier against Malawi’s possible competitors (Brazil and Argentina) in RSA (cooking oil)
• Possible indirect exports to Zambia and Zimbabwe through RSA market – RSA supplies these markets (cooking oil)
• Existing domestic market (soaps)
• Already well established regional market in Zambia (soaps)

….. more & new oil seeds products and markets –
possibilities and limitationsPossibilities – cont’d
• New regional markets ($174 million, 2011) -- Zimbabwe, South Africa and Democratic Republic of Congo (soaps)
• Large COMESA regional market (around $400 million, 2011)
• Possible use of Fairtrade Mark branding for exports outside the region (soaps)
Limitations
• 25% tariff barrier in Tanzanian market that is supplied almost solely by Argentina (cooking oil)
• Costly transport linkages between Malawi and Egypt (cooking oil)
• Significant tariff barriers in new regional markets (soaps) -- 15% (DRC); 20% (RSA) and 40% (Zimbabwe)

Envisioning the horticulture sector
(i) Business as Usual Existing growth path: Increasing trend in total exports – (0.11% (2011) to
0.26% (2013)
• Existing products:
• Floriculture industry -- hard to define the value chain type (Sturgeon, 2008)
• Vegetables -- end-user (homestead, local and export markets) unchanged
• Sizable share of processed fruit export products (almost 100%)
• Existing markets: No current market for pulp (NES)
• Finding: Scenario inconsistent with draft vision – No specific NES vision –from 0.05% (2010) to 1% (2017)
(ii) Same but More• Step up efforts to export more of existing products to same and
similar markets – Borrow short-term strategy for oil seeds

More horticulture to same markets possible! Production possibilities
• Competitive advantage: Varied climatic conditions (tropical to semi-temperate offer an opportunity)
• Export production -- sizable share (100%)of export of processed fruits (2010 – 2013)
Market possibilities
• Increasing local demand for hospitality industry
• Import substitution -- sizable share of imported unprocessed (23%) and processed (77%) fruits (2010 – 2013)
• Growing regional markets in neighbouring countries’ growing areas of Lusaka, Tete, Nacala, Harare and Mbeya

Limitations to more horticultures to same markets…..
Production limitations• Unavailable horticulture production data at farm level difficult planning for
increasing production
• Low production – limitation to medium scale fresh fruit juice manufacturers & no economies of scale
• Limited expertise on post harvest handling of horticultural products
Market limitations• Poor quality issues -- high fibre and seeds content; Poor storage,
processing/grading and transport infrastructure; Limited expertise on marketing ; Competition with African flowers producers
• Finding: Scenario also inconsistent with the draft vision
• Small size of local and regional market
• Regional dd varies dramatically from one year to the next

(iii) Sector upgrade
Upgrade sector to find and export more new products to more new markets -- Borrow medium to long-term strategy for oil seeds
More new horticulture products to more markets possible!
Production possibilities
• Scale up high value processing
Marketing possibilities• High potential for pulp in the short term
• Growing regional markets in neighbouring countries’ growing areas of Lusaka, Tete, Nacala, Harare and Mbeya
• Target potential markets of Kenya, UAE, RSA, UK and Scandinavia
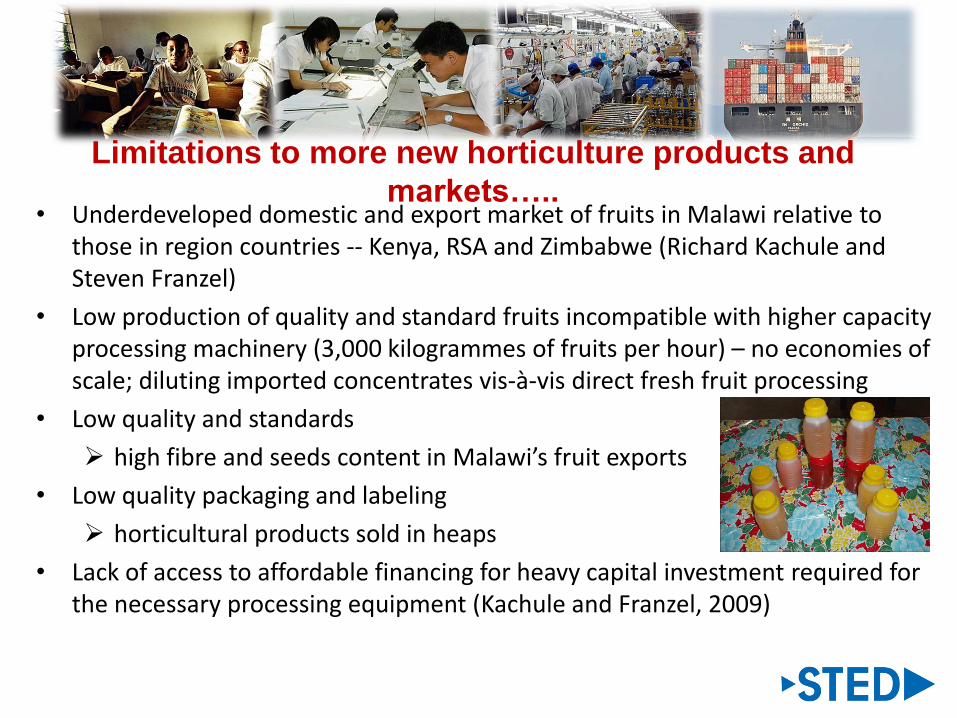
Limitations to more new horticulture products and
markets…..• Underdeveloped domestic and export market of fruits in Malawi relative to
those in region countries -- Kenya, RSA and Zimbabwe (Richard Kachule and Steven Franzel)
• Low production of quality and standard fruits incompatible with higher capacity processing machinery (3,000 kilogrammes of fruits per hour) – no economies of scale; diluting imported concentrates vis-à-vis direct fresh fruit processing
• Low quality and standards
high fibre and seeds content in Malawi’s fruit exports
• Low quality packaging and labeling
horticultural products sold in heaps
• Lack of access to affordable financing for heavy capital investment required for the necessary processing equipment (Kachule and Franzel, 2009)
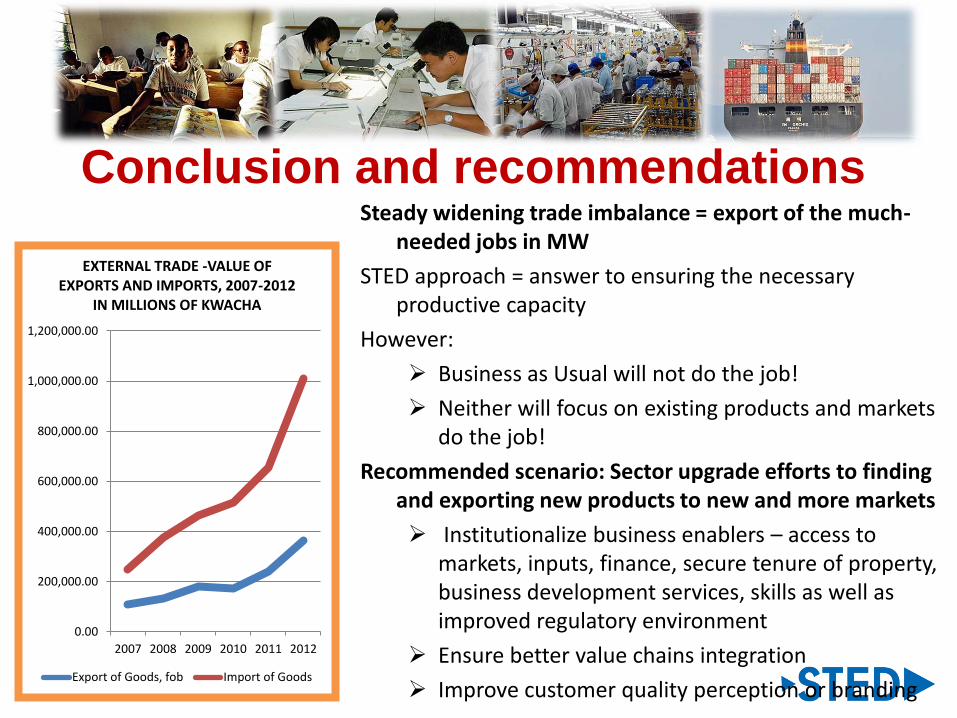
Conclusion and recommendationsSteady widening trade imbalance = export of the much-
needed jobs in MW
STED approach = answer to ensuring the necessary productive capacity
However:
Business as Usual will not do the job!
Neither will focus on existing products and markets do the job!
Recommended scenario: Sector upgrade efforts to finding and exporting new products to new and more markets
Institutionalize business enablers – access to markets, inputs, finance, secure tenure of property, business development services, skills as well as improved regulatory environment
Ensure better value chains integration
Improve customer quality perception or branding
0.00
200,000.00
400,000.00
600,000.00
800,000.00
1,000,000.00
1,200,000.00
2007 2008 2009 2010 2011 2012
EXTERNAL TRADE -VALUE OF EXPORTS AND IMPORTS, 2007-2012
IN MILLIONS OF KWACHA
Export of Goods, fob Import of Goods

The End
Qs and As
T H A N K Y O U F O R Y O U R A T T E N T I O N