analytical coverage probability framework and … · analytical coverage probability framework and...
TRANSCRIPT
Analytical Coverage Probability Framework and Spectrum
Sharing Prohibition Zone in Heterogeneous Cellular
Networks with Sectored-FFR
Sani Umar Abdullahi, Jian Liu, and Seyed Alireza Mohadeskasaei School of Computer and Communications Engineering, University of Science and Technology Beijing, Beijing 102208,
P.R. China
Email: [email protected]; [email protected]; [email protected]
Abstract—In this work, an analytical coverage probability
framework is derived for all the User Equipment (UE) types in a
Fractional Frequency Reuse (FFR)-aided heterogeneous
network leveraging tools of stochastic geometry. This
framework is used to determine the minimum distance for edge
femtocells to safely reuse same spectrum resources utilized by
center macro users (MUEs) for successful signal transmission
and decoding. A spectrum sharing prohibition zone is thus
created in which only orthogonal spectrum usage is allowed
between the two tiers to avoid violating the system outage
constraint, and is found to be sensitive to macrocell antenna
azimuth and other key network parameters. Using the macrocell
center radius, mR and the derived co-channel femtocells
distance, minco Fr , a new spatial partitioning threshold, fR is
obtained for the femtocell network, extending the spectrum
sharing prohibition zone for further interference reduction.
Analytical and numerical results show that the introduction of
fR and use of extended co-channel prohibition zone offers
improved protection to UEs against severe cross-tier
interference with enhanced throughput performance, compared
to most schemes employing a single spatial partitioning
parameter. The proposed scheme therefore provides guidelines
for efficient deployment of closed-access femtocells with hybrid
spectrum usage in multi-tier networks for lower power
consumption and improved throughput performance.
Index Terms—Heterogeneous network, fractional frequency
reuse, stochastic geometry, coverage probability, spectrum
sharing, prohibition zone
I. INTRODUCTION
Femtocells are the lowest in hierarchy of small cells
that are deployed in modern cellular networks over
traditional macrocells to improve spectral efficiency and
indoor coverage, while also off-loading data traffic from
congested macro cells in a cost-effective manner. Femto
base stations, referred to as Home eNBs (HeNBs) in
LTE-Advanced nomenclature, are short range (10-30m),
low-power (10-100mw), relatively inexpensive plug-and-
play type access points deployed in an unplanned manner
Manuscript received January 25, 2017; revised March 28, 2017.
This work was supported by the National Major Project under Grant
No. 2015ZX03001013-002. Corresponding author email: [email protected].
by end-users, and connected to operators’ core network
via broadband internet backhaul connections [1]. As they
utilize licensed spectrum of the mobile network operators,
femtocells are usually deployed in co-channel mode to
the underlying macro base stations (MeNBs) for higher
spectral efficiency, albeit at the cost of increased
interference [2], but could also be deployed in dedicated
spectrum for cross-tier interference avoidance, but at the
cost of less spectrum utilization [3]. For security,
economic reasons and backhaul limitations, many
femtocells allow access to only authorized subscribers
which are said to belong to a Closed Subscriber Group
(CSG), barring any other User Equipments (UEs)
irrespective of location or tier association. In such
scenarios, inter-tier interference could severely degrade
UE performance, especially when the randomly deployed
femtocells are in very close proximity to high-powered
macrocells [4], or for macro UEs (MUEs) located indoors
within coverage range of closed-access femtocells [5]. An
attractive Inter-Cell Interference Coordination (ICIC)
technique well suited to current Orthogonal Frequency
Division Multiple Access (OFDMA) networks to mitigate
against Co-Channel Interference (CCI) in multi-tier
networks is the Fractional Frequency Reuse (FFR)
scheme, due to its low complexity, minimal signaling
overhead, and significant coverage improvement [6]-[10].
The use of FFR is a natural trade-off between full-
frequency reuse systems and systems with higher
frequency re-reuse factors, by employing spectral reuse
only for the edge UEs to improve their coverage, while
serving cell-center UEs with full frequency for highest,
possible spectral efficiency.
Investigation into the dead-spot problem for co-
channel femtocells deployed very close to macrocells has
gathered considerable interest in the research community
[4], [11]-[14]. In [4], an Interference Limited Coverage
Area (ILCA) for femtocells was derived where co-
channel transmission by femtocells is avoided for a
single-macrocell/single-femtocell system using a path-
loss only channel model. Authors in [11] improved on
this to propose a hybrid femtocell spectrum arrangement
by using femto user classification based on the achievable
throughput of the two LTE tiers instead of the coverage
of femto cells, but do not particularly improve the edge
macro user performance. Wu et al. derived in [12] an
Journal of Communications Vol. 12, No. 3, March 2017
©2017 Journal of Communications 152
doi:10.12720/jcm.12.3.152-163
analytical expression for the minimum distance that co-
channel femtocells can be deployed away from a MeNB
as a function of azimuth angle for a 3-sector, hierarchical
grid structure, and proposed a downlink power control for
femtocells to prevent them transmitting when very close
to the embedding macrocell. In [13], two possible Femto
Exclusion Regions (FERs) are derived for co-channel
operation of femtocells in an FFR-aided, two-tier,
OFDMA network employing an omni-directional antenna,
and ignoring other macrocells’ interference in the
analytical evaluation. Authors in [14] derive an optimal
exclusion region centered on each femtocell to reduce
cross-tier interference and minimize system power
consumption, also considering a single macrocell for the
entire analysis.
0 1
23
4
5 6
7
8
91011
12
13
14
15 16 17
18
B C D E F GA
Macro: B
Femto: A,D,E,F
Fem: D,E,F
Macro: C
Femto: A
,E,F,G
Fem: E,F,G
Macro:
D
Femto:
B,F,G
Fem: B,C,GMacro: E
Femto: A,B,C,G
Mac
ro: F
Femto
: A,B
,C,D
Macro:
G
Femto:
A,C,
D,E
Fem: B
,F,G
Fem: C
,D,E
Fem: C
,D,E
Fem: D,E,F Fem
: E,F,G
Fem: B
,F,G
Fem: B,C,G
Fem: B,
C,D
Fem: B,
C,D
S01
S02
S03
S05
S06
S04
m inc o F
r
fR
mR
2 3 3
4 3 3
0
(a) (b)
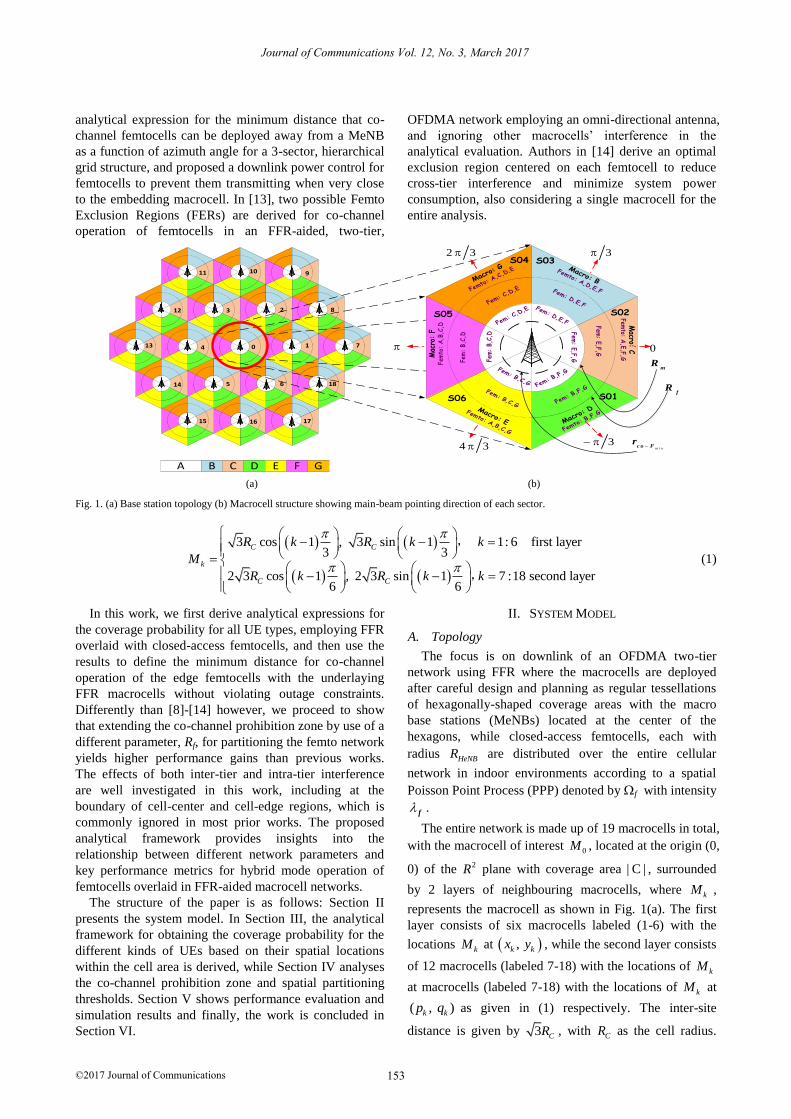
Fig. 1. (a) Base station topology (b) Macrocell structure showing main-beam pointing direction of each sector.
3 cos 1 , 3 sin 1 1: 6 first layer3 3
2 3 cos 1 , 2 3 sin 1 7 :18 second layer6 6
C C
k
C C
R k R k k
M
R k R k k
,
,
(1)
In this work, we first derive analytical expressions for
the coverage probability for all UE types, employing FFR
overlaid with closed-access femtocells, and then use the
results to define the minimum distance for co-channel
operation of the edge femtocells with the underlaying
FFR macrocells without violating outage constraints.
Differently than [8]-[14] however, we proceed to show
that extending the co-channel prohibition zone by use of a
different parameter, Rf, for partitioning the femto network
yields higher performance gains than previous works.
The effects of both inter-tier and intra-tier interference
are well investigated in this work, including at the
boundary of cell-center and cell-edge regions, which is
commonly ignored in most prior works. The proposed
analytical framework provides insights into the
relationship between different network parameters and
key performance metrics for hybrid mode operation of
femtocells overlaid in FFR-aided macrocell networks.
The structure of the paper is as follows: Section II
presents the system model. In Section III, the analytical
framework for obtaining the coverage probability for the
different kinds of UEs based on their spatial locations
within the cell area is derived, while Section IV analyses
the co-channel prohibition zone and spatial partitioning
thresholds. Section V shows performance evaluation and
simulation results and finally, the work is concluded in
Section VI.
II. SYSTEM MODEL
A. Topology
The focus is on downlink of an OFDMA two-tier
network using FFR where the macrocells are deployed
after careful design and planning as regular tessellations
of hexagonally-shaped coverage areas with the macro
base stations (MeNBs) located at the center of the
hexagons, while closed-access femtocells, each with
radius HeNBR are distributed over the entire cellular
network in indoor environments according to a spatial
Poisson Point Process (PPP) denoted by f with intensity
f .
The entire network is made up of 19 macrocells in total,
with the macrocell of interest 0M , located at the origin (0,
0) of the 2R plane with coverage area | C | , surrounded
by 2 layers of neighbouring macrocells, where kM ,
represents the macrocell as shown in Fig. 1(a). The first
layer consists of six macrocells labeled (1-6) with the
locations kM at , k kx y , while the second layer consists
of 12 macrocells (labeled 7-18) with the locations of kM
at macrocells (labeled 7-18) with the locations of kM at
( , )k kp q as given in (1) respectively. The inter-site
distance is given by 3 CR , with CR as the cell radius.
Journal of Communications Vol. 12, No. 3, March 2017
©2017 Journal of Communications 153
For analytical convenience, 0M is approximated as a disc
which has the same area as the respective hexagon given
as 2| | CC R as shown in Fig. 1. The radius of the
circular cell is defined as 3 3
2C HexR R
where HexR is
the radius of the original hexagon. Each macrocell
contains six equal sectors: 1 2 6, ......k k kS S S where the bore-
sight of each sector, ( {1,2,3,4,5,6})klS l , is given by
6
2 2v
l l
such that the arrangement of the sectors is
as shown in Fig. 1(b). The average number of femtocells
per macrocell is therefore given as | |f fN C . Due to
the symmetric structure of the macrocell sectors, we
hereby present the analytical evaluation for one sector
only (sector 03S ) for brevity, since similar results will be
realized for other sectors. For each MeNB sector, the
horizontal antenna gain pattern is given by;
(max) min 12 ,m m mG G AHPBW
(2)
where 180 180 is the azimuth angle relative to
the main-lobe, 25 dBmA is the maximum attenuation
and for a six-sectored antenna 35HPBW [15]. The
azimuth angle of a UE at ,r relative to the main beam
pointing direction of sector0 ( 1,2,3,4,5,6})lS l is
given by v
l , while the azimuth angle of a UE at
,r with respect to the main beam pointing direction of
sector (k 1,2,3,4....18}, 1,2,3,4.,5,6})klS l is a
function of r and given by;
sinatan 2 1: 6
cos
sinatan 2 7 :18
cos
kl
kkl
kl
k
r yk
r x
r qk
r p
(3)
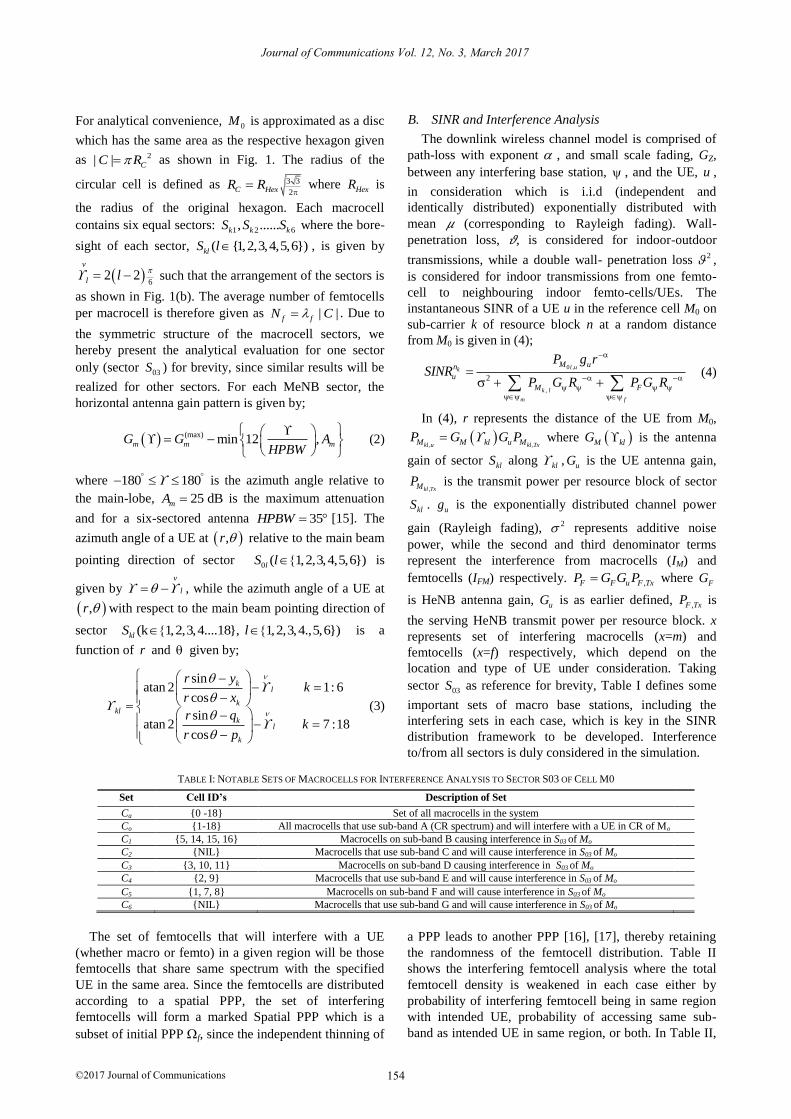
B. SINR and Interference Analysis
The downlink wireless channel model is comprised of
path-loss with exponent , and small scale fading, GZ,
between any interfering base station, , and the UE, u ,
in consideration which is i.i.d (independent and
identically distributed) exponentially distributed with
mean 𝜇 (corresponding to Rayleigh fading). Wall-
penetration loss, 𝜗, is considered for indoor-outdoor
transmissions, while a double wall- penetration loss 2 ,
is considered for indoor transmissions from one femto-
cell to neighbouring indoor femto-cells/UEs. The
instantaneous SINR of a UE u in the reference cell M0 on
sub-carrier k of resource block n at a random distance
from M0 is given in (4);
0 ,
,
2
l uk
k l
m f
M un
u
M F
P g rSINR
P G R P G R
(4)
In (4), r represents the distance of the UE from M0,
, ,kl u kl TxM M kl u MP G G P
where M klG is the antenna
gain of sector klS along kl , uG is the UE antenna gain,
,kl TxMP is the transmit power per resource block of sector
klS . ug is the exponentially distributed channel power
gain (Rayleigh fading), 2 represents additive noise
power, while the second and third denominator terms
represent the interference from macrocells (IM) and
femtocells (IFM) respectively. ,F F u F TxP G G P where FG
is HeNB antenna gain, uG is as earlier defined, ,F TxP is
the serving HeNB transmit power per resource block. x
represents set of interfering macrocells (x=m) and
femtocells (x=f) respectively, which depend on the
location and type of UE under consideration. Taking
sector 03S as reference for brevity, Table I defines some
important sets of macro base stations, including the
interfering sets in each case, which is key in the SINR
distribution framework to be developed. Interference
to/from all sectors is duly considered in the simulation.
TABLE I: NOTABLE SETS OF MACROCELLS FOR INTERFERENCE ANALYSIS TO SECTOR S03 OF CELL M0
Set Cell ID’s Description of Set
Ca {0 -18} Set of all macrocells in the system
Co {1-18} All macrocells that use sub-band A (CR spectrum) and will interfere with a UE in CR of Mo
C1 {5, 14, 15, 16} Macrocells on sub-band B causing interference in S03 of Mo
C2 {NIL} Macrocells that use sub-band C and will cause interference in S03 of Mo
C3 {3, 10, 11} Macrocells on sub-band D causing interference in S03 of Mo
C4 {2, 9} Macrocells that use sub-band E and will cause interference in S03 of Mo
C5 {1, 7, 8} Macrocells on sub-band F and will cause interference in S03 of Mo
C6 {NIL} Macrocells that use sub-band G and will cause interference in S03 of Mo
The set of femtocells that will interfere with a UE
(whether macro or femto) in a given region will be those
femtocells that share same spectrum with the specified
UE in the same area. Since the femtocells are distributed
according to a spatial PPP, the set of interfering
femtocells will form a marked Spatial PPP which is a
subset of initial PPP f, since the independent thinning of
a PPP leads to another PPP [16], [17], thereby retaining
the randomness of the femtocell distribution. Table II
shows the interfering femtocell analysis where the total
femtocell density is weakened in each case either by
probability of interfering femtocell being in same region
with intended UE, probability of accessing same sub-
band as intended UE in same region, or both. In Table II,
Journal of Communications Vol. 12, No. 3, March 2017
©2017 Journal of Communications 154
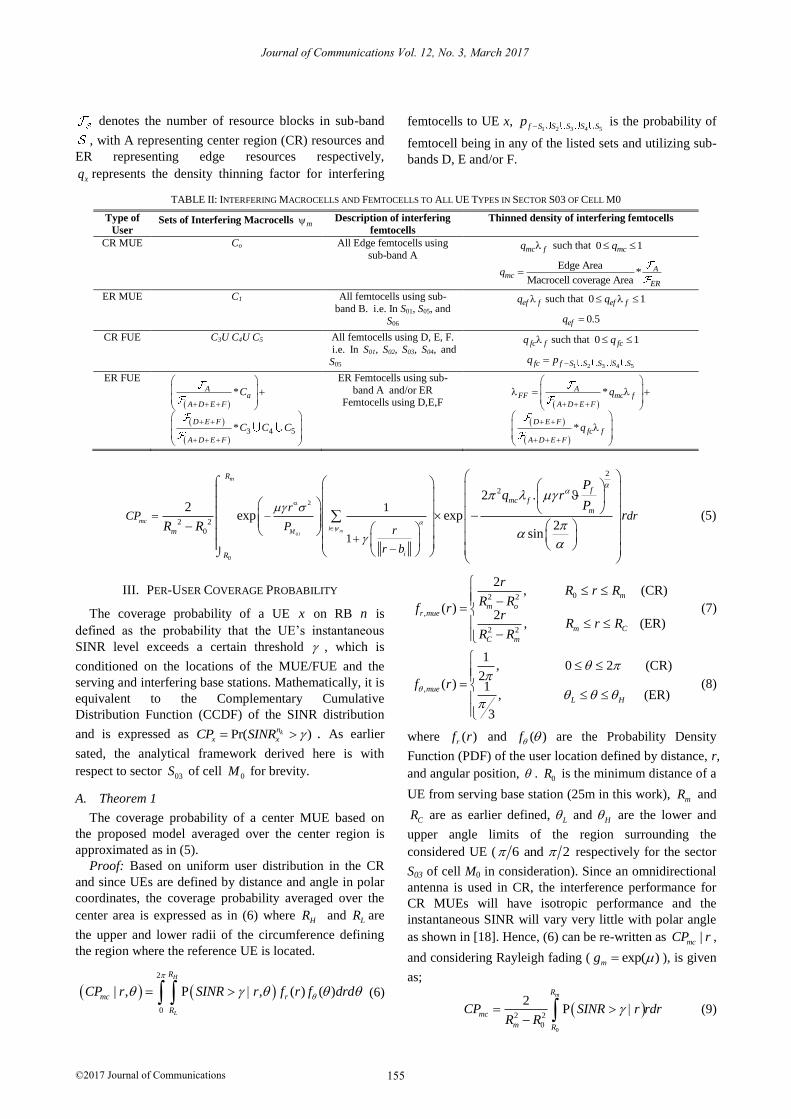
denotes the number of resource blocks in sub-band
, with A representing center region (CR) resources and
ER representing edge resources respectively,
xq represents the density thinning factor for interfering
femtocells to UE x, 1 2 3 4 5f S S S S Sp is the probability of
femtocell being in any of the listed sets and utilizing sub-
bands D, E and/or F.
TABLE II: INTERFERING MACROCELLS AND FEMTOCELLS TO ALL UE TYPES IN SECTOR S03 OF CELL M0
Type of
User Sets of Interfering Macrocells m Description of interfering
femtocells
Thinned density of interfering femtocells
CR MUE Co All Edge femtocells using
sub-band A mc fq such that 0 1mcq
Edge Area*
Macrocell coverage Area
Amc
ER
q
ER MUE C1 All femtocells using sub-
band B. i.e. In S01, S05, and
S06
ef fq such that 0 1ef fq
0.5efq
CR FUE C3U C4U C5 All femtocells using D, E, F.
i.e. In S01, S02, S03, S04, and
S05
fc fq such that 0 1fcq
1 2 3 4 5fc f S S S S Sq p
ER FUE
3 4 5
*
*
Aa
A D E F
D E F
A D E F
C
C C C
ER Femtocells using sub-
band A and/or ER Femtocells using D,E,F
*
*
AFF mc f
A D E F
D E F
fc fA D E F
q
q
0
0
2
2
2
2 2
0
1
1
2 .2
exp exp2
sinml
m
mci
M
i
R
f
mc f
m
m
R
rCP dr
P r
r b
Pq r
Pr
R R
(5)
III. PER-USER COVERAGE PROBABILITY
The coverage probability of a UE x on RB n is
defined as the probability that the UE’s instantaneous
SINR level exceeds a certain threshold , which is
conditioned on the locations of the MUE/FUE and the
serving and interfering base stations. Mathematically, it is
equivalent to the Complementary Cumulative
Distribution Function (CCDF) of the SINR distribution
and is expressed as Pr( )kn
x xCP SINR . As earlier
sated, the analytical framework derived here is with
respect to sector 03S of cell 0M
for brevity.
A. Theorem 1
The coverage probability of a center MUE based on
the proposed model averaged over the center region is
approximated as in (5).
Proof: Based on uniform user distribution in the CR
and since UEs are defined by distance and angle in polar
coordinates, the coverage probability averaged over the
center area is expressed as in (6) where HR and LR are
the upper and lower radii of the circumference defining
the region where the reference UE is located.
2
0
| , P , ( ) ( )
H
L
R
mc r
R
CP r SINR r f r f drd
(6)
02 2
,
2 2
2, (CR)
( )2
, (ER)
m
m or mue
m C
C m
rR r R
R Rf r
rR r R
R R
(7)
,
1, 0 2 (CR)
2( ) 1
, (ER)
3
mue
L H
f r
(8)
where ( )rf r and ( )f are the Probability Density
Function (PDF) of the user location defined by distance, r,
and angular position, . 0R is the minimum distance of a
UE from serving base station (25m in this work), mR and
CR are as earlier defined, L and H are the lower and
upper angle limits of the region surrounding the
considered UE ( 6 and 2 respectively for the sector
S03 of cell M0 in consideration). Since an omnidirectional
antenna is used in CR, the interference performance for
CR MUEs will have isotropic performance and the
instantaneous SINR will vary very little with polar angle
as shown in [18]. Hence, (6) can be re-written as |mcCP r ,
and considering Rayleigh fading ( exp( )mg ), is given
as;
0
2 2
0
2P
mR
mc
m R
CP SINR r rdrR R
(9)
Journal of Communications Vol. 12, No. 3, March 2017
©2017 Journal of Communications 155
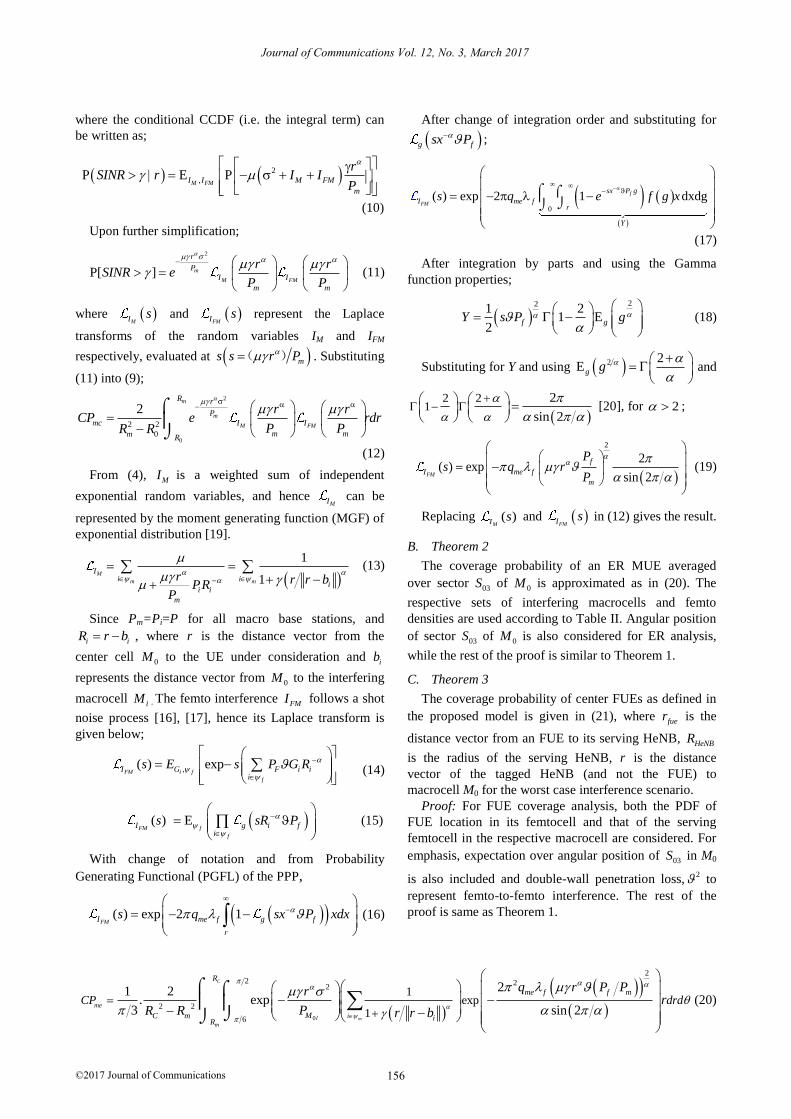
where the conditional CCDF (i.e. the integral term) can
be written as;
2
,P E PM FMI I M FM
m
rSINR r I I
P
(10)
Upon further simplification;
2
P[ ] m
M FM
r
P
I I
m m
r rSINR e
P P
(11)
where MI s and
FMI s represent the Laplace
transforms of the random variables IM and IFM
respectively, evaluated at ms s r P( ) . Substituting
(11) into (9);
2
0
2 2
0
2m
m
M FM
R r
P
mc I I
m mm R
r rCP e rdr
P PR R
(12)
From (4), MI is a weighted sum of independent
exponential random variables, and hence MI can be
represented by the moment generating function (MGF) of
exponential distribution [19].
1
1M
m m
Ii i
ii i
m
r r r bPRP
(13)
Since Pm=Pi=P for all macro base stations, and
i iR r b , where r is the distance vector from the
center cell 0M to the UE under consideration and
ib
represents the distance vector from 0M to the interfering
macrocell iM . The femto interference FMI follows a shot
noise process [16], [17], hence its Laplace transform is
given below;
,( ) exp
FM i f
f
I G F i ii
s E s P G R
(14)
( ) EFM f
f
I g i fi
s sR P
(15)
With change of notation and from Probability
Generating Functional (PGFL) of the PPP,
( ) exp 2 1FMI me f g f
r
s q sx P xdx
(16)
After change of integration order and substituting for
g fsx P ;
0
( ) exp 2 1 dxdgf
FM
sx P g
I me fr
Y
s q e f g x
(17)
After integration by parts and using the Gamma
function properties;
22
1 21 E
2f gY s P g
(18)
Substituting for Y and using 2 2Eg g
and
2 21
2
sin 2
[20], for 2 ;
2
2( ) exp
sin 2FM
f
I me f
m
Ps q r
P
(19)
Replacing ( )MI s
and
FMI s in (12) gives the result.
B. Theorem 2
The coverage probability of an ER MUE averaged
over sector 03S of 0M
is approximated as in (20). The
respective sets of interfering macrocells and femto
densities are used according to Table II. Angular position
of sector 03S of 0M
is also considered for ER analysis,
while the rest of the proof is similar to Theorem 1.
C. Theorem 3
The coverage probability of center FUEs as defined in
the proposed model is given in (21), where fuer is the
distance vector from an FUE to its serving HeNB, HeNBR
is the radius of the serving HeNB, r is the distance
vector of the tagged HeNB (and not the FUE) to
macrocell M0 for the worst case interference scenario.
Proof: For FUE coverage analysis, both the PDF of
FUE location in its femtocell and that of the serving
femtocell in the respective macrocell are considered. For
emphasis, expectation over angular position of 03S in M0
is also included and double-wall penetration loss,2 to
represent femto-to-femto interference. The rest of the
proof is same as Theorem 1.
0
22 2
2
2 2
6
1exp
1
21 2. exp
3 sin 2
C
mlm
me
i
R
me f f m
MC m iR
CP drdq r P Pr
rPR R r r b
(20)
Journal of Communications Vol. 12, No. 3, March 2017
©2017 Journal of Communications 156
2
2
2 2
6002
2
exp
1 2 2 1. exp
31
2 .
2sin
fHeNB
m
fc
R R
fue
mfHeNB f ifue i
f
f
fc f
m
fue HeNB
CP
dr d
r
PPR Rr r b
P
Pq r
Pr r dr
(21)
2
2
2 2 2
60
2
2
exp
1 2 2 1. exp
31
2
2sin
CHeNB
m
f
fe
R R
fue
mfHeNB C f ifue i
fR
f
FF
m
fue HeNB
CP
dr d
r
PPR R Rr r b
P
Pr
Pr r dr
(22)
2
2
2
exp
21
exp 1sin 2
1
f
FF
F fue m
Fmf
F fue i
f
Pr
r P
PPr r b
P
(23)
min
1-1
2
2
2
exp
21
exp 121
sin
f
FF
F fue m
co F fue m F f
F f
Pr
r Pr r P P
P
(24)
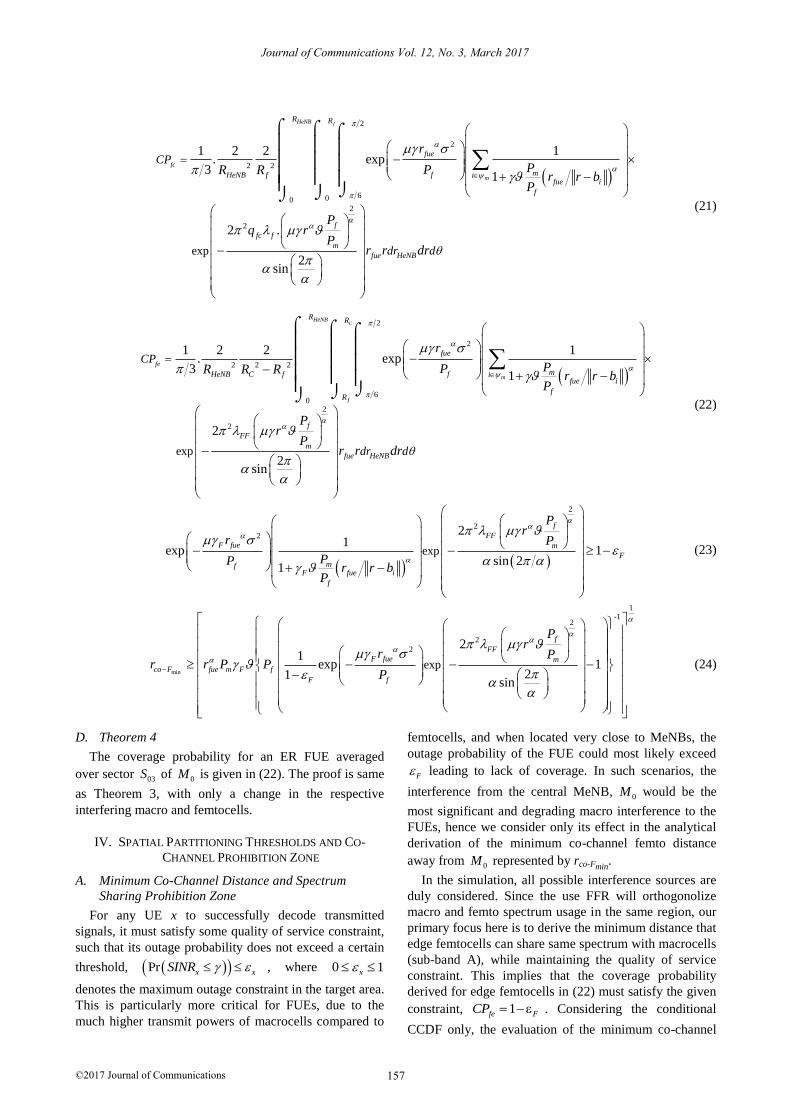
D. Theorem 4
The coverage probability for an ER FUE averaged
over sector 03S of 0M
is given in (22). The proof is same
as Theorem 3, with only a change in the respective
interfering macro and femtocells.
IV. SPATIAL PARTITIONING THRESHOLDS AND CO-
CHANNEL PROHIBITION ZONE
A. Minimum Co-Channel Distance and Spectrum
Sharing Prohibition Zone
For any UE x to successfully decode transmitted
signals, it must satisfy some quality of service constraint,
such that its outage probability does not exceed a certain
threshold, Pr x xSINR , where 0 1x denotes the maximum outage constraint in the target area.
This is particularly more critical for FUEs, due to the
much higher transmit powers of macrocells compared to
femtocells, and when located very close to MeNBs, the
outage probability of the FUE could most likely exceed
F leading to lack of coverage. In such scenarios, the
interference from the central MeNB, 0M would be the
most significant and degrading macro interference to the
FUEs, hence we consider only its effect in the analytical
derivation of the minimum co-channel femto distance
away from 0M represented by rco-Fmin
.
In the simulation, all possible interference sources are
duly considered. Since the use FFR will orthogonolize
macro and femto spectrum usage in the same region, our
primary focus here is to derive the minimum distance that
edge femtocells can share same spectrum with macrocells
(sub-band A), while maintaining the quality of service
constraint. This implies that the coverage probability
derived for edge femtocells in (22) must satisfy the given
constraint, 1fe FCP . Considering the conditional
CCDF only, the evaluation of the minimum co-channel
Journal of Communications Vol. 12, No. 3, March 2017
©2017 Journal of Communications 157
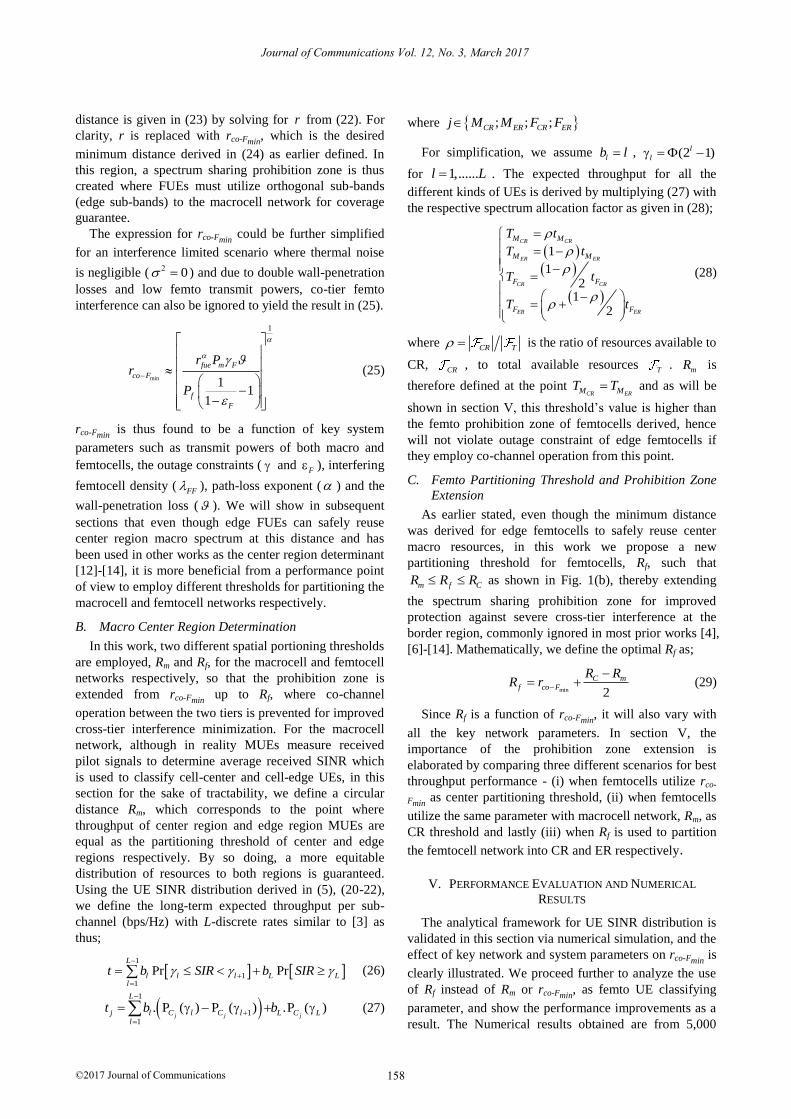
distance is given in (23) by solving for r from (22). For
clarity, r is replaced with rco-Fmin, which is the desired
minimum distance derived in (24) as earlier defined. In
this region, a spectrum sharing prohibition zone is thus
created where FUEs must utilize orthogonal sub-bands
(edge sub-bands) to the macrocell network for coverage
guarantee.
The expression for rco-Fmin could be further simplified
for an interference limited scenario where thermal noise
is negligible ( 0 ) and due to double wall-penetration
losses and low femto transmit powers, co-tier femto
interference can also be ignored to yield the result in (25).
min
1
11
1
fue m F
co F
f
F
r Pr
P
(25)
rco-Fmin is thus found to be a function of key system
parameters such as transmit powers of both macro and
femtocells, the outage constraints ( and F ), interfering
femtocell density ( FF ), path-loss exponent ( ) and the
wall-penetration loss ( ). We will show in subsequent
sections that even though edge FUEs can safely reuse
center region macro spectrum at this distance and has
been used in other works as the center region determinant
[12]-[14], it is more beneficial from a performance point
of view to employ different thresholds for partitioning the
macrocell and femtocell networks respectively.
B. Macro Center Region Determination
In this work, two different spatial portioning thresholds
are employed, Rm and Rf, for the macrocell and femtocell
networks respectively, so that the prohibition zone is
extended from rco-Fmin up to Rf, where co-channel
operation between the two tiers is prevented for improved
cross-tier interference minimization. For the macrocell
network, although in reality MUEs measure received
pilot signals to determine average received SINR which
is used to classify cell-center and cell-edge UEs, in this
section for the sake of tractability, we define a circular
distance Rm, which corresponds to the point where
throughput of center region and edge region MUEs are
equal as the partitioning threshold of center and edge
regions respectively. By so doing, a more equitable
distribution of resources to both regions is guaranteed.
Using the UE SINR distribution derived in (5), (20-22),
we define the long-term expected throughput per sub-
channel (bps/Hz) with L-discrete rates similar to [3] as
thus;
1
11
Pr PrL
l l l L Ll
t b SIR b SIR
(26)
1
11
. P ( ) P ( ) .P ( )j j j
L
j l C l C l L C Ll
t b b
(27)
where ; ; ;CR ER CR ERj M M F F
For simplification, we assume lb l , (2 1)l
l for 1,......l L . The expected throughput for all the
different kinds of UEs is derived by multiplying (27) with
the respective spectrum allocation factor as given in (28);
1
12
12
CR CR
ER ER
CR CR
ER ER
M M
M M
F F
F F
T t
T t
T t
T t
(28)
where CR T
is the ratio of resources available to
CR, CR
, to total available resources T
. mR is
therefore defined at the point CR ERM MT T and as will be
shown in section V, this threshold’s value is higher than
the femto prohibition zone of femtocells derived, hence
will not violate outage constraint of edge femtocells if
they employ co-channel operation from this point.
C. Femto Partitioning Threshold and Prohibition Zone
Extension
As earlier stated, even though the minimum distance
was derived for edge femtocells to safely reuse center
macro resources, in this work we propose a new
partitioning threshold for femtocells, Rf, such that
m f CR R R as shown in Fig. 1(b), thereby extending
the spectrum sharing prohibition zone for improved
protection against severe cross-tier interference at the
border region, commonly ignored in most prior works [4],
[6]-[14]. Mathematically, we define the optimal Rf as;
min 2
C mf co F
R RR r
(29)
Since Rf is a function of rco-Fmin, it will also vary with
all the key network parameters. In section V, the
importance of the prohibition zone extension is
elaborated by comparing three different scenarios for best
throughput performance - (i) when femtocells utilize rco-
Fmin as center partitioning threshold, (ii) when femtocells
utilize the same parameter with macrocell network, Rm, as
CR threshold and lastly (iii) when Rf is used to partition
the femtocell network into CR and ER respectively.
V. PERFORMANCE EVALUATION AND NUMERICAL
RESULTS
The analytical framework for UE SINR distribution is
validated in this section via numerical simulation, and the
effect of key network and system parameters on rco-Fmin is
clearly illustrated. We proceed further to analyze the use
of Rf instead of Rm or rco-Fmin, as femto UE classifying
parameter, and show the performance improvements as a
result. The Numerical results obtained are from 5,000
Journal of Communications Vol. 12, No. 3, March 2017
©2017 Journal of Communications 158
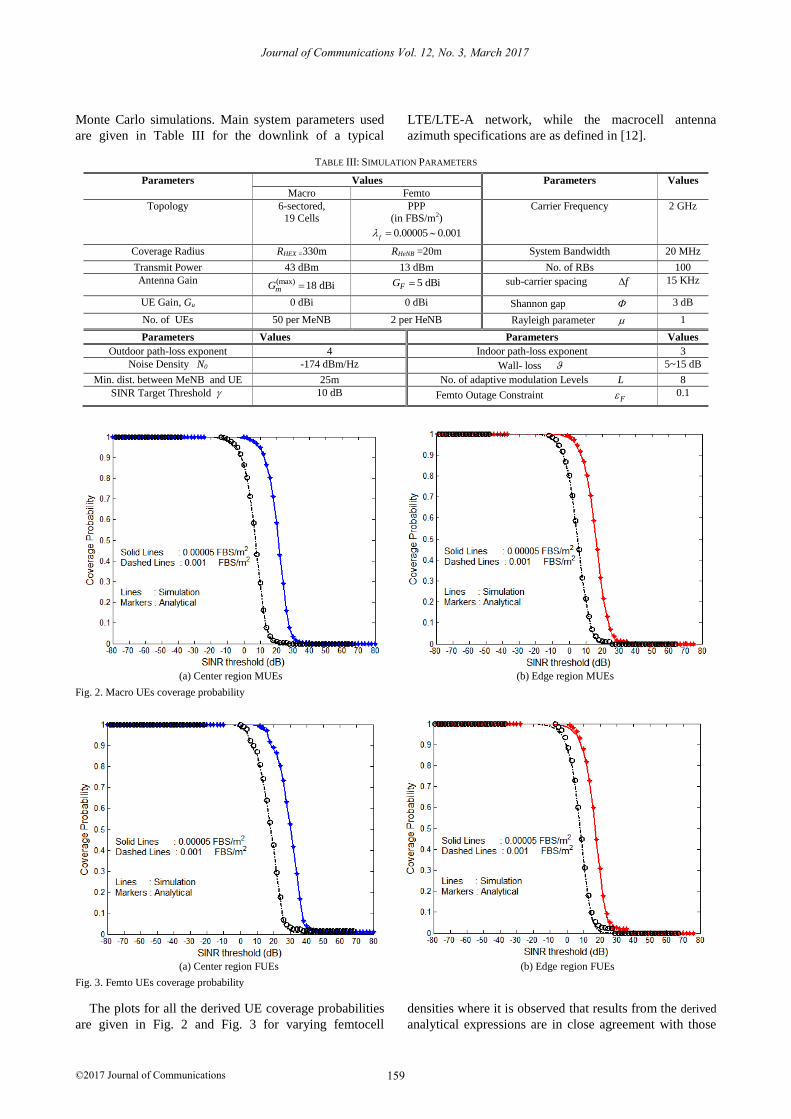
Monte Carlo simulations. Main system parameters used
are given in Table III for the downlink of a typical
LTE/LTE-A network, while the macrocell antenna
azimuth specifications are as defined in [12].
TABLE III: SIMULATION PARAMETERS
Parameters Values Parameters Values
Macro Femto
Topology 6-sectored, 19 Cells
PPP (in FBS/m2)
0.00005 0.001f
Carrier Frequency 2 GHz
Coverage Radius RHEX =330m RHeNB =20m System Bandwidth 20 MHz
Transmit Power 43 dBm 13 dBm No. of RBs 100
Antenna Gain (max) 18 dBimG 5 dBiFG sub-carrier spacing f 15 KHz
UE Gain, Gu 0 dBi 0 dBi Shannon gap 3 dB
No. of UEs 50 per MeNB 2 per HeNB Rayleigh parameter 1
Parameters Values Parameters Values
Outdoor path-loss exponent 4 Indoor path-loss exponent 3
Noise Density N0 -174 dBm/Hz Wall- loss 5~15 dB
Min. dist. between MeNB and UE 25m No. of adaptive modulation Levels L 8
SINR Target Threshold 10 dB Femto Outage Constraint F 0.1
(a) Center region MUEs (b) Edge region MUEs
Fig. 2. Macro UEs coverage probability
(a) Center region FUEs (b) Edge region FUEs
Fig. 3. Femto UEs coverage probability
The plots for all the derived UE coverage probabilities
are given in Fig. 2 and Fig. 3 for varying femtocell
densities where it is observed that results from the derived
analytical expressions are in close agreement with those
Journal of Communications Vol. 12, No. 3, March 2017
©2017 Journal of Communications 159
obtained from Monte Carlo simulations. This validates
the analytical framework derived for the UE SINR
distribution in this work. In all cases, it is evident that
with increasing density of the closed-access femtocells,
coverage performance for all UEs gets degraded due to
rising interference, and can be easily observed from the
expressions in (5), (20) - (22) where the coverage is a
monotonically decreasing function of f .
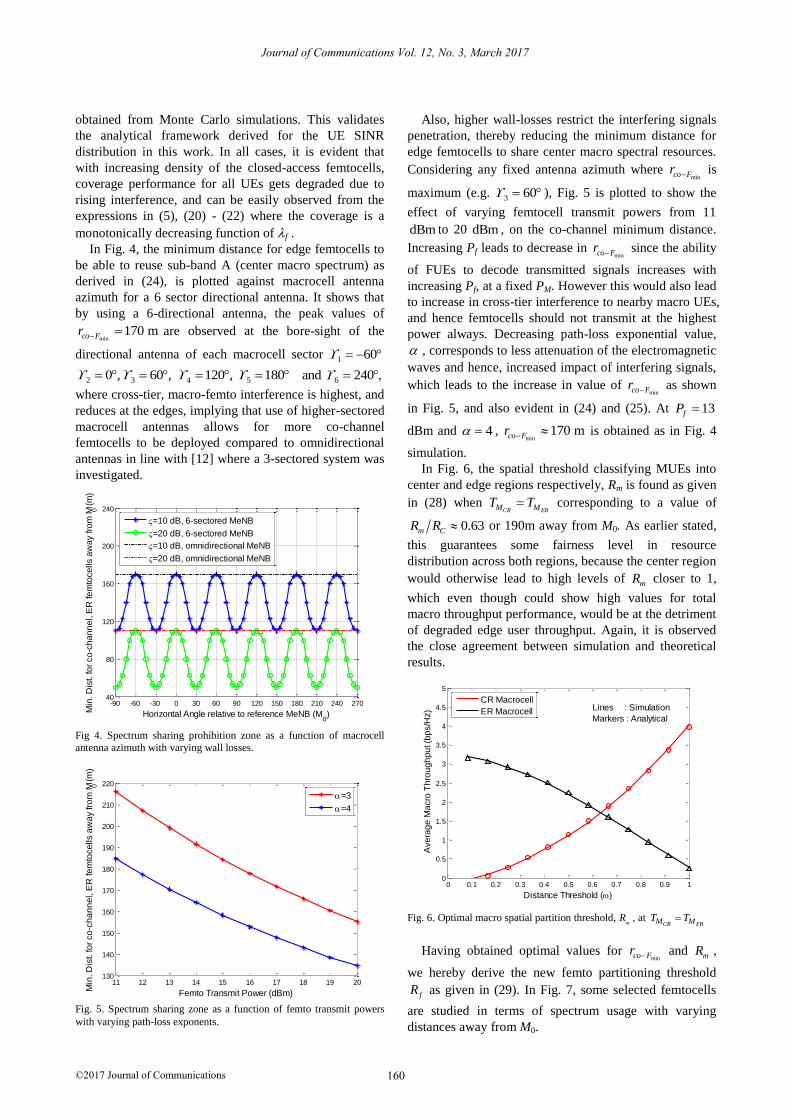
In Fig. 4, the minimum distance for edge femtocells to
be able to reuse sub-band A (center macro spectrum) as
derived in (24), is plotted against macrocell antenna
azimuth for a 6 sector directional antenna. It shows that
by using a 6-directional antenna, the peak values of
min170 mco Fr are observed at the bore-sight of the
directional antenna of each macrocell sector 1 60
2 3 4 50 , 60 , 120 , 180 6and 240
where cross-tier, macro-femto interference is highest, and
reduces at the edges, implying that use of higher-sectored
macrocell antennas allows for more co-channel
femtocells to be deployed compared to omnidirectional
antennas in line with [12] where a 3-sectored system was
investigated.
-90 -60 -30 0 30 60 90 120 150 180 210 240 27040
80
120
160
200
240
Horizontal Angle relative to reference MeNB (M0)M
in. D
ist. fo
r co
-ch
an
ne
l, E
R fe
mto
ce
lls a
wa
y fro
m M
0 (
m)
=10 dB, 6-sectored MeNB
=20 dB, 6-sectored MeNB
=10 dB, omnidirectional MeNB
=20 dB, omnidirectional MeNB
Fig 4. Spectrum sharing prohibition zone as a function of macrocell
antenna azimuth with varying wall losses.
11 12 13 14 15 16 17 18 19 20130
140
150
160
170
180
190
200
210
220
Femto Transmit Power (dBm)
Min
. D
ist. fo
r co
-ch
an
ne
l, E
R fe
mto
ce
lls a
wa
y fro
m M
0 (
m)
=3
=4
Fig. 5. Spectrum sharing zone as a function of femto transmit powers
with varying path-loss exponents.
Also, higher wall-losses restrict the interfering signals
penetration, thereby reducing the minimum distance for
edge femtocells to share center macro spectral resources.
Considering any fixed antenna azimuth where minco Fr
is
maximum (e.g. 3 60 ), Fig. 5 is plotted to show the
effect of varying femtocell transmit powers from 11
dBm to 20 dBm , on the co-channel minimum distance.
Increasing Pf leads to decrease in minco Fr
since the ability
of FUEs to decode transmitted signals increases with
increasing Pf, at a fixed PM. However this would also lead
to increase in cross-tier interference to nearby macro UEs,
and hence femtocells should not transmit at the highest
power always. Decreasing path-loss exponential value,
, corresponds to less attenuation of the electromagnetic
waves and hence, increased impact of interfering signals,
which leads to the increase in value of minco Fr
as shown
in Fig. 5, and also evident in (24) and (25). At 13fP
dBm and 4 , min
170 mco Fr is obtained as in Fig. 4
simulation.
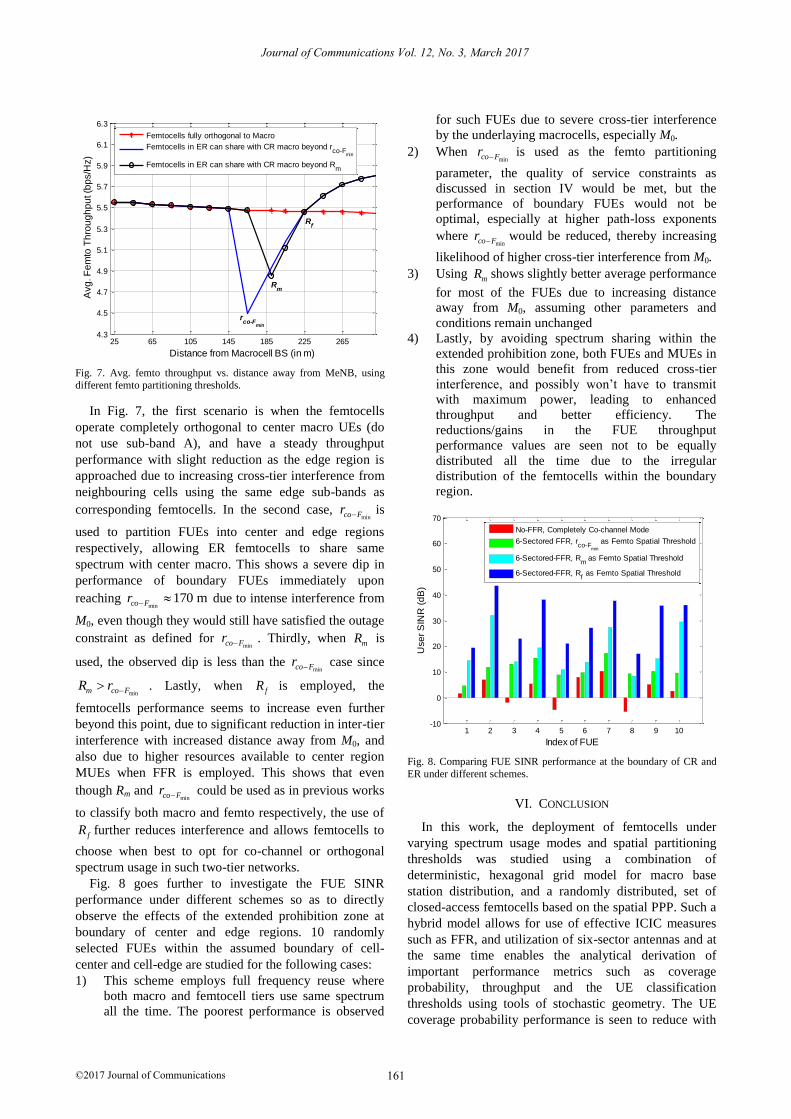
In Fig. 6, the spatial threshold classifying MUEs into
center and edge regions respectively, Rm is found as given
in (28) when CR ERM MT T corresponding to a value of
0.63m CR R or 190m away from M0. As earlier stated,
this guarantees some fairness level in resource
distribution across both regions, because the center region
would otherwise lead to high levels of mR closer to 1,
which even though could show high values for total
macro throughput performance, would be at the detriment
of degraded edge user throughput. Again, it is observed
the close agreement between simulation and theoretical
results.
0 0.1 0.2 0.3 0.4 0.5 0.6 0.7 0.8 0.9 10
0.5
1
1.5
2
2.5
3
3.5
4
4.5
5
Distance Threshold ()
Ave
rag
e M
acro
Th
rou
gh
pu
t (b
ps/H
z)
Lines : Simulation
Markers : Analytical
CR Macrocell
ER Macrocell
Fig. 6. Optimal macro spatial partition threshold, m
R , at CR ERM MT T
Having obtained optimal values for minco Fr
and mR ,
we hereby derive the new femto partitioning threshold
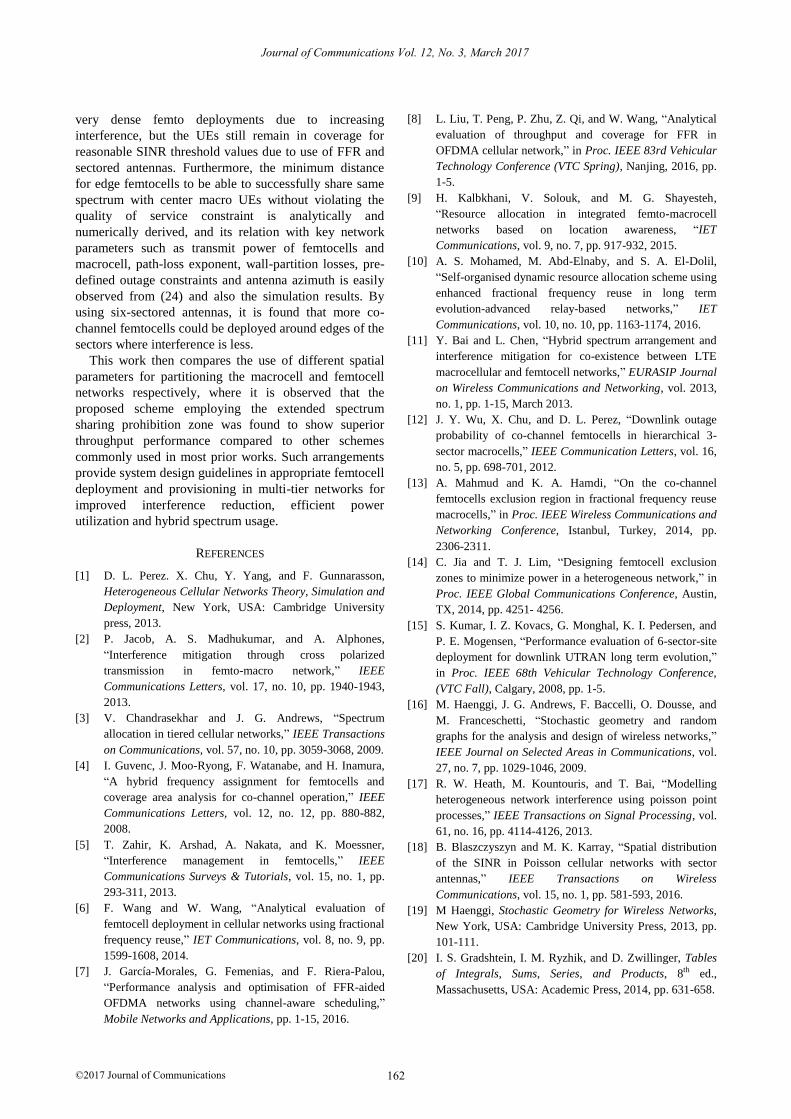
fR as given in (29). In Fig. 7, some selected femtocells
are studied in terms of spectrum usage with varying
distances away from M0.
Journal of Communications Vol. 12, No. 3, March 2017
©2017 Journal of Communications 160
25 65 105 145 185 225 2654.3
4.5
4.7
4.9
5.1
5.3
5.5
5.7
5.9
6.1
6.3
Distance from Macrocell BS (in m)
Avg
. F
em
to T
hro
ug
hp
ut (b
ps/H
z)
rco-F
min
Rm
Rf
Femtocells fully orthogonal to Macro
Femtocells in ER can share with CR macro beyond rco-F
min
Femtocells in ER can share with CR macro beyond Rm
Fig. 7. Avg. femto throughput vs. distance away from MeNB, using
different femto partitioning thresholds.
In Fig. 7, the first scenario is when the femtocells
operate completely orthogonal to center macro UEs (do
not use sub-band A), and have a steady throughput
performance with slight reduction as the edge region is
approached due to increasing cross-tier interference from
neighbouring cells using the same edge sub-bands as
corresponding femtocells. In the second case, minco Fr is
used to partition FUEs into center and edge regions
respectively, allowing ER femtocells to share same
spectrum with center macro. This shows a severe dip in
performance of boundary FUEs immediately upon
reaching min
170 mco Fr due to intense interference from
M0, even though they would still have satisfied the outage
constraint as defined for minco Fr . Thirdly, when mR
is
used, the observed dip is less than the minco Fr
case since
minm co FR r . Lastly, when fR is employed, the
femtocells performance seems to increase even further
beyond this point, due to significant reduction in inter-tier
interference with increased distance away from M0, and
also due to higher resources available to center region
MUEs when FFR is employed. This shows that even
though Rm and minco Fr
could be used as in previous works
to classify both macro and femto respectively, the use of
fR further reduces interference and allows femtocells to
choose when best to opt for co-channel or orthogonal
spectrum usage in such two-tier networks.
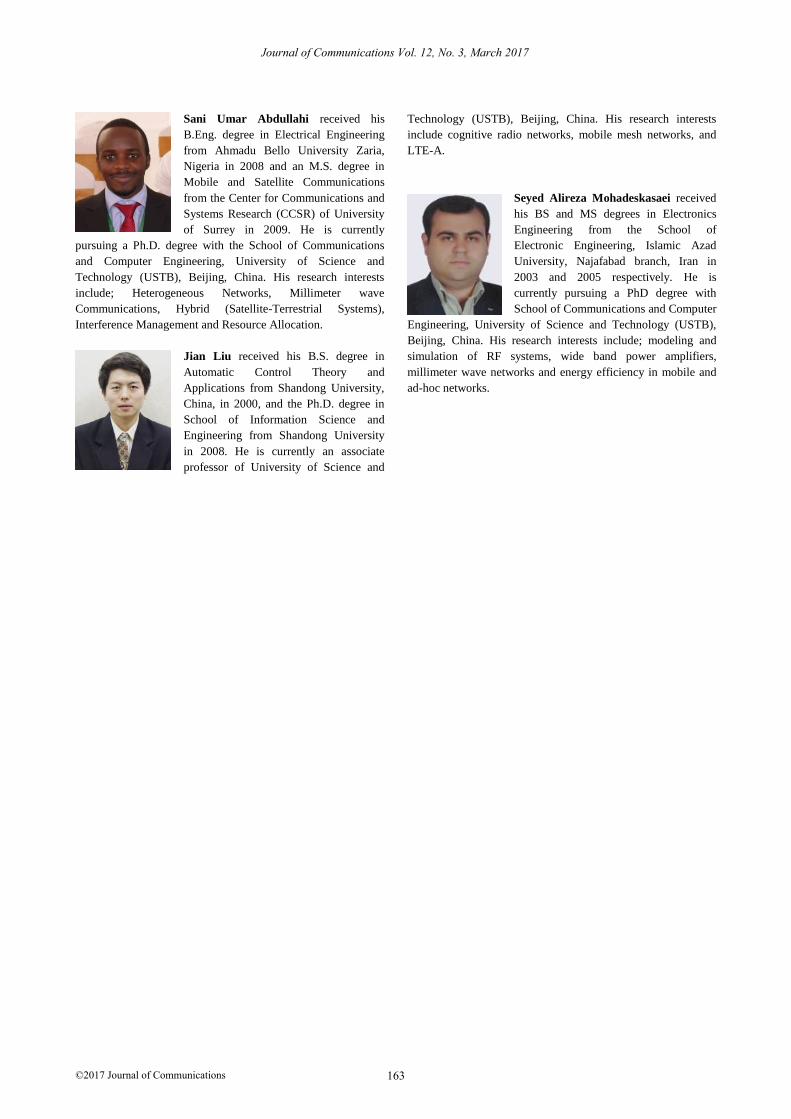
Fig. 8 goes further to investigate the FUE SINR
performance under different schemes so as to directly
observe the effects of the extended prohibition zone at
boundary of center and edge regions. 10 randomly
selected FUEs within the assumed boundary of cell-
center and cell-edge are studied for the following cases:
1) This scheme employs full frequency reuse where
both macro and femtocell tiers use same spectrum
all the time. The poorest performance is observed
for such FUEs due to severe cross-tier interference
by the underlaying macrocells, especially M0.
2) When minco Fr is used as the femto partitioning
parameter, the quality of service constraints as
discussed in section IV would be met, but the
performance of boundary FUEs would not be
optimal, especially at higher path-loss exponents
where minco Fr would be reduced, thereby increasing
likelihood of higher cross-tier interference from M0.
3) Using mR shows slightly better average performance
for most of the FUEs due to increasing distance
away from M0, assuming other parameters and
conditions remain unchanged
4) Lastly, by avoiding spectrum sharing within the
extended prohibition zone, both FUEs and MUEs in
this zone would benefit from reduced cross-tier
interference, and possibly won’t have to transmit
with maximum power, leading to enhanced
throughput and better efficiency. The
reductions/gains in the FUE throughput
performance values are seen not to be equally
distributed all the time due to the irregular
distribution of the femtocells within the boundary
region.
1 2 3 4 5 6 7 8 9 10-10
0
10
20
30
40
50
60
70
Index of FUE
Use
r S
INR
(d
B)
No-FFR, Completely Co-channel Mode
6-Sectored FFR, rco-F
min
as Femto Spatial Threshold
6-Sectored-FFR, Rm
as Femto Spatial Threshold
6-Sectored-FFR, Rf as Femto Spatial Threshold
Fig. 8. Comparing FUE SINR performance at the boundary of CR and
ER under different schemes.
VI. CONCLUSION
In this work, the deployment of femtocells under
varying spectrum usage modes and spatial partitioning
thresholds was studied using a combination of
deterministic, hexagonal grid model for macro base
station distribution, and a randomly distributed, set of
closed-access femtocells based on the spatial PPP. Such a
hybrid model allows for use of effective ICIC measures
such as FFR, and utilization of six-sector antennas and at
the same time enables the analytical derivation of
important performance metrics such as coverage
probability, throughput and the UE classification
thresholds using tools of stochastic geometry. The UE
coverage probability performance is seen to reduce with
Journal of Communications Vol. 12, No. 3, March 2017
©2017 Journal of Communications 161
very dense femto deployments due to increasing
interference, but the UEs still remain in coverage for
reasonable SINR threshold values due to use of FFR and
sectored antennas. Furthermore, the minimum distance
for edge femtocells to be able to successfully share same
spectrum with center macro UEs without violating the
quality of service constraint is analytically and
numerically derived, and its relation with key network
parameters such as transmit power of femtocells and
macrocell, path-loss exponent, wall-partition losses, pre-
defined outage constraints and antenna azimuth is easily
observed from (24) and also the simulation results. By
using six-sectored antennas, it is found that more co-
channel femtocells could be deployed around edges of the
sectors where interference is less.
This work then compares the use of different spatial
parameters for partitioning the macrocell and femtocell
networks respectively, where it is observed that the
proposed scheme employing the extended spectrum
sharing prohibition zone was found to show superior
throughput performance compared to other schemes
commonly used in most prior works. Such arrangements
provide system design guidelines in appropriate femtocell
deployment and provisioning in multi-tier networks for
improved interference reduction, efficient power
utilization and hybrid spectrum usage.
REFERENCES
[1] D. L. Perez. X. Chu, Y. Yang, and F. Gunnarasson,
Heterogeneous Cellular Networks Theory, Simulation and
Deployment, New York, USA: Cambridge University
press, 2013.
[2] P. Jacob, A. S. Madhukumar, and A. Alphones,
“Interference mitigation through cross polarized
transmission in femto-macro network,” IEEE
Communications Letters, vol. 17, no. 10, pp. 1940-1943,
2013.
[3] V. Chandrasekhar and J. G. Andrews, “Spectrum
allocation in tiered cellular networks,” IEEE Transactions
on Communications, vol. 57, no. 10, pp. 3059-3068, 2009.
[4] I. Guvenc, J. Moo-Ryong, F. Watanabe, and H. Inamura,
“A hybrid frequency assignment for femtocells and
coverage area analysis for co-channel operation,” IEEE
Communications Letters, vol. 12, no. 12, pp. 880-882,
2008.
[5] T. Zahir, K. Arshad, A. Nakata, and K. Moessner,
“Interference management in femtocells,” IEEE
Communications Surveys & Tutorials, vol. 15, no. 1, pp.
293-311, 2013.
[6] F. Wang and W. Wang, “Analytical evaluation of
femtocell deployment in cellular networks using fractional
frequency reuse,” IET Communications, vol. 8, no. 9, pp.
1599-1608, 2014.
[7] J. García-Morales, G. Femenias, and F. Riera-Palou,
“Performance analysis and optimisation of FFR-aided
OFDMA networks using channel-aware scheduling,”
Mobile Networks and Applications, pp. 1-15, 2016.
[8] L. Liu, T. Peng, P. Zhu, Z. Qi, and W. Wang, “Analytical
evaluation of throughput and coverage for FFR in
OFDMA cellular network,” in Proc. IEEE 83rd Vehicular
Technology Conference (VTC Spring), Nanjing, 2016, pp.
1-5.
[9] H. Kalbkhani, V. Solouk, and M. G. Shayesteh,
“Resource allocation in integrated femto-macrocell
networks based on location awareness, “IET
Communications, vol. 9, no. 7, pp. 917-932, 2015.
[10] A. S. Mohamed, M. Abd-Elnaby, and S. A. El-Dolil,
“Self-organised dynamic resource allocation scheme using
enhanced fractional frequency reuse in long term
evolution-advanced relay-based networks,” IET
Communications, vol. 10, no. 10, pp. 1163-1174, 2016.
[11] Y. Bai and L. Chen, “Hybrid spectrum arrangement and
interference mitigation for co-existence between LTE
macrocellular and femtocell networks,” EURASIP Journal
on Wireless Communications and Networking, vol. 2013,
no. 1, pp. 1-15, March 2013.
[12] J. Y. Wu, X. Chu, and D. L. Perez, “Downlink outage
probability of co-channel femtocells in hierarchical 3-
sector macrocells,” IEEE Communication Letters, vol. 16,
no. 5, pp. 698-701, 2012.
[13] A. Mahmud and K. A. Hamdi, “On the co-channel
femtocells exclusion region in fractional frequency reuse
macrocells,” in Proc. IEEE Wireless Communications and
Networking Conference, Istanbul, Turkey, 2014, pp.
2306-2311.
[14] C. Jia and T. J. Lim, “Designing femtocell exclusion
zones to minimize power in a heterogeneous network,” in
Proc. IEEE Global Communications Conference, Austin,
TX, 2014, pp. 4251- 4256.
[15] S. Kumar, I. Z. Kovacs, G. Monghal, K. I. Pedersen, and
P. E. Mogensen, “Performance evaluation of 6-sector-site
deployment for downlink UTRAN long term evolution,”
in Proc. IEEE 68th Vehicular Technology Conference,
(VTC Fall), Calgary, 2008, pp. 1-5.
[16] M. Haenggi, J. G. Andrews, F. Baccelli, O. Dousse, and
M. Franceschetti, “Stochastic geometry and random
graphs for the analysis and design of wireless networks,”
IEEE Journal on Selected Areas in Communications, vol.
27, no. 7, pp. 1029-1046, 2009.
[17] R. W. Heath, M. Kountouris, and T. Bai, “Modelling
heterogeneous network interference using poisson point
processes,” IEEE Transactions on Signal Processing, vol.
61, no. 16, pp. 4114-4126, 2013.
[18] B. Blaszczyszyn and M. K. Karray, “Spatial distribution
of the SINR in Poisson cellular networks with sector
antennas,” IEEE Transactions on Wireless
Communications, vol. 15, no. 1, pp. 581-593, 2016.
[19] M Haenggi, Stochastic Geometry for Wireless Networks,
New York, USA: Cambridge University Press, 2013, pp.
101-111.
[20] I. S. Gradshtein, I. M. Ryzhik, and D. Zwillinger, Tables
of Integrals, Sums, Series, and Products, 8th ed.,
Massachusetts, USA: Academic Press, 2014, pp. 631-658.
Journal of Communications Vol. 12, No. 3, March 2017
©2017 Journal of Communications 162
Sani Umar Abdullahi received his
B.Eng. degree in Electrical Engineering
from Ahmadu Bello University Zaria,
Nigeria in 2008 and an M.S. degree in
Mobile and Satellite Communications
from the Center for Communications and
Systems Research (CCSR) of University
of Surrey in 2009. He is currently
pursuing a Ph.D. degree with the School of Communications
and Computer Engineering, University of Science and
Technology (USTB), Beijing, China. His research interests
include; Heterogeneous Networks, Millimeter wave
Communications, Hybrid (Satellite-Terrestrial Systems),
Interference Management and Resource Allocation.
Jian Liu received his B.S. degree in
Automatic Control Theory and
Applications from Shandong University,
China, in 2000, and the Ph.D. degree in
School of Information Science and
Engineering from Shandong University
in 2008. He is currently an associate
professor of University of Science and
Technology (USTB), Beijing, China. His research interests
include cognitive radio networks, mobile mesh networks, and
LTE-A.
Seyed Alireza Mohadeskasaei received
his BS and MS degrees in Electronics
Engineering from the School of
Electronic Engineering, Islamic Azad
University, Najafabad branch, Iran in
2003 and 2005 respectively. He is
currently pursuing a PhD degree with
School of Communications and Computer
Engineering, University of Science and Technology (USTB),
Beijing, China. His research interests include; modeling and
simulation of RF systems, wide band power amplifiers,
millimeter wave networks and energy efficiency in mobile and
ad-hoc networks.
Journal of Communications Vol. 12, No. 3, March 2017
©2017 Journal of Communications 163