analysts meeting - dassault systèmes€¦ · analysts meeting q4 & fy 2016 bernard ......
TRANSCRIPT

Analysts Meeting
Q4 & FY 2016
Bernard Charlès, Vice-Chairman of the Board
of Directors & CEO
Thibault de Tersant, Senior EVP, CFO

2
Forward Looking Information Statements herein that are not historical facts but express expectations or objectives for the future, including but not limited to statements
regarding the Company’s non-IFRS financial performance objectives, are forward-looking statements.
Such forward-looking statements are based on Dassault Systèmes management's current views and assumptions and involve known
and unknown risks and uncertainties. Actual results or performances may differ materially from those in such statements due to a range
of factors. The Company’s current outlook for 2017 takes into consideration, among other things, an uncertain global economic
environment. In light of the continuing uncertainties regarding economic, business, social and geopolitical conditions at the global level,
the Company’s revenue, net earnings and cash flows may grow more slowly, whether on an annual or quarterly basis. While the
Company makes every effort to take into consideration this uncertain macroeconomic outlook, the Company’s business results, however,
may not develop as anticipated. Furthermore, due to factors affecting sales of the Company’s products and services as described above
and in the Risk Factors section of the Company’s most recent Document de Référence, there may be a substantial time lag between an
improvement in global economic and business conditions and an upswing in the Company’s business results.
In preparing such forward-looking statements, the Company has in particular assumed an average US dollar to euro exchange rate of
US$1.10 per €1.00 for the 2017 first quarter and US$1.10 per €1.00 for the full year 2017 as well as an average Japanese yen to euro
exchange rate of JPY117 to €1.00 for the first quarter and JPY117 to €1.00 for the full year 2017 before hedging; however, currency
values fluctuate, and the Company’s results of operations may be significantly affected by changes in exchange rates.
The Company’s actual results or performance may also be materially negatively affected by numerous risks and uncertainties, as
described in the “Risk Factors” section of the 2015 Document de Référence, filed with the AMF on March 23, 2016, and also available on
the Company’s website www.3ds.com.

3
Non-IFRS Information Readers are cautioned that the supplemental non-IFRS information presented in this press release is subject to inherent limitations. It is
not based on any comprehensive set of accounting rules or principles and should not be considered as a substitute for IFRS
measurements. Also, the Company’s supplemental non-IFRS financial information may not be comparable to similarly titled non-IFRS
measures used by other companies. Further specific limitations for individual non-IFRS measures, and the reasons for presenting non-
IFRS financial information, are set forth in the Company’s 2015 Document de Référence filed with the AMF on March 23, 2016.
In the tables accompanying this press release the Company sets forth its supplemental non-IFRS figures for revenue, operating income,
operating margin, net income and diluted earnings per share, which exclude the effect of adjusting the carrying value of acquired
companies’ deferred revenue, share-based compensation expense and related social charges, the amortization of acquired intangible
assets, other operating income and expense, net, certain one-time items included in financial revenue and other, net, and the income tax
effect of the non-IFRS adjustments and certain one-time tax effects. The tables also set forth the most comparable IFRS financial
measure and reconciliations of this information with non-IFRS information.
When the Company believes it would be helpful for understanding trends in its business, the Company provides percentage increases or
decreases in its revenue (in both IFRS as well as non-IFRS) to eliminate the effect of changes in currency values, particularly the
U.S. dollar and the Japanese yen, relative to the euro. When trend information is expressed herein "in constant currencies", the results of
the "prior" period have first been recalculated using the average exchange rates of the comparable period in the current year, and then
compared with the results of the comparable period in the current year.
4
1
Q4 & FY16 Financial Highlights
2
Q4 & FY16 Business Review & Strategy Update
3 Q1 & FY17 Financial Objectives
4 Financial Information Appendix
Agenda

5
Q4 & FY16 Business Review & Strategy Update
Q416 Business Review
FY16 Growth Drivers
Strategy Update

6
Q416 Business Highlights Non-IFRS
Total Revenue growth up +10% exFX
New Licenses Revenue growth up +10% exFX
EPS growth up +10%
SOLIDWORKS software revenue up +13% exFX
SIMULIA, DELMIA, QUINTIQ software revenue up double-digit exFX
Europe software revenue up +13% exFX
Diversification Industries software revenue up +16% exFX
7
Q4 & FY16 Business Review & Strategy Update
Q416 Business Review
FY16 Growth Drivers
Strategy Update

8
2014-2019: Multiple Drivers to Support Growth
Build on VALUE Increase Domain LEADERSHIP Improve EFFICIENCY
Industry Focus
3DEXPERIENCE Platform
Cloud
Brand Value Creation
Acquisitions Sales Channels Coverage in Geographies

9
3DEXPERIENCE | FY16 Performance
* Excluding SOLIDWORKS and acquisitions
29% 36%
FY 15 FY 16
+7 points in 2016
% 3DEXPERIENCE / New Licenses Revenue* Non-IFRS
3DEXPERIENCE new licenses
revenue up +30% exFX

10
Valmet is a leading supplier of services and technology to the pulp, paper and energy
industries
Valmet Adopts 3DEXPERIENCE Platform
Valmet
Business Values:
Solution: - Increase market share by managing the right
product portfolio
- Win more bids and increase profitability by
proposing the right offers, on-time
- Decrease costs through maximized part reuse
• 3DEXPERIENCE Platform
with Single Source For
Speed Industry Solution
Experience

11
Industry Vertical Diversification
FY 16 – Software Revenue
• Diversification industries* representing
31% of 2016 software revenue
+1 percentage point YoY
High-tech, Marine & Offshore,
Energy Process & Utilities
* Architecture, Engineering & Construction; Consumer Goods & Retail; Consumer Packaged Goods & Retail; Energy, Process & Utilities; Finance Business
Services; High-Tech; Life Sciences; Marine & Offshore; Natural Resources

12
FY16 High-Tech Performance
High-Tech software revenue up ~+16% exFX in 2016
Signing a major win in Telecommunication with Ericsson
Expanding in Semiconductors and winning Samsung Electronics
Winning important references in Consumer Electronics in Japan and China
13
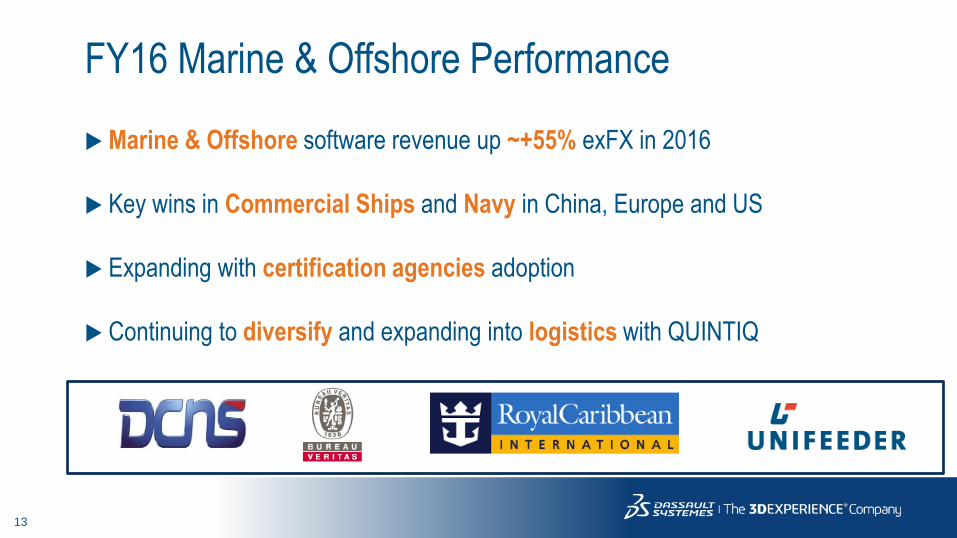
FY16 Marine & Offshore Performance
Marine & Offshore software revenue up ~+55% exFX in 2016
Key wins in Commercial Ships and Navy in China, Europe and US
Expanding with certification agencies adoption
Continuing to diversify and expanding into logistics with QUINTIQ
14
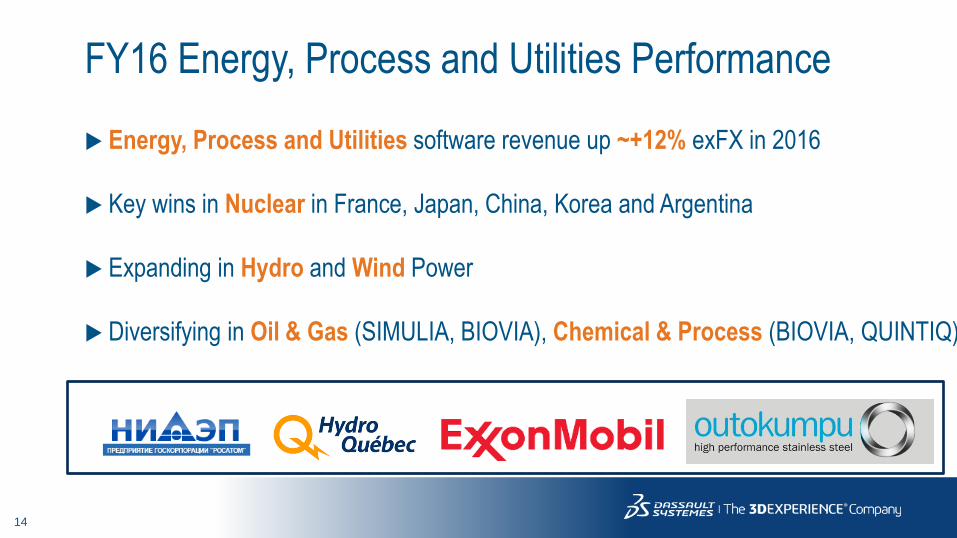
FY16 Energy, Process and Utilities Performance
Energy, Process and Utilities software revenue up ~+12% exFX in 2016
Key wins in Nuclear in France, Japan, China, Korea and Argentina
Expanding in Hydro and Wind Power
Diversifying in Oil & Gas (SIMULIA, BIOVIA), Chemical & Process (BIOVIA, QUINTIQ)

15
Cloud Portfolio
Largest Cloud Offering on the Market
16 Industry Solution Experiences
67 Industry Process Experiences
175 Roles (22 New Roles)
Coverage
8 data centers
Europe, US East, US West Japan, Hong Kong , + 3 new data centers
3 openings in 2016
Singapore, China, Korea

16
Japan leading architecture firm
Kengo Kuma & Associates Adopts
3DEXPERIENCE Platform
Kengo Kuma & Associates (KKAA)
Business Values:
Solution: Improving design speed, accuracy & collaboration
- “Our team can access a single digital resource to
better coordinate projects, gather feedback
and make any necessary design adjustments.
In the future, we plan to deepen this level of
collaboration in order to manage multiple projects
across offices worldwide while maintaining the
high caliber of our designs.” Toshiki Meijo, Chief of
Design Division, KKAA.
• 3DEXPERIENCE Platform
with cloud-based Design
for Fabrication Industry
Solution Experience

17
2014-2019: Multiple Drivers to Support Growth
Build on VALUE Increase Domain LEADERSHIP Improve EFFICIENCY
Industry Focus
3DEXPERIENCE Platform
Cloud
Brand Value Creation
Acquisitions Sales Channels Coverage in Geographies

18
Brands Value Creation | A Unique Brand Portfolio

19
SOLIDWORKS Non-IFRS | Authentic Designer Experience
Delivering good performance in 2016 Software revenue up +12% exFX
New licenses revenue +7% exFX (improvement throughout the year, +15% exFX in Q4)
Strong growth in recurring in 2016 Recurring revenue up +15% exFX, lifted up by strong SOLIDWORKS reinstatements
Gaining market share Increased proportion of competition displacements: winbacks accounting for ~40% of
2016 new licenses revenue

20
Business Values Solution
Unilever Selects BIOVIA
Unilever British-Dutch multinational consumer goods company. Products include food, beverages,
cleaning agents and personal care products. World's third-largest consumer goods
company after Procter & Gamble and Nestlé.
• Optimizing operations with standardized
global approach for laboratory processes to
capture scientific data
• Integrating and enriching data across sites
• Accelerating scientific innovation with
tools for the creation of In-Silico models for
both formulations and packaging designs
• BIOVIA
• 3DEXPERIENCE Platform
• SIMULIA

21
DELMIA Non-IFRS | The World of Value Making
DELMIA software revenue up +17% exFX in 2016
Revenue driven by Transportation & Mobility, Aerospace & Defense,
Industrial Equipment
Diversifying in Marine & Offshore, Energy, Process & Utilities, High-Tech

22
World leader in communications technology. Providing hardware, software and
services to enable transformation through mobility. 40% of global mobile traffic.
Ericsson Adds DELMIA
Ericsson
Business Values:
Solution: - Continuous process standardization
maintaining and enforcing global standards
- Lower IT TCO due to less “silo systems”
- Full real-time visibility on progress,
performance and material consumption
- Cross-domain synchronized processes and
flows
• DELMIA Apriso
Manufacturing Operations
Management solution
23
QUINTIQ Non-IFRS | Solving The World Planning Puzzle
QUINTIQ software revenue up +23% exFX in 2016
Key wins in Financial & Business Services (organizers of goods and
passengers transportation …), Marine & Offshore (cruise lines), Energy
Process & Utilities (metal industries)

24
2016 Main Acquisitions
* Next Limit Dynamics, developer of XFlow
*

25
Multi-physics Discipline Our Technology
Vision Thermal Fluids Chemical
Functional
Logical
Physical
(Macro-scale
Continuum)
Material Sciences
Physical
(Micro-scale
Non-Continuum)
Bio Geophysics
Mul
ti-sc
ale
Electromagnetics Controls Structures & Solids

26
Multiphysics-Multiscale | Next Limit Dynamics Acquisition
Enriching Computational Fluid Dynamics Simulation with Next Limit Dynamics, Developer of XFlow Technology
Developing Lattice Boltzmann simulation technology
Accurate and robust simulation of highly dynamic fluid flow
Faster than traditional methods
Privately-held company headquartered in Madrid ~20 employees
2016 FY revenue: ~€1.7m
Enhancing fluid flow simulation
Integrated in a multiphysics, multiscale 3DEXPERIENCE platform enabling successful creation of sustainable consumer experiences

27
2014-2019: Multiple Drivers to Support Growth
Build on VALUE Increase Domain LEADERSHIP Improve EFFICIENCY
Industry Focus
3DEXPERIENCE Platform
Cloud
Brand Value Creation
Acquisitions Sales Channels Coverage in Geographies

28
High-Growth Countries* Non-IFRS
Increased sales coverage
Strong software growth: ~+15% exFX in 2016
Increased proportion of total revenue: ~17%
+1 point compared to 2015
* China, India, AP South, Latam, Czech Republic, Hungary, Slovakia, Turkey, Poland, Russia, Africa, Balkans excluding
Greece and Cyprus, Israel, Middle-East, North Africa
29
Q4 & FY16 Business Review & Strategy Update
Q416 Business Review
FY16 Growth Drivers
Strategy Update

30
Dassault Systèmes provides business & people
with 3DEXPERIENCE universes to imagine
sustainable innovations capable of
harmonizing product, nature and life.
“ “
Our Purpose

31
Our Strategy
Social Industry Experiences
Ease of use
Online
Mobile
Business Solutions Software Services Content
32
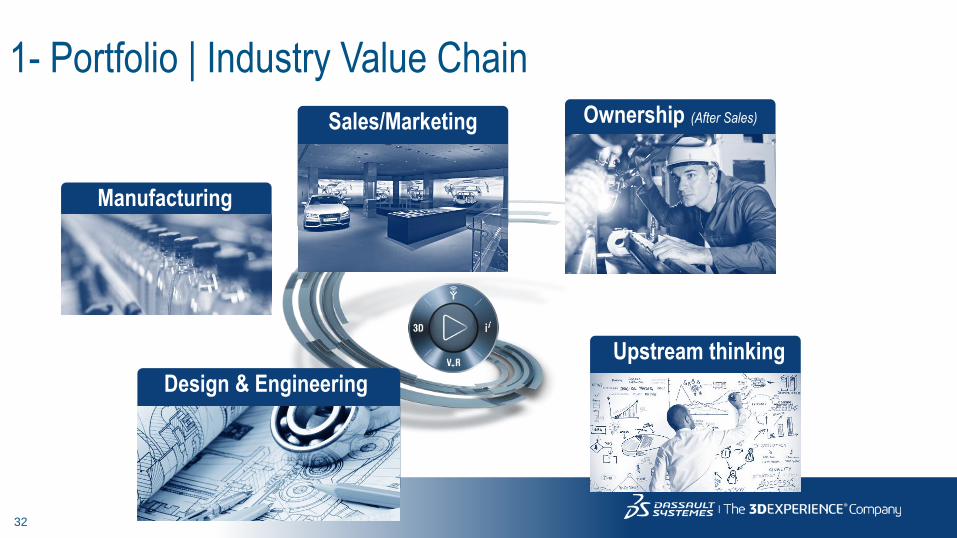
1- Portfolio | Industry Value Chain
Sales/Marketing
Manufacturing
Ownership (After Sales)
Upstream thinking
Design & Engineering

34
Roles & Apps
Industry Solution Experiences ENTERPRISE VALUES
Industry Process Experiences
USERS VALUES
TEAM VALUES
2- Portfolio | Architecture
35
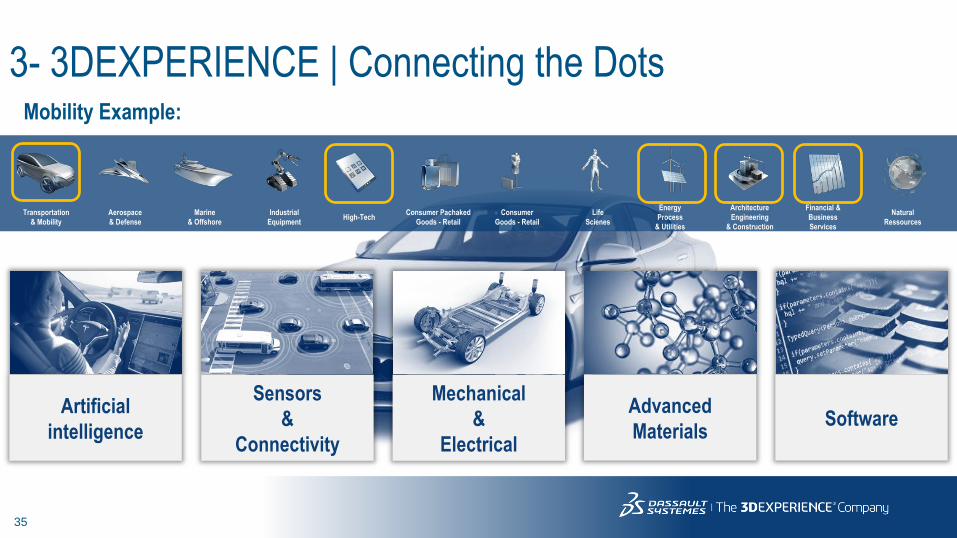
3- 3DEXPERIENCE | Connecting the Dots
Transportation
& Mobility
Mechanical
&
Electrical
Sensors
&
Connectivity
Artificial
intelligence
Advanced
Materials Software
Aerospace
& Defense
Marine
& Offshore
Industrial
Equipment High-Tech
Consumer Pachaked
Goods - Retail
Consumer
Goods - Retail
Life
Scienes
Energy
Process
& Utilities
Architecture
Engineering
& Construction
Financial &
Business
Services
Natural
Ressources
Mobility Example:
36
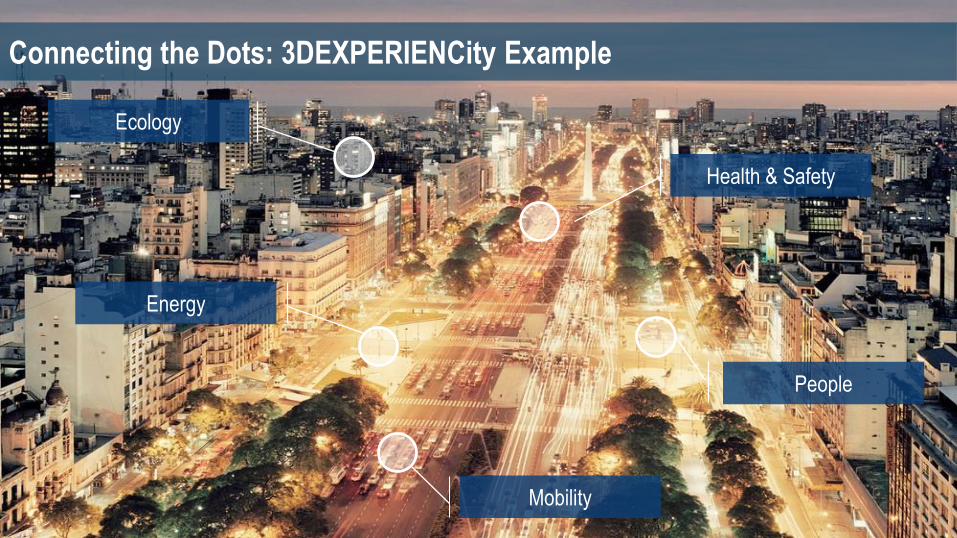
Connecting the Dots: 3DEXPERIENCity Example
People
Health & Safety
Mobility
Energy
Ecology

37
4- 3DEXPERIENCE MANUFACTURING | Industry 4.0
To be FASTER… To be FLEXIBLE… To be RELIABLE…
…with a
DIGITAL MODEL
…in the
SHOP FLOOR
…with
PREDICTIVE ANALYTICS
& OPTIMIZATION
SOLUTIONS
CHALLENGES
To FREE UP design…
…with
ADDITIVE LAYER
MANUFACTURING
39
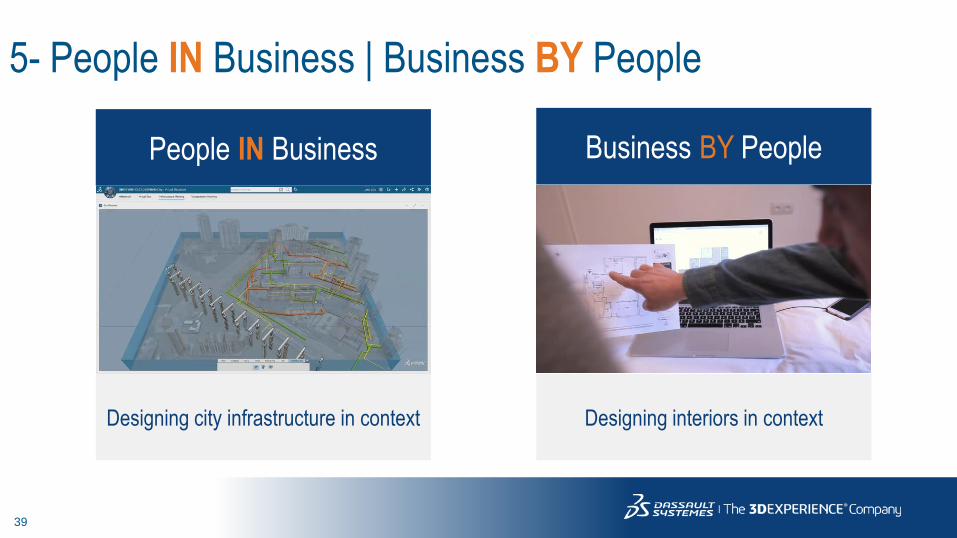
People IN Business Business BY People
Designing city infrastructure in context Designing interiors in context
5- People IN Business | Business BY People

40
1 Q4 & FY16 Financial Highlights
2
Q4 & FY16 Business Review & Strategy Update
3 Q1 & FY17 Financial Objectives
4 Financial Information Appendix
Agenda

41
Total Revenue Growth Non-IFRS
Organic revenue up +8% exFX in Q4 and +6% in FY
2 876.73 065.6
802.1 882.6
-
500
1 000
1 500
2 000
2 500
3 000
3 500
YTD 15 YTD 16 4Q15 4Q16
+10.0%
+10% ex FX
in MEUR +6.6%
+7% ex FX
Total Revenue

42
Software Revenue Growth Non-IFRS
New Licenses Revenue Periodic & Maintenance and Other Software Revenue
Good new licenses revenue in Q4
Good recurring performance driven by SOLIDWORKS
735.6773.8
239.8 262.8
-
100
200
300
400
500
600
700
800
YTD 15 YTD 16 4Q15 4Q16
in MEUR
1 802.31 930.5
468.9 511.1
-
500
1 000
1 500
2 000
2 500
YTD 15 YTD 16 4Q15 4Q16
in MEUR+5.2%
+5% ex FX +7.1%
+8% ex FX
+9.6%
+10% ex FX +9.0%
+9% ex FX
43
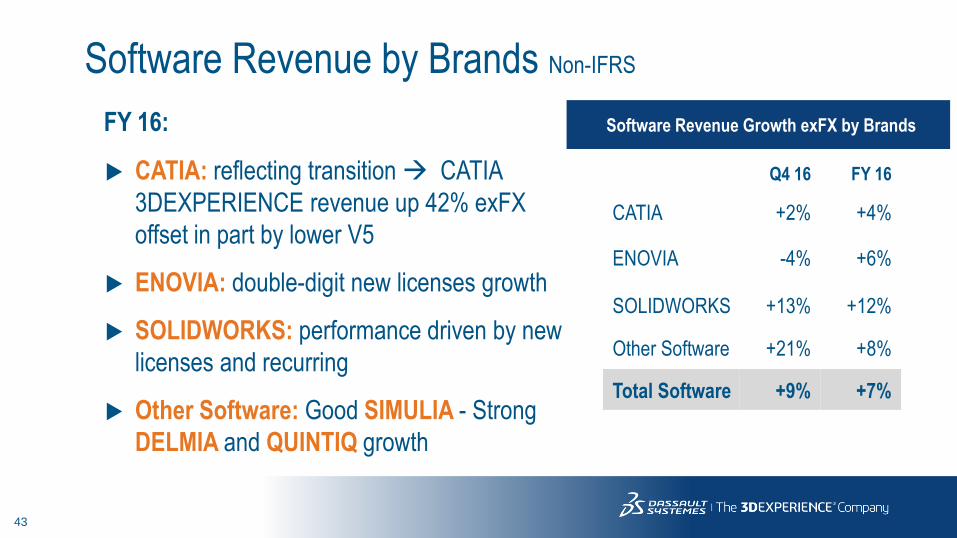
Software Revenue by Brands Non-IFRS
CATIA: reflecting transition CATIA
3DEXPERIENCE revenue up 42% exFX
offset in part by lower V5
ENOVIA: double-digit new licenses growth
SOLIDWORKS: performance driven by new
licenses and recurring
Other Software: Good SIMULIA - Strong
DELMIA and QUINTIQ growth
Software Revenue Growth exFX by Brands
Q4 16 FY 16
CATIA +2% +4%
ENOVIA -4% +6%
SOLIDWORKS +13% +12%
Other Software +21% +8%
Total Software +9% +7%
FY 16:

44
Software Revenue by Region Non-IFRS
Americas: driven by indirect channels
Europe: solid 2016 performance across most
geos with good direct sales dynamic
Asia: driven by China and India with some
fluctuations from a quarter to another
Q4 16 FY 16
Americas +6% +6%
Europe +13% +8%
Asia +7% +8%
Software Revenue +9% +7%
Software Revenue Growth exFX by Region
FY 16:

45
Service Revenue & Margin Evolution Non-IFRS
Service Revenue
338.8361.3
93.4108.7
-
50
100
150
200
250
300
350
400
YTD 15 YTD 16 4Q15 4Q16
in MEUR+6.6%
+7% ex FX
+16.4%
+15% ex FX
Service Gross
Margin 13.2% 14.7% 17.5% 27.6%

46
Operating Margin Evolution Non-IFRS

47
Diluted EPS
EPS Non-IFRS
Lower tax rate (32.3% in 2016, 34.4% in 2015) with Q1 16
tax reserve reversal (5 cents)
2.25
2.49
0.71 0.78
-
0.50
1.00
1.50
2.00
2.50
3.00
YTD 15 YTD 16 4Q15 4Q16
in EUR
+11%
+10%
in EUR

48
1,351
+452
+246 +39
-115
-258
+27
-102
-127
+37
1,493
-57
Net FinancialPosition Q4 2015
Net Income Non cash P&Litems
Change inoperating
working capital
Change in nonoperating
working capital
Capitalexpenditure
Acquisitions andother investing
net
DS stock optionexercise
Cash dividendpaid
ShareRepurchase
FX Impact Net FinancialPosition Q4 2016
Change in Net Financial Position (YTD)
Operating cash flow: +€622m
compared to +€633m in 2015
49
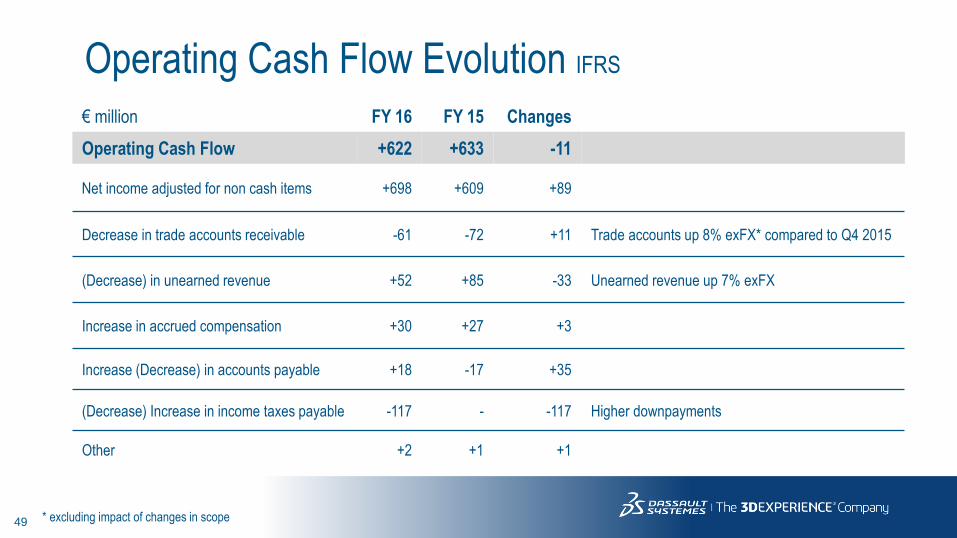
Operating Cash Flow Evolution IFRS
€ million FY 16 FY 15 Changes
Operating Cash Flow +622 +633 -11
Net income adjusted for non cash items +698 +609 +89
Decrease in trade accounts receivable -61 -72 +11 Trade accounts up 8% exFX* compared to Q4 2015
(Decrease) in unearned revenue +52 +85 -33 Unearned revenue up 7% exFX
Increase in accrued compensation +30 +27 +3
Increase (Decrease) in accounts payable +18 -17 +35
(Decrease) Increase in income taxes payable -117 - -117 Higher downpayments
Other +2 +1 +1
* excluding impact of changes in scope
50
1
Q4 & FY16 Financial Highlights
2
Q4 & FY16 Business Review & Strategy Update
3 Q1 & FY17 Financial Objectives
4 Financial Information Appendix
Agenda

51
Initiating 2017 Guidance non-IFRS Assumptions for 2017 Guidance
Using Q4 16 new licenses growth for 2017 new licenses
Recurring revenue modeled on 2016 performance net of SOLIDWORKS reinstatements
(2 points of growth impact)
Targeting organic operating margin up by ~+50 basis points exFX
Tax rate increasing to ~33.5% (2016 rate at 32.3% including a tax reserve reversal with 5
cents impact on 2016 EPS)
Exchange rate assumptions of US$1.10 per €1.00 and JPY117 per €1.00 before hedging
Considering environment with increased volatility

52
Proposed objectives Non-IFRS
Q1 2017
• EPS up +4-9% (excluding 5 cents of Q1 16
tax reserve reversal)
FY 2017
• New licenses revenue up +8-10% exFX
• Recurring revenue up ~+6% exFX
• Organic operating margin up ~50 basis
points exFX
• Tax rate of ~33.5%
• EPS up +9-11% (excluding 5 cents of Q1 16
tax reserve reversal)
Q1 2017 FY 2017
Revenue (M€) 740-750 3,275-3,300
Growth +7-8% +7-8%
Growth ex FX +6-7% +6-7%
Operating Margin 25-26% ~31.5%
EPS (€) 0.48-0.50 2.65-2.70
EPS Growth -6 to -2% +6-8%
€/$ rates 1.10 1.10
€/¥ rates 117.0 117.0

53
1
Q4 & FY16 Financial Highlights
2
Q4 & FY16 Business Review & Strategy Update
3 Q1 & FY17 Financial Objectives
4 Financial Information Appendix
Agenda
54
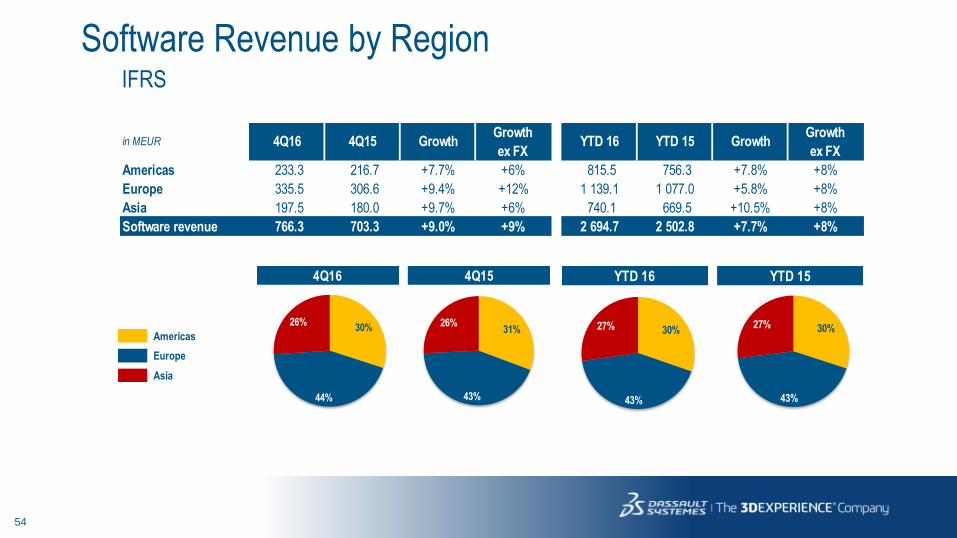
Software Revenue by Region IFRS
Americas
Europe
Asia
in MEUR 4Q16 4Q15 GrowthGrowth
ex FXYTD 16 YTD 15 Growth
Growth
ex FX
Americas 233.3 216.7 +7.7% +6% 815.5 756.3 +7.8% +8%
Europe 335.5 306.6 +9.4% +12% 1 139.1 1 077.0 +5.8% +8%
Asia 197.5 180.0 +9.7% +6% 740.1 669.5 +10.5% +8%
Software revenue 766.3 703.3 +9.0% +9% 2 694.7 2 502.8 +7.7% +8%
4Q16 4Q15
30%
44%
26%31%
43%
26%
YTD 16 YTD 15
30%
43%
27% 30%
43%
27%

55
Software by Region Non-IFRS
Americas
Europe
Asia
in MEUR 4Q16 4Q15 GrowthGrowth
ex FXYTD 16 YTD 15 Growth
Growth
ex FX
Americas 235.7 220.0 +7.1% +6% 818.8 775.4 +5.6% +6%
Europe 340.3 307.9 +10.5% +13% 1 144.5 1 087.9 +5.2% +8%
Asia 197.9 180.8 +9.5% +7% 741.0 674.6 +9.8% +8%
Software revenue 773.9 708.7 +9.2% +9% 2 704.3 2 537.9 +6.6% +7%
4Q16 4Q15
30%
44%
26%31%
43%
26%
YTD 16 YTD 15
30%
43%
27% 31%
42%
27%
56
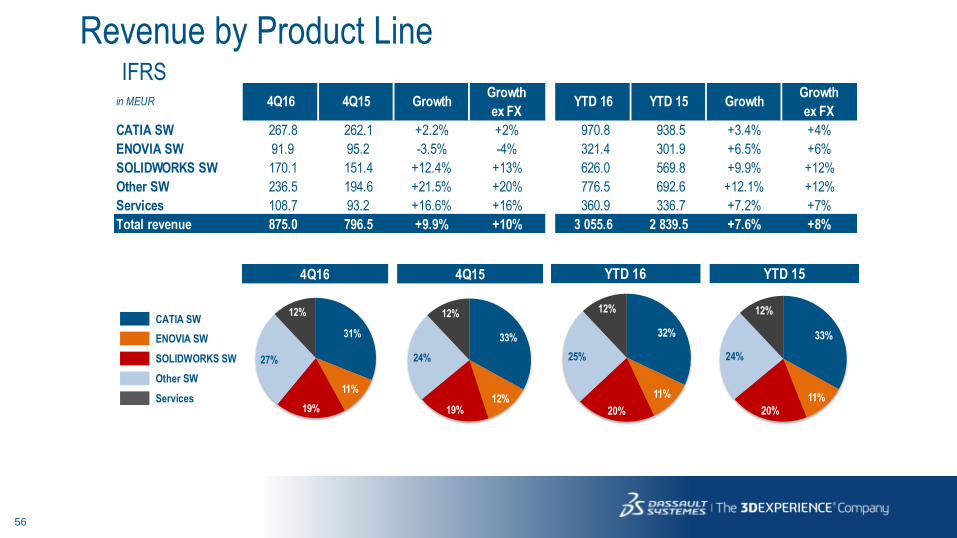
Revenue by Product Line IFRS
CATIA SW
ENOVIA SW
SOLIDWORKS SW
Other SW
Services
in MEUR 4Q16 4Q15 GrowthGrowth
ex FXYTD 16 YTD 15 Growth
Growth
ex FX
CATIA SW 267.8 262.1 +2.2% +2% 970.8 938.5 +3.4% +4%
ENOVIA SW 91.9 95.2 -3.5% -4% 321.4 301.9 +6.5% +6%
SOLIDWORKS SW 170.1 151.4 +12.4% +13% 626.0 569.8 +9.9% +12%
Other SW 236.5 194.6 +21.5% +20% 776.5 692.6 +12.1% +12%
Services 108.7 93.2 +16.6% +16% 360.9 336.7 +7.2% +7%
Total revenue 875.0 796.5 +9.9% +10% 3 055.6 2 839.5 +7.6% +8%
4Q16 4Q15
31%
11%
19%
27%
12%
33%
12%19%
24%
12%
YTD 16 YTD 15
32%
11%
20%
25%
12%
33%
11%
20%
24%
12%

57
Non-IFRS
Revenue by Product Line
CATIA SW
ENOVIA SW
SOLIDWORKS SW
Other SW
Services
in MEUR 4Q16 4Q15 GrowthGrowth
ex FXYTD 16 YTD 15 Growth
Growth
ex FX
CATIA SW 267.8 262.5 +2.0% +2% 970.8 938.9 +3.4% +4%
ENOVIA SW 91.9 95.2 -3.5% -4% 321.4 301.9 +6.5% +6%
SOLIDWORKS SW 170.1 151.4 +12.4% +13% 626.0 569.8 +9.9% +12%
Other SW 244.1 199.6 +22.3% +21% 786.1 727.3 +8.1% +8%
Services 108.7 93.4 +16.4% +15% 361.3 338.8 +6.6% +7%
Total revenue 882.6 802.1 +10.0% +10% 3 065.6 2 876.7 +6.6% +7%
4Q16 4Q15
31%
10%
19%
28%
12%
32%
12%
19%
25%
12%
YTD 16 YTD 15
32%
10%
20%
26%
12%
33%
10%
20%
25%
12%

58
Software Revenue Evolution
Recurring
Non-recurring
Non-IFRS
70% 71%
66% 66%
30%29%
34% 34%
-
500
1 000
1 500
2 000
2 500
3 000
YTD 15 YTD 16 4Q15 4Q16

59
IFRS P&L Three months ended December 31, Twelve months months ended December 31,
(In millions of €, except per share data) 2016 2015 YoY 2016 2015 YoY
Software revenue 766.3 703.3 +9.0% 2,694.7 2,502.8 +7.7%
New licenses 262.8 236.8 +11.0% 773.2 716.5 +7.9%
Other software revenue 2.9 4.2 -31.0% 11.2 20.4 -45.1%
Periodic licenses and Maintenance 500.6 462.3 +8.3% 1,910.3 1,765.9 +8.2%
Service and other revenue 108.7 93.2 +16.6% 360.9 336.7 +7.2%
Total revenue 875.0 796.5 +9.9% 3,055.6 2,839.5 +7.6%
Cost of Software revenue (41.7) (37.8) +10.3% (153.8) (143.2) +7.4%
Cost of Service and other revenue (79.4) (77.5) +2.5% (309.8) (294.7) +5.1%
Research and development (139.5) (126.0) +10.7% (540.5) (492.5) +9.7%
Marketing and sales (268.5) (235.1) +14.2% (952.6) (892.2) +6.8%
General and administrative (63.8) (59.2) +7.8% (230.5) (211.7) +8.9%
Amortization of acquired intangibles (40.6) (39.2) +3.6% (155.8) (159.6) -2.4%
Other operating income and expense, net (14.3) (5.6) N/A (40.6) (12.4) N/A
Total operating expenses (647.8) (580.4) +11.6% (2,383.6) (2,206.3) +8.0%
Operating income 227.2 216.1 +5.1% 672.0 633.2 +6.1%
Financial revenue and other, net 7.1 (2.8) N/A (10.5) (0.1) N/S
Income tax expense (90.7) (85.9) +5.6% (209.3) (227.1) -7.8%
Non-controlling interest (0.7) (0.9) -22.2% (5.0) (3.8) +31.6%
Net Income (to equity holders of the parent) 142.9 126.5 +13.0% 447.2 402.2 +11.2%
Diluted net income per share (EPS) 0.56 0.49 +14.3% 1.74 1.57 +10.8%
Average diluted shares (Million) 257.4 256.6 257.4 256.6

60
IFRS P&L (%) Three months ended December 31, Twelve months months ended December 31,
2016 2015 2016 2015
% of revenue % of revenue
Software revenue 87.6% 88.3% 88.2% 88.1%
New licenses 30.0% 29.7% 25.3% 25.2%
Other software revenue 0.3% 0.5% 0.4% 0.7%
Periodic licenses and Maintenance 57.2% 58.0% 62.5% 62.2%
Service and other revenue 12.4% 11.7% 11.8% 11.9%
Total revenue 100.0% 100.0% 100.0% 100.0%
Cost of Software revenue 4.8% 4.7% 5.0% 5.0%
Cost of Service and other revenue 9.1% 9.7% 10.1% 10.4%
Research and development 15.9% 15.8% 17.7% 17.3%
Marketing and sales 30.7% 29.5% 31.2% 31.4%
General and administrative 7.3% 7.4% 7.5% 7.5%
Amortization of acquired intangibles 4.6% 4.9% 5.1% 5.6%
Other operating income and expense, net 1.6% 0.7% 1.3% 0.4%
Total operating expenses 74.0% 72.9% 78.0% 77.7%
Operating income 26.0% 27.1% 22.0% 22.3%
Financial revenue and other, net 0.8% -0.4% -0.3% 0.0%
Income tax rate (% of IBIT) 38.7% 40.3% 31.6% 35.9%
Non-controlling interest -0.1% -0.1% -0.2% -0.1%
Net Income (to equity holders of the parent) 16.3% 15.9% 14.6% 14.2%
61
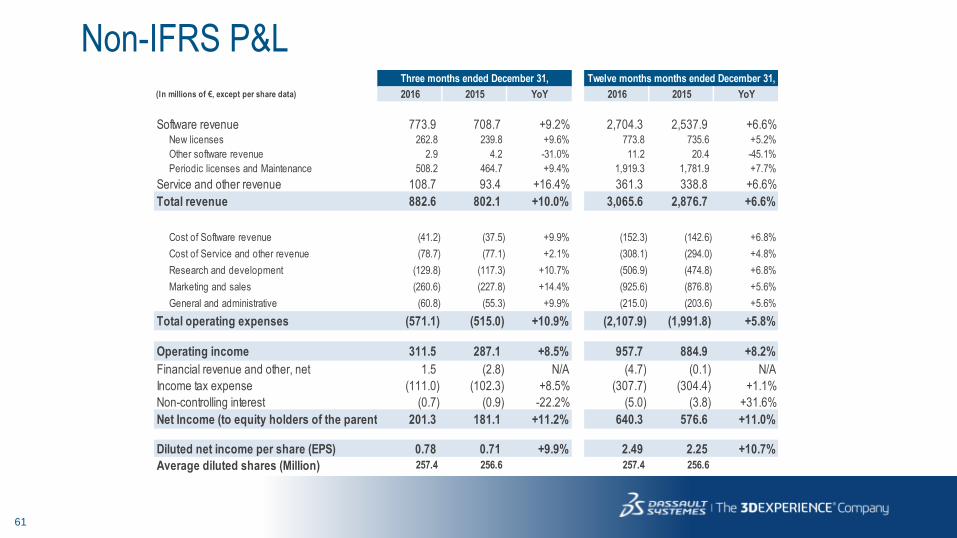
Non-IFRS P&L Three months ended December 31, Twelve months months ended December 31,
(In millions of €, except per share data) 2016 2015 YoY 2016 2015 YoY
Software revenue 773.9 708.7 +9.2% 2,704.3 2,537.9 +6.6%New licenses 262.8 239.8 +9.6% 773.8 735.6 +5.2%
Other software revenue 2.9 4.2 -31.0% 11.2 20.4 -45.1%
Periodic licenses and Maintenance 508.2 464.7 +9.4% 1,919.3 1,781.9 +7.7%
Service and other revenue 108.7 93.4 +16.4% 361.3 338.8 +6.6%
Total revenue 882.6 802.1 +10.0% 3,065.6 2,876.7 +6.6%
Cost of Software revenue (41.2) (37.5) +9.9% (152.3) (142.6) +6.8%
Cost of Service and other revenue (78.7) (77.1) +2.1% (308.1) (294.0) +4.8%
Research and development (129.8) (117.3) +10.7% (506.9) (474.8) +6.8%
Marketing and sales (260.6) (227.8) +14.4% (925.6) (876.8) +5.6%
General and administrative (60.8) (55.3) +9.9% (215.0) (203.6) +5.6%
Total operating expenses (571.1) (515.0) +10.9% (2,107.9) (1,991.8) +5.8%
Operating income 311.5 287.1 +8.5% 957.7 884.9 +8.2%
Financial revenue and other, net 1.5 (2.8) N/A (4.7) (0.1) N/A
Income tax expense (111.0) (102.3) +8.5% (307.7) (304.4) +1.1%
Non-controlling interest (0.7) (0.9) -22.2% (5.0) (3.8) +31.6%
Net Income (to equity holders of the parent) 201.3 181.1 +11.2% 640.3 576.6 +11.0%
Diluted net income per share (EPS) 0.78 0.71 +9.9% 2.49 2.25 +10.7%
Average diluted shares (Million) 257.4 256.6 257.4 256.6

62
Non-IFRS P&L (%) Three months ended December 31, Twelve months months ended December 31,
2016 2015 2016 2015
Software revenue 87.7% 88.4% 88.2% 88.2%New licenses 29.8% 29.9% 25.2% 25.6%
Other software revenue 0.3% 0.5% 0.4% 0.7%
Periodic licenses and Maintenance 57.6% 57.9% 62.6% 61.9%
Service and other revenue 12.3% 11.6% 11.8% 11.8%
Total revenue 100.0% 100.0% 100.0% 100.0%
Cost of Software revenue 4.7% 4.7% 5.0% 5.0%
Cost of Service and other revenue 8.9% 9.6% 10.1% 10.2%
Research and development 14.7% 14.6% 16.5% 16.5%
Marketing and sales 29.5% 28.4% 30.2% 30.5%
General and administrative 6.9% 6.9% 7.0% 7.1%
Total operating expenses 64.7% 64.2% 68.8% 69.2%
Operating income 35.3% 35.8% 31.2% 30.8%
Financial revenue and other, net 0.2% -0.3% -0.2% 0.0%
Income tax rate (% of IBIT) 35.5% 36.0% 32.3% 34.4%
Non-controlling interest -0.1% -0.1% -0.2% -0.1%
Net Income (to equity holders of the parent) 22.8% 22.6% 20.9% 20.0%

63
Revenue and Gross Margin
IFRS – Non-IFRS Reconciliation QTD
* No amortization of acquired intangibles is included in Software Gross margin calculation
(€ million, except % and per share data) 2016 IFRS Adjustment2016
Non-IFRS2015 IFRS Adjustment
2015
Non-IFRSIFRS Non-IFRS
Total Revenue 875.0 7.6 882.6 796.5 5.6 802.1 9.9% 10.0%
Total Revenue breakdown by activity
Software revenue 766.3 7.6 773.9 703.3 5.4 708.7 9.0% 9.2%
New Licenses revenue 262.8 262.8 236.8 3.0 239.8 11.0% 9.6%
Other software revenue 2.9 2.9 4.2 4.2 -31.0% -31.0%
Periodic and Maintenance revenue 500.6 7.6 508.2 462.3 2.4 464.7 8.3% 9.4%
Recurring portion of Software revenue 65% 66% 66% 66%
Service and other revenue 108.7 108.7 93.2 0.2 93.4 16.6% 16.4%
Total Revenue breakdown by product line
CATIA SW revenue 267.8 267.8 262.1 0.4 262.5 2.2% 2.0%
ENOVIA SW revenue 91.9 91.9 95.2 95.2 -3.5% -3.5%
SOLIDWORKS SW revenue 170.1 170.1 151.4 151.4 12.4% 12.4%
Other SW revenue 236.5 7.6 244.1 194.6 5.0 199.6 21.5% 22.3%
Service and other revenue 108.7 108.7 93.2 0.2 93.4 16.6% 16.4%
Total Revenue breakdown by geography
Americas revenue 268.8 2.4 271.2 253.4 3.4 256.8 6.1% 5.6%
Europe revenue 387.3 4.7 392.0 347.1 1.4 348.5 11.6% 12.5%
Asia revenue 218.9 0.5 219.4 196.0 0.8 196.8 11.7% 11.5%
Gross Margin
Cost of Software revenue ( 41.7) 0.5 ( 41.2) ( 37.8) 0.3 ( 37.5) 10.3% 9.9%
Software Gross margin* 94.6% 94.7% 94.6% 94.7%
Cost of Service and other revenue ( 79.4) 0.7 ( 78.7) ( 77.5) 0.4 ( 77.1) 2.5% 2.1%
Service Gross margin 27.0% 27.6% 16.8% 17.5%
Three months ended December 31, Increase (Decrease)

64
Expenses & Earnings
IFRS – Non-IFRS Reconciliation QTD
(€ million, except % and per share data) 2016 IFRS Adjustment2016
Non-IFRS2015 IFRS Adjustment
2015
Non-IFRSIFRS Non-IFRS
Total Operating Expenses ( 647.8) 76.7 ( 571.1) ( 580.4) 65.4 ( 515.0) 11.6% 10.9%
Share-based compensation expense ( 21.8) 21.8 - ( 20.6) 20.6 -
Amortization of acquired intangibles ( 40.6) 40.6 - ( 39.2) 39.2 -
Other operating income and expense, net ( 14.3) 14.3 - ( 5.6) 5.6 -
Operating Income 227.2 84.3 311.5 216.1 71.0 287.1 5.1% 8.5%
Operating Margin 26.0% 35.3% 27.1% 35.8%
Financial revenue & other, net 7.1 ( 5.6) 1.5 ( 2.8) ( 2.8) - -
Income tax expense ( 90.7) ( 20.3) ( 111.0) ( 85.9) ( 16.4) ( 102.3) 5.6% 8.5%
Non-controlling interest ( 0.7) ( 0.7) ( 0.9) ( 0.9) -22.2% -22.2%
Net Income attributable to shareholders 142.9 58.4 201.3 126.5 54.6 181.1 13.0% 11.2%
Diluted net income per share, in EUR 0.56 0.22 0.78 0.49 0.22 0.71 14.3% 9.9%
Three months ended December 31, Increase (Decrease)
(€ million)
2016 IFRS Adjust.2016
Non-IFRS2015 IFRS Adjust.
2015
Non-IFRS
Cost of revenue ( 121.1) 1.2 ( 119.9) ( 115.3) 0.7 ( 114.6)
Research and development ( 139.5) 9.7 ( 129.8) ( 126.0) 8.7 ( 117.3)
Marketing and sales ( 268.5) 7.9 ( 260.6) ( 235.1) 7.3 ( 227.8)
General and administrative ( 63.8) 3.0 ( 60.8) ( 59.2) 3.9 ( 55.3)
Total Share-based compensation expense 21.8 20.6
Three months ended December 31,

65
Revenue and Gross Margin
IFRS – Non-IFRS Reconciliation YTD
* No amortization of acquired intangibles is included in Software Gross margin calculation
(€ million, except % and per share data) 2016 IFRS Adjustment2016
Non-IFRS2015 IFRS Adjustment
2015
Non-IFRSIFRS Non-IFRS
Total Revenue 3 055.6 10.0 3 065.6 2 839.5 37.2 2 876.7 7.6% 6.6%
Total Revenue breakdown by activity
Software revenue 2 694.7 9.6 2 704.3 2 502.8 35.1 2 537.9 7.7% 6.6%
New Licenses revenue 773.2 0.6 773.8 716.5 19.1 735.6 7.9% 5.2%
Other software revenue 11.2 11.2 20.4 20.4 -45.1% -45.1%
Periodic and Maintenance revenue 1 910.3 9.0 1 919.3 1 765.9 16.0 1 781.9 8.2% 7.7%
Recurring portion of Software revenue 71% 71% 71% 70%
Service and other revenue 360.9 0.4 361.3 336.7 2.1 338.8 7.2% 6.6%
Total Revenue breakdown by product line
CATIA SW revenue 970.8 970.8 938.5 0.4 938.9 3.4% 3.4%
ENOVIA SW revenue 321.4 321.4 301.9 301.9 6.5% 6.5%
SOLIDWORKS SW revenue 626.0 626.0 569.8 569.8 9.9% 9.9%
Other SW revenue 776.5 9.6 786.1 692.6 34.7 727.3 12.1% 8.1%
Service and other revenue 360.9 0.4 361.3 336.7 2.1 338.8 7.2% 6.6%
Total Revenue breakdown by geography
Americas revenue 942.4 3.5 945.9 889.5 20.0 909.5 5.9% 4.0%
Europe revenue 1 301.9 5.7 1 307.6 1 226.5 11.6 1 238.1 6.1% 5.6%
Asia revenue 811.3 0.8 812.1 723.5 5.6 729.1 12.1% 11.4%
Gross Margin
Cost of Software revenue ( 153.8) 1.5 ( 152.3) ( 143.2) 0.6 ( 142.6) 7.4% 6.8%
Software Gross margin* 94.3% 94.4% 94.3% 94.4%
Cost of Service and other revenue ( 309.8) 1.7 ( 308.1) ( 294.7) 0.7 ( 294.0) 5.1% 4.8%
Service Gross margin 14.2% 14.7% 12.5% 13.2%
Twelve months months ended December 31, Increase (Decrease)

66
Expenses & Earnings
IFRS – Non-IFRS Reconciliation YTD
(€ million, except % and per share data) 2016 IFRS Adjustment2016
Non-IFRS2015 IFRS Adjustment
2015
Non-IFRSIFRS Non-IFRS
Total Operating Expenses (2 383.6) 275.7 (2 107.9) (2 206.3) 214.5 (1 991.8) 8.0% 5.8%
Share-based compensation expense ( 79.3) 79.3 - ( 42.5) 42.5 -
Amortization of acquired intangibles ( 155.8) 155.8 - ( 159.6) 159.6 -
Other operating income and expense, net ( 40.6) 40.6 - ( 12.4) 12.4 -
Operating Income 672.0 285.7 957.7 633.2 251.7 884.9 6.1% 8.2%
Operating Margin 22.0% 31.2% 22.3% 30.8%
Financial revenue & other, net ( 10.5) 5.8 ( 4.7) ( 0.1) ( 0.1) - -
Income tax expense ( 209.3) ( 98.4) ( 307.7) ( 227.1) ( 77.3) ( 304.4) -7.8% 1.1%
Non-controlling interest ( 5.0) ( 5.0) ( 3.8) ( 3.8) 31.6% 31.6%
Net Income attributable to shareholders 447.2 193.1 640.3 402.2 174.4 576.6 11.2% 11.0%
Diluted net income per share, in EUR 1.74 0.75 2.49 1.57 0.68 2.25 10.8% 10.7%
Twelve months months ended December 31, Increase (Decrease)
(€ million)
2016 IFRS Adjust.2016
Non-IFRS2015 IFRS Adjust.
2015
Non-IFRS
Cost of revenue ( 463.6) 3.2 ( 460.4) ( 437.9) 1.3 ( 436.6)
Research and development ( 540.5) 33.6 ( 506.9) ( 492.5) 17.7 ( 474.8)
Marketing and sales ( 952.6) 27.0 ( 925.6) ( 892.2) 15.4 ( 876.8)
General and administrative ( 230.5) 15.5 ( 215.0) ( 211.7) 8.1 ( 203.6)
Total Share-based compensation expense 79.3 42.5
Twelve months months ended December 31,

67
Non-IFRS
Financial Revenue and Other
MEUR 4Q16 4Q15 var YTD 16 YTD 15 var
Interest Income 4.6 3.1 1.5 17.4 18.6 (1.2)
Interest Expense (3.1) (2.8) (0.3) (12.8) (7.4) (5.4)
Financial net Income 1.5 0.3 1.2 4.6 11.2 (6.6)
Exchange Gain / (Loss) 0.2 (3.9) 4.1 (9.3) (12.0) 2.7
Other Income / (Loss) (0.2) 0.8 (1.0) 0.0 0.7 (0.7)
Total 1.5 (2.8) 4.3 (4.7) (0.1) (4.6)

68
Exchange Rate evolution From assumptions to actual data
Revenue 2016 2015 % change
EUR/USD 1.08 1.10 -2%
EUR/JPY 117.9 133.0 -11%
EUR/USD 1.11 1.11 -
EUR/JPY 120.2 134.3 -10%
4Q15 4Q16 4Q15
1.10 1.08 133.0 4Q16
in average in average in average 117.9
in average
Breakdown of P&L by currency for YTD 16
QTD
Average Exchange rates
YTD
36.5%USD
Average ¥/EUR rate
1.10 -> 1.08 133.0 -> 117.9
Average $/EUR rate
Operating Expenses
35.6%
5.2%
$/EUR – 4Q16/4Q15 Variance ¥/EUR – 4Q16/4Q15 Variance
JPY 13.1%

69
Non-IFRS
Comparing 4Q16 with mid-range Objectives
Revenue Operating
Expenses
Operating
Profit
Operating
Margin
4Q16 Guidances mid-range 840.0 (554.4) 285.6 34.0%
Growth YoY +4.7% +7.7% -0.5% -1.8pt
USD impact 20.6 (12.0) 8.6 +0.2pt
JPY impact including hedging 0.9 (0.6) 0.3 -0.0pt
Other currencies and other
hedging impact 5.7 (3.0) 2.7 +0.1pt
Total FX 27.2 (15.6) 11.6 +0.3pt
Activity / Cost Control / Other 15.4 (1.1) 14.3 +1.0pt
Delta: Reported vs guidances 42.6 (16.7) 25.9 +1.3pt
4Q16 Reported 882.6 (571.1) 311.5 35.3%
Growth YoY +10.0% +10.9% +8.5% -0.5pt
4Q15 Reported 802.1 (515.0) 287.1 35.8%
70
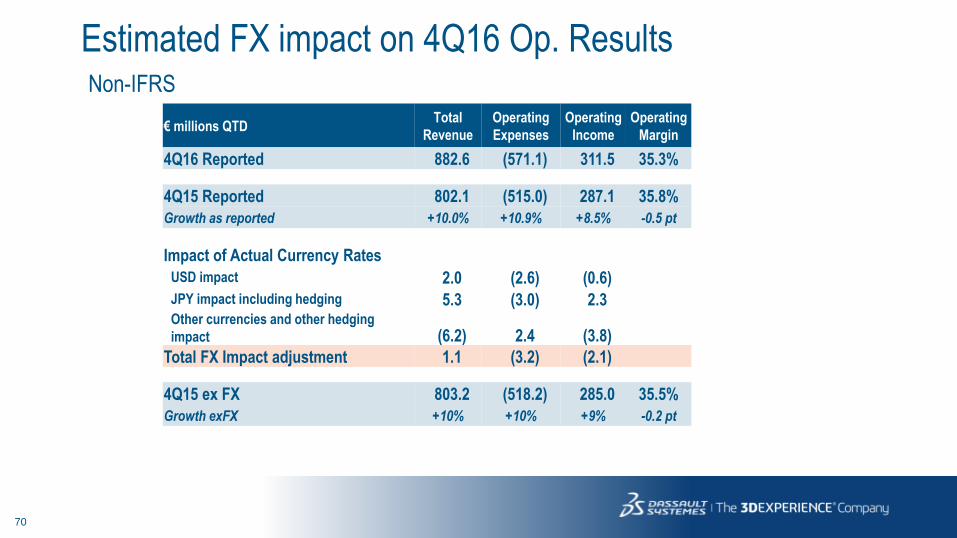
Non-IFRS
Estimated FX impact on 4Q16 Op. Results
€ millions QTD Total
Revenue
Operating
Expenses
Operating
Income
Operating
Margin
4Q16 Reported 882.6 (571.1) 311.5 35.3%
4Q15 Reported 802.1 (515.0) 287.1 35.8%
Growth as reported +10.0% +10.9% +8.5% -0.5 pt
Impact of Actual Currency Rates
USD impact 2.0 (2.6) (0.6)
JPY impact including hedging 5.3 (3.0) 2.3 Other currencies and other hedging
impact (6.2) 2.4 (3.8)
Total FX Impact adjustment 1.1 (3.2) (2.1)
4Q15 ex FX 803.2 (518.2) 285.0 35.5%
Growth exFX +10% +10% +9% -0.2 pt
71
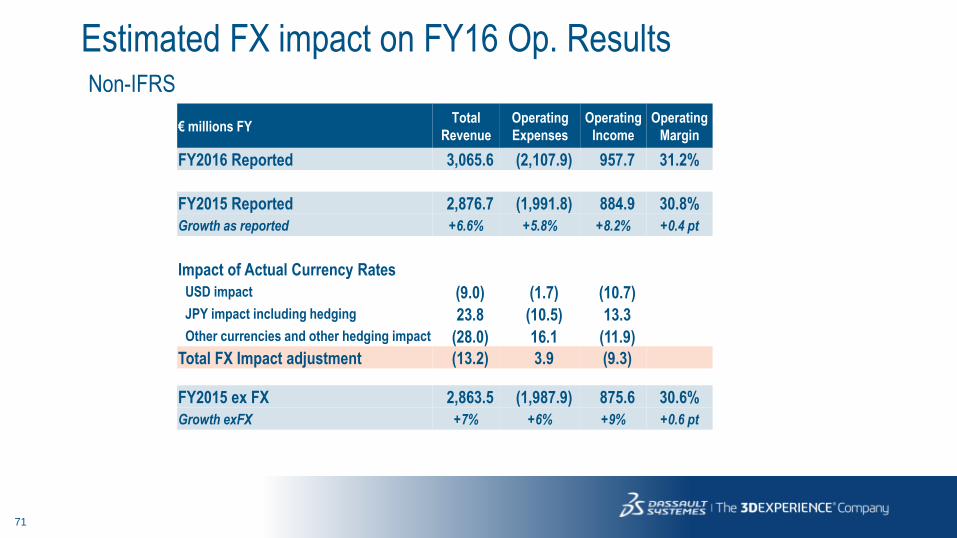
Non-IFRS
Estimated FX impact on FY16 Op. Results
€ millions FY Total
Revenue
Operating
Expenses
Operating
Income
Operating
Margin
FY2016 Reported 3,065.6 (2,107.9) 957.7 31.2%
FY2015 Reported 2,876.7 (1,991.8) 884.9 30.8%
Growth as reported +6.6% +5.8% +8.2% +0.4 pt
Impact of Actual Currency Rates
USD impact (9.0) (1.7) (10.7)
JPY impact including hedging 23.8 (10.5) 13.3
Other currencies and other hedging impact (28.0) 16.1 (11.9)
Total FX Impact adjustment (13.2) 3.9 (9.3)
FY2015 ex FX 2,863.5 (1,987.9) 875.6 30.6%
Growth exFX +7% +6% +9% +0.6 pt

72
Consolidated Statement of Cash Flows
IFRS (in millions of €)
4Q16 4Q15 Variation YTD16 YTD15 Variation
Net income attributable to equity holders of the parent 142.9 126.5 16.4 447.2 402.2 45.0
Non-controlling interest 0.7 0.9 (0.2) 5.0 3.8 1.2
Net income 143.6 127.4 16.2 452.2 406.0 46.2
Depreciation of property & equipment 10.5 10.8 (0.3) 42.0 42.4 (0.4)
Amortization of intangible assets 42.9 42.3 0.6 164.5 169.0 (4.5)
Other non-cash P&L items 25.8 14.9 10.9 39.2 (7.9) 47.1
Changes in working capital (126.8) (92.4) (34.4) (76.2) 23.8 (100.0)
Net Cash Provided by (Used in) Operating Activities (I) 96.0 103.0 (7.0) 621.7 633.3 (11.6)
Additions to property, equipment and intangibles (24.7) (12.8) (11.9) (56.7) (43.6) (13.1)
Payment for acquisition of businesses, net of cash acquired (16.8) (2.1) (14.7) (262.7) (20.2) (242.5)
Sale (Purchase) of short-term investments, net (0.9) (11.9) 11.0 19.6 5.8 13.8
Investments, loans and others 0.3 0.8 (0.5) 0.9 (2.5) 3.4
Net Cash Provided by (Used in) Investing Activities (II) (42.1) (26.0) (16.1) (298.9) (60.5) (238.4)
Proceeds of short term and long term debt - 650.0 (650.0) - 650.0 (650.0)
Repayment of short term and long term debt - - - - (10.8) 10.8
(Purchase) Sale of treasury stock (74.8) (0.3) (74.5) (127.3) (28.3) (99.0)
Proceeds from exercise of stock-options 10.9 10.9 0.0 26.8 35.9 (9.1)
Cash dividend paid - (0.0) 0.0 (101.9) (98.4) (3.5)
Net Cash Provided by (Used in) Financing Activities (III) (63.9) 660.6 (724.5) (202.4) 548.4 (750.8)
Effect of exchange rate changes on cash and cash equivalents (IV) 39.1 22.9 16.2 35.8 55.1 (19.3)
Increase (Decrease) in Cash (V) = (I)+(II)+(III)+(IV) 29.1 760.5 (731.4) 156.2 1,176.3 (1,020.1)
Cash and cash equivalents at Beginning of Period 2,407.6 1,520.0 2,280.5 1,104.2
Cash and cash equivalents at End of Period 2,436.7 2,280.5 2,436.7 2,280.5
Cash and cash equivalents variation 29.1 760.5 156.2 1,176.3
73
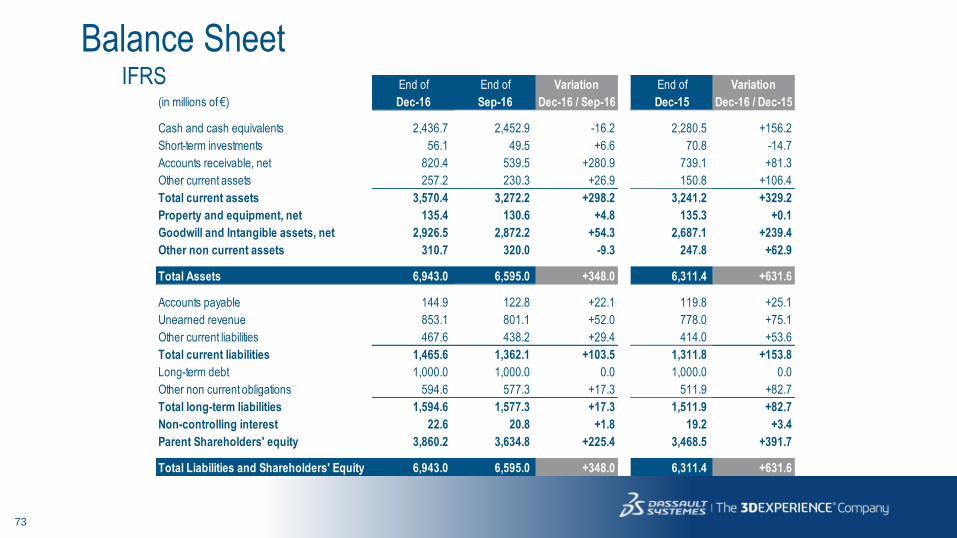
Balance Sheet IFRS End of End of Variation End of Variation
(in millions of €) Dec-16 Sep-16 Dec-16 / Sep-16 Dec-15 Dec-16 / Dec-15
Cash and cash equivalents 2,436.7 2,452.9 -16.2 2,280.5 +156.2
Short-term investments 56.1 49.5 +6.6 70.8 -14.7
Accounts receivable, net 820.4 539.5 +280.9 739.1 +81.3
Other current assets 257.2 230.3 +26.9 150.8 +106.4
Total current assets 3,570.4 3,272.2 +298.2 3,241.2 +329.2
Property and equipment, net 135.4 130.6 +4.8 135.3 +0.1
Goodwill and Intangible assets, net 2,926.5 2,872.2 +54.3 2,687.1 +239.4
Other non current assets 310.7 320.0 -9.3 247.8 +62.9
Total Assets 6,943.0 6,595.0 +348.0 6,311.4 +631.6
Accounts payable 144.9 122.8 +22.1 119.8 +25.1
Unearned revenue 853.1 801.1 +52.0 778.0 +75.1
Other current liabilities 467.6 438.2 +29.4 414.0 +53.6
Total current liabilities 1,465.6 1,362.1 +103.5 1,311.8 +153.8
Long-term debt 1,000.0 1,000.0 0.0 1,000.0 0.0
Other non current obligations 594.6 577.3 +17.3 511.9 +82.7
Total long-term liabilities 1,594.6 1,577.3 +17.3 1,511.9 +82.7
Non-controlling interest 22.6 20.8 +1.8 19.2 +3.4
Parent Shareholders' equity 3,860.2 3,634.8 +225.4 3,468.5 +391.7
Total Liabilities and Shareholders' Equity 6,943.0 6,595.0 +348.0 6,311.4 +631.6

74
Trade Accounts Receivable / DSO IFRS
91
76 73
87 90
77
64 73
79
69
58
75 83
74 66
84 86
68 66
84 80 74
66
84
0 days
10 days
20 days
30 days
40 days
50 days
60 days
70 days
80 days
90 days
100 days
1Q112Q113Q114Q111Q122Q123Q124Q121Q132Q133Q134Q131Q142Q143Q144Q141Q152Q153Q154Q151Q162Q163Q164Q16

75
Headcount by destination
49% 42%
9%
M&S + COR Ser R&D + COR SW
G&A
Closing H/C - December 2016
At Closing - TOTAL
4Q16 4Q15 % growth 3Q16 % growth
M&S + COR Ser 7,518 6,906 +9% 7,375 +2%
R&D + COR SW 6,375 5,853 +9% 6,235 +2%
G&A 1,322 1,212 +9% 1,311 +1%
Total 15,215 13,971 +9% 14,921 +2%
76
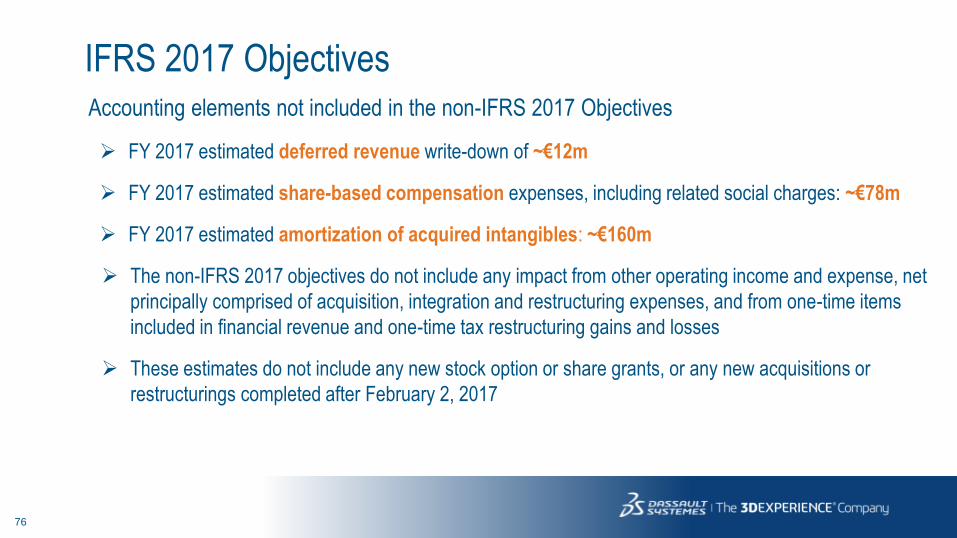
Accounting elements not included in the non-IFRS 2017 Objectives
IFRS 2017 Objectives
FY 2017 estimated deferred revenue write-down of ~€12m
FY 2017 estimated share-based compensation expenses, including related social charges: ~€78m
FY 2017 estimated amortization of acquired intangibles: ~€160m
The non-IFRS 2017 objectives do not include any impact from other operating income and expense, net
principally comprised of acquisition, integration and restructuring expenses, and from one-time items
included in financial revenue and one-time tax restructuring gains and losses
These estimates do not include any new stock option or share grants, or any new acquisitions or
restructurings completed after February 2, 2017
77