analysts briefing - refining nz · · 2016-08-22analysts briefing 23 august ... material greater...
TRANSCRIPT

1
Analysts
Briefing
23 August 2016

2
This presentation contains forward looking statements concerning the financial condition, results and operations of The New Zealand Refining Company Limited (hereafter referred to as “Refining NZ”).
Forward looking statements are subject to the risks and uncertainties associated with the refining environment, including price and foreign currency fluctuations, production results, demand for Refining NZ’s services and other conditions.
Forward looking statements are based on management’s current expectations and assumptions and involve known and unknown risks and uncertainties that could cause actual results, performance or events to differ materially from those expressed or implied in these statements.
Forward looking statements include among other things, statements concerning the potential exposure of Refining NZ to market risk and statements expressing management’s expectations, beliefs, estimates, forecasts, projections and assumptions.
Forward looking statements are identified by the use of terms and phrases such as “anticipate”, “believe”, “could”, “estimate”, “expect”, “goals”, “intend”, “may”, “objectives”, “outlook”, “plan”, “probably”, “project”, “risks”, “seek”, “should”, “target”, “will” and similar terms and phrases.
Readers should not place undue reliance on forward looking statements.
In light of these risks, results could differ materially from those stated, implied or inferred from the forward looking statements contained in this announcement.
Each forward looking statement speaks only as of the date of this announcement, 23 August 2016.
Disclaimer

3
Commentary March-June period (incl shutdown) without any TRCs, after two LTIs in the first two months
One high potential Tier 1 process safety incident
Successful planned shutdown and strong operational performance post shutdown
Tight control on costs, and capital spend reductions for 2016 (NZ$4 mln), 2017 and 2018
TMH performing well with scope for further optimisation
Good progress with natural gas, dredging and pipeline capacity projects
Solid first half performance…
Results 1H 16 1H 15Gross Refinery Margin (US$/bbl) 5.25 9.09
Shutdown impact -1.12
TMH impact +0.85
Throughput (mln bbl) 21.1 20.9
Net profit after tax (NZ$mln) 11.6 65.4
Interim dividend (cps) 3 5
Exchange rate (US$) 0.67 0.75
Dubai crude price (US$/bbl) 37 57

4
Margin at top of historical average……but year-on-year uplift impacted by shutdown and reduced freight advantage
2015 H1 2016 H1 Delta
Refining NZ Margin – Actual 9.09 5.25 (3.84)
Uplift vs Singapore Complex 4.27 1.82 (2.45)
- Freight advantage (1.19)
- Plant availability (0.84)
- Crude cost and yield (0.28)
- Product quality (0.14)
Singapore Complex Margin 4.82 3.43 (1.39)
- Crude price 0.70
- Gasoline differential (0.30)
- Diesel differential (1.70)

5
Source: Facts Global Energy (May 2016, June 2016)
“East of Suez capacity overhang to drop to record low levels”
“Looking ahead, we are optimistic about the long-term demand expansion in Asia”
“We expect product markets will come back to balance by 2017 with demand…”Goldman Sachs: July-August 2016
Near term… Long term…
-500
0
500
1,000
1,500
2,000
Incremental CDU Capacity Incremental Products Demand
Asia CDU Capacity vs. Demand Growth
kb/d
“Diesel is in structural surplus as industrial demand growth has peaked…”
“…with gasoline demand strong so far this year, the counter-seasonal rise in inventories was likely due to an excess of refining capacity and strong refining margins this US summer”
“We expect product markets will come back to balance by 2017 with demand…”
Source: Goldman Sachs (July 2016, August 2016)
”Asian gasoline balances maintain a surplus through the summer months, as high levels of refinery runs earlier in the year keep stock levels high”
Source: Facts Global Energy (July 2016)

6
TMH delivering benefitsUplift of ~US$0.85/bbl for 1H 2016
2 million barrels extra gasoline production for full year
Better yields
Re-optimising energy balances- operational changes made- further optimisation progressing

7
NPAT delivery in line with profit matrix…

8
Safe operations
Post TMH optimisation
Natural gas
Dredging
Pipeline capacity increase
Advanced process control
Short payback projects
Key focus areas 2016
Continuing with our strategy……and capital spend reflective of near-term margin environment
9
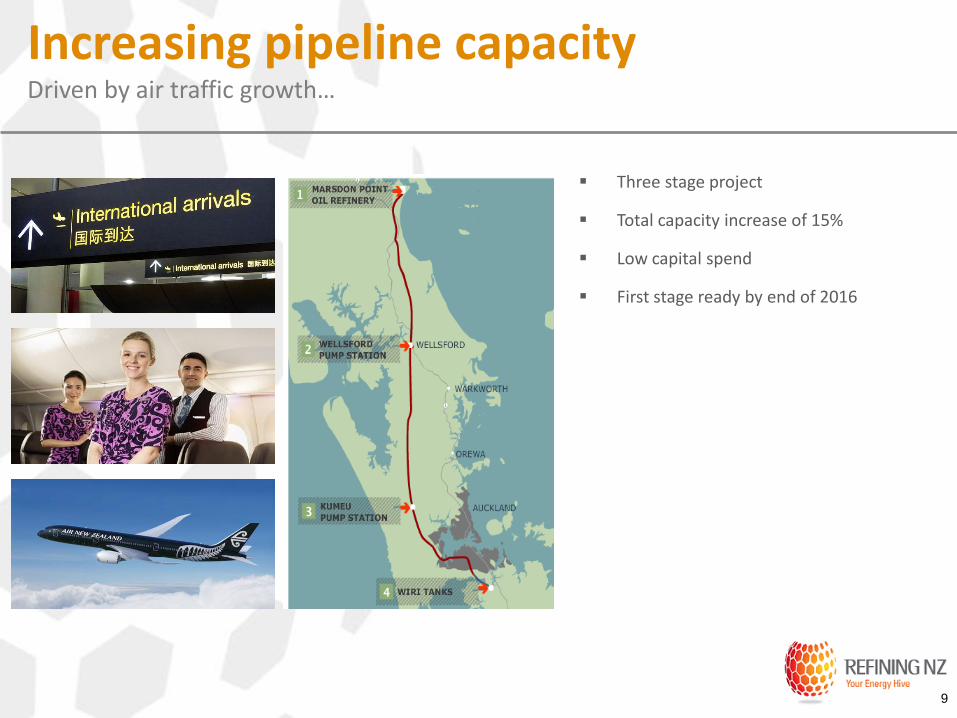
Three stage project
Total capacity increase of 15%
Low capital spend
First stage ready by end of 2016
Increasing pipeline capacityDriven by air traffic growth…

10
2016 profit and borrowings matrix
Capex (NZ$ mln) 2016 2017 2018
Retain Was 75-80 75-85 120-130
Now 74 65-75 110-120
Grow Was 5 10-50 10-50
Now 4 10 10

11
CDU Crude distillation unit mln Million
EII Energy intensity index NPAT Net profit after tax
GRM Gross refining margin TRC Total recordable case
LOPC Loss of primary containment TRCF Total recordable case frequency (cases per million hours)
LTI Lost time injury YE Year ended
LTIF Lost time injury frequency (cases per million hours) YTD Year to date
Tier 1 Process Safety Event (API 754)
A tier 1 Process Safety Event (PSE) is an unplanned or uncontrolled release of any material, including non-toxic and non-flammable, from a process which results in one or more of the following: A LTI and/or fatality; A fire or explosion resulting in greater than or equal to $25,000 of direct cost to the company; A release of material greater than the threshold quantities given in Table 1 of API 754 in any one-hour period; A officially declared community evacuation or community shelter-in-place.
Tier 2 Process Safety Event (API 754)
A tier 2 Process Safety Event (PSE) is an unplanned or uncontrolled release of any material, including non-toxic and non-flammable, from a process which results in one or more of the following: A recordable injury; A fire or explosion resulting in greater than or equal to $2,500 of direct cost to the company; A release of material greater than the threshold quantities given in Table 2 of API 754 in any one-hour period.
Glossary

12
Analysts
Briefing
23 August 2016