analyst presentation script - morrisons · slide 2 - agenda this is our agenda ... goodwill arising...
TRANSCRIPT
Analyst Presentation Script
Preliminary Results for the 12 months ended
29 January 2006
SLIDE 1 - Introduction
Good morning ladies and gentlemen. Welcome to our
preliminary results announcement for the year to January 29th
2006.
SLIDE 2 - Agenda
This is our agenda for today. This year, in addition to our
normal financial and operational review, we will be sharing with
you our plans to improve our financial performance in the
medium term.
Analyst Presentation Script
SLIDE 3 – Likely OFT referral
I would like to start by commenting onthe potential OFT referral
of the grocery market to the Competition Commission. This is a
subject which seems to be high on everyone’s agenda at the
moment.
Let me tell you that Morrisons welcomes strong competition as
good for the consumer and good for our business.
But strong competition also needs to be fair competition.
• When Morrisons gets planning consent, it builds what the
plans say.
• When Morrisons advertises a price, you know it is the
price you will pay - it does not depend on which format
you are in.
• When Morrisons advertises a saving, it is a genuine
saving – not money off a price that was artificially
inflated the month before.
• We won’t make spurious claims against our competitors,
on our website or in the press.

Analyst Presentation Script We share some of the OFT’s concerns, and hope that measures
can be taken to clean up the competitive landscape, hopefully
without the cost that a full market reference would incur. We are
making appropriate representations to the OFT.

Analyst Presentation Script
SLIDE 4 – Board
This year we made great strides in strengthening our board by
appointing:
• Susan Murray as non-executive director and Chairman of
the Remuneration Committee.
• Paul Manduca as a non-executive director and Chairman
of the Audit Committee.
• Brian Flanagan & Nigel Robertson as non-executive
directors.
And last but not least
• Richard Pennycook as Group Finance Director.
I can confirm that we are making good progress in our search for
a new CEO to take over from Bob and, whilst I have nothing
further to say today, I will update you further as soon as I can.
Much of the Board’s time over the last few months has been
focused on the Optimisation Plan and Richard will be talking
about this later.

Analyst Presentation Script
SLIDE 5 - Dividend
The Board’s confidence in the future prospects of the company
is reflected in its recommendation of a final dividend of 3.07p
bringing the full year dividend to 3.7p. This is the same level as
last year.
And now I’ll hand over to Richard who will take you through the
financial results.
SLIDE 6 -
Thanks Ken
Ladies and gentlemen I am pleased that we have stabilised after
a difficult year, and can today report trading figures in line with
the guidance we gave at the interims. I intend to keep this
section brief, to allow more time for our forward looking
discussions around the Optimisation Plan.

Analyst Presentation Script
SLIDE 7 - Financial summary
All numbers in this presentation are in IFRS format - you see
here our key financial metrics. Sales were level, despite the
volume of disposals, but their composition changed
substantially. Our Operating Profits were down from £395m to
£112m, and I will talk more about this in a moment.
Exceptional items were in line with previous guidance, with
£271m included in the total figure shown here of £374m. Given
the Group’s profitability in the year, we undertook an
impairment review of the Safeway acquisition. No impairment
charge was taken against the carrying value of converted stores,
as our Optimisation Plan supports these, but we did impair the
goodwill arising on the acquisition, of £103.2m.
Net debt remained constant, reflecting the good cash generation
characteristics of the business.
Net assets declined by £357m reflecting the loss in the year and
our commitment to continue to pay the dividend. Within this
figure, fixed assets (which are called “non current” assets under
IFRS) increased by £249m as a result of investments in store
conversions, new stores and infrastructure.
Analyst Presentation Script SLIDE 8 - Profit and loss account
I will bridge both sales and operating profit for you shortly. On
this slide, I will just highlight three things:
• that the reduced interest charge is partly due to an increase
in interest capitalised to £12m, as a result of some big
infrastructure projects that will not recur next year.
• that operating profit before exceptionals of £111.5m would
be £109.3m under UK gaap – so no material differences.
• that the effective tax rate is a credit, reflecting loss relief
that will be carried back against past profits, leading to
repayments of tax. We expect to revert to a normal tax
charge next year.
Analyst Presentation Script
SLIDE 9 - Operating profit pre exceptionals
Between this slide and the profit bridge you will gain a pretty
clear idea of how Morrisons moved from an industry leading
profit conversion two years ago to 0.9% in 2005/06. Our
discussion on the Optimisation Plan will address the journey
back towards more acceptable levels of profitability, but here let
me highlight the following:
• Gross margin has reduced slightly, by 30bps. In fact, the
real performance was somewhat better than this comparison
suggests – the prior year figure included a one-time
accounting gain of £77m and the current year figure
includes the dilutive effect of much increased fuel sales –
which as you know are low margin. Taking these two
factors into account, there was a margin uplift from 04/05
of approximately 110 bps.
• The rise in staff costs is despite the divestment of 241 stores
with associated payroll costs of approximately £80m in the
year. The increase reflects a very substantial rise in staff
numbers in stores following conversion, as well as more
people in our expanded manufacturing facilities and the

Analyst Presentation Script
increase in depot staff following the opening of the Latimer
Park RDC.
• Depreciation was a level percentage of sales, and under UK
gaap would have been £265m. I am confident, having
reviewed our depreciation policies, that we remain the most
conservative company in the sector.
• Other costs, that is overheads, were up significantly – by
£158m. The key components were distribution and the
impact of energy price increases.
Analyst Presentation Script
SLIDE 10 - Exceptional costs
Exceptional cash costs were in line with previous guidance. The
largest element was the completion of the two year stores
conversion programme, with £147m charged in 2005/06 and
£58m in 2004/05. These charges were in addition to the
capitalized costs of £419m over two years. So in total, the 220
stores converted cost us £624m, equivalent to £2.8m per store or
£110 per square foot. This is a higher figure than we previously
highlighted but we remain within the overall guidance for post
acquisition capex.
The other large cash item in exceptionals reflects the previously
announced closure of three depots. Redundancy costs were
£44m of the total £76m shown here, and we also took an
impairment charge against the properties, of £21m.
We have written off the £103.2m goodwill created on the
acquisition of Safeway. This arose on conversion from UK Gaap
to IFRS and the Board considers, in view of the Group’s current
financial performance and the likelihood that profit recovery will
take time, that it is appropriate to write off this item.
Analyst Presentation Script
SLIDE 11 - Sales bridge – year on year
I mentioned previously that there were a lot of moving parts in
sales in the year, and this chart helps to summarise them. It
shows non fuel takings including VAT.
In bridging the two years’ sales figures, £686m reflects 5
additional weeks of Safeway in 05/06, as the business was only
owned for 47 weeks in the previous year. £780m results from the
volume reduction of stores sold in 2004/05 and a further £687m
from stores sold in the year. These are much the largest effects.
Core Morrisons store sales were down £163m, primarily as a
result of cannibalization following the disposals required by the
OFT, which cost some £3m in lost sales per affected store. The
good news story was the growth of £375m in the converted
stores, and Bob will update you later on the most recent trends.
It is worth pointing out that the “disposal effect” will continue to
be seen in 2006/07. There were sales in the year of £544m from
stores that are no longer in the Group.

Analyst Presentation Script
SLIDE 12 - Profit bridge – year on year
This slide sets out the year on year movement in operating profit.
It is only directional, but I think it highlights clearly the
dynamics of the year.
In 2005, when the business reported an Operating Profit of
£395m, there was a hope that this was a reflection of post
acquisition indigestion and that profits would bounce back. In
fact in looking at the bridge from last year’s operating profit of
£395m to this year’s £112m, you can see that a number of
elements of this performance had been set in train in the
immediate aftermath of the Safeway acquisition. £89m of the
decline simply reflects accounting changes in 2004/05 which
gave a one-time benefit in that year (particularly the recognition,
on an accruals basis, of supplier income). A further £132m
reflects the direct impact of conversion and disposal activity, in
three elements:
Firstly, £49m from lost contribution as a result of disposals.
Secondly, the £47m profit impact on core stores of being
required by the OFT to dispose of a number of large Safeway
stores.

Analyst Presentation Script Thirdly the fact that staff costs in converted stores more than
offset the profit contribution from increased sales, leaving those
stores down £36m in the year.
These were the biggest effects on the year – totaling £221m of
the profit decline. Improvements seen in margin performance, as
I mentioned earlier, added £120m in the year, the biggest
positive factor. Distribution costs increased by £72m due to the
addition of network capacity. Extra manufacturing costs were
£30m, reflecting much higher volumes of in house production
supporting the bigger business. Cost inflation hit us hard, with
the impact of energy cost increases the biggest factor in the
£100m shown here. Another large element was higher pensions
funding.
As you can see from this bridge, there is not much here that can
simply be added back as non-recurring when considering our
future profit recovery.

Analyst Presentation Script
SLIDE 13 - Cash flow
This chart is largely self explanatory. I would just draw your
attention to the disposal proceeds and capital expenditure lines.
The two year picture shows the full effect of the post acquisition
activities, with £1.4bn of disposal proceeds being used to fund
the conversion programme and other infrastructure investments
of £1.1bn as well as to pay off some of the acquisition debt. A
full reconciliation of the movement in net debt is provided at the
back of your packs. There are no more large disposals to come,
but there will be some more infrastructure cost in distribution.
Ladies and gentlemen, there is much more financial detail
available in your packs, but we have covered the key elements.
Now let me hand you over to Bob Stott, for the operational
review. Bob…
Analyst Presentation Script
SLIDE 14
Thank you Richard
Good Morning ladies and gentlemen. It is good to be here again,
even if for the final time. As Ken has said the search for my
successor is well underway. However I continue to remain
totally focused on the business but will also be ready to
handover as soon as it’s practical.
SLIDE 15 - Operational review
I am very pleased with what we have achieved operationally
since the Christmas period update. The major events post
Christmas have involved the commencement in February, of the
first steps in the practical implementation of optimisation, the
closure and sale of the former Safeway offices at Hayes and a
major Company conference in order to explain our plans to all
our senior management. I would also add at this point that this
follows a conference in Leeds on November 28th to update our
supply base following the completion of our conversion
program. Our plans and strategy were very well received by our
suppliers.

Analyst Presentation Script SLIDE 16 - The stores estate
This next slide demonstrates the nationwide network of stores
now trading under the Morrison brand. We have created one
business with one vision and one set of values. Going forward,
as we indicated at the interims, we will therefore report to you as
one business. In moving to the current 374 store estate we
converted 220 stores, sold 241 and opened 15 new builds during
2004 and 2005. Since January 29th we have completed the
planned disposal of a further four stores. There is a slide at the
back of your pack which tracks the store estate during the last
financial year.
SLIDE 17 - The stores estate - size
This slide demonstrates the components of the Morrison store
estate by store sales areas. It highlights that around 40% of our
stores, excluding the systems conversions, are now less than
25,000 square feet and these need to have an appropriate
customer offer relative to specific store size, geography and
demographics. Work is already underway as part of our
optimisation program, and Richard will be talking about this
later.

Analyst Presentation Script SLIDE 18 - The stores estate - geography
This completes the store estate picture in identifying the year end
store numbers in our operating regions, and as you can see we
are now a truly national brand. You will note that I have also
shown the numbers of petrol filling stations in each region and I
am pleased to tell you that we are now the fifth biggest fuel
brand nationally and second to Tesco in the supermarket league.
Both these stats are based on volume sales, the true measure in
fuel retailing.
Analyst Presentation Script
SLIDE 19 - Support infrastructure - distribution
I now move onto updating you on our distribution infrastructure
and confirm that all activity ceased in January at Aylesford and
Bristol, whilst the only activity still live at Warrington covers
frozen foods. Warrington will finally close when our new frozen
food distribution centre is fully on stream at Corby later this
year. We are very well placed with distribution facilities in
Scotland, the North East, the North West and into the Midlands,
South Wales and East Anglia. We have no issues with capacity
in serving the South West and South East but we are traveling
too far in so doing. Our priority is therefore to develop modern
regional distribution facilities to serve the south. Again this is
part of the optimisation opportunity. In closing Aylesford,
Bristol and Warrington we have moved from tired and high cost
facilities at a short term cost, but with annual benefit of £30m.

Analyst Presentation Script
SLIDE 20 - Support infrastructure - manufacturing
Vertical integration is very much part of our business model.
We have increased capacity based on Northamptonshire by
doubling the size of our fruit packing facilities at Thrapston and
opening a new veg packhouse nearby at Rushden. This slide
indicates how we are able to meet most of the needs of the
business in fresh produce, fresh meat and certain other fresh
food areas. Vertical integration also helps to give us leadership
in certain fresh areas, as TNS data will later demonstrate.

Analyst Presentation Script
SLIDE 21 – Performance update – year to 29th January 2006
I will now show you the like for like sales performance over the
whole of last year across the continuing group broken down for
the final time between core Morrison stores and the converted
estate. Given the flat store sales performance reported in
October for the stores converted for more than 52 weeks, I am
pleased at the 3.8% uplift I can report for the period to January
29th; 6% if fuel is included. As reported at Christmas, core
Morrisons is now on an improving trend following
cannibalisation from converted stores over the past year.
Customer numbers, average basket size and sales densities are
encouraging across the estate.

Analyst Presentation Script
SLIDE 22 – Performance update – 7 weeks to 19th March
2006
Looking now at the first 7 weeks of the new year, to Sunday
March 19th, I have set out the comparison with full year
2005/6The total like for like sales uplift (excluding fuel) is 3.2%
and this, as you will realize, is stronger than the 6 week
Christmas figures released in early January. Customer numbers
in converted stores continue to grow and are cumulatively 7%
higher after 7 weeks. Within the total like for like store sales
uplift, stores converted for more than one year are continuing to
show a very encouraging trend.
Analyst Presentation Script
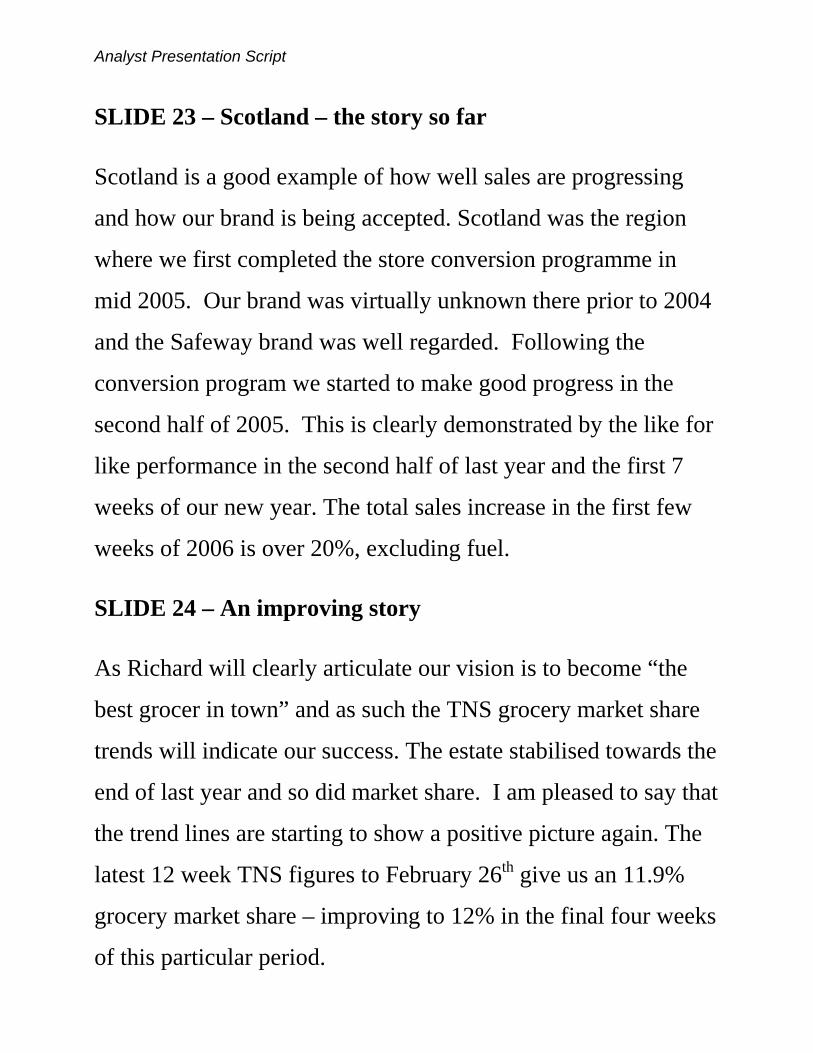
SLIDE 23 – Scotland – the story so far
Scotland is a good example of how well sales are progressing
and how our brand is being accepted. Scotland was the region
where we first completed the store conversion programme in
mid 2005. Our brand was virtually unknown there prior to 2004
and the Safeway brand was well regarded. Following the
conversion program we started to make good progress in the
second half of 2005. This is clearly demonstrated by the like for
like performance in the second half of last year and the first 7
weeks of our new year. The total sales increase in the first few
weeks of 2006 is over 20%, excluding fuel.
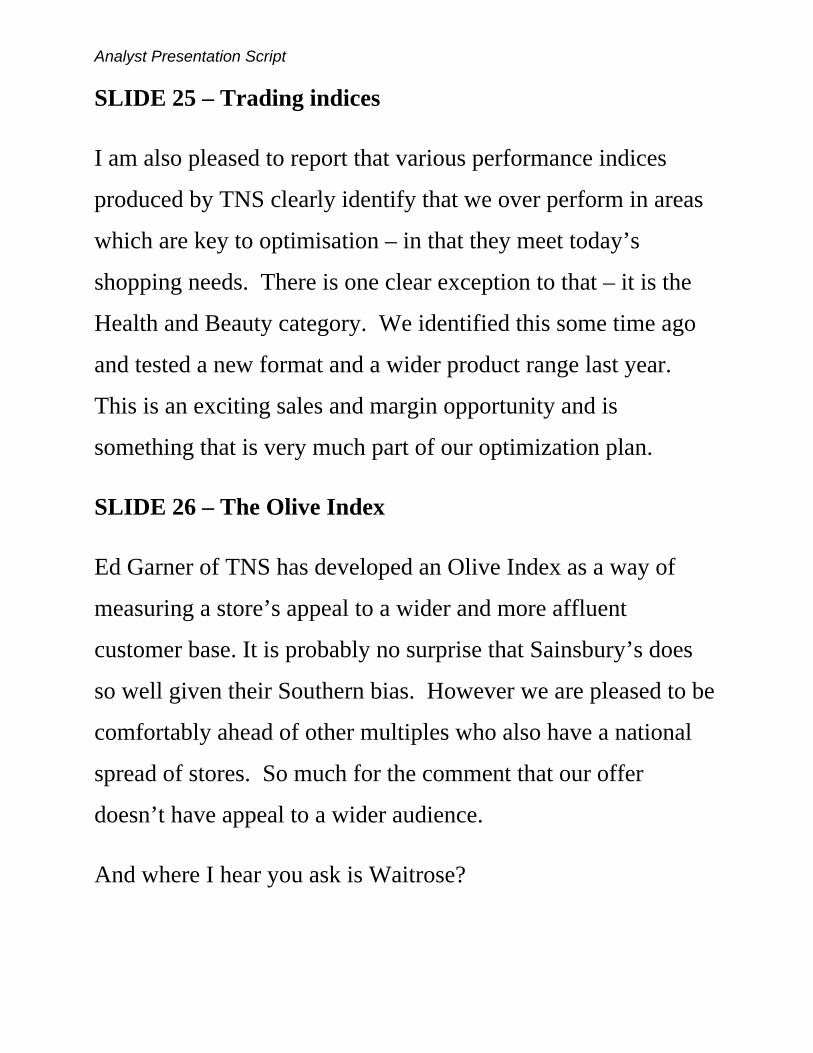
SLIDE 24 – An improving story
As Richard will clearly articulate our vision is to become “the
best grocer in town” and as such the TNS grocery market share
trends will indicate our success. The estate stabilised towards the
end of last year and so did market share. I am pleased to say that
the trend lines are starting to show a positive picture again. The
latest 12 week TNS figures to February 26th give us an 11.9%
grocery market share – improving to 12% in the final four weeks
of this particular period.
Analyst Presentation Script SLIDE 25 – Trading indices
I am also pleased to report that various performance indices
produced by TNS clearly identify that we over perform in areas
which are key to optimisation – in that they meet today’s
shopping needs. There is one clear exception to that – it is the
Health and Beauty category. We identified this some time ago
and tested a new format and a wider product range last year.
This is an exciting sales and margin opportunity and is
something that is very much part of our optimization plan.
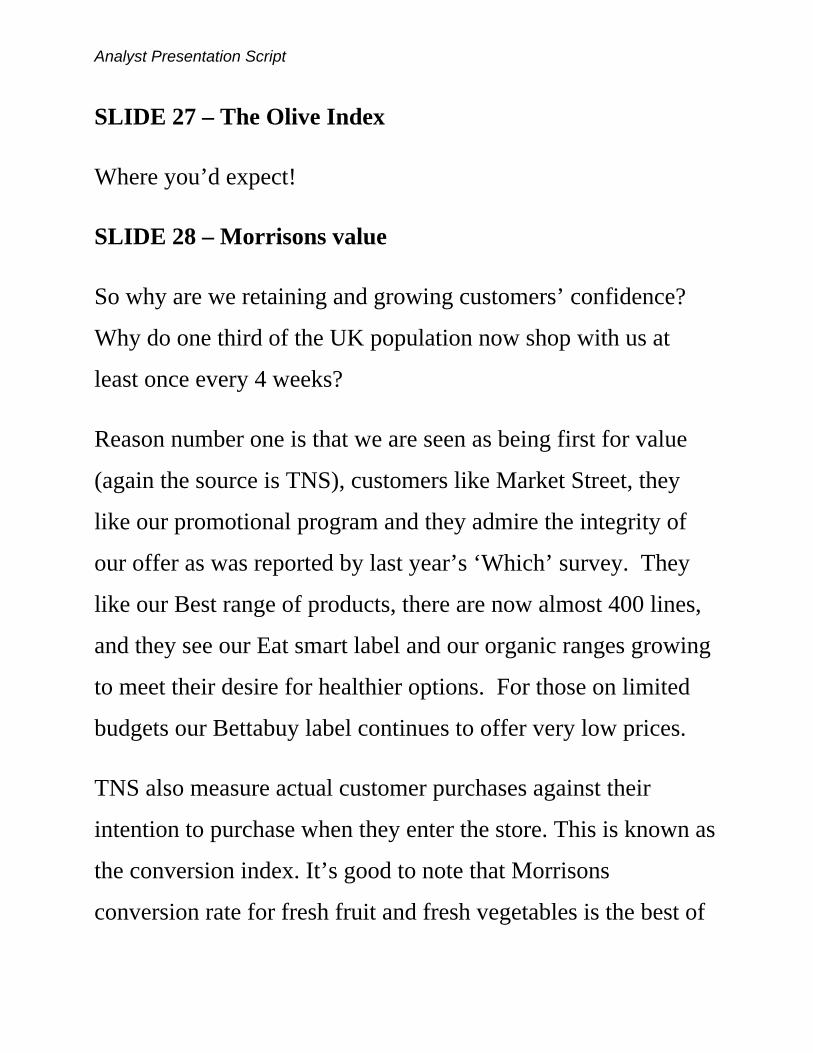
SLIDE 26 – The Olive Index
Ed Garner of TNS has developed an Olive Index as a way of
measuring a store’s appeal to a wider and more affluent
customer base. It is probably no surprise that Sainsbury’s does
so well given their Southern bias. However we are pleased to be
comfortably ahead of other multiples who also have a national
spread of stores. So much for the comment that our offer
doesn’t have appeal to a wider audience.
And where I hear you ask is Waitrose?
Analyst Presentation Script
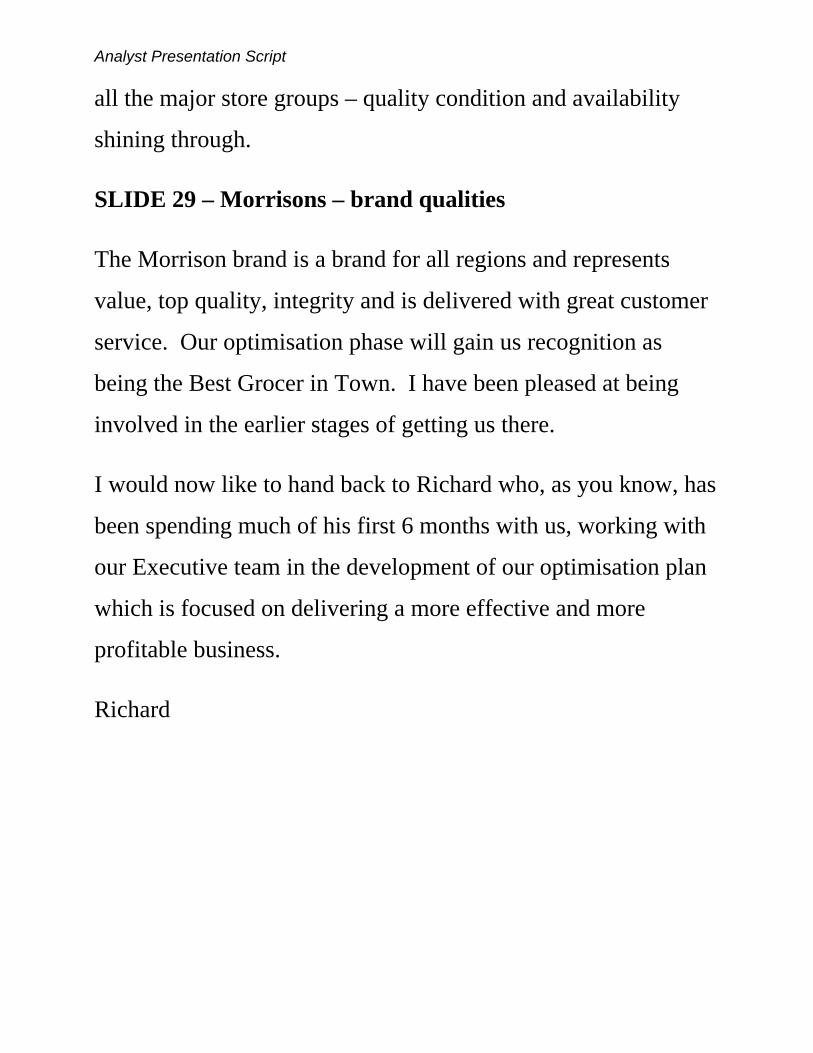
SLIDE 27 – The Olive Index
Where you’d expect!
SLIDE 28 – Morrisons value
So why are we retaining and growing customers’ confidence?
Why do one third of the UK population now shop with us at
least once every 4 weeks?
Reason number one is that we are seen as being first for value
(again the source is TNS), customers like Market Street, they
like our promotional program and they admire the integrity of
our offer as was reported by last year’s ‘Which’ survey. They
like our Best range of products, there are now almost 400 lines,
and they see our Eat smart label and our organic ranges growing
to meet their desire for healthier options. For those on limited
budgets our Bettabuy label continues to offer very low prices.
TNS also measure actual customer purchases against their
intention to purchase when they enter the store. This is known as
the conversion index. It’s good to note that Morrisons
conversion rate for fresh fruit and fresh vegetables is the best of
Analyst Presentation Script all the major store groups – quality condition and availability
shining through.
SLIDE 29 – Morrisons – brand qualities
The Morrison brand is a brand for all regions and represents
value, top quality, integrity and is delivered with great customer
service. Our optimisation phase will gain us recognition as
being the Best Grocer in Town. I have been pleased at being
involved in the earlier stages of getting us there.
I would now like to hand back to Richard who, as you know, has
been spending much of his first 6 months with us, working with
our Executive team in the development of our optimisation plan
which is focused on delivering a more effective and more
profitable business.
Richard

Analyst Presentation Script
SLIDE 30 - Optimisation Plan
Thanks Bob.
SLIDE 31 – Optimisation plan - themes
I want to spend a few minutes setting the scene and describing
the new shape of the business, but let me just also summarise the
guidance we are going to be providing:
• There will be no firm guidance on sales, but I will give you
a sense of how we are looking at different aspects of the
business.
• I will provide firm guidance on margins and costs.
• The very significant levels of exceptional spend getting the
business into its new shape will come to an end, with
exceptionals below £50m in total over the next 2 years.
• We will keep tight cash control in the coming year, with no
increase in net debt.
Analyst Presentation Script
SLIDE 32 – Optimisation plan – what it is (and is not)
The objectives of the Optimisation Plan are simple – apply the
Morrisons model, which has worked so well over many years, to
the new, bigger business, and adapt it where we have to, to
reflect things that have changed. It is about getting the most out
of our new business. Importantly, there is no “golden bullet” to
fire, no raft of double running costs to fall out, no huge untapped
synergy gains to pursue. Instead, it is about getting back to the
day job, and delivering improvement store by store, line by line.
The Board has been very conscious of a few things in
developing the Plan:
• Firstly, that it is about basic, tactical profit recovery. There
is no “big idea” here. Strategic issues will await the imprint
of the new CEO.
• Secondly, that this is not the FD’s plan – the whole
management team owns it.
• Thirdly, implementation will take some time – this is a
three year programme.
Analyst Presentation Script
SLIDE 33 - Applying the Morrisons model
The new business is Morrisons. We have one vision – to be the
best grocer in town - and one set of values. All the things that the
business did right, in delivering industry leading financial
performance two years ago, in continuing to win service awards
whilst in the thick of the conversion programme, and, right now,
in being regarded as the best grocer for value, need to be picked
up and applied in all our stores.
This is no mean task.

Analyst Presentation Script
SLIDE 34 - Adapting where necessary
Morrisons is a new business today. 5.5m customers each week,
more than half the total, are only just getting to know us, and
two in every three colleagues have less than 2 years service.
More than half our space is new to Morrisons, and it is smaller
and geographically more diverse than before. Getting our
colleagues to deliver the Morrisons way will take us towards our
Optimisation Goals – but we will also have to adapt. What works
in 40,000 square feet may not work in 20,000, and what works in
Newcastle may not work in Newquay. Morrisons has always
been able to adapt successfully to new locations and local
markets – now there are just more of them. A key to the
Optimisation Programme will be more, and faster, adaptation
than before.

Analyst Presentation Script
SLIDE 35 - Delivering the plan – our goals
Our goals for the Optimisation phase are simple. We cannot
overestimate the importance, for all colleagues, of getting back
to the day job. Throughout the business, people have been
distracted for two years - whether it is store managers displaced
onto conversion activities, traders distracted by terms
rationalisation, distribution managers opening and closing
depots, HR managers handling redundancy programmes or
finance guys managing disposal transactions. Morrisons was
under-resourced to handle this activity, and the best people were
put on to it. They are now getting back to the day job.
A strength of Morrisons is the ability of the business to act at
pace, as witnessed by the conversion programme. Where we can
deliver obvious gains, we are acting quickly.
However, where issues are not so obvious, we will think things
through carefully. I will talk later about some trials that are
under way, where we think there are benefits to be gained, but
cannot be sure until the hypotheses have been tested.
And finally, as I mentioned previously, bigger, more strategic
issues will await the arrival of the CEO.
Analyst Presentation Script SLIDE 36 - A critical change challenge
The Optimisation Plan is a large change programme, which has
to build on the past strengths of the business but adapt these to
the new shape of the business. This slide shows some examples:
• In the past, Morrisons was run by a small, tightly knit team
at the centre, who knew the business and each other
extremely well. Now, there are newcomers in the team, and
the business is bigger and more diverse. We have to
empower the top team more.
• Morrisons made a great virtue out of keeping things simple,
and where we can we want to preserve this ethic. But we
cannot avoid the fact that the business is more complex, or
that there are so many new people needing to learn, fast.
• Morrisons was a business that acted on sound instinct – the
normal decision support functions that would exist in most
businesses were not required in Morrisons. They are now –
the decision making is more complex, particularly in
prioritising our work.
• Being the best creates a confidence that itself builds
momentum. Morrisons’ confidence has been knocked, but
management are committed and determined to rebuild it.

Analyst Presentation Script
• The low cost Morrisons culture, previously a virtue, in part
caused some of the pain post acquisition, with not enough
depth of management or systems flexibility. Any change
programme has costs attached to it. We must have the
former “low cost” credentials in mind, but recognise that
we will not get back there immediately.

Analyst Presentation Script
SLIDE 37 - A critical change challenge
What about the things that really made Morrisons great?
Being sales led, value driven, with a trading mentality, customer
focused and massive attention to detail in stores?
In all these respects, there is no change.
SLIDE 38 - Original Morrisons stores – back to best
The so called core Morrisons stores had sales per square foot of
£19.94 in 2003/04. Over the past two years, this figure barely
changed, whilst cost inflation progressed by over 10%. A key
part of our plan is the restoration of these stores to their past,
industry best, conversion levels through the resumption of top
line growth.
Analyst Presentation Script
SLIDE 39 - Large converted stores – up to best
We converted 73 large Safeway stores to Morrisons, in places
like Milton Keynes and Reading, and in time they should
perform just like any comparable Morrisons store. The average
size of this batch is 30,000 square feet, and whilst this is smaller
than core Morrisons at 36,000, these stores have large enough
volumes to convert at high profit levels.
As you can see, in the past year these stores were not performing
at best practice levels, and over the next three years we will get
them there. A combination of continuing sales momentum and
great operational execution is required to build the profits, and a
big contribution to this will come from a targeted 2.1m hours
saving in the coming year.

Analyst Presentation Script
SLIDE 40 -Smaller converted stores – forward to best
The smaller converted stores are large enough, at 21,000 square
feet, to be “full shop” food stores, but in some respects we have
to operate them differently. The original conversion programme
simply dropped the Morrisons operating model into the stores,
and now we have to go back and fine tune it. Some things are
obvious to do – for example our admininstrative offices are
manned throughout store opening times . In large stores, this is
fine, and needed. In small stores, the volume of work is not
there, and the stores can manage perfectly well on a more limited
service. Trials have shown we can operate these smaller stores
on 160 hours per week less, with no loss of service to the store.
This, and other initiatives, will allow us to save 3.9m staff hours
in these stores this year, from natural staff turnover.
We have a number of trials beginning to explore more difficult
aspects of small store operation, including space allocations,
range selection, promotional balance, in-store preparation and
supply chain service. We will report back, as these trials
progress, on deliverable and quantifiable benefits.
Analyst Presentation Script
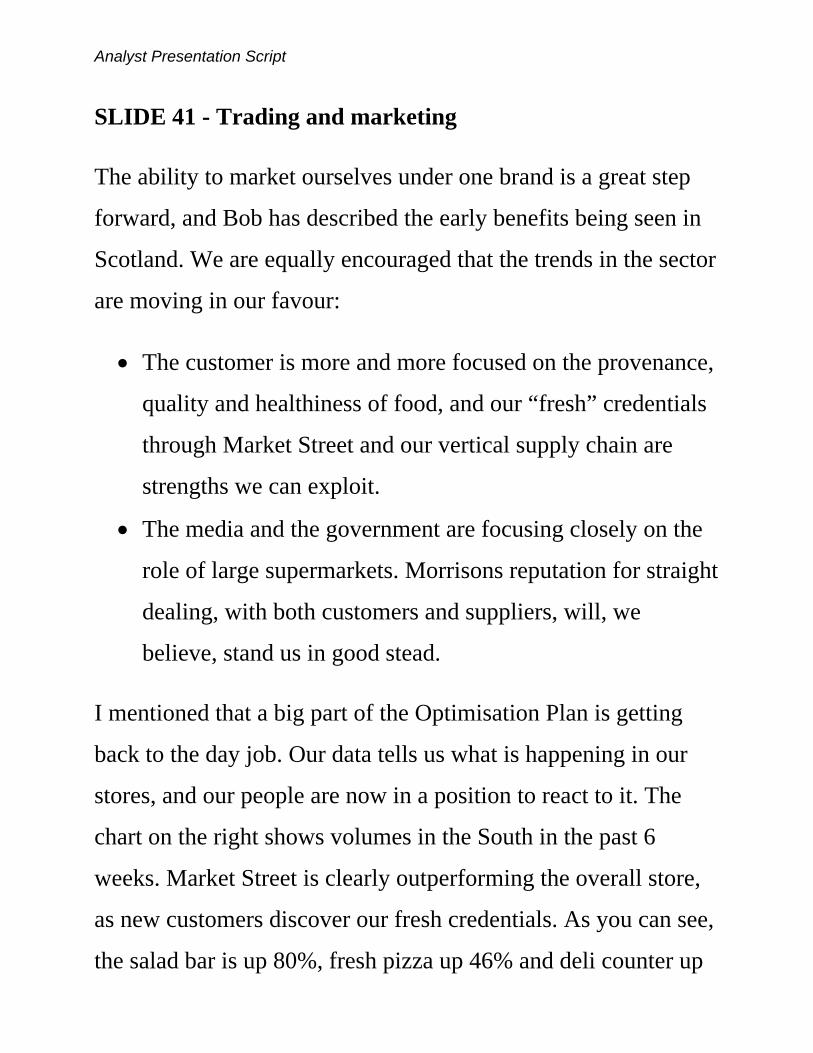
SLIDE 41 - Trading and marketing
The ability to market ourselves under one brand is a great step
forward, and Bob has described the early benefits being seen in
Scotland. We are equally encouraged that the trends in the sector
are moving in our favour:
• The customer is more and more focused on the provenance,
quality and healthiness of food, and our “fresh” credentials
through Market Street and our vertical supply chain are
strengths we can exploit.
• The media and the government are focusing closely on the
role of large supermarkets. Morrisons reputation for straight
dealing, with both customers and suppliers, will, we
believe, stand us in good stead.
I mentioned that a big part of the Optimisation Plan is getting
back to the day job. Our data tells us what is happening in our
stores, and our people are now in a position to react to it. The
chart on the right shows volumes in the South in the past 6
weeks. Market Street is clearly outperforming the overall store,
as new customers discover our fresh credentials. As you can see,
the salad bar is up 80%, fresh pizza up 46% and deli counter up

Analyst Presentation Script 57% - all revealing the taste and discernment of our Southern
customers. We are also pleased that pie sales, up 28%, are
outstripping sales in the North of the country!
A good example of a specific initiative in the Trading arena is
health and beauty. My colleagues have known for some time that
we were lagging the market in this area, but could not act in the
midst of the conversion programme. Now, following successful
trials, we are rolling out a new layout and range across 140 large
stores, and if the trial results are replicated we will see
incremental sales of £100m pa from this initiative.
Our plans anticipate a continuing deflationary environment, but
over and above this we have targeted a 90bps margin
improvement during the three years of the plan.
Analyst Presentation Script
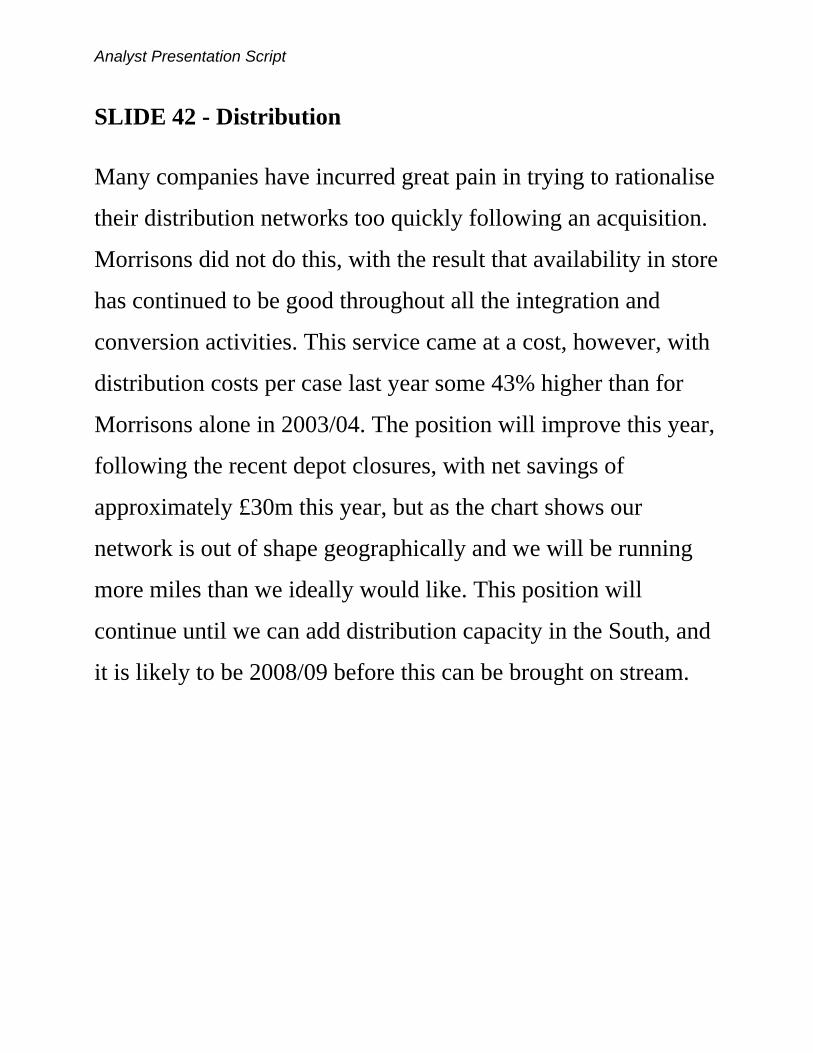
SLIDE 42 - Distribution
Many companies have incurred great pain in trying to rationalise
their distribution networks too quickly following an acquisition.
Morrisons did not do this, with the result that availability in store
has continued to be good throughout all the integration and
conversion activities. This service came at a cost, however, with
distribution costs per case last year some 43% higher than for
Morrisons alone in 2003/04. The position will improve this year,
following the recent depot closures, with net savings of
approximately £30m this year, but as the chart shows our
network is out of shape geographically and we will be running
more miles than we ideally would like. This position will
continue until we can add distribution capacity in the South, and
it is likely to be 2008/09 before this can be brought on stream.

Analyst Presentation Script
SLIDE 43 - In support
The support functions in Morrisons will come together under
one roof by the time of the half year. As we move into the year, I
hope that a new accounting system and new recruits to the
finance team will provide insightful support to the business in
monitoring our progress in delivery of the Plan.
Centrally, we will see lower costs as a result of elimination of
the “dual running” elements last year and from other overhead
reduction actions. These two things will deliver savings of £30m
this year.

Analyst Presentation Script
SLIDE 44 - Restoring pride in Morrisons
There is no rocket science in the Optimisation Plan – it is about
hard work, attention to detail and a great team effort. In the
coming year, we aim to save 6 million staff hours in store,
equivalent to £50m in the year and an annualised saving of
£90m.We intendto make progress towards our three year margin
improvement target of 90 bps, to save £30m in distribution and a
further £30m in the centre. Beyond the current year, we are
confident of further improvements in our operating efficiency.
Our recovery will take time, but we are on with it and we will
keep you updated on progress.
Now let me hand you back to Ken for his concluding remarks.

Analyst Presentation Script
SLIDE 45 - Summary
You have seen our historic results, and we have outlined our
future plans. It would be an understatement to say that this has
been a challenging year. I am sure that we are over the worst and
that the business is now stabilised. Certainly the 7 week year to
date sales figures are encouraging, albeit that we have a long
way to go.
The completion of the largest ever retail conversion programme
in the UK in just eighteen months was a stunning achievement
and one of which all those involved are justifiably proud. We
still have much work to do to complete the necessary cultural
change.
Clearly, as we have described, we face a number of challenges
as we seek to return the business to delivering acceptable levels
of shareholder returns.
I am confident that in our Optimisation Plan we have a blueprint
to take the business forward.
Thank you - and I will now invite gentle questions from the
floor.