analysis plug-in user guide - sap insert a data source in a workbook ... the analysis plug-in user...
TRANSCRIPT

PUBLIC
SAP BusinessObjects Analysis, edition for Microsoft OfficeDocument Version: 2.3 SP3 – 2017-04-20
Analysis Plug-in User Guide

Content
1 About this guide. . . . . . . . . . . . . . . . . . . . . . . . . . . . . . . . . . . . . . . . . . . . . . . . . . . . . . . . . . . . . . . 71.1 Who should read this guide?. . . . . . . . . . . . . . . . . . . . . . . . . . . . . . . . . . . . . . . . . . . . . . . . . . . . . . . . 71.2 User profiles. . . . . . . . . . . . . . . . . . . . . . . . . . . . . . . . . . . . . . . . . . . . . . . . . . . . . . . . . . . . . . . . . . . 71.3 About the documentation set. . . . . . . . . . . . . . . . . . . . . . . . . . . . . . . . . . . . . . . . . . . . . . . . . . . . . . . 7
2 Getting Started. . . . . . . . . . . . . . . . . . . . . . . . . . . . . . . . . . . . . . . . . . . . . . . . . . . . . . . . . . . . . . . . 92.1 What is SAP BusinessObjects Analysis, edition for Microsoft Office?. . . . . . . . . . . . . . . . . . . . . . . . . . . 92.2 Introduction to the Analysis Plug-in. . . . . . . . . . . . . . . . . . . . . . . . . . . . . . . . . . . . . . . . . . . . . . . . . . .92.3 Working with Analysis in Microsoft Excel. . . . . . . . . . . . . . . . . . . . . . . . . . . . . . . . . . . . . . . . . . . . . . 102.4 Working with Analysis in Microsoft PowerPoint. . . . . . . . . . . . . . . . . . . . . . . . . . . . . . . . . . . . . . . . . . 17
3 Creating Workbooks. . . . . . . . . . . . . . . . . . . . . . . . . . . . . . . . . . . . . . . . . . . . . . . . . . . . . . . . . . . 223.1 Creating and administrating workbooks. . . . . . . . . . . . . . . . . . . . . . . . . . . . . . . . . . . . . . . . . . . . . . .22
To insert a data source in a workbook. . . . . . . . . . . . . . . . . . . . . . . . . . . . . . . . . . . . . . . . . . . . . .23To insert a data source into a default workbook. . . . . . . . . . . . . . . . . . . . . . . . . . . . . . . . . . . . . . . 24Launching the Query Designer for editing a data source. . . . . . . . . . . . . . . . . . . . . . . . . . . . . . . . . 26To smart copy/paste a data source. . . . . . . . . . . . . . . . . . . . . . . . . . . . . . . . . . . . . . . . . . . . . . . 27Inserting data sources using BW Workspaces. . . . . . . . . . . . . . . . . . . . . . . . . . . . . . . . . . . . . . . . 28To open a workbook. . . . . . . . . . . . . . . . . . . . . . . . . . . . . . . . . . . . . . . . . . . . . . . . . . . . . . . . . . 32To save a workbook. . . . . . . . . . . . . . . . . . . . . . . . . . . . . . . . . . . . . . . . . . . . . . . . . . . . . . . . . . 33To save a query view. . . . . . . . . . . . . . . . . . . . . . . . . . . . . . . . . . . . . . . . . . . . . . . . . . . . . . . . . . 35To rename a workbook. . . . . . . . . . . . . . . . . . . . . . . . . . . . . . . . . . . . . . . . . . . . . . . . . . . . . . . . 36To delete a workbook. . . . . . . . . . . . . . . . . . . . . . . . . . . . . . . . . . . . . . . . . . . . . . . . . . . . . . . . . 36To launch Analysis from a BW system. . . . . . . . . . . . . . . . . . . . . . . . . . . . . . . . . . . . . . . . . . . . . .37To convert a BEx workbook. . . . . . . . . . . . . . . . . . . . . . . . . . . . . . . . . . . . . . . . . . . . . . . . . . . . . 38
3.2 Defining style sets for crosstabs. . . . . . . . . . . . . . . . . . . . . . . . . . . . . . . . . . . . . . . . . . . . . . . . . . . . 40SAP cell styles. . . . . . . . . . . . . . . . . . . . . . . . . . . . . . . . . . . . . . . . . . . . . . . . . . . . . . . . . . . . . . 41To apply a style set. . . . . . . . . . . . . . . . . . . . . . . . . . . . . . . . . . . . . . . . . . . . . . . . . . . . . . . . . . . 42To create a style set. . . . . . . . . . . . . . . . . . . . . . . . . . . . . . . . . . . . . . . . . . . . . . . . . . . . . . . . . . 43To share a style set. . . . . . . . . . . . . . . . . . . . . . . . . . . . . . . . . . . . . . . . . . . . . . . . . . . . . . . . . . .44To delete a style set. . . . . . . . . . . . . . . . . . . . . . . . . . . . . . . . . . . . . . . . . . . . . . . . . . . . . . . . . . 44
3.3 Editing crosstabs with Table Design. . . . . . . . . . . . . . . . . . . . . . . . . . . . . . . . . . . . . . . . . . . . . . . . . 45To apply formats. . . . . . . . . . . . . . . . . . . . . . . . . . . . . . . . . . . . . . . . . . . . . . . . . . . . . . . . . . . . 45To add new cells. . . . . . . . . . . . . . . . . . . . . . . . . . . . . . . . . . . . . . . . . . . . . . . . . . . . . . . . . . . . . 47To add texts in new member cells. . . . . . . . . . . . . . . . . . . . . . . . . . . . . . . . . . . . . . . . . . . . . . . . 48To add formulas in new data cells. . . . . . . . . . . . . . . . . . . . . . . . . . . . . . . . . . . . . . . . . . . . . . . . .49
3.4 Inserting other components. . . . . . . . . . . . . . . . . . . . . . . . . . . . . . . . . . . . . . . . . . . . . . . . . . . . . . . 49
2 P U B L I CAnalysis Plug-in User Guide
Content

To insert a dynamic chart. . . . . . . . . . . . . . . . . . . . . . . . . . . . . . . . . . . . . . . . . . . . . . . . . . . . . . 50To insert a waterfall chart. . . . . . . . . . . . . . . . . . . . . . . . . . . . . . . . . . . . . . . . . . . . . . . . . . . . . . 50To insert an info field. . . . . . . . . . . . . . . . . . . . . . . . . . . . . . . . . . . . . . . . . . . . . . . . . . . . . . . . . . 51To insert a filter. . . . . . . . . . . . . . . . . . . . . . . . . . . . . . . . . . . . . . . . . . . . . . . . . . . . . . . . . . . . . 52
3.5 Working with formulas. . . . . . . . . . . . . . . . . . . . . . . . . . . . . . . . . . . . . . . . . . . . . . . . . . . . . . . . . . . 53To create a formula. . . . . . . . . . . . . . . . . . . . . . . . . . . . . . . . . . . . . . . . . . . . . . . . . . . . . . . . . . .54SAPGetData. . . . . . . . . . . . . . . . . . . . . . . . . . . . . . . . . . . . . . . . . . . . . . . . . . . . . . . . . . . . . . . .55SAPGetDimensionDynamicFilter. . . . . . . . . . . . . . . . . . . . . . . . . . . . . . . . . . . . . . . . . . . . . . . . . 56SAPGetDimensionEffectiveFilter. . . . . . . . . . . . . . . . . . . . . . . . . . . . . . . . . . . . . . . . . . . . . . . . . 56SAPGetDimensionInfo. . . . . . . . . . . . . . . . . . . . . . . . . . . . . . . . . . . . . . . . . . . . . . . . . . . . . . . . 57SAPGetDimensionStaticFilter. . . . . . . . . . . . . . . . . . . . . . . . . . . . . . . . . . . . . . . . . . . . . . . . . . . 57SAPGetDisplayedMeasures. . . . . . . . . . . . . . . . . . . . . . . . . . . . . . . . . . . . . . . . . . . . . . . . . . . . . 58SAPGetInfoLabel. . . . . . . . . . . . . . . . . . . . . . . . . . . . . . . . . . . . . . . . . . . . . . . . . . . . . . . . . . . . 58SAPGetMeasureFilter. . . . . . . . . . . . . . . . . . . . . . . . . . . . . . . . . . . . . . . . . . . . . . . . . . . . . . . . . 59SAPGetMember. . . . . . . . . . . . . . . . . . . . . . . . . . . . . . . . . . . . . . . . . . . . . . . . . . . . . . . . . . . . . 60SAPGetSourceInfo. . . . . . . . . . . . . . . . . . . . . . . . . . . . . . . . . . . . . . . . . . . . . . . . . . . . . . . . . . . 60SAPGetUniformScaling. . . . . . . . . . . . . . . . . . . . . . . . . . . . . . . . . . . . . . . . . . . . . . . . . . . . . . . . 61SAPGetVariable. . . . . . . . . . . . . . . . . . . . . . . . . . . . . . . . . . . . . . . . . . . . . . . . . . . . . . . . . . . . . 62SAPGetWorkbookInfo. . . . . . . . . . . . . . . . . . . . . . . . . . . . . . . . . . . . . . . . . . . . . . . . . . . . . . . . . 63SAPListOf. . . . . . . . . . . . . . . . . . . . . . . . . . . . . . . . . . . . . . . . . . . . . . . . . . . . . . . . . . . . . . . . . 63SAPListOfDimensions. . . . . . . . . . . . . . . . . . . . . . . . . . . . . . . . . . . . . . . . . . . . . . . . . . . . . . . . .64SAPListOfDynamicFilters. . . . . . . . . . . . . . . . . . . . . . . . . . . . . . . . . . . . . . . . . . . . . . . . . . . . . . 65SAPListOfEffectiveFilters. . . . . . . . . . . . . . . . . . . . . . . . . . . . . . . . . . . . . . . . . . . . . . . . . . . . . . 65SAPListOfMeasureFilters. . . . . . . . . . . . . . . . . . . . . . . . . . . . . . . . . . . . . . . . . . . . . . . . . . . . . . 66SAPListOfMembers. . . . . . . . . . . . . . . . . . . . . . . . . . . . . . . . . . . . . . . . . . . . . . . . . . . . . . . . . . 67SAPListOfMessages. . . . . . . . . . . . . . . . . . . . . . . . . . . . . . . . . . . . . . . . . . . . . . . . . . . . . . . . . . 67SAPListOfStaticFilters. . . . . . . . . . . . . . . . . . . . . . . . . . . . . . . . . . . . . . . . . . . . . . . . . . . . . . . . 68SAPListOfVariables. . . . . . . . . . . . . . . . . . . . . . . . . . . . . . . . . . . . . . . . . . . . . . . . . . . . . . . . . . 69SAPSetData. . . . . . . . . . . . . . . . . . . . . . . . . . . . . . . . . . . . . . . . . . . . . . . . . . . . . . . . . . . . . . . .70SAPSetFilterComponent. . . . . . . . . . . . . . . . . . . . . . . . . . . . . . . . . . . . . . . . . . . . . . . . . . . . . . . 71
3.6 Converting crosstab cells to formula. . . . . . . . . . . . . . . . . . . . . . . . . . . . . . . . . . . . . . . . . . . . . . . . . 72To convert a crosstab to formula. . . . . . . . . . . . . . . . . . . . . . . . . . . . . . . . . . . . . . . . . . . . . . . . . 73
3.7 Working with macros. . . . . . . . . . . . . . . . . . . . . . . . . . . . . . . . . . . . . . . . . . . . . . . . . . . . . . . . . . . . 74SAPAddMessage. . . . . . . . . . . . . . . . . . . . . . . . . . . . . . . . . . . . . . . . . . . . . . . . . . . . . . . . . . . . 74SAPCallMemberSelector. . . . . . . . . . . . . . . . . . . . . . . . . . . . . . . . . . . . . . . . . . . . . . . . . . . . . . . 75SAPExecuteCommand. . . . . . . . . . . . . . . . . . . . . . . . . . . . . . . . . . . . . . . . . . . . . . . . . . . . . . . . 77SAPExecutePlanningFunction. . . . . . . . . . . . . . . . . . . . . . . . . . . . . . . . . . . . . . . . . . . . . . . . . . . 82SAPExecutePlanningSequence. . . . . . . . . . . . . . . . . . . . . . . . . . . . . . . . . . . . . . . . . . . . . . . . . . 83SAPGetCellInfo. . . . . . . . . . . . . . . . . . . . . . . . . . . . . . . . . . . . . . . . . . . . . . . . . . . . . . . . . . . . . 83SAPGetProperty. . . . . . . . . . . . . . . . . . . . . . . . . . . . . . . . . . . . . . . . . . . . . . . . . . . . . . . . . . . . .84SAPLogOff. . . . . . . . . . . . . . . . . . . . . . . . . . . . . . . . . . . . . . . . . . . . . . . . . . . . . . . . . . . . . . . . .85
Analysis Plug-in User GuideContent P U B L I C 3

SAPLogon. . . . . . . . . . . . . . . . . . . . . . . . . . . . . . . . . . . . . . . . . . . . . . . . . . . . . . . . . . . . . . . . . 86SAPMoveDimension. . . . . . . . . . . . . . . . . . . . . . . . . . . . . . . . . . . . . . . . . . . . . . . . . . . . . . . . . . 87SAPOpenWorkbook. . . . . . . . . . . . . . . . . . . . . . . . . . . . . . . . . . . . . . . . . . . . . . . . . . . . . . . . . . 88SAPSetFilter. . . . . . . . . . . . . . . . . . . . . . . . . . . . . . . . . . . . . . . . . . . . . . . . . . . . . . . . . . . . . . . 89SAPSetPlanParameter. . . . . . . . . . . . . . . . . . . . . . . . . . . . . . . . . . . . . . . . . . . . . . . . . . . . . . . . 90SAPSetRefreshBehaviour. . . . . . . . . . . . . . . . . . . . . . . . . . . . . . . . . . . . . . . . . . . . . . . . . . . . . . 91SAPSetVariable. . . . . . . . . . . . . . . . . . . . . . . . . . . . . . . . . . . . . . . . . . . . . . . . . . . . . . . . . . . . . 92SAPSuppressMessage. . . . . . . . . . . . . . . . . . . . . . . . . . . . . . . . . . . . . . . . . . . . . . . . . . . . . . . . 93Table Design API. . . . . . . . . . . . . . . . . . . . . . . . . . . . . . . . . . . . . . . . . . . . . . . . . . . . . . . . . . . . 94Using Analysis functions. . . . . . . . . . . . . . . . . . . . . . . . . . . . . . . . . . . . . . . . . . . . . . . . . . . . . . 100Hiding / Showing Analysis UI components. . . . . . . . . . . . . . . . . . . . . . . . . . . . . . . . . . . . . . . . . .102Enhancing the Analysis Ribbon. . . . . . . . . . . . . . . . . . . . . . . . . . . . . . . . . . . . . . . . . . . . . . . . . .102Using BAdI information. . . . . . . . . . . . . . . . . . . . . . . . . . . . . . . . . . . . . . . . . . . . . . . . . . . . . . . 103Using Callbacks. . . . . . . . . . . . . . . . . . . . . . . . . . . . . . . . . . . . . . . . . . . . . . . . . . . . . . . . . . . . 105Using LastError information. . . . . . . . . . . . . . . . . . . . . . . . . . . . . . . . . . . . . . . . . . . . . . . . . . . .109Syntax for Entering Values. . . . . . . . . . . . . . . . . . . . . . . . . . . . . . . . . . . . . . . . . . . . . . . . . . . . . 111
4 Analyzing Data. . . . . . . . . . . . . . . . . . . . . . . . . . . . . . . . . . . . . . . . . . . . . . . . . . . . . . . . . . . . . . . 1134.1 Analyzing data with the design panel. . . . . . . . . . . . . . . . . . . . . . . . . . . . . . . . . . . . . . . . . . . . . . . . 113
The Analysis tab. . . . . . . . . . . . . . . . . . . . . . . . . . . . . . . . . . . . . . . . . . . . . . . . . . . . . . . . . . . . 113The Property View on the Analysis tab. . . . . . . . . . . . . . . . . . . . . . . . . . . . . . . . . . . . . . . . . . . . . 115The Information tab. . . . . . . . . . . . . . . . . . . . . . . . . . . . . . . . . . . . . . . . . . . . . . . . . . . . . . . . . . 117The Components tab. . . . . . . . . . . . . . . . . . . . . . . . . . . . . . . . . . . . . . . . . . . . . . . . . . . . . . . . . 118The Design Rules tab. . . . . . . . . . . . . . . . . . . . . . . . . . . . . . . . . . . . . . . . . . . . . . . . . . . . . . . . . 123Pausing Refresh. . . . . . . . . . . . . . . . . . . . . . . . . . . . . . . . . . . . . . . . . . . . . . . . . . . . . . . . . . . . 123Managing components in the design panel. . . . . . . . . . . . . . . . . . . . . . . . . . . . . . . . . . . . . . . . . 124Managing system connections in the design panel. . . . . . . . . . . . . . . . . . . . . . . . . . . . . . . . . . . . 126
4.2 Prompting. . . . . . . . . . . . . . . . . . . . . . . . . . . . . . . . . . . . . . . . . . . . . . . . . . . . . . . . . . . . . . . . . . . 127To define prompt values. . . . . . . . . . . . . . . . . . . . . . . . . . . . . . . . . . . . . . . . . . . . . . . . . . . . . . 128Using Variants. . . . . . . . . . . . . . . . . . . . . . . . . . . . . . . . . . . . . . . . . . . . . . . . . . . . . . . . . . . . . 130To select workbook properties for prompting. . . . . . . . . . . . . . . . . . . . . . . . . . . . . . . . . . . . . . . .133
4.3 Filtering data . . . . . . . . . . . . . . . . . . . . . . . . . . . . . . . . . . . . . . . . . . . . . . . . . . . . . . . . . . . . . . . . .135Filtering members. . . . . . . . . . . . . . . . . . . . . . . . . . . . . . . . . . . . . . . . . . . . . . . . . . . . . . . . . . . 135Filtering measures. . . . . . . . . . . . . . . . . . . . . . . . . . . . . . . . . . . . . . . . . . . . . . . . . . . . . . . . . . 143To work with BEx conditions in Analysis. . . . . . . . . . . . . . . . . . . . . . . . . . . . . . . . . . . . . . . . . . . .147To show/hide zeros in rows and columns. . . . . . . . . . . . . . . . . . . . . . . . . . . . . . . . . . . . . . . . . . 148
4.4 Sorting data. . . . . . . . . . . . . . . . . . . . . . . . . . . . . . . . . . . . . . . . . . . . . . . . . . . . . . . . . . . . . . . . . 149To sort values. . . . . . . . . . . . . . . . . . . . . . . . . . . . . . . . . . . . . . . . . . . . . . . . . . . . . . . . . . . . . . 150To sort members. . . . . . . . . . . . . . . . . . . . . . . . . . . . . . . . . . . . . . . . . . . . . . . . . . . . . . . . . . . . 151
4.5 Working with hierarchies. . . . . . . . . . . . . . . . . . . . . . . . . . . . . . . . . . . . . . . . . . . . . . . . . . . . . . . . . 151To include dimensions with hierarchies in an analysis. . . . . . . . . . . . . . . . . . . . . . . . . . . . . . . . . . 153To display single dimensions as hierarchy. . . . . . . . . . . . . . . . . . . . . . . . . . . . . . . . . . . . . . . . . . 154
4 P U B L I CAnalysis Plug-in User Guide
Content

4.6 Calculating new measures . . . . . . . . . . . . . . . . . . . . . . . . . . . . . . . . . . . . . . . . . . . . . . . . . . . . . . . 156To calculate a new measure based on available measures. . . . . . . . . . . . . . . . . . . . . . . . . . . . . . .156To add a new measure based on one available measure. . . . . . . . . . . . . . . . . . . . . . . . . . . . . . . . 157To add a new measure based on free-form calculation. . . . . . . . . . . . . . . . . . . . . . . . . . . . . . . . . 159To add a restricted measure . . . . . . . . . . . . . . . . . . . . . . . . . . . . . . . . . . . . . . . . . . . . . . . . . . . 160
4.7 Defining Conditional Formatting. . . . . . . . . . . . . . . . . . . . . . . . . . . . . . . . . . . . . . . . . . . . . . . . . . . .161To define a conditional format. . . . . . . . . . . . . . . . . . . . . . . . . . . . . . . . . . . . . . . . . . . . . . . . . . 162To edit conditional formats. . . . . . . . . . . . . . . . . . . . . . . . . . . . . . . . . . . . . . . . . . . . . . . . . . . . 163
4.8 Defining the display of members, measures and totals. . . . . . . . . . . . . . . . . . . . . . . . . . . . . . . . . . . 163To define the members display. . . . . . . . . . . . . . . . . . . . . . . . . . . . . . . . . . . . . . . . . . . . . . . . . .164Defining the measures display. . . . . . . . . . . . . . . . . . . . . . . . . . . . . . . . . . . . . . . . . . . . . . . . . . 165Defining the totals display. . . . . . . . . . . . . . . . . . . . . . . . . . . . . . . . . . . . . . . . . . . . . . . . . . . . . 168
4.9 To jump to a target with Goto. . . . . . . . . . . . . . . . . . . . . . . . . . . . . . . . . . . . . . . . . . . . . . . . . . . . . 1704.10 To comment a data cell. . . . . . . . . . . . . . . . . . . . . . . . . . . . . . . . . . . . . . . . . . . . . . . . . . . . . . . . . . 171
5 Analyzing SAP HANA data. . . . . . . . . . . . . . . . . . . . . . . . . . . . . . . . . . . . . . . . . . . . . . . . . . . . . . 1735.1 Analyzing SAP HANA data sources. . . . . . . . . . . . . . . . . . . . . . . . . . . . . . . . . . . . . . . . . . . . . . . . . 173
6 Planning Data. . . . . . . . . . . . . . . . . . . . . . . . . . . . . . . . . . . . . . . . . . . . . . . . . . . . . . . . . . . . . . . 1746.1 To plan data manually. . . . . . . . . . . . . . . . . . . . . . . . . . . . . . . . . . . . . . . . . . . . . . . . . . . . . . . . . . .1756.2 To plan data with planning objects . . . . . . . . . . . . . . . . . . . . . . . . . . . . . . . . . . . . . . . . . . . . . . . . . .1776.3 To recalculate planning data . . . . . . . . . . . . . . . . . . . . . . . . . . . . . . . . . . . . . . . . . . . . . . . . . . . . . . 1796.4 To save planning data . . . . . . . . . . . . . . . . . . . . . . . . . . . . . . . . . . . . . . . . . . . . . . . . . . . . . . . . . . 1796.5 Locking Cells. . . . . . . . . . . . . . . . . . . . . . . . . . . . . . . . . . . . . . . . . . . . . . . . . . . . . . . . . . . . . . . . . 180
Front-End Cell Locks. . . . . . . . . . . . . . . . . . . . . . . . . . . . . . . . . . . . . . . . . . . . . . . . . . . . . . . . . 180Back-End Cell Locks. . . . . . . . . . . . . . . . . . . . . . . . . . . . . . . . . . . . . . . . . . . . . . . . . . . . . . . . . 181To lock cells. . . . . . . . . . . . . . . . . . . . . . . . . . . . . . . . . . . . . . . . . . . . . . . . . . . . . . . . . . . . . . . 181
6.6 Setting the Work Status. . . . . . . . . . . . . . . . . . . . . . . . . . . . . . . . . . . . . . . . . . . . . . . . . . . . . . . . . 182To set a work status. . . . . . . . . . . . . . . . . . . . . . . . . . . . . . . . . . . . . . . . . . . . . . . . . . . . . . . . . 183
6.7 To undo changes while planning data . . . . . . . . . . . . . . . . . . . . . . . . . . . . . . . . . . . . . . . . . . . . . . . 1846.8 To switch between display and change mode. . . . . . . . . . . . . . . . . . . . . . . . . . . . . . . . . . . . . . . . . . 1846.9 Editing short texts in queries. . . . . . . . . . . . . . . . . . . . . . . . . . . . . . . . . . . . . . . . . . . . . . . . . . . . . . 186
7 Creating Presentations. . . . . . . . . . . . . . . . . . . . . . . . . . . . . . . . . . . . . . . . . . . . . . . . . . . . . . . . 1877.1 To smart paste a data source. . . . . . . . . . . . . . . . . . . . . . . . . . . . . . . . . . . . . . . . . . . . . . . . . . . . . 1887.2 Presentation settings. . . . . . . . . . . . . . . . . . . . . . . . . . . . . . . . . . . . . . . . . . . . . . . . . . . . . . . . . . . 189
8 Creating Web Applications. . . . . . . . . . . . . . . . . . . . . . . . . . . . . . . . . . . . . . . . . . . . . . . . . . . . . 190
9 Using Analysis in other SAP BusinessObjects Applications. . . . . . . . . . . . . . . . . . . . . . . . . . . . . 1929.1 To save an analysis view. . . . . . . . . . . . . . . . . . . . . . . . . . . . . . . . . . . . . . . . . . . . . . . . . . . . . . . . . 1929.2 To insert an analysis view. . . . . . . . . . . . . . . . . . . . . . . . . . . . . . . . . . . . . . . . . . . . . . . . . . . . . . . . 1939.3 To export a data source to the SAP BusinessObjects Design Studio. . . . . . . . . . . . . . . . . . . . . . . . . . 194
Analysis Plug-in User GuideContent P U B L I C 5

10 Scheduling. . . . . . . . . . . . . . . . . . . . . . . . . . . . . . . . . . . . . . . . . . . . . . . . . . . . . . . . . . . . . . . . . .19510.1 Precalculation Restrictions. . . . . . . . . . . . . . . . . . . . . . . . . . . . . . . . . . . . . . . . . . . . . . . . . . . . . . . 196
11 Settings. . . . . . . . . . . . . . . . . . . . . . . . . . . . . . . . . . . . . . . . . . . . . . . . . . . . . . . . . . . . . . . . . . . . 19711.1 User Settings. . . . . . . . . . . . . . . . . . . . . . . . . . . . . . . . . . . . . . . . . . . . . . . . . . . . . . . . . . . . . . . . . 19711.2 Advanced Settings. . . . . . . . . . . . . . . . . . . . . . . . . . . . . . . . . . . . . . . . . . . . . . . . . . . . . . . . . . . . . 19811.3 Platform Settings. . . . . . . . . . . . . . . . . . . . . . . . . . . . . . . . . . . . . . . . . . . . . . . . . . . . . . . . . . . . . . 19911.4 Conversion Settings. . . . . . . . . . . . . . . . . . . . . . . . . . . . . . . . . . . . . . . . . . . . . . . . . . . . . . . . . . . . 20111.5 Support Settings. . . . . . . . . . . . . . . . . . . . . . . . . . . . . . . . . . . . . . . . . . . . . . . . . . . . . . . . . . . . . . 202
12 Troubleshooting. . . . . . . . . . . . . . . . . . . . . . . . . . . . . . . . . . . . . . . . . . . . . . . . . . . . . . . . . . . . . 20512.1 To enable the Analysis Add-In after system crash (Microsoft Office 2010 and higher). . . . . . . . . . . . . 205
6 P U B L I CAnalysis Plug-in User Guide
Content

1 About this guide
1.1 Who should read this guide?
This guide is intended for users interested in building and analyzing workbooks using SAP BusinessObjects Analysis, edition for Microsoft Office.
1.2 User profiles
There are three user profiles for SAP BusinessObjects Analysis, edition for Microsoft Office:
● Workbook CreatorUsers who create and maintain workbooks based on SAP BEx queries, query views and SAP NetWeaver BW InfoProvider.
● Data AnalystUsers who navigate through existing workbooks and analyze the data they contain. They can also include workbooks in a Microsoft PowerPoint presentation and continue the analysis there.
● AdministratorIT specialists who install, configure and administer SAP BusinessObjects Analysis, edition for Microsoft Office. They also assign security rights and authorizations to workbook creators and analyzers.
If your existing profile needs to be modified, contact your IT administrator.
1.3 About the documentation set
The documentation set for SAP BusinessObjects Analysis, edition for Microsoft Office, comprises the following guides and online help products:
TipThe guides and tutorials are regulary updated and enhanced. Make sure that you have the latest version by checking the SAP Help Portal and SAP Community Network on a regular basis.
Administrator Guide
The Administrator Guide contains detailed information that a user needs to install, configure and administer the edition for Microsoft Office. The guide is available on the SAP Help Portal.
Analysis Plug-in User GuideAbout this guide P U B L I C 7

User Guide
The User Guide contains the conceptual information, procedures and reference material that a user needs to create and analyze Microsoft Excel workbooks and Microsoft PowerPoint slides with the edition for Microsoft Office. There are two user guides for Analysis: the Analysis Plug-in User Guide and the EPM Plug-in User Guide. The guides are available on the SAP Help Portal.
Online Help
The online help contains the same information as the User Guide. It is included in the plug-ins. To access context sensitive help, move the mouse cursor to a field in the ribbon and select F1. For dialogs, you can access context sensitive help by selecting F1 when the dialog is open.
What's New Guide
The What's New guide for SAP BusinessObjects Analysis, edition for Microsoft Office, provides a complete list of the new and modified features for SAP BusinessObjects Analysis since the previous release. The guide is available on the SAP Help Portal.
eLearning Tutorials
The tutorials show you how to use SAP BusinessObjects Analysis. They give you a quick introduction to different features so that you can learn the basics of working with the Add-In. They also give you a first impression of the look and feel. The tutorials are available in the SAP Community Network at http://scn.sap.com/docs/DOC-7679?refer=product-help .
8 P U B L I CAnalysis Plug-in User Guide
About this guide

2 Getting Started
2.1 What is SAP BusinessObjects Analysis, edition for Microsoft Office?
SAP BusinessObjects Analysis, edition for Microsoft Office, is a Microsoft Office Add-In that allows multidimensional analysis of OLAP sources. It consists of the following components:
● Analysis Plug-in● Enterprise Performance Management Plug-in● Business Planning and Consolidation plug-in
The plug-ins include versions for Microsoft Excel and Microsoft PowerPoint. They are installed in one common installation. After the installation, the Analysis plug-in and the Enterprise Performance Management (EPM) plug-in are available as separate tabs in the ribbon. The Business Planning and Consolidation plug-in is available in the interface as a pane named Activity.
In the edition for Microsoft Excel, you can use the plug-ins in one workbook. The sheet type defines which plug-in is active. The available sheet types are: Analysis, EPM, Neutral and Non-COF. Empty sheets are defined as neutral. If you add a data source into a neutral sheet with one plug-in, the corresponding sheet type is assigned. If you switch within a workbook to a sheet of another type, the respective plug-in is enabled automatically. To reset a sheet to type neutral, you have to remove all inserted data sources from the sheet.
Sheets of type Non-COF are not checked from the Analysis Add-In. It might be useful to assign this type to sheets that do not contain Analysis content to improve the performance.
In the edition for Microsoft PowerPoint, you can add data sources with the plug-ins into one presentation and define the analysis with the respective plug-in.
The Business Planning and Consolidation plug-in pane can be displayed for each tab in the Ribbon: Analysis and EPM.
2.2 Introduction to the Analysis Plug-in
The Analysis plug-in allows multidimensional analysis of OLAP sources in Microsoft Excel, MS Excel workbook application design, and intuitive creation of BI presentations with MS PowerPoint. The Plug-in is available for the following Microsoft Office versions:
● Microsoft Office 2016 (Excel and PowerPoint)● Microsoft Office 2013 (Excel and PowerPoint)● Microsoft Office 2010 (Excel and PowerPoint)
In the Analysis plug-in, you can use SAP Queries, query views and InfoProvider as data sources. The data is displayed in the workbook in crosstabs. You can insert multiple crosstabs in a workbook with data from different
Analysis Plug-in User GuideGetting Started P U B L I C 9

sources and systems. If the workbook will be used by different users, it is also helpful to add info fields with information on the data source and filter status.
Using the design panel, you can analyze the data and change the view on the displayed data. You can add and remove dimensions and measures to be displayed easily with drag and drop. To avoid single refreshes after each step, you can pause the refresh to build a crosstab. After ending the pause, all changes are applied at once.
You can refine your analysis using conditional formatting, filter, prompting, calculations and display hierarchies. You can also add charts to your analysis. If you want to keep a status of your navigation, you can save it as an analysis view. Other users can then reuse your analysis.
For more sophisticated workbook design, the Analysis plug-in contains a dedicated set of functions in Microsoft Excel to access data and meta data of connected BW systems. There are also a number of API functions available that you can use with the Visual Basic Editor, to filter data and set values for BW variables.
You can also plan business data based on the current data in your data source. You can enter the planning data manually and you can enter planning data automatically using planning functions and planning sequences of SAP BW Integrated Planning.
The Analysis plug-in, must be installed on your local machine. You can connect directly to a SAP BW system or you can connect via a to include data sources. You can use the following platforms to store and share workbooks and presentations: SAP BusinessObjects business intelligence platform, SAP NetWeaver platform and SAP BW/4HANA.
Using the business intelligence platform enables you to save workbooks and presentations with their navigation state in a central management system and to reuse these analysis views in other applications such as SAP Crystal Reports or Analysis, OLAP edition.
To get a first impression of the look and feel of the Plug-in, you can have a look at the Analysis eLearning tutorials. They are available in the SAP Community Network at http://scn.sap.com/docs/DOC-7679 .
2.3 Working with Analysis in Microsoft Excel
In Microsoft Excel, Analysis is available as a separate tab in the ribbon. The ribbon is part of the Microsoft Office user interface above the main work area that presents commands and options. Some Analysis options are available in the ribbon tab under File Analysis in Microsoft Excel.
This guide describes procedures using the ribbon. Most of the options are also available via the context menu.
The Analysis tab contains the following groups:
● Data Source● Actions● Data Analysis● Display● Format● Insert● Tools● Planning● Design Panel
10 P U B L I CAnalysis Plug-in User Guide
Getting Started

The following table describe the options that are available in the ribbon tab under File Analysis .
Analysis in the File tab
Table 1:
Icon Description
Open Data Source
More information: To insert a data source into a default workbook [page 24]
Open Workbook
This icon is displayed if only one platform is enabled.
More information: To open a workbook [page 32]
Open Workbook
Open Workbook from SAP BusinessObjects BI Platform.
This icon is displayed if both platforms are enabled.
Open Workbook
Open Workbook from SAP NetWeaver.
This icon is displayed if both platforms are enabled.
Convert BEx Workbook
Convert BEx workbook to Analysis workbook.
More information: To convert a BEx workbook [page 38]
Save Workbook
This icon is displayed if only one platform is enabled.
More information: To save a workbook [page 33]
Save Workbook
Save Workbook to SAP BusinessObjects BI Platform.
This icon is displayed if both platforms are enabled.
Save Workbook
Save Workbook to SAP NetWeaver.
This icon is displayed if both platforms are enabled.
Settings
Edit settings.
More information:Settings [page 197]
About Analysis
View details of the installed version of Analysis.
Analysis Plug-in User GuideGetting Started P U B L I C 11

Icon Description
Help
Launch help.
The following tables describe the groups in the Analysis tab and their options.
Data Source group
Table 2:
Icon Description
Insert Data Source
Insert data from a source system into a crosstab.
More information: To insert a data source in a workbook [page 23]
Refresh All
Refresh all data sources. The data sources are updated with the corresponding data from the server and the crosstabs are redrawn.
More information: The Components tab [page 118]
Workspaces - Create Local Provider
More information: To create a local provider [page 29]
Workspaces - Reload Local Provider
More information: To reload data in a local provider [page 30]
Workdspaces - Add Local Provider to Data Source
More information: To create a CompositeProvider [page 31]
Actions group
Table 3:
Icon Description
Undo
Undo last Analysis step.
Redo
Redo last Analysis step.
12 P U B L I CAnalysis Plug-in User Guide
Getting Started

Icon Description
Messages
Display a dialog with error, warning and information messages.
You have the following options:
● Select Messages Show Messages to display the messages in a dialog.
● Select Messages Show Workbook Profiling Statistics to display the workbook profiling statistics.
● Select Messages Show Client Profiling Statistics to display the client profiling statistics.
More information on Profiling: Support Settings [page 202]
Data Analysis group
Table 4:
Icon Description
Prompts
Enter values for query parameters and variables.
More information: Prompting [page 127]
Filter
Define filter criteria for data.
More information:To filter data by measure [page 144] / To filter data by member [page 136]
Sort
Sort data.
More information: Sorting data [page 149]
Hierarchy
Define hierarchy options such as expansion level and parent member positions.
More information: Working with hierarchies [page 151]
Calculations
Define simple calculations (+,-,*,/) and dynamic calculations (for example, ranking and cumulation.
More information: Calculating new measures [page 156]
Analysis Plug-in User GuideGetting Started P U B L I C 13
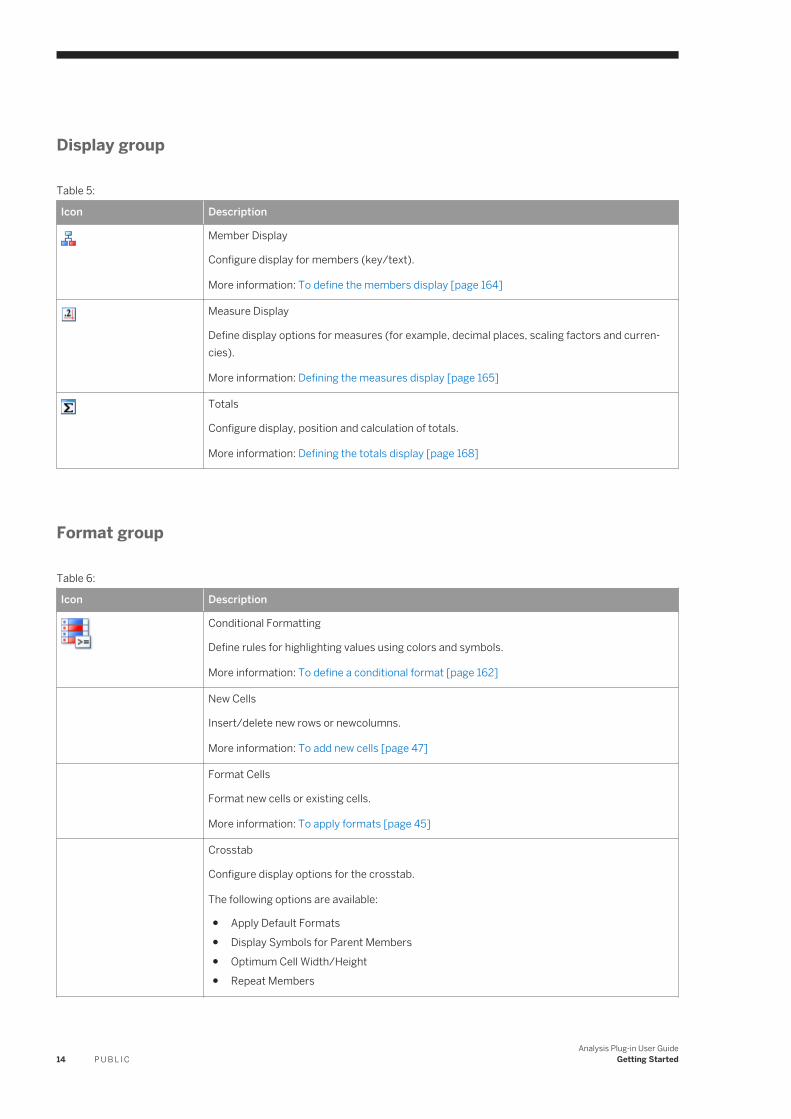
Display group
Table 5:
Icon Description
Member Display
Configure display for members (key/text).
More information: To define the members display [page 164]
Measure Display
Define display options for measures (for example, decimal places, scaling factors and currencies).
More information: Defining the measures display [page 165]
Totals
Configure display, position and calculation of totals.
More information: Defining the totals display [page 168]
Format group
Table 6:
Icon Description
Conditional Formatting
Define rules for highlighting values using colors and symbols.
More information: To define a conditional format [page 162]
New Cells
Insert/delete new rows or newcolumns.
More information: To add new cells [page 47]
Format Cells
Format new cells or existing cells.
More information: To apply formats [page 45]
Crosstab
Configure display options for the crosstab.
The following options are available:
● Apply Default Formats● Display Symbols for Parent Members● Optimum Cell Width/Height● Repeat Members
14 P U B L I CAnalysis Plug-in User Guide
Getting Started
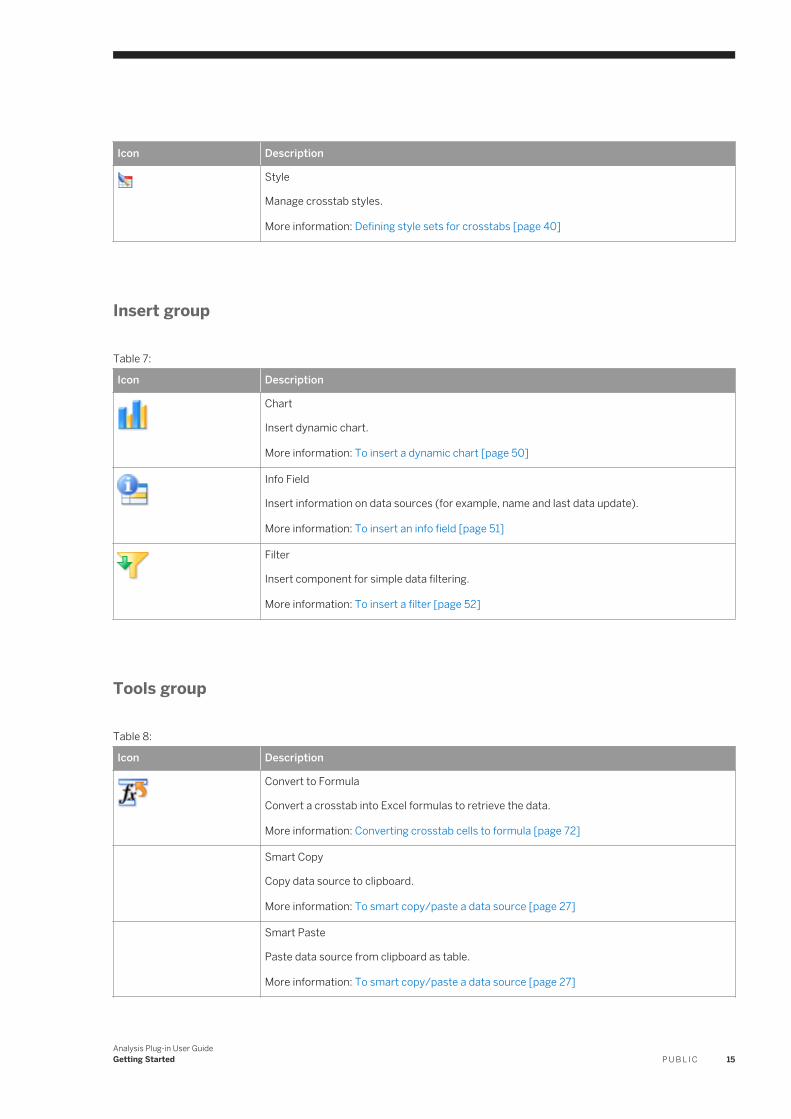
Icon Description
Style
Manage crosstab styles.
More information: Defining style sets for crosstabs [page 40]
Insert group
Table 7:
Icon Description
Chart
Insert dynamic chart.
More information: To insert a dynamic chart [page 50]
Info Field
Insert information on data sources (for example, name and last data update).
More information: To insert an info field [page 51]
Filter
Insert component for simple data filtering.
More information: To insert a filter [page 52]
Tools group
Table 8:
Icon Description
Convert to Formula
Convert a crosstab into Excel formulas to retrieve the data.
More information: Converting crosstab cells to formula [page 72]
Smart Copy
Copy data source to clipboard.
More information: To smart copy/paste a data source [page 27]
Smart Paste
Paste data source from clipboard as table.
More information: To smart copy/paste a data source [page 27]
Analysis Plug-in User GuideGetting Started P U B L I C 15

Icon Description
Save View
Save data source as view.
More information: To save a query view [page 35]
Planning group
This group is optional. You can configure in the user settings if this group should be displayed in the ribbon or not.
Table 9:
Icon Description
Save Data
Save plan values to InfoProvider.
More information: To save planning data [page 179]
Recalculate
Recalculate plan values.
More information: To recalculate planning data [page 179]
Lock Cells
Lock and unlock input-ready cells.
More information: To lock cells [page 181]
Work Status
Change the work status of the data source/selected cells.
More information: Setting the Work Status [page 182]
Display
Switch all data sources to display mode.
More information: To switch between display and change mode [page 184]
Change
Switch all data sources to change mode.
More information: To switch between display and change mode [page 184]
Back
Reset edited cells.
More information: To undo changes while planning data [page 184]
16 P U B L I CAnalysis Plug-in User Guide
Getting Started

Design Panel group
Table 10:
Icon Description
Display
Show/hide Design Panel
More information: Analyzing data with the design panel [page 113]
Pause Refresh
Activate/deactivate automatic refresh after each navigation step in the Design Panel.
More information: Analyzing data with the design panel [page 113]
2.4 Working with Analysis in Microsoft PowerPoint
In Microsoft PowerPoint, Analysis is available as a separate tab in the ribbon. The ribbon is part of the Microsoft Office user interface above the main work area that presents commands and options. Some Analysis options are available in the ribbon tab under File Analysis in Microsoft PowerPoint.
This guide describes procedures using the ribbon. Most of the options are also available via the context menu.
The Analysis tab contains the following groups: :
● Data Source● Actions● Data Analysis● Display● Insert● Tools● Presentation
The following table describe the options that are available in the ribbon tab under File Analysis .
Analysis in the File tab
Table 11:
Icon Description
Open Presentation
This icon is displayed if only one platform is enabled.
Analysis Plug-in User GuideGetting Started P U B L I C 17
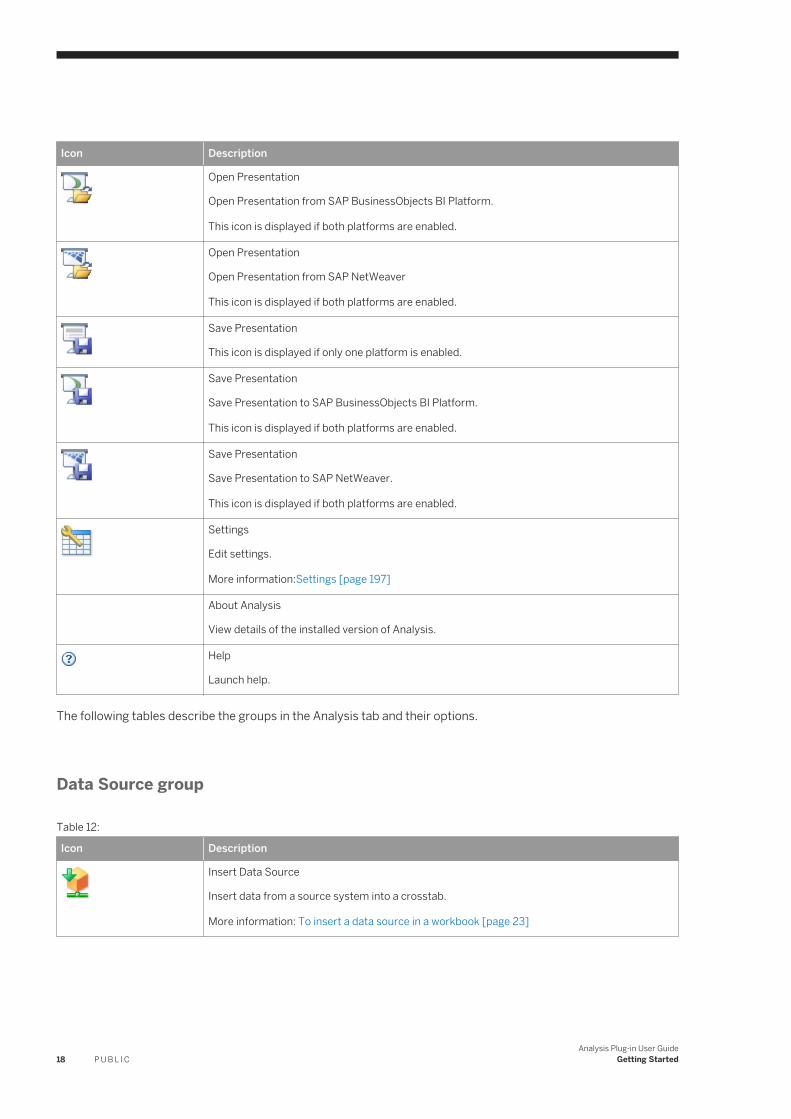
Icon Description
Open Presentation
Open Presentation from SAP BusinessObjects BI Platform.
This icon is displayed if both platforms are enabled.
Open Presentation
Open Presentation from SAP NetWeaver
This icon is displayed if both platforms are enabled.
Save Presentation
This icon is displayed if only one platform is enabled.
Save Presentation
Save Presentation to SAP BusinessObjects BI Platform.
This icon is displayed if both platforms are enabled.
Save Presentation
Save Presentation to SAP NetWeaver.
This icon is displayed if both platforms are enabled.
Settings
Edit settings.
More information:Settings [page 197]
About Analysis
View details of the installed version of Analysis.
Help
Launch help.
The following tables describe the groups in the Analysis tab and their options.
Data Source group
Table 12:
Icon Description
Insert Data Source
Insert data from a source system into a crosstab.
More information: To insert a data source in a workbook [page 23]
18 P U B L I CAnalysis Plug-in User Guide
Getting Started

Icon Description
Refresh All
Refresh all data sources.
More information: The Components tab [page 118]
To open and save existing presentations saved on the business intelligence platform, use the corresponding options in the Microsoft Office button.
Actions group
Table 13:
Icon Description
Undo
Undo last Analysis step.
Redo
Redo last Analysis step.
Messages
Display a dialog with error, warning and information messages.
You have the following options:
● Select Messages Show Messages to display the messages in a dialog.
● Select Messages Show Workbook Profiling Statistics to display the workbook profiling statistics.
● Select Messages Show Client Profiling Statistics to display the client profiling statistics.
More information on Profiling: Support Settings [page 202]
Data Analysis group
Table 14:
Icon Description
Prompts
Enter values for query parameters and variables.
More information:Prompting [page 127]
Analysis Plug-in User GuideGetting Started P U B L I C 19

Icon Description
Filter
Define filter criteria for data.
More information:To filter data by measure [page 144]To filter data by member [page 136]
Sort
Sort data.
More information:Sorting data [page 149]
Hierarchy
Define hierarchy options such as expansion level and parent member positions.
More information: Working with hierarchies [page 151]
Display group
Table 15:
Icon Description
Member Display
Configure display for members (key/text).
More information: To define the members display [page 164]
Measure Display
Define display options for measures (for example, decimal places, scaling factors and display currency).
More information: Defining the measures display [page 165]
Totals
Configure display, position and calculation of totals.
More information: Defining the totals display [page 168]
Insert group
Table 16:
Icon Description
Chart
Insert dynamic chart.
More information: To insert a dynamic chart [page 50]
20 P U B L I CAnalysis Plug-in User Guide
Getting Started

Icon Description
Info Field
Insert information on data sources (for example, name and last data update).
More information: To insert an info field [page 51]
Tools group
Table 17:
Icon Description
Fit Table
Abbreviate a table to fit one slide, or split the table across multiple slides.
Move to
Move the selected Analysis object (table, chart or info field) from its current location to different slide in the presentation.
Smart Paste
Paste data source from clipboard.
More information: To smart paste a data source [page 188]
Presentation group
Table 18:
Icon Description
Properties
Configure the properties of this presentation.
More information: Presentation settings [page 189]
Analysis Plug-in User GuideGetting Started P U B L I C 21
3 Creating Workbooks
3.1 Creating and administrating workbooks
You can insert SAP BEx Queries, query views and SAP Netweaver BW InfoProvider as data sources into a workbook. These data sources are stored in a SAP BW system. You can add multiple crosstabs to a worksheet or workbook. The crosstabs can contain data from the same data source or from different sources. You can also use data sources that are stored in different systems in one workbook.
To add a crosstab with data to a workbook, you select a data source in a SAP BW system. You need the appropriate authorizations for the platform you want to use (SAP NetWeaver BW, SAP BW/4HANA or SAP BusinessObjects Business Intelligence), and the relevant SAP BW systems to insert a data source into a workbook. For more information, contact your IT administrator.
You can insert a data source into a standard workbook or default workbook. If you use a default workbook, styles, formatting and the workbook settings that you defined in the default workbook are used when you open a data source.
You can also insert data sources with local data into a workbook. To be analyzed, the local data is uploaded to a BW workspace.
You can save new workbooks either on the SAP BusinessObjects business intelligence platform, on the SAP NetWeaver platform or in a SAP BW/HANA system. Stored workbooks can be opened from the corresponding platforms. They can also be renamed or deleted on the platforms.
You can also convert workbooks created with the SAP BEx Analyzer 3.5 and SAP BEx Analyzer 7.0 to an Analysis workbook.
Related Information
To insert a data source in a workbook [page 23]To insert a data source into a default workbook [page 24]To save a workbook [page 33]To open a workbook [page 32]To rename a workbook [page 36]To delete a workbook [page 36]To convert a BEx workbook [page 38]
22 P U B L I CAnalysis Plug-in User Guide
Creating Workbooks

3.1.1 To insert a data source in a workbook
Procedure
1. Select the cell in the worksheet where the crosstab with the data from the selected data source should be inserted.
2. Select Insert Data Source.The Log on to SAP BusinessObjects BI platform dialog box appears.
3. Log on to the platform you want to use:
○ Enter your User, Password and the WEB Service URL to log on to the business intelligence platform.○ Select Skip to use the SAP NetWeaver platform. Log on to a BW system directly without using the
business intelligence platform. Continue with step 7 if using this log on.
NoteIf you log on with an initial password to a BW system, or your password is expired and needs to be reset, the dialog for changing the password opens automatically.
4. Optional step: Enter System and Authentication.You will normally not be asked to supply this information. However, if you are asked to log on to a special Central Management System (CMS), you can add these two additional fields to the dialog box by selecting Options. Enter the name of your Central Management System in the System field and the authentication type in the Authentication field.
5. Press OK.The Select Data Source dialog box appears.
6. Select a connection in the Show Connections list:
○ If you select All, all available systems, Cubes / InfoProvider and Query / Query views on the business intelligence platform are displayed.
○ If you select System, all available systems on the business intelligence platform are displayed.○ If you select Cube / InfoProvider, all available Cubes and InfoProvider on the business intelligence
platform are displayed.○ If you select Query / Query View, all available Queries and query views on the business intelligence
platform are displayed.○ If you select Local System, all systems in your local SAP Logon are displayed.
7. Select a system and press Next.To select a Query, query view or InfoProvider directly, double-click the object you want to select.The Logon to System dialog box appears.
You can refresh the displayed system list by choosing Refresh in the context menu or pressing F5, for example after adding a new system to the SAP Logon.
8. Enter Client, User and Password in the fields and press OK.If you want to specify the system language, select Options and enter the language in the Language field.
9. Select a data source in the Select Data Source box and press OK.
○ For BW systems, the Select Data Source dialog consists of the following tabs:○ Search
You can select if you want to search for the Description, Technical Name or All.
Analysis Plug-in User GuideCreating Workbooks P U B L I C 23

To retrieve data sources that begin with a specific string, you can type * after a partial string.○ Area○ Role○ Workspaces
On the Search and Role tabs, you can specify the objects to be displayed: All, InfoProvider, Query or Query View.Note that query views have only a technical name.
○ For HANA systems, the Select Data Source dialog consists of the following tabs:○ Search
You can select if you want to search for the Description, Technical Name or All.To retrieve data sources that begin with a specific string, you can type * after a partial string.
○ AreaOn both tabs, you can specify the objects to be displayed: All, Cube, Attribute View or Dimension View.
Results
A new crosstab with the data of the selected data source is inserted into the worksheet. The SAP style set SAP Black&White is used as default. You can now analyze the data and change the displayed data set according to your needs. You can also add other components to your analysis, charts for example.
3.1.2 To insert a data source into a default workbook
You can define a workbook as the default workbook. The styles, formatting and the workbook settings that you defined in the default workbook are used when you open a data source. If you save the default workbook on a server, you can share it with other users.
If you do not define a default workbook, the data source is opened with the SAP standard settings.
To open a data source with the default workbook
1. Open a data source in Analysis.Choose File Analysis Open Data Source .
2. Log on to a platform and system.For more information, see To insert a data source in a workbook [page 23]
3. Select a data source.4. Press OK.
A new workbook with the data from the selected data source is created using the styles, formatting and workbook settings that you defined in the default workbook for the first inserted data source. All elements that you have defined for the first data source of your workbook are displayed with the data from the new selected data source. If the default workbook contains more than one data source, the elements from the other data sources are also displayed with the data from the corresponding data sources.
24 P U B L I CAnalysis Plug-in User Guide
Creating Workbooks

To open a data source without a default workbook
If you do not define a default workbook in the user settings, the data source is opened with the following Analysis default settings:
● The crosstab is inserted starting in cell A1 in the worksheet.● The default style set is used for formatting. SAP style set SAP Black&White is the initial default.
Related Information
To define a default workbook [page 25]
3.1.2.1 To define a default workbook
Procedure
1. Open a workbook and insert a data source.2. Define the styles, formatting and workbook settings that you want to use for your default workbook.
You can insert other elements like charts or formulas for the data source. You can also change the data source alias.
NoteYou can insert more than one data source into a default workbook. The elements and settings from the first data source that you insert, are used as a reference when you open a data source with the default workbook. The elements from the other data sources in the workbook are displayed unchanged when you open a new data source with the default workbook.
3. Save the workbook locally or on a server.4. Choose Settings to open the User Settings dialog.5. Define the location of your default workbook.
Select Browse to browse to your default workbook.6. Press OK.
Results
The selected workbook is defined as the default workbook.
Analysis Plug-in User GuideCreating Workbooks P U B L I C 25

Related Information
User Settings [page 197]
3.1.3 Launching the Query Designer for editing a data source
Context
Directly from Analysis, you can access the BEx Query Designer for queries or the SAP HANA editor for HANA calculation views to open a data source that has been inserted in the current workbook.
You can use this function to check the query definition and to change the definition according to your needs. After saving the changes, you can update the data source in the workbook immediately.
Prerequisites for using this function with SAP BW:
● You use a BEx query as data source.● BEx Query Designer with minimum release 7.20 SP10 or 730 SP3 is installed on your client PC.
Prerequisites for using this function with SAP HANA:
● You use a HANA calculation view as data source.● You use a SAP HANA Web-based Development Workbench editor with minimum release SPS 10.
Procedure
1. Select a crosstab cell.2. Choose Call Query Designer in the ribbon.
If the icon is not displayed in the ribbon Tools group, you can enable it in the Advanced Settings dialog.The Logon dialog for the BEx Query Designer or SAP HANA system appears.
3. Enter your logon data and choose OK to log on.The Query Designer / HANA editor is opened and the data source selected in the workbook is already open and ready to be edited.
4. Edit the query definition and save your changes.5. In Analysis, select a crosstab cell and choose Reset Data Source in the context menu to display the changed
data source.
26 P U B L I CAnalysis Plug-in User Guide
Creating Workbooks
Results
The data is displayed corresponding to the new initial state defined in the BEx Query Designer or SAP HANA Web-based Development Workbench editor.
Related Information
Advanced Settings [page 198]
3.1.4 To smart copy/paste a data source
Prerequisites
You have inserted a data source in Analysis, edition for Microsoft Excel.
Context
You can copy a data source (crosstab or chart) that is currently displayed in the workbook. You can then insert the copied data source in the edition for Microsoft Excel and the edition for Microsoft PowerPoint.
Procedure
1. In the edition for Microsoft Excel, select the crosstab or chart that should be copied.2. Choose Smart Copy.3. Select an empty cell in the sheet and choose Smart Paste.
The copied data source is inserted as crosstab.
Results
The current navigation state of the copied data source is displayed, but it exists independently from the origin. Navigation steps in the original object do not affect the pasted crosstab and vice versa.
In the edition for Microsoft PowerPoint, you can paste a data source as crosstab or chart.
Analysis Plug-in User GuideCreating Workbooks P U B L I C 27
Related Information
Managing components in the design panel [page 124]To smart paste a data source [page 188]
3.1.5 Inserting data sources using BW Workspaces
A BW workspace is a special area in which new models can be created based on a central data provider from the BW system and local data. The aim of workspaces is to bridge the gap between the central requirements and the flexibility required locally.
Queries are usually based on InfoProviders. If you need to add new fields, you have to change these InfoProviders in the BW back-end. BW workspaces enable you to react quickly to new analytical requirements. This means you can add fields to a query without changing the objects in the BW system.
BW workspaces are usually created by the central IT department making a set of InfoProviders available in a workspace and assigning the authorizations for workspaces to business users. By uploading local data, you can create a local provider in a workspace. In a CompositeProvider, you can connect your own data in the local provider with BW data in the workspace. By reloading data to a local provider, the data in the local provider can be updated. This allows you to react quickly to new requirements. The central InfoProviders stored on the BW server expose their data to a workspace. The data in these providers is updated with the newest server data with every refresh.
You can insert all providers of a workspace as a data source in Analysis. They are available in the workspace view on the folder tab when you select a data source in a BW system.
NoteTo create and work with BW workspaces, you need to use a SAP NetWeaver Business Warehouse Accelerator (BWA) or a SAP HANA database.
For more information about creating BW workspaces and authorizations for BW workspaces, see the SAP NetWeaver BW documentation at http://help.sap.com/saphelp_nw73ehp1/helpdata/en/f3/8f492432354fdc913f93e8a2bed4a6/frameset.htm.
Related Information
To create a local provider [page 29]To reload data in a local provider [page 30]To create a CompositeProvider [page 31]
28 P U B L I CAnalysis Plug-in User Guide
Creating Workbooks

3.1.5.1 To create a local provider
Context
You can upload local data to create a local provider. The data in the local provider can then be analyzed with Analysis and you can use the local provider to create a CompositeProvider.
Procedure
1. Open the Microsoft Excel file containing the data you want to upload to a local provider.2. Select the cells you want to upload.
The entries in the first row of the selected range will be defined as column names automatically. You can change these column names in the local provider settings.
3. Select Upload in the Data Source group.4. Log on to the BW system.
The new local provider will be added to a workspace. Log on to the BW system containing the workspace where you want to add the local provider.
5. Select the workspace and press Next.The Details dialog appears.
6. Enter a name for the local provider in the Description field (optional step).7. Enter a technical name for the local provider in the Technical Name field (optional step).
The first part is predefined by the system containing the elements @3 and the workspace prefix.8. In the Column Definition section, you can define the following settings:
○ Column NameThe column name is predefined with the entries in the first row of the uploaded range. You can change the name here. If you change the name, you should also change the entries in your Excel source file to be able to reload data later.
○ MeasureSelect the check box if the column contains measure data.A default entry for the measure is made. It can however be changed manually.
○ TypeFor dimensions, select one of the following types: Time, Date, Dimension, Text (default), Text with Leading Zeros.For measures, select one of the following types: Integer, Decimal, Floating Point Number, Measure.A default entry for the type is made. It can however be changed manually.
○ Type DetailsIf you want to use this local provider to create a CompositeProvider, you can select the InfoProvider object of the workspace where the uploaded data should be linked to. The selection is possible for type Dimension and Measure. For dimensions, you get a list of all dimensions in the workspace to select an object. For measures, the list contains all measures available in the workspace.
9. Press Next.
Analysis Plug-in User GuideCreating Workbooks P U B L I C 29

In the Target Location dialog, you can specify wether the new local provider should be inserted into the current workbook sheet or a new workbook sheet after being created. You can also select that the new local provider is not inserted in a sheet after the creation.
10. Press OK to create the local provider.
Results
The local provider is created in the workspace. You can add it to a workbook as a data source and analyze the data with Analysis.
3.1.5.2 To reload data in a local provider
Context
You can reload data to a local provider to update the data in the provider.
Procedure
1. Open the Microsoft Excel file containing the data you want to upload to a local provider.2. Select the cells you want to reload.
The selected range must contain the same number of columns you used for creating the local provider. The column titles must also be identical.
3. Select Reload in the Data Source group.4. Log on to the BW system.
Log on to the BW system containing the local provider you want to reload.5. Select the workspace and press Next.6. Select the local provider you want to reload.
In the Data Source Details section, you see the defined settings for the local provider. You cannot change the settings when reloading data.If the columns in the selected local provider do not match the selected columns for reloading, a message is displayed.
7. Press Next.In the Target Location dialog, you can specify whether the reloaded local provider should be inserted into the current workboook sheet or a new workbook sheet after reloading. You can also specify that it is not inserted into a sheet after reloading.
8. Press OK to relaod the local provider.
30 P U B L I CAnalysis Plug-in User Guide
Creating Workbooks

Results
The local provider is updated with the reloaded data.
3.1.5.3 To create a CompositeProvider
Context
In a CompositeProvider, you can combine all the data that you want to view in your query. You can use all central BW InfoProviders assigned to the workspace as data providers, as well as your own data assigned to the workspace as local providers.
Procedure
1. Insert the query that you want to enhance with a local provider.The query must belong to the same workspace as the local provider.
2. Select a cell of crosstab.
3. Choose Add Dimension or Add Data Records in the Data Source group.
NoteIf you want to add measure data to a query, we recommend adding it as data records.
The Define Composite Provider Settings dialog appears.4. Select a local provider from the list.
You can specify whether the local providers for all dimensions in the query should be listed, or jus for one dimension that you select in the drop down list.If you select a local provider, the data source details are displayed.
5. Press Next.In the Details dialog, you can enter a description and technical name for the new CompositeProvider and the new data source (composite provider query).The technical name of the composite provider has the same predefined prefix as the local provider. The technical name of the composite provider query starts with the predefined prefix containing the elements $ and the workspace prefix.If you add a local provider to a composite provider, you cannot change the descriptions and technical names. These can only be assigned when the first local provider is added to a query.
6. Press Next.In the Target Location dialog, you can specify whether the CompositeProvider should be inserted into the current workbook sheet or a new one. You can also specify that it should not inserted into a sheet.
7. Press OK to create the CompositeProvider.
Analysis Plug-in User GuideCreating Workbooks P U B L I C 31

NoteYou can use the graphical view or the table view in the BW Workspace Designer to check the field connections.
For more information on the BW Workspace Designer, see the SAP NetWeaver BW documentation at http://help.sap.com/saphelp_nw73ehp1/helpdata/en/93/3bf44f28384d86ace3bb061a14851c/content.htm?frameset=/en/92/e1cfdf93194cf4a298aef9cae66856/frameset.htm
Results
The composite provider is created in the workspace. You can insert it as a data source into a workbook and analyze the data. You can also add new dimension or data records to the composite provider.
3.1.6 To open a workbook
Context
You can open a workbook that is stored on the business intelligence platform or on the SAP NetWeaver platform. This allows you to see the navigation state that was saved with the workbook. You also see the workbook properties that were saved with the workbook. These properties are part of the Component tab in the design panel.
You can navigate through the data and design different views on the data. You can also add new data sources or components.
Procedure
1. Choose File Analysis Open Workbook .
NoteIf all platforms are enabled in your Analysis installation, you will find two icons for opening a workbook, one for each platform.
2. Log on to the selected platform and BW system.3. Select a workbook.
You can search for a workbook name or select a workbook in the platform folder structure.You can refresh the displayed document list by choosing Refresh in the context menu or pressing F5.
○ On the business intelligence platform, the Open Document dialog consists of the following tabs:○ Search
32 P U B L I CAnalysis Plug-in User Guide
Creating Workbooks

You can select if you want to search for the Description, Technical Name or All.If you search a workbook on the BI platform, you may find two different object types: Analysis Workbook or Microsoft Excel Workbook.
○ Folders○ Favorite Folders
○ On the SAP NetWeaver platform, the Open Document dialog consists of the following tabs:○ Search
You can select if you want to search for the Description, Technical Name or All.○ MyDocuments○ Role○ Environment
You can open EPM workbooks saved in the SAP Busisness Planning and Consolidation (BPC) repository.You can access all environments with the respective EPM folder structure (private, public, teams).To change an EPM workbook or save it to the BPC repository, you have to use the EPM plug-in in Analysis.
4. Press OK.The workbook is opened in Analysis.
5. Choose Refresh All to refresh the data sources.
NoteIf the workbook property Refresh Workbook on Opening is selected on the Components tab in the design panel, the refresh is executed automatically. In this case, you do not need to refresh the data sources manually.
Results
The selected workbook is opened in Analysis, and you can start your analysis.
Related Information
Working with Analysis in Microsoft Excel [page 10]The Components tab [page 118]Platform Settings [page 199]
3.1.7 To save a workbook
Context
You can save a workbook on the business intelligence platform, on the SAP NetWeaver platform or as a local file.
Analysis Plug-in User GuideCreating Workbooks P U B L I C 33

If you save a workbook to the BI platform (as of version 4.1), the workbook is saved as an Analysis Workbook object. If you save a workbook to the BI platform 4.0 or former releases, the workbook is saved as Microsoft Excel object.
The workbook is saved with the current navigation state and selected properties. The workbook properties are part of the Component tab in the design panel.
If you want to save a workbook as a local file, you can use the Microsoft Excel functionality choosing File Save As .
The following procedure shows how you can save a workbook on a platform.
Procedure
1. Choose File Analysis Save Workbook .
NoteIf all platforms are enabled in your Analysis installation, you will find two icons for saving a workbook, one for each platform.
2. Log on to the selected platform and BW system.3. Select the location where you want to save the workbook.4. Enter a name and technical name for the workbook.5. Optional step: Select the checkbox Save as 1.x format.
You can save workbooks with the format of former Analysis releases. Then you can open the workbook in a 1.x release. Note that all changes made with functions that are only available as of Analysis 2.0 (for example, Table Design formatting), are deleted if you save workbook as 1.x format.
Note that after saving a workbook in 2.x format, it is no longer possible to save the same workbook to 1.x format. If you want to save a 2.x workbook as 1.x again, you can delete the 2.x version with the context menu in the Save Workbook dialog and then save the workbook in 1.x format.
This option can only be enabled with administration rights. For more information, contact your IT administrator.
6. Press Save.The workbook is saved to the selected platform.
You can refresh the displayed document list by choosing Refresh in the context menu or pressing F5.
Results
The workbook is saved. You and other users with access to the server can open and analyze it.
34 P U B L I CAnalysis Plug-in User Guide
Creating Workbooks

Related Information
Working with Analysis in Microsoft Excel [page 10]The Components tab [page 118]Platform Settings [page 199]
3.1.8 To save a query view
Context
You can save a navigation state of a data source as a query view in a BW system.
Procedure
1. Select a cell of the crosstab.2. Choose Save View.
The Save Query View dialog box appears. If there are already query views based on the same query, they are listed in the dialog box.
NoteIf you are connected to a BI platform server, the view will be saved as analysis view on the BI platform.
3. Enter a name and a description.4. Select Save Variable Values if the values should be saved with the query view.
This option is only selectable if the data source contains variables.5. Press Save to save the query view.
Results
The query view is saved on the same server as the data source.
You can open the query view with Insert Data Source.
You can delete a query view with the context menu in the Save Query View dialog. The system checks if the query view is used in other objects saved on the same server. If the query view is used in an object saved on another server, no message appears.
Analysis Plug-in User GuideCreating Workbooks P U B L I C 35
Related Information
To save an analysis view [page 192]
3.1.9 To rename a workbook
Context
You can rename a workbook on the business intelligence platform and on the SAP NetWeaver platform.
Procedure
1. Choose File Analysis Open Workbook .
NoteIf both platforms are enabled in your Analysis installation, you will find two icons for opening a workbook: one for each platform.
2. Log on to the selected platform and BW system.3. Select the workbook that you want to rename.4. Open the context menu and select Rename.5. Enter a new name for the workbook.
The technical name of a workbook cannot be changed.
Results
The workbook is renamed. You and other users with access to the server can open and analyze it again.
3.1.10 To delete a workbook
Context
You can delete a workbook on the business intelligence platform and on the SAP NetWeaver platform.
36 P U B L I CAnalysis Plug-in User Guide
Creating Workbooks
Procedure
1. Choose File Analysis Open Workbook .
NoteIf both platforms are enabled in your Analysis installation, you will find two icons for opening a workbook, one for each platform.
2. Log on to the selected platform and BW system.3. Select the workbook that you want to delete.4. Open the context menu and select Delete.
Results
The workbook is deleted.
3.1.11 To launch Analysis from a BW system
Context
You can launch Analysis from a BW system in the SAP GUI. Before launching, you can also select the data source that should be displayed in Analysis.
Procedure
1. Log on to a BW system.2. Open the Analysis Launcher.
Execute transaction RAAOE to open the Analysis Excel Launcher.Execute transaction RAAOP to open the Analysis PowerPoint Launcher.
3. Select the Type you want to open with Analysis:The following types can be selected:○ Client Only
If you select this option, Analysis is opened and the connection information (system, client, language, user and password) is transfered to Analysis. Therefore the connected user can open data sources and workbooks (respectively presentations) without logging on again.
○ DocumentIf you select this option, you can select a workbook or presentation in the next step.
○ QueryIf you select this option, you can select a query in the next step.
Analysis Plug-in User GuideCreating Workbooks P U B L I C 37

○ Query ViewIf you select this option, you can select a query view in the next step.
4. Select an object.You can use input help to select an object. Input help lists the objects available in the system depending on the object type selected.
5. Press Execute.
Results
Analysis is opened, and the selected object is displayed. If you have selected type Client Only, no objects are displayed, but you can open a data source or workbook/presentation without logging on to the BW system again.
The BW system switches automatically back to the start menu.
3.1.12 To convert a BEx workbook
Context
You can convert workbooks created with SAP BEx Analyzer 3.5 and SAP BEx Analyzer 7.0 to an Analysis workbook. In the platform settings, you can specify which BEx objects should be converted and you can also specify whether a conversion log should be created.
Procedure
1. Choose File Analysis Convert BEx Workbook .2. Select the SAP NetWeaver BW system and press Next.3. Enter your user and password to log on to the system.4. Select the workbook you want to convert.
You can search for the name or technical name of the workbook or you can select it in a folder. BEx Analyzer
workbooks have the following icon in the workbook list: .5. Press OK.
The conversion starts directly. Depending on your selection in the platform settings, the following objects will be converted:
Table 19:
BEx Analyzer object Analysis object
Workbook Workbook
Data Provider Data Source
38 P U B L I CAnalysis Plug-in User Guide
Creating Workbooks

BEx Analyzer object Analysis object
Item: Grid Crosstab
Chart Chart
Item: List Of Filters Formulas: SAPGetDimensionEffectiveFilter and SAPGetDimensionInfo
Item: Dropdown Box Component: Filter with single member selection
Item: Checkbox Group Component: Filter with multiple member selection
Item: Radio Button Component: Filter with single member selection
Item: Text Different info fields and formulas
Item: Message Formula: SAPListOfMessages
Planning Objects used in item Button Planning Objects
Styles The style is not converted. The converted workbook is displayed with the default Analysis style set.
Item: List of Conditions The list is not converted. The conditions are available as BEx conditions in Analysis and can be activated and deactivated with the menu.
Item: List of Exceptions The list is not converted. The exceptions are available as Conditional Formatting in Analysis and can be activated and deactivated with the menu.
VBA API Customer-specific code is not converted, but it is available in the workbook after the conversion.
Navigation Pane No conversion. You can use the design panel in Analysis.
Item: Dropdown Box (displaying query views) No conversion.
Item: Button No conversion.
Results
After the conversion, the converted workbook is opened in Analysis. You can save the newly created workbook to a platform and continue your analysis.
Related Information
Conversion log [page 40]Conversion Settings [page 201]
Analysis Plug-in User GuideCreating Workbooks P U B L I C 39

3.1.12.1 Conversion log
The conversion log contains the conversion status for all objects in the BEx workbook. In the platform settings, you can specify whether a conversion log should be created during the conversion and whether it should be stored in a visible or hidden sheet in the workbook.
At the top of the conversion log, a message is displayed informing you whether conversion was successful. The ID of the BEx workbook and the selected conversion setting are shown too. Possible selections are to convert all objects, data sources and crosstabs or data sources only.
The objects of the BEx workbook are then displayed with the conversion status in three lists: one for data providers, one for planning objects and one for items (all other objects on the workbook). The list contains the following columns:
● StatusThe status can be Converted, Not Converted or Ignored.
● TypeThe objects type is displayed. Examples are DATAPROVIDER, GRID or NAVIGATION_PANE.
● TextThe technical name of the object is displayed.
● Data Provider / AliasThe alias of the data provider is displayed.
● MessageA message is displayed if the conversion status is Not Converted or Ignored.
ExampleAn object with status Ignored can have the following message: Item not converted due to current conversion settings.
● Sheet RangeYou can select the sheet range to go to the object in the workbook.
3.2 Defining style sets for crosstabs
A style set is a collection of Microsoft Excel cell styles that is applied by Analysis to format the cells of a crosstab. Whenever you insert a new crosstab in a workbook, the styles in the current default style set are used to format the crosstab cells. You can change the applied style set in your analysis. With Analysis, the following style sets and their cell styles are installed:
● SAP Blue (default)● SAP Black&White● SAP Tradeshow Plus● SAP Blue Crystal
By modifying the cell styles of these style sets, you can create your own style sets and share them with other users.
40 P U B L I CAnalysis Plug-in User Guide
Creating Workbooks

3.2.1 SAP cell styles
SAP standard styles
SAP standard styles are available after the installation. You can modify them in the Styles group on the Home tab in Microsoft Excel. They affect the formatting as described in the following table:
Style Name Description
SAPDimensionCell Format for dimension header cells.
SAPMemberCell Format for member cells (non-hierarchical dimensions).
SAPHierarchyCell Format for hierarchical member cells (even levels 0, 2, ...).
SAPHierarchyOddCell Format for hierarchical member cells (odd levels 1, 3, ...) .
SAPMemberTotalCell Format for member total cells.
SAPDataCell Format for data cells.
SAPDataTotalCell Format for data total cells.
SAPExceptionLevel1-9 Format for highlighted cells due to conditional formats (rule priorities 1-9).
SAPEmphasized Format for highlighted data cells (as per query definition).
SAPEmphasizedTotal Format for highlighted total cells (as per query definition).
SAPBorder Format for borders around a crosstab and between header/member and data cells (format for left border is taken).
After changing this style, for example the color, you have to execute Refresh All in the Analysis ribbon to apply the changes.
SAPMessageText Format for the message that is displayed whenever a crosstab cannot be rendered and displayed in the sheet.
SAPFormula Format for inserted single cell fomulas: Insert Filter and Insert Info Field (Data Source Name, Last Data Update and Key Date).
The fomat is not applied for array formulas (Insert Info Field for Effective Filters or Variables) and for fomulas inserted directly into the sheet (manual or as MS Excel function).
SAPEditableDataCell Format for input-ready data cells in planning change mode.
SAPEditableDataTotalCell Format for input-ready total cells in planning change mode.
SAPReadonlyDataCell Format for read-only data cells in planning change mode.
SAPReadonlyDataTotalCell Format for read-only total cells in planning change mode.
SAPLockedDataCell Format for locked data cells in planning change mode.
SAPLockedDataTotalCell Format for locked total cells in planning change mode.
Analysis Plug-in User GuideCreating Workbooks P U B L I C 41
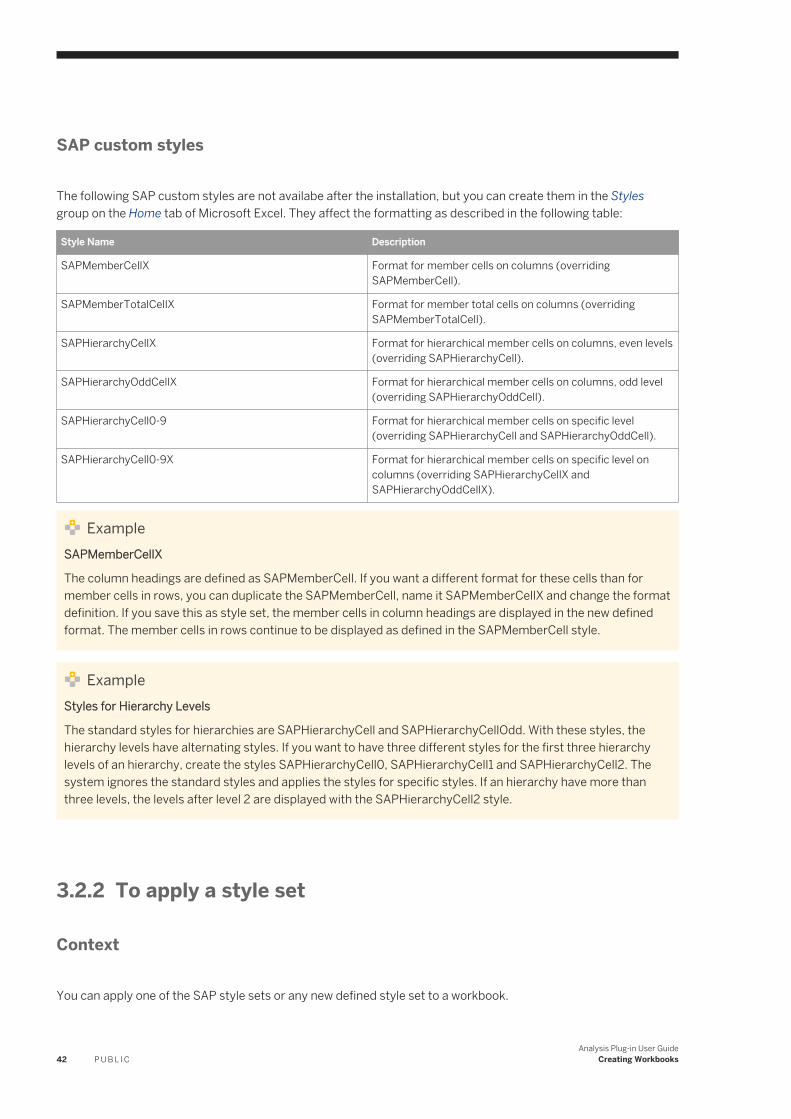
SAP custom styles
The following SAP custom styles are not availabe after the installation, but you can create them in the Styles group on the Home tab of Microsoft Excel. They affect the formatting as described in the following table:
Style Name Description
SAPMemberCellX Format for member cells on columns (overriding SAPMemberCell).
SAPMemberTotalCellX Format for member total cells on columns (overriding SAPMemberTotalCell).
SAPHierarchyCellX Format for hierarchical member cells on columns, even levels (overriding SAPHierarchyCell).
SAPHierarchyOddCellX Format for hierarchical member cells on columns, odd level (overriding SAPHierarchyOddCell).
SAPHierarchyCell0-9 Format for hierarchical member cells on specific level (overriding SAPHierarchyCell and SAPHierarchyOddCell).
SAPHierarchyCell0-9X Format for hierarchical member cells on specific level on columns (overriding SAPHierarchyCellX and SAPHierarchyOddCellX).
ExampleSAPMemberCellX
The column headings are defined as SAPMemberCell. If you want a different format for these cells than for member cells in rows, you can duplicate the SAPMemberCell, name it SAPMemberCellX and change the format definition. If you save this as style set, the member cells in column headings are displayed in the new defined format. The member cells in rows continue to be displayed as defined in the SAPMemberCell style.
ExampleStyles for Hierarchy Levels
The standard styles for hierarchies are SAPHierarchyCell and SAPHierarchyCellOdd. With these styles, the hierarchy levels have alternating styles. If you want to have three different styles for the first three hierarchy levels of an hierarchy, create the styles SAPHierarchyCell0, SAPHierarchyCell1 and SAPHierarchyCell2. The system ignores the standard styles and applies the styles for specific styles. If an hierarchy have more than three levels, the levels after level 2 are displayed with the SAPHierarchyCell2 style.
3.2.2 To apply a style set
Context
You can apply one of the SAP style sets or any new defined style set to a workbook.
42 P U B L I CAnalysis Plug-in User Guide
Creating Workbooks
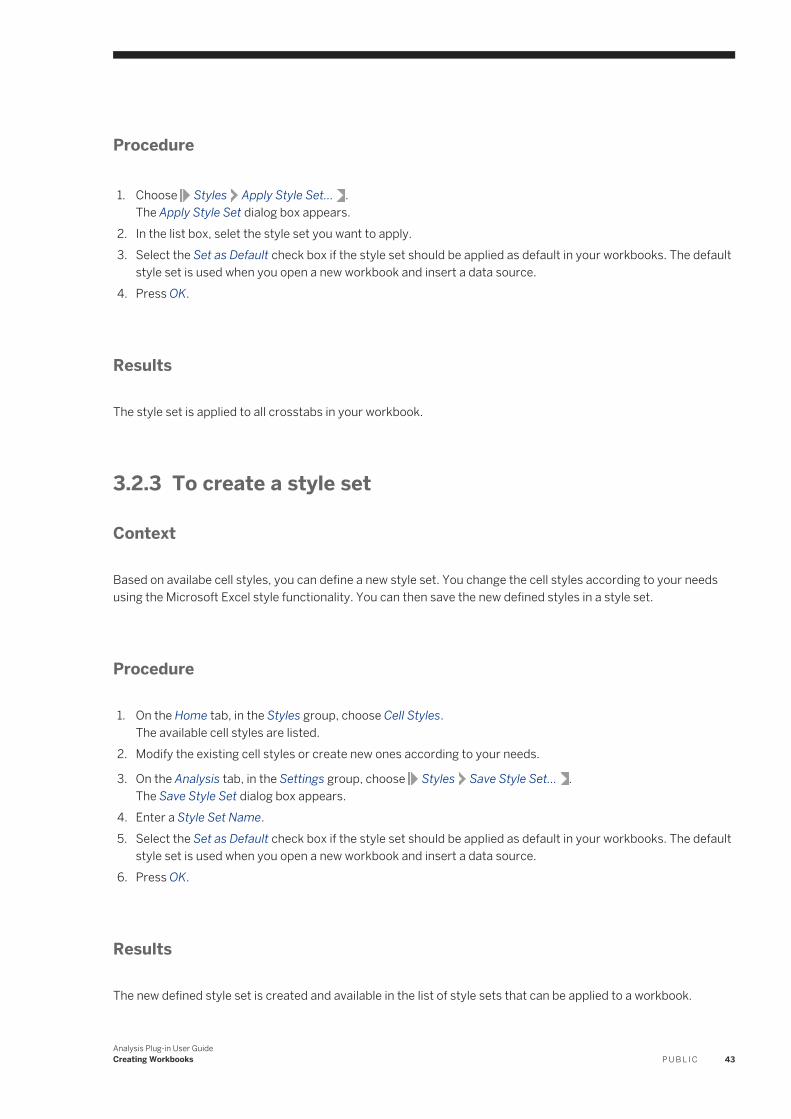
Procedure
1. Choose Styles Apply Style Set... .The Apply Style Set dialog box appears.
2. In the list box, selet the style set you want to apply.3. Select the Set as Default check box if the style set should be applied as default in your workbooks. The default
style set is used when you open a new workbook and insert a data source.4. Press OK.
Results
The style set is applied to all crosstabs in your workbook.
3.2.3 To create a style set
Context
Based on availabe cell styles, you can define a new style set. You change the cell styles according to your needs using the Microsoft Excel style functionality. You can then save the new defined styles in a style set.
Procedure
1. On the Home tab, in the Styles group, choose Cell Styles.The available cell styles are listed.
2. Modify the existing cell styles or create new ones according to your needs.
3. On the Analysis tab, in the Settings group, choose Styles Save Style Set... .The Save Style Set dialog box appears.
4. Enter a Style Set Name.5. Select the Set as Default check box if the style set should be applied as default in your workbooks. The default
style set is used when you open a new workbook and insert a data source.6. Press OK.
Results
The new defined style set is created and available in the list of style sets that can be applied to a workbook.
Analysis Plug-in User GuideCreating Workbooks P U B L I C 43
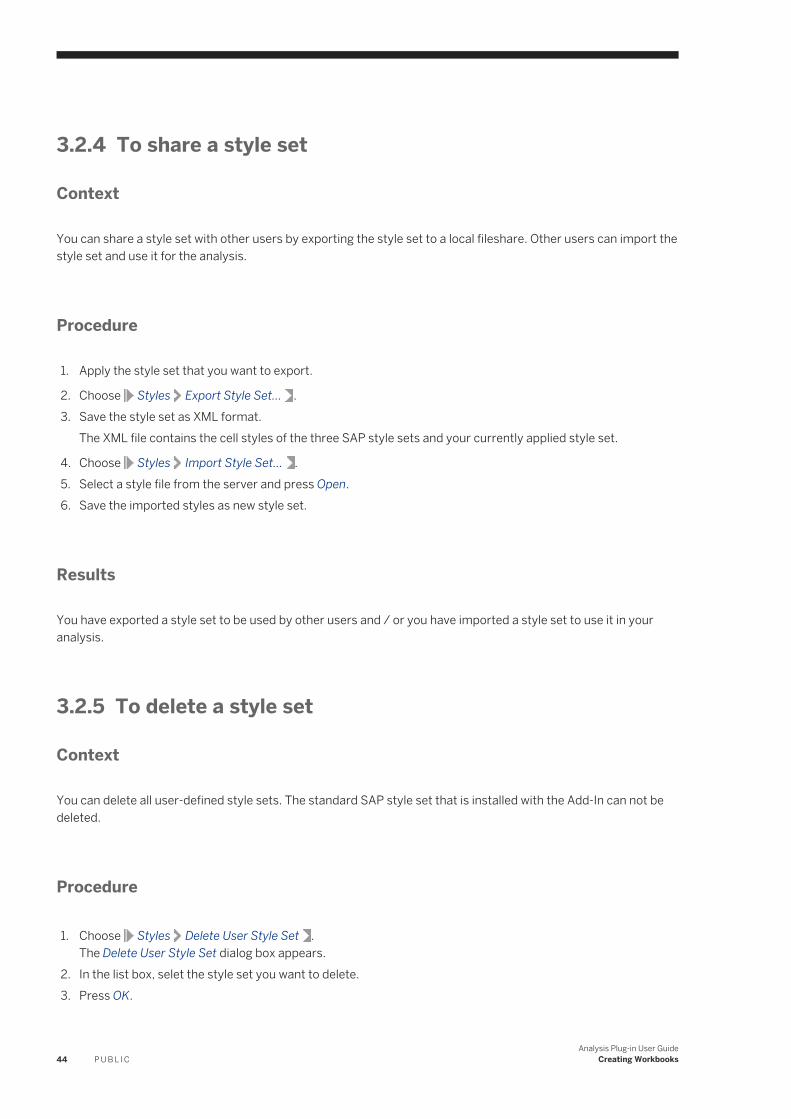
3.2.4 To share a style set
Context
You can share a style set with other users by exporting the style set to a local fileshare. Other users can import the style set and use it for the analysis.
Procedure
1. Apply the style set that you want to export.
2. Choose Styles Export Style Set... .3. Save the style set as XML format.
The XML file contains the cell styles of the three SAP style sets and your currently applied style set.
4. Choose Styles Import Style Set... .5. Select a style file from the server and press Open.6. Save the imported styles as new style set.
Results
You have exported a style set to be used by other users and / or you have imported a style set to use it in your analysis.
3.2.5 To delete a style set
Context
You can delete all user-defined style sets. The standard SAP style set that is installed with the Add-In can not be deleted.
Procedure
1. Choose Styles Delete User Style Set .The Delete User Style Set dialog box appears.
2. In the list box, selet the style set you want to delete.3. Press OK.
44 P U B L I CAnalysis Plug-in User Guide
Creating Workbooks

Results
The style set is deleted and no longer available in the list of style sets that can be applied to a workbook.
3.3 Editing crosstabs with Table Design
Table Design enables you to edit single elements in a crosstab. For example, you can add a new line to the crosstab. The changes made using Table Design persist after navigation steps that force a rebuild of the crosstab, like a refresh or swaping axes.
You can edit crosstabs with the following Table Design options:
● Applying formats to single cells, rows and columns● Adding new lines (rows and columns)● Adding texts in new member cells● Adding formulas in new data cells
You can manage existing Table Design modifications (rules) on the Design Rules tab in the design panel.
You can also remove all Table Design rules manually by choosing Reset Data Source in the context menu.
Related Information
To apply formats [page 45]To add new cells [page 47]To add texts in new member cells [page 48]To add formulas in new data cells [page 49]The Design Rules tab [page 123]
3.3.1 To apply formats
Context
You can apply defined cell styles as format to single cells, rows and columns. You can use and select standard Microsoft Excel cell styles, SAP cell styles and user-defined cell styles.
You cannot apply Table Design formats if Pause Refresh is active.
Analysis Plug-in User GuideCreating Workbooks P U B L I C 45

Procedure
1. Select a cell in the crosstab.Multiple cells cannot be selected.
2. Select Format cells in the Format group in the ribbon.3. In the Format dialog, select the cell range the new format should be applied to.
For a selected dimension header, you have the following options:○ Dimension Header
The format will be applied to the selected cell.○ Dimension Header and All Members
The format will be applied to the selected cell and all members of the dimension.○ All Members
The format will be applied to all dimension members of the selected cell, but not to the selected dimension header cell.
For a selected dimension member, you have the following options:○ Dimension Member
The format will be applied to the selected cell. A dimension member in a crosstab can be a member of a dimension or a measure header.
○ Member and all Dependants on axisThe format will be applied to the selected cell and all its members on the same axis.
○ All Dependants on the Axis for this MemberThe format will be applied to all dimension members of the selected cell, but not to the selected dimension member cell.
For a selected data cell, you have the following option:○ Data Cell
The format will be applied to the selected cell.4. Select the format that should be applied to the defined cells.5. Select OK.
Results
The format is applied to the selected cell range in the crosstab. If a cell is affected by more than one format, the last defined format is visible.
You can change an applied format by selecting the cell and Format cells <defined format> Change/Delete .
The new format is also added as a rule of typeFormats to the Design Rules tab in the design panel. In the design panel, you can activate and deactivate the new rule. You can also delete the rule.
Related Information
The Design Rules tab [page 123]
46 P U B L I CAnalysis Plug-in User Guide
Creating Workbooks

3.3.2 To add new cells
Context
You can insert new lines, rows and columns, into a crosstab. These new lines can be used as layout elements to visually separate report areas. The style information is taken from the triggered context. You can adapt column width, row height and formats for new lines.
New lines can be inserted to the following crosstab elements:
● next to the header sectionThe header section comprises the dimension and measures at the left border of a crosstab before the data cell area. You can insert a row below the header and a column beside the header.
● before and after every dimension● before and after every dimension member
If a dimension member appears several times in a crosstab, the new line is added to each occurrence.● before and after the members of a dimension (dimension group)● before and after a combination of members of different dimensions● before and after every measure● before and after a result line
The new line is connected to the selected element. If you add a new line after a dimension member and you change your analysis so that the member is no longer part of the crosstab, the new line will also no longer be visible. But it is not deleted. The new line will be displayed again if the dimension member is again in the crosstab.
If you connect a new line to all members of a dimension (dimension group), you can remove members from the dimension in the crosstab and the new line will still be in the crosstab as it is connected to the dimension group
New lines cannot be inserted next to a data cell.
Procedure
1. Select a cell in the crosstab where you want to add a new line.2. Select New Cells and the option where you want to locate the new line in the Format group in the ribbon.
Results
The new line is inserted into the crosstab. The context menu for cells in new lines is restricted to table design functions.
To delete a new line, select the added line and New Cells Delete in the Format group.
The new line is also added as a rule of type New Lines to the Design Rules tab in the design panel. In the design panel, you can activate and deactivate the new rule. You can also delete the rule.
Analysis Plug-in User GuideCreating Workbooks P U B L I C 47

Related Information
The Design Rules tab [page 123]
3.3.3 To add texts in new member cells
Context
You can add texts to member cells of new inserted lines.
The display of the new text corresponds to the currently selected display in the crosstab. If the display Text is selected for the dimension, the new text will also be created with display Text. If you change the display in the crosstab to Key, no text will be displayed in the new line. You can add again a new text that will then be created with display Key.
Procedure
1. Select a member cell in the crosstab where you want to add a text.2. Enter the text manually.
Results
The text is added to the cell in the crosstab.
The inserted text is added as a rule of type Texts to the Design Rules tab in the design panel. In the design panel, you can activate and deactivate the new rule. You can also delete the rule.
Related Information
The Design Rules tab [page 123]
48 P U B L I CAnalysis Plug-in User Guide
Creating Workbooks

3.3.4 To add formulas in new data cells
Context
You can add formulas to data cells of new inserted lines.
Procedure
1. Select a data cell in the crosstab where you want to add a formula2. Enter a function.
Enter =SUM to create a sum, for example.
3. Select the cells that you want to use in the function
You can select single cells or a range of cells.
If you select a range of cells, you can remove one or several members that are in the range. The formula will then use the data of the members that are still available in the crosstab.
If you select single cells and you change your analysis later so that one or several of the selected cells are no longer displayed in the crosstab, the formula will return NA.
4. Press Return.
Results
The formula is calculated and added to the cell in the crosstab.
The formula is added as a rule of type Formulas to the Design Rules tab in the design panel. In the design panel, you can activate and deactivate the new rule. You can also delete the rule.
Related Information
The Design Rules tab [page 123]
3.4 Inserting other components
In addition to crosstabs, you can add the following components to your analysis:
Analysis Plug-in User GuideCreating Workbooks P U B L I C 49

● Charts for providing a graphical representation of the data in the crosstab.You can insert a dynamic chart (using the Microsoft Excel functionality) or a waterfall chart.
● Info fields for providing metadata information● Filters or providing simplified filtering for end users
3.4.1 To insert a dynamic chart
Procedure
1. Select a cell of the crosstab you want to visualize in a chart.By inserting a chart with Analysis, the data of the entire crosstab is visualized in the chart. If you want to visualize only a subset of the crosstab data, you can use Microsoft Excel functionality.If you change the data displayed in the crosstab, e.g. with a filter, the chart is adapted automatically.
2. Choose Chart Insert Chart in the ribbon.The chart is added to the analysis. You can position it in the worksheet using drag and drop.
3. Modify the chart.To modify the chart, you can use Microsoft Excel options for charts. For example, you can change the chart type or define a data range for the chart.
4. You can move the chart to another worksheet in the workbook.On the Component tab in the design panel, select the chart you want to move, and open the Move to dialog. Select the sheet that should contain the chart and press OK.
Results
The chart is added to the analysis according to your configuration. The chart is updated automatically when you change the displayed data in the crosstab.
3.4.2 To insert a waterfall chart
Context
A waterfall chart is a specialized type of bar chart. Typically, it can be used to show how an initial value is affected by a series of intermediate positive or negative values. The start and end values are always displayed in a column as totals. The individual interim values are not displayed as subtotals, but as delta values.
In Analysis, the crosstab values of the first key figure are drawn into the waterfall chart cell by cell from top to bottom. Total rows in the crosstab are always ignored. The start and end column are displayed in gray color, negative delta values in red, and positive delta values in green.
You can also insert a waterfall chart for a query with hierarchies. The hierarchy nodes should be expanded upwards. Expanded nodes are displayed as columns and are also displayed in gray color.
50 P U B L I CAnalysis Plug-in User Guide
Creating Workbooks

To insert a meaningful waterfall chart, the crosstab view must meet specific requirements. You can define structures for a query in the BEx Query Designer to create queries that meet these requirements:
● Only one dimension should be in the view.● The first data row should be the desired start column in the waterfall chart.● The last data row should be the desired end column in the waterfall chart.● The intermediate data rows should represent delta values showing the changes between the start and end
column.
Procedure
1. Select a cell of the crosstab that you want to visualize in a waterfall chart.For the waterfall chart, the data of the first key figure in the crosstab will be used.
2. To insert a vertical waterfall chart, choose Chart Insert Waterfall Chart from the ribbon.
To insert a horizontal waterfall chart, choose Chart Insert Pivoted Waterfall Chart .The chart is added to the analysis. You can position it in the worksheet using drag and drop.
If you change the data of the first key figure displayed in the crosstab, e.g. by expanding a hierarchy node, the chart is adapted automatically.
NoteYou should not modify the waterfall chart using Microsoft Excel options for charts.
3. You can move the chart to another worksheet in the workbook.On the Component tab in the design panel, select the chart you want to move, and open the Move to dialog. Select the sheet that should contain the chart and press OK.
Results
The chart is added to the analysis according to your configuration. The chart is updated automatically when you change the displayed data in the crosstab.
3.4.3 To insert an info field
Context
You can insert information fields to provide additional information on data displayed in the workbook sheets.
Analysis Plug-in User GuideCreating Workbooks P U B L I C 51

Procedure
1. Select an empty cell where you want to place the info field.2. Select the info field you want to insert.
○ Choose Info Field and one of the listed fields: Data Source Name, Last Data Update, Key Date, Effective Filters, Variables. If you want to insert other info fields, use the second option.The info field is added to worksheet. If you use more than one data source in your analysis, you are prompted to select a data source.For MultiProviders, two dates are inserted as Last Data Update. The date when all InfoProviders of the MultiProvider were updated successfully for the last time (LastDataUpdate) and the date when a single InfoProvider of the MultiProvider was updated for the last time (LastDataUpdateMaximum).
○ You can also drag and drop the info fields from the Information tab in the design panel to a cell in the worksheet.Select the data source on the top of the tab and drag and drop the information you want to insert as info field. For dynamic info fields (filters and variables), you have to use the first option.
Results
The info fields are inserted with label and source information. The functions used for the formulas are SAPGetInfoLabel and SAPGetSourceInfo. The formulas are created automatically.
3.4.4 To insert a filter
Context
You can insert a filter component to your analysis to simplify the filtering. This helps you to quickly change the view of the displayed data, for example to different periods of time.
Procedure
1. Select an empty cell where you want to place the filter component.2. Choose Filter and select one of the listed dimensions to insert a filter component for this dimension.
The dimension name and a filter component formula are inserted in the worksheet. The functions used for the formulas are SAPGetDimensionInfo and SAPSetFilterComponent. The formulas are created automatically.
3. Optional Step: Specify the filter component formula.The formula that is inserted automatically, allows the user to select multiple members for filtering. It looks like this: =SAPSetFilterComponent("DS_2"; "0CALYEAR";"ALL").You can add one of the following parameters to the formula: SINGLE, MULTIPLE, LOWERBOUNDARY, UPPERBOUNDARY to specify the filtering options. If you add the parameter SINGLE, the user can only select
52 P U B L I CAnalysis Plug-in User Guide
Creating Workbooks

one member for filtering. The formula looks like this: =SAPSetFilterComponent("DS_2"; "0CALYEAR";"ALL";"SINGLE").You can also insert filter components to enable a range selection. Insert two filter components for the same dimension and add to one the parameter LOWERBOUNDARY and to the other the parameter UPPERBOUNDARY. You can now filter for the lower and upper bounds of a range.
4. Optional step: Format the filter component.You can use the formatting options of Microsoft Excel to format cells of the filter component.
5. Select the filter icon to define a filter.All tables on the current sheet that contain this dimension, will be filtered according to the selected filter. On the Components tab in the design panel, you can define which tables should be affected if not all tables should be filtered accordingly.
Results
The filter is added to the analysis according to your configuration.
Related Information
SAPGetDimensionInfo [page 57]SAPSetFilterComponent [page 71]
3.5 Working with formulas
In Analysis, edition for Microsoft Office, you can use the standard functions of Microsoft Excel to build formulas. The Plug-in also contains an own set of functions that you can use to build formulas. You can use these functions to include data and meta data of used data sources into your analysis. For example, you can insert information fields on data source properties, display the measure filter or list the variables of a data source. With the SAPGetData function, you can also define measure values for certain member combinations.
A Microsoft Excel formula for Analysis consists of a function and references to the data source, measures and/or dimensions. You can use the text or the key of an object to use it as reference. You can also use a cell value like B10 as reference.
The formula alias of a data source is displayed and can be changed in the data source properties on the Components tab in the design panel. For measures, dimensions and their members text references are better to read, but if you want to create a multi-language enabled analysis or there are duplicate texts in the meta data of your data source, you should reference these objects with their keys.
You can also use these functions in VBA macros.
Analysis Plug-in User GuideCreating Workbooks P U B L I C 53

Analysis functions
The following functions are available in the Analysis category:
● SAPGetData● SAPGetDimensionDynamicFilter● SAPGetDimensionEffectiveFilter● SAPGetDimensionInfo● SAPGetDimensionStaticFilter● SAPGetDisplayedMeasures● SAPGetInfoLabel● SAPGetMeasureFilter● SAPGetMember● SAPGetSourceInfo● SAPGetVariable● SAPGetWorkbookInfo● SAPListOf● SAPListOfDimensions● SAPListOfDynamicFilters● SAPListOfEffectiveFilters● SAPListOfMembers● SAPListOfMessages● SAPListOfStaticFilters● SAPListOfVariables● SAPSetFilterComponent
Related Information
Using Analysis functions [page 100]
3.5.1 To create a formula
Context
To create a formula with Analysis functions:
Procedure
1. Select the cell in which you want to enter the formula.
54 P U B L I CAnalysis Plug-in User Guide
Creating Workbooks
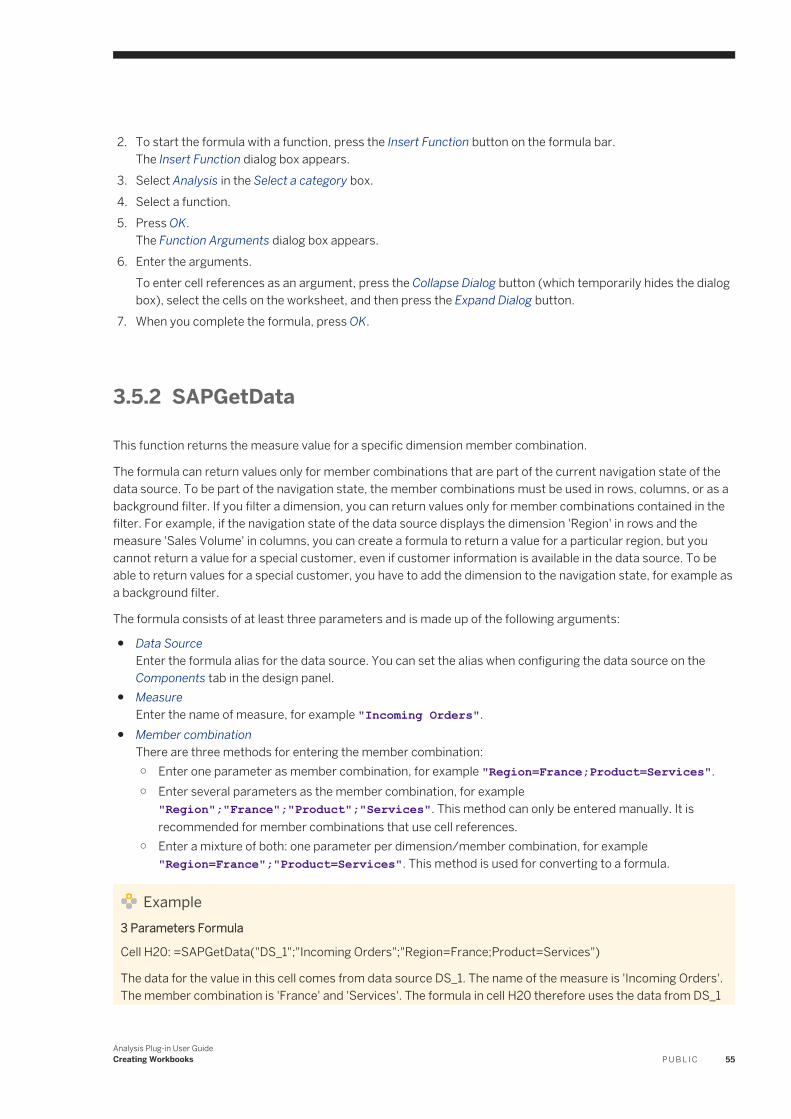
2. To start the formula with a function, press the Insert Function button on the formula bar.The Insert Function dialog box appears.
3. Select Analysis in the Select a category box.4. Select a function.5. Press OK.
The Function Arguments dialog box appears.6. Enter the arguments.
To enter cell references as an argument, press the Collapse Dialog button (which temporarily hides the dialog box), select the cells on the worksheet, and then press the Expand Dialog button.
7. When you complete the formula, press OK.
3.5.2 SAPGetData
This function returns the measure value for a specific dimension member combination.
The formula can return values only for member combinations that are part of the current navigation state of the data source. To be part of the navigation state, the member combinations must be used in rows, columns, or as a background filter. If you filter a dimension, you can return values only for member combinations contained in the filter. For example, if the navigation state of the data source displays the dimension 'Region' in rows and the measure 'Sales Volume' in columns, you can create a formula to return a value for a particular region, but you cannot return a value for a special customer, even if customer information is available in the data source. To be able to return values for a special customer, you have to add the dimension to the navigation state, for example as a background filter.
The formula consists of at least three parameters and is made up of the following arguments:
● Data SourceEnter the formula alias for the data source. You can set the alias when configuring the data source on the Components tab in the design panel.
● Measure Enter the name of measure, for example "Incoming Orders".
● Member combinationThere are three methods for entering the member combination:○ Enter one parameter as member combination, for example "Region=France;Product=Services".○ Enter several parameters as the member combination, for example
"Region";"France";"Product";"Services". This method can only be entered manually. It is recommended for member combinations that use cell references.
○ Enter a mixture of both: one parameter per dimension/member combination, for example "Region=France";"Product=Services". This method is used for converting to a formula.
Example3 Parameters Formula
Cell H20: =SAPGetData("DS_1";"Incoming Orders";"Region=France;Product=Services")
The data for the value in this cell comes from data source DS_1. The name of the measure is 'Incoming Orders'. The member combination is 'France' and 'Services'. The formula in cell H20 therefore uses the data from DS_1
Analysis Plug-in User GuideCreating Workbooks P U B L I C 55
to calculate the incoming orders for region 'France' and product 'Services'. If you change 'France' to 'Germany' in the formula, the incoming orders for Germany and Services are displayed in cell H20.
Example>3 Parameters Formula with Cell Reference
Cell H20: =SAPGetData("DS_1";"Incoming Orders";"Region";B10;"Product";"Services")
The data for the value in this cell comes from data source DS_1. The name of the measure is 'Incoming Orders'. The member combination is the region entered in cell B10 and 'Services'. For example, if you enter 'Spain' in cell B10, the formula in cell H20 uses the data from DS_1 to calculate the incoming orders for region 'Spain' and product 'Services'. If you change 'Spain' to 'France' in cell B10, the incoming orders for 'France' and 'Services' are displayed in cell H20.
3.5.3 SAPGetDimensionDynamicFilter
This function returns the dynamic filter of a dimension. Dynamic filters are defined by the user.
The formula consists of three parameters and is made up of the following arguments:
● Data SourceEnter the formula alias of the data source or planning function. You can set the alias when configuring the data source or planning function on the Components tab in the design panel.
● DimensionEnter the technical name of the dimension.
● Member DisplayYou can enter TEXT, KEY, or INPUT_STRING to define how the filtered members should be displayed in the workbook.You can use INPUT_STRING_AS_ARRAY if the formula is called from VBA to get the input string as a string array.
ExampleCell F20: =SAPGetDimensionDynamicFilter("DS_1";"0DIVISION";"TEXT")
You add a filter for dimension 0DIVISION and the following members are displayed in the analysis: Paints, Lighting, Foods. If you enter the formula in cell F20, the three filtered members are displayed in cell F20 as text.
3.5.4 SAPGetDimensionEffectiveFilter
This function returns all effective filters of a dimension: dynamic filters defined by the user, static filters defined in the underlying source, and filters by measure defined for the selected dimension.
The formula consists of three parameters and is made up of the following arguments:
● Data Source
56 P U B L I CAnalysis Plug-in User Guide
Creating Workbooks

Enter the formula alias of the data source or planning function. You can set the alias when configuring the data source or planning function on the Components tab in the design panel.
● DimensionEnter the technical name of the dimension.
● Member DisplayYou can enter TEXT, KEY, or INPUT_STRING to define how the filtered members should be displayed in the workbook.You can use INPUT_STRING_AS_ARRAY if the formula is called from VBA to get the input string as a string array.
ExampleCell F20: =SAPGetDimensionEffectiveFilter("DS_1";"0DIVISION";"TEXT")
If you enter the formula in cell F20, the members of 0DIVISION that are currently filtered by the user, the static filters that are defined in the data source, and the filters by measure for this dimension are displayed in cell F20 as text. If no static filters are defined for the data source, only the dynamic filter members and filters by measure are displayed.
3.5.5 SAPGetDimensionInfo
This function returns the name of a dimension or the name of an active hierarchy.
The formula consists of 3 parameters and is made up of the following arguments:
● Data SourceEnter the formula alias for the data source. You can set the alias when configuring the data source on the Components tab in the design panel.
● DimensionEnter the technical name of the dimension.
● Property NameYou can enter the following property names:○ NAME○ ACTIVEHIERARCHY
ExampleCell F20: =SAPGetDimensionInfo("DS_1";"0DIVISION";"NAME")
If you enter the formula in cell F20, the name of dimension 0DIVISION is displayed in cell F20.
3.5.6 SAPGetDimensionStaticFilter
This function returns the static filter of a dimension. Static filters are defined in the underlying source and cannot be changed by the user.
The formula consists of three parameters and is made up of the following arguments:
Analysis Plug-in User GuideCreating Workbooks P U B L I C 57
● Data Source Enter the formula alias for the data source. You can set the alias when configuring the data source on the Components tab in the design panel.
● DimensionEnter the technical name of the dimension.
● Member DisplayYou can enter TEXT, KEY, or INPUT_STRING to define how the filtered members should be displayed in the workbook.You can use INPUT_STRING_AS_ARRAY if the formula is called from VBA to get the input string as a string array.
ExampleCell F20: =SAPGetDimensionStaticFilter("DS_1";"0MATERIAL";"KEY")
If you enter the formula in cell F20, the static filter of dimension 0MATERIAL is displayed in cell F20.
3.5.7 SAPGetDisplayedMeasures
This function returns a list of all measures displayed in the analysis as text.
The formula is made up of the following argument: Data Source.
Enter the formula alias for the data source. You can set the alias when configuring the data source on the Components tab in the design panel.
ExampleCell G10: =SAPGetDisplayedMeasures("DS_1")
If you enter the formula in cell G10, all measures that are currently displayed in the crosstab are listed in cell G10. If you add or remove a measure from the crosstab, the list in cell G10 is updated accordingly.
3.5.8 SAPGetInfoLabel
This function returns the language-dependant label for an info field. The property names correspond to the info fields that are available for workbook and data sources on the Information tab in the design panel. Using this function, the info field labels are displayed in the selected UI language. The info field values can be inserted with function SAPGetWorkbookInfo and SAPGetSourceInfo.
The formula is made up of the following argument: Property Name.
For workbook related info fields, you can enter the following property names:
● WorkbookName● CreatedBy● CreatedAt
58 P U B L I CAnalysis Plug-in User Guide
Creating Workbooks

● LastChangedAt● LastRefreshedAt● LogonUser
For data source related info fields, you can enter the following property names:
● DataSourceName● LastDataUpdate● LastDataUpdateMaximum
This property is related to MulitProviders. It returns the date of the last update of all InfoProviders in a MultiProvider.Example: A MultiProvider contains three InfoProviders. The date when all three InfoProviders were updated succesfully for the last time, is the LastDataUpdateMaximum.
● KeyDate● QueryTechName● QueryCreatedBy● QueryLastChangedBy● QueryLastChangedAt● QueryLastRefreshedAt● InfoProviderTechName● InfoProviderName● System● LogonUser
ExampleCell D20: =SAPGetInfoLabel("System")
The label of the info field is displayed in the selected UI language, for example in English: System.
3.5.9 SAPGetMeasureFilter
This function returns a list of filtered measures created with Filter by Measure (All Dimensions Independently).
NoteAs of Analysis 1.4 SP7, you can use the function SAPListOfMeasureFillters to get a list of the all filtered measures. This function also returns more detailed information and includes BEx conditions.
The formula is made up of the following argument: Data Source.
Enter the formula alias for the data source. You can set the alias when configuring the data source on the Components tab in the design panel.
ExampleCell G10: =SAPGetMeasureFilter("DS_1")
Analysis Plug-in User GuideCreating Workbooks P U B L I C 59

If you enter the formula in cell G10, all measures that have a filter definition and the corresponding rules are displayed in a list in cell G10. If you add or remove a filter to a measure, the list in cell G10 is updated accordingly.
Related Information
SAPListOfMeasureFilters [page 66]
3.5.10 SAPGetMember
This function returns the dimension member or attribute.
The formula can only return values for dimension members or atttributes that are part of the current navigation state of the data source. To be part of the navigation state, the members must be used in rows, columns or as background filter. If you filter a dimension, you can only return values for members that the filter contains.
The formula consists of 3 parameters and is made up of the following arguments:
● Data SourceEnter the formula alias for the data source. You can set the alias when configuring the data source on the Components tab in the design panel.
● Dimension MemberEnter the technical name of a dimension and assign a member key, for example "0DIVISION=R1".
● Member DisplayYou can enter TEXT, KEY or Internal_Key to define how the filtered members should be displayed in the workbook.
ExampleCell G15: =SAPGetMember("DS_1";"0DIVISION=R1";"TEXT")
You want to display the text for member Retail. The key for Retail is R1. If you enter the formula in cell G15, the text of member R1 (Retail) is displayed in cell G15.
3.5.11 SAPGetSourceInfo
This function returns an info field value for a data source. The info field label can be inserted using the SAPGetInfoLabel function. The property names correspond to the info field values that are available for data sources on the Information tab in the design panel.
The formula consists of 2 parameters and is made up of the following arguments:
● Data SourceEnter the formula alias for the data source. You can set the alias when configuring the data source on the Components tab in the design panel.
60 P U B L I CAnalysis Plug-in User Guide
Creating Workbooks

● Property NameYou can enter the following property names:○ DataSourceName○ LastDataUpdate○ LastDataUpdateMaximum
This property is related to MulitProviders.For MultiProviders, the property LastDataUpdate returns the date of the last update of all InfoProviders in the MultiProvider.The property LastDataUpdateMaximum returns the date of the last update of a single InfoProvider of the MultiProvider.Example: A MultiProvider contains three InfoProviders. The date when all three InfoProviders were updated successfully for the last time, is the LastDataUpdate. The date when a single InfoProvider was updated for the last time, is the LastDataUpdateMaximum.
○ KeyDate○ QueryTechName○ QueryCreatedBy○ QueryLastChangedBy○ QueryLastChangedAt○ QueryLastRefreshedAt○ InfoProviderTechName○ InfoProviderName○ System○ LogonUser
ExampleCell D20: =SAPGetInfoLabel("DataSourceName")
Cell E20: =SAPGetSourceInfo("DS_1";"DataSourceName")
In cell D20, the Data Source Name label is displayed. In cell E20, the name of the data source with alias DS_1 is displayed, for example Sales Volume Europe.
3.5.12 SAPGetUniformScaling
This function returns the unit/scaling information for a specific dimension member combination.
The formula can only return values for member combinations that are part of the current navigation state of the data source. To be part of the navigation state, the member combinations must be used in rows, columns, or as a background filter. If you filter a dimension, you can return values only for member combinations contained in the filter.
The formula consists of at least three parameters and is made up of the following arguments:
● Data SourceEnter the formula alias for the data source. You can set the alias when configuring the data source on the Components tab in the design panel.
● Measure
Analysis Plug-in User GuideCreating Workbooks P U B L I C 61

Enter the name of measure, for example "Sales Volume".● Member combination
There are two methods for entering the member combination:○ Enter one parameter as member combination, for example "Region=France;Product=IT". This
method is used for converting to a formula.○ Enter several parameters as the member combination, for example
"Region";"France";"Product";"IT". This method can only be entered manually. It is recommended for member combinations that use cell references.
Example3 Parameters Formula
Cell H20: =SAPGetUniformScaling("DS_1";"Sales";"Region=France;Product=IT")
The data for the value in this cell comes from data source DS_1. The name of the measure is 'Sales Volume'. The member combination is 'France' and 'IT'. The formula in cell H20 therefore uses the data from DS_1 to calculate the unit/scaling factor for the sales volume for region 'France' and 'IT' (e.g. EUR). If you change 'France' to 'USA' in the formula, the unit/scaling factor for the sales volume of 'USA' and 'IT' is displayed in cell H20 (e.g. USD).
3.5.13 SAPGetVariable
This function returns the value of the specified property for a specific variable.
The formula consists of three parameters and is made up of the following arguments:
● Data SourceEnter the formula alias for the data source. You can set the alias when configuring the data source on the Components tab in the design panel.
● Variable NameEnter the name or technical name of the variable.
● Property NameYou can enter the following property names:○ VALUE
If you enter VALUE, the current value of the variable is displayed.○ VALUEASKEY
If you enter VALUEASKEY, the current value of the variable is displayed as a key.○ VALUEASTEXT
If you enter VALUEASTEXT, the current value of the variable is displayed as text.○ INPUT_STRING
If you enter INPUT_STRING, the current value of the variable is displayed as an input string.○ INPUT_STRING_AS_ARRAY
This property name can only be used if the formula is called from VBA. It returns the input string as a string array.
○ DESCRIPTIONIf you enter DESCRIPTION, the variable name is displayed.
○ ISINPUTENABLED
62 P U B L I CAnalysis Plug-in User Guide
Creating Workbooks

If you enter ISINPUTENABLED, the function checks if the variable is input-enabled.○ ISMANDATORY
If you enter ISMANDATORY, the function checks if the variable is mandatory.○ TECHNICALNAME
If you enter TECHNICALNAME, the technical name of the variable is displayed.○ BASEINFOOBJECT
If you enter BASEINFOOBJECT, the technical name of the dimension the variable is based on is displayed.
ExampleCell F20: =SAPGetVariable("DS_2";"0BW_VAR";"DESCRIPTION")
If you enter the formula in cell F20, the name of variable 0BW_VAR is displayed in cell F20.
3.5.14 SAPGetWorkbookInfo
This function returns an info field value for the current workbook. The info field label can be inserted with the SAPGetInfoLabel function The property names correspond to the info field values that are available for workbooks on the Information tab in the design panel.
This formula is made up of the following argument: Property Name.
You can enter the following property names:
● WorkbookName● CreatedBy● CreatedAt● LastChangedAt● LastRefreshedAt● LogonUser● PlanninEnvironment● PlanningModel
ExampleCell D20: =SAPGetInfoLabel("WorkbookName")
Cell E20: =SAPGetWorkbookInfo("WorkbookName")
In cell D20, the Workbook Name label is displayed. In cell E20, the name used for saving the workbook is displayed, for example Sales in Europe.
3.5.15 SAPListOf
This function returns a list of available objects for a specific object type. The list contains two columns for every entry (Alias and Description).
Analysis Plug-in User GuideCreating Workbooks P U B L I C 63

This formula consists of 3 parameters and is made up of the following arguments:
● Object TypeYou can enter the following object types:○ DATASOURCES○ CROSSTABS
For object type CROSSTABS, the function returns a list with three columns (Alias, Description and data source Alias).
○ PLANNINGFUNCTIONS○ PLANNINGSEQUENCES○ CUSTOMAPPLCONTEXT
For object type CUSTOMAPPLCONTEXT, the function returns a list with three columns (SystemID, RowCount and Content).
● SearchYou can enter a search string. Note that the search is case sensitive. If you do not enter a search string, all available objects of the selected object type will be listed.
● Search inYou can search in ALIAS or DESCRIPTION. This parameter is optional. The default value is ALIAS.
ExampleCell G15: =SAPListOf("CROSSTABS";"Cross")
Starting in Cell G15, a list with three columns (crosstab Alias, crosstab Description, data source alias) is displayed with all crosstabs that contain the search string Cross in their Alias.
Related Information
Using BAdI information [page 103]
3.5.16 SAPListOfDimensions
This function returns a list of dimensions. Depending on the search entries, the list can display all dimensions with their current drill state, dimensions that match a defined search string with their current drill state or just the dimensions used in rows, columns or background filter.
For planning functions, the function returns a list of all dimensions defined on the aggregation level of the planning function. The axis type is always ROW.
This formula consists of 3 parameters and is made up of the following arguments:
● Data SourceEnter the formula alias of the data source or planning function. You can set the alias when configuring the data source or planning function on the Components tab in the design panel.
● Search InYou can determine which columns the search should be executed in by selecting TECHNICALNAME, DESCRIPTION or AXIS. The default selection is TECHNICALNAME.
64 P U B L I CAnalysis Plug-in User Guide
Creating Workbooks

● SearchIf you have selected TECHNICALNAME or DESCRIPTION, you can enter a search string. Note that the search is case sensitive. If you do not enter a search string, all available dimensions will be listed.If you have selected AXIS, you can use the axis type to define which dimensions should be displayed:○ Enter ROWS to list the dimensions that are used in rows inthe current analysis.○ Enter COLUMNS to list the dimensions that are used in columns inthe current analysis.○ Enter FILTER to list the dimensions that are used as background filter in the current analysis.○ Enter ALL to list all available dimensions with their current drill state. For dimensions that are not used in
the current analysis, the drill state column is empty.
If the selected axis type contains no dimensions in the current analysis, the list is empty.
ExampleCell G11: =SAPListOfDimensions("DS_1";"TECHNICALNAME";"0SOLD")
Starting in Cell G11, a list with three columns (Technical Name, Description, Drill state) is displayed with all dimensions that contain 0SOLD in their technical name.
3.5.17 SAPListOfDynamicFilters
This function returns a list of all dynamic filters of a data source. Dynamic filters are defined by the user using Filter by Member.
The formula consists of 2 parameters and is made up of the following arguments:
● Data SourceEnter the formula alias for the data source. You can set the alias when configuring the data source on the Components tab in the design panel.
● Member DisplayYou can enter TEXT, KEY or INPUT_STRING to define how the filtered members should be displayed in the workbook.
ExampleCell G15: =SAPListOfDynamicFilters("DS_1";"TEXT")
If you enter the formula in cell G15, the dynamic filters of data source DS_1 are displayed as text.
3.5.18 SAPListOfEffectiveFilters
This function returns a list of all effective filters of a data source: Dynamic filters defined by the user, static filters defined in the underlying source, and filters by measure defined for the data source dimensions.
The formula consists of 2 parameters and is made up of the following arguments:
● Data Source
Analysis Plug-in User GuideCreating Workbooks P U B L I C 65
Enter the formula alias for the data source. You can set the alias when configuring the data source on the Components tab in the design panel.
● Member DisplayYou can enter TEXT, KEY or INPUT_STRING to define how the filtered members should be displayed in the workbook. This parameter is optional. The current display selected for members is the default setting. If two options exist, the first one is applied.
ExampleCell F20: =SAPListOfEffectiveFilters("DS_1";"TEXT")
You have added dimension Region from data source DS_1 to your analysis. You filter this dimension and the following members are part of the analysis: California, Arizona, Florida, Nevada. If you enter the formula in cell F20, the name of the dimension is displayed in cell F20, and the four filtered members are listed as text in cell G20.
3.5.19 SAPListOfMeasureFilters
This function returns a list of all measure filters including BEx conditions. The list contains two columns: the first column lists the filter type (BEX, DIMENSION, MEASURE) and the second with filter values.
The formula consist of three parameters and is made up of the following arguments:
● Data SourceEnter the formula alias of the data source or planning object. You can set the alias when configuring the data source or planning object on the Components tab in the design panel.
● DisplayYou can enter ALL, DIMENSION, MEASURE or BEX to define which measure filters should be displayed in the workbook:○ ALL returns a list of all measure filters.○ DIMENSION returns a list of filter by measure on all dimensions or a defined one.○ MEASURE returns a list of filter by measure on data cells.
The list also returns the filter type: All Dimensions Independently, Most Detailed Dimension in Rows or Most Detailed Dimension in Columns.
○ BEX returns a list of BEx conditions.This parameter is optional. ALL is the default value. You can also combine values of this parameter.
● NameEnter the technical name of the dimension if you have selected DIMENSION in the display parameter. This parameter is optional. If you do not enter a dimension name, all dimensions are listed.
ExampleCell G20: =SAPListOfMeasureFilters("DS_1";"BEX")
Starting in cell G20, a list is displayed with all BEx conditions in data source DS_1.
66 P U B L I CAnalysis Plug-in User Guide
Creating Workbooks

3.5.20 SAPListOfMembers
This functions returns a list of members for a selected dimension or prompt. Each list entry contains the key, text, and key as filter string of a member. The key as filter string differs from the key if the member is compounded to another dimension.
You cannot use this function to list the members for a dimension with hierarchies.
The formula consists of five parameters and is made up of the following arguments:
● Data SourceEnter the formula alias of the data source or planning object. You can set the alias when configuring the data source or planning object on the Components tab in the design panel.You have to define this parameter, irrespective of whether the variables in the workbook are merged or not.
● SourceEnter one of the following sources:○ PROMPT to get a list of the prompt members.
If you use PROMPT as source, you have to define the data source alias, irrespective of whether the variables in the workbook are merged or not.
○ FILTER to get a list of the dimension members.○ FILTER_MASTERDATA to get a list of all members of the master data for the selected dimension.○ PLAN_PARAMETER to get a list of all members for a variable in a planning object.
● NameEnter the technical name of a flat dimension or prompt whose members should be listed.
● SearchYou can enter a search string to restrict the list of members. This parameter is optional.
● Search inEnter whether the search should be executed in the KEY or TEXT column. This parameter is optional. The default entry is KEY.
● CountYou can specify (restrict or enlarge) the number of members that can be returned by this formula. The number specified in user setting Maximum Number of Members Displayed in the Filter Dialog is used as default.
ExampleCell G15: =SAPListOfMembers("DS_1";"FILTER";"0CALMONTH";"12";"KEY")
Starting in cell G15, a list is displayed with all members of dimension 0CALMONTH that contain search string '12' in their technical name (KEY).
3.5.21 SAPListOfMessages
This function includes messages into the sheet. You can select which messages , according to their level of severity, and details should be displayed in the sheet.
The formula consists of 2 parameters and is made up of the following arguments:
Analysis Plug-in User GuideCreating Workbooks P U B L I C 67

● SeverityYou can enter the following severities: INFORMATION, WARNING, ERROR and CRITICAL.INFORMATION is the least severe category, CRITICAL the most severe. If you select a severity, all messages are shown which have this severity or higher. If you select WARNING, for example, all messages with severity WARNING, ERROR and CRITICAL are displayed.
● Show DetailsIf you enter FALSE, the messages are listed with severity and short text.If you enter TRUE, the messages are listed with additional information. The details are listed in the following sequence:1. Message ID
The message ID is a unique identifier for a message that is valid for the current messages dialog. If the same message is displayed again at a later time, it has a different message ID.The message ID can be used as identifier in the API methods SAPAddMessage and SAPSuppressMessage.
2. Short TextThe message short text is displayed.
3. Message ClassIf the message comes from a BW back-end system, the message class is displayed.
4. IDFor Analysis messages, the notification ID is displayed. For messages from a BW back-end, a concatenation of the message class and the message number is displayed.
5. SeverityThe message severity is displayed.
6. Variables: VARIABLE1-VARIABLE4If the message comes from a BW back-end system, the message can comprise up to four variables to support dynamic message texts.
7. System IDIf the message comes from a BW back-end system, the system ID is displayed.
ExampleCell H11: =SAPListOfMessages("ERROR";FALSE)
In cell H11, all messages with severity ERROR and CRITICAL are displayed with severity and text.
Related Information
Using Analysis functions [page 100]SAPAddMessage [page 74]SAPSuppressMessage [page 93]
3.5.22 SAPListOfStaticFilters
This function returns a list of all static filters of a data source. Static filters are defined in the underlying source and cannot be changed by the user.
68 P U B L I CAnalysis Plug-in User Guide
Creating Workbooks

The formula consists of 2 parameters and is made up of the following arguments:
● Data SourceEnter the formula alias for the data source. You can set the alias when configuring the data source on the Components tab in the design panel.
● Member DisplayYou can enter TEXT, KEY or INPUT_STRING to define how the filtered members should be displayed in the workbook.
ExampleCell G15: =SAPListOfStaticFilters("DS_1";"TEXT")
If you enter the formula in cell G15, the static filters of data source DS_1 are displayed as text.
3.5.23 SAPListOfVariables
This function returns a list of all variables of a data source or planning object.
The formula consists of 3 parameters and is made up of the following arguments:
● Data SourceEnter the formula alias of the data source or planning object. You can set the alias when configuring the data source or planning object on the Components tab in the design panel.You have to define this parameter if the variables in the workbook are not merged. If the variables in the workbook are merged, you can define this parameter but you do not have to define it.
● Member DisplayYou can enter TEXT, KEY or INPUT_STRING to define how the filtered members should be displayed in the workbook. This parameter is optional. The current display selected for members is the default setting. If two options exist, the first one is applied.
● DisplayEnter one of the following values:○ ALL to display all variables (filled and unfilled) including variables not visible on the prompts dialog.○ PROMPTS to display all variables (filled and unfilled) visible on the prompts dialog.○ ALL_FILLED to display all filled variables including variables not visible on the prompts dialog.○ PROMPTS_FILLED to display all filled variables visible on the prompts dialog.○ PLAN_PARAMETER to display all variables (filled and unfilled) of a planning object.
This parameter is optional. The default value is PROMPTS_FILLED.
ExampleCell F20: =SAPListOfVariables("DS_2";"TEXT")
If you enter the formula in cell F20, all variables with values in data source DS_2 are listed with their values in the worksheet. The first variable name is displayed in cell F20, the next in cell F21 and so on. The corresponding values are listed in G20, G21 and so on.
Analysis Plug-in User GuideCreating Workbooks P U B L I C 69

3.5.24 SAPSetData
With this function, you can set planning values. You can either enter the value(s) in the formula directly or you can refer to another cell in Microsoft Excel that contains the value(s).
The formula consists of five parameters and is made up of the following arguments:
● Data SourceEnter the formula alias for the data source. You can set the alias when configuring the data source on the Components tab in the design panel.
● New ValueYou can enter a value manually or reference a cell in Microsoft Excel that contains the value.
NoteIf you reference a cell, the cell must not be part of a crosstab in Analysis.
● OptionYou can use options to define the behavior of the formula. If you use more than one option in a formula, use a semicolon-separated list to enter the options.This parameter is optional. If you do not need to define an option for the formula, you can enter an empty parameter.The following options are available:○ SetOnly
With this option set, the formula does not adopt values in a referenced cell if the values in the data cell were changed, for example after executing a planning function.
○ NoScalingWith this option set, the scaling factor of the data cell in the crosstab is not included for setting the value.Example: The scaling factor for a data cell is set to 100. The data cell shows the value 3, the 'real' value of the data cell is 300. If you want to change the 'real' value to 400, you can set the value 4 or you set the value 400 using the option NoScaling. Due to the scaling factor, the data cell will show value 4.
● Measure Enter the name of measure, for example "Incoming Orders".
● Member combinationThere are three methods for entering the member combination:○ Enter one parameter as the member combination, for example
"Region=France;Product=Services".○ Enter several parameters as the member combination, for example
"Region";"France";"Product";"Services". This method can only be entered manually. It is recommended for member combinations that use cell references.
○ Enter a mixture of both: one parameter per dimension/member combination, for example "Region=France";"Product=Services".
When a data source is initially refreshed, the formula is evaluated and the value after the formula is set in the data source. If the target value is changed, manually or in the referenced cell, the new value is set in the data source. But a recalculation is not triggered automatically and the crosstab still shows the old value. With this behavior, you can change several values and then recalculate all changes in one step by executing the recalculation manually.
ExampleCell D10: =SAPSetData("DS_1"; H5;;"Incoming Orders";"Region";"France";"Product";"Services")
70 P U B L I CAnalysis Plug-in User Guide
Creating Workbooks
The formula in cell D10 defines the value for a measure and member combination of data source DS_1. The name of the measure is 'Incoming Orders'. The member combination is 'France' and 'Services'. The value that is set is taken from cell H5. Therefore, cell H5 must not be part of the crosstab.
The parameter option is not defined in the formula.
Related Information
SAPGetData [page 55]Syntax for Entering Values [page 111]
3.5.25 SAPSetFilterComponent
This function creates a filter component and sets the members selected by the user as a filter. You can click the filter icon to change your filter definition in a dialog box.
This formula consists of 4 parameters and is made up of the following arguments:
● Data SourceEnter the formula alias for the data source. You can set the alias when configuring the data source on the Components tab in the design panel.
● Dimension NameEnter the technical name of the dimension.
● Target Data SourceYou can enter ALL or a list of formula aliases for data sources that should be affected.
● Selection TypeEnter one of the following selection types:○ SINGLE
With this selection type, you can select only one member for filtering.○ MULTIPLE
With this selection type, you can select multiple members for filtering.○ LOWERBOUNDARY
With this selection type, you can define a member as a lower boundary, for example a date.○ UPPERBOUNDARY
With this selection type, you can define a member as an upper boundary, for example a date. You can also insert two filter components in your analysis to define a period of time with a lower boundary date and an upper boundary date.
ExampleCell E25: =SAPSetFilterComponent("DS_1";"0DIVISION";"ALL";"MULTIPLE")
If you enter the formula in cell E25, the members that are currently filtered are displayed in cell E25. If you select the filter icon next to cell E25, you can change your filter definition.
Analysis Plug-in User GuideCreating Workbooks P U B L I C 71
3.6 Converting crosstab cells to formula
You can convert all cells of a crosstab into formulas with one step. This deletes the crosstab object and defines every row in the table as a Microsoft Excel formula. The result values called from the server with the formula are still displayed in the table. The formula of the selected cell is displayed in the formula bar. In formula mode, you can edit the analysis table using Microsoft Excel formatting and formula functions and make further calculations using the existing data.
In formula mode, you can use all Microsoft Excel formatting functions. With the deletion of the design item, the individual formatting of the data will not be overwritten by the standard formatting in the crosstab the next time you update this data. For example, if you select a color to highlight interim results in the table and then navigate in this table, only the data for the values from the server is called and not the standard formatting from the crosstab. Your individual formatting is retained.
You can use the Microsoft Excel formula functions to make further calculations on the basis of existing data. You can also copy the formula for a cell to another cell outside the table and thus work independently of the original table. If the workbook contains two crosstabs based on different data providers, you can combine the data from both data providers for your calculations.
The Formulas
Formulas with the following functions are composed in the formula mode:
● SAPGetData● SAPGetMember● SAPGetDimensionInfo● SAPGetUniformScaling
Examples for working in formula mode
In formula mode, you can use various functions to modify the layout and perform additional calculations.
● You can highlight cells by formatting the font and background color.● You can insert spaces to make the display easier to read.● You can copy parts of the table or individual cells to another position in the workbook in order to compare
particular values.● You can re-use cells.● You can overwrite a members with another one, or add one in order to call data that you need from the BI
server. If member "3.2007" is used to read the sales revenue for March 2007, for example, you can replace the 3 with a 4, thus using member "4.2007" to obtain the sales revenue for April 2007, provided that the data provider contains this data.
● You can also calculate additional subtotals.● You can create offers based on data from various data providers.
72 P U B L I CAnalysis Plug-in User Guide
Creating Workbooks

Restrictions
Converting to formula mode has the following consequences:
● Navigation using Drag & Drop is no longer possible.● The context menu is not available.
Related Information
To convert a crosstab to formula [page 73]
3.6.1 To convert a crosstab to formula
Procedure
1. Insert a crosstab into a workbook2. Choose Convert to Formula.
This performs the following steps:
○ Texts that are not displayed because they occur several times in a column or row, are repeated in each cell automatically to produce valid formulas. You can also execute this step manually by selecting the Repeat Members check box for the crosstab on the Components tab in the design panel.
○ Every cell in the crosstab is defined as a Microsoft Excel formula.
NoteAll currently displayed cells of the crosstab are converted to formula. Cells in a hierarchy that are currently not expanded, are not converted.
○ For dimensions and members displayed as text in the crosstab, the key is added to the data source during conversion to formula. This doesn't change the display in the original crosstab. You will only see the added key if you insert the crosstab with the same data source again in your workbook. Then columns and rows are added to display the key.
○ Crosstab object is deleted.
Results
All currently displayed cells of the crosstab are converted to a formula using the functions SAPGetData, SAPGetMember, SAPGetDimensionInfo and SAPGetUniformScaling.
NoteAs long as you haven't changed the data in the table, you can go back to analysis mode by choosing Undo.
Analysis Plug-in User GuideCreating Workbooks P U B L I C 73

3.7 Working with macros
Analysis contains API methods that can be used in VBA macros that are embedded in Microsoft Office Excel workbooks. Macros are created in the Visual Basic Editor. The Visual Basic Editor can be used to write and edit a macro that is attached to a Microsoft Office Excel workbook. The macros can be connected to UI elements that are available on the Developer tab in the menu.
You can also use the Analysis functions for creating formulas in VBA macros.
Microsoft Office documentation provides information about creating and using VBA macros. The following section describes the Analysis API methods.
The following methods are available in Analysis:
● SAPAddMessage● SAPCallMemberSelector● SAPExecuteCommand● SAPExecutePlanningFunction● SAPExecutePlanningSequence● SAPGetCellInfo● SAPGetProperty● SAPLogon● SAPMoveDimension● SAPSetFilter● SAPSetPlanParameter● SAPSetRefreshBehaviour● SAPSetVariable
3.7.1 SAPAddMessage
With this API method, you can define messages and add them to the standard message dialog.
To call the method, use Application.Run and specify the following input parameters:
● MessageEnter the message text.
● SeverityYou can enter one of the following severities: INFORMATION, WARNING, ERROR or CRITICAL. This parameter is optional. The default value is INFORMATION.
● Details You can enter a long text with additional information to the message. This parameter is optional.
● Message ID With the message ID, you can define a specific position in the message dialog where the new message should be added. The new message is inserted before the specified message ID. If the specified message ID does not exist in the message dialog, the new message is added as last message.The message ID is a unique identifier for a message that is valid in the current messages dialog. It can be retrieved with function SAPListOfMessages.
74 P U B L I CAnalysis Plug-in User Guide
Creating Workbooks

This parameter is optional.
The system returns one of the following output parameters for each function execution:
● 0 = execution failed.● 1 = execution successful.
ExampleDim lResult As Long
lResult= Application.Run("SAPAddMessage", "This is a new error message!", "ERROR")
The message 'This is a new error message' with severity Error is displayed in the message dialog.
Related Information
SAPListOfMessages [page 67]SAPSuppressMessage [page 93]
3.7.2 SAPCallMemberSelector
With this API method, you can call the standard input help (member selector) from the worksheet. The standard input help is the dialog that is used for filtering in Analysis. If you define the ReferenceCell parameter, the inplace selector is called. The inplace selector is a smaller version of the member selector. You can use it to select members of a dimension, but you cannot change how members are displayed in the selector, for example to change the display from key to text.
To call the method, use Application.Run and specify the following input parameters:
● Formula AliasEnter the formula alias for the data source or planning object. You can set the alias when configuring the data source on the Components tab in the design panel.You have to define this parameter if the variables in the workbook are not merged. If the variables in the workbook are merged, you can define this parameter but you do not have to define it.
● Selector TypeEnter one of the following selector types:○ PROMPT to get a selector with the prompt members.○ FILTER to get a selector with the dimension members.○ FILTER_MASTERDATA to get a selector with all members of the master data for the selected dimension.○ PLAN_PARAMETER to get a selector with the members of a variable (filled and unfilled) of a planning
object.○ FILTER_NEW_LINES to get a selector with member access mode P (Planning).
● NameEnter the name of the variable or dimension.
● ReferenceCellDefine the cell in which the inplace selector is displayed. This parameter is optional.
Analysis Plug-in User GuideCreating Workbooks P U B L I C 75

● Selection TypeEnter one of the following selection types:○ SINGLE
With this selection type, you can select only one member for filtering.○ MULTIPLE
With this selection type, you can select multiple members for filtering.This parameter is optional.
The system returns one of the following output parameters for each function execution:
● InputString = selected data.● Error = if invalid data is selected.● False = if the dialog is canceled.
ExampleSAPCallMemberSelectorFilter
Dim lResult As Variant
lResult= Application.Run("SAPCallMemberSelector", "DS_1", "FILTER", "0MATERIAL")
The member selector for dimension 0MATERIAL is displayed, and you can select the members you need. You can also select a range of members or change how the members are displayed in the selector.
ExampleSAPCallMemberSelectorFilter used for SAPSetFilter
Public Sub CallMemberSelectorFilter() Dim lResult As Variant lResult = Application.Run("SAPCallMemberSelector", "DS_1", "FILTER", "0MATERIAL") If Not IsError(lResult) Then If lResult <> False Then Call Application.Run("SAPSetFilter", "DS_1", "0MATERIAL",lResult) End If End If End Sub
The member selector for dimension 0MATERIAL is displayed, and you can select the members you need. If the selected data is valid and the dialog is not canceled, the filter for dimension 0MATERIAL is set to the selected members.
ExampleSAPCallMemberSelectorInplace
Dim lResult As Variant
lResult= Application.Run("SAPCallMemberSelector", "DS_1", "FILTER", "0MATERIAL", ActiveCell)
The inplace selector for dimension 0MATERIAL is displayed in the active cell, and you can select the members you need.
76 P U B L I CAnalysis Plug-in User Guide
Creating Workbooks
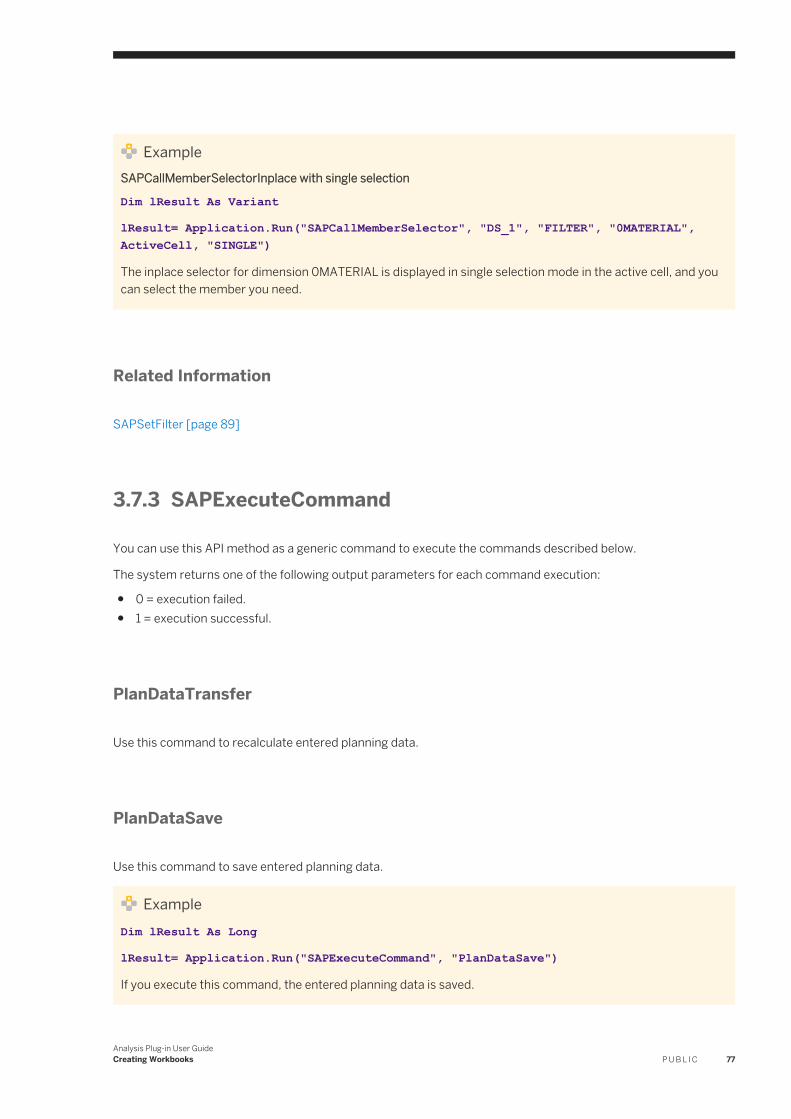
ExampleSAPCallMemberSelectorInplace with single selection
Dim lResult As Variant
lResult= Application.Run("SAPCallMemberSelector", "DS_1", "FILTER", "0MATERIAL", ActiveCell, "SINGLE")
The inplace selector for dimension 0MATERIAL is displayed in single selection mode in the active cell, and you can select the member you need.
Related Information
SAPSetFilter [page 89]
3.7.3 SAPExecuteCommand
You can use this API method as a generic command to execute the commands described below.
The system returns one of the following output parameters for each command execution:
● 0 = execution failed.● 1 = execution successful.
PlanDataTransfer
Use this command to recalculate entered planning data.
PlanDataSave
Use this command to save entered planning data.
ExampleDim lResult As Long
lResult= Application.Run("SAPExecuteCommand", "PlanDataSave")
If you execute this command, the entered planning data is saved.
Analysis Plug-in User GuideCreating Workbooks P U B L I C 77

PlanDataReset
Use this command to reset planning data entered since the last save of data.
PlanDataClientReset
Use this command to reset planning data entered since the last successful recalculation of data.
PlanDataToDisplayMode
Use this command to quit input-ready mode and switch to display mode while planning data.
PlanDataToChangeMode
Use this command to switch to input-ready mode while planning data.
PauseVariableSubmit
Use this command to pause the execution of variables using the parameter "On". To end the pausing, use the command with parameter "Off".
When PauseVariableSubmit is in mode "On", all Analysis formulas and most of the Analysis macros will not be executed. The following macros will be executed: SAPAddMessage, SAPSetVariable, PauseVariableSubmit "Off".
Hide/Show
Use this command to hide and show Analysis UI components for a workbook. You can use the command for the types "Ribbon", "ContextMenu" and "TaskPane".
You can hide the complete ribbon ("All") and show it again ("Default"). For the context menu, you can hide the complete menu and show it again. For the design panel, you can hide the Analysis and the Components tab and show the complete design panel again.
The following commands are supported:
● Application.Run("SAPExecuteCommand", "Hide", "Ribbon", "All") ● Application.Run("SAPExecuteCommand", "Show", "Ribbon", "Default") ● Application.Run("SAPExecuteCommand", "Hide", "ContextMenu", "All")
78 P U B L I CAnalysis Plug-in User Guide
Creating Workbooks

● Application.Run("SAPExecuteCommand", "Show", "ContextMenu", "Default") ● Application.Run("SAPExecuteCommand", "Hide", "TaskPane", "Analysis")● Application.Run("SAPExecuteCommand", "Hide", "TaskPane", "Components")● Application.Run("SAPExecuteCommand", "Show", "TaskPane", "Default")
ShowPrompts
Use this command to display the prompts dialog. You can call the workbook or data source prompts dialaog. To call the dialog, the data source(s) need to be refeshed.
ExampleShow prompts dialog for one data source
lResult= Application.Run("SAPExecuteCommand", "ShowPrompts", "DS_1")
If you execute this command, the prompts dialog for DS_1 is displayed. This is only possible if the variables are not merged in the workbook.
ExampleShow prompts dialog for all data sources
lResult= Application.Run("SAPExecuteCommand", "ShowPrompts", "ALL")
If you execute this command, the prompts dialog for all data sources in the workbook is displayed.
Refresh
Use this command to initially refresh the data in the workbook. You can specify one data source or one planning object as a parameter that should be refreshed. If you do not enter a parameter or you enter the string 'ALL' as parameter, all data sources and planning objects will be refreshed. If you execute this command for a data source which is already refreshed, all corresponding crosstabs are redrawn.
Additionally, you can refresh a list of data sources.
NoteIf a planning function 'PF_X' has a filter assigned, you can include this filter with the alias 'PF_X' into the list. However, the planning function itself wil not be refreshed and has to be refreshed with an own command.
ExampleRefresh one data source
Dim lResult As LonglResult= Application.Run("SAPExecuteCommand", "Refresh", "DS_1")
Analysis Plug-in User GuideCreating Workbooks P U B L I C 79

If you execute this command, the data for data source DS_1 is refreshed.
ExampleRefresh all data sources
Dim lResult As Long
lResult= Application.Run("SAPExecuteCommand", "Refresh")
If you execute this command, the data of all data sources is refreshed.
ExampleRefresh a list of data sources
Dim lResult As Long
lResult= Application.Run("SAPExecuteCommand", "Refresh"; "DS_1;DS_2")
If you execute this command, the data of data source DS_1 and DS_2 is refreshed.
RefreshData
Use this command to refresh the transaction data for all or defined data sources in the workbook. You can specify the data sources that should be refreshed. If you do not enter a parameter or you enter the string 'ALL' as parameter, all data sources will be refreshed. If you execute this command for a data source, the corresponding transaction data is updated from the server and the crosstabs are redrawn.
To use this command, the following prerequisites must be met:
● SAP BW 7.30 or higher● The defined query read mode provides current data.● Entered planning data was saved.
ExampleRefresh two defined data sources
Dim lResult As Long
lResult= Application.Run("SAPExecuteCommand", "RefreshData", "DS_1;DS_3")
If you execute this command, the data for data source DS_1 and DS_3 is refreshed from the server.
Restart
Use this command to technically restart all or defined data sources in the workbook. Technically restarting a data source has the same effect than deleting and reinserting it with keeping the current navigation state and the
80 P U B L I CAnalysis Plug-in User Guide
Creating Workbooks
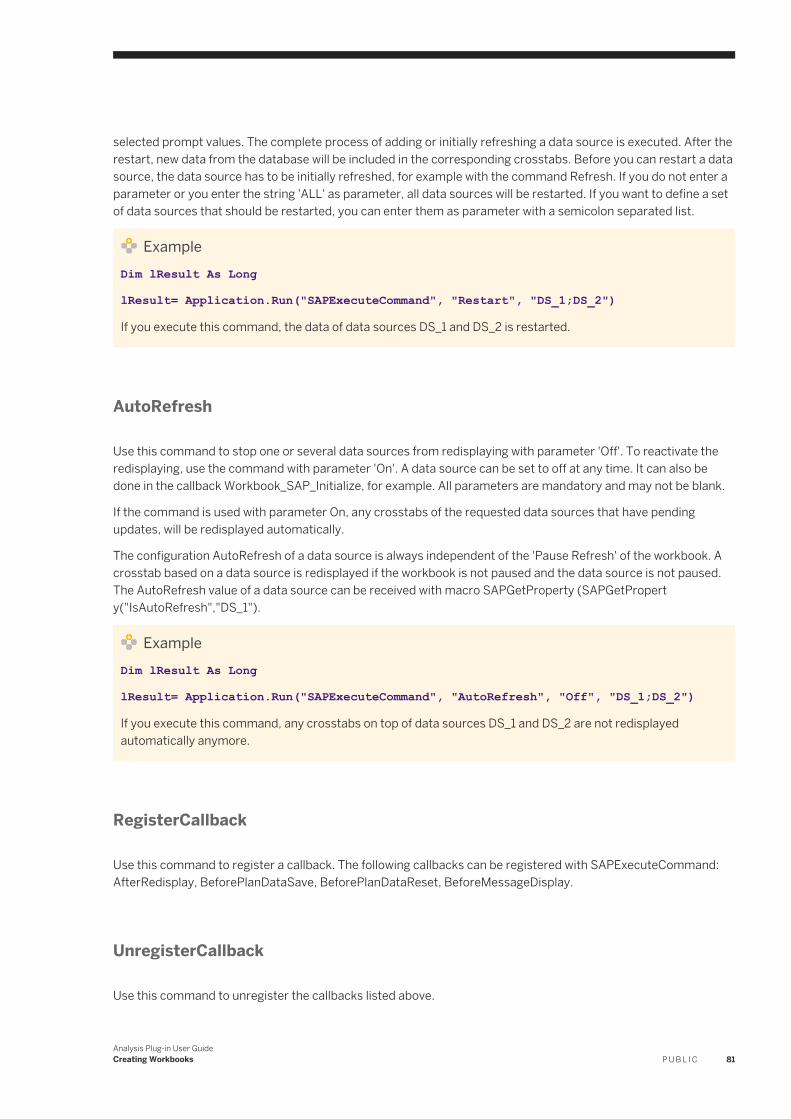
selected prompt values. The complete process of adding or initially refreshing a data source is executed. After the restart, new data from the database will be included in the corresponding crosstabs. Before you can restart a data source, the data source has to be initially refreshed, for example with the command Refresh. If you do not enter a parameter or you enter the string 'ALL' as parameter, all data sources will be restarted. If you want to define a set of data sources that should be restarted, you can enter them as parameter with a semicolon separated list.
ExampleDim lResult As Long
lResult= Application.Run("SAPExecuteCommand", "Restart", "DS_1;DS_2")
If you execute this command, the data of data sources DS_1 and DS_2 is restarted.
AutoRefresh
Use this command to stop one or several data sources from redisplaying with parameter 'Off'. To reactivate the redisplaying, use the command with parameter 'On'. A data source can be set to off at any time. It can also be done in the callback Workbook_SAP_Initialize, for example. All parameters are mandatory and may not be blank.
If the command is used with parameter On, any crosstabs of the requested data sources that have pending updates, will be redisplayed automatically.
The configuration AutoRefresh of a data source is always independent of the 'Pause Refresh' of the workbook. A crosstab based on a data source is redisplayed if the workbook is not paused and the data source is not paused. The AutoRefresh value of a data source can be received with macro SAPGetProperty (SAPGetPropert y("IsAutoRefresh","DS_1").
ExampleDim lResult As Long
lResult= Application.Run("SAPExecuteCommand", "AutoRefresh", "Off", "DS_1;DS_2")
If you execute this command, any crosstabs on top of data sources DS_1 and DS_2 are not redisplayed automatically anymore.
RegisterCallback
Use this command to register a callback. The following callbacks can be registered with SAPExecuteCommand: AfterRedisplay, BeforePlanDataSave, BeforePlanDataReset, BeforeMessageDisplay.
UnregisterCallback
Use this command to unregister the callbacks listed above.
Analysis Plug-in User GuideCreating Workbooks P U B L I C 81

ExampleDim lResult As Long
lResult= Application.Run("SAPExecuteCommand", "UnregisterCallback", "AfterRedisplay")
If you execute this command, the AfterRedisplay callback is unregistered.
SetFunctionalArea
Use this command to add a functional area (similar to a tag) to an Analysis workbook. It is limited to a length of 30 characters.
As it is typically called in the callback Workbook_SAP_Initialize, the functional area must be set before Analysis has established a connection to the BW system.
Related Information
Using Callbacks [page 105]Hiding / Showing Analysis UI components [page 102]SAPSetVariable [page 92]Using BAdI information [page 103]
3.7.4 SAPExecutePlanningFunction
With this API method, you can execute a planning function. Planning functions are maintained in the Components tab in the design panel.
To call the method, use Application.Run and specify the following input parameters:
● Planning Function AliasEnter the formula alias of the planning function. You can set the alias when configuring the planning function on the Components tab in the design panel.
The system returns one of the following output parameters for each function execution:
● 0 = execution failed.● 1 = execution successful.
ExampleDim lResult As Long
lResult= Application.Run("SAPExecutePlanningFunction","PF_1")
82 P U B L I CAnalysis Plug-in User Guide
Creating Workbooks

If you select this command, planning function PF_1 is executed.
3.7.5 SAPExecutePlanningSequence
With this API method, you can execute a planning sequence. Planning sequences are maintained in the Components tab in the design panel.
To call the method, use Application.Run and specify the following input parameters:
● Planning Sequence AliasEnter the formula alias of the planning sequence. You can set the alias when configuring the planning sequence on the Components tab in the design panel.
The system returns one of the following output parameters for each function execution:
● 0 = execution failed.● 1 = execution successful.
ExampleDim lResult As Long
lResult= Application.Run("SAPExecutePlanningSequence","PS_1")
If you select this command, planning sequence PS_1 is executed.
3.7.6 SAPGetCellInfo
With this API method, you can define a command to get information on a crosstab cell. You can define the commands for a selection and for a dimension.
For a Dimension call, the result contains the data source alias and the technical name of the dimension.
For a Selection call, the result contains a list of dimensions. Each list entry contains the data source alias, the technical name of the dimension and the technical name of the member. For measures, a list entry contains the data source alias, the measure structure and the technical name of the measure.
To call the method, use Application.Run and specify the following input parameters:
● CellEnter the cell information for one cell of the worksheet. If the currently selected cell should be evaluated, enter ActiveCell.If you have selected a range containing more than one cell, the method returns the cell information for the upper left cell in the range.
● PropertyEnter one of the following properties: SELECTION, DIMENSION, DATASOURCE or CROSSTAB.
● FilterFor the SELECTION property , you can enter a list of dimensions to be evaluated, using semicolons as separator. If you do not enter any dimensions, all available dimensions are evaluated.
Analysis Plug-in User GuideCreating Workbooks P U B L I C 83

For DIMENSION, DATASOURCE or CROSSTAB, you do not have to enter a value.
TipIf you want to include a check in your program to check if the selected cell is part of the crosstab, you can use the named range of the crosstab as reference. You can find the named range in the Name box in the formula bar. You can modify it on the Components tab in the design panel.
ExampleDimension
Dim lResult As Variant
lResult= Application.Run("SAPGetCellInfo", ActiveCell, "DIMENSION")
If you select a dimension cell in the crosstab and execute the command, it returns the data source alias and the technical name of the dimension.
ExampleSelection
Dim lResult As Variant
lResult= Application.Run("SAPGetCellInfo", ActiveCell, "SELECTION")
In your current analysis, you have filtered the dimensions 0MATERIAL and 0COUNTRY in rows and the measure 0SALESVOLUME in columns. If you select a data cell and execute the command, it returns a list with three rows: One with the measure information, one with the information for dimension 0MATERIAL and one with the information for dimension 0COUNTRY.
Related Information
The Components tab [page 118]
3.7.7 SAPGetProperty
You can use this API method to read properties of a data source or a workbook. The command returns a Boolean value: True or False.
To call the method, use Application.Run and specify the following input parameters:
● Property NameEnter one of the following properties:○ IsDataSourceActive to check whether a data source is active.○ IsDataSourceEditable to check whether the data source is input-ready.○ HasChangedPlanData to check whether the workbook contains changed planning data.
84 P U B L I CAnalysis Plug-in User Guide
Creating Workbooks

○ IsAutoRefresh to check whether the automatic refresh is active or paused on workbook level or for the specified data source.
○ IsConnected to check whether a data source is already connected.○ LastError to get information on an error that occurred while executing Analysis API methods and
functions.○ ChangedCrosstabs to get the crosstabs that have been changed in the last round trip with callback
AfterRedisplay.○ ChangedDatasources to get the data sources that have been changed in the last round trip with callback
AfterRedisplay.● Data Source Alias
Enter the formula alias for the data source. You can set the alias when configuring the data source on the Components tab in the design panel. This parameter is optional.If you use the HasChangedPlanData or LastError property, you should not enter a data source alias, as this property is not related to a specific data source but to the complete workbook.
ExampleDim lResult As Variant
lResult= Application.Run("SAPGetProperty", "IsDataSourceEditable", "DS_1")
If you execute the command, it returns the Boolean value. If the data source DS_1 is editable, the value is True.
ExampleIret = Application.Run("SAPGetProperty", "IsConnected", "DS_1")
If you execute the command, it returns the Boolean value. If the data source DS_1 is connected, the value is True.
Related Information
Using LastError information [page 109]
3.7.8 SAPLogOff
You can use this API method to disconnect a workbook from the server or to trigger a restart to the system.
You can also log off and reconnect a workbook manually in Analysis. The options are available in the context menu for workbooks on the Components tab in the design panel.
To call the method, use Application.Run and specify the following input parameters:
● Boolean Parameter for restarting a systemThis parameter is optional. You can enter the following values:○ True: With this value, the system will be restarted.
Analysis Plug-in User GuideCreating Workbooks P U B L I C 85

○ False: With this value, the system will not be restarted.
The system returns one of the following output parameters for each command execution:
● 0 = execution failed.● 1 = execution successful.
ExampleDim lResult As Long
lResult= Application.Run("SAPLogOff", True )
If you you execute this command, the workbook connection to the system is restarted.
Related Information
Managing system connections in the design panel [page 126]
3.7.9 SAPLogon
You can use this API method to trigger a logon to a system for a specified data source.
To call the method, use Application.Run and specify the following input parameters:
● Formula AliasEnter the formula alias for the data source. You can set the alias when configuring the data source on the Components tab in the design panel.
● Client Enter the system client. This parameter is only relevant for logon to an SAP system.
● UserEnter the user.
● PasswordEnter the password.
● LanguageEnter the logon language. This parameter is optional.
The system returns one of the following output parameters for each command execution:
● 0 = execution failed.● 1 = execution successful.
Examplelret = Application.Run("SAPLogon", "DS_1", "000", "Anzeiger", "Display")
If you execute the command, the system of data source DS_1 with client 000 will be connected for user Anzeiger with password Display.
86 P U B L I CAnalysis Plug-in User Guide
Creating Workbooks

3.7.10 SAPMoveDimension
With this API method, you can define the position of a dimension in the crosstab, swap the dimension with another one or position a dimension relative to another one.
To call the method, use Application.Run and specify the following input parameters:
● Data Source AliasEnter the formula alias for the data source. You can set the alias when configuring the data source on the Components tab in the design panel.
● Dimension KeyEnter the technical name of the dimension.
● PositionByEnter one of the following constants:○ ROWS to move a dimension to the rows.○ COLUMNS to move a dimension to the columns.○ FILTER to move a dimension to the background filter.○ AFTER to move a dimension after a relative dimension.○ BEFORE to move a dimension before a relative dimension.○ SWAP to swap a dimension with a relative dimension.
● IdentifierIf PositionBy is set to AFTER, BEFORE or SWAP, enter the technical name of the relative dimension.If PositionBy is set to ROWS, COLUMNS or FILTER, enter the position as an index. The index is 1-based and optional. If the index is not valid, the command will not be executed. If no index is specified, the dimension is added at the end.
The system returns one of the following output parameters for each function execution:
● 0 = execution failed.● 1 = execution successful.
ExampleDim lResult As Long
lResult= Application.Run("SAPMoveDimension", "DS_1", "0COUNTRY", "AFTER", "0CALMONTH" )
If you you execute this command, dimension 0COUNTRY will be inserted in the crosstab to the position after dimension 0CALMONTH.
ExampleDim lResult As Long
lResult= Application.Run("SAPMoveDimension", "DS_1", "0COUNTRY", "ROWS", "2")
If you execute this command, dimension 0COUNTRY is added as second entry to the rows in the crosstab.
Analysis Plug-in User GuideCreating Workbooks P U B L I C 87
3.7.11 SAPOpenWorkbook
You can use this API method to open an Analysis workbook. The workbook to be opened can be stored on a SAP NetWeaver server or on a BI platform.
The workbook is opened in the same Microsoft Excel instance. After the command execution, the opened workbook is active.
To call the method, use Application.Run and specify the following input parameters:
● NameEnter the technical name of the document.For documents stored on a SAP NetWeaver server, this is the technical name as is it is shown in the Open dialog.For documents stored on a BI platform, it is the CUID that can be found in the general properties of an Analysis workbook in the CMC.
● Formula AliasEnter the formula alias for the data source or planning object, which provides the reference connection for the target workbook. The target workbook is the workbook that you want to open.If the referenced connection is a local connection to a BW system, the workbook is opened from this system. If the referenced connection is a system (BW or HANA) on a BI platform, the workbook is opened from the BI platform.This parameter is mandatory if several connections are used in the workbook, which provides the reference connection for the target workbook. If only one connection is used in the workbook, it is optional.
● Parameters for variablesThis parameter is only relevant if variables are used in the data source.Enter the data source alias, the variable name and values.The data source alias is only required if a variable is used in several data sources, the variables are not merged and you want to specify different values for the same variable.There are three methods for entering the variable name and values:○ Enter one parameter, for example "[DS_1]0COUNTRY=France;0PRODUCT=P01;
[DS_2]0COUNTRY=Germany".○ Enter several parameters, for example
"[DS_1]0COUNTRY";"France";"[DS_1]0PRODUCT";"P01";"[DS_2]0COUNTRY";"Germany".○ Enter a mixture of both: one parameter per variable/value combination, for example
"[DS_1]0COUNTRY=France";"0PRODUCT=P0"1;"[DS_2]0COUNTRY=Germany"Limitations:The first method only allows single members as variable values, complex input strings are not allowed.As the Microsoft Excel command Application.Run is limited to 30 arguments, the second and third method only allow you to enter 14 variable or 28 value combinations.If you need to set more than 28 variable/value combinations with a complex input string (for example, multiple members separated by a semicolon), the third method can be changed to specify multiple variables in one string. In this case the data source alias is mandatory but can be left blank, for example "[DS_1]0COUNTRY=France";"[]0PRODUCT=P01; P02; P03;[DS_2]0COUNTRY=Germany".
The system returns one of the following output parameters for each command execution:
● 0 = execution failed.● 1 = execution successful.
88 P U B L I CAnalysis Plug-in User Guide
Creating Workbooks
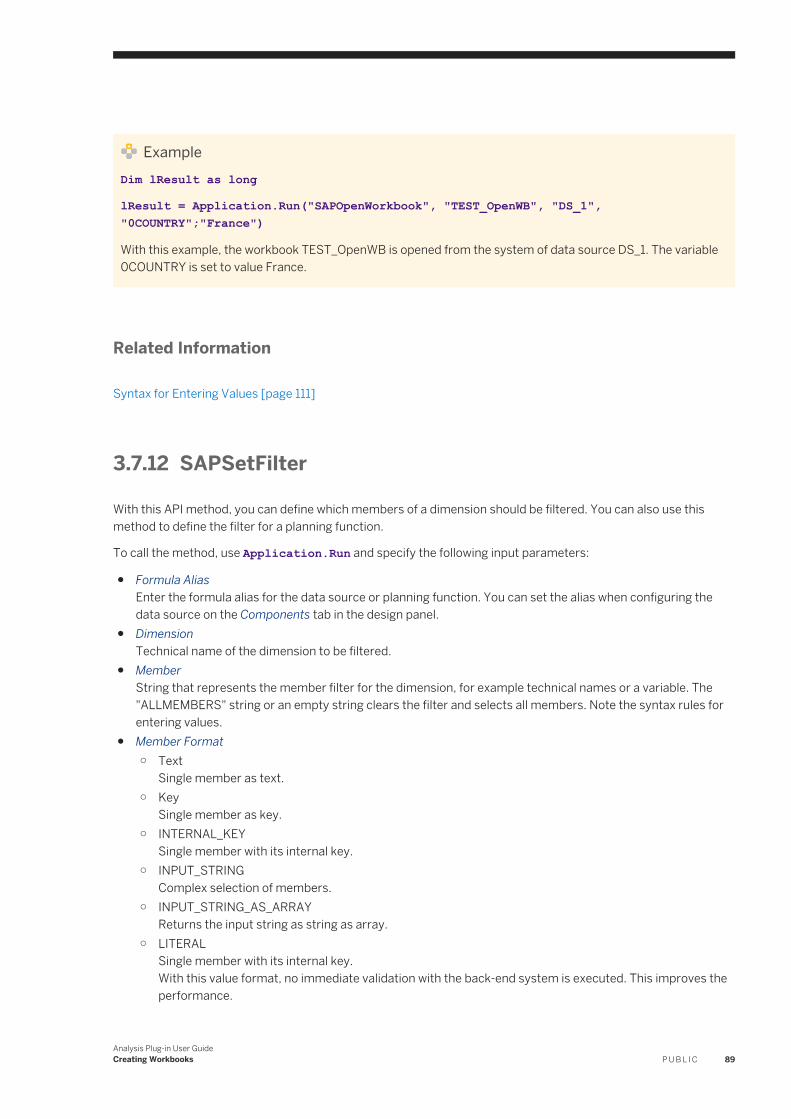
ExampleDim lResult as long
lResult = Application.Run("SAPOpenWorkbook", "TEST_OpenWB", "DS_1", "0COUNTRY";"France")
With this example, the workbook TEST_OpenWB is opened from the system of data source DS_1. The variable 0COUNTRY is set to value France.
Related Information
Syntax for Entering Values [page 111]
3.7.12 SAPSetFilter
With this API method, you can define which members of a dimension should be filtered. You can also use this method to define the filter for a planning function.
To call the method, use Application.Run and specify the following input parameters:
● Formula AliasEnter the formula alias for the data source or planning function. You can set the alias when configuring the data source on the Components tab in the design panel.
● DimensionTechnical name of the dimension to be filtered.
● MemberString that represents the member filter for the dimension, for example technical names or a variable. The "ALLMEMBERS" string or an empty string clears the filter and selects all members. Note the syntax rules for entering values.
● Member Format ○ Text
Single member as text.○ Key
Single member as key.○ INTERNAL_KEY
Single member with its internal key.○ INPUT_STRING
Complex selection of members.○ INPUT_STRING_AS_ARRAY
Returns the input string as string as array.○ LITERAL
Single member with its internal key.With this value format, no immediate validation with the back-end system is executed. This improves the performance.
Analysis Plug-in User GuideCreating Workbooks P U B L I C 89

This format is only valid if you set the prompt value with its internal key and you use the syntax rule Equal To.If the entered member is not valid, a message is displayed.
This parameter is optional. The default value is INPUT_STRING.
NoteThe KEY and INTERNAL_KEY depend on the InfoObject modeling in SAP NetWeaver BW.
The system returns one of the following output parameters for each function execution:
● 0 = execution failed.● 1 = execution successful.
ExampleDim lResult as long
lResult= Application.Run("SAPSetFilter", "DS_1", "0SOLD_TO__0COUNTRY", "CA;US;DE", "INPUT_STRING")
With this example, you set the filter for dimension 0SOLD_TO__0COUNTRY of data source DS_1 to the countries USA, Canada and Germany using member format INPUT_STRING.
Related Information
Syntax for Entering Values [page 111]
3.7.13 SAPSetPlanParameter
With this API method, you can define values for input-ready variables of planning objects.
To call the method, use Application.Run and specify the following input parameters:
● Formula AliasEnter the formula alias for the planning object. You can set the alias when configuring the planning object on the Components tab in the design panel.
● Variable NameName or technical name of the variable to be filtered.
● Variable ValueString that represents the value for the variable, for example the key. Note the syntax rules for entering values.
● Member Format ○ Text
Single member as text.○ Key
Single member as key.
90 P U B L I CAnalysis Plug-in User Guide
Creating Workbooks
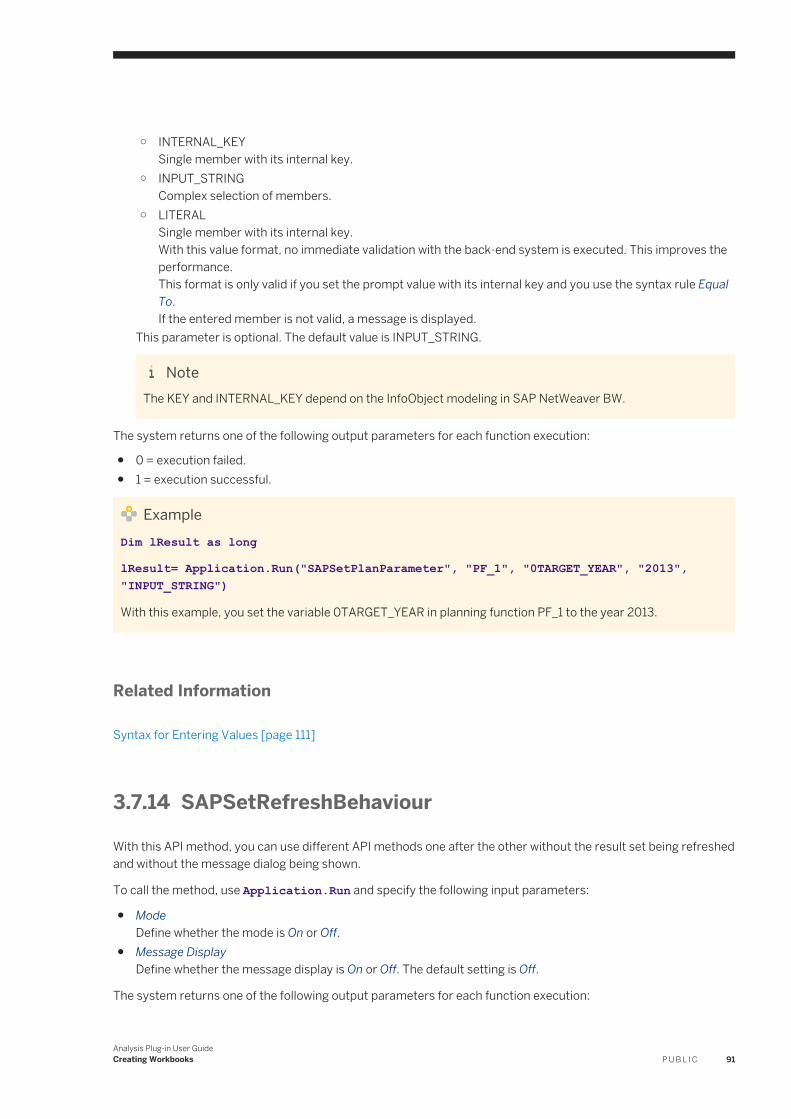
○ INTERNAL_KEYSingle member with its internal key.
○ INPUT_STRINGComplex selection of members.
○ LITERALSingle member with its internal key.With this value format, no immediate validation with the back-end system is executed. This improves the performance.This format is only valid if you set the prompt value with its internal key and you use the syntax rule Equal To.If the entered member is not valid, a message is displayed.
This parameter is optional. The default value is INPUT_STRING.
NoteThe KEY and INTERNAL_KEY depend on the InfoObject modeling in SAP NetWeaver BW.
The system returns one of the following output parameters for each function execution:
● 0 = execution failed.● 1 = execution successful.
ExampleDim lResult as long
lResult= Application.Run("SAPSetPlanParameter", "PF_1", "0TARGET_YEAR", "2013", "INPUT_STRING")
With this example, you set the variable 0TARGET_YEAR in planning function PF_1 to the year 2013.
Related Information
Syntax for Entering Values [page 111]
3.7.14 SAPSetRefreshBehaviour
With this API method, you can use different API methods one after the other without the result set being refreshed and without the message dialog being shown.
To call the method, use Application.Run and specify the following input parameters:
● ModeDefine whether the mode is On or Off.
● Message DisplayDefine whether the message display is On or Off. The default setting is Off.
The system returns one of the following output parameters for each function execution:
Analysis Plug-in User GuideCreating Workbooks P U B L I C 91
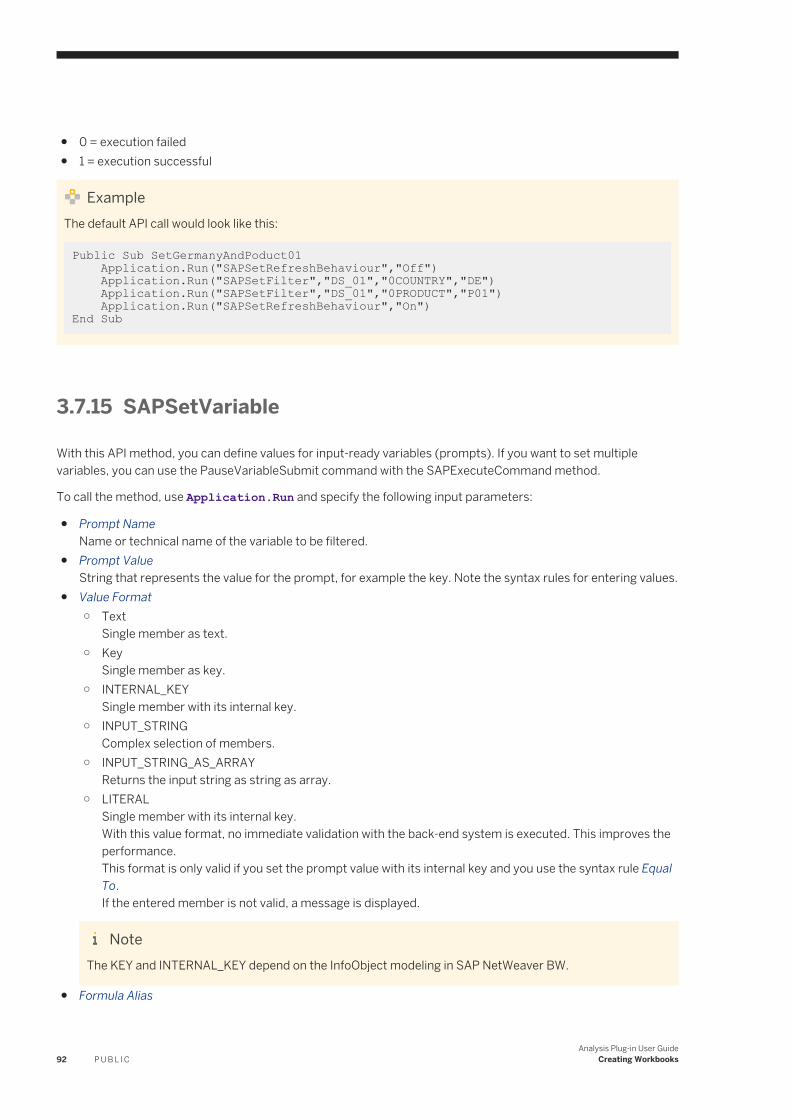
● 0 = execution failed● 1 = execution successful
ExampleThe default API call would look like this:
Public Sub SetGermanyAndPoduct01 Application.Run("SAPSetRefreshBehaviour","Off") Application.Run("SAPSetFilter","DS_01","0COUNTRY","DE") Application.Run("SAPSetFilter","DS_01","0PRODUCT","P01") Application.Run("SAPSetRefreshBehaviour","On")End Sub
3.7.15 SAPSetVariable
With this API method, you can define values for input-ready variables (prompts). If you want to set multiple variables, you can use the PauseVariableSubmit command with the SAPExecuteCommand method.
To call the method, use Application.Run and specify the following input parameters:
● Prompt Name Name or technical name of the variable to be filtered.
● Prompt ValueString that represents the value for the prompt, for example the key. Note the syntax rules for entering values.
● Value Format○ Text
Single member as text.○ Key
Single member as key.○ INTERNAL_KEY
Single member with its internal key.○ INPUT_STRING
Complex selection of members.○ INPUT_STRING_AS_ARRAY
Returns the input string as string as array.○ LITERAL
Single member with its internal key.With this value format, no immediate validation with the back-end system is executed. This improves the performance.This format is only valid if you set the prompt value with its internal key and you use the syntax rule Equal To.If the entered member is not valid, a message is displayed.
NoteThe KEY and INTERNAL_KEY depend on the InfoObject modeling in SAP NetWeaver BW.
● Formula Alias
92 P U B L I CAnalysis Plug-in User Guide
Creating Workbooks
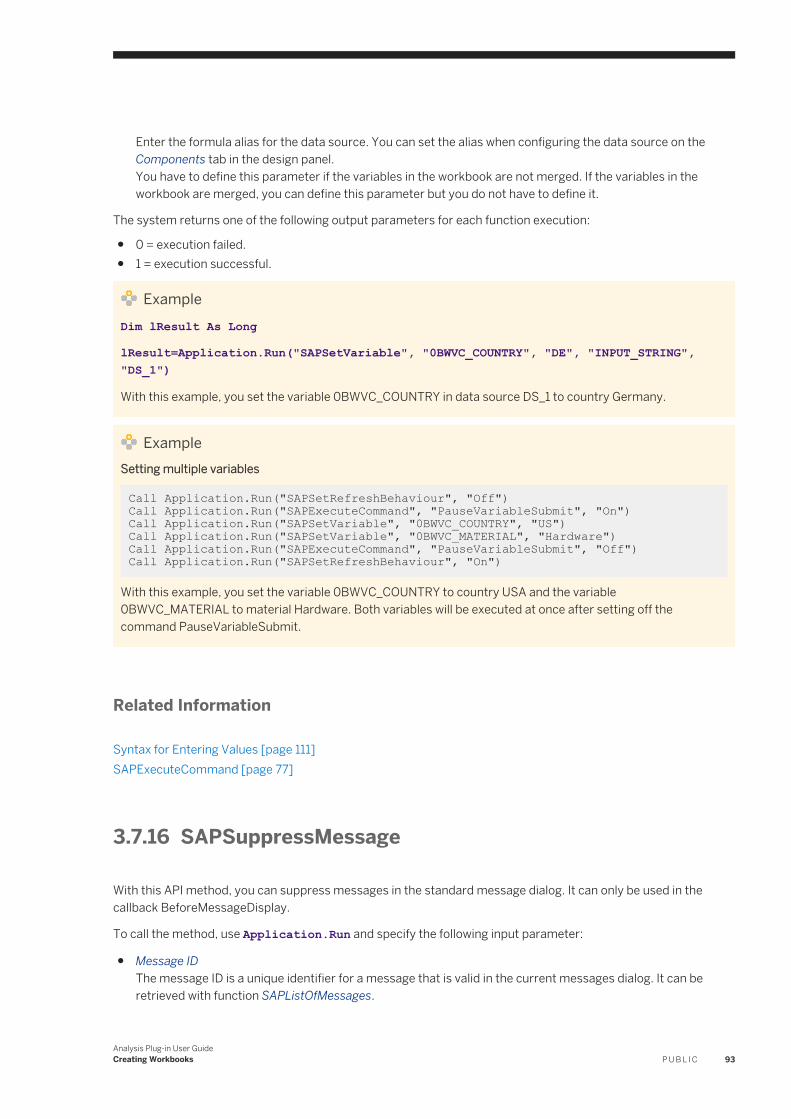
Enter the formula alias for the data source. You can set the alias when configuring the data source on the Components tab in the design panel.You have to define this parameter if the variables in the workbook are not merged. If the variables in the workbook are merged, you can define this parameter but you do not have to define it.
The system returns one of the following output parameters for each function execution:
● 0 = execution failed.● 1 = execution successful.
ExampleDim lResult As Long
lResult=Application.Run("SAPSetVariable", "0BWVC_COUNTRY", "DE", "INPUT_STRING", "DS_1")
With this example, you set the variable 0BWVC_COUNTRY in data source DS_1 to country Germany.
ExampleSetting multiple variables
Call Application.Run("SAPSetRefreshBehaviour", "Off")Call Application.Run("SAPExecuteCommand", "PauseVariableSubmit", "On")Call Application.Run("SAPSetVariable", "0BWVC_COUNTRY", "US")Call Application.Run("SAPSetVariable", "0BWVC_MATERIAL", "Hardware")Call Application.Run("SAPExecuteCommand", "PauseVariableSubmit", "Off")Call Application.Run("SAPSetRefreshBehaviour", "On")
With this example, you set the variable 0BWVC_COUNTRY to country USA and the variable 0BWVC_MATERIAL to material Hardware. Both variables will be executed at once after setting off the command PauseVariableSubmit.
Related Information
Syntax for Entering Values [page 111]SAPExecuteCommand [page 77]
3.7.16 SAPSuppressMessage
With this API method, you can suppress messages in the standard message dialog. It can only be used in the callback BeforeMessageDisplay.
To call the method, use Application.Run and specify the following input parameter:
● Message ID The message ID is a unique identifier for a message that is valid in the current messages dialog. It can be retrieved with function SAPListOfMessages.
Analysis Plug-in User GuideCreating Workbooks P U B L I C 93

The system returns one of the following output parameters for each function execution:
● 0 = execution failed.● 1 = execution successful.
Examplelret = Application.Run("SAPSuppressMessage", "5")
The message with message ID 5 is suppressed in the message dialog.
Related Information
Using Callbacks [page 105]SAPListOfMessages [page 67]SAPAddMessage [page 74]
3.7.17 Table Design API
Table Design API enables you to edit single elements in a crosstab with API methods (for example, you can add a new line to the crosstab).
The Table Design API offers methods for the following options:
● Applying formats● Adding new lines● Adding texts to new lines● Fixing the line size● Listing Table Design API methods for a specific data source● Deleting Table Design API methods for a specific data source
Related Information
Editing crosstabs with Table Design [page 45]
3.7.17.1 SAPSetFormat
With this API method, you can apply defined cell styles as formats to single cells and cell ranges. You can use and select standard Microsoft Excel cell styles, SAP cell styles and user-defined cell styles.
To call the method, use Application.Run and specify the following input parameters:
94 P U B L I CAnalysis Plug-in User Guide
Creating Workbooks

● RuleIDIf you define a rule ID, you can address it in other API methods, for example for deleting the rule with SAPDeleteDesignRule.If you do not define an ID, the system generates one automatically.
● Data Source AliasEnter the formula alias for the data source. You can set the alias when configuring the data source on the Components tab in the design panel.
● StyleEnter the style that should be applied.
● First Line Type and attributesWith the first and second line type and their atttributes, you can define the anchor for the area in the crosstab, which you want the selected format to be applied to. The operation anchor, or operation context, is defined as a crossing point of two lines. Each line is defined using two parameters: line type and line context (attributes). Different context information is expected, depending on the line type.You can enter one of the following constant types and their relevant attributes:○ DIMENSION
To define a dimension, enter the constant DIMENSION and the technical name of the dimension as the attribute.
○ MEMBERTo define a member, enter the constant MEMBER and the technical names of the dimension and the member as attributes.
○ RESULTMEMBERTo define a result member, enter the constant RESULTMEMBER and the technical name of the dimension as the attribute.
○ HIERARCHYNODETo define a hierarchy node, enter the constant HIERARCHYNODE and the technical names of the dimension, the member and the node as attributes.
○ VIRTUALHEADERTo define a new inserted header line, enter VIRTUALHEADER and the rule ID of the inserted line.
○ VIRTUALDIMENSIONTo define a new inserted dimension line, enter VIRTUALDIMENSION and the rule ID of the inserted line.
○ VIRTUALMEMBERTo define a member of a new inserted dimension line, enter VIRTUALMEMBER and the rule ID of the inserted line.
○ TUPLEThe constant TUPLE can be used to define a combination of members of various dimensions on an axis.To define a TUPLE, enter one of the following member types with the corresponding attributes:○ MEMBER with the technical names of the dimension and the member as attributes.○ VIRTUALMEMBER with the rule ID of the inserted line as the attribute.○ RESULTMEMBER with the technical name of the dimension as the attribute.○ HIERARCHYNODE with the technical names of the dimension, the member and the node as
attributes.● Second Line Type and attributes
You can enter the same constants and attributes as for the first line type. If you enter a second line type, you can specify the anchor more precisely.
● Scope AreaThis parameter is optional. You can enter one of the following values:○ CONTEXT
Analysis Plug-in User GuideCreating Workbooks P U B L I C 95

The parameter CONTEXT is the anchor defined with first and second line type. Context is the default value for the scope area parameter.
○ FIRSTThe parameter FIRST defines the area on the left or top from the anchor as the scope area.
○ SECONDThe parameter SECOND defines the area on the right or bottom from the anchor as the scope area.
○ BOTHThe parameter BOTH defines the areas of the parameters FIRST and SECOND as the scope area.
● Scope AxisThis parameter is optional. You can enter one of the following values:○ PRIMARY
PRIMARY applies style to the primary axis, depending on the context.○ SECONDARY
SECONDARY applies style to the secondary axis, depending on the context.○ ROW
ROW applies the style to the specified area on the row axis.○ COLUMN
COLUMN applies style to the specified context on the column axis.
ExampleApply a style to a member
Dim lResult As String
lResult= Application.Run("SAPSetFormat", "Style1", "DS_1", "Green", "MEMBER", "0CALYEAR;2014")
The style Green is applied to member 2014 of the dimension 0CALYEAR. If the member 2014 appears several times in the crosstab, the style is applied to each occurrence. The rule ID for the applied style is Style1.
ExampleApply a style to the data cells of a member for one measure
Dim lResult As String
lResult= Application.Run("SAPSetFormat", "Style2", "DS_1", "Green", "TUPLE", "MEMBER;0CALYEAR;2014", "TUPLE", "MEMBER;Measure;Sales")
The style Green is applied to the data cell for measure Sales of member 2014 of the dimension 0CALYEAR. If the member 2014 appears several times in the crosstab with data cells for measures Sales, the style is applied to each corresponding data cell. The rule ID for the applied style is Style2.
ExampleApply a style to a member and to the data cells of the member for several measures
Dim lResult As String
lResult= Application.Run("SAPSetFormat", "Style3", "DS_1", "Green", "TUPLE", "MEMBER;0CALYEAR;2014", "TUPLE", "MEMBER;Measure;Sales","Both")
96 P U B L I CAnalysis Plug-in User Guide
Creating Workbooks

The style Green is applied to member 2014 of the dimension 0CALYEAR and to the corresponding data cell of measure Sales. If there are data cells for other measures in the same row, the style is also applied to these cells. If the member 2014 appears several times in the crosstab, the style is applied to each occurrence and the corresponding data cells. The rule ID for the applied style is Style3.
3.7.17.2 SAPInsertLine
With this API method, you can insert new lines in a crosstab.
To call the method, use Application.Run and specify the following input parameters:
● RuleIDIf you define a rule ID, you can address it in other API methods, for example for deleting the rule with SAPDeleteDesignRule.If you do not define an ID, the system generates one automatically.
● Data Source AliasEnter the formula alias for the data source. You can set the alias when configuring the data source on the Components tab in the design panel.
● PositionEnter one of the following positions: Before, After, BelowHeader or BesideHeader.
● PositionByEnter one of the following crosstab elements: Dimension, DimensionResult, DimensionGroup, DimensionMember, HierarchyNode or Tuple.The constant TUPLE can be used to define a combination of members of various dimensions on an axis.
● PositionBy parametersIf PositionBy is set to Dimension, DimensionResult or DimensionGroup, enter the technical name of the relative dimension.If PositionBy is set to DimensionMember, enter the technical name of the relative dimension and member.If PositionBy is set to HierarchyNode, enter the technical name of the relative dimension, member and node type.If PositionBy is set to Tuple, enter one of the following member types of the relative member with the corresponding attributes:○ MEMBER with the technical names of the dimension and the member as attribute.○ VIRTUALMEMBER with the rule ID of the inserted line as attribute.○ RESULTMEMBER with the technical name of the dimension as attribute.○ HIERARCHYNODE with the technical names of the dimension, the member and the node as attribute.
If you define a tuple, you have to specify placeholders for the parameters dimension, member and node type (see example 2).
ExampleInserting a line after a dimension
Dim lResult As String
lResult= Application.Run("SAPInsertLine", "NewLine1", "DS_1", "After", "Dimension", "0CALYEAR")
Analysis Plug-in User GuideCreating Workbooks P U B L I C 97

A new line is inserted after the dimension 0CALYEAR in the crosstab of data source DS_1. The rule ID for the new line is NewLine1.
ExampleInserting a line after a tuple
Dim lResult As String
Dim tupleArray(1) As String
tupleArray(0)= "Member;0CALYEAR;2014"
tupleArray(1)= "Member;0COUNTRY;FR"
lResult= Application.Run("SAPInsertLine", "NewLine2", "DS_1", "After", "Tuple",,,, tupleArray)
A new line is inserted after the combination of the members 2014 and France (FR) in the crosstab of data source DS_1. The rule ID for the new line is NewLine2.
The three placeholders after the PositionBy element Tuple replace the attributes dimension, member and node type that are not relevant for the element Tuple.
ExampleInserting a line after a hierarchy node
Dim lResult As String
lResult= Application.Run("SAPInsertLine", "NewLine3", "DS_1", "After", "HierarchyNode", "0Country", "FR", "State")
A new line is inserted after the member France (FR) in the crosstab of data source DS_1. The node type is State. If the member France occurs several times in the crosstab, a new line is inserted after each occurrence. The rule ID for the new line is NewLine3.
3.7.17.3 SAPFixLineSize
With this API method, you can define the size for a inserted line.
To call the method, use Application.Run and specify the following input parameters:
● RuleIDIf you define a rule ID, you can address it in other API methods, for example for deleting the rule with SAPDeleteDesignRule.If you do not define an ID, the system generates one automatically.
● Data Source AliasEnter the formula alias for the data source. You can set the alias when configuring the data source on the Components tab in the design panel.
● ID of new lineEnter the rule ID of the inserted line whose size you want to fix.
98 P U B L I CAnalysis Plug-in User Guide
Creating Workbooks

● Size Enter an integer number. The measurement unit for the size is pixels.
ExampleDim lResult As String
lResult= Application.Run("SAPFixLineSize", "SizeLine1", "DS_1", "NewLine1", "20")
The size of the new inserted line with ID NewLine1 is set to 20 pixels. The rule ID for the new line size is SizeLine1.
3.7.17.4 SAPListOfDesignRules
With this API method, you can list Table Design methods defined for a specific data source.
To call the method, use Application.Run and specify the following input parameters:
● Data Source AliasEnter the formula alias for the data source. You can set the alias when configuring the data source on the Components tab in the design panel.
● API Method TypeEnter one of the following types:○ All to list all methods.○ NewLine to list the inserted lines.
You can specify the new lines in more detail by using NewDimensionLine, NewHeaderLine or NewMemberLine.
○ LineSize to list the defined sizes for new inserted lines.○ Format to list the defined formats.
ExampleDim lResult As Variant
lResult= Application.Run("SAPListOfDesignRules", "DS_1", "NewLine")
All inserted lines defined for data source DS_1 with method SAPInsertLine are listed.
3.7.17.5 SAPDeleteDesignRule
With this API method, you can delete a rule that was applied with the Table Design API.
To call the method, use Application.Run and specify the following input parameters:
● Data Source AliasEnter the formula alias for the data source. You can set the alias when configuring the data source on the Components tab in the design panel.
Analysis Plug-in User GuideCreating Workbooks P U B L I C 99

● RuleIDEnter the rule ID of the rule to be deleted. If you do not specify a rule ID, all rules defined for that data source will be deleted.
The system returns one of the following output parameters for each execution:
ExampleDim lResult As Boolean
lResult= Application.Run("SAPDeleteDesignRule", "DS_1")
All rules defined for data source DS_1 are deleted.
3.7.18 Using Analysis functions
You can use the Analysis functions in VBA macros. The return value of a formula in a macro corresponds to the return value of the formula used in a Microsoft Excel sheet. Depending on the function that you use, a formula can either return a single value (single string value) or a list (array). If the list contains only one line, the returning array is one-dimensional. If the list contains two or more lines the array is two-dimensional.
If you use a formula in a macro, the function is the first parameter followed by the arguments you use to create a formula with this function.
If a formula is invalid, Microsoft Excel returns an error.
ExampleFormula returning a single string value
Dim lResult As Variant
lResult = Application.Run("SAPGetVariable", "DS_2", "0BW_VAR", "Value")
This formula returns the current value of variable 0BW_VAR.
ExampleFormula returning an array
Dim lResult As Variant
lResult = Application.Run("SAPListOfDimensions", "DS_1")
This formula returns a list with the dimensions of data source DS_1. If the data source contains only one dimension, the returned array is one-dimensional.
To make your programming easier, you can create an additional function to ensure that the array is always two-dimensional, for example the function GetAsTwoDimArray.
Function GetAsTwoDimArray(value As Variant) As Variant'value is error return the errorIf IsError(value) ThenGetAsTwoDimArray = value'value is array
100 P U B L I CAnalysis Plug-in User Guide
Creating Workbooks
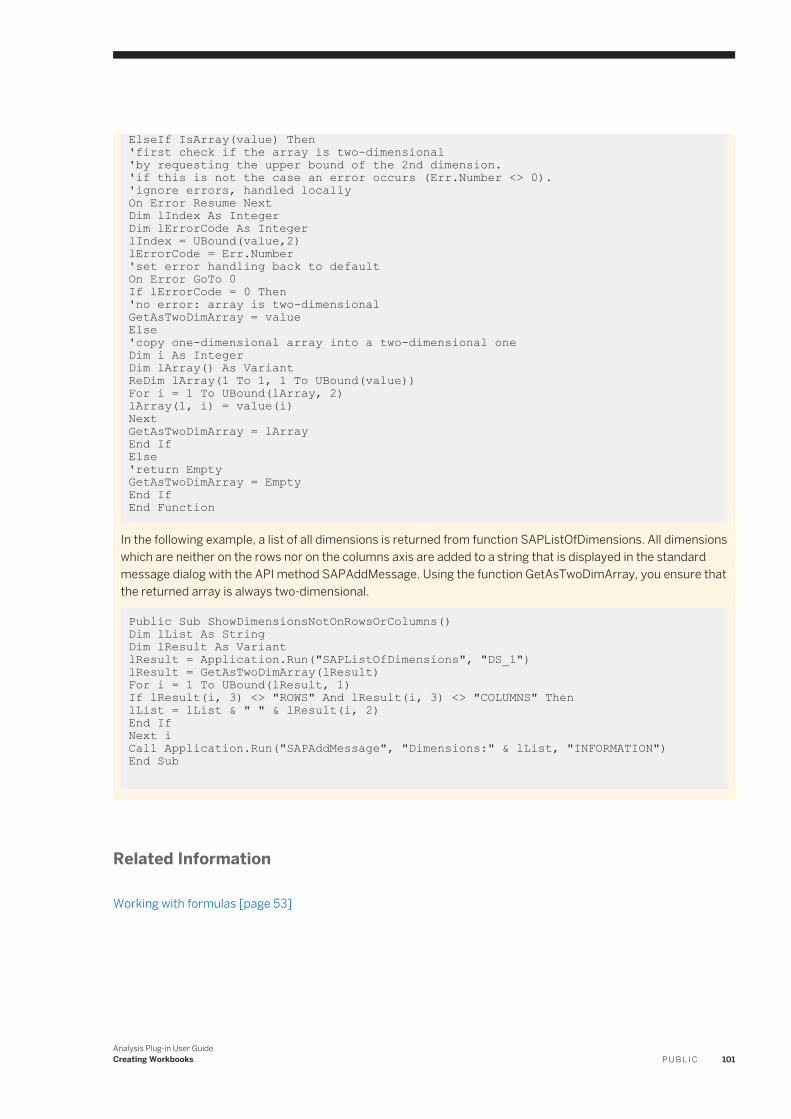
ElseIf IsArray(value) Then'first check if the array is two-dimensional'by requesting the upper bound of the 2nd dimension.'if this is not the case an error occurs (Err.Number <> 0).'ignore errors, handled locallyOn Error Resume NextDim lIndex As IntegerDim lErrorCode As IntegerlIndex = UBound(value,2)lErrorCode = Err.Number'set error handling back to defaultOn Error GoTo 0If lErrorCode = 0 Then'no error: array is two-dimensionalGetAsTwoDimArray = valueElse'copy one-dimensional array into a two-dimensional oneDim i As IntegerDim lArray() As VariantReDim lArray(1 To 1, 1 To UBound(value))For i = 1 To UBound(lArray, 2)lArray(1, i) = value(i)NextGetAsTwoDimArray = lArrayEnd IfElse'return EmptyGetAsTwoDimArray = EmptyEnd IfEnd Function
In the following example, a list of all dimensions is returned from function SAPListOfDimensions. All dimensions which are neither on the rows nor on the columns axis are added to a string that is displayed in the standard message dialog with the API method SAPAddMessage. Using the function GetAsTwoDimArray, you ensure that the returned array is always two-dimensional.
Public Sub ShowDimensionsNotOnRowsOrColumns()Dim lList As StringDim lResult As VariantlResult = Application.Run("SAPListOfDimensions", "DS_1")lResult = GetAsTwoDimArray(lResult)For i = 1 To UBound(lResult, 1)If lResult(i, 3) <> "ROWS" And lResult(i, 3) <> "COLUMNS" ThenlList = lList & " " & lResult(i, 2)End IfNext iCall Application.Run("SAPAddMessage", "Dimensions:" & lList, "INFORMATION")End Sub
Related Information
Working with formulas [page 53]
Analysis Plug-in User GuideCreating Workbooks P U B L I C 101

3.7.19 Hiding / Showing Analysis UI components
You can use the commands Hide and Show of the API method SAPExecuteCommand to hide and show Analysis UI components.
The changed visibility of UI components is valid for the active workbook in which the VBA macro is executed. If the Analysis tab is hidden in a workbook and the user switches to another workbook, the Analysis tab is visible again. When switching back to the first workbook, the Analysis tab is hidden again.
The following types and IDs are supported:
● Ribbon○ All
Use this ID to hide the Analysis tab in the ribbon.Example: Application.Run("SAPExecuteCommand", "Hide", "Ribbon", "All")
○ DefaultUse this ID to show the Analysis tab in the ribbon.Example:
● ContextMenu○ All
Use this ID to hide the Analysis context menu.Application.Run("SAPExecuteCommand", "Hide", "ContextMenu", "All") Default DefaultExample: Example:
○ Default DefaultUse this ID to show the complete context menu.Example: Application.Run("SAPExecuteCommand", "Show", "ContextMenu", "Default") Application.Run("SAPExecuteCommand", "Show",
Related Information
SAPExecuteCommand [page 77]Enhancing the Analysis Ribbon [page 102]
3.7.20 Enhancing the Analysis Ribbon
The Microsoft Office Ribbons can be enhanced and adjusted. You can learn more about the general ribbon enhancement in the Microsoft documentation.
If you build an application related to Analysis, you can visualize the dependencies to Analysis by locating the new ribbon tab beside (before/after) the Analysis tab or by adding new ribbon groups to the Analysis tab. The ribbon is described via an XML definition where an identifier is assigned to each item. The Analysis tab has a qualified identifier (idQ) with the name space SapExcelAddIn and the id com.sap.ip.bi.analysis.menu.
102 P U B L I CAnalysis Plug-in User Guide
Creating Workbooks
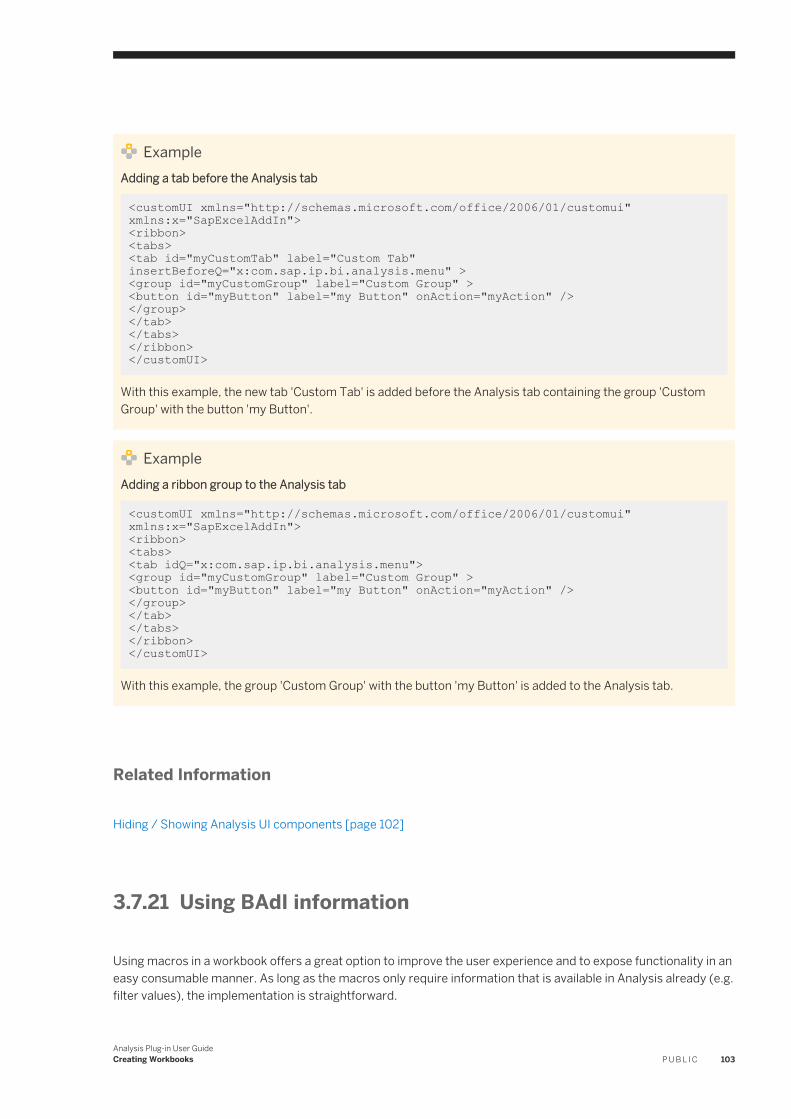
ExampleAdding a tab before the Analysis tab
<customUI xmlns="http://schemas.microsoft.com/office/2006/01/customui"xmlns:x="SapExcelAddIn"><ribbon><tabs><tab id="myCustomTab" label="Custom Tab" insertBeforeQ="x:com.sap.ip.bi.analysis.menu" ><group id="myCustomGroup" label="Custom Group" ><button id="myButton" label="my Button" onAction="myAction" /></group></tab></tabs></ribbon></customUI>
With this example, the new tab 'Custom Tab' is added before the Analysis tab containing the group 'Custom Group' with the button 'my Button'.
ExampleAdding a ribbon group to the Analysis tab
<customUI xmlns="http://schemas.microsoft.com/office/2006/01/customui"xmlns:x="SapExcelAddIn"><ribbon><tabs><tab idQ="x:com.sap.ip.bi.analysis.menu"><group id="myCustomGroup" label="Custom Group" ><button id="myButton" label="my Button" onAction="myAction" /></group></tab></tabs></ribbon></customUI>
With this example, the group 'Custom Group' with the button 'my Button' is added to the Analysis tab.
Related Information
Hiding / Showing Analysis UI components [page 102]
3.7.21 Using BAdI information
Using macros in a workbook offers a great option to improve the user experience and to expose functionality in an easy consumable manner. As long as the macros only require information that is available in Analysis already (e.g. filter values), the implementation is straightforward.
Analysis Plug-in User GuideCreating Workbooks P U B L I C 103
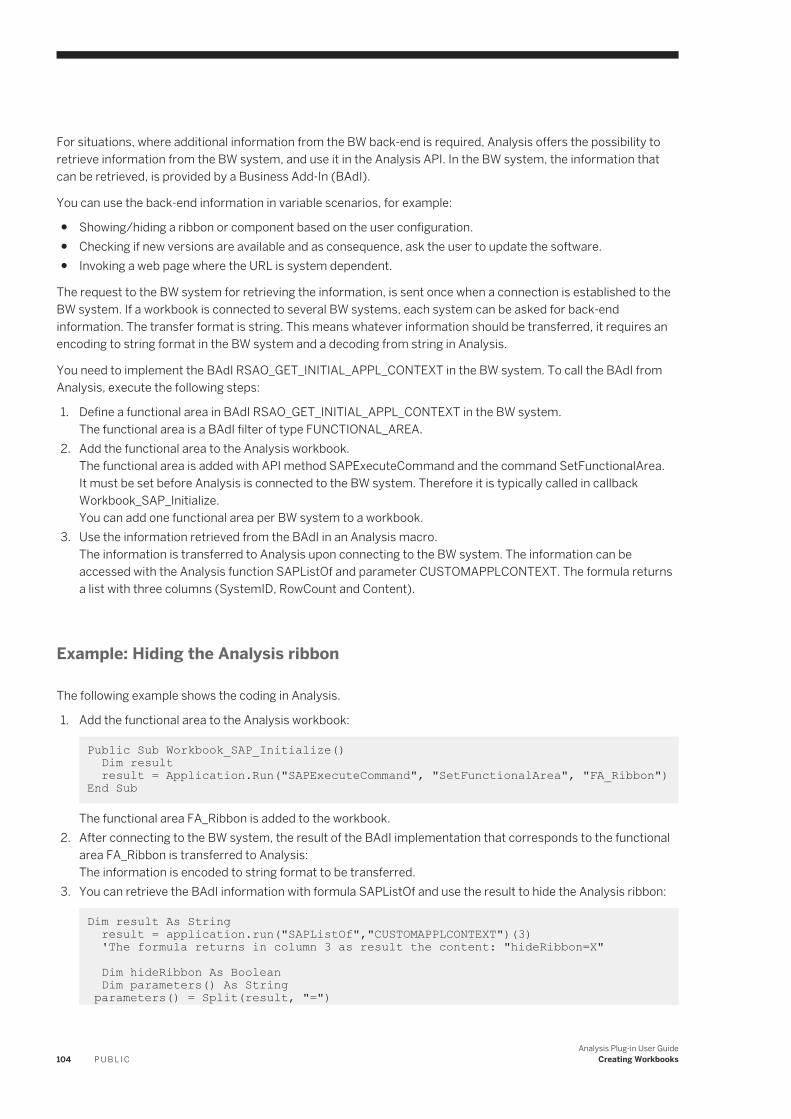
For situations, where additional information from the BW back-end is required, Analysis offers the possibility to retrieve information from the BW system, and use it in the Analysis API. In the BW system, the information that can be retrieved, is provided by a Business Add-In (BAdI).
You can use the back-end information in variable scenarios, for example:
● Showing/hiding a ribbon or component based on the user configuration.● Checking if new versions are available and as consequence, ask the user to update the software.● Invoking a web page where the URL is system dependent.
The request to the BW system for retrieving the information, is sent once when a connection is established to the BW system. If a workbook is connected to several BW systems, each system can be asked for back-end information. The transfer format is string. This means whatever information should be transferred, it requires an encoding to string format in the BW system and a decoding from string in Analysis.
You need to implement the BAdI RSAO_GET_INITIAL_APPL_CONTEXT in the BW system. To call the BAdI from Analysis, execute the following steps:
1. Define a functional area in BAdI RSAO_GET_INITIAL_APPL_CONTEXT in the BW system.The functional area is a BAdI filter of type FUNCTIONAL_AREA.
2. Add the functional area to the Analysis workbook.The functional area is added with API method SAPExecuteCommand and the command SetFunctionalArea.It must be set before Analysis is connected to the BW system. Therefore it is typically called in callback Workbook_SAP_Initialize.You can add one functional area per BW system to a workbook.
3. Use the information retrieved from the BAdI in an Analysis macro.The information is transferred to Analysis upon connecting to the BW system. The information can be accessed with the Analysis function SAPListOf and parameter CUSTOMAPPLCONTEXT. The formula returns a list with three columns (SystemID, RowCount and Content).
Example: Hiding the Analysis ribbon
The following example shows the coding in Analysis.
1. Add the functional area to the Analysis workbook:
Public Sub Workbook_SAP_Initialize() Dim result result = Application.Run("SAPExecuteCommand", "SetFunctionalArea", "FA_Ribbon")End Sub
The functional area FA_Ribbon is added to the workbook.2. After connecting to the BW system, the result of the BAdI implementation that corresponds to the functional
area FA_Ribbon is transferred to Analysis:The information is encoded to string format to be transferred.
3. You can retrieve the BAdI information with formula SAPListOf and use the result to hide the Analysis ribbon:
Dim result As String result = application.run("SAPListOf","CUSTOMAPPLCONTEXT")(3) 'The formula returns in column 3 as result the content: "hideRibbon=X" Dim hideRibbon As Boolean Dim parameters() As String parameters() = Split(result, "=")
104 P U B L I CAnalysis Plug-in User Guide
Creating Workbooks

If parameters(0) = "hideRibbon" and parameters(1) = "X" Then hideRibbon = True Else hideRibbon = FalseEnd IfIf hideRibbon = True Application.run("SAPExecuteCommand","Hide","Ribbon")End If
The result "hideRibbon=X" is the encoded string provided by the BW system.The BAdI information is decoded from string and used to hide the Analysis ribbon with API method SAPExecuteCommand.
Related Information
SAPListOf [page 63]SAPExecuteCommand [page 77]
3.7.22 Using Callbacks
Analysis offers different callbacks that are executed with certain events. Callback 'Workbook_SAP_Initialize' is always executed. The other callbacks listed below must be registered with the API method 'SAPExecuteCommand' before being used for the first time. To deregister the callbacks, you can also use 'SAPExecuteCommand'.
Every callback can be registered only once in a workbook. If you register one of the callbacks for a second time, the first registration is overwritten.
NoteCallback 'Workbook_SAP_Initialize' has to be defined in the 'ThisWorkbook' section of the VBA editor. The other callbacks should be defined in a module. If they are defined in the 'ThisWorkbook' or a sheet section, they have to be fully referenced during registration. In the 'ThisWorkbook' section, for example, you have to use ThisWorkbook.<MacroName> as a reference.
Workbook_SAP_Initialize
Use this callback to define the initialization logic of the workbook. This callback is similar to the 'Workbook_Open' event offered by Microsoft Excel, but it is executed after the Microsoft Excel event and after the Analysis standard initialization. If you open a workbook in Microsoft Excel and then activate Analysis, the Excel event is executed when opening the workbook, and the Analysis standard initialization and the callback are executed after the activation of Analysis.
The callback has to be defined as a subroutine without input parameters.
Analysis Plug-in User GuideCreating Workbooks P U B L I C 105

Example
' defined in ThisWorkbookPublic Sub Workbook_SAP_Initialize()' register callbacksCall Application.Run("SAPExecuteCommand", "RegisterCallback", "AfterRedisplay", "Callback_AfterRedisplay")Call Application.Run("SAPExecuteCommand", "RegisterCallback", "BeforePlanDataSave", "Callback_BeforePlanDataSave")Call Application.Run("SAPExecuteCommand", "RegisterCallback", "BeforePlanDataReset", "Callback_BeforePlanDataReset")Call Application.Run("SAPExecuteCommand", "RegisterCallback", "BeforeMessageDisplay", "Callback_BeforeMessageDisplay")Call Application.Run("SAPExecuteCommand", "RegisterCallback", "BeforeFirstPromptsDisplay", "Callback_BeforeFirstPromptsDisplay")End Sub
The 'AfterRedisplay', 'BeforePlanDataSave' and 'BeforePlanDataReset' callbacks are registered during workbook initialization and can therefore be used in the VBA project.
AfterRedisplay
Use this callback to define the logic that should take place every time the workbook is redisplayed. For example, you can automatically adapt the formatting in the workbook after every redisplay.
The callback has to be defined as subroutine without input parameters. The callback is called only when 'Pause Refresh' on workbook level is false or the user explicitly requested a 'Refresh All'. It is also called only when the active workbook has been changed.
Example ' defined in a modulePublic Sub Callback_After Redisplay() ThisWorkbook.Worksheets("Sheet1").Cells(1, 1).Value = "Last redisplay: "ThisWorkbook.Worksheets("Sheet1").Cells(1, 2).Value = Now()End Sub
With this callback, the text "Last redisplay: " is displayed in cell A1 on sheet 1, and in cell A2, the date and time of the last redisplay are displayed. The information is updated after every redisplay.
ExampleWith the following code, you can get the crosstabs and data sources that have been changed since the last user action and that therefore now have been updated in the sheets.
NoteThese calls work only withing the 'Callback_AfterRedisplay'. Otherwise they will return an error. Objects that have just been deleted will not be part of the returned array.
lResult= Application.Run("SAPGetProperty", "CHANGEDCROSSTABS")
106 P U B L I CAnalysis Plug-in User Guide
Creating Workbooks
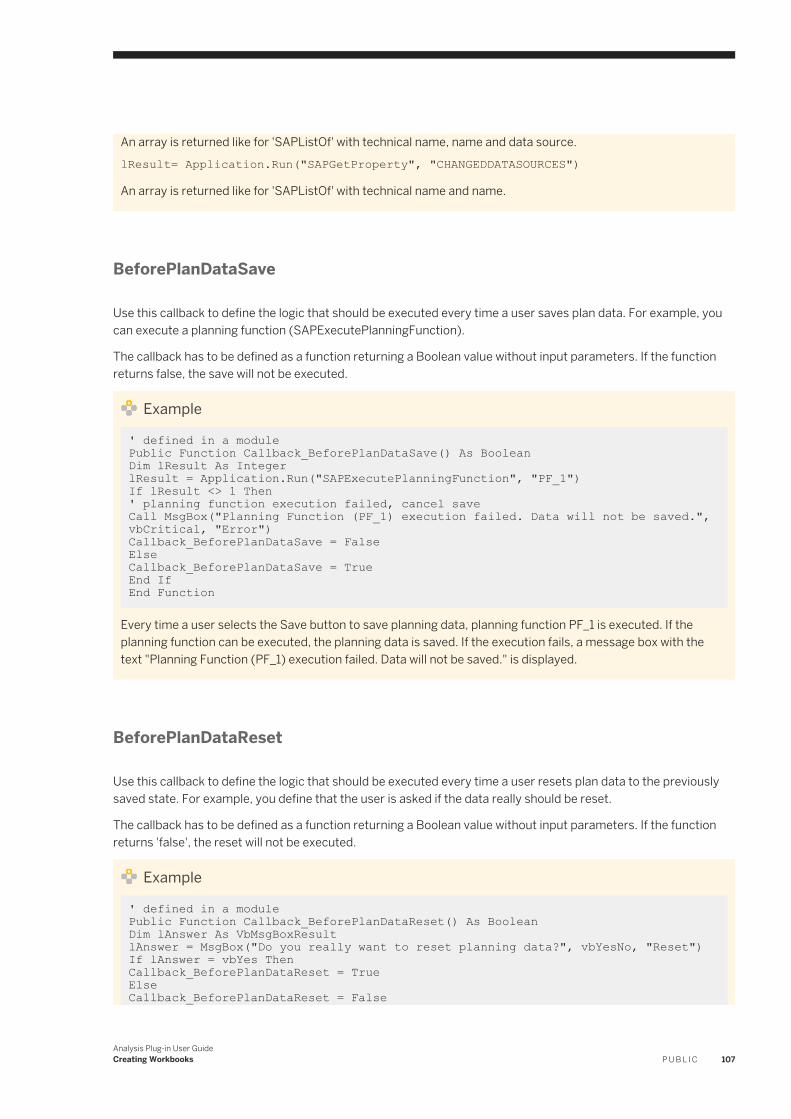
An array is returned like for 'SAPListOf' with technical name, name and data source.lResult= Application.Run("SAPGetProperty", "CHANGEDDATASOURCES")
An array is returned like for 'SAPListOf' with technical name and name.
BeforePlanDataSave
Use this callback to define the logic that should be executed every time a user saves plan data. For example, you can execute a planning function (SAPExecutePlanningFunction).
The callback has to be defined as a function returning a Boolean value without input parameters. If the function returns false, the save will not be executed.
Example ' defined in a modulePublic Function Callback_BeforePlanDataSave() As BooleanDim lResult As IntegerlResult = Application.Run("SAPExecutePlanningFunction", "PF_1")If lResult <> 1 Then' planning function execution failed, cancel saveCall MsgBox("Planning Function (PF_1) execution failed. Data will not be saved.", vbCritical, "Error")Callback_BeforePlanDataSave = FalseElseCallback_BeforePlanDataSave = TrueEnd IfEnd Function
Every time a user selects the Save button to save planning data, planning function PF_1 is executed. If the planning function can be executed, the planning data is saved. If the execution fails, a message box with the text "Planning Function (PF_1) execution failed. Data will not be saved." is displayed.
BeforePlanDataReset
Use this callback to define the logic that should be executed every time a user resets plan data to the previously saved state. For example, you define that the user is asked if the data really should be reset.
The callback has to be defined as a function returning a Boolean value without input parameters. If the function returns 'false', the reset will not be executed.
Example ' defined in a modulePublic Function Callback_BeforePlanDataReset() As BooleanDim lAnswer As VbMsgBoxResultlAnswer = MsgBox("Do you really want to reset planning data?", vbYesNo, "Reset")If lAnswer = vbYes ThenCallback_BeforePlanDataReset = TrueElseCallback_BeforePlanDataReset = False
Analysis Plug-in User GuideCreating Workbooks P U B L I C 107

End IfEnd Function
Every time a user enters planning data and selects Back To previous saved state , a message box with the text "Do you really want to reset planning data?" is displayed. If the user selects 'Yes', the entered data is reset to the previous saved state. If the user selects 'No', the reset is not executed.
BeforeMessageDisplay
Use this callback to specify which messages are displayed in the message dialog.
This callback is called whenever the messages dialog is displayed. You can provide some actions that affect which messages will be displayed. Two typical actions are to suppress one or several messages with SAPSuppressMessage or to add one or several messages with SAPAddMessage.
Example Public Sub Callback_BeforeMessageDisplay() Dim messageList As Variant Dim messages As Variant Dim lRet As Variant Dim messageCount As Variant Dim i As Integer messageList = Application.Run("SAPListOfMessages", ,"True") messages = GetAsTwoDimArray(messageList) ' see "Using Analysis functions" messageCount = UBound(messages, 1) For i = 1 To messageCount If messages(i, 5) = "INFORMATION" Then lRet = Application.Run("SAPSuppressMessage", messages(i, 1)) End If Next iEnd Sub
The function SAPListOfMessages with parameter True lists the messages with detailed information. The details are always listed in a determined sequence.
At position 5, the message severity is listed. The example shows that all messages with severity INFORMATION will be suppressed in the message dialog.
BeforeFirstPromptsDisplay
Use this callback to perform operations before the initial display of the prompting dialog. It is triggered when the prompting dialog is called for the first time and when changing the Merge Variables property in the workbook. If the property Force Prompt for Initial Refresh is not selected, variable values are set without displaying the prompting dialog.
You can use this callback to overwrite default values before calling the prompting dialog for the first time, to define a workbook variant in the workbook that automatically fills the variable values or to use dynamic values (e.g. 'today' or 'last week') without defining dedicated variables.
108 P U B L I CAnalysis Plug-in User Guide
Creating Workbooks

Example ' defined in a modulePublic Sub onBeforeFirstPromptsDisplay(dpNames As Variant) Dim dpName As Variant For Each dpName In dpNames If dpName = "DS_1" Then Call Application.Run("SAPSetVariable", "COUNTRY", "EN", "INPUT_STRING", "DS_1") End If NextEnd Sub
The variable COUNTRY is set to value EN before the prompting dialog is initially displayed. The input variable dpNames contains all data source aliases which are part of the current refresh processing. In this example, it is only asked for one data source: DS_1.
Related Information
SAPExecuteCommand [page 77]SAPExecutePlanningFunction [page 82]SAPAddMessage [page 74]SAPSuppressMessage [page 93]SAPListOfMessages [page 67]
3.7.23 Using LastError information
You can use the property LastError of the API method SAPGetProperty to get a more detailed error information when executing an Analysis API method or function. The error information contains a number and an English error text. You can enter as second parameter Text or Number if only this information should be reurned. I you do not define the second parameter, both values will be returned.
In the table below, you find a list of all errors with number and text.
Table 20:
Number Text
General critical errors
1 A general error occurred.
2 A general error occurred in one of the data sources.
This is most probably an error in the backend system or in the communication with the backend system.
3 An error from a previous call is still unhandled.
Errors on pre-execution checks
10 The BI-Addin is disabled.
Analysis Plug-in User GuideCreating Workbooks P U B L I C 109

Number Text
11 At least one worksheet is protected.
12 Variable submit is paused.
13 A callback is running.
14 The command is not enabled.
15 Action is currently not allowed.
Parameter errors
20 A parameter is missing.
21 A parameter has an invalid value.
Analysis object reference errors
30 No active workbook application.
31 The specified data source is invalid.
The alias may be wrong or the data source is not yet refreshed.
32 The alias cannot be resolved.
This applies to macros where an alias may be a data source or a planning object.
33 Variables are unmerged, data source alias needs to be specified.
34 No result set is available for the specified data source.
35 At least one data source must have input variables.
36 A data source was specified but variables are merged.
37 At least one data source must be refreshed.
Excel object reference errors
40 Invalid sheet reference.
41 Invalid cell reference.
General uncritical errors
50 A general error occurred.
51 Logon failed.
Errors dealing with selection state
60 Single selection requested but multiple selection is applied.
61 Multiple selection requested but only single selection is allowed.
Errors dealing with interface restrictions
70 Maximum string length is exceeded, texts are truncated.
ExampleError Number 1
lResult= Application.Run("SAPGetProperty", "LastError", "Number")
If you execute this command, it returns '1'.
110 P U B L I CAnalysis Plug-in User Guide
Creating Workbooks

lResult= Application.Run("SAPGetProperty", "LastError", "Text")
If you execute this command, it returns the text 'A general error occurred'.
lResult= Application.Run("SAPGetProperty", "LastError")
If you execute this command, it returns an array with the members { "1", "A general error occurred"}.
Related Information
SAPGetProperty [page 84]
3.7.24 Syntax for Entering Values
Follow these syntax rules when you enter members for filtering and values for prompting.
For compounded dimensions, the complete compounded key of the member must be used.
Description Example
Equal to 15
Exclude value !22
Value range 1 - 5
Exclude value range !6 - 9
Greater than >8
Exclude values greater than <value limit> !>8
Greater than or equal to >=8
Exclude values greater than or equal to <value limit> !>=8
Less than <12
Exclude values less than <value limit> !<12
Less than or equal to <=12
Exclude values less than or equal to <value limit> !<=12
Contains pattern (for example, all values that begin with A)* A*
Exclude values that contain pattern (for example, exclude all values that begin with A)*
!A*
Dimension hierarchy node +<Dimension Attribute>(<Technical Name of Dimension>)
For example: +ELEMENT1(WBS_ELEMENT)
Text hierarchy node +<Technical Name of Hierarchy Node>(0HIER_NODE)
For example: +EUROPE(0HIER_NODE)
Analysis Plug-in User GuideCreating Workbooks P U B L I C 111

Description Example
Delimiter for multiple values; semicolon followed by a space 1-5; >12; !8
Multiple values may also be passed as an array of strings 1-5
>12
!8
Escape character; backslash without space \
If you enter a string that contains one of the special characters used in these syntax rules, you can use a backslash as escape character.
For example: Enter the string CA-QU as CA\-QU.
*You cannot use these syntax rules for filtering.
112 P U B L I CAnalysis Plug-in User Guide
Creating Workbooks

4 Analyzing Data
4.1 Analyzing data with the design panel
The Analysis design panel is an additional element on the user interface that you can use to create new views on your data, to find information on the used data sources and on the components of the workbook. The design panel consists of three tabs: Analysis, Information and Components.
You can show and hide the design panel by choosing Display Display Design Panel in the design panel group. You can modify the size and position of the design panel in Microsoft Excel. Your modifications of the design panel will be preserved even if you close Analysis or hide the design panel and show it again.
You can also show and hide the technical names in the design panel by choosing Display Show Technical Names in the design panel group. The technical names are displayed in squared brackets.
On the Analysis tab, you can show and hide the property view on the design panel by choosing Display Show Property View .
Working with the design panel, the crosstab is updated after each navigation step. You can choose Pause Refresh to deactivate the permanent refresh.
Related Information
The Analysis tab [page 113]The Property View on the Analysis tab [page 115]The Information tab [page 117]The Components tab [page 118]Pausing Refresh [page 123]Managing components in the design panel [page 124]
4.1.1 The Analysis tab
On the Analysis tab, you can see the available fields for a single data source and the fields currently used to display the data in a crosstab in columns and rows. If you use multiple data sources in your analysis, select a crosstab cell of the required data source to specify which data source information should be displayed.
The Analysis tab contains the following sections:
● Search fieldYou can search for a numeric or character string. The search results are highlighted.In the sections Columns, Rows and Background Filter, the relevant nodes are expanded automatically.
Analysis Plug-in User GuideAnalyzing Data P U B L I C 113

Due to performance reasons, the nodes in the <Data source> section are not expanded automatically. If you expand them manually, you can see the highlighted search results. By expanding the nodes manually, the data has been loaded and the nodes will be expanded automatically in future searches.
● <Data source> The heading for this section is the name of the selected data source. You can check whether you have selected the right data source. The section displays all fields of the data source: measures, dimensions, attributes and hierarchies.You can move a data source field to another section on the Analysis tab to add it to the crosstab. If you move a field to another section, its name is displayed in both sections: the data source section and the other crosstab section, for example Rows. Attribute and hierarchy fields that are added to another crosstab section, are displayed in bold letters in the data source section.In BEx Query Designer, a dimension can be defined as not to be displayed. These dimensions are displayed in the Analysis design panel in gray font. You can add them to your crosstab and filter them. This will affect the data and result in your crosstab, but the dimensions will not be visible in the crosstab. If you want a dimension to be displayed in an Analysis crosstab, you have to change the definition in BEx Query Designer.
● ColumnsThis section contains all fields that are currently displayed in columns.
● RowsThis section contains all fields that are currently displayed in rows.Next to the section header, you can select the Swap Axes icon to swap rows and columns.
● Background FilterThis section contains all fields that are currently defined as background filters.
● PropertiesIn this section, you can define properties for the data source, measures and dimensions. You can show or hide this section by choosing Display Show Property View in the design panel group.
Navigating through the data
Using the Analysis tab, you have the following options to analyze data and create new views on it:
● You can use the context menu to move fields in the four sections. You can add a new dimension from the <Data source> section to the Rows, for example.
● You can use drag and drop to move fields in the four sections.● You can use drag and drop to add rows and columns to the crosstab. Drag a field directly to the crosstab and
drop it. The field is added automatically to the corresponding section on the Analysis tab.● You can also use drag and drop to remove a field from the crosstab. Select the border of a cell in the crosstab
to drag the field to the Analysis tab and drop it there.● You can use the context menu to create, change and remove filters. If a filter is defined for an object, you see a
filter icon beside this object.● You can swap the axis of the crosstab by selecting the icon next to the rows section.
Related Information
The Property View on the Analysis tab [page 115]
114 P U B L I CAnalysis Plug-in User Guide
Analyzing Data

4.1.2 The Property View on the Analysis tab
In the Property view on the Analysis tab, you can define properties for the data source, measures and dimensions in the workbook. You can show or hide this section by choosing Display Show Property View in the design panel group.
The properties can also be changed using the ribbon. If you change a property on the Analysis tab, the changes are also reflected in the ribbon.
The available properties depend on the selected data source element. At the top of the Properties section, you will always find the description and technical name of the selected data source element. You can select the data source, measures, a single measures, dimensions, members and hierarchies.
For single measures, dimensions and attributes, you can enter a new description and thereby rename the selected data source element. The new description is directly available in the Analysis UI: in the design panel, in the crosstab and in the dialogs, for example the Filter dialog. You can also save new descriptions with a view in Analysis. Depending on the platform you use, this could be a query view, an Analysis view or a HANA view.
For hierarchies, only the properties of the assigned hierarchy can be changed.
Table 21: Data Source Properties
Property Options
Zero Suppression
Zero Suppression in Rows
Zero Suppression in Columns
Compact Display
Compact Display in Rows
Compact Display in Columns
Totals Total Rows Above Members
Total Columns Left of Members
General Format
Display of Negative Values
Display Zero as
Table 22: Measures Properties
Property Options
Members Display
Use
Currency Conversion You can open the currency conversion dialog.
Table 23: Single Measure Properties
Property Options
Scaling Factor You can select the scaling factor to be used.
Decimal Places You can select the decimal places to be used.
Analysis Plug-in User GuideAnalyzing Data P U B L I C 115

Table 24: Dimension Properties
Property Options
Members Display
Use
Totals Show Totals
Hide Totals
Hide Totals if Only One Member is Available
Sort Sort Ascending
Sort Descending
You can also open the sorting dialog.
Table 25: Member Properties
Property Options
Members Display
Use
Totals Show Totals
Hide Totals
Hide Totals if Only One Member is Available
Table 26: Hierarchies Properties
Property Options
Expand Expand Downwards / Expand to the Right
Expand Upwards / Expand to the Left
Show Nodes with only One Lower-Level Node
Values of Posted Nodes
Related Information
To show/hide zeros in rows and columns [page 148]To display single dimensions as hierarchy [page 154]To locate the totals display in the crosstab [page 168]To define the display of zeros and negative values [page 167]To define the number format [page 165]To define currency translation [page 166]To define the members display [page 164]To show or hide totals in the crosstab [page 169]
116 P U B L I CAnalysis Plug-in User Guide
Analyzing Data

To sort members [page 151]
4.1.3 The Information tab
On the Infomation tab, you can see detailed information about a data source or the complete workbook. You can also find information on filters and variables on this tab. The general information is displayed as text elements.
In the Information for list, you can select the complete workbook or one of the inserted data sources. The information fields are displayed for the selected object. You can insert these fields in the analysis using drag and drop.
For a workbook, the following information is displayed:
● Workbook Name● Created By● Variables● Logged On User● Last Refreshed At● Created At● Last Changed At
For a data source, the following information is displayed:
● Data Source Name● Key Date● Last Data Update
For MultiProviders, two dates are displayed: The date when all InfoProviders of the MultiProvider were updated successfully for the last time (LastDataUpdate) and the date when a single InfoProvider of the MultiProvider was updated for the last time (LastDataUpdateMaximum).
● Variables● Filter● BEx Conditions● Query Technical Name● InfoProvider Technical Name● InfoProvider Name● Created By● Last Changed By● Last Changed At● System● Logged On User
Related Information
To insert an info field [page 51]To insert a filter [page 52]
Analysis Plug-in User GuideAnalyzing Data P U B L I C 117
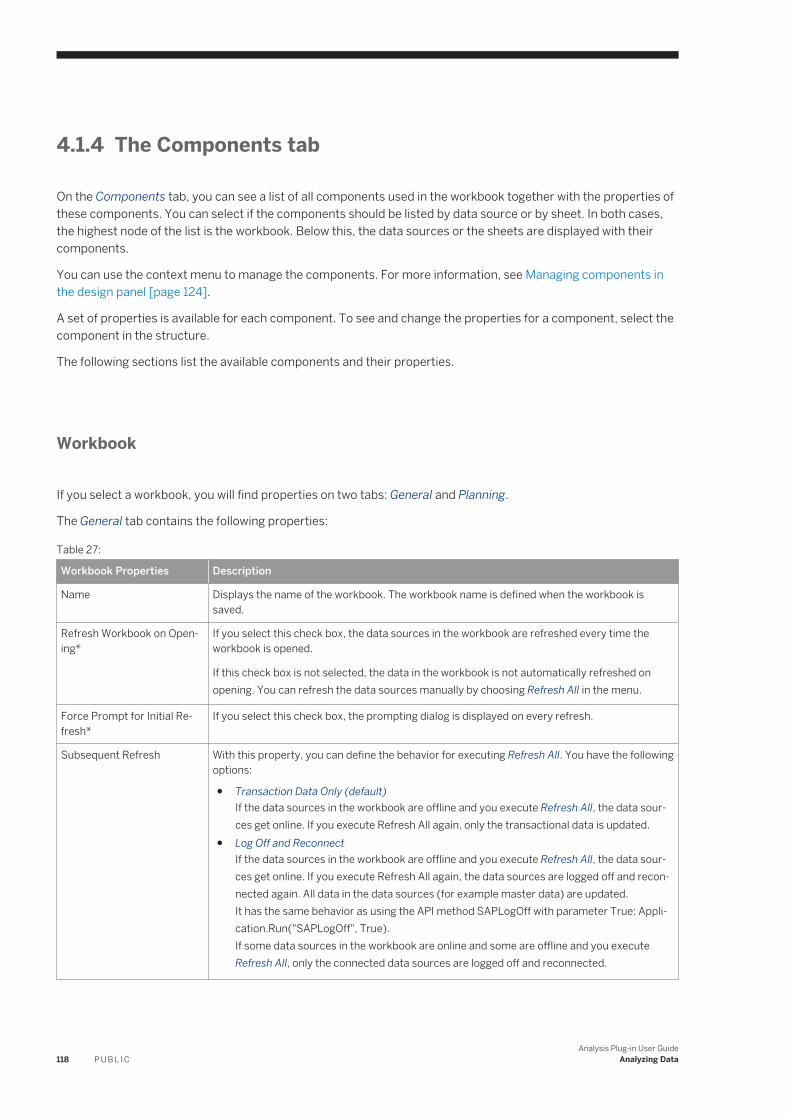
4.1.4 The Components tab
On the Components tab, you can see a list of all components used in the workbook together with the properties of these components. You can select if the components should be listed by data source or by sheet. In both cases, the highest node of the list is the workbook. Below this, the data sources or the sheets are displayed with their components.
You can use the context menu to manage the components. For more information, see Managing components in the design panel [page 124].
A set of properties is available for each component. To see and change the properties for a component, select the component in the structure.
The following sections list the available components and their properties.
Workbook
If you select a workbook, you will find properties on two tabs: General and Planning.
The General tab contains the following properties:
Table 27:
Workbook Properties Description
Name Displays the name of the workbook. The workbook name is defined when the workbook is saved.
Refresh Workbook on Opening*
If you select this check box, the data sources in the workbook are refreshed every time the workbook is opened.
If this check box is not selected, the data in the workbook is not automatically refreshed on opening. You can refresh the data sources manually by choosing Refresh All in the menu.
Force Prompt for Initial Refresh*
If you select this check box, the prompting dialog is displayed on every refresh.
Subsequent Refresh With this property, you can define the behavior for executing Refresh All. You have the following options:
● Transaction Data Only (default)If the data sources in the workbook are offline and you execute Refresh All, the data sources get online. If you execute Refresh All again, only the transactional data is updated.
● Log Off and ReconnectIf the data sources in the workbook are offline and you execute Refresh All, the data sources get online. If you execute Refresh All again, the data sources are logged off and reconnected again. All data in the data sources (for example master data) are updated.It has the same behavior as using the API method SAPLogOff with parameter True: Application.Run("SAPLogOff", True).If some data sources in the workbook are online and some are offline and you execute Refresh All, only the connected data sources are logged off and reconnected.
118 P U B L I CAnalysis Plug-in User Guide
Analyzing Data

Workbook Properties Description
Store Prompts with Workbook*
If you select this check box, the defined prompt values for characteristic value variables are saved with the workbook. These variables are defined in the Characteristic Restrictions area in the BEx query designer.
Remove Data Before Saving If you select this check box, the workbook is saved without the data. When you reopen the workbook, no data is displayed. To display the data, refresh the data sources manually by choosing Refresh All in the menu.
Merge Variables* If you select this check box, the variables are merged for all data sources. If the check box is not selected, the variables can be defined for each data source separately.
Every time you change your selection for this property in the workbook, the connected data sources are restarted. Therefore the prompting dialog will appear automatically so that you can define the values before the data sources are refreshed. If the data sources are not connected, the dialog will not appear and only the property will be changed.
In the default setting, this check box is not selected when you create a new workbook. The default setting can be changed in the registry. For more information, contact your IT Administrator.
NoteThe following functions and API methods might need different parameters depending on the selection for merging variables:
● SAPListOfMembers● SAPListOfVariables● SAPCallMemberSelector● SAPSetVariable
* For more information on workbook properties, see To select workbook properties for prompting [page 133].
The Planning tab contains the following properties:
Table 28:
Workbook Properties Description
System for Data Write Back Displays the currently selected planning system.
For an empty workbook, this property is empty.
When the first data source is inserted, the corresponding system is visible as the planning system.
When you insert data sources from different systems, the system of the first inserted data source is the planning system. You can change the planning system by selecting another system in the list. The changed property value will only become effective when you close and reopen the workbook.
When you change the planning system in a workbook before you are connected to a server, the changed property will become effective when you connect to a server. In this case, you do not need to close and reopen the workbook again.
Analysis Plug-in User GuideAnalyzing Data P U B L I C 119

Workbook Properties Description
Cell Locking You can lock input-ready cells against manual changes in planning workbooks. A locked cell is a time-limited setting that only applies to the current user session. Locked cells are displayed in a different cell style.
There are two implementations of the cell locking function in Analysis: Front-end cell locks and back-end cell locks (single query and cross query).
You can select here which implementation should be applied in a workbook.
For more information , see Locking Cells [page 180].
Planning Model
Switch All Data Sources to Change Mode for Initial Refresh
If you select this check box when saving a workbook, the workbook (containing input-ready data sources) will be opened in display mode.
With the initial refresh, the data sources will be switched to change mode automatically.
By default, this check box is not selected when you create a new workbook.
Refresh Planning Objects on Refresh All
If you select this check box, planning objects in the workbook are refreshed when a refresh is executed with Refresh All.
By default, this check box is selected when you create a new workbook.
Data Source
Table 29:
Data Source Properties Description
Data Source Name Displays the data source name. You can change it here.
Data Source Technical Name Displays the technical name of the data source.
Formula Alias Displays the formula alias. You can change it here.
System Alias Displays the system alias.
Planning: Open Data Source Input-Enabled
If you select this check box, the input-ready data source is opened in change mode when you open the workbook, and you can immediately start entering planning data.
If you do not select this check box for an input-ready data source, you cannot enter and save planning data for this data source until you have selected the check box.
Reset Data Source on Opening Workbook
If you select this check box, the initial state of a query or query view defined in the BEx Query Designer, will be displayed when you reopen the workbook. You cannot save a navigation state with that workbook as the navigation state will be replaced with the initial state.
120 P U B L I CAnalysis Plug-in User Guide
Analyzing Data

Sheet
Table 30:
Sheet Properties Description
Name Displays the sheet name.
Sheet Type Displays the sheet type.
The following sheet types are available: Analysis, Neutral and Non-COF.
Empty sheets are defined as neutral. If you add a data source with the Analysis plug-in, the sheet type Analysis is assigned. To reset a sheet to type neutral, you have to remove all inserted data sources from the sheet.
Sheets of type Non-COF are not checked from the Analysis Add-In. It might be useful to assign this type to sheets that do not contain Analysis content to improve the performance.
Crosstab
Table 31:
Crosstab Properties Description
Name Displays the crosstab name. You can change it here.
Formula Alias Displays the formula alias of the crosstab. You can change it here.
The crosstab formula alias is the second part of the named range for a crosstab. The first part is always SAP. For example, if the crosstab formula alias is CrossTab1, the named range for this crosstab would be SAPCrossTab1. You can select a crosstab with its named range in the Name box in the formula bar.
Data Source Name Displays the data source name and the data source alias.
Range Displays the cell range of the crosstab in the sheet. You can change the range to move the crosstab in the sheet.
New Lines You can define how many new lines should be added to the crosstab for planning data. The default number is 5 lines. The new lines are only visible in change mode.
Apply Default Formats If you select this check box, the default formats are applied after each navigation step.
Display Symbols for Parent Members
If you select this check box, a symbol is displayed for parent members in a hierarchy (+/-).
Optimum Cell Width/Height If you select this check box, the table is displayed with optimum cell width and height.
Repeat Members If you select this check box, texts that are not displayed because they occur several times in a column or row are repeated in each cell.
The setting made in BEx Query Designer to hide/show repeated key values is not evaluated in Analysis. To define the display for repeated members only this setting in the design panel is evaluated.
Analysis Plug-in User GuideAnalyzing Data P U B L I C 121

Planning Objects
Table 32:
Planning Objects Properties Description
Name of Planning Function / Sequence
Displays the name of the planning object.
Technical name of Planning Function / Sequence
Displays the technical name of the planning object.
Alias Displays the alias of the planning object. You can change it here.
Process Changed Data If you select this check box, you can define that only data changed by the user in the current session since the last save will be processed.
For planning functions, you can specify which aggregation level should be used as a filter to define the changed data. In the default setting, the aggregation level the planning function is built on is selected for a planning function.
For planning sequences, it is not possible to select an aggregation level.
Variables of Planning Function / Sequence
You can define the variables values of the planning object:
● For source Member, you can select the members with input help.● For source Cell, you can define the cell that contains the values.
Filter On the Filter tab, you can define the filter for a planning function.
For more information on planning objects, see To plan data with planning objects [page 177].
Filter
Table 33:
Filter Properties Description
Data Source Name Displays data source name.
Dimension Displays the name of the filtered dimension.
Filter applies to the following data sources
You can select which of the data sources in the workbook should be filtered.
Chart
Table 34:
Chart Properties Description
Name Displays sheet and chart name.
Cross Tab Name Displays the crosstab name.
122 P U B L I CAnalysis Plug-in User Guide
Analyzing Data

Chart Properties Description
Sheet Displays the sheet name. You can change it here.
4.1.5 The Design Rules tab
On the Design Rules tab, you can display and maintain the rules created with Table Design. The rules are displayed for each data source and rule type.
You can select the data source in the Rule for field. If a workbook contains only one data source, then this data source is preselected.
In the Ruletype field, you can select a rule type. The following rule types are available:
● Format● Formula● Texts● New Lines
The rules for the selected data source and rule type are displayed in the list. You see an icon, a value, a style and a description per rule. The information in the list is filled in automatically. The icon shows if a rule is active or deactivated. The style is an ID that is unique for each rule.
You can use the arrows above the list to move the rules up and down in the list to change their priority.
Rules of type Format can be edited from the design panel. If you select a rule and Edit, a dialog box appears where you can change the rule. For rules of type New Lines, you can edit the the row height. Note that the Edit button is only enabled after you have changed the height of the new line once manually.
You can select a rule and Deactivate it, if you don't want the rule to be applied at the moment. If you deactivate a rule, the icon for the rule in the list changes. You can activate the rule again.
You can also select a rule and Delete it completely.
If the checkbox Keep selection in synch with crosstab selection is selected and you select a cell in the crosstab containing a rule, the rule is highlighted in the list.
Related Information
Editing crosstabs with Table Design [page 45]
4.1.6 Pausing Refresh
You can choose Pause Refresh to deactivate the refresh after each navigation step when you work on the Analysis tab in the design panel. With the deactivated refresh, you can design a new view on your data with multiple navigation steps. All steps will be executed at once when you choose Pause Refresh again to activate the refresh.
Analysis Plug-in User GuideAnalyzing Data P U B L I C 123

Note that most functions in the menu are not available when Pause Refresh is activated. You should only work on the Analysis tab when the automatic refresh is deactivated.
The following functions are available in the context menu of the design panel if Pause Refresh is selected:
● Define the members displayMore information: To define the members display [page 164]
● Define the number formatMore information: To define the number format [page 165]
● Show or hide totals in the crosstabMore information: To show or hide totals in the crosstab [page 169]
● Define the calculation of totalsMore information: To define the calculation of totals [page 169]
● Calculate a new measure based on available measuresMore information: To calculate a new measure based on available measures [page 156]
● Add a new measure based on one available measure (dynamic calculation)More information: To add a new measure based on one available measure [page 157]
4.1.7 Managing components in the design panel
On the Components tab, all components included in a workbook are displayed in a tree-like structure. You can select if the components should be listed by data source or by sheet. In both cases, the highest node of the list is the workbook. Below this, the data sources or the sheets are displayed with their components.
You can use the context menu to manage the components. The following sections describe the functions of the context menu.
To insert a component
On workbook level, you can insert the following components:
● data sources ('Use Data Source')● planning functions ('Use Planning Function')● planning sequences ('Use Planning Sequence')
On data source level, you can insert a crosstab for this data source ('Insert Crosstab'). A dialog box appears to enter the sheet and cell information where the copied crosstab should be inserted.
On the planning objects level, you can insert planning functions ('Use Planning Function') and planning sequences ('Use Planning Sequence')
To refresh a component
You can refresh the following components with the context menu:
124 P U B L I CAnalysis Plug-in User Guide
Analyzing Data

● workbooks● crosstabs● charts
To copy a component
You can copy the following components with the context menu:
● data sourcesWhen you copy a data source, the copied data source is added to the tree-like structure with a new data source alias. No crosstab or other component of the original data source is added to the workbook.
● crosstabsWhen you copy a crosstab, a dialog box appears to enter the sheet and cell information where the copied crosstab should be inserted. The new crosstab is inserted on the defined position and in the structure, a entry with data source, data source alias and crosstab is added.
● sheetsWhen you copy a sheet, the copied sheet is added to the tree-like structure.
To move a component
You can move crosstabs and charts ('Move To'). A dialog box appears to enter the sheet and cell information where the crosstab or chart should be moved to.
To jump to a component
You can use the context menu to jump to a crosstab or a filter ('Jump To'). You can use this function to jump to a crosstab on another sheet in the workbook, for example. The sheet with the selected crosstab will be displayed.
To execute planning objects
You can use the context menu to execute planning functions and planning sequences.
To delete a component
You can delete the following components with the context menu:
● data sources● crosstabs
Analysis Plug-in User GuideAnalyzing Data P U B L I C 125

● charts● filters● planning functions● planning sequences
4.1.8 Managing system connections in the design panel
On the Components tab, you can manage the system connections on workbook level. You can log off from all systems the workbook is connected to. You can also reconnect to the systems or replace a system with another system.
You can use the context menu to manage the system connections. The following sections describe the functions of the context menu.
To log off a workbook
To disconnect a workbook from the server (BW and HANA), select the workbook and choose Log Off in the context menu.
The connections to all systems in the workbook are closed and the design panel is closed.
You can also disconnect a workbook using the API method SAPLogOff.
To reconnect a workbook
To reconnect to the systems, display the design panel, select the workbook and choose Refresh All in the context menu.
All systems in the workbook are reconnected.
You can also reconnect a workbook using the API method SAPLogOff.
To replace a system in a workbook
To replace a system, select Replace System... in the context menu. The option is only enabled if the workbook is not connected to any system.
In the dialog, you can select the system that you want to replace (Current System) and the system that you want replace the current system with (Replace By System).
For BW and HANA systems, you can replace local connections and connections from the BI platform. If a workbook contains BW and HANA connections, you will find two tabs in the dialog: BW and HANA.
126 P U B L I CAnalysis Plug-in User Guide
Analyzing Data
To list the BIP connections in the Replace By System section, select the Logon to BIP icon and log on to the BI platform.
You can also open the dialog for replacing systems in the Platform settings.
Related Information
SAPLogOff [page 85]Platform Settings [page 199]
4.2 Prompting
In the prompting dialog, you can set values for prompts. Prompts are defined as variables in BEx Query Designer. The variables are parameters of a BW query and are filled with values when you insert a query as a data source in a worksheet. They serve as placeholders for members, hierarchies, hierarchy nodes, formula elements and texts. After defining the variable values, the crosstab is displayed according to the selected values.
To be editable in the prompting dialog, a variable must be defined as input-ready and set to Manual Input in Query Designer. A variable can be defined as mandatory or optional in Query Designer.
The prompting dialog appears automatically when you insert the query with variables in a worksheet. You can open the prompting dialog manually with the prompting icon in the menu to change variable values.
At workbook level, you can select properties to define how the prompting dialog and defined values behave in workbooks. For example, you can define that variable values are saved in a workbook. If you open this workbook again, the data is displayed according to the defined values. You can then open the prompting dialog and change the values.
Defined prompt values can be saved as variant for a query or for a document (workbook or presentation) using the variant dialog in the prompting dialog.
If there are no input-ready variables in the query that you use as your data source, the prompting dialog is disabled.
NoteObjects that are defined as input-ready variables in BEx Query Designer are called prompts in Analysis, edition for Microsoft Office. In the following documentation the Analysis term prompt is used for these variables. A query can also contain other variable types. All variables and values of these variables that a query contains, are displayed in the Variables area on the Information tab in the design panel.
To find more information about the definition of variables in the BEx Query Designer, go to the SAP Help Portal at http://help.sap.com SAP NetWeaver Select release and language SAP NetWeaver Library SAP NetWeaver by Key Capability Business Intelligence BI Suite: Business Explorer Query Design: BEx Query Designer Reusable Query components Variables .
Analysis Plug-in User GuideAnalyzing Data P U B L I C 127

Related Information
To define prompt values [page 128]Using Variants [page 130]To select workbook properties for prompting [page 133]
4.2.1 To define prompt values
Procedure
1. Open the Prompts dialog.In the Prompts Summary area, you see a list of all available prompts in the query and the selected values. In the Specify Value for Prompts area, you can expand single prompts to define values. The mandatory prompts are marked with an asterisk. If default values for the prompts are defined in BEx Query Designer, they are displayed as selected in the prompting dialog.If you have selected to not merge the variables for this workbook on the Components tab in the design panel, the prompts are displayed separately for each data source and you can define different values for the same prompt for the corresponding data sources.
2. In the Display list box, select whether all prompts, no prompts or only the mandatory prompts are expanded in the Specify Value for Prompts area:
○ Select Hide All if all prompts should be displayed collapsed.○ Select Show All if all prompts should be displayed expanded. This is the default option.○ Select Hide Optional Prompts if only the mandatory prompts should be displayed expanded.
3. Define values for the expanded prompts.You can define values for the following prompt types. Depending on the prompt definition in BEx Query Designer, you have various options:
Prompt Type Value Definition
Dimension* Single value
You can select one member as the prompt value for this dimension.
Dimension* Multiple value
You can select multiple members as the prompt values for this dimension.
Press the + button, to add a field for additional values. Press the Filter button if you want to select multiple values in a list at once. To remove a selected member, press the red X button.
Dimension* Value range
You can select a start and an end member to define a range of values for this dimension.
Dimension* Selection option
128 P U B L I CAnalysis Plug-in User Guide
Analyzing Data
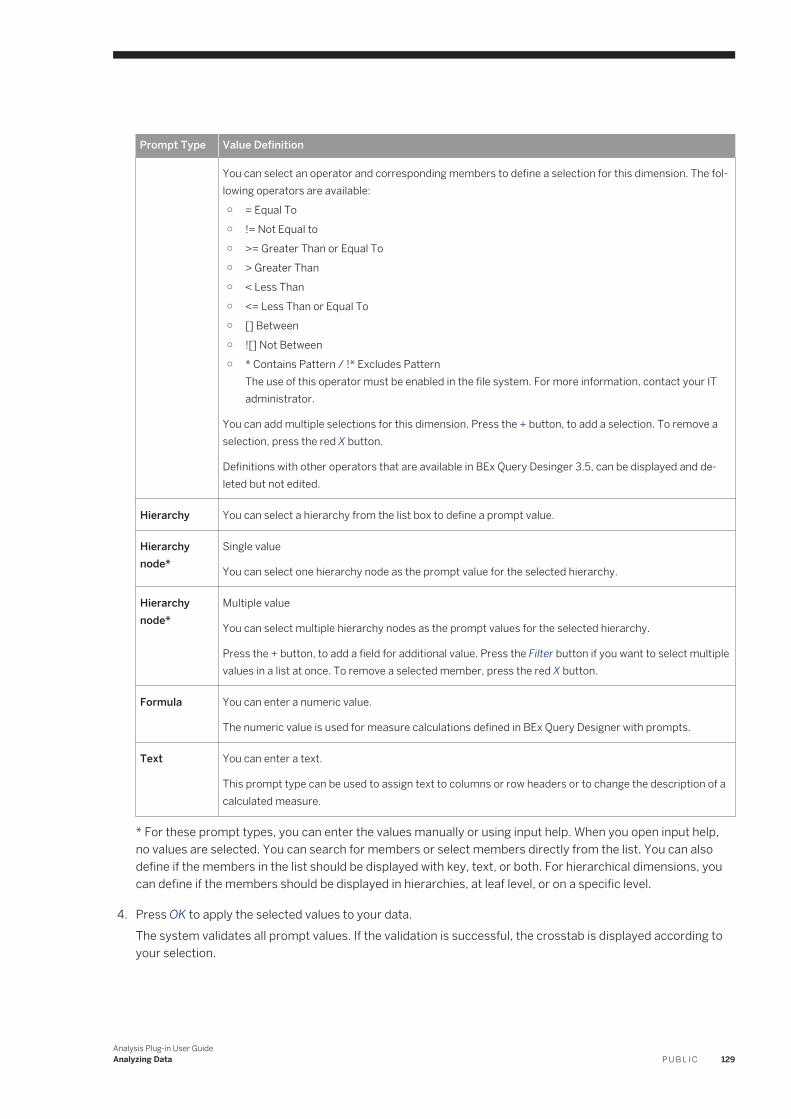
Prompt Type Value Definition
You can select an operator and corresponding members to define a selection for this dimension. The following operators are available:○ = Equal To○ != Not Equal to○ >= Greater Than or Equal To○ > Greater Than○ < Less Than○ <= Less Than or Equal To○ [] Between○ ![] Not Between○ * Contains Pattern / !* Excludes Pattern
The use of this operator must be enabled in the file system. For more information, contact your IT administrator.
You can add multiple selections for this dimension. Press the + button, to add a selection. To remove a selection, press the red X button.
Definitions with other operators that are available in BEx Query Desinger 3.5, can be displayed and deleted but not edited.
Hierarchy You can select a hierarchy from the list box to define a prompt value.
Hierarchy node*
Single value
You can select one hierarchy node as the prompt value for the selected hierarchy.
Hierarchy node*
Multiple value
You can select multiple hierarchy nodes as the prompt values for the selected hierarchy.
Press the + button, to add a field for additional value. Press the Filter button if you want to select multiple values in a list at once. To remove a selected member, press the red X button.
Formula You can enter a numeric value.
The numeric value is used for measure calculations defined in BEx Query Designer with prompts.
Text You can enter a text.
This prompt type can be used to assign text to columns or row headers or to change the description of a calculated measure.
* For these prompt types, you can enter the values manually or using input help. When you open input help, no values are selected. You can search for members or select members directly from the list. You can also define if the members in the list should be displayed with key, text, or both. For hierarchical dimensions, you can define if the members should be displayed in hierarchies, at leaf level, or on a specific level.
4. Press OK to apply the selected values to your data.The system validates all prompt values. If the validation is successful, the crosstab is displayed according to your selection.
Analysis Plug-in User GuideAnalyzing Data P U B L I C 129

Results
The data in the worksheet is displayed according to your selection.
If you select a data source on the Information tab in the design panel, you can see the defined values in the Variables area. If you select the workbook on the Information tab in the design panel, you can see the defined values in the Variables area if the variables in the workbook are merged. If the variables are not merged, the message 'Variables are not merged' is displayed in the Variables ares.
The defined prompt values can be saved with the workbook and are then available to other users or in other sessions. To change the prompt values, open the prompting dialog again.
Related Information
To select workbook properties for prompting [page 133]
4.2.2 Using Variants
You can save defined prompt values as a variant for a query or for a document (workbook or presentation). The variants of a document can contain prompt values for different data sources. You can create a variant for your user (user-specific variant) or for all users (global variant). When you next open the workbook or query, you can apply your user-specific variants and all global variants. You can also change a variant by selecting different prompt values and saving the variant again. Variants can also be deleted.
You can create multiple variants, which allows you to choose different prompt values. Only one variant can be active at any one time however.
Variants are created and maintained in the prompting dialog. There are two different modes when working with variants. These are document mode for working with document variants and data source mode for working with query variants. An icon shows which mode is active. The currently active mode depends on the selection you made for workbook property Merge Variables on the Components tab in the design panel and on how you open the prompting dialog.
Working in data source mode
In data source mode, you see the variants for this query in the prompting dialog. If you create a new variant, it is always saved to this query. The following prerequisites apply for working with query variants:
● Authorization object S_RS_PARAM must be maintained for the user in the SAP NetWeaver server so that the user can create a variant.
● You open the prompting dialog with the context menu on the crosstab. The context menu for prompts is only available if workbook property Merge Variables is not selected.
● Workbook property Merge Variables is not selected when a new query is inserted.
130 P U B L I CAnalysis Plug-in User Guide
Analyzing Data

Working in document mode
In document mode, you see the variants for this workbook or presentation in the prompting dialog. If you create a new variant, it is saved to this document. The following prerequisites apply for working with document variants:
● Authorization object S_RS_PARAM must be maintained for the user in the SAP NetWeaver server so that the user can create a variant.
● The workbook is already saved on the SAP NetWeaver server.● You open the prompting dialog with the icon in the ribbon.● Workbook property Merge Variables is selected when a new query is inserted.
Related Information
To create a user-specific variant [page 131]To create a global variant [page 132]To apply a variant [page 132]To change a variant [page 133]To delete a variant [page 133]To select workbook properties for prompting [page 133]
4.2.2.1 To create a user-specific variant
Procedure
1. Open the prompting dialog in the required mode.2. Define the prompt values for the variant.3. Enter a name for the variant in the Use Variant field.4. Press the save icon.
Results
The new variant can now be selected in the drop down list.
Analysis Plug-in User GuideAnalyzing Data P U B L I C 131

4.2.2.2 To create a global variant
Context
You create a global variant by changing the type of a user-specific variant.
Procedure
1. Open the prompting dialog in the required mode.2. Select the Show Variant Settings icon.
The available variants are listed in the Variant Settings dialog with name, type and technical name.3. Select the change icon next to the user-specific variant you want to change.
A user-specific variant has the type User.4. Select type Global for the variant.5. Enter a technical name.6. Press the OK icon.7. Press Close to close the variant settings dialog.
Results
The variant is now saved as a global variant and can be used by all authorized users.
4.2.2.3 To apply a variant
Procedure
1. Open the prompting dialog in the required mode.2. Select the variant in the drop-down list.
Firstly, the user-specific variants are listed. Tthe global variants are then listed, separated by a bar.3. Press the OK button.
Results
The variant is applied to the query or workbook, and the crosstab is displayed accordingly.
132 P U B L I CAnalysis Plug-in User Guide
Analyzing Data

4.2.2.4 To change a variant
Procedure
1. Open the prompting dialog in the required mode.2. Select the variant in the drop-down list.3. Change the prompt values for the variant.4. Press the save icon.
Results
The variant is saved with the new defined prompt values. If you want to change the variant name, go to the variant settings dialog.
4.2.2.5 To delete a variant
Procedure
1. Open the prompting dialog in the required mode.2. Press the Show Variant Settings icon.
The available variants are listed in the Variant Settings dialog.3. Press the delete icon next to the variant you want to delete.
The variant is deleted.4. Press Close to close the variant settings dialog.
Results
The variant is deleted permanently.
4.2.3 To select workbook properties for prompting
Context
You can select various workbook properties in the design panel that affect the behavior of the prompting dialog and existing prompt values:
Analysis Plug-in User GuideAnalyzing Data P U B L I C 133

Procedure
1. Open the Design Panel in the menu.2. Select the Components tab.3. Select the required workbook properties in the Properties area. The following properties are available:
○ Refresh Workbook on OpeningIf you select this option, the data sources in the workbook are refreshed every time the workbook is opened. The behavior of the prompting dialog depends on the other properties you selected for this workbook.If this check box is not selected, the data in the workbook is not automatically refreshed on opening. You can refresh the data sources manually by choosing Refresh All in the menu.
○ Force Prompt for Initial RefreshIf you select this option, the prompting dialog is displayed every time you refresh. The dialog appears even if the query only contains optional prompts. If values are already saved with the workbook, these are displayed as predefined settings in the dialog. You can accept or change these values. A refresh happens when you open a workbook and select refresh, when you select the setting above and open a workbook or when you insert a new data source.If this property is not selected, the system checks whether the workbook contains mandatory variables that no values are available for. If no values are available, the prompting dialog is displayed. If values are available, the workbook is displayed straight away.
○ Store Prompts with WorkbookThis is the default property. If it is used, the defined prompt values for characteristic value variables are saved with the workbook. These variables are defined in the Characteristic Restrictions area in the BEx query designer.The stored values will be applied to the data when the workbook is refreshed during the current session or closed and opened again. The prompt values are also available to other users using the workbook. To change the values, you can open the prompting dialog manually.If this property is not selected, the defined values will not be saved with the workbook.
○ Merge VariablesIf you select this option, all prompts in the workbook are listed in the Prompts dialog. You can define values for each prompt. These prompt values are valid for all data sources that contain the prompt.If this property is not selected, the data sources in the workbook are displayed in the Prompt Summary area of the Prompts dialog, and the corresponding prompts are listed in the Specify Value for Prompts area. You can define different values for the prompts for each data source.Every time you change your selection for this property in the workbook, the connected data sources are restarted. The prompting dialog will therefore appear automatically so that you can define the values before the data sources are refreshed. If the data sources are not connected, the dialog will not appear, and only the property will be changed.
Results
The behavior of the prompting dialog and saved prompt values will be in accordance with your workbook properties selection.
134 P U B L I CAnalysis Plug-in User Guide
Analyzing Data

4.3 Filtering data
In Analysis, you can define criteria to restrict the data displayed in your analysis to a subset of data. This action is called filtering. By filtering, you define which subset of data appears in the analysis. This allows you to create new, more specific views of your data. Filters are additive, which means that each additional filter is based on the current filter and further reduces the subset of data.
There are two types of filters. With "Filtering members", you can specify which members to display and which not to display in your analysis. You can also define members to use as filters in the background of the analysis. With "Filtering measures", you can specify which measure values should be displayed in the analysis. For example, you can define that you want to see the Top 3 regions in sales volume for each product in your analysis. You can also filter out rows and columns that contain only zeros.
Related Information
Filtering members [page 135]Filtering measures [page 143]To show/hide zeros in rows and columns [page 148]
4.3.1 Filtering members
By selecting and removing members of your analysis, you can create new views of your data. You can filter members of a flat dimension with the filter dialog or directly on the crosstab. You can also filter members of a hierarchical dimension (hierarchy). The measures in an analysis are combined to one dimension, the measure dimension. You can also define criteria that are used in the background of the analysis for filtering.
For example, if you analyse the sales volume of your company in the last three years, and you only want to see the values for the last three month of each year, you can remove the other months from your analysis.
Filtering members is a static action. Members that you have removed from your analysis remain excluded unless you change the filter criteria and include them again.
Member filters affect the totals and subtotals in your analysis. Only the values for the displayed members are included in the totals.
Related Information
To filter data by member [page 136]To filter data by member within hierarchies [page 138]To filter members directly on the crosstab [page 139]To filter out members directly on the crosstab [page 140]To create a background filter [page 141]
Analysis Plug-in User GuideAnalyzing Data P U B L I C 135

To remove a filter by member [page 142]
4.3.1.1 To filter data by member
Context
You can filter members of a dimension to create new views of your data. You can define the number of members displayed in the filter dialog in the User Settings.
If a dimension has more members than defined in the User settings, the filter dialog for mass data is opened. In this dialog, you only see the selected members, but you can add all other members of the dimension using the input help.
The filter dialog for mass data can be disabled in the registry. For more information, contact your IT Administrator.
Procedure
1. Select a cell in the crosstab that belongs to the dimension you want to use for filtering.
2. Choose Filter Filter by member .The Filter by Member dialog box appears.
NoteYou can also open this dialog box using the context menu on the crosstab or the design panel.
3. Select Individual Selection if you want to filter individual members of the dimension.a. If you want to search for members, clear the Select All checkbox in the members list and enter a search
string in the entry field. In the dropdown list of the search button, you can select if you want to search for a key, text or a member attribute.Members that match the search string are displayed in the members list and can be selected.
b. With the Display list, you can select how the members are displayed in the list. The following options are available: Key, Text, Text and key, Key and text and the member attributes.
NoteIf no text is defined for a member, the key is displayed as text. Members without text are displayed first in the filter dialog. Even if the key is displayed as text, the search for text is not possible if no text is defined. The result list will be empty.
You can also select the Access Mode and Explicit Selection.
The Access Mode option is available only if you select the check box Allow Access Mode to be Changed in the Advanced Settings dialog.
The Explicit Selection option could be useful if you do not have the authorization to see all members of a dimension. If the option is not active and you select Select All, no crosstab will be rendered as you do not
136 P U B L I CAnalysis Plug-in User Guide
Analyzing Data

have the authorization to see all members. If the Explicit Selection option is active and you select Select All, the single members you are authorized to see, will be selected and displayed in a crosstab.
You can save an Explicit Selection with a workbook. Note that if your authorizations change and you are authorized to see additional members, they will not be selected automatically when you reopen the workbook. You need to select them manually.
c. Choose the Show Selected button if only the selected members should be displayed.The button name changes to Show All. Choose this, if you want all members to be displayed again.
d. Select the members that you want to use for filtering in the members list.In the members list, all members are selected in the default setting. To deselect a member, clear the corresponding checkbox. You can also deselect all members by clearing the Select All checkbox and selecting individual members from the list.
e. Insert the members that you want to use for filtering with Paste from Clipboard.You can copy a single or a list of members to the clipboard and paste your selection to the filter dialog using the Paste from Clipboard icon at the left bottom of the filter dialog. The members that you want to paste can be displayed as either text or key in the list. Members defined without text in BW cannot be pasted as text.If you want to paste members that are displayed as text in the list, select Text or Text and key as Display option. If you want to paste members that are displayed as key in the list, select Key or Key and text as Display option.If you copy a list of members, you can use one of the following separators: \r\n (new line), \t (tab), ; (semicolon), | (pipe), : (colon). The sequence the separators are listed here, is relevant for their recognition as separator, that means if new lines are used as separator in the pasted list of members, a semicolon in the list will not be recognized as separator. But if semicolons and pipes are used in the pasted list, the semicolon is the identified separator.After pasting from the clipboard, the copied members are selected in the member list.
f. Insert the members that you want to use for filtering with Paste from File.You can paste a single or a list of members using the Paste from File icon at the left bottom of the filter dialog. An open dialog appears and you can select a text file (e.g. a .txt file) with members in the Windows explorer. The members that you want to paste can be displayed as either text or key in the file. Members defined without text in BW cannot be pasted as text.If you want to paste members that are displayed as text in the list, select Text or Text and key as Display option. If you want to paste members that are displayed as key in the list, select Key or Key and text as Display option.You can use the following separators in the text file: \r\n (new line), \t (tab), ; (semicolon), | (pipe), : (colon). The sequence the separators are listed here, is relevant for their recognition as separator, that means if new lines are used as separator in the pasted list of members, a semicolon in the list will not be recognized as separator. But if semicolons and pipes are used in the pasted file, the semicolon is the identified separator.After pasting the members from a file, they are selected in the member list.
4. Select Range Selection if you want to filter for a range of members.a. Select an operator.
The following operators are available: Between, Not Between, Greater Than, Greater Than Or Equal To, Less Than, Less Than Or Equal To, Equal To and Not Equal To.
b. Select the member range.For the range definition, the key of the members is relevant, not the text.
c. Select Add Range.
Analysis Plug-in User GuideAnalyzing Data P U B L I C 137

The range is added to the Range area. You can add several ranges to the filter.5. Press OK to apply the filter to your data.
Results
The data in the worksheet is filtered according to your selection. The filter is saved with the workbook and is available to other users or in other sessions. You can also open and edit existing filters again.
Related Information
User Settings [page 197]
4.3.1.2 To filter data by member within hierarchies
Prerequisites
The data source you are using contains hierarchies.
Procedure
1. Select a cell in the crosstab that belongs to the hierarchy you want to use for filtering.
2. Choose Filter Filter by member .The Filter by Member dialog box for hierarchies appears.
NoteYou can also open this dialog box using the context menu on the crosstab or the design panel.
3. If you want to search for members, clear the Select All checkbox in the members list and enter a search string in the entry field. In the dropdown list of the search button, you can select if you want to search for a key or a text.Members that match the search string are displayed in the members list and can be selected.
4. With the Display list, you can select how the members are displayed. The following options are available: Key, Text, Text and key, Key and text and Show Attributes. You can also select the Access Mode.
NoteIf no text is defined for a member, the key is displayed as text. Members without text are displayed first in the filter dialog. Even if the key is displayed as text, the search for text is not possible if no text is defined. The result list will be empty.
138 P U B L I CAnalysis Plug-in User Guide
Analyzing Data

In the Show Attributes list, you can find the attributes that are available for the members in your hierarchy. For example, a product hierarchy could have 'size' and 'color' as attributes. You can select and add these attributes to the member list in the filter dialog. This additional information may help you to make the selections for filtering.
5. In the list box, choose which members should be displayed in the list for selection.
○ Select Hierarchy in the list if you want the members to be listed with the hierarchy.○ Select Leaves if you want all members of all levels to be listed in a flat view.
6. Choose the Show Selected button if only the selected members should be displayed.The button name changes to Show All. Choose this if you want all members to be displayed.
7. Select the members that you want to use for filtering in the members list.In the members list, all members are selected in the default setting. To deselect a member, clear the corresponding check box. You can also deselect all members by clearing the Select All checkbox and selecting individual members from the list.If you deselect a node in a hierarchy, all leaf members of this node are deselected automatically. The parent members of the deselected node are still selected, but the background color of the checkbox changes to gray. That shows you that not all leaf members of this node are selected for filtering.
8. Press OK to apply the filter to your data.
Results
The data in the worksheet is filtered according to your selection. The filter is saved with the workbook and is available to other users or in other sessions. You can also reopen and edit existing filters.
Related Information
Access mode for filtering [page 142]
4.3.1.3 To filter members directly on the crosstab
Context
You can filter for one or multiple members directly using the context menu or double-clicking a member cell.
Procedure
1. In the crosstab, select one cell for each member that you want to filter for.To select multiple members, hold down the Ctrl or Shift key as you select members.
Analysis Plug-in User GuideAnalyzing Data P U B L I C 139
2. Choose Filter Members in the context menu.
NoteTo filter for one member only, you can also double-click the corresponding member cell.
In the design panel, the filter icon is added to the corresponding dimension.
Results
The data in the worksheet is filtered according to your selection. You can apply this filter to dimensions with and without hierarchies.
4.3.1.4 To filter out members directly on the crosstab
Context
You can filter out one or multiple members directly using the context menu or drag and drop.
Procedure
1. In the crosstab, select one cell for each member that you want to filter out.To select multiple members, hold down the Ctrl or Shift key as you select members.
2. Choose Filter Other Members in the context menu.To filter out the selected members using drag and drop, select the border of the marked field(s) and drag them out of the crosstab.In the design panel, the filter icon is added to the corresponding dimension.
Results
The data in the worksheet is filtered according to your selection. You can apply this filtering to dimensions with and without hierarchies.
140 P U B L I CAnalysis Plug-in User Guide
Analyzing Data

4.3.1.5 To create a background filter
Context
In Analysis, you can set filters for dimensions and hierarchies that you have chosen to be displayed in the crosstab. This allows you to narrow the scope of your analysis to the data you need. You can however also select members for filtering that should not be displayed in the crosstab. These non-visible filters are background filters.
For example, you have selected the dimensions Product and Region to be displayed in the crosstab. The data source contains the sales volume for the years, 2008, 2009 and 2010. If you are only interested in the sales volume for 2010, you can add the Year dimension as a background filter to your analysis and filter for 2010. The analysis will show the data for year 2010, but the Year dimension is not visible in the crosstab.
NoteBackground filters for a measure dimension can contain only one measure as a filter. The same is true for other dimensions that do not aggregate.
You have the following options to add a background filter to your analysis:
Procedure
1. You can add a dimension to the Background Filter area and define a filter:a. Add the dimension that you want to add to the Background Filter area in the design panel.
You can add the dimension using drag and drop or you can choose Move to Background Filter in the context menu.
b. Choose Filter By Member in the context menu.The Filter by Member dialog box appears.
c. Make your selection and press OK.The background filter is created.
2. Or: You can add a dimension that already has a filter. The existing filter will be applied as a background filter in the crosstab.
3. Or: You can add a background filter using the context menu on the crosstab.a. Select the member(s) that you want to define as background filter in the crosstab.b. Choose Filter Members and Swap With in the context menu.
The dimension with the selected filters is added automatically to the Background Filter area, and the dimension chosen for swapping with is added to the Rows area in the design panel.
Results
The data in the crosstab is displayed according to your filter selection.
Analysis Plug-in User GuideAnalyzing Data P U B L I C 141

4.3.1.6 To remove a filter by member
Procedure
1. Select a cell in the crosstab that belongs to the dimension you want to remove the filter for.
2. Choose Filter Select All Members .
NoteYou can also choose Select All Members in the context menu on the crosstab or the design panel.
Results
All members of the selected dimension are displayed in the crosstab.
4.3.1.7 Access mode for filtering
In the Filter by Member dialog, you can define the access mode that is used to display the members in the dialog. The acces mode is available in the Display list. The available options vary for the different data sources: BW data sources, SAP HANA analytic views and SAP HANA calculated views.
NoteThe Access Mode option is available only if you select the check box Allow Access Mode to be Changed in the Advanced Settings dialog.
Access mode for BW data sources
For BW data sources, you have the following options:
● Choose Access Mode Values in Master Data to display all members for the dimension (with and without posted data).
● Choose Access Mode Only Values in InfoProvider to display the members with posted data.
● Choose Access Mode Only Values with Posted Data in Current Navigation State to display the members with posted data that are selected in the current navigation state.
142 P U B L I CAnalysis Plug-in User Guide
Analyzing Data

Access mode for HANA analytic views
For SAP HANA analytic views, you have the following options:
● Choose Access Mode Values in Master Data to display all members for the dimension (with and without posted data).
● Choose Access Mode Values in Fact Table to display the members with posted data.
● Choose Access Mode Only Values with Posted Data in Current Navigation State to display the members with posted data that are selected in the current navigation state.
● Choose Access Mode Only Values for Existing Attribute Combinations in Master Data to display all members for existing attribute combinations.
Access Mode for SAP HANA calculated views
For SAP HANA calculated views, you have the following options:
● Choose Access Mode Values in Fact Table to display the members with posted data.
● Choose Access Mode Only Values with Posted Data in Current Navigation State to display the members with posted data that are selected in the current navigation state.
4.3.2 Filtering measures
With filtering measures, you can define rules to filter the data of your analysis to your current scope of interest. You can apply one or multiple rules to a measure. Depending on where you open the Filter by measure dialog, the filter definition is applied to a selected dimension, to all dimensions or to the most detailed dimension in your analysis. The applied measure filters do not affect totals or subtotals in your analysis.
You can define rules to get a ranked list of data and a list of data matching a threshold value.
In a ranked list filtering, all entries of the currently displayed data are considered and their relationship to each other determines whether an entry is displayed. For example, you can define that the Top 3 entries for a measure should be displayed.
In a threshold list filtering, an entry is filtered independently of the other entries if its value matches the criteria in the defined rule. For example, you can define that all entries are displayed that are greater than a specific threshold value.
Filtering measures is a dynamic action. Whenever you change the view of your data, the filter is applied again. For example, if you add a Top 5 filter, five members are shown in your analysis. If you then add members that you previously removed from the analysis, some of these newly added members could match the Top 5 criteria and replace some of the previously displayed members.
Analysis Plug-in User GuideAnalyzing Data P U B L I C 143

Related Information
To filter data by measure [page 144]To change a filter by measure [page 146]To remove a filter by measure [page 147]
4.3.2.1 To filter data by measure
Procedure
1. You have the following options to open the filter dialog:
○ Select a cell belonging to a dimension in the crosstab and choose Filter Filter by Measure Edit .If you select this option, the filter is applied to the members of the selected dimension.
○ Select a cell belonging to a measure in the crosstab and choose Filter Filter by Measure All Dimensions Independantly Edit .If you select this option, the filter is applied to all dimensions in the analysis, from the outermost to the most detailed one. For example, in an analysis with three dimensions in columns A, B and C, the filter is first applied to the dimension in column A, then to the dimension in column B and finally to the dimension in column C.
○ Select a cell belonging to a measure in the crosstab and choose Filter Filter by Measure Most Detailed Dimension in Rows Edit .If you select this option, the filter is applied to the most detailed dimension of the rows. For example, in an analysis with three dimensions in columns A, B and C, the filter is applied to the dimension in column C. This option is optimized for threshold value filtering.
○ Select a cell belonging to a measure in the crosstab and choose Filter Filter by Measure Most Detailed Dimension in Columns Edit .If you select this option, the filter is applied to the most detailed dimension of the columns. For example, in an analysis with three dimensions in rows 2, 3and 4, the filter is applied to the dimension in row 4. As with the option above, this option is also recommended for threshold value filtering.
The Filter by Measure dialog box appears.
NoteYou can also open this dialog box using the context menu on the crosstab or the design panel.
2. In the Based on measure: list, select the measure you want to use.3. In the Definition area, select the operator and value for a new rule.
The following operators are available: Between, Not Between, Greater Than, Greater Than or Equal to, Less Than, Less Than or Equal to, Equal to, Top N, Bottom N, Top%, Bottom %, Top Sum, Bottom Sum.
NoteFor SAP HANA data sources the following operators are available: Top N and Bottom N.
144 P U B L I CAnalysis Plug-in User Guide
Analyzing Data

4. Press Add.The new rule is added to the Rules area.
5. If you define multiple rules, select the logic for the rules.Select AND, if all rules should be applied simultaneously, or OR , if only one of the rules should be applied.
6. Press OK.
Results
The data in the worksheet is filtered according to your selection. The filter is saved with the workbook and is available to other users or in other sessions. You can also open and edit existing filters again.
Related Information
Operators used for filtering measures [page 145]To change a filter by measure [page 146]To remove a filter by measure [page 147]
4.3.2.2 Operators used for filtering measures
When defining filters by measure, you can create rules to get a list of data for a defined threshold value and rules to get ranked list of data.
To define threshold values, you can use the following operators:
● Between / Not BetweenFor these operators, you define a range of values that should be included or excluded in the list.
● Greater Than / Less ThanFor these operators, you define a specific value to display members that are greater or less than this value.
● Greater Than or Equal to / Less Than or Equal toFor these operators, you define a specific value to display members that are greater or equal to or less or equal to this value.
● Equal toFor this operator, you define a specific value to display members that are equal to this value.
To define a ranked list of values, you can use the following operators:
● Top N / Bottom NFor these operators, you must enter a whole, positive number as the value. The ranked list is arranged according to the defined number.For example, if you want a list of the three customers with the strongest sales volume and the five customers with with the weakest sales volume, you create a Top 3 and a Bottom 5 rule in the filter definition.
● Top% / Bottom %For these operators, you must enter a number between 0 and 100. The ranked list is arranged according to the defined percentage.
Analysis Plug-in User GuideAnalyzing Data P U B L I C 145

For example, if you want a list of the strongest products in revenue until 25% of the total revenue is attained, you create a Top 25% rule for this measure with regard to products.
● Top Sum / Bottom SumFor these operators, you can also enter a floating point number (15.7 for example). The ranked list is arranged according to the defined total value.For example, you want a list of products with the highest sales volume, whose combined sales volume totals EUR 20,000. All sales volumes are first sorted in descending order. The totals are calculated until the threshold value of 20,000 is exceeded. If the last value that need to be included to achieve EUR 20,000, causes the total to exceed 20,000, it is also included in the list. All products with a lower sales volume than this product are no longer displayed. Products that exceed the EUR 20,000 threshold remain in the list.
NoteDo not use these operators for ranked lists for filtering hiearchies.
4.3.2.3 To change a filter by measure
Procedure
1. Select a cell in the crosstab.There are four options for defining a filter by measure. To delete an existing filter, you have to select a cell that belongs to the option you used for defining it.
2. Choose Filter Filter by Measure [Selected Filter Option] Edit .
NoteYou can also use the context menu on the crosstab.
3. In the Rules area, select the Change icon in the rule that you want to change.4. Change the definition of the rule as required and press the Confirm icon to change the rule.5. Press OK to apply the changed rule(s) to your data.
Results
The data in the worksheet is displayed according to the changed filter rule(s).
146 P U B L I CAnalysis Plug-in User Guide
Analyzing Data

4.3.2.4 To remove a filter by measure
Procedure
1. Select a cell in the crosstab.There are four options for defining a filter by measure. To delete an existing filter, you have to select a cell that belongs to the option you used for defining the filter.
2. Choose Filter Filter by measure [Selected Filter Option] Reset .
NoteYou can also use the context menu on the crosstab.
Results
The data in the crosstab is displayed without the removed filter.
4.3.3 To work with BEx conditions in Analysis
In Analysis, BEx conditions correspond to a filter by measure. In SAP Business Explorer, you can define a condition for a query, for a query view or for a workbook:
● Query conditions are created in BEx Query Designer.In the results area of the query, the data is filtered according to the conditions. You can define multiple conditions for a query.If you insert a query with condtions in Analysis, you can activate and deactivate the conditions as BEx conditions in the menu.
● Conditions that are attached to a workbook are created in the BEx Analyzer.In the BEx Analyzer, you can activate and deactivate conditions.In Analysis, you can activate and deactivate the conditions as BEx conditions in the menu after the workbook conversion.
● Conditions that are attached to a query view can be created with various BEx tools, for example BEx Web Analyzer.If you insert a query view with condtions in Analysis, some of the conditions can not be recognized as BEx conditions. These conditions are displayed as filter by measure in Analysis. Conditions that are not activated in the query view, are not displayed in Analysis.In Analysis, you can activate and deactivate the conditions as BEx conditions in the menu or with the Filter by Measure dialog.
Analysis Plug-in User GuideAnalyzing Data P U B L I C 147

Using BEx conditions in Analysis
You can activate and deactivate BEx conditions:
● To activate a condition, choose Filter BEx Condition and select the condition you want to activate.The displayed data in the crosstab is changed according to the condition.
● To deactivate a condition, choose Filter BEx Condition and select the condition you want to deactivate.The displayed data in the crosstab is changed accordingly.
Using BEx conditions as filter by measure in Analysis
The conditions are displayed as rules in the Filter by Measure dialog. You can activate and deactivate the conditions in Analysis:
● To activate a local condition, choose Filter Filter by Measure Edit .The conditions are displayed in the rules section. Press OK to activate the conditions.
● To deactivate a local condition, choose Filter Filter by Measure Edit and remove all conditions in the rules section that you want to deactivate.Press OK to deactivate and delete the conditions. Deleted conditions cannot be activated again.
Related Information
Filtering measures [page 143]To convert a BEx workbook [page 38]The Information tab [page 117]SAPListOfMeasureFilters [page 66]
4.3.4 To show/hide zeros in rows and columns
Procedure
1. Select a cell in the crosstab.2. Choose Filter and one of the following options:
○ Suppress Zeros in RowsAll rows that only contain zeros are removed.
○ Suppress Zeros in ColumnsAll columns that only contain zeros are removed.
148 P U B L I CAnalysis Plug-in User Guide
Analyzing Data

Results
The zeros are suppressed in rows and/or columns. When zero suppression is active, a check mark is displayed beside the menu item.
NoteIn the BEx Query Designer, a query can have 2 settings relevant for zero suppression.
The first one is available at the overall query level and configures whether zero suppression is active or not in general. The second one is available at the structure level and specifies the behavior of the structure with regards to zero suppression. Given the 2 settings, there are several configurations that can be set for each axis respectively (especially if there are 2 structures).
In order to simplify the UI, you can only switch on or off zero suppression for each axis in Analysis. Hence, there is only 1 setting with 2 options for each axis available.
Therefore, Analysis is not able to visualize all possible BEx Query configurations in the menu. Depending on the configuration in the Query Designer a second activation of zero suppression could be necessary. After this second activation, zero suppression will be active in Analysis.
For more information, see SAP Note 2366950 .
To restore the hidden rows and columns, choose Filter Suppress Zeros in Rows or Filter Suppress Zeros in Columns again.
You can also define how zeros should be displayed in the crosstab if they are not hidden.
Related Information
To define the display of zeros and negative values [page 167]
4.4 Sorting data
Sorting data is a fundamental part of data analysis. It helps you understand your data better as you can visualize and organize different views on the data in your crosstab. With sorting the data, you are able to quickly identify the data you need for your decisions.
You can sort data by values (smallest to largest and largest to smallest) and members (A to Z and Z to A). If you sort the values of one measure (for example sales volume) from smallest to largest, the other cells in your crosstab are also affected by the sorting. The metadata information therefore remains correct in the crosstab.
The following sorting options are available:
● AscendingIf you select ascending sorting, the data is sorted from smallest to largest. Ascending sorting for members results in sorting from A to Z.
Analysis Plug-in User GuideAnalyzing Data P U B L I C 149

● DescendingIf you select descending sorting, the data is sorted from largest to smallest. Descending sorting for members results in sorting from Z to A.
● Break HierarchiesIn the default setting, data is sorted in the hierarchy levels of the crosstab. Parent members are sorted in order, and child members are sorted below each parent member in their own order. If you want to sort data across the entire hierarchy, select the Break Hierarchies option.
Related Information
To sort values [page 150]To sort members [page 151]
4.4.1 To sort values
Procedure
1. Select a cell in the crosstab that belongs to the measure you want to use for sorting.
2. Choose Sort More Sort Options... .The Sort by dialog box appears.
3. Select the sort options you want to use:
○ Sort AscendingSorts values from smallest to largest.
○ Sort DescendingSorts values from largest to smallest.
○ Break HierarchiesIf you select this option, the values are sorted across hierarchies. Existing hierarchies in the crosstab and their subtotals are not available any more after sorting. In the default setting, the option is not selected.
NoteIf you do not want to change the settings for Break Hierarchies, you can also select the sorting options Sort Ascending and Sort Descending directly in the menu or context menu.
4. Press OK.
Results
The sorting is applied to the crosstab.
150 P U B L I CAnalysis Plug-in User Guide
Analyzing Data

4.4.2 To sort members
Procedure
1. Select a cell in the crosstab that belongs to the dimension you want to use for sorting.
2. Choose Sort More Sort Options... .The Sort by dialog box appears.
3. Select the sort option you want to use:
○ Sort AscendingSorts members from A to Z.
○ Sort DescendingSorts members from Z to A.
4. In the Sort by list, select the object type for sorting:
○ Default (Dimension Members by First Display Type)The members are sorted by the first display type of the selected dimension.
○ Member Display TypeYou can select one of the member display types in the list below.
○ MeasureIf you select this object type, you can select one of the available measures in the list below. With this object type, the sorting is applied to the values of the selected measure and not to a dimension.
NoteIf you do not want to change these settings, you can also select the sorting options Sort Ascending and Sort Descending directly in the menu or context menu.
5. Select Break Hierarchies if you want to sort the members across hierarchies. Existing hierarchies in the crosstab and their subtotals are not available any more after sorting.
6. Press OK.
Results
The sorting is applied to the crosstab.
4.5 Working with hierarchies
There are two options for working with hierarchical presentations in your analysis: dimensions with hierarchies and dimensions displayed as hierarchy.
Analysis Plug-in User GuideAnalyzing Data P U B L I C 151

Including Dimensions with Hierarchies
Hierarchies for dimensions are created in the data modeling of SAP NetWeaver BW. In SAP NetWeaver BW, they are called Characteristic Hierarchy. A dimension can contain multiple hierarchies. In a hierarchy, dimension members are organized in a tree structure. For example, the hierarchy of cost centers that are assembled in cost center groups.
In BW, you can define different versions of a hierarchy for a dimension. In Analysis, these hierarchies are displayed several times in the design panel with the version number available in brackets after the hierarchy name.
You can also define different views of a hierarchy that are valid for a specific time period in BW. For that, you need to create the hierarchy structure time-dependently. In Analysis, you can specify in the 'Advanced Settings' dialog whether all time-dependent hierarchies for a dimension should be available in the design panel, or only the hierarchy for a selected period. For time-dependent hierarchies, the validity date is displayed in brackets after the hierarchy name in the design panel.
Note that dimensions with hierarchies can behave differently during filtering and sorting, and that there are separate styles for displaying hierarchy levels. The behavior is described in the corresponding chapters.
To find more information about the definition of characteristic hierarchies in SAP NetWeaver BW, go to the SAP Help Portal at http://help.sap.com SAP NetWeaver Select release and language SAP NetWeaver LibrarySAP NetWeaver by Key Capability Business Intelligence BI Platform OLAP Hierarchies .
Displaying Single Dimensions as Hierarchy
You can display multiple dimensions in a crosstab as a flat presentation or as a hierarchy. By default, the flat presentation is displayed. You can change the display to a hierarchical presentation. You can also use dimensions with hierarchies as a single dimension and combine it with other dimensions to a hierarchical presentation.
Related Information
To include dimensions with hierarchies in an analysis [page 153]To display single dimensions as hierarchy [page 154]To filter data by member within hierarchies [page 138]Sorting data [page 149]SAP cell styles [page 41]Advanced Settings [page 198]
152 P U B L I CAnalysis Plug-in User Guide
Analyzing Data

4.5.1 To include dimensions with hierarchies in an analysis
Context
By using a data source that contains a dimension with hierarchies, you can define different views on the hierarchies of the dimension. You can also display the members of the dimension in a flat presentation.
As of step two, the steps in the following procedure are optional. You can use the options you need to define your view on the data.
Procedure
1. Move a dimension with hierarchies to the Rows section in the design panel.
NoteDimensions can also be moved to the Columns section. This procedure describes dimensions in the Rows section. Dimensions in columns behave accordingly.
The dimension is displayed in the crosstab according to the definition in the BEx Query Designer. If the dimension is defined with an active hierarchy and active attributes, the dimension is displayed in the crosstab accordingly. Nodes with a + contain subnodes. In the design panel, the active hierarchy and attributes are displayed in bold letters in the <data source> section.If no hierarchy is active in the query definition, the data is displayed in a flat presentation.
2. Select a different hierarchy.Select a different hierarchy of the dimension in the <data source> section in the design panel and move it to the dimension in the Rows section.Only one hierarchy of a dimension can be active at the same time.The data in the crosstab changes according to your selection. The selected hierarchy is now active and displayed in bold letters in the <data source> section.
3. Activate attributesSelect an attribute of the dimension in the <data source> section and move it to the dimension in the Rows section.Multiple attributes can be active at the same time.The data in the crosstab changes according to your selection. The selected attribute is now active and displayed in bold letters in the <data source> section.
4. Expand/Collapse all nodes.
Select the cell with the dimension name in the crosstab and choose Hierarchy Expand to Level<Level> . The number of available levels depends from the hierarchy.The levels in the crosstab are expanded according to your selection. To collapse the levels, choose the first level.
5. Expland/Collapse a single node.
Select a node cell in the crosstab that you want to expand and choose Hierarchy Expand .
Analysis Plug-in User GuideAnalyzing Data P U B L I C 153
The selected node is expanded to the next level. To collapse the subnodes of a selected node, choose Hierarchy Collapse . You can also select the +/- symbols to expand and collapse a single node.
6. Define the available levels of the hierarchy.
Select a member cell of the dimension in the crosstab and choose Hierarchy Show Level... . Select the levels that should be available in the analysis and press OK.Only the selected levels can be displayed in the crosstab. The total is not affected by this selection because the leaf level is always available.
7. Define the sequence of a hierarchy.By default, a hierarchy is displayed from parent level to child level. To change this presentation, select the node of the first level and choose Hierarchy Expand Upwards (Rows) .The hierarchy is displayed from child level to parent level.
8. Display the dimension as flat presentation.Select the Flat Presentation node in the <data source> section of the design panel and move it to the dimension in the Rows section.The hierarchy is removed from the dimension and the members of the dimension are displayed in a flat presentation.
9. Switch between hierarchical and flat presentation.You can activate and deactivate hierarchies in the design panel to switch between hierarchical and flat presentation.In the Rows section, choose Use Hierarchy <HierarchyName> For Filter Only in the context menu for an hierarchy to deactivate the hierarchy and switch to the flat presentation.The members of the dimension are displayed in a flat presentation in the crosstab. The hierarchy information is removed in the design panel. If you open the filter dialog for this dimension, the hierarchy is still active and can be used for filtering.To activate the hierarchy again and switch to the hierarchical presentation, choose Use Hierarchy <HierarchyName> For Filter Only in the context menu for the dimension.
Results
The dimension with hierarchies is displayed according to your definition.
4.5.2 To display single dimensions as hierarchy
Context
If you use multiple dimensions in your analysis, you can display them as flat presentation or as hierarchy in the crosstab.
As of step three, the steps in the following procedure are optional. You can use the options you need the define your view on the data.
154 P U B L I CAnalysis Plug-in User Guide
Analyzing Data

Procedure
1. Move at least two dimensions to the Rows section in the design panel.
NoteDimensions can also be moved to the Columns section. This procedure describes dimension in the Rows section. Dimensions in columns behave accordingly.
The dimensions are displayed side by side in the crosstab.2. Change to hierarchical display.
Select a crosstab cell and choose Hierarchy Compact Display in Rows .The dimensions in the crosstab are displayed as hierarchy. The first dimension in the Rows section is the first level in the hierarchy. Nodes with a + contain subnodes.
3. Expand/Collapse all nodes.
Select the cell with the dimension name in the crosstab and choose Hierarchy Expand to Dimension <Dimension Name> . The number of available dimensions depends from the number of dimensions in the Rows section.The hierarchy in the crosstab is expanded according to your selection. To collapse the hierarchy, choose the first dimension.
4. Expand/Collapse a single node.
Select a node cell in the crosstab that you want to expand and choose Hierarchy Expand Dimension <Dimension Name> .The selected node is expanded to the next dimension below. To collapse the subnodes of a selected node, choose Hierarchy Collapse . You can also select the +/- symbols to expand and collapse a single node.
5. Define the sequence of the dimensions in the hierarchy.The sequence of the dimension in the Rows section determines their level in the hierarchy. The first dimension in the design panel is the first level in the hierarchy. By using drag and drop, you can move the dimensions up and down. The levels in the hierarchy are changed immediately.The hierarchy is displayed from child level to parent level.
6. Display the dimensions again as flat presentation.
Select a crosstab cell and choose Hierarchy Compact Display in Rows .The dimensions are again displayed side by side in the crosstab.
Results
The dimensions are displayed according to your definition.
Analysis Plug-in User GuideAnalyzing Data P U B L I C 155

4.6 Calculating new measures
In Analysis, you can calculate new measures based on measures that are available in the selected data source.
The measures used as basis for calculations must have a unique name in the data source. If several measures in a data source have the same name, these measures cannot be used for calculations. If one of these measures is selected, the Calculation option in the ribbon is disabled. Therefore, we recommend to use data sources containing measures with unique names.
For simple calculations, you use two or more available measures as operands and an operator to create a new measure. The new measure is the sum of two available measures, for example.
For dynamic calculations, you only use one available measure as operand and you create a new measure based on this operand. For example, if you use sales volume per region as operand, you can add a new measure that displays the rank of each region according to sales volume. If you now filter out or add new regions to your analysis, the rank numbers are changed dynamically. These calculations are therefore called dynamic calculations.
For advanced calculations, you can use the free-form editor. In this editor, you can create formulas with the available measures in the workbook and mathematical functions. The measures of the data source must have a unique name.
You can also add a new measure by restricting an existing one.
The newly created measures are added to the crosstab and to the design panel. In the design panel, you can switch the sequence of the measures, edit their name or delete them. Directly on the crosstab, you can also switch the sequence using drag and drop, and edit the name and delete measures with the context menus.
Related Information
To calculate a new measure based on available measures [page 156]To add a new measure based on one available measure [page 157]To add a new measure based on free-form calculation [page 159]To add a restricted measure [page 160]
4.6.1 To calculate a new measure based on available measures
Procedure
1. Select the measure headings that you want to use.The first measure that you select is the first operand. Use the STRG key to select the next measure that is the second operand. You can also select more than two operands for your calculation.
2. Choose Calculations Add Calculation [Operator] .The following operators are available:
156 P U B L I CAnalysis Plug-in User Guide
Analyzing Data

○ Add○ Substract○ Multiply○ Divide○ Percentage Difference
The new measure calculates the difference between operand 1and operand 2 as a percentage.For example, operand 1 has value 80 and operand 2 has value 20. The new measure displays the value 300%, as the difference is 60 and 60 is 300% of 20.If operand 2 has a higher value than operand 1, the result is negative. For example, operand 1 has value 20 and operand 2 has value 80. The new measure displays the value -75%, as the difference is -60 and -60 is -75% of 80.
○ Percentage ShareThe new measure calculates the share of operand 1 in comparison with operand 2 in percentage.For example, operand 1 has value 20 and operand 2 has value 80. The new measure displays the value 25%, as 20 is 25% of 80.
Results
The new calculated measure is added to the crosstab and the design panel.
A measure value that is displayed with sign reversal, is used in calculations as displayed.
ExampleA measure value is 200. If you have selected the sign reversal property in the BEx query definition, the value is displayed as -200 in Analysis. For calculations in Anaylsis, the value 200 is used. If you select this check box, the value -200 is used for calculations.
4.6.2 To add a new measure based on one available measure
Procedure
1. Select the measure heading that you want to use.
2. Choose Calculations Add Dynamic Calculation [Operator] .The following operators are available:
Option Description
Moving Minimum Value
The new measure displays the smallest value available up to this point.
For example, there are ten rows with values in your crosstab. The new measure starts in the first row with the same value as the original measure. If the second row in the original measure has a higher value than the first, the value of the first row is repeated in the second row of the new measure and so on.
Analysis Plug-in User GuideAnalyzing Data P U B L I C 157

Option Description
Moving Maximum Value
The new measure displays the highest value available up to this point.
Accumulative Sum The new measure displays the sum of all values up to this point.
For example, the original measure has eight rows with values. In the fourth row of the new measure, the sum of first four rows is displayed.
Accumulative Sum of Rounded Values
The new measure displays the sum of all rounded values up to this point.
Accumulative Count of All Detailed Values
The values per measure are counted and numbered starting with 1 for the first value. If there are 8 rows with values, including zeros, that contribute to the total, the new measure displays the numbers 1 to 8 for the 8 values.
Accumulative Count of All Detailed Values that are Not Zero, Null or Error
The values per measure are counted and numbered starting with 1 for the first value, excluding values that are equal to zero.
For values that are equal to zero, the last number is repeated.
Moving Average The new measure calculates the average of all values up to this point.
For example, if there are five rows with values in the crosstab, the new measure calulates in row 2 the average of the values in row one and two, and so on.
Moving Average that is Not Zero, Null or Error
The new measure calculates the average of all values up to this point, excluding values that are equal to zero.
Rank Number The new measure displays a rank number for each value of the original measure. The highest value in the original measure has the rank number 1.
If a value occurs more than once, the values are assigned to the same rank number. If there are two identical values with rank number 4, the next smallest value has rank number 5.
Olympic Rank Number
The Olympic ranked list differs from the basic ranked list as follows: In the Olympic ranked list, when a value occurs more than once, the next smallest value is not assigned the rank incremented by one, but the rank that corresponds to the number of previous values (including the current value).
For example, if the rank 4 occurs twice, the new measure displays number 6 for the next smallest value rank.
Percentage Contribution
The new measure calculates the percentage contribution of a value in the original measure to the overall result of the original measure.
Results
The new measure is added to the crosstab and the design panel.
158 P U B L I CAnalysis Plug-in User Guide
Analyzing Data

4.6.3 To add a new measure based on free-form calculation
Context
You can add a new measure with the advanced calculation editor.
Note that the advanced calculation editor is available only if all measures of the data source, visible or hidden in the current navigation state, have a unique name.
Procedure
1. Select a measure heading in the crosstab.
2. Choose Calculations Add Advanced Calculation... .
The New Calculation dialog appears.3. Enter a name for the new calculation.
This will also be the name for the new measure.4. Enter a formula for the new measure in the Calculation area.
With Insert Member, you can select the measures of the data source as operands.
With Insert Function, you can select the operator for the calculation. The following functions are selectable:○ Mathematical Functions:
○ Addition○ Division○ Multiplication○ Subtraction○ Power Function○ Logarithm○ Remainder from Integer Division○ Root○ Logarithm to the Base of 10○ Absolute Value○ Smallest integer value that is greater than operand○ Integer Division○ Largest integer value that is less than operand○ Decimal part of operand○ Maximum○ Maximum of 0 and operand○ Minimum○ Minimum of 0 and operand
Analysis Plug-in User GuideAnalyzing Data P U B L I C 159

○ Integer value of operand○ To the Power
○ Data Functions:○ Value without Dimension (No Unit)○ Process Value as Date○ Process Value as Time○ NOERR(x)\: Equals 0 for undefined calculations; otherwise x○ NDIVO(x)\: Equals 0 when Divided by 0; otherwise x
○ Percentage Functions:○ Percentage Deviation○ Percentage Share
○ Boolean Operators:○ Logical AND○ Logical OR○ Logical EXCLUSIV OR○ Logical NOT
You can also use CTRL+Space to enter operands and operators.5. Select OK to save the new measure.
The button is enabled if the calculation is valid.
Results
The new calculated measure is added to the crosstab and the design panel.
You can edit or delete the new measure.
4.6.4 To add a restricted measure
Context
You can add new measures based on restrictions for existing measures. The existing measure can also be a restricted measure.
Procedure
1. Select a measure heading or a data cell in the crosstab.
160 P U B L I CAnalysis Plug-in User Guide
Analyzing Data

2. Choose Calculations Add Restriction... .
The New Restriction dialog appears.3. .4. Enter a name for the new restriction.
This will also be the name for the new measure. The name cannot be edited after the creation.5. Select the measure that you want the new restricted measure to be Based on:6. In the Selections area, select the dimension that you want to restrict and specify the members for the
restriction.
You can select the Open Value Help icon to open the Filter by Member dialog for specifying the members.
If you opened the dialog from a data cell, this data cell is already defined as a restriction. You can change this restriction.
7. Select the Add Line icon to restrict an additional dimension.
This step is optional.8. Select OK to create the new measure.
Results
The new calculated measure is added to the crosstab and the design panel.
You can delete the new measure, but you cannot edit it.
4.7 Defining Conditional Formatting
You can use conditional formatting to highlight important values or unexpected results in your data.
With conditional formatting, you define rules to select different or critical values in a crosstab. Results that fall outside a set of predetermined threshold values are highlighted in color or designated with symbols. This enables you to identify immediately any results that deviate from the expected results. For example, you directly see answers to questions, such as which products have over 10% revenue increase this year or which regions have sales volume higher than a defined amount.
You can add one or more rules to a conditional format and prioritize the application of the rules in your crosstab. You can also define more than one conditional format in a worksheet and decide for each of them when it should be active by toggling it on and off. Existing conditional formats can be edited or deleted.
NoteThe conditional formatting described in this guide is part of the Analysis plug-in. There is also a conditional formatting available in Microsoft Excel.
Analysis Plug-in User GuideAnalyzing Data P U B L I C 161

Related Information
To define a conditional format [page 162]To edit conditional formats [page 163]
4.7.1 To define a conditional format
Procedure
1. Choose Conditional Formatting New .The New Conditional Formatting dialog box appears.
2. In the Name field, enter a name for the new conditional format.3. In the Based on list, select the measure you want to apply the conditional format to.4. In the Format list, select the style you want to use for highlighting values.
The following styles are available:○ Background: the cells background is colored.○ Values: the text of the cells is colored.○ Status Symbol: a symbol is displayed in the cells.○ Trend Ascending: a colored arrow (green to red) is displayed in the cells.○ Trend Descending: a colored arrow (red to green) is displayed in the cells.○ Trend Grey: a grey arrow is displayed in the cells.
Every style consists of nine members. The numbers 1 to 9 represent the priority of the rule.5. Define one or more rules on the Definition tab.
a. Select the priority.In the first list, select one of the nine priorities of the style selected above. If you define more than one rule in a conditional format, and the rules overlap for values in your crosstab, the priority determines which rule is applied to these cells. You should therefore use a priority only for one rule in a conditional format. Priority one is the highest priority and priority 9 the lowest.
b. Select an operator.You can choose one of the following operators: Between, Outside, Greater Than, Greater Than Or Equal To, Less Than, Less Than Or Equal To and Equal To.
c. Enter a threshold value or value range.d. Press Add.
The rule is added to the Rules area.6. Optional step: Define the selection for the conditional format.
On the Selection tab, you can define for each dimension if the conditional formatting should be applied to All Members and Totals or only to the Members or Totals. The default value is All Members and Totals.
7. Optional step: Define the visualization on the Display tab.Under Apply conditional formatting to:, you can define which parts of the crosstab are affected by conditional formatting: Data Cells, Row Headers and/or Column Headers.
162 P U B L I CAnalysis Plug-in User Guide
Analyzing Data

Under Apply Visualization to Another Measure:, you can specify that the conditional format defined for one measure (sales volume for example), is visualized in the data of another measure (sales order items for example). To use this function, select the Applied to check box.
8. Press OK to apply your rules to the crosstab.
Results
You have created one or more conditional formats. They are saved with the workbook and are available to other users or in other sessions.
4.7.2 To edit conditional formats
Context
Once you have defined conditional formats, you can open and change them, delete them or activate and deactivate them:
Procedure
1. Choose Conditional Formatting [Name of Conditional Formatting] .2. Select one of the following options:
○ Select Edit if you want to change the current definitions of a conditional format. You can add new rules, change existing rules, , or delete existing ones.To change existing rules, select the Change icon in the rule that you want to change, change the definition of the rule and select the Apply icon to change the rule.To delete existing rules, select the Remove icon in the rule that you want to delete.To apply the changed rule(s) to your data, press OK.
○ Select Delete if you want to delete a conditional format.○ Select or deselect Active if you want to toggle the formatting on and off.
4.8 Defining the display of members, measures and totals
When you insert a new crosstab in your analysis, members, measures and totals are displayed according to the default settings. You can change the display of these elements using the toolbar or context menu.
Analysis Plug-in User GuideAnalyzing Data P U B L I C 163

Related Information
To define the members display [page 164]Defining the measures display [page 165]Defining the totals display [page 168]
4.8.1 To define the members display
Context
Members can be displayed as key, text or both. For texts, you can define which text should be displayed.
Key, text and short text of a dimension and its members is set during creation in SAP NetWeaver BW. In the query definition, you can define the member display that should be used as default. In Analysis, you can define the member display for each dimension.
The defintion of the member display does not affect the totals and subtotals in your analysis.
Procedure
1. Select a member cell of a dimension to define the display for all members of this dimension.2. Choose Members and the display option you want to use. You can select the following display options:
○ Text: The members are displayed with their text.○ Key: The members are displayed with their key.○ Text and key: The members are displayed with their text and key.○ Key and text: The members are displayed with their key and text.
3. If you select a display option that contains text, you can choose between two display options for the text. Choose Members and one of the following options:
○ Short Text: The short text for the members is used for the text display.○ Text: The text for the members is used for the text display.
4. Select the Access Mode for the dimension to define which members should be displayed in the crosstab.
NoteThe Access Mode option is only available if you select the check box Allow Access Mode to be Changed in the Advanced Settings dialog.
For HANA data sources, the Access Mode option is not available.
You can select one of the following options:
○ Default: The members are displayed in the crosstab according to the query definition (either members with posted data or all members).
164 P U B L I CAnalysis Plug-in User Guide
Analyzing Data
○ Only Values with Posted Data: The members with posted data are displayed.○ Values in Master Data: All members (with and without posted data) are displayed.
Results
The members of the selected dimension are displayed in the crosstab according to your definition.
4.8.2 Defining the measures display
To define the measures display, you can specify the number format for each measure in your analysis. This includes the scaling factor and the decimals used.
For all measures in your analysis, you can define in one single step whether the scaling factors should be displayed. If you use currency as unit, you can translate the current currency to the currency you want to use. You can also define how zeros and negative values are displayed in the crosstab.
Related Information
To define the number format [page 165]To show or hide the scaling factors [page 166]To define currency translation [page 166]To define the display of zeros and negative values [page 167]
4.8.2.1 To define the number format
Procedure
1. Select a cell from the measure that you want to change.
2. Choose Measures Number Format .3. In the Number Format dialog box, select the Scaling Factor and the Decimal Places that you want to use for
the measure display.4. Select the Display Scaling Factor and Units in the Header for All Measures check box if the scaling factor
should be displayed in the crosstab.5. Press OK.
Analysis Plug-in User GuideAnalyzing Data P U B L I C 165

Results
The data cells of the selected measure are displayed according to your definition.
4.8.2.2 To show or hide the scaling factors
Procedure
1. Select a crosstab cell.
2. Choose Measures Show Scaling Factors .When the option is active, a check mark is displayed beside the menu item. To deactivate the option, choose it again.
Results
The scaling factors are displayed for all measures according to your definition.
The setting made in BEx Query Designer to display the scaling factors for key figures is not evaluated in Analysis. To define the display for scaling factors only this setting in Analysis is evaluated.
4.8.2.3 To define currency translation
Context
You can translate the currency for all measures of an analysis.
Procedure
1. Select a crosstab cell.
2. Choose Measures Currency Translation .3. In the Currency Conversion dialog, select a Target Currency, a Currency Conversion Type and press OK.
The currency conversion types are created in SAP NetWeaver BW. For more information, see SAP Help Portal at http://help.sap.com.
NoteThe selection options in the Target Currency and Currency Conversion Type lists are interdependent. Depending on the currency you selected, the system offers you all conversion types that support this
166 P U B L I CAnalysis Plug-in User Guide
Analyzing Data

currency. To be able to display all conversion types again, choose the standard setting Display Original Currency. Conversely, if you select a particular conversion type, the system shows all currency options for this conversion type.
4. Select the Use Currency Translation from Query Definition check box, if the currency translation should be based on the currency definition in the BEx Query Designer.The currency that you define in the query definition can be different from the currency in the original InfoProvider. For example, in the InfoProvider the currency USD is used and in the query definition, the currency is translated from USD to EUR. If you want to translate the currency in your analysis to GBP, the currency translation is based on EUR if you select this check box and it is based on USD, if you do not select it.
NoteThe check box is only available in the dialog when you select the Advanced Options in the User Settings.
Results
All measures that are scaled in a currency are translated to the selected currency.
Related Information
User Settings [page 197]
4.8.2.4 To define the display of zeros and negative values
Procedure
1. Select a crosstab cell.
2. Choose Measures General Format .3. Select an option from the Display of Negative Values list.
The following options are available: -X, X-, (X).4. Select an option from the Display Zeros as: list.
The following options are available:○ With Currency/Unit○ Without Currency/Unit○ Empty Cell○ User Defined
If you select this option, you can enter a text that should be displayed in the cells.5. Press OK.
Analysis Plug-in User GuideAnalyzing Data P U B L I C 167

Results
The values are displayed for all measures according to your definition.
You can also suppress zeros if there are rows or columns that only contain zeros.
Related Information
To show/hide zeros in rows and columns [page 148]
4.8.3 Defining the totals display
For totals, you can define whether they should be displayed in the crosstab. If they are displayed, you can decide where they should be displayed in the crosstab. You can also define how the totals should be calculated.
Related Information
To locate the totals display in the crosstab [page 168]To show or hide totals in the crosstab [page 169]To define the calculation of totals [page 169]
4.8.3.1 To locate the totals display in the crosstab
Context
In the default display, totals are displayed below members and to the right of the members. You have the following options to change the display:
Procedure
1. Select a crosstab cell.
2. Choose Totals Total Rows Above Members .The totals are displayed above the members.
3. Choose Totals Total Columns Left of Members .The totals are displayed left of the members.
168 P U B L I CAnalysis Plug-in User Guide
Analyzing Data

Results
The totals are displayed according to your definition. To change the location again, deselect the option.
4.8.3.2 To show or hide totals in the crosstab
Procedure
1. Select a member cell in the crosstab.
2. To show the totals in the crosstab, choose Totals Show Totals .
3. To hide totals that only have one member, choose Totals Hide Totals if Only One Member is Available .
Results
The totals are shown / hidden according to your definition.
4.8.3.3 To define the calculation of totals
Context
The default setting is to display totals according to the definition in the query. You can calculate with these values to display another result, for example the highest value for an area.
Procedure
1. Select a measure heading in the crosstab.
2. Choose Totals Calculate Totals As [Option] .The following options are available:
Option Description
Minimum The smallest value for the corresponding area is displayed as the result.
Maximum The highest value for the corresponding area is displayed as the result.
Sum The total of all values for the corresponding area is displayed as the result.
Analysis Plug-in User GuideAnalyzing Data P U B L I C 169

Option Description
Sum of Rounded Values
If you have set a scaling factor, it is useful to calculate the totals of rounded values locally since the totals can differ considerably (in particular with high scaling factors).
Total Number of Detailed Values
The number of values for the corresponding area is displayed as the result.
Total Number of Detailed Values that are Not Zero, Null or Error
The number of values for the corresponding area, excluding zeros, is displayed as the result.
Standard Deviation The deviation of the values from its mean is displayed as the result. The more spread out the data is, the higher the deviation. Standard deviation is calculated as the square root of variance.
For example, the mean of the following two is the same: 15, 15, 15, 14, 16 and 2, 7, 14, 22, 30. However, the second is clearly more spread out.
Average The average (total divided by total number of values) of all values for the corresponding area is displayed as the result.
Average of All Detailed Values that are Not Zero, Null or Error
The average (total divided by number) of all values for the corresponding area is displayed as the result, with the exception of zeros, meaning that values equal to zero are not counted.
Median The system sorts the values internally by size and displays the mean value from the list as the result.
For example, if there are five values in the list, the third value is displayed as the result. If the list has an even number of values (for example six), the system adds the two values in the middle of the list together (in this case, the third and fourth values) and divides the result by two. The resulting value is displayed as the result.
Median of Detailed Values that are Not Zero, Null or Error
Excluding the values that are equal to zero, the system sorts the values internally by size and displays the mean value from the list as the result.
Variance The variance is calculated as the square of the standard deviation and displayed as the result.
Hide The result is not displayed.
Default With this setting, the results provided by the query are displayed.
Results
The totals are calculated according to your definition.
4.9 To jump to a target with Goto
The report-report interface (RRI) allows you to call a jump target from a BEx query executed in Analysis. You can use the RRI to jump from the executed query (sender) to another report (receiver) containing more information. You can call targets in BW systems and beyond.
170 P U B L I CAnalysis Plug-in User Guide
Analyzing Data
You can use the report-report interface to call targets that you have defined in your query. To be able to call the targets from executed queries, you must define the targets for the query with the sender/receiver assignment. The sender/receiver assignment is defined in transaction RSBBS in the BW system.
In Analysis, you can assign the following receivers:
● QueryIf you call a query with Goto, a new workbook is opened with the query.
● Web addresshttp://www.google.com for example.
● The following targets are opened in the web browser:○ ABAP transaction. The transaction must be classified for using SAP GUI for HTML.○ ABAP Report○ BEx Web Application (3.x and 7.0)○ Crystal Report○ Xcelsuis dashboard
After making the assignment, you can choose Goto in the context menu to call all the targets for cells in the crosstab of the executed sender query.
More Information
You can find more information about the report-report interface and the sender/receiver assignment in the SAP NetWeaver documentation in the SAP Help Portal under http://help.sap.com/saphelp_nw73ehp1/helpdata/en/4a/5b96c6517f2e24e10000000a42189b/frameset.htm.
4.10 To comment a data cell
Context
With Microsoft Excel functionality, you can add a note to a cell by inserting a comment. You can edit the text in comments and delete comments that you no longer need. You can also choose if the comment text box is shown or hidden in your analysis.
You can add comments to the data cells in the crosstab. The data source must have been refreshed before you add a comment to a data cell. A comment is available internally as long as it is not explicitly deleted. For example, you add a comment to a cell and then change the view on your data. In the new navigation state, the cell with the comment is not visible. As soon as you change the navigation state so that the cell with the comment is again visible in the crosstab, the comment is also available.
The comments are associated with the selection of the cell. The selection inlcudes all selected values for the dimension, for example prompt, filter and background filter values. Analysis stores for each dimension the single member selection if the selection is a single member selection, for example a single value in the prompting definition. For other selections, Anaylsis stores that there has not been a single member selection for this dimension. Note that a comment that is placed on the total cell of a dimension also is considered to not have a
Analysis Plug-in User GuideAnalyzing Data P U B L I C 171

single member selection associated for this dimension. A comment is visible in a cell if the cell has for all dimensions the matching single member selection or the comment and the cell both do not have associated a single member selection.
Any hidden selections of a restricted key figure is not taken into account. Instead the key figure id is considered as single member selection.
If you add a comment to a member or header cell in the crosstab, the comment is not available after changing the navigation state.
NoteIf you create a Microsoft Powerpoint presentation with a crosstab that contains comments, the comments will not be available in the presentation.
Procedure
1. Make sure that the data source has already been refreshed.2. Select the cell that you want to add a comment.3. Choose Insert Comment in the context menu.4. In the comment text box, type the comment text.
A small red triangle in the corner of the cell indicates that the cell has a comment attached to it.5. To edit an existing comment, select the cell and choose Edit Comment in the context menu.6. To keep a comment visible with the cell, select the cell and choose Show/Hide Comment in the context menu.
The comment text box is shown permantly in your analysis. You can move the text box using drag and drop.7. To delete an existing comment, select the cell and choose Delete Comment in the context menu.
172 P U B L I CAnalysis Plug-in User Guide
Analyzing Data

5 Analyzing SAP HANA data
5.1 Analyzing SAP HANA data sources
After configuring a connection to the SAP HANA applicance software, you can analyze the following information models developped with SAP HANA as data sources in Analysis: analytic views and calculation views (type CUBE). You can also analyze data sources from a SAP NetWeaver BW, powerd by SAP HANA.
SAP HANA data sources
With SAP HANA data sources, you can use the following Analysis functions to analyze your data:
● Inserting a crosstab with SAP HANA data
You can also insert more than one data source in a workbook.● Saving/Opening a workbook to/from the business intelligence platform server● Undo/Redo● Defining style sets for crosstabs● Swapping axes● Analyzing data with the design panel● Filtering members● Sorting data by members and by measures● Inserting charts● Inserting filter components● Converting crosstab cells to formula● Creating Presentations● Pause Refresh
These functions are described in the correponding chapters in this guide.
SAP NetWeaver BW data sources
If you use SAP NetWeaver Business Warehouse, powered by SAP HANA, you can analyze BW queries, query views and InfoProvider with Analysis. You can use the BW data sources with Analysis like data sources of other BW systems.
Analysis Plug-in User GuideAnalyzing SAP HANA data P U B L I C 173

6 Planning Data
In Analysis, you can plan business data based on the current data in your data source. You can enter the planning data manually or you can enter planning data automatically using planning functions and planning sequences of SAP NetWeaver BW Integrated Planning. For planning data, you have to use a BW query or query view as data source that is defined as input-ready in BEx Query Designer.
When you work with input-ready data sources, Analysis offers two different modes: display mode and change mode. You use change mode to enter planning data in an input-ready query. If you want to unlock a data source for another user or avoid changing data accidentially, you can switch to display mode. You can also undo your changes and go back to the previous saved state or to the previous consistent client state. You can also lock and unlock selected crosstab cells for changes.
The work status function allows you to lock data cells or to set a new work status for data cells. The work states are configured in the SAP Business Planning and Consolidation (BPC) Web Admin Tool.
After entering the planning data, you can recalculate or save it. When you recalculate the planning data, all changed values are transfered to the planning buffer and checked for consistency. If the changed data entries are correct, the recalculated data is available and visible in all other components of the workbook. Recalculated data is not saved to the InfoProvider though. If you save the planning data, all transfered and changed values are saved to the InfoProvider.
The planning functionality is available in a separate group in the ribbon. You can define in the user settings if the planning group should be displayed in the ribbon.
Related Information
To plan data manually [page 175]To plan data with planning objects [page 177]To undo changes while planning data [page 184]To lock cells [page 181]To set a work status [page 183]To recalculate planning data [page 179]To save planning data [page 179]To switch between display and change mode [page 184]User Settings [page 197]
174 P U B L I CAnalysis Plug-in User Guide
Planning Data
6.1 To plan data manually
Context
You can enter the planning data manually in a crosstab in your analysis. To enter planning data, you can either change the values in existing data cells in the crosstab or you can add new lines to crosstabs in change mode.
Procedure
1. Enter an input-ready data source or open a workbook with an input-ready data source.The crosstab is visible in change mode. In change mode, read-only cells of the data source are displayed with different background colors. If you switch to display mode, the distinct visualization of input-ready and read-only cells is not visible.
NoteMicrosoft Excel cells are always input enabled. That means you can also enter values in the read-only cells of the data source. These values will not affect your planning though. If the read-only cells are displayed with a different background color, you can avoid entering data in read-only cells.
If a data source is not displayed in change mode, you can check the following settings:○ Check on the Components tab in the design panel if the correct planning system is connected.
In the default setting, the planning system is the first system you connect to after opening a workbook. If a workbook contains objects from different systems, you can select one of these systems as the planning system in the list. The changed planning system will only be effective after closing and reopening the workbook.
○ Check on the Components tab in the design panel if the check box Switch All Data Sources to Change Mode for Initial Refresh is selected.If the check box is selected, the input-ready data sources in the workbook are opened in display mode. With the initial refresh, they will be switched to change mode automatically.
○ If a data source is locked by another user, a message is displayed after opening.You can also use the property IsDataSouceEditable of the API method SAPGetProperty to check if a data source is input-ready.
2. You can enter planning data by changing data in existing data cells of the crosstab.The format of an entered value is immediately validated. If the format is not correct, a message is displayed.To check the consistency of the new values and apply it to the crosstab, choose Recalculate.
3. You can enter planning data in new lines added to the crosstab.You can define the number of new lines on the Components tab in the design panel. The default number of lines is 5. New lines for planning are added to the bottom of the crosstab. In display mode, the new lines are not visible.To enter data in the data cells, you have to enter the complete member combination for the data cell. For example, the dimensions Country, Region and City are in the rows of your crosstab. If you want to enter a planning value for Paris, you also have to enter the region and country member in the corresponding line. You
Analysis Plug-in User GuidePlanning Data P U B L I C 175
can enter the member manually or select values with input help. The entered values are immediately validated for format and master data. If a value is not correct, a message is displayed.If the data source contains dimensions that are created in BW as characteristics without master data, you can enter master data in the new lines to create new members in Analysis. The new members will also be saved to the BW system.
Note that you can only create new members if the RSADMIN parameter PLAN_ALLOW_NOT_EXIST_MEM is active (value X) in the BW system. For more information, contact your IT administrator.
To check the consistency of the new values and apply them to the crosstab, choose Recalculate.4. You can undo all changes that are not recalculated or undo recalculated changes that are not saved.
Select Back To Previous Consistent Client State / Saved State .
NotePlanning data that you entered in a data cell in the crosstab, will be written to the planning buffer with the next action executed in Analysis. This could be swapping axis or adding or removing a dimension, for example. Even if the data cell where you entered the planning data is no longer displayed in the crosstab, the data is still available in the buffer.
If data is no longer needed, you can delete it manually in the data cell or delete the complete buffer with Back To Previous Consistent Client State .
5. Choose Save to save the planning data to the system.
Results
The changed data is saved in the data source.
Related Information
To recalculate planning data [page 179]To save planning data [page 179]To undo changes while planning data [page 184]To switch between display and change mode [page 184]The Components tab [page 118]SAP cell styles [page 41]
176 P U B L I CAnalysis Plug-in User Guide
Planning Data

6.2 To plan data with planning objects
Context
You can use two planning objects: planning functions and planning sequences. Planning functions allow system-based processing or generation of data. A planning sequence is a sequence of planning functions. Both obejcts are created with Planning Modeler in SAP NetWeaver BW.
The following procedure explains the steps to be done in Analysis when working with planning objects. For more information about SAP NetWeaver BW Integrated Planning, Planning Modeler and objects like planning function or aggregation level, see the corresponding documentation on the SAP Help Portal.
Procedure
1. Insert an input-ready data source or open a workbok with an input-ready data source.
NoteThis step is optional. You can also use planning objects without visualization in a crosstab.
2. Add a planning object to the workbook.On the Components tab in the design panel, choose Use Planning Function or Use Planning Sequence in the context menu of the workbook. In the Open dialog box, search for the planning object, select an object and press OK.The node Planning Objects is added to the workbook on the Components tab. All planning objects are assigned to this node.
3. Check on the Components tab in the design panel if the correct planning system is connected.In the default setting, the planning system is the first system you connect to after opening a workbook. If a workbook contains objects from different systems, you can select one of these systems as the planning system in the list. The changed planning system will only be effective after closing and reopening the workbook.
4. Select the Process Changed Data check box if you want to use process changed data.If you select this check box, you can define that only data changed by the user in the current session since the last save will be processed. You can specify for planning functions which aggregation level should be used as a filter to define the changed data. In the default setting, the aggregation level the planning function is built on is selected for a planning function.Note that an aggregation level can only be set for planning functions. Therefore, it is not possible to select an aggregation level for planning sequences.
5. Define the variables values of the planning object.On the Variables of Planning Sequence / Functions tab, select the source and define the values:
○ For source Member, you can select the members with input help.○ For source Cell, you can define the cell that contains the values.
Variables act as placeholders for members, hierarchies and numbers. They can be defined in BEx Query Designer or in Planning Modeler. All variable values are valid locally in the planning object. To plan data for two
Analysis Plug-in User GuidePlanning Data P U B L I C 177

different years for example, you can insert the same planning function twice in a workbook and enter different values for the dimension year.
6. Define the filter for the planning function.On the Filter tab, you get a list of all dimensions of the aggregation level.a. Define the filter values for the dimensions as required.
For source Member, you can select the members with input help.For source Cell, you can define the cell that contains the values.For source Link, the current filter values in the data source are used.
NoteFor dimension with source Link, you can also use the API method SAPSetFilter, to define the filter values.
b. You can also select the filter the planning function is linked to:○ Press the Open Filter button to insert a filter object.
The filter object can be created in the BEx Query Designer and in the Planning Modeler.○ Press the list button to select the data source you want to use for planning. The data source should
already be used in the workbook.When you insert a filter object or data source, the source type changes from Member to Link for all dimensions that have not previously been defined, and the current filter values in the data source or filter object are used.
c. Redefine filter values.You can change the filter definition for a planning function at any time. After inserting a data source, for example, you can change the source from Link to Cell and define a cell that contains the values that should be used as filter.
7. Choose Execute Planning Funtion in the context menu of a planning function on the Components tab to execute the object.When working with planning sequences, choose Execute Planning Sequence in the context menu of a planning sequence on the Components tab to execute the object.
NoteThe changed data is recalculated automatically when you execute a planning object. To undo all changes since the last save, choose Back To Previous Saved State .
8. Optional step: Delete a planning object from the workbook.Choose Delete in the context menu of the planning object on the Components tab.
9. Choose Save to save the planning data to the system.
Results
The changed data is saved in the data source.
178 P U B L I CAnalysis Plug-in User Guide
Planning Data

6.3 To recalculate planning data
Procedure
1. Enter or change planning data.2. Choose Recalculate.
Results
All changed values are checked for consistency. If the changed data entries are correct, the recalculated data is available, the totals are updated and the new values are visible in all other components of the workbook. The recalculation is executed for all data sources in the workbook that are available in the selected planning system.
You can also use the PlanDataTransfer command from API method SAPExecuteCommand to recalculate planning data.
Related Information
SAPExecuteCommand [page 77]
6.4 To save planning data
Procedure
1. Enter or change planning data.2. Choose Save.
Results
All changed values are checked for consistency. If the changed data entries are correct, the data is saved in the data sources and a message is displayed that the data was saved. The saving is executed for all data sources in the workbook that are available in the selected planning system.
You can also use the PlanDataSave command from API method SAPExecuteCommand to save planning data.
Analysis Plug-in User GuidePlanning Data P U B L I C 179

Related Information
SAPExecuteCommand [page 77]
6.5 Locking Cells
You can lock input-ready cells against manual changes in planning workbooks. A locked cell is a time-limited setting that only applies to the current user session. Locked cells are displayed in a different cell style. You can also undo cell locks.
There are two implementations of the cell lock function in Analysis. These are
● Front-end cell locksCell locks are managed in the runtime for the current result set. Cell locks remain in effect so long as no significant changes are made to the result set.
● Back-end cell locks (Single Query and Cross Query)Cell locks are managed exclusively in the back-end system for one single or all input-ready queries in the planning workbook. Locking cells in all queries of the workbook makes it possible for a cell that is locked in one query to be displayed as locked in other queries and to be treated as such.
You can select on the Components tab in the design panel which implementation should be applied in a workbook.
For more information about cell locking in SAP BW, see the BW documentation on the SAP Help Portal at http://help.sap.com.
6.5.1 Front-End Cell Locks
Front-end cell locks in a query remain in effect until the user makes significant changes to the crosstab.
The cell locks remain in effect if the user performs any of the following activities:
● Sorting the crosstab● Expanding or collapsing nodes in BW hierarchies● Changing display settings for dimensions
If the user performs one of the following activities though, the cells locks are undone: :
● Adding/removing dimensions or measures to the crosstab● Calling the prompting dialog to change variable values● Swapping row and column axes● Hierarchical axis display● Zero suppression● Setting a filter● Executing a planning function or sequence
180 P U B L I CAnalysis Plug-in User Guide
Planning Data

6.5.2 Back-End Cell Locks
Back-end cell locks in a planning application allow more navigation steps in a query while retaining the cells locks as front-end cell locks. In Analysis, you can decide if the cells are locked for a a single query or multiple queries in a planning application.
Cross query cell locks could be particularly suitable if a planning workbook contains multiple sheets, and its queries are closely linked but are used for different aspects of the planning application.
The back-end cell locks remain in effect if the user performs any of the following activities:
● Displaying the properties of the dimensions (like Key or Text )● Displaying attributes of the dimensions● Sorting the result set by dimension members, texts or key figures● Swapping row and column axes● Expanding or collapsing nodes in hierarchies● Hiding/showing structure elements (filter structure elements for example)● Adding a dimension to the crosstab: At the lowest point on the right in the rows and the furthest point inside in
the columns● Removing a dimension from the crosstab: At the lowest point on the right in the rows and the furthest point
inside in the columns
Note that some of the operations listed above hide locked cells. This does not undo the cell locks however. These "hidden" cell locks also remain active and are taken into account by the system when calculating inverse formulas and during disaggregation.
If the user performs any of the following activities, all cell locks are undone :
● Changing the order of the dimensions included in a cell lock● Change the axis of the dimension included in a cell lock● Changing the settings for BW hierarchies (on/off) for dimensions included in a cell lock,● Change the query's dynamic filter (by restricting the variable values without restarting the query for example)● Changing the filter using the prompting dialog● Performing a planning function or planning sequence
6.5.3 To lock cells
Context
You can lock input-ready crosstab and total cells in Analysis. A locked cell can not be changed manually when the crosstab is recalculated.
NoteMicrosoft Excel cells are always input enabled. That means you can also enter values in the locked cells of the data source. These values will not affect your planning though.
The cells are locked for the current user session only. You can also unlock the cells during the session.
Analysis Plug-in User GuidePlanning Data P U B L I C 181

Procedure
1. Select the crosstab cells you want to lock.The selected cells have to be input enabled and have not been changed since the last recalculation.If you select a mixture of input-ready and already locked cells, all selected cells will be locked.
2. Choose Lock Cells in the planning group.You can also use the context menu to lock and unlock the cells.
Results
The selected cell are locked for changes. The locked cells are displayed in a different cell style.
To unlock the cells, select all cells you want to unlock and choose Unlock Cells.
6.6 Setting the Work Status
With the work status function, you can define who can enter planning data in a workbook and who can set a work status. Work states can also be used to apply a label to a current view and lock its data for review or approval.
For example, your month-end close business process requires that a specific set of data is locked down so that accurate month-end reports can be created. After a data submission, the owner sets the work state to Submitted. This locks the data intersection from subsequent submissions.
Another use case is that users have the authorization to enter planning data for defined members of a dimension. For example, user A can enter the planning data for France and user B for Spain.
A work status that will be used in Analysis, has to be defined with SAP Business Planning and Consolidation (BPC), version for SAP NetWeaver embedded. The work status is configured in the BPC Web Admin Tool and is based on a BPC model. A model can include one or several InfoProviders. All InfoProviders in the model must contain the owner dimension
In the work status configuration, a list of work states can be defined with any name. Typical work states are Unlocked, In Process and Approved. In the section Locking Dimensions, an Owner Dimension, a Hierarchy and an Owner (and Team) must be defined. The hierarchy is a BW hierarchy based on the owner dimension. Other dimensions can be added to the work status.
The ownership for single members is defined in the master data maintenance of the SAP BW system. In transaction rsd1, an owner can be defined for each member of a selected dimension. As the ownership is defined on member level, several users can plan data or set a work status in a workbook at the same time.
NoteCheck the licensing conditions for SAP BusinessObjects Planning and Consolidation, version for SAP NetWeaver embedded.
For more information about setting up work states, see Work Status Setup
182 P U B L I CAnalysis Plug-in User Guide
Planning Data

Related Information
To set a work status [page 183]
6.6.1 To set a work status
Context
You can change the planning data and set a work status for data cells of defined members. You can also lock data cells for updates with a work status.
To be able to set a new work status at least one work status is defined in the BPC Web Admin Tool and you have the authority to set a work status for one or several members. The ownership is defined in the master data maintenance of the SAP BW system.
Procedure
1. Open a workbook containing a planning model and a corresponding data source.
You can also open an empty workbook and insert a planning model and a corresponding data source. Planning models are available on the Environment tab in the open workbook dialog.
2. Select a data cell.
3. Choose Work Status Work Status Criteria to check the work status criteria.
You can only set a work status if all defined criteria is fulfilled.
4. Choose Work Status Set Work Status Hierarchy to apply the hierarchy defined for the owner dimension in the BPC Web Admin Tool.
This step is optional. We recommend it to fulfill the criteria, but you can also create a navigation state in Analysis that fulfills all criteria without setting the hierarchy.
5. Choose Work Status Include All Descendants to apply the work status to the selected member and all descendant members.
This step is optional.
The entry is available only if a data cell of a member is selected that has descendant members in the hierarchy.
The setting is valid for the workbook and not only for the selected data cell.
6. Choose Work Status <Defined Work Status> to set a new work status.
You can only see and select a work status if you are defined as owner for this member in the master data maintenance of the SAP BW system.
Analysis Plug-in User GuidePlanning Data P U B L I C 183

The available work states are defined in the BPC Web Admin Tool.7. Choose Save Data in the planning group to save your changes.
Results
The workbook is saved with the changed data and work status.
6.7 To undo changes while planning data
Procedure
1. Enter or change planning data.2. To undo your changes, you have the following options:
○ Choose Back To Previous Saved State .With this option, you undo all changes since the last save of your data. The undo is executed for all data sources in the workbook that are available in the selected planning system.You can also use the PlanDataReset command from API method SAPExecuteCommand to revert to the last saved state of your planning data.
○ Choose Back To Previous Consistent Client State .With this option, you undo all changes since the last successful recalculation of your data. The undo is executed for all data sources in the workbook that are available in the selected planning system.You can also use the PlanDataClientReset command from API method SAPExecuteCommand to revert to the last recalculated state of your planning data.
Related Information
SAPExecuteCommand [page 77]
6.8 To switch between display and change mode
When you work with input-ready data sources, Analysis offers two different modes: display mode and change mode. You use change mode to enter planning data and to recalculate or save the changed data to the BW system. If a user is working with an input-ready data source in change mode, this data source is locked for the other users. If the user switches to display mode, another user can work with this data source in change mode.
When you open a workbook containing input-ready data sources, the crosstabs of these data sources are displayed in change mode. If you select the check box Switch All Data Sources to Change Mode for Initial Refresh
184 P U B L I CAnalysis Plug-in User Guide
Planning Data

on the components tab in the design panel when saving a workbook, the workbook will be opened in display mode. The data sources will be switched to change mode with the initial refresh automatically.
In change mode, new lines for planning are added to the bottom of the crosstab, and read-only cells of the data source are displayed with different background colors. The Plug-in includes SAP standard styles for the visualization (SAPEditableDataCell, SAPEditiableDataTotalCell, SAPReadonlyDataCell and SAPReadonlyDataTotalCell). You can change the cell styles as required. In display mode, the distinct visualization of input-ready and read-only cells is not visible.
Switch to display mode
You work in a workbook that includes input-ready data sources.
1. Enter or change planning data.2. Choose Display to switch to display mode.3. A dialog box asks if you want to save your changes before switching to display mode.
Press Yes to save your changes or No to discard them.
The data sources are switched to display mode. The distinct visualization of input-ready and read-only cells is not visible any more and the new lines at the bottom of the crosstab are deleted. The data sources can now be used in change mode by another user.
You can also use the PlanDataToDisplayMode command from API method SAPExecuteCommand to switch to display mode.
Switch to change mode
You work in a workbook that includes input-ready data sources. You are currently working in display mode.
1. Check on the Components tab in the design panel that the correct planning system is connected.2. Check on the Components tab in the design panel that the check box Planning: Open Data Source Input-
Enabled is selected for the data sources you want to change.3. Choose Change to switch to change mode.
All data sources in the workbook that are available in the selected planning system and are selected as input-enabled are switched to change mode. The distinct visualization of input-ready and read-only cells is applied, and the new lines are added at the bottom of the corresponding crosstabs.
NoteIf a data source is locked by another user, a message is displayed.
You can also use the PlanDataToChangeMode command from API method SAPExecuteCommand to switch to change mode.
Analysis Plug-in User GuidePlanning Data P U B L I C 185

Related Information
The Components tab [page 118]SAP cell styles [page 41]
6.9 Editing short texts in queries
With release SAP BW 7.40 SPS08, you can edit short texts in input-ready queries. This enables you to use characteristics of a suitable InfoProvider as key figures in the query definition, in order to change characteristic values (for example, classifications) in queries or to write comments (short texts) on key figure values in queries.
In Analysis, you can select or modify characteristic values for classification, depending on the definition in the query designer. You can also enter or change short texts as comments in a query.
You can find more information about editing short texts in queries and the definition in the query designer, in the SAP BW documentation in the SAP Help Portal at http://help.sap.com/.
186 P U B L I CAnalysis Plug-in User Guide
Planning Data

7 Creating Presentations
You can insert a data source in Analysis, edition for Microsoft PowerPoint. The data is displayed in a crosstab.
If a crosstab includes more rows than can be displayed on a slide, the Fit Table dialog box appears. In this dialog, you can define if the crosstab should be splitted to multiple slides or displayed abbreviated in one slide.
You can change the view on the data with the following options: Prompting, Filtering, Sorting and Hierachies.
You can change the formatting of a crosstab with Table Tools. In the Table Style Options group, you can define the display of rows and columns. If you select Header Row and First Column, the formatting is only applied to the first header row and first column even if your Analysis crosstab contains more than one header rows or columns with member information. The formatting will be applied to these rows and columns after the next Analysis refresh.
NoteYou should not use the other options in the Table Tools ribbon to format an Analysis crosstab. If you use them, your changes will be overwritten with the next Analysis refresh.
You can select a crosstab to insert the data as a Chart or an Info Field. You can edit the charts with the Microsoft PowerPoint Chart Tools. The option is available if a chart is selected.
With Move to, you can move any object in the presentation to another slide.
You can also paste a copied object from the edition for Microsoft Exel to the edtion for Microsoft PowerPoint (Smart Copy).
In the settings dialog, you can define specific settings for Analysis in Microsoft PowerPoint. To open this dialog, choose File Analysis Settings or Presentation Settings....
Corresponding to workbooks, you can save a presentation to a platform server and open it from there. Choose Analysis Open Presentation or Save Presentation. Presentations without charts can also be saved as 1.x
version.
Related Information
Working with Analysis in Microsoft PowerPoint [page 17]To open a workbook [page 32]To save a workbook [page 33]Presentation settings [page 189]To smart paste a data source [page 188]
Analysis Plug-in User GuideCreating Presentations P U B L I C 187

7.1 To smart paste a data source
Prerequisites
You have inserted a data source in Analysis, edition for Microsoft Excel.
Context
In the edition for Microsoft Excel, you can copy a crosstab or chart that is currently displayed in the workbook. In the edition for Microsoft PowerPoint, you can then insert the copied object.
In Microsoft PowerPoint, the current navigation state of the objects in Excel is displayed, but the objects exist independently in Excel and PowerPoint. After the creation of the slide, navigation steps in Excel do not affect the objects in PowerPoint and vice versa.
Procedure
1. In the edition for Microsoft Excel, select the crosstab or chart that should be copied.2. Choose Smart Copy.3. Open the edition for Microsoft PowerPoint and select a slide.
4. Choose Smart Paste Smart Pate as Table or Smart Paste Smart Pate as Chart .
The copied object is pasted as table or chart into the slide.5. Optional step: Change the view on the data.
You can change the view on the data in Microsoft PowerPoint using the functions of the Analysis ribbon.You can use the undo/redo in the Anaylsis ribbon to undo and redo steps that you executed with functions in the Analysis ribbon. To undo/redo steps that you executed with Microsoft PowerPoint, for example the deletion of a crosstab, you should use the undo/redo of Microsoft PowerPoint.
6. Optional step: Change the formatting of a crosstab or chart.
Results
The copied object is displayed on a Microsoft PowerPoint slide.
188 P U B L I CAnalysis Plug-in User Guide
Creating Presentations

7.2 Presentation settings
In the Presentation Settings dialog, you can define specific settings for Analysis in Microsoft PowerPoint. In Microsoft Excel, these settings are available on the Components tab in the design panel.
To open this dialog in Microsoft PowerPoint, choose Settings Presentation Settings .
Refresh Presentation on Opening
If you select this check box, the data sources in the presentation are refreshed every time the presentation is opened.
If this check box is not selected, the data in the presentation is not automatically refreshed on opening. You can refresh the data sources manually with choosing Refresh All in the menu.
Force Prompt for Initial Refresh
If you select this check box, the prompting dialog is displayed on every refresh.
Store Prompts with Presentation
If you select this check box, the defined prompt values are saved with the presentation.
Remove Data Before Saving
If you select this check box, the presentation is saved without the data. When you reopen the presentation, no data is displayed. To display the data, refresh the data sources manually with choosing Refresh All in the menu.
Merge Variables
If you select this check box, the variables are merged for all data sources in the presentation. If the check box is not selected, the variables can be defined for each data source separately.
Analysis Plug-in User GuideCreating Presentations P U B L I C 189

8 Creating Web Applications
Context
You can transfer components in an Analysis workbook to the SAP BusinessObject Design Studio to create a web application. The design studio enables application designers to create analysis applications and dashboards for browsers and mobile devices.
In Analysis, you can use methods that are not available in the design studio. For example, you can use calculations, conditional formatting, and exceptions to change a data source. You may then want to create a web application to use this changed data source in the design studio.
The following Analysis components can be transferred:
● Crosstabs● Charts
The following chart types are enabled: Pie, Line, Column, Bar, Surface, Radar, Bubble, and Scatter.● Filters
Procedure
1. Ensure that the design studio is closed.2. In Analysis, select the workbook sheet with the components that you want to transfer to the design studio.3. Choose Create Web Application in the ribbon.
If the icon is not displayed in the ribbon 'Tools' group, you can enable it in the 'Advanced Settings' dialog.The 'Logon' dialog for the design studio appears.
4. Enter your logon data and choose OK to log on to the design studio.The Design Studio is opened and the components of the workbook sheet are added to the design studio template.
Results
You can now modify the web application with the Design Studio.
For more information about working with the Design Studio, see the documentation at http://help.sap.com/boad.
190 P U B L I CAnalysis Plug-in User Guide
Creating Web Applications

Related Information
Advanced Settings [page 198]
Analysis Plug-in User GuideCreating Web Applications P U B L I C 191

9 Using Analysis in other SAP BusinessObjects Applications
After performing an analysis, you might want to use other SAP BusinessObjects applications to communicate your findings and share the analysis with others.
To use an analysis in other applications, you save it as an analysis view. An analysis view is a saved navigation state of an analysis including applied filters, hierarchies, and available metadata.
Analysis views can be saved with SAP BusinessObjects Analysis, edition for Microsoft Office, and with SAP BusinessObjects Analysis, edition for OLAP. They can be inserted in both editions of SAP BusinessObjects Analysis.
Like workbooks, analysis views are saved to the business intelligence platform server. While a workbook can comprise several analyses, an analysis view comprises just one.
If analysis views created with a 1.x Analysis version and containing SAP HANA data sources are available, you can use the Analysis View Migration dialog on the Conversion tab in the settings dialog to migrate them to 2.x analysis views.
You can also export data sources from Analysis to the SAP BusinessObjects Design Studio and use it there for creating applications and dashboards.
Related Information
To save an analysis view [page 192]To insert an analysis view [page 193]Conversion Settings [page 201]
9.1 To save an analysis view
Prerequisites
You have to be connected to a business intelligence platform server.
Procedure
1. In the worksheet, select the crosstab component that you want to save as an analysis view.
192 P U B L I CAnalysis Plug-in User Guide
Using Analysis in other SAP BusinessObjects Applications

2. Choose Save View.
NoteIf you are not connected to a BI platform server, the Save Query View dialog box appears to save a query view in the BW system.
3. Select the location to save your analysis view to.4. Type a filename for the analysis view and press Save.
Results
The analysis view is saved to the repository.
9.2 To insert an analysis view
Procedure
1. In your worksheet, select the cell where you want to insert the analysis view.
2. Choose Insert Data Source Insert Analysis View .If you are not already connected to a business intelligence platform server, connect to the server where the analysis view you want to open is saved.
NoteIf you want to insert analysis views created with a 1.x Analysis version and containing SAP HANA data sources, you can use the Analysis View Migration dialog on the Conversion tab in the settings dialog to migrate them to 2.x analysis views.
3. In the folder list, select an analysis view and press OK.
Results
The selected analysis view is added to the worksheet. You can change the displayed data set and create new views on the data as required.
Related Information
Conversion Settings [page 201]
Analysis Plug-in User GuideUsing Analysis in other SAP BusinessObjects Applications P U B L I C 193

9.3 To export a data source to the SAP BusinessObjects Design Studio
Prerequisites
To export a data source and use it in the SAP BusinessObjects Design Studio, the following prerequisites have to be fulfilled:
● Make sure that you have installed SAP BusinessObjects Analysis, edition for Microsoft Office and SAP BusinessObjects Design Studio on your machine.
● Make sure that you use both tools in either local mode or with a BI platform. Otherwise you can not insert an exported data source.
Context
The Design Studio enables application designers to create analysis applications and dashboards for browsers and mobile devices on top of BW and SAP HANA data sources. In the edition for Microsoft Office, you can use analysis methods that are not available in the design studio. For example, you can define calculations, conditional formatting and filters to change a data source. With exporting a changed data source to the design studio, you can use these changes in the data source also for the application design.
Procedure
1. To export a data source to the design studio , select the crosstab of the corresponding data source.2. Choose Smart Copy in the context menu.3. Insert the data source in the Design Studio.
For more information, see the Application Designer Guide for the SAP BusinessObjects Design Studio on the SAP Help Portal: http://help.sap.com/boad
194 P U B L I CAnalysis Plug-in User Guide
Using Analysis in other SAP BusinessObjects Applications

10 Scheduling
Using BI Launch Pad and the Central Management Console (CMC), you can schedule Analysis workbooks to automatically run at specified times. The flexible time-based scheduling system allows you to process large reports during off hours and to avoid unnecessary database hits.
You can schedule workbooks with SAP BW and SAP HANA data sources. In order to use HANA data sources, you must create the connection from the BI platform to the SAP HANA platform as an HTTP connection.
When a scheduled object runs successfully, an instance is created. An instance is a version of the object that contains data from the time the object ran.
With scheduling, you can precalculate and distribute Analysis workbooks stored on the BI platform repository. To open a distributed workbook, Analysis does not have to be installed. This allows you to make the workbooks available to a wide spectrum of users.
To schedule an Analysis workbook, the connection to BI platform and BW / HANA system must be configured as an SSO and the user needs Schedule rights for Analysis workbooks.
NoteTo enable scheduling, the Analysis BI platform Add-On must be installed. For more information, contact your IT Administrator.
In the BI Launch Pad, you have the following options to schedule an Analysis workbook:
● Scheduling an object.● Labeling a scheduled instance to name the instance.● Specifying the recurrence pattern for the object to be run, for example weekly.● Selecting a destination, for example BI Inbox or Email.● Selecting a scheduling server group for the object.● Scheduling an object with parameters (prompts).
You can enter the data source, the technical name of the variable and the input string as value. The data source is not necessary if the variables are merged in a workbook. For more information on the syntax, see the section Syntax for Entering Values in this guide.
In the Central Management Console, you have the following additional options to manage and monitor an instance:
● In the Inbox, you can manage and delete instances.● In the Instance Manager, you can filter for Analysis workbook instances and check their status.● For instances with status Failed, you can check the error description.
For more information about scheduling, see the BI Launch Pad User Guide on SAP Help Portal at http://help.sap.com/bobip and the SAP BusinessObjects BI platform CMC Online Help.
Analysis Plug-in User GuideScheduling P U B L I C 195

Related Information
Syntax for Entering Values [page 111]
10.1 Precalculation Restrictions
There are precalculation restrictions for the following workbook settings and elements:
● The setting Refresh Workbook on Opening is ignored.● The setting Force Prompt for Initial Refresh is ignored.● If the workbook is in protected mode, it is not precalculated.● SAP formulas concatenating other SAP formulas are not precalculated.● Microsoft Excel formulas are not precalculated.● VBA macros are not executed during precalculation.● Icons are ignored, for example arrows in conditional formats.● Comments are ignored.
196 P U B L I CAnalysis Plug-in User Guide
Scheduling

11 Settings
In Analysis, edition for Microsoft Excel, you can change user settings according to your personal preferences. The User Settings dialog box is divided into the following tab pages, each providing different settings:
● User Settings● Advanced Settings● Platform Settings● Conversion Settings● Support Settings
To open the settings dialog, select File Analysis Settings in the ribbon tab.
Related Information
User Settings [page 197]Advanced Settings [page 198]Platform Settings [page 199]Conversion Settings [page 201]Support Settings [page 202]
11.1 User Settings
On the User Settings tab, you can define the following settings.
In Analysis for Microsoft PowerPoint, additional settings are available in the Presentation Settings dialog.
Recently Used List
When you choose Insert in the menu to insert a new data source into the workbook, you get a list of recently used data sources for quick selection. To define the number of listed data sources, enter the required number in the Maximum Number of Entries in Recent List field.
If you choose Delete Recently Used List, the history of recently used data sources is deleted.
Analysis Plug-in User GuideSettings P U B L I C 197

Number of Members Displayed in Filter Dialog
Here, you can enter the maximum number of members displayed in the Filter by Member dialog for selection. To define the number of members displayed, enter the required number in the Maximum Number of Members Displayed in Filter Dialog field. If you filter on a dimension that contains more members than defined in the user settings, you see only the currently selected members, but you can search for all members.
NoteYou can also define settings at workbook level. These workbook properties are part of the Component tab in the design panel.
Default Workbook Location
You can set the location of your default workbook. The default workbook is used when you open a data source by choosing Open Data Source . The data source is opened with the styles, formatting, and the workbook settings of the default workbook.
Related Information
The Components tab [page 118]To insert a data source into a default workbook [page 24]Presentation settings [page 189]
11.2 Advanced Settings
On the Advanced Settings tab, you can define the following settings.
Ribbon
In this section, you define the following settings for the ribbon:
● Show Planning GroupSelect this checkbox if you want the planning group to be displayed in the ribbon.
● Show 'Convert To Formula' in Tools GroupSelect this checkbox if you want the 'Convert To Formula' icon to be displayed in the ribbon tools group.
● Show 'Create Web Application' in Tools GroupSelect this checkbox if you want the 'Create Web Application' icon to be displayed in the ribbon tools group.
198 P U B L I CAnalysis Plug-in User Guide
Settings

The setting is selectable only if a SAP BusinessObjects Design Studio with minimum release 1.1 is installed.● Show 'Launch Query Designer' in Tools Group
Select this checkbox if you want the 'Call Query Designer' icon to be displayed in the ribbon tools group.This setting is available only if a BEx Query Designer with minimum release 7.20 SP10 or 7.30 SP3 is installed.
Enhance Currency Conversion by Query Definition
Select this checkbox if you want the Use Currency Translation from Query Definition checkbox to be available in the currency translation dialog for measures.
Show All Time-Dependent Hierarchies in Analysis Tab
Select this checkbox if all time-dependent hierarchies for a dimension should be available in the design panel. If this setting is not selected, only the hierarchy for a selected period is available in the design panel.
Show Access Mode for Member Display
Select this checkbox to enable the access mode for the member display definition in the crosstab and for the 'Filter by Member' dialog. If this setting is not selected, the access mode option is not displayed in the menu.
Allow Client and Language Selection for SSO Logon
Select this checkbox if the Logon dialog box should be displayed when using SSO with BW systems (locally or on the SAP NetWeaver platform). In this logon dialog box, you can change the client and the logon language.
Force Logon Dialog for SSO Logon on BIP
Select this checkbox if the Logon dialog box should be displayed when using SSO with the BI platform.
The last used BI platform is selected as default. In this logon dialog box, you can select one of the available BI platforms.
11.3 Platform Settings
On the Platform Settings tab, you can define the following settings.
Analysis Plug-in User GuideSettings P U B L I C 199

Preferred Platform
You can select the following settings:
● SelectableThis selection enables all platforms. You can save workbooks to all platforms and open workbooks from there.
● Business Intelligence PlatformThis selection enables the SAP BusinessObjects Business Intelligence Platform. You can save workbooks to this platform and open workbooks from this platform only.If you use SAP BusinessObjects Business Intelligence platform 4.0, the workbook is saved as a Microsoft Excel object.If you use SAP BusinessObjects Business Intelligence platform 4.1, the workbook is saved as an Analysis Workbook object.
● NetWeaverThis selection enables the SAP NetWeaver platform. You can save workbooks to this platform and open workbooks from this platform only.
Caching of Documents
Caching allows you to store copies of frequently used documents, Analysis workbooks and presentations, on a local client machine for quick access. In Analysis, caching can be used for documents that are stored on a SAP NetWeaver server. The documents will be cached for each server (BW system) independently.
To enable caching, the setting Enable Document Caching must be selected. After the installation, the setting is selected by default.
The default location for cached documents is the directory sapaocache which is located beneath the users Temp directory. You can change the Cache Location here.
To delete the cached documents, press Clear Cache.
You can also enable the setting and change the folder path with the file system settings IsCachingDocuments and DocumentCacheFolderPath in the Ao_app.config file. For more information, contact your IT administrator.
Replace System
With this setting, you can replace one or multiple systems in a workbook. The System Replacement... button to open the dialog is enabled if a workbook with a data source is opened but not connected to any of the systems.
For BW and HANA systems, you can replace local connections and connections from the BI platform. If a workbook contains BW and HANA connections, you will find two tabs in the dialog: BW and HANA.
In the dialog, select the system that should be replaced (Current System) and the system that should replace the former system (Replace By System).
To list the BIP connections in the Replace By System section, select the Logon to BIP icon and log on to the BI platform.
You can also open the dialog for replacing systems with the context menu on workbook level in the design panel.
200 P U B L I CAnalysis Plug-in User Guide
Settings

11.4 Conversion Settings
On the Conversion Settings tab, you can define the following settings.
BEx Workbook Conversion Settings
You can convert workbooks created with SAP BEx Analyzer 3.5 and SAP BEx Analyzer 7.0 to an Analysis workbook. You can specify which BEx objects should be converted and you can also specify whether a conversion log should be created.
Setting: Conversion Settings
You can select the following settings:
● Convert AllAll objects in the workbook are converted.
● Convert Data Sources and CrosstabsData sources and crosstabs are converted.
● Convert Data Sources OnlyOnly the data sources are converted.
Setting: Refresh Workbook
You can select the following settings:
● AlwaysThe workbook is always refreshed after conversion.
● NeverThe workbook is not refreshed after conversion.
● Use Workbook SettingsThe workbook is refreshed after conversion if the corresponding property is active in BEx Analyzer.
Setting: Conversion Log
You can select the following settings:
● DisabledNo conversion log is created.
● Create on New Visible WorksheetA log is created and displayed on a new worksheet.
● Create on New Hidden WorksheetA log is created and stored on a hidden sheet in the workbook.
Setting: Show Save Dialog After Conversion
If you select this setting, the Save dialog is displayed after conversion.
Analysis Plug-in User GuideSettings P U B L I C 201

Analysis View Migration
You can use the Analysis View Migration dialog to migrate analysis views (which were created with Analysis version 1.x and which contain SAP HANA data sources) to 2.x analysis views.
SAP HANA ODBC connections that were used in previous Analysis releases (1.x) are no longer supported. Therefore, you cannot open an analysis view created with a 1.x version in Analysis 2.x. For Analysis 2.x versions, HTTP connections are used for SAP HANA data sources. With Analysis 2.3 and higher, you can migrate the analysis views.
After creating a SAP HANA HTTP connection, you can open the Analysis View Migration dialog and migrate the analysis views:
1. Log on to the BI platform.2. Select a HANA ODBC connection.3. Select a HANA HTTP connection.4. Select the analysis view to be migrated.
You can migrate one analysis view per migration.5. Press Migrate.
You can select another analysis view and start the migration again, or press Close to close the dialog.
The migrated analysis views can now be opened in Analysis.
NoteMigrated Analysis Views can no longer be used in Analysis 1.4. Furthermore, they cannot be used with other clients that use JDBC-based OLAP connections, such as Design Studio and Analysis, edition for OLAP.
11.5 Support Settings
Log Severity
This setting defines the amount of log and trace information that is stored. The information is stored as .glf files under C:\Users\<user>\AppData\Local\Temp\Sap\Cof.
● Error: The system stores exceptions and error messages. This is the default setting after installation.● Support: The system stores exceptions, error messages and traces.● Customized: The system stores messages and traces that are defined in the log.config file under C:\Users
\<user>\AppData\Roaming\SAP\Cof. For more information, contact your system administrator.
Enable BW Server Tracing
To activate the SAP NetWeaver BW trace tool environment, select the Enable BW Server Tracing check box.
You can also activate the BW server tracing with the file system setting AbapTrace in the Ao_app.config file.
202 P U B L I CAnalysis Plug-in User Guide
Settings

The trace tool environment (transaction code RSTT in the connected BW system) has special tools to log and play back traces and process automatic regression tests.
For more information about the trace tool environment, see SAP Help Portal at http://help.sap.com SAP NetWeaver SAP NetWeaver by Key Capability Information Integration by Key Capability Business Intelligence BI Platform OLAP Performance Optimization BEx Monitor Trace Tool Environment .
Enable Workbook Profiling
To activate the SAP NetWeaver BW query runtime statistics, select the Enable Profiling check box.
You can also activate the workbook profiling with the file system setting Profiling in the Ao_app.config file.
Using the query runtime statistics, you can find out how much time it takes to execute certain user actions in Analysis and the BW analytic engine. The system records the performance-critical parts of the processing (statistics events). It calculates the net times by calculating the runtime of an event using the difference between the start and end times (minus the times for other events called from within the event).
You can check the statistics in theAnalysis ribbon Actions group under Messages Show Workbook Profiling Statistics... . The Messages entry is enabled only if statistics are available.
For more information about the query runtime statistics, see section Query runtime statistics in the Analysis Administrator guide.
Enable Client Profiling
To activate the Analysis client profiling, select the Enable Profiling check box.
You can also activate the client profiling with the file system setting clientProfiling in the Ao_app.config file.
If the setting is activated, Analysis will capture every interaction.
You can check the statistics in the Analysis ribbon Actions group under Messages Show Client Profiling Statistics... . The Messages entry is enabled only if statistics are available.
In the Client Profiling Statistics dialog, the captured interactions are displayed as steps in a tree view and you can navigate to each interaction. You can see the overall processing time per step (in ms), the time the user spent in dialogs, the number of RFC calls per step and the time that was spent for RFC. In section Update UI, you can see if a navigation step has caused (unexpected) RFC calls.
At the bottom of the Client Profiling Statistics dialog, you find a summary containing the time that was used on client side for processing (in ms), the number of RFC calls (count) and the time that was used for that (in ms) and the time the user spent in dialogs (in ms).
Analysis Plug-in User GuideSettings P U B L I C 203

Display Technical Names
To activate the technical names of the dimensions in your Analysis workbook, select the Display Technical Names check box. The dimensions are displayed with technical name and text.
Enable NCO Tracing
This setting may be used for SAP error handling.
Analysis uses the .Net connector (NCO) for calling ABAP RFCs from client. NCO supports logging of RFC traces. You can activate the tracing by selecting Enable NCO Tracing and choosing the desired level (usually 4).
If you now work with Analysis, log files will be created in the %temp% folder of windows. There you can find a dev_nco_rfc.log file and a number of files "nco_rfc_XXXX_Y.trc". Additionally, there are the Analysis log files of type .glf, for example AO_Log_<processID>.glf.. You can zip all of them to attach them to the message.
Show Suppressed Messages
Select this check box you want the suppressed messages to be shown.
204 P U B L I CAnalysis Plug-in User Guide
Settings

12 Troubleshooting
12.1 To enable the Analysis Add-In after system crash (Microsoft Office 2010 and higher)
Context
If Microsoft Excel or Microsoft PowerPoint crashes, and you have to close the application, the Analysis Add-In might be disabled by the Microsoft application. If this happens, you have to re-enable the Analysis Add-In in Microsoft Excel or Microsoft PowerPoint.
Procedure
1. Open Analysis for Microsoft Excel or Microsoft PowerPoint.After the system crash the Analysis Add-In is not visible in the menu.
2. Choose File in Microsoft Excel or Microsoft PowerPoint.3. In Microsoft Excel, press Excel Options. In Microsoft PowerPoint, press PowerPoint Options.4. In the Excel Options dialog box and in the PowerPoint Options dialog box in the categories pane, select Add-
Ins.5. In the Manage box, select Disabled Items.6. Press Go....7. In the Disabled Items dialog box, select the Analysis Add-In.8. Press Enable.9. In the Manage box, select COM Add-Ins.10. Press Go....11. In the COM Add-Ins dialog box, make sure that Analysis option is activated.12. Press OK.
Results
The Analysis ribbon is available again.
Analysis Plug-in User GuideTroubleshooting P U B L I C 205

Important Disclaimers and Legal Information
Coding SamplesAny software coding and/or code lines / strings ("Code") included in this documentation are only examples and are not intended to be used in a productive system environment. The Code is only intended to better explain and visualize the syntax and phrasing rules of certain coding. SAP does not warrant the correctness and completeness of the Code given herein, and SAP shall not be liable for errors or damages caused by the usage of the Code, unless damages were caused by SAP intentionally or by SAP's gross negligence.
AccessibilityThe information contained in the SAP documentation represents SAP's current view of accessibility criteria as of the date of publication; it is in no way intended to be a binding guideline on how to ensure accessibility of software products. SAP in particular disclaims any liability in relation to this document. This disclaimer, however, does not apply in cases of willful misconduct or gross negligence of SAP. Furthermore, this document does not result in any direct or indirect contractual obligations of SAP.
Gender-Neutral LanguageAs far as possible, SAP documentation is gender neutral. Depending on the context, the reader is addressed directly with "you", or a gender-neutral noun (such as "sales person" or "working days") is used. If when referring to members of both sexes, however, the third-person singular cannot be avoided or a gender-neutral noun does not exist, SAP reserves the right to use the masculine form of the noun and pronoun. This is to ensure that the documentation remains comprehensible.
Internet HyperlinksThe SAP documentation may contain hyperlinks to the Internet. These hyperlinks are intended to serve as a hint about where to find related information. SAP does not warrant the availability and correctness of this related information or the ability of this information to serve a particular purpose. SAP shall not be liable for any damages caused by the use of related information unless damages have been caused by SAP's gross negligence or willful misconduct. All links are categorized for transparency (see: http://help.sap.com/disclaimer).
206 P U B L I CAnalysis Plug-in User Guide
Important Disclaimers and Legal Information

Analysis Plug-in User GuideImportant Disclaimers and Legal Information P U B L I C 207

go.sap.com/registration/contact.html
© 2017 SAP SE or an SAP affiliate company. All rights reserved.No part of this publication may be reproduced or transmitted in any form or for any purpose without the express permission of SAP SE or an SAP affiliate company. The information contained herein may be changed without prior notice.Some software products marketed by SAP SE and its distributors contain proprietary software components of other software vendors. National product specifications may vary.These materials are provided by SAP SE or an SAP affiliate company for informational purposes only, without representation or warranty of any kind, and SAP or its affiliated companies shall not be liable for errors or omissions with respect to the materials. The only warranties for SAP or SAP affiliate company products and services are those that are set forth in the express warranty statements accompanying such products and services, if any. Nothing herein should be construed as constituting an additional warranty.SAP and other SAP products and services mentioned herein as well as their respective logos are trademarks or registered trademarks of SAP SE (or an SAP affiliate company) in Germany and other countries. All other product and service names mentioned are the trademarks of their respective companies.Please see http://www.sap.com/corporate-en/legal/copyright/index.epx for additional trademark information and notices.