analysis of within-subject variation of caffeine...
TRANSCRIPT
Vol. 4, 139-146, March 1995 Cancer Epidemiology, Biomarkers & Prevention 139
Analysis of Within-Subject Variation of Caffeine MetabolismWhen Used to Determine Cytochrome P4501A2 and
N-Acetyltransferase-2 Activities1
Scott H. McQuilkin, David W. Nierenberg,2 andEdward BresnickDepartments of Pharmacology and Toxicology IS. H. M., D. W. N., E. B.l
and Medicine ID. W. N.], and The Norris Cotton Cancer Center,Dartmouth-Hitchcock Medical Center [S. H. M., D. W. N., E. B.], HinmanBox 7506, Lebanon, New Hampshire 03756
Abstrad
Cytochrome P4501 A2 (CYP1 A2) and N-acetyltransferase-2 (NAT2) are hepatic enzymes thatmay adivate some procarcinogens. Previous reportshave determined CYP1 A2 and NAT2 phenotypes byquantitating relative amounts of urinary caffeine andmetabolites. However, a number of experimental issueswith this approach remain. To address these, wemeasured caffeine and 4 metabolites in urine samplesfrom 20 healthy volunteers on 3 separate occasions at7-day intervals. Two additional volunteers were studiedto measure the pattern of excretion of these analytes inurine over time. The molar ratio of two compounds(1 ,7-dimethylxanthine/1 ,3,7-trimethylxanthine) was usedto phenotype CYP1 A2, while the molar ratio of twoother compounds (5-acetylamino-6-formylamino-3-methyluracil/1 -methylxanthine) served to phenotypeNAT2. Within-subjed variation was less than 25% formost participants. In instances when within-subjedvariation of the metabolic ratio was >25%, metabolitepeaks were usually present in one or more control urinesamples. Some caffeine metabolites were observed inurine samples at detedable levels up to 48 h aftercaffeine ingestion. We conclude that: (a) this assay fordetermining CYP1 A2 and NAT2 adivities (phenotyping)has an acceptably low within-subjed variation over 3consecutive weeks for most subjeds who were caffeine-free for 36 h prior to study; (b) colleding and analyzingurine samples prior to testing can indicate if subjects areexcreting caffeine metabolites and will aid in locatingmetabolite peaks on chromatograms; (c) refraining fromcaffeine for 48 h before testing is the best compromisebetween convenience for the subjed and obtainingreproducible results; (d) determining metabolite molarratios in urine colleded 4-5 h after ingesting caffeineprovides an acceptable time for the measurement; and
(e) different ratios of metabolites for determiningCYP1 A2 phenotype have different advantages.
Introdudion
CYP1A23 and NAT2 are hepatic enzymes that have beenimplicated in the biotransformation ofsome procarcinogensinto carcinogens. Individuals who are extensive metaboliz-ens of substrates of CYP1 A2 (e.g., oxidative demethylationof caffeine) on of substrates of NAT2 (e.g., N-adetylationduring caffeine metabolism) are suspected of having in-creased risk for development of some types of urinary blad-den and coborectal cancers. This increased risk may be dueto increased activation of anylammnes present in cigarette
smoke, coal- and shale-derived oils, and agricultural chem-icals, or to increased activation of hetenocyclic aminespresent in some cooked foods (1-7). Conversely, poor me-tabolizers of NAT2 may be at risk ofdeveloping some typesof urinary bladder cancer(s) if they are slow to inactivatedietary carcinogens (3, 4). Several research groups have
described an assay in which the metabolism of the probe-drug caffeine by CYP1A2 and NAT2 is measured by HPLCto quantitate urinary caffeine and caffeine metabolites.Measured molar quantities of these analytes are then usedto generate molar ratios (metabolic ratios) which can beused to classify human phenotypes for CYP1A2 and NAT2(2, 7-1 0). Caffeine is a convenient substrate for phenotyp-ing because it is metabolized in the liven primarily byCYP1A2 and NAT2, and it is widely used, relatively safe,and inexpensive (2, 4, 8, 1 1).
However, when we reviewed previous work in thisfield, we found that several issues remained unsettled onincompletely defined: (a) an optimal combination of solid
and mobile phases for the best separation and quantitationof peaks of interest was not evident. Some previous papersdid not include actual chromatograms or indicate detectorsensitivity (1-3, 11, 12), while others included chromato-grams but did not completely describe chromatognaphicconditions such as detector sensitivity (4, 7-9), thus makingit difficult to compare new results with data obtainedby other groups; (b) no within-subject variation in pheno-typing results was presented in some publications(1-3, 6, 8, 11, 12), while in others, preliminary on variableestimates were reported (4, 7, 9, 10); (c) detailed descnip-tions of the patterns of excretion of caffeine and its metab-olites over time were not provided (1-4, 6, 7, 9-1 1) or
Received 7/1 2/94; revised 1 1/21/94; accepted 1 1/22/94.1 Supported by a National Dairy Council grant and a Cancer Center CoreGrant CA 23108.2 To whom requests for reprints should be addressed, at Dartmouth-
Hitchcock Medical Center, One Medical Center Drive, Hinman Box7506, 630E Borwell Research, Lebanon, NH 03756.
3 The abbreviations used are: CYP1A2, cytochrome P4501 A2; NAT2, N-acetyl-
transferase-2; NAPAP, N-acetyl-p-aminophenol; AFMU, 5-acetylamino-6-formylamino-3-methyluracil; 1 37x, 1 ,3,7-trimethylxanthine; 1 7X, 1 ,7-dimeth-
ylxanthine; 1 7U, 1 ,7-dimethyluric acid; 1 x, 1 -methylxanthine; CV, coefficient
of variation.
on June 16, 2018. © 1995 American Association for Cancer Research. cebp.aacrjournals.org Downloaded from
140 Within-Subjed Variation in Caffeine Metabolism
were presented in preliminary fashion (8, 1 2). This back of
experimental data made it difficult to formalize a procedurethat could be readily reproduced from one laboratory toanother. For example, some groups reported the monitoringof subjects in clinical research centers where they were keptcaffeine-free for up to 72 h prior to study, while in otherprotocols, participants were studied as outpatients who ne-framed from caffeine for just 1 2 h prior to study (4, 7-1 1);and (ci) in previous studies different molar ratios for pheno-typing CYP1 A2 activity [e.g., 1 7X/1 37X, (1 7U + 1 7X)/1 37X](2, 4, 7, 10, 1 2) were used and it was not clear which ratiomight be technically most feasible, and which would resultin the lowest within-subject variation.
These four issues were addressed in the followingways: (a) several different combinations of columns andmobile phases/grad ients were tested u ntib near-baselineseparation of analyte peaks of interest was achieved. Wehave included actual chromatograms and detailed chro-matographic conditions to allow comparison of our resultsto those obtained in other laboratories; (b) 20 healthy vol-unteers (1 0 women and 1 0 men) were studied once a weekfor 3 consecutive weeks to determine within-subject vania-tion of CYP1A2 and NAT2 phenotypes (for this portion ofthe study we assumed that all subjects should be caffeinefree for 36 h, and that an optimal interval for urine collec-tion was 3-5 h after the dose of caffeine); (c) the pattern ofexcretion of caffeine and its metabolites was studied over48 h in 2 healthy male volunteers to address the issues ofoptimal washout period and optimal time for collection ofurine samples; and (ci) we determined the phenotype ofCYP1 A2 in 9 of the women using both 1 7X/1 37X and (1 7U+ 1 7X)/1 37X as molar ratios and compared the results. Byaddressing these four issues, we provide additional data thatmay help other groups implement this technique in a ne-producible manner.
Materials and Methods
Protocol for Determining Within-Subjed Variation. Afterreceiving permission from our Committee for the Protectionof Human Subjects, 20 healthy volunteers (1 0 women and10 men; 22-61-years-old) who worked in various capaci-ties within the medical center were recruited for this study.All participants were Caucasian nonsmokers, with no priorhistories of caffeine sensitivity, kidney problems, on liverdisease. The current medications of each subject were re-corded, but we did not track current diets and intercurrentillnesses.
Each volunteer refrained from consuming caffeine-containing foods and beverages for 36 h before each studymorning (3 mornings, 1 week apart). Volunteers were alsoinstructed not to ingest acetaminophen on the night beforeon during each study day because this compound was usedas the internal standard. Following an overnight fast ofapproximately 1 0 h, each subject discarded hen on his first-morning urine and drank a glass of water at home. Onarrival at the study site at 8:00 a.m., each subject urinatedagain and a urine sample was collected at midstream, ofwhich 9 ml was saved (referred to as the T0 urine). From8:05 to 8:30 am., participants consumed 1 large (16-ounce) cup of brewed coffee (containing approximately200 mg 1 37X) and 1 on 2 donuts (purchased from Dunkin’Donuts) and then resumed their daily schedules. (While theamount of caffeine in brewed coffee may vary more than ina measured amount of instant coffee, on in a caffeine pill of
known dosage, we felt that subject recruitment and com-pliance would be increased by using the former. Also,
because we are dealing with molar ratios we felt that smallvariations in caffeine dosage would not alter phenotypeclassifications.) Subjects were allowed to urinate at willuntil 1 1 :00 am., at which time they voided, with no urine
being saved. Subjects did not urinate again until arrivingback at the study site at 1 :00 p.m. when they providedanother urine sample, of which 9 ml was saved (referred toas the T3_5 urine). Aside from the morning donut(s), nofoods on beverages were allowed until after the T3_5 urinewas collected, with water intake being encouragedthroughout the day.
Protocol for Studying Caffeine and Metabolite Excretion.Urinary excretion of caffeine and four caffeine metabolitesoven a 48-h period was studied in two healthy, nonsmoking,Caucasian males, 23 and 42 years old (men A and B), whoexhibited different CYP1A2 and NAT2 phenotypes. Afterrefraining from caffeine for 48 h prior to the study morning,
and following an overnight fast of approximately 1 0 h, eachsubject discarded his first morning urine and drank oneglass ofwaten at home. After arriving atthe study site at 8:00a.m., the total second morning urine was collected and thevolume was recorded. A 9-mb aliquot of the total urinesample was saved, and the remaining urine was discarded.After consumption of coffee and one on two donuts, thevolunteers urinated and samples were obtained at hourlyintervals for 8 hours. Drinking water every hour was en-couraged, and foods and beverages not Containing caffeinewere allowed after 1 :00 p.m. Twenty-three and 47 h afteringesting caffeine, the two subjects voided and discardedtheir urine. At 24 and 48 h after caffeine consumption, thesubjects urinated and the total volumes were measured, andan abiquot of each urine sample was saved.
Chemicals. 1 ,3,7-Tnimethylxanthine (caffeine), 1 ,7-dim-ethylxanthine, 1,7-dimethylunic acid, 1-methylxanthine,and NAPAP (internal standard) were purchased from SigmaChemical Co. (St. Louis, MO); ammonium sulfate, hydro-chbonic and acetic acids, and isopropyl alcohol were pun-chased from Fisher Scientific (Fain Lawn, NJ); chloroformwas purchased from Baxter Diagnostics, Inc. (McGaw Park,IL); AFMU was a gift received from Drs. John Richie andWayne Kleinman (Division of Nutritional Carcinogenesis,American Health Foundation, Valhalla, NY).
Urine Processing and Extradion. Urine samples were pro-cessed and extracted using a protocol modified from Butleret a!. (4) and Grant et a!. (8). Immediately following collec-tion, 9-mb urine samples were transferred to 1 0-mI polypro-pylene tubes (Baxter Diagnostics, Inc.) and the pH of theunines was lowered to 3.5 with approximately 75-1 50 p1 of6N HCI. Samples were then stoned at -70#{176}Cuntil lateranalysis.
Prior to extraction, a frozen urine sample was thawedat room temperature in low light, vortexed, and then cen-tnifuged for 5 mm at 2500 rpm. The supernatant was trans-fenred to a clean 10-mb tube, and a 200-pl sample wasadded to another 10-mb tube which contained approxi-mately 1 20 mg ammonium sulfate. After replacing the 9-mburine sample in the freezer, the 200-pl aliquot was vortexedfor 2 mm, and 50 p1 of internal standard solution [1 25 rig/mI(0.827 mM) NAPAP in 0.05% acetic acid] were added. Thesample was then vortexed briefly, followed by the additionof 6 ml of chloroform:isopropyb alcohol (1 9:1 ; v/v), vortex-ing for 1 mm, and centnifugation for 5 mm at 2500 rpm. A
on June 16, 2018. © 1995 American Association for Cancer Research. cebp.aacrjournals.org Downloaded from
Cancer Epidemiology, Biomarkers & Prevention 141
5.5-mb sample of the lower (organic) phase was removed,transferred to a clean 6-mb glass tube, and evaporated to
dryness under a gentle stream of nitrogen in a 40#{176}Cwaterbath. The dry extract was resuspended in 500 p1 of 0.05%acetic acid and stoned at room temperature in bow light,pending analysis.
HPLC. HPLC analysis was performed with a Waters model680 gradient controller driving two Waters Model 510 sob-vent delivery systems (Waters Chromatography Division,Miblipore Corp., Milfond, MA). Sample injections, usually
20 pI, were introduced via a Rheodyne Model 71 25 injectorequipped with a 1 OO-pl loop, which was connected to aBnownbee RP-1 8 guard column (5 i�m material; 4.6 mm x 3
cm) and a Microsorb RP-18 HPLC column (5 pm material;4.6 mm x 25 cm; all purchased from Rainin Instrument Co.,Woburn, MA). A Beckman Model 1 60 UV detector (Fuller-ton, CA) with a 280-nm filter and a sensitivity of 0.02
absonbance unit at full scale, and a Hewlett-Packard Model3390A recorder-integrator (Wilmington, DE), were used todetect analytes and plot/integratepeaks.
The mobile phase consisted of a linear gradient over 40
mm, with solvent A consisting of 0.05% acetic acid andsolvent B consisting of 100% methyl alcohol. The gradientprofile, which began with 90% A:10% B, was changed in alinear fashion to 50% A:50% B over 40 mm, with the flowrate remaining fixed at 1.0 mI/mm. Between nuns, initialconditions were maintained for 1 5 mm to neequilibrate theHPLC column.
Data Interpretation. The amount of each analyte (in pmol)
was calculated by using a method of external standards.
Standard curves (pmob injected versus peak area) for eachanalyte of interest were established each day by injecting
known volumes of a standard “sextet” solution of analytesof interest [1.39 pg/mI (6.15 pM) AFMU-0.87 pg/mb (5.24pM) 1 X-2.61 �ig/ml (1 7.3 �JM) NAPAP-1 .30 pg/mI (6.63 pM)
17U-1.58 pg/mI (8.77 pM) 17X-0.87 pg/mb (4.48 pM) 137Xin 0.05% acetic acid] onto the HPLC. A typical day con-
sisted of injecting 20 p1 of sextet, 20 p1 of each extractedurine sample, 20 p1 of NAPAP solution [12.5 pg/mI (82.7pM) in 0.05% acetic acid], and 50 p1 of sextet. To eliminatebetween-day variation, all six urine samples from eachsubject were analyzed on the same day.
The addition of the internal standard [50 p1 of 125pg/mb (0.827 mM) NAPAP in 0.05% acetic acid] to the200-pb urine aliquot prior to extraction served two pun-
poses. The internal standard was an accurate and neproduc-ible time reference point which assisted in the location of
caffeine and metabolite peaks and was also used to calcu-bate the percentage recovery of the entire extraction proce-dune. The theoretical 1 00% recovery of internal standardwas determined as follows: 6.25 pg NAPAP were added toeach 200-pl aliquot of urine following ammonium sulfatetreatment. After evaporation oven nitrogen, each samplewas resuspended in 500 p1 of 0.05% acetic acid, and 20 p1of the latterwas injected; thus, the total amount injectedrepresented (20 pl/500 pI) x 6.25 pg, on 0.25 pg (1 .65 nmol)
of NAPAP. Complete recovery of internal standard wasdefined as the peak area obtained when 0.25 pg (1 .65 nmol)
of NAPAP was injected on the chromatognaph [20 p1 of 1 2.5pg/mI (82.7 pM) NAPAP in 0.05% acetic acid].
Amounts of caffeine and caffeine metabolites (in pmol)were calculated using the sextet-derived standard curves,molar ratios were calculated using Microsoft Excel version
4.0 (Microsoft Corp.), and graphs were constructed usingCricket Graph version 1 .2 (Cricket Software, Malvern, PA).
Results
Optimization of Chromatographic Conditions and Show-ing Representative Chromatograms. The optimal length ofthe reversed-phase HPLC column to separate caffeine, itsmetabolites, and the internal standard were investigated. A25-cm column was superior to a 15-cm column from thesame manufacturer (Rainin) and was necessary to providenear-baseline separation of caffeine metabolites from otherUV-absonbing peaks in human urine. We also determinedthat metabolite separation is comparable when using manydifferent guard columns from the same manufacturer(Bnownlee). A number of different gradient profiles werealso tested for optimization of separation of these sub-stances. The final conditions were a linear gradient from90% 0.05% acetic acid:10% methyl alcohol (9:1) to 50%0.05% acetic acid:50% methyl alcohol (1 :1 ) oven 40 mm,with a flow rate of 1 .0 mI/mm. The total run time (includingwashout and column reequilibration) was approximately 50mm.
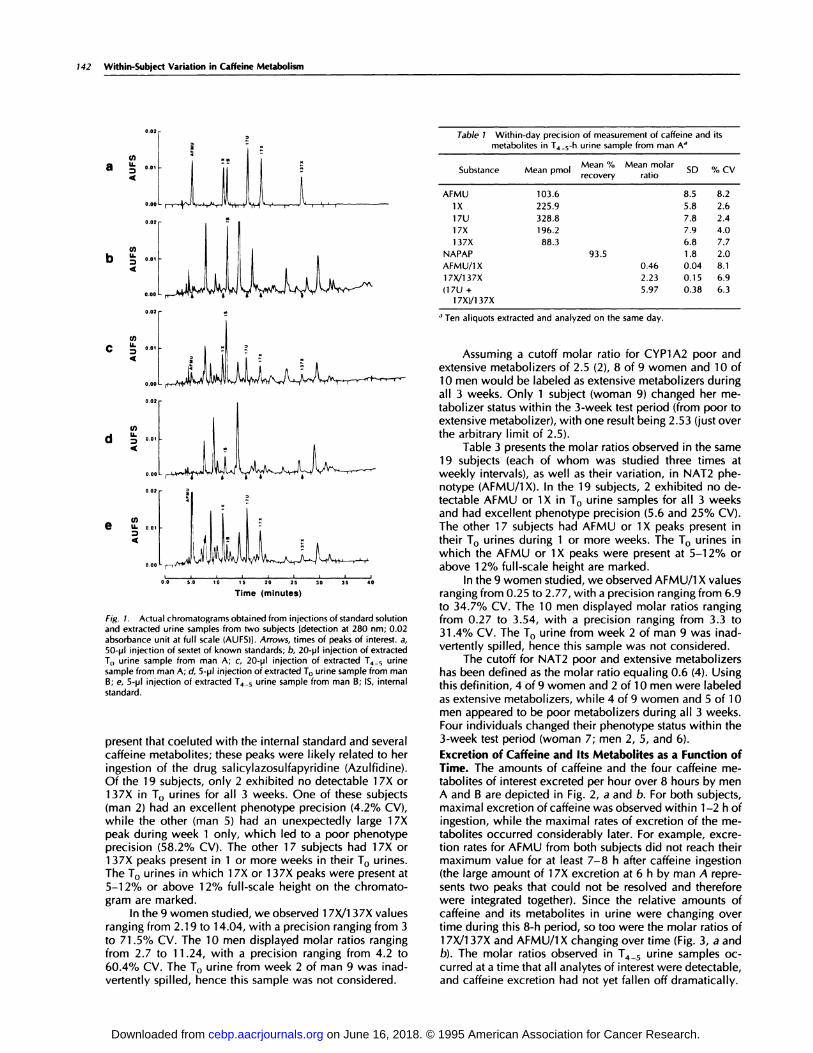
Fig. 1 a shows a typical chromatognaphic separation ofthe standard sextet of caffeine metabolites. The approxi-mate elution times for the analytes were: AFMU, 5.1 0 mm;1 X, 1 1 .4 mm; NAPAP, 1 2.0 mm; 1 7U, 1 6.0 mm; 1 7X, 18.6mm; and 1 37X, 26.5 mm. Standard curves of pmol injectedversus peak area units for each of the analytes had typical r�values above 0.998 (data not shown). Extraction efficiencyof the internal standard, measured in extracts from 1 1 5urine samples, was 86.9% (± 6.3%). As described previ-ously by Butler et a!. (4), some small endogenous peaks(<1 2% full-scale height of chromatognam) were periodicallyobserved coeluting with analytes of interest. Small differ-ences in elution times were also observed for some ana-bytes, but this could probably be accounted for by ambienttemperature fluctuations.
Chromatograms of T0 and T4_5 unines from one malesubject (man A) are indicated in Fig. 1 , b and c. Man Atended to excrete relatively small amounts of caffeine me-tabolites in the T4_5 urine sample. The data clearly show theseparation of caffeine and its metabolites and indicate thenature of background endogenous peaks found in urine. Todetermine the reproducibility of the extraction procedure(same day precision), the T4_5 urine sample from Fig. 1 cwas extracted a total of 1 0 times on the same day, and the1 0 extracts were analyzed on that same day. The percent-age CV for the analytes of interest ranged from 2.0-8.2%.The results are presented in Table 1.
The chromatograms of extracted T0 and T4_5 urinesamples from a second male subject (man B), who tended toexcrete large amounts of caffeine metabolites in the T4_5urine sample, are shown in Fig. 1 , d and e. Since thecaffeine/metabolite peaks were so large, they were kept onscale by reducing the volume injected to 5 p1 (from theusual 20 pI); this in turn made the endogenous peaks appearsmaller.
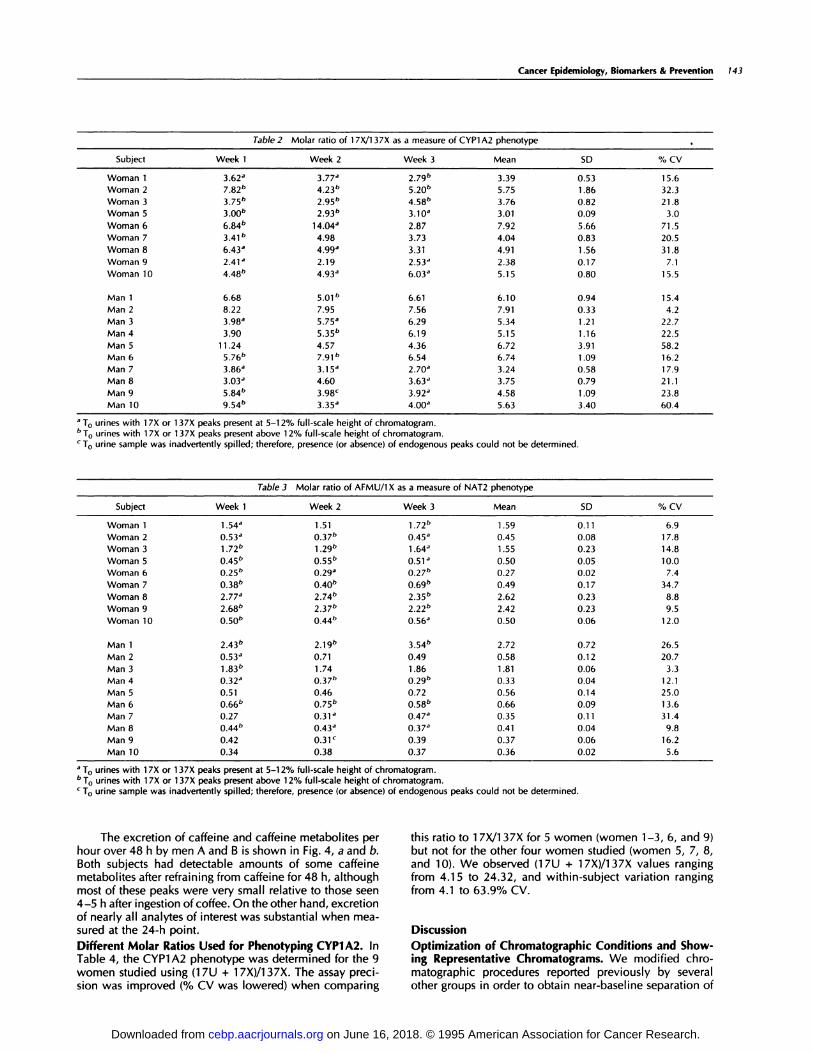
Metabolic Molar Ratios and Within-Subjed Variation inCYP1 A2 (Using 1 7X/1 37X) and NAT2 Phenotypes. Table 2
presents the molar ratios observed in 9 women and 10 men,each of whom was studied 3 times at weekly intervals, aswell as their variation in CYP1 A2 phenotype (using 1 7X/1 37X). Data from woman 4 could not be used for calcu bat-ing either molar ratio since large endogenous peaks were
on June 16, 2018. © 1995 American Association for Cancer Research. cebp.aacrjournals.org Downloaded from
142 Within-Subject Variation in Caffeine Metabolism
Cl)� IL.
0.02
b � �Cl)II.
‘, �4
d �
e �
Time (minutes)
Fig. 1. Actual chromatograms obtained from injections ofstandard solution
and extracted urine samples from two subjects Idetection at 280 nm; 0.02absorbance unit at full scale (AUFS)J. Arrows, times of peaks of interest. a,
SO-pI injection of sextet of known standards; b, 20-uI injection of extractedT0 urine sample from man A; c, 20-pl injection of extracted T4_5 urinesample from man A; d, S-pI injection of extracted T0 urine sample from manB; e, S-pI injection of extracted T4_5 urine sample from man B; IS, internalstandard.
present that coebuted with the internal standard and severalcaffeine metabolites; these peaks were likelyrebated to heningestion of the drug salicylazosulfapynidine (Azulfidine).Of the 1 9 subjects, only 2 exhibited no detectable 1 7X on1 37X in T0 unines for all 3 weeks. One of these subjects(man 2) had an excellent phenotype precision (4.2% CV),while the other (man 5) had an unexpectedly large 1 7Xpeak during week 1 only, which led to a poor phenotypeprecision (58.2% CV). The other 1 7 subjects had 1 7X or1 37X peaks present in 1 or more weeks in their T0 unines.The T0 unines in which 1 7X or 1 37X peaks were present at5-12% on above 12% full-scale height on the chromato-gram are marked.
In the 9 women studied, we observed 1 7X/1 37X valuesranging from 2.1 9 to 1 4.04, with a precision ranging from 3
to 71 .5% CV. The 1 0 men displayed molar ratios rangingfrom 2.7 to 1 1 .24, with a precision ranging from 4.2 to60.4% CV. The T0 urine from week 2 of man 9 was mad-vertently spilled, hence this sample was not considered.
Table 1 Within-day precision of measurement of caffeine and itsmetabolites in T45-h urine sample from man A’
Substance Mean pmolMean 0/
recovery
Mean molar.
ratioSD I,, CV
AFMU 103.6 8.5 8.2
lx 225.9 5.8 2.6
17U 328.8 7.8 2.4
17x 196.2 7.9 4.0
137X 88.3 6.8 7.7
NAPAP 93.5 1.8 2.0
AFMU/lx 0.46 0.04 8.1
17X/137X 2.23 0.15 6.9
(17U + 5.97 0.38 6.3
1 7x)/1 37X
a Ten aliquots extracted and analyzed on the same day.
Assuming a cutoff molar ratio for CYP1A2 poor andextensive metabolizers of 2.5 (2), 8 of 9 women and 10 of10 men would be labeled as extensive metabolizers during
all 3 weeks. Only 1 subject (woman 9) changed her me-tabolizer status within the 3-week test period (from poor toextensive metabolizer), with one result being 2.53 (just overthe arbitrary limitof 2.5).
Table 3 presents the molar ratios observed in the same1 9 subjects (each of whom was studied three times atweekly intervals), as well as their variation, in NAT2 phe-notype (AFMU/1 X). In the 1 9 subjects, 2 exhibited no de-tectable AFMU or lx in T0 urine samples for all 3 weeksand had excellent phenotype precision (5.6 and 25% CV).The other 1 7 subjects had AFMU or 1 X peaks present in
their T0 unines during 1 or more weeks. The T0 unines inwhich the AFMU or 1 X peaks were present at 5-i 2% orabove 12% full-scale height are marked.
In the 9 women studied, we observed AFMU/1 X valuesranging from 0.25 to 2.77, with a precision ranging from 6.9to 34.7% CV. The 10 men displayed molar ratios rangingfrom 0.27 to 3.54, with a precision ranging from 3.3 to31 .4% CV. The T0 urine from week 2 of man 9 was mad-vertently spilled, hence this sample was not considered.
The cutoff for NAT2 poor and extensive metabolizershas been defined as the molar ratio equaling 0.6 (4). Using
this definition, 4 of 9 women and 2 of 1 0 men were labeledas extensive metabolizens, while 4 of 9 women and 5 of 10men appeared to be poor metabolizers during all 3 weeks.Four individuals changed their phenotype status within the3-week test period (woman 7; men 2, 5, and 6).
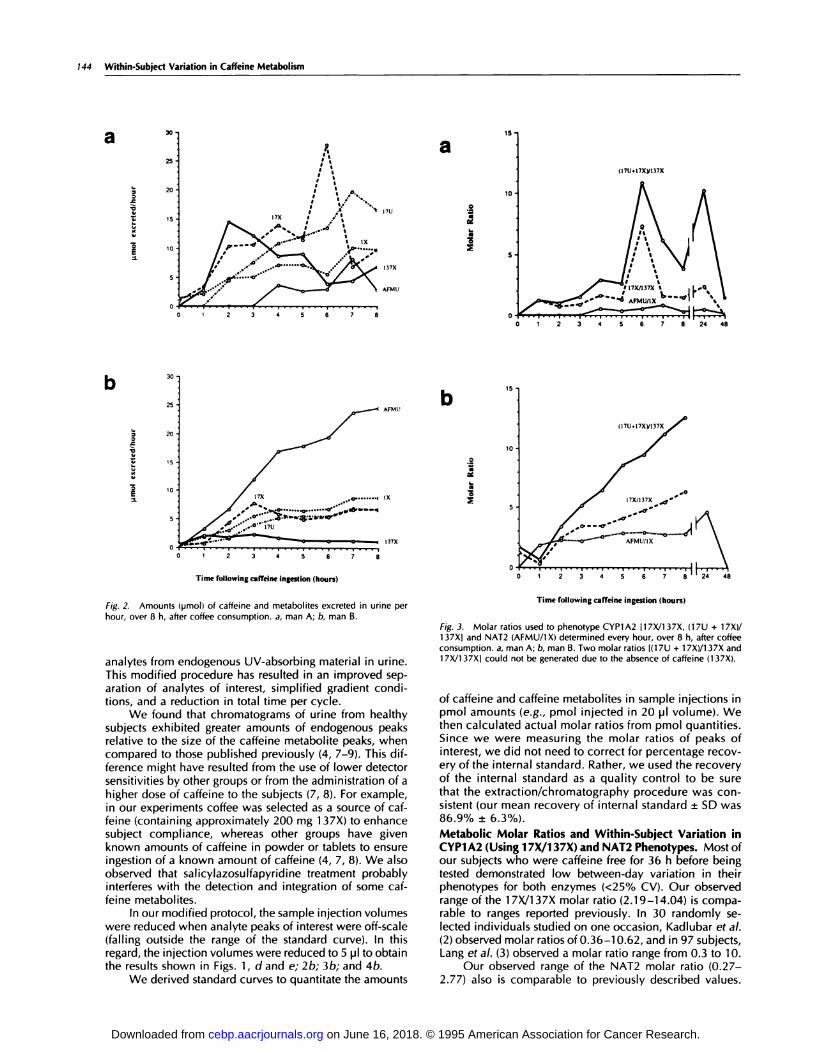
Excretion of Caffeine and Its Metabolites as a Fundion ofTime. The amounts of caffeine and the four caffeine me-tabolites of interest excreted pen hour over 8 hours by menA and B are depicted in Fig. 2, a and b. For both subjects,maximal excretion ofcaffeine was observed within 1-2 h ofingestion, while the maximal rates of excretion of the me-tabolites occurred considerably later. For example, excne-tion rates for AFMU from both subjects did not reach theirmaximum value for at least 7-8 h after caffeine ingestion(the large amount of 1 7X excretion at 6 h by man A repre-
sents two peaks that could not be resolved and thereforewere integrated together). Since the relative amounts ofcaffeine and its metabolites in urine were changing overtime during this 8-h period, so too were the molar ratios of1 7X/i 37X and AFMU/i X changing over time (Fig. 3, a andb). The molar ratios observed in T4_5 urine samples oc-curred at a time that all analytes of interest were detectable,and caffeine excretion had not yet fallen off dramatically.
on June 16, 2018. © 1995 American Association for Cancer Research. cebp.aacrjournals.org Downloaded from
Cancer Epidemiology, Biomarkers & Prevention 143
Table 2 Molar ratio of 1 7X/1 37X as a measure of CYP1 A2 phenotype .
Subject Week 1 Week 2 Week 3 Mean SD % CV
Woman 1 3.62a 377#{224} 279b 339 0.53 15.6
Woman 2 782b 423b 520b 575 1.86 32.3
Woman 3 375b 295b 458b 3.76 0.82 21.8
Woman 5 300b 293b 3.lOa 3.01 0.09 3.0
Woman 6 684b 14.04a 2.87 7.92 5.66 71.5
Woman 7 341b 4.98 3.73 4.04 0.83 20.5
Woman 8 6.43a 499a 3.31 4.91 1 .56 31.8
Woman 9 2.41a 2.19 2.53” 2.38 0.17 7.1
Woman 10 448b 493� 6.03” 5.15 0.80 15.5
Man 1 6.68 501b 6.61 6.10 0.94 15.4
Man 2 8.22 7.95 7.56 7.91 0.33 4.2
Man 3 3.98a 5.75�� 6.29 5.34 1.21 22.7
Man 4 3.90 535b 6.19 5.15 1.16 22.5
Man 5 11.24 4.57 4.36 6.72 3.91 58.2
Man 6 576b 791b 6.54 6.74 1.09 16.2
Man 7 3.8&’ 3.15” 2.70” 3.24 0.58 17.9
Man8 3.03’ 4.60 3.63�’ 3.75 0.79 21.1Man 9 5.84” 3.98’ 3.92’ 4.58 1 .09 23.8
Man 10 9.54�’ 335a 4.00” 5.63 3.40 60.4
a T0 urines with 1 7X or 1 37X peaks present at 5-1 2% full-scale height of chromatogram.b T0 urines with 1 7X or 1 37X peaks present above 1 2% full-scale height of chromatogram.C T0 urine sample was inadvertently spilled; therefore, presence (or absence) of endogenous peaks could not be determined.
Table 3 Molar ratio of AFMU/1 X as a measure of NAT2 phenotype
Subject Week 1 Week 2 Week 3 Mean SD % CV
Woman 1 1 .54” 1 .51 1 .72” 1 .59 0.1 1 6.9
Woman 2 0.53� 037b ��5a 0.45 0.08 1 7.8
Woman 3 172b 129b 1.64” 1.55 0.23 14.8
Woman 5 045b 055b 0.Sla 0.50 0.05 10.0
Woman 6 025b 0.29a 027b 0.27 0.02 7.4
Woman 7 038b 040b 069b 0.49 0.17 34.7
Woman 8 2.77a 274b 235b 2.62 0.23 8.8
Woman 9 268b 237b 2.22” 2.42 0.23 9.5
Woman 10 050b 044b 0.56” 0.50 0.06 12.0
Man 1 243b 219b 354b 2.72 0.72 26.5
Man 2 0.53” 0.71 0.49 0.58 0.12 20.7
Man 3 183b 1.74 1.86 1.81 0.06 3.3
Man 4 0.32a 037b 029b o33 0.04 12.1
Man 5 0.51 0.46 0.72 0.56 0.14 25.0
Man 6 066b 075b 058b 0.66 0.09 13.6
Man 7 0.27 0.3V #{216}47� 0.35 0.11 31.4
Man 8 044b 0.43” 0.37�’ 0.41 0.04 9.8
Man 9 0.42 0.31c 0.39 0.37 0.06 16.2
Man 10 0.34 0.38 0.37 0.36 0.02 5.6
a T0 urines with 1 7X or 1 37X peaks present at 5-1 2% full-scale height of chromatogram.b T0 urines with 1 7X or 1 37X peaks present above 1 2% full-scale height of chromatogram.
C T0 urine sample was inadvertently spilled; therefore, presence (or absence) of endogenous peaks could not be determined.
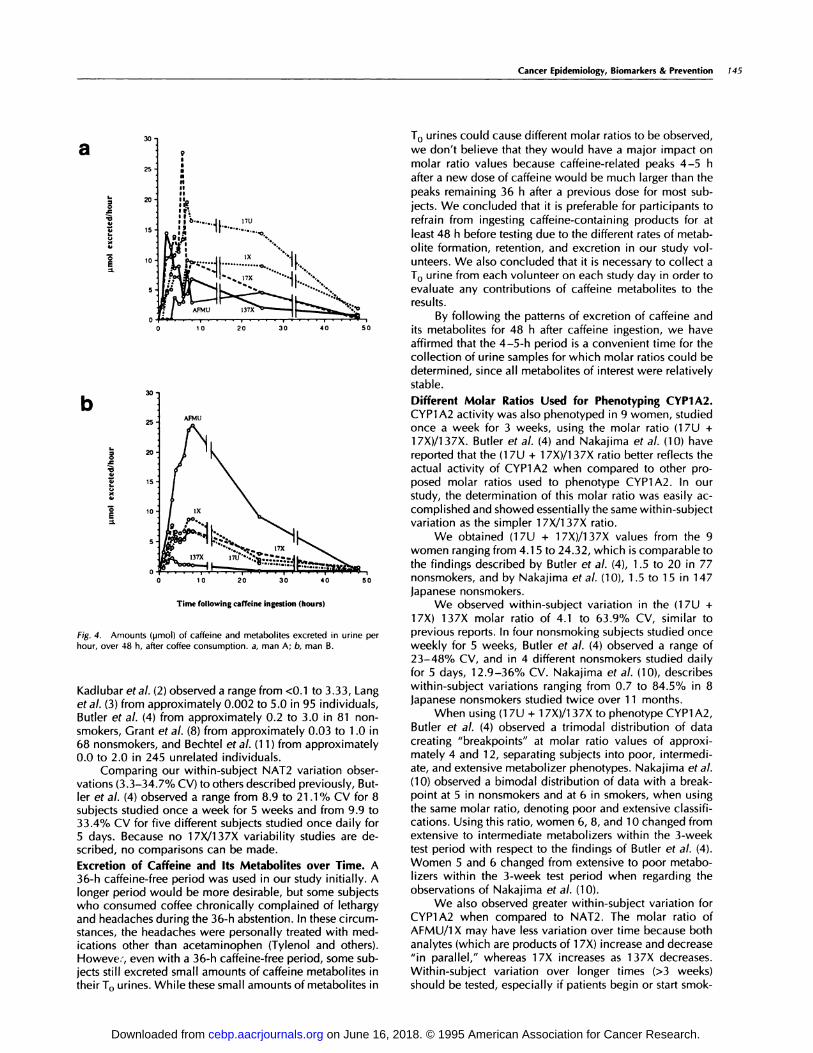
The excretion of caffeine and caffeine metabolites penhour oven 48 h by men A and B is shown in Fig. 4, a and b.Both subjects had detectable amounts of some caffeinemetabolites after refraining from caffeine for 48 h, althoughmost of these peaks were very small relative to those seen4-5 h after ingestion of coffee. On the other hand, excretionof nearly all analytes of interest was substantial when mea-suned at the 24-h point.
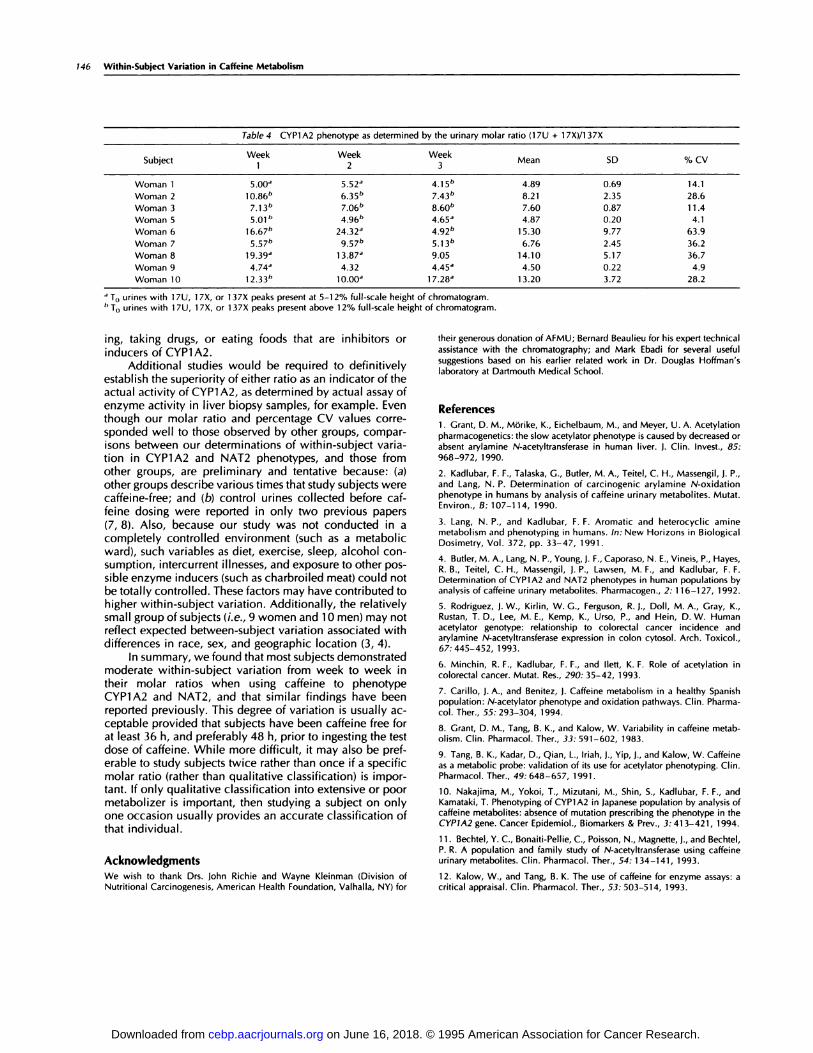
Different Molar Ratios Used for Phenotyping CYP1A2. InTable 4, the CYP1 A2 phenotype was determined for the 9women studied using (1 7U + 1 7X)/1 37X. The assay preci-sion was improved (% CV was lowered) when comparing
this ratio to 1 7X/1 37X for 5 women (women 1-3, 6, and 9)but not for the other four women studied (women 5, 7, 8,and 10). We observed (1 7U + 1 7X)/1 37X values rangingfrom 4.15 to 24.32, and within-subject variation rangingfrom 4.1 to 63.9% CV.
Discussion
Optimization of Chromatographic Conditions and Show-ing Representative Chromatograms. We modified chro-matognaphic procedures reported previously by severalother groups in order to obtain near-baseline separation of
on June 16, 2018. © 1995 American Association for Cancer Research. cebp.aacrjournals.org Downloaded from
30
0
aE
17U
(I7U+17X�137X
a
b
30
25
a
137X
AFMU
0 � 2 3 4 5 7 8
bAFMU
lx
37X
Fig. 2. Amounts (pmol( of caffeine and metabolites excreted in urine per
hour, over 8 h, after coffee consumption. a, man A; b, man B.
2 3 4
a
a
0
0
a
20
5 6 7 8 24 48
Is
10
(17u+17x5137x
2 3 4 5 8 7 8
Time following caffeine ingestion (hours) 2 3 4 5 6 7
Time following caffeine ingestion (hours)
Fig. 3. Molar ratios used to phenotype CYP1A2 117X/137x, (17U + 17x)/1 37Xl and NAT2 (AFMU/1 x) determined every hour, over 8 h, after coffee
consumption. a, man A; b, man B. Two molar ratios 1(1 7U + 1 7x)/1 37X and1 7X/1 37X1 could not be generated due to the absence of caffeine (1 37X).
144 Within-Subject Variation in Caffeine Metabolism
analytes from endogenous UV-absorbing material in urine.This modified procedure has resulted in an improved sep-anation of analytes of interest, simplified gradient condi-tions, and a reduction in total time per cycle.
We found that chromatograms of urine from healthy
subjects exhibited greater amounts of endogenous peaksrelative to the size of the caffeine metabolite peaks, whencompared to those published previously (4, 7-9). This dif-ference might have resulted from the use of lower detector
sensitivities by other groups or from the administration of ahigher dose of caffeine to the subjects (7, 8). For example,in our experiments coffee was selected as a source of caf-feine (containing approximately 200 mg 1 37X) to enhancesubject compliance, whereas other groups have givenknown amounts of caffeine in powder or tablets to ensureingestion of a known amount of caffeine (4, 7, 8). We alsoobserved that salicylazosulfapynidmne treatment probablyinterfereswith the detection and integration of some caf-feine metabolites.
In our modified protocol, the sample injection volumeswere reduced when analyte peaks of interest were off-scale(falling outside the range of the standard curve). In thisregard, the injection volumes were reduced to 5 p1 to obtainthe results shown in Figs. 1 , d and e; 2b; 3b; and 4b.
We derived standard curves to quantitate the amounts
of caffeine and caffeine metabobites in sample injections inpmol amounts (e.g., pmol injected in 20 p1 volume). Wethen calculated actual molar ratios from pmob quantities.Since we were measuring the molar ratios of peaks ofinterest, we did not need to connect for percentage necov-eny of the internal standard. Rather, we used the recoveryof the internal standard as a quality control to be surethat the extraction/chromatography procedure was con-sistent (our mean recovery of internal standard ± SD was86.9% ± 6.3%).
Metabolic Molar Ratios and Within-Subjed Variation inCYP1 A2 (Using 1 7X/1 37X) and NAT2 Phenotypes. Most ofour subjects who were caffeine free for 36 h before beingtested demonstrated low between-day variation in theirphenotypes for both enzymes (<25% CV). Our observedrange of the 1 7X/1 37X molar ratio (2.1 9-1 4.04) is compa-rable to ranges reported previously. In 30 randomly se-lected individuals studied on one occasion, Kadluban et a!.(2) observed molar ratios of 0.36-i 0.62, and in 97 subjects,Lang et a!. (3) observed a molar ratio range from 0.3 to 10.
Our observed range of the NAT2 molar ratio (0.27-2.77) also is comparable to previously described values.
on June 16, 2018. © 1995 American Association for Cancer Research. cebp.aacrjournals.org Downloaded from
30’
25’
9
IS
20
15
10
a
b
T0 unines could cause different molar ratios to be observed,
we don’t believe that they would have a major impact on
molar ratio values because caffeine-related peaks 4-5 hafter a new dose of caffeine would be much larger than the
peaks remaining 36 h after a previous dose for most sub-
jects. We concluded that it is preferable for participants tol7u refrain from ingesting caffeine-containing products for at
least 48 h before testing due to the different rates of metab-
olite formation, retention, and excretion in our study vol-unteens. We also concluded that it is necessary to collect aT0 urine from each volunteer on each study day in order toevaluate any contributions of caffeine metabolites to theresults.
By following the patterns of excretion of caffeine andits metabolites for 48 h after caffeine ingestion, we have
affirmed that the 4-5-h period is a convenient time for thecollection of urine samples for which molar ratios could bedetermined, since allmetabolites of interestwere relatively
stable.
aa
8I
aEa.
a
C
I’C
aEa.
20 30 40 50
Time following caffeine ingestion (hours)
Fig. 4. Amounts (pmol) of caffeine and metabolites excreted in urine perhour, over 48 h, after coffee consumption. a, man A; b, man B.
Cancer Epidemiology, Biomarkers & Prevention 145
Kadlubar eta!. (2) observed a range from <0.1 to 3.33, Lang
et a!. (3) from approximately 0.002 to 5.0 in 95 individuals,Butler et a!. (4) from approximately 0.2 to 3.0 in 81 non-smokers, Grant et a!. (8) from approximately 0.03 to i .0 in68 nonsmokers, and Bechtel et a!. (1 1 ) from approximately0.0 to 2.0 in 245 unrelated individuals.
Comparing our within-subject NAT2 variation obsen-vations (3.3-34.7% CV) to others described previously, But-len et a!. (4) observed a range from 8.9 to 2i .1 % CV for 8subjects studied once a week for 5 weeks and from 9.9 to33.4% CV for five different subjects studied once daily for5 days. Because no i 7X/1 37X variability studies are de-scnibed, no comparisons can be made.
Excretion of Caffeine and Its Metabolites over Time. A36-h caffeine-free period was used in our study initially. Alonger period would be more desirable, but some subjectswho consumed coffee chronically complained of lethargyand headaches during the 36-h abstention. In these circum-stances, the headaches were personally treated with med-ications other than acetaminophen (Tylenol and others).However, even with a 36-h caffeine-free period, some sub-jects still excreted small amounts of caffeine metabolites intheir T0 unines. While these small amounts of metabolites in
Different Molar Ratios Used for Phenotyping CYP1 A2.CYP1 A2 activity was also phenotyped in 9 women, studiedonce a week for 3 weeks, using the molar ratio (i 7U +
1 7X)/1 37X. Butler et a!. (4) and Nakajima et a!. (i 0) havereported that the (1 7U + 1 7X)/i 37X ratio better reflects the
actual activity of CYP1A2 when compared to other pro-posed molar ratios used to phenotype CYP1 A2. In ourstudy, the determination of this molar ratio was easily ac-complished and showed essentially the same within-subjectvariation as the simpler 1 7X/1 37X ratio.
We obtained (17U + 17X)/137X values from the 9women ranging from 4.1 5 to 24.32, which is Comparable to
the findings described by Butler et a!. (4), 1 .5 to 20 in 77nonsmokers, and by Nakajima eta!. (10), 1.5 to 15 in 147
Japanese nonsmokers.We observed within-subject variation in the (1 7U +
17X) 137X molar ratio of 4.1 to 63.9% CV, similar toprevious reports. In four nonsmoking subjects studied once
weekly for 5 weeks, Butler et a!. (4) observed a range of23-48% CV, and in 4 different nonsmokers studied dailyfor 5 days, 1 2.9-36% CV. Nakajima et a!. (1 0), describeswithin-subject variations ranging from 0.7 to 84.5% in 8
Japanese nonsmokers studied twice oven 1 1 months.When using (1 7U + 1 7X)/1 37X to phenotype CYP1 A2,
Butler et a!. (4) observed a tnimodal distribution of data
creating “breakpoints” at molar ratio values of approxi-mately 4 and 1 2, separating subjects into poor, intenmedi-
ate, and extensive metabolizen phenotypes. Nakajima et a!.(i 0) observed a bimodal distribution of data with a break-
point at 5 in nonsmokers and at 6 in smokers, when usingthe same molar ratio, denoting poor and extensive classifi-cations. Using this ratio, women 6, 8, and 1 0 changed fromextensive to intermediate metabolizers within the 3-weektest period with respect to the findings of Butler et a!. (4).Women 5 and 6 changed from extensive to poor metabo-lizens within the 3-week test period when regarding the
observations of Nakajima et a!. (10).We also observed greaten within-subject variation for
CYP1A2 when compared to NAT2. The molar ratio ofAFMU/1 X may have less variation over time because both
analytes (which are products of 1 7X) increase and decrease“in parallel,” whereas i 7X increases as 1 37X decreases.
Within-subject variation oven longer times (>3 weeks)should be tested, especially if patients begin on start smok-
on June 16, 2018. © 1995 American Association for Cancer Research. cebp.aacrjournals.org Downloaded from
146 Within-Subject Variation in Caffeine Metabolism
1 2. Kalow, W., and Tang, B. K. The use of caffeine for enzyme assays: acritical appraisal. Clin. Pharmacol. Ther., 53: 503-514, 1993.
Table 4 CYP1 A2 phenotype as deter mined by the urinary m olar ratio (1 7U + 1 7X)/1 37X
.Subject
Week
1
Week
2
Week3 Mean SD I,, CV
Woman 1
Woman 2
Woman 3
Woman 5
Woman 6
Woman 7
Woman 8
Woman 9
Woman 10
5.00”
1086b
713b
501b
1667b
557b
19.39a
4.74”
1233b
5.52a635b
706b
496b
24.32a957b
13.87a
4.32
�
415b
743b
860b
4.65�’492b
513b
9.05
445#{224}
17.28a
4.89
8.217.60
4.8715.30
6.76
14.10
4.50
13.20
0.69
2.350.87
0.209.77
2.45
5.17
0.22
3.72
14.1
28.611.4
4.163.9
36.2
36.7
4.9
28.2
., T0 urines with 1 7U, 1 7X, or 1 37X peaks present at 5-1 2% full-scale height of chromatogram.
I, T0 urines with 1 7U, 1 7X, or 1 37X peaks present above 1 2% full-scale height of chromatogram.
ing, taking drugs, or eating foods that are inhibitors oninducens of CYP1A2.
Additional studies would be required to definitivelyestablish the superiority of either ratio as an indicator of theactual activity of CYP1 A2, as determined by actual assay ofenzyme activity in liver biopsy samples, for example. Eventhough our molar ratio and percentage CV values come-sponded well to those observed by other groups, compan-isons between our determinations of within-subject vania-tion in CYP1A2 and NAT2 phenotypes, and those fromother groups, are preliminary and tentative because: (a)other groups describe various times that study subjects werecaffeine-free; and (b) control unines collected before caf-feine dosing were reported in only two previous papers(7, 8). Also, because our study was not conducted in acompletely controlled environment (such as a metabolicwand), such variables as diet, exercise, sleep, alcohol con-sumption, intercurrent illnesses, and exposure to other pos-sibbe enzyme inducers (such as chanbnoiled meat) could notbe totally controlled. These factors may have contributed tohigher within-subject variation. Additionally, the relativelysmall group of subjects (i.e., 9 women and 1 0 men) may notreflect expected between-subject variation associated withdifferences in race, sex, and geographic location (3, 4).
In summary, we found that most subjects demonstratedmoderate within-subject variation from week to week intheir molar ratios when using caffeine to phenotypeCYP1A2 and NAT2, and that similar findings have beenreported previously. This degree of variation is usually ac-ceptable provided that subjects have been caffeine free forat beast 36 h, and preferably 48 h, prior to ingesting the testdose of caffeine. While more difficult, it may also be pref-enable to study subjects twice rather than once if a specificmolar ratio (rather than qualitative classification) is impor-tant. If only qualitative classification into extensive on poormetabolizen is important, then studying a subject on onlyone occasion usually provides an accurate classification ofthat individual.
AcknowledgmentsWe wish to thank Drs. John Richie and Wayne Kleinman (Division ofNutritional Carcinogenesis, American Health Foundation, Valhalla, NY) for
their generous donation of AFMU; Bernard Beaulieu for his expert technical
assistance with the chromatography; and Mark Ebadi for several useful
suggestions based on his earlier related work in Dr. Douglas Hoffman’s
laboratory at Dartmouth Medical School.
References1 . Grant, D. M., M#{246}rike, K., Eichelbaum, M., and Meyer, U. A. Acetylation
pharmacogenetics: the slow acetylator phenotype is caused by decreased or
absent arylamine N-acetyltransferase in human liver. J. Clin. Invest., 85:
968-972, 1990.
2. Kadlubar, F. F., Talaska, G., Butler, M. A., Teitel, C. H., Massengil, J. P.,
and Lang, N. P. Determination of carcinogenic arylamine N-oxidationphenotype in humans by analysis of caffeine urinary metabolites. Mutat.Environ., B: 107-114, 1990.
3. Lang, N. P., and Kadlubar, F. F. Aromatic and heterocyclic amine
metabolism and phenotyping in humans. In: New Horizons in BiologicalDosimetry, Vol. 372, pp. 33-47, 1991.
4. Butler, M. A., Lang, N. P., Young, J. F., Caporaso, N. E., Vineis, P., Hayes,
R. B., Teitel, C. H., Massengil, J. P., Lawsen, M. F., and Kadlubar, F. F.Determination of CYP1 A2 and NAT2 phenotypes in human populations by
analysis of caffeine urinary metabolites. Pharmacogen., 2: 1 1 6-1 27, 1992.
5. Rodriguez, J. W., Kirlin, W. G., Ferguson, R. J., Doll, M. A., Gray, K.,Rustan, T. D., Lee, M. E., Kemp, K., Urso, P., and Hem, D. W. Humanacetylator genotype: relationship to colorectal cancer incidence and
arylamine N-acetyltransferase expression in colon cytosol. Arch. Toxicol.,67:445-452, 1993.
6. Minchin, R. F., Kadlubar, F. F., and IIett, K. F. Role of acetylation incolorectal cancer. Mutat. Res., 290: 35-42, 1993.
7. Carillo, J. A., and Benitez, J. Caffeine metabolism in a healthy Spanish
population: N-acetylator phenotype and oxidation pathways. Clin. Pharma-
col. Ther., 55: 293-304, 1994.
8. Grant, D. M., Tang, B. K., and Kalow, W. Variability in caffeine metab-
olism. Clin. Pharmacol. Ther., 33: 591-602, 1983.
9. Tang, B. K., Kadar, D., Qian, I., Iriah, J., Yip, J., and Kalow, W. Caffeineas a metabolic probe: validation of its use for acetylator phenotyping. Clin.Pharmacol. Ther., 49: 648-657, 1991.
10. Nakajima, M., Yokoi, T., Mizutani, M., Shin, S., Kadlubar, F. F., andKamataki, T. Phenotyping of CYP1 A2 in Japanese population by analysis of
caffeine metabolites: absence of mutation prescribing the phenotype in theCYP1A2 gene. Cancer Epidemiol., Biomarkers & Prey., 3: 413-421, 1994.
1 1 . Bechtel, Y. C., Bonaiti-Pellie, C., Poisson, N., Magnette, J., and Bechtel,
P. R. A population and family study of N-acetyltransferase using caffeine
urinary metabolites. Clin. Pharmacol. Ther., 54: 134-141, 1993.
on June 16, 2018. © 1995 American Association for Cancer Research. cebp.aacrjournals.org Downloaded from
1995;4:139-146. Cancer Epidemiol Biomarkers Prev S H McQuilkin, D W Nierenberg and E Bresnick N-acetyltransferase-2 activities.when used to determine cytochrome P4501A2 and Analysis of within-subject variation of caffeine metabolism
Updated version
http://cebp.aacrjournals.org/content/4/2/139
Access the most recent version of this article at:
E-mail alerts related to this article or journal.Sign up to receive free email-alerts
Subscriptions
Reprints and
To order reprints of this article or to subscribe to the journal, contact the AACR Publications
Permissions
Rightslink site. Click on "Request Permissions" which will take you to the Copyright Clearance Center's (CCC)
.http://cebp.aacrjournals.org/content/4/2/139To request permission to re-use all or part of this article, use this link
on June 16, 2018. © 1995 American Association for Cancer Research. cebp.aacrjournals.org Downloaded from