analysis of the potential of a mars orbital ground
TRANSCRIPT

05_Radar_White_Paper_v11.doc 1 04/03/01
ANALYSIS OF THE POTENTIAL OF A MARSORBITAL GROUND-PENETRATING RADAR
INSTRUMENT IN 2005
January 28, 2001
A White Paper
Mars Radar Sounding Strategy Team, listed alphabetically:David W. Beaty (Mars Program Office), [email protected] Coradini (ASI), [email protected] Clifford (LPI), [email protected] Grant (Smithsonian Institution), [email protected] Gogineni (University of Kansas), [email protected] Plaut (JPL), [email protected] Raney (APL), [email protected] Safaeinili (JPL), [email protected]
Linkage to spacecraft engineering:Peter.Xaypraseuth (JPL), [email protected] Mateer (JPL), [email protected]
Linkage to NASA HQ:Jim Garvin (HQ), [email protected]
Note: This report represents the analysis completed by the above team over a period of about two months, as input to the’05 SDT. We recognize that documents such as this are never final, and that this work will likely need to berefined (possibly by other authors) during 2001. However, in order for the information to be in time to make adifference, our revisions must be closed with this version. For future reference, the final electronic file of thisreport is named Radar_White_Paper_v10.doc.

05_Radar_White_Paper_v11.doc 2 04/03/01
Table of Contents
1. Executive Summary ............................................................................................................................................. 4Summary Conclusions....................................................................................................................................... 4Summary Recommendations............................................................................................................................. 5
2. Introduction.......................................................................................................................................................... 63. Overall Scientific Objectives of Orbital Radar Sounding .................................................................................... 7
A. Introduction.................................................................................................................................................. 7B. Discussion of MEPAG Document............................................................................................................... 8C. Expected Volatile Stratigraphy of the Martian Crust................................................................................... 9D. Summary of Potential Subsurface Targets and Associated Scientific Objectives ...................................... 11E. Ambiguities and Potential Complications in the Interpretation of Geophysical Data................................ 15
4. Mars Orbiting Radar Sounder Design Issues ..................................................................................................... 16A. Dispersion .................................................................................................................................................. 16B. Range (Depth) Sidelobes............................................................................................................................ 16C. Operation Frequency Choice ...................................................................................................................... 17D. Galactic Noise ............................................................................................................................................ 19E. Electromagnetic Compatibility ................................................................................................................... 19F. Potentials for Mission Enrichment............................................................................................................. 19
5. MARSIS and The MRO Sounder........................................................................................................................ 21A. MARSIS at Mars........................................................................................................................................ 21B. The Radar Sounder on MRO...................................................................................................................... 22C. A Radar Sounder for MRO (ASI).............................................................................................................. 23D. Marrying Objectives and Constraints ........................................................................................................ 24
6. Second Generation Radar Sounder Design Options........................................................................................... 26A. MARSIS Heritage Sounder ........................................................................................................................ 26B. Stepped Frequency Modulation.................................................................................................................. 27C. Ricker Wavelet Modulation........................................................................................................................ 28D. Inverse Dispersion Modulation .................................................................................................................. 28
7. Science Objectives versus Radar Sounders........................................................................................................ 308. Engineering constraints on addition of a radar sounder to ’05 Orbiter .............................................................. 339. Technology R&D needs..................................................................................................................................... 3310. References........................................................................................................................................................ 34APPENDIX 1: Charter ( November 4, 2000) ........................................................................................................ 41APPENDIX 2: Capabilities of the MARSIS Radar Sounder .................................................................................. 42
Resolution, Coverage and Data Content ......................................................................................................... 42Subsurface interface detection ........................................................................................................................ 43
APPENDIX 3: MARSIS Experience and Technical Issues In Implementing A Radar Sounder ............................ 47MARSIS Background ..................................................................................................................................... 47MARSIS Science Goals .................................................................................................................................. 47MARSIS Constraints....................................................................................................................................... 48MARSIS Science Processing Philosophy ....................................................................................................... 48Radar Sounder Design Issues.......................................................................................................................... 48Low Frequency and Ionosphere ...................................................................................................................... 49High Relative Bandwidth ................................................................................................................................ 49Innovative Antenna Design ............................................................................................................................. 49EMI and Susceptibility Requirement .............................................................................................................. 49Raw Data Storage and Downlink .................................................................................................................... 50Along Track Resolution .................................................................................................................................. 50Improving SNR ............................................................................................................................................... 50Clutter issue and Two-Dimensional Aperture synthesis.................................................................................. 50High Resolution Radar Sounder...................................................................................................................... 50
APPENDIX 4: A Design Based on The MARSIS Heritage: Wide-band Multi-channel Radar .............................. 51Multiple Transmitter and Antenna .................................................................................................................. 51

05_Radar_White_Paper_v11.doc 3 04/03/01
Operation Modes............................................................................................................................................. 52Antenna ........................................................................................................................................................... 53Mass and Power Estimate ............................................................................................................................... 53Possible Orbit Requirements........................................................................................................................... 53
05_Radar_White_Paper_v11.doc 4 04/03/01
1. Executive Summary
Radar sounding on Mars is one of the critical measurements required by NASA’s strategy of “followthe water”. The MARSIS instrument, which will be included on the Mars Express mission in 2003will be a first step towards acquiring these data. The purpose of this report is to assess the scientificand technical justification of including a second radar sounder on the ’05 Orbiter to extend theresults of MARSIS. Note that as of this writing, a radar sounder is not part of the baseline plan forthe ’05 Orbiter.
During November and December 2000, a multi-disciplinary team assessed a specific set of questions(see Appendix 1) related to this opportunity. These results constitute input to the science definitionteam for this mission.
Summary Conclusions1. Science of water on Mars. Geomorphic evidence and theoretical arguments suggest that the
Martian crust is water-rich and may possess a complex stratigraphy of saturated and unsaturatedfrozen ground, massive segregated bodies of ground ice, liquid groundwater, and gas hydrateswithin the top 10 km. As recently summarized by MEPAG, assessing the 3-dimensionaldistribution and state of water in the Martian crust is the common thread and one of the primarygoals of the Mars exploration program. Analysis of the science of subsurface water on Mars iscontained in Section 3 of this report.
2. Water detection using radar sounding. An orbital radar sounder provides a unique ability to mapthe subsurface distribution of water on a global basis with a single spacecraft. Such areconnaissance would likely also yield significant new insights regarding the subsurface structureand lithology of the crust, including the nature of the polar layered deposits. Although theunambiguous identification of a specific volatile target is probably not possible using orbitalsounding alone, it provides the only approach for achieving global coverage of this importantdata type. This analysis is contained in Section 4 of this report.
3. MARSIS. MARSIS, the radar sounder that will fly on Mars Express in 2003, will attempt tosound as deep as 5 km, with a depth resolution of 50-80 m and a horizontal footprint of 5-10 km.At a minimum, a MARSIS-like instrument on the 2005 Orbiter would benefit from the low-eccentricity orbit and increased data volume, as well as from possible improvements in spacecraftaccommodation and electromagnetic compatibility, as compared with Mars Express. This couldresult in improved science return in terms of coverage, maximum detection depth, sensitivity andinterpretability of data. This analysis is contained in Section 5 of this report, as well asAppendices 2 and 3.
4. Second Generation Radar Sounder. A second-generation radar sounder can be designed to obtainboth high vertical resolution (10-20 m) soundings of the upper 1 km (with a footprint size assmall as 1 by 3 km) and equal, or improve upon, the deep sounding capability of MARSIS usinga single instrument. A radar including antenna and signal processing algorithms can bedeveloped to maximize information return from the upper 500-1000 meters of Martian soil. Thisanalysis is contained in Sections 5-7 of this report.
5. 2005 Orbiter. There are sufficient mass, power and data volume resources to accommodate asecond-generation radar sounder on the 2005 orbiter. Issues such as mechanical accommodation,dynamic stability, and electromagnetic compatibility need to be resolved. Although issues such

05_Radar_White_Paper_v11.doc 5 04/03/01
as mechanical accommodation, dynamic stability, and electromagnetic compatibility need to beresolved, all appear tractable. . This analysis is contained in Section 8 of this report.
6. Programmatic Issues. Flying a radar sounder in the 2005 opportunity is compatible with Marsprogrammatic goals. It continues the probing started with MARSIS to “follow the water” bydirectly detecting ice and possible aquifers, with an increased likelihood of success due to themission design. The capability to probe the upper 1 km at high resolution allows testing ofhypotheses of recent shallow water reservoirs, and feeds forward to characterization and selectionof possible sites for drilling experiments in 2007 and beyond. In addition, the expectedimprovements in orbital characteristics and data volume in ’05 provide an opportunity forsubstantial advances in deep sounding capability. While a second-generation radar sounder willbenefit from MARSIS design heritage, the design of a 2005 sounder cannot benefit fromMARSIS data due to the close consecutive launch opportunities. Consequently, most risksassociated with uncertainties in the Mars environment (ionosphere, attenuation in the crust,nature of interfaces) will apply to both MARSIS and a 2005 sounder.
7. Technology Development. Technology for implementing a radar that operates in four sub-bandsin chirp mode already exists. Four element antenna for this radar must be evaluated fordetermining the mutual interaction between sub-band antenna elements. Step-frequency radars tosupport variety of military and commercial applications have been developed. Technologiesdeveloped in support of these can be readily adopted for a dual-mode radar, but some of thehardware may need to be space qualified. . This analysis is contained in Section 9 of this report.
Summary Recommendations1. We recommend inclusion of a coherent radar sounder on the 2005 Mars Reconnaissance Orbiter
2005. The sounder should operate in two modes: high-resolution (~20 m ) for collecting data onsubsurface features to depths approaching 1 km, and low-resolution (~100 m) for collecting datafor depths beyond 1 km. These dual-mode data will both complement and supplement those fromMARSIS for imaging sub-surface features.
2. We recommend that NASA initiate a study to define an optimum system including signalprocessing algorithms with existing technologies.

05_Radar_White_Paper_v11.doc 6 04/03/01
2. Introduction
The search for water is a primary focus of Mars exploration. At the surface of Mars, water is presentonly as ice in the polar ice caps and in trace quantities in the atmosphere. In order to discover liquidwater, we will need to search in the subsurface. The abundance and distribution of water (both asground ice and groundwater) have important implications for understanding the geologic, hydrologic,and climatic evolution of the planet; the potential origin and continued survival of life; and theaccessibility of a critical in situ resource for sustaining future human explorers.
A critical investigation identified by MEPAG is subsurface sounding using ground penetrating radar.The first measurement towards this investigation will be the MARSIS radar sounder, which will beflown on the Mars Express spacecraft in 2003.
The purpose of this document is to evaluate the scientific and technical merits of placing a secondradar sounder on the 2005 Orbiter. This analysis was initiated at the beginning of November, 2000,and is intended to supply input to the Science Definition Team for the 2005 Orbiter by approximatelythe first of 2001. The charter for this assignment is included as Appendix 1 of this report.
If any reader has follow-up questions, he/she is encouraged to contact anybody listed on the coversheet of this report.

05_Radar_White_Paper_v11.doc 7 04/03/01
3. Overall Scientific Objectives of Orbital Radar Sounding
A. Introduction
The basis for an Orbital Radar Sounder -The major goals outlined by the MEPAG focus on determining: 1) whether life ever arose on
Mars; 2) the climate history of Mars; 3) the evolution of the interior and surface of Mars; and 4) howbest to prepare for the human exploration of Mars. The common theme associated with each of thesegoals relates to the occurrence, distribution, and form of water on Mars. As summarized below, theimportance of resolving the water inventory of Mars is reflected in the primary objective and (in allbut one instance) the highest priority investigation and required measurement for each of these fourMEPAG goals. Text in boxes below is directly quoted form the prioritized MEPAG document, andreference numbers refer to the source.
I. GOAL: DETERMINE IF LIFE EVER AROSE ON MARS
A. Objective: Determine if life exists today.1. Investigation: Map the 3-dimensional distribution of water in all its forms. Zones of liquidwater in the subsurface provide the most likely environments for extant life on Mars. In theabsence of life, such environments could also sustain pre-biotic chemistry of interest forunderstanding the origin of life on Earth. Requires global remote sensing of water in all itsforms to identify the locations, phases, and, if possible, temporal changes in near-surfacewater budgets.Measurements:a. Global search and mapping of water to 5.0 km depth at a horizontal spatial resolution of 1.0km and vertical resolution of 400 m; must be able to distinguish ice and liquid water.
II. GOAL: DETERMINE CLIMATE ON MARS
A. Objective: Characterize Mars’ Present Climate and Climate Processes.1. Investigation: Determine the processes controlling the present distributions of water,carbon dioxide and dust. Understanding the factors that control the present annual variations ofvolatiles and dust on Mars is a necessary first step to determining to what extent today’sprocesses have controlled climate change in the past. Requires, in priority order: 1) globalmapping of the time-varying three-dimensional distributions of dust, water vapor, carbondioxide, thermal state, and radiative forcing of the atmosphere, surface and near-subsurface overat least one annual cycle; 2) landed observations of the exchange of volatiles and dust betweenthe surface and atmosphere on daily and seasonal time scales.Measurement:b. Detect near-surface (< 100 m) and deep (100 m – 5 km) occurrences of liquid water; mapglobal presence at scales equal to, or better than, 10 degrees longitude by 30 degrees latitude.Determine depths to ± 10 m for near surface water, ± 100 m at greater depth.c. Detect subsurface ice layers, delineating depth with precisions of 100-200 m as deep as 5 km,at horizontal scales of a few hundred kilometers.

05_Radar_White_Paper_v11.doc 8 04/03/01
III. GOAL: DETERMINE THE EVOLUTION OF THE SURFACE ANDINTERIOR OF MARS ("Geology")
A. Objective: Determine the nature and sequence of the various geologic processes (volcanism,impact, sedimentation, alteration etc.) that have created and modified the Martian crust andsurface.1. Investigation: Determine the present state, distribution and cycling of water on Mars.Water is the critical limiting resource for the development and sustenance of life and for futurehuman exploration. Requires global observations using geophysical sounding (radio orradar).Measurements:a. Orbital remote sensing using sounding to detect water at spatial scales of approximately 100 mand to a depth of several kilometers.b. Orbital and/or aerial platform remote sensing using to search for subsurface water and todetermine its physical state on spatial scales ranging from 100 km (from orbit) to 100 m (fromaerial platforms).6. Investigation: Determine the large-scale vertical structure of the crust and its regionalvariation. This includes, for example, the structure and origin of hemispheric dichotomy. Thevertical and global variation of rock properties and composition places constraints on thedistribution of subsurface aquifers and aids interpretation of past igneous and sedimentaryprocesses. Requires geophysical sounding from orbiters and surface systems, geologicmapping, in-situ analysis of mineralogy and composition of surface material, returnedsamples, and seismic monitoring.
IV. GOAL : PREPARE FOR HUMAN EXPLORATION
A. Objective: Acquire Martian environmental data sets.3. Investigation: Understand the distribution of accessible water in soils, regolith, and Martiangroundwater systems. Water is a principal resource to humans. Requires geophysical investigationsand subsurface drilling. Can also be met by sample analysis.Measurements:a. Map the Martian subsurface for liquid water reservoirs.b. Obtaining the vertical distribution of permafrost, water ice and liquid water is essential tounderstand the requirements for drilling equipment that will be used to penetrate these layers.
B. Discussion of MEPAG Document
An orbital radar sounder has the potential to penetrate beneath the surface of Mars and should behighly sensitive to the presence of liquid water as well as being capable of defining coarse-scalestratigraphy within the Martian crust. As such, an orbiting radar sounder could accomplish many ofthe critical measurements outlined above and should be considered as a high priority candidate forflight on an upcoming mission. Post-MARSIS instrument design concepts are responsive to thestated measurement requirements, including penetration to depths of ~5-10 km with the ability toresolve features on the scale of 0.1 km vertically. Somewhat lesser capabilities (e.g., penetration to
05_Radar_White_Paper_v11.doc 9 04/03/01
~3-5 km depth with vertical resolution of ~ 0.4 km) would still permit achieving a number ofimportant goals.
C. Expected Volatile Stratigraphy of the Martian Crust
A summary of the expected state and distribution of water and other volatiles on Mars follows and isbased on current models and observations. This overview is presented as context for understandingthe need for global measurements using an orbital radar sounder and as the framework forsubsequent definition of specific science questions related to the stated MEPAG priorities.
1. Distribution of H2O. To a first order, subsurface conditions on Mars are expected to resemblethose found in cold-climate regions on Earth, particularly the unglaciated, continuous permafrostregions of Antarctica, Siberia, and North America. This similarity is likely to extend to anequivalent level of geologic complexity and spatial variability in such characteristics as lithology,structure, stratigraphy, porosity, ice content, and mechanical and thermal properties.
Current mean annual surface temperatures on Mars range from ~154 K at the poles to ~218 K at theequator (±5 K), with radiogenic heating expected to result in increasingly warmer temperatures atdepth. The region of frozen ground defined by this thermal structure is known as the cryosphere,whose depth z, at any location, is given by
g
msmp
Q
TTz
−= κ (1)
where Tms is the mean annual surface temperature, Tmp is the melting temperature of ice at the base ofthe cryosphere, Qg is the geothermal heat flux, and κ is the column-averaged thermal conductivity(Fanale 1976; Rossbacher and Judson 1981; Kuzmin 1983; Clifford 1993).
Substituting the present best estimates of mean annual surface temperature (154 K – 218 K),geothermal heat flow (~30 mW m-2), and melting temperature (252-273 K) into Eq. (1), we find thatthe present thickness of frozen ground on Mars should vary from ~2.3 km – 4.7 km at the equator to~6.5 km – 13 km at the poles (Fig. 1; Clifford and Parker, 2000). However, natural variations incrustal heat flow and thermal conductivity are likely to result in significant local departures fromthese predicted average values.
At the Martian surface, the low relative humidity of the atmosphere means that ground ice isthermodynamically unstable at latitudes equatorward of ~40o – leading to its sublimation at a ratethat is dependent on the mean annual surface temperature, as well as the local thermal and diffusiveproperties of the crust. Depending on the nature of these properties, their variation with depth, andthe potential for replenishment from any deeper reservoir of subpermafrost groundwater, thesefactors may result in local depths of desiccation at low-latitudes that range from centimeters to asmuch as a kilometer -- with the potential for significant and complex variations in saturation statebeneath the sublimation front (Fig. 2; Clifford, 1998). Such uncertainties preclude any reliabletheoretical or geomorphic prediction of the local presence and subsurface distribution of ground icebelow the seasonal skin-depth.

05_Radar_White_Paper_v11.doc 10 04/03/01
Ground ice may also be present as massive segregated deposits in the northern plains – anexpectation based on the possible former existence of a Noachian ocean, and the geomorphicevidence for extensive and repeated flooding by Hesperian-age outflow channel activity. As a result,the volatile stratigraphy of the northern plains is likely to be quite complex, having been built upthrough multiple episodes of flooding, freezing, sublimation, and burial. This complexity hasundoubtedly been compounded by local differences in hydraulic and geologic evolution arising fromimpacts, volcanism, tectonism, and other processes, as well as by extreme climatic fluctuationsassociated with the chaotic evolution of the planet’s obliquity (Touma and Widom, 1993; Laskar andRobutel, 1993; Jakosky et al., 1995). While the resulting fine-scale structure of the crust is expectedto exhibit considerable heterogeneity, in many areas the bulk properties of the uppermost ~0.1 km –1.0 km are likely to be dominated by multiple, overlapping deposits of water ice – with individualflows ranging from meters to many hundreds of meters thick (Fig. 3).
If the Martian inventory of water exceeds what can be stored as ice within the pore volume of thecryosphere, then any excess will be stored as groundwater, saturating the lowermost porous regionsof the crust. Given a large-scale permeability of the planet’s crust comparable to that of the Earthand the apparent lack of recent precipitation, the influence of gravity should result in a groundwatersystem that is effectively in hydrostatic equilibrium – except where it may be locally perturbed bytectonic, seismic or thermal processes. Because of the low values of crustal porosity expected atdepth, comparatively little water is required to produce a groundwater system of substantial extent.Thus, if a subpermafrost groundwater system is present on Mars, it is expected to underlie much ofthe planet’s surface.
Because the distribution of ground ice is expected to follow the thermal structure of the crust, whilethe global groundwater table is expected to conform to a surface of constant geopotential, the verticaldistance separating these subsurface reservoirs of water and ice is expected to vary considerably. Theintervening unsaturated zone will be maximized in regions of high elevation and minimized (orabsent) at lower elevations (Fig. 4). Within the unsaturated zone, the presence of a geothermalgradient is expected to give rise to a low-temperature hydrothermal convection system of risingvapor and descending liquid condensate that may have lead to the development of perched watertables and the geochemical evolution of the underlying groundwater into a highly mineralized brine(Clifford, 1993).
The preceding discussion suggests that the occurrence of liquid water on Mars today is restricted todepths of several kilometers or more (except, perhaps, where it may occur in association with localgeothermal anomalies). This belief has recently been challenged by Malin and Edgett (2000), whohave identified features in high-resolution MOC images that they interpret as having originated fromrecent (within last ~107 years, and possibly still active today) episodic discharges of near-surfaceliquid water. Although extremely rare (being found in less than 1% of all MOC images taken todate), these “seepage” features are found on exposed scarps in both the northern and southernhemispheres within the latitude band of 30o – 70o that occur preferentially (by a factor of 2-to-1) onpoleward-facing slopes. While the true nature and age of the Malin and Edgett “seepage” featurescontinue to be topics of intense debate, the potential implications of a fluvial origin require that theynot be discounted.

05_Radar_White_Paper_v11.doc 11 04/03/01
2. The potential occurrence and distribution of gas hydrates and liquid CO2. Gas hydrates mayalso exist on Mars. Hydrates are formed when hydrocarbons and other gases (like CO2 and H2S) areconcentrated under condition of high pressure and low temperature in the presence of H2O – wherethey can become stabilized by Van der Waals bonding within the cubic crystalline lattice of water icemolecules. On Mars, methane may have been produced by biotic (Farmer, 1996; Fisk andGiovannoni, 1999; Max and Clifford, 2000) and/or abiotic (Wallendahl and Treiman, 1999)processes. As the internal heat flow of Mars has declined with time, the resulting downwardpropagation of the freezing-front at the base of the cryosphere would have incorporated anysubsurface methane that exists as hydrate. These hydrates could occur in concentrations ranging froma dispersed contaminant, to massive deposits (Max and Clifford, 2000).
Several workers (e.g., Miller and Smythe, 1970; Milton, 1974; Kamatsu et al. 2000; Kargel et al.2000) argued that substantial amounts of CO2 hydrate might also be present in the Martiansubsurface. The molecular structure of CO2 hydrate is essentially identical to methane hydrate, withthe exception that CO2 substitutes for CH4 as the guest molecule in the crystalline lattice of water ice(Miller and Smythe, 1970; Sloan, 1997). The stability field of CO2 hydrate is also similar, butshifted to slightly shallower depths – extending from ~5 m (corresponding to a confining pressure of~50 kPa) at 200 K to a maximum depth defined by the location of the 283 K isotherm. The mostprobable mechanism by which such deposits could have formed is by the progressive cooling andfreezing of CO2-saturated groundwater.
In addition to gas hydrates, several recent studies have argued that the expected pressure andtemperature conditions in the Martian subsurface also permit the stable existence of liquid CO2 – inamounts that may range from small inclusions to aquifer-like reservoirs that may have played a rolein the genesis of the outflow channels (e.g., Hoffman, 2000). However, while it is possible toidentify a P-T environment in the Martian subsurface where liquid CO2 would be stable if emplacedafter that environment had formed, it appears difficult to imagine an evolutionary scenario by whichaquifers of liquid CO2 could have initially formed and survived to the present day. If, however,liquid CO2 is currently present in the subsurface, it appears that it will most likely occur as inclusionsand localized pockets.
D. Summary of Potential Subsurface Targets and Associated ScientificObjectives
The search for subsurface water has become a primary focus of Mars exploration. Its abundance anddistribution (both as ground ice and groundwater) have important implications for understanding thegeologic, hydrologic, and climatic evolution of the planet; the potential origin and continued survivalof life; and the accessibility of a critical in situ resource for sustaining future human explorers.
For these reasons, the principal goal of the Mars science, astrobiology, and the HEDS programs is todetermine the 3-D distribution and state of subsurface H2O, at a resolution sufficient to permitreaching any desired volatile target by drilling. Additional objectives include the identification ofother volatile substances (such as gas hydrates and liquid CO2), local and regional variations in

05_Radar_White_Paper_v11.doc 12 04/03/01
subsurface structure and lithologies, and any compositional information that can be deduced from thecharacter and penetration depth of the returned signal (e.g., the presence of iron oxide, carbonates,etc.).
The H2O mapping requirements identified by MEPAG differ by subgroup, with a maximum desiredsounding depth of 10 km. Although the MARSIS instrument aboard Mars Express may yield firstorder information regarding the distribution of water and ice in the crust within the depth range of 1 -5 km, its ability to detect H2O at greater or shallower depths is limited. From the perspective ofidentifying volatile targets that might be accessed by drilling in the near-future, the most desirableimprovement in a 2nd generation radar sounder would be the identification of ground ice andgroundwater at shallower (<1 km) depths – without sacrificing a deep-sounding capability equivalentto, or better than, MARSIS. To make targeted drilling investigations practical, this will requirevertical and horizontal resolutions of approximately 20 meters and 1000 meters, respectively. Thetechnology required for development of a radar that can accomplish this task appears to be in-handand could likely be implemented in accordance with the schedule dictated by the Mars 2005 Orbitermission.
Regardless of the success of MARSIS, the inclusion of a radar on the Mars 2005 orbiter with theabove capabilities would enable a major increase in our understanding of the role of water on Marswith respect to the goals defined by MEPAG. Such data would enable significant advances inknowledge relevant to answering a wide range of specific questions related to the life, climate,geology, and future human exploration of Mars. These questions can be grouped in several topicalareas and are described in more below.
1. Saturated/Unsaturated Frozen Ground: The distribution of frozen ground on Mars is bydefinition coextensive with the cryosphere; however, local variations in mean annual temperature,geothermal heat flow, and the thermophysical and diffusive properties of the crust, are likely to resultin complex stratigraphic and geographic variations in saturation state – particularly within the top~102 m – 103 m of the crust (e.g., Fig. 2). Of particular interest is the extent of equatorial and mid-latitude desiccation due to the sublimation of ground ice.
Primary science questions related to this target:i. How does the depth of desiccation vary geographically?ii. How does the saturation state of the crust vary stratigraphically and geographically beneath
the shallowest occurrence of ground ice?iii. How large is the variability of both of the above at m- to km- size scales?iv. What are the temporal changes in the near-surface water budgets from summer to winter, and
from year to year over the lifetime of the mission?
Related technical issues:To what extent can an orbital radar sounder assess the saturation state (or contrasts in the saturationstate) of the crust?
What is the plausible highest spatial/volume resolution of a sounder as a function of depth?

05_Radar_White_Paper_v11.doc 13 04/03/01
What constraint does this resolution place on our ability to assess a minimum and maximum volume-averaged saturation state?
Are there potential changes in sounder design or implementation that could yield significantimprovements in any of the above (e.g., transmitted power, wave shape, use of multiple frequencies,receiver sensitivity, antenna size and geometry, orbit, addition of 2nd receiver – either boom-mountedor on an adjacent orbiter, etc.)?
2. Massive Bodies of Segregated Ground Ice: In addition to ice that may occur within the frozensaturated zone, variations in depositional history may have resulted in emplacement of massivesegregated lenses ranging from ~1-100’s of meters thick (e.g. frozen lakes, oceans; Fig. 3).
Primary science questions related to this target:i. Is there evidence of massive bodies of segregated ground ice, resulting from the ponded
dischage of the outflow channels or the presence of an ancient ocean, in the northern plains?ii. Can such deposits be identified within/beneath large impact basins/craters?iii. If so, what is the depth/distribution of these ice bodies?
3. Liquid Water: Liquid water may be present in the subsurface in a variety of forms and potentialdistributions. During the summer, at low-latitudes, the temperature of the top few centimeters of theregolith may exceed 273 K for as much as a few hours a day – sufficient to melt near-surface ice orfrost and produce transient films of liquid water on mineral grains. The presence of potent freezing-point depressing salts could conceivably extend the duration and extent of melting, particularly atequatorial latitudes. Near-surface liquid water might also occur in association with local geothermalanomalies.
Within the lowermost km of the cryosphere, thin films of super-cooled liquid water are expected tooccur on the surfaces of mineral grains as the crustal temperature reaches values that are within 20 Kof the freezing point. Beneath the cryosphere, the distribution of liquid water may be quite complex.If the subpermafrost inventory of liquid water is large, the vast bulk of it is expected to saturate thelowermost porous regions of the crust, forming a groundwater table in effective hydrostaticequilibrium. For this reason, in regions of low surface elevation, the base of the cryosphere andgroundwater may be in intimate contact (e.g., Fig. 2); while, in regions of higher elevation, the baseof the cryosphere and water table may be separated by an unsaturated zone of many kilometers.Capillarity, and the effects of low-temperature hydrothermal convection, are likely to contributed to agradational transition in saturation state that precludes identification of a clear interface betweensaturated and unsaturated conditions. These process are also likely to produce complicatedstratigraphic variations in saturation state between the base of the cryosphere and water table,including the development of perched aquifers.
Primary science questions related to this target:i. Is there a water table on Mars and, if so, what is its three dimensional configuration?ii. Do hydrothermal or other near-surface reservoirs of liquid water/brine exist? If so, what is
their spatial distribution?iii. What is the 3D configuration of the surface defining the base of the cryosphere? Where is

05_Radar_White_Paper_v11.doc 14 04/03/01
this surface most accessible to a possible future drilling mission?iv. What is the degree of water saturation of the rocks below the base of the cryosphere?
Related technical issues:What is the smallest volume and minimum depth that liquid water/brine could be detected by anorbital sounder?
Does the likely presence of continuous, thin-films of super-cooled liquid water on mineral grainsurfaces at the base of the cryosphere preclude the identification (and mapping) of liquid water atgreater depths?
4. Polar Layered Deposits:
Primary science questions related to this target:i. What is the thickness, extent and continuity of the layers within the polar deposits?ii. Is there geophysical evidence of prior variations in vertical and areal extent?iii. Is there evidence of flow in the internal structure or other characteristic of the caps?iv. Is there evidence of past or present basal melting or basal lakes?v. Are there peripheral ice deposits that may have been associated with local discharges of
subpolar or subpermafrost groundwater?
5. Gas Hydrates and Liquid CO2:
Primary science questions related to this target:i. What is the 3-dimensonal distribution/concentration of gas hydrates and liquid CO2 in the
crust?
Related technical issues:Do gas hydrates and liquid CO2 have characteristic geophysical signatures that are detectable by anorbital sounder?
If so, to what level of confidence and highest resolution (e.g., maximum/minimum: concentration,volume, depth, contrast)?
6. Local and Regional Variations in Crustal Lithology and Structure:
Primary science questions related to this target:i. What is the 3-dimensional tectonic, volcanic and sedimentary structure of the crust?ii. How does the porosity of the crust vary geographically and at depth?
Related technical issues:Are layering and tectonic structures (e.g., faults) detectable by an orbital sounder and, if so, at whatresolution? Specific examples: Valles Marineris, Medussae Fossae formation, polar layereddeposits, etc.

05_Radar_White_Paper_v11.doc 15 04/03/01
7. Compositional and Electromagnetic Properties of the Crust:
Primary science questions related to this target:i. What is the vertical distribution and composition of brines, iron oxides, carbonates, etc. within
the upper crust?
Related technical issues:What are the sensible electromagnetic properties that can be exploited to differentiate these strata?
8. General Technical Questions:
i. Are there potential changes in sounder design or implementation relative to MARSIS thatcould yield significant improvements in any of the above (e.g., transmitted power, waveshape, use of multiple frequencies, receiver sensitivity, antenna size and geometry, orbit,addition of 2nd receiver – either boom-mounted or on an adjacent orbiter, etc.)?
ii. Can an orbital radar sounder be used to identify targets with sufficient confidence andresolution to access them by drilling?
iii. Does an orbital sounder provide any additional capabilities to characterize or assess the safetyof potential landing sites?
E. Ambiguities and Potential Complications in the Interpretation of GeophysicalData
Terrestrial experience has demonstrated that the accurate interpretation of geophysical data is likelyto require the application of multiple geophysical techniques (Stoker, 1998). The same lesson is noless true for Mars. In this context, radar sounder data can be relied upon to indicate areas of potentialinterest, and should effectively inform plans for subsequent surface investigations designed to“follow the water.” However, it would not be realistic to view radar sounding as a self-sufficientmeans of sub-surface water exploration.
A potential complication for the detection of groundwater by orbital or surface radar is the likelypresence of super-cooled water within the lowermost kilometer of the cryosphere. Thin films ofliquid water are known to persist on mineral surfaces down to very low temperatures (~250 K)particularly in the presence of freezing-point depressing salts. This means that near the base of thecryosphere, where crustal temperatures increase to within ~20 K of the freezing point, an electricallyconductive and seismically dispersive region may exist that could pose a significant problem forgeophysical efforts to determine the presence and depth of a regional or global groundwater table.

05_Radar_White_Paper_v11.doc 16 04/03/01
4. Mars Orbiting Radar Sounder Design Issues
There will have been no experience with substantial subsurface depth sounding by radar from orbituntil MARSIS begins its mission. Radar sounding from orbit presents many challenges, especiallyunder the circumstances expected at Mars. For example, penetration of the Martian surface to 1 kmor more requires low frequency (very long wave) radiation, yet ionospheric dispersion is more severefor low frequencies than for high, and resolution (both vertically and horizontally) is bounded belowas a function of wavelength. Penetration also requires sufficient per-pulse energy to excite sensiblesignals from layers at depth, yet those same signals generate sidelobes and other self-noise that canmask the desired returns. This section reviews the principal issues, outlines the MARSIS radarsounder on the ’03 Mars Express, and elaborates on selected design constraints and extensions opento the ’05 MRO opportunity.
A. Dispersion
The Martian ionosphere poses a major limitation on low-frequency wide-bandwidth radarobservations of the surface and subsurface. At these frequencies, frequency-dependent propagationdelays (dispersion) will degrade the signal, and compound the task of recovering depth penetrationprofiles. The ionospheric phase delay at frequency f is proportional to
[1 – ( fp/f )2]1/2
where fp is the plasma frequency (Evans and Hagfors, 1968). Clearly, different frequencies sufferdifferent delays, an effect whose severity increases with relative bandwidth, and with proximity ofthe radar’s band to the plasma frequency. These perturbations vary both temporally and spatially overthe planet. The resulting signal distortion can be sufficient to destroy coherent signal processingunless adequately compensated. The plasma cutoff frequency of the Martian ionosphere has beenmeasured to be about 3.0 MHz during daylight illumination, and is expected to be well below 1 MHzat night.
B. Range (Depth) Sidelobes
Traditional ground-penetrating sounders are radars that operate on (or close to) the target surface tomeasure the ranges of a sequence of subsurface layers stacked in depth. Sounding radars usually usesimple short pulses because these have been proven to have minimal sidelobes (Daniels, 1999).Sidelobes can be devastating for sounding radars, primarily because the desired signals come fromdepths from which they suffer attenuation, and thus appear at a distinct disadvantage as they competewith energy in the tails of stronger and less attenuated reflections, usually from the surface. Thetrade-offs between pulse modulation, signal attenuation with depth, and sidelobe levels are the mostchallenging aspects of sounding radar design.
Radar sounding from a relatively high altitude instrument requires that the pulses convey moreenergy than is possible for very short pulses. Hence, the design of orbital radar sounders to date hasbeen heavily influenced by ocean-sensing radar altimetry. In these well-known instruments, long

05_Radar_White_Paper_v11.doc 17 04/03/01
linear fm pulses have been the norm for decades (Raney, 1999). One advantage of a long modulatedpulse is that its large time-bandwidth product (TBP) can be exploited to render very nice range(height) resolution while at the same time preserving relatively large per-pulse energy. Compressionof pulses having large time-bandwidth products requires that the pulse phase modulation must bematched with a precision comparable to 1/TBP. In the event that such precision is not achieved, therange sidelobes in the compressed pulse will increase, and as the mismatch increases the rangeresolution will be degraded. Sidelobes are not of major concern for an altimeter because the rangedepth of the scene is very small. In contrast, sidelobes can be the dominant limiting factor for asounding radar because the equivalent range span of the sidelobes often overlaps the domain fromwhich depth signals are desired. In general, range sidelobe support for large TBP signals is equal tothe duration of the original modulated pulse length. A 250-microsecond pulse length, for example,corresponds to about 25 km in depth of the Martian surface in which sidelobes will exist that aregenerated by reflections from the surface. The principal sidelobe neighborhood shrinks to about 3 kmin depth for a 30-microsecond pulse.
The range sidelobe and resolution problem is compounded at Mars due to ionospheric dispersion.Accurate coherent pulse compression requires detailed knowledge of the modulation of the returningsignals, but their (two-way) propagation through the ionosphere distorts their phase structure. Thus,the end-to-end pulse modulation must be estimated, as it cannot be known a priori. One approach isto use the strong quasi-specular surface return as a reference to map the dispersion properties.Indeed, the (conjugate) surface return could be used as the pulse compression reference signal. Thisapproach is well suited for Mars, for which much of the surface appears to be smooth (quasi-specular) at the long wavelengths to be used for subsurface sounding. Reported results using thistechnique based on simulations are promising (Safaeinili and Jordan, 2000). Although challenging, itshould be possible to match the dispersion characteristic of the ionosphere across signal spectra to atolerance that is comparable to 1/TBP.
In a situation in which very high dynamic range signals (>60 dB) may be in competition, rangesidelobe suppression is a major concern. Sidelobes become important if their power is comparable toor greater than a desired signal that they could overwhelm. Thus, if such a signal is to be observed bya pulse-compression technique, residual sidelobes due to reflections from the Martian surface andthat overlap the desired signals from depth must be suppressed by more than the signal level, plus thedesired SNR margin for reliable detection. This may be difficult to accomplish. For example, in arecent exercise that was designed to test just this question, it was concluded that long linear fm pulsetechniques tend to mask weaker reflections from internal features (Moussessian et al., 2000).
C. Operation Frequency Choice
The radar sounder on MRO should look for a solution that may do a better job responding to thepost-Mars Express requirements. If the objective is higher resolution penetration into the first km,then ~15 MHz should suffice, in contrast to the upper frequency of ~5 MHz of MARSIS. Evenhigher frequencies could be given serious consideration. To first order, under the conditions expectedat Mars, depth penetration is proportional to wavelength, hence inversely proportional to frequency.

05_Radar_White_Paper_v11.doc 18 04/03/01
Given that the MARSIS design has low enough frequency to probe 5-6 km, as designed, then thesame performance should be achieved at 1/5 the depth using a frequency 5 times higher. MARSISClaims penetration of 5-7 km under “nominal” conditions for the lowest band which is centered at1.8 MHz. The corresponding penetration depth for 15 MHz would then be 600-800 m.
There are several non-trivial benefits to the higher frequency. These benefits include:(1) Dispersion. The dispersion problem is much less severe, as can be seen from the phase
delay equation cited in above. Dispersion sensitivity is proportional to the square of theratio of the plasma frequency to the radar frequency. Hence, an increase in frequency by afactor of three decreases the impact of dispersion by nearly an order of magnitude. This isparticularly significant if higher bandwidth/finer resolution is to be achieved.
(2) Percent bandwidth. A given signal bandwidth at a higher carrier frequency implies asmaller percent bandwidth. Although this may appear to be obvious, implementationchallenges should be relaxed. Likewise, the effect of dispersion is proportional to thesquare of the percent bandwidth, to first order. Hence, smaller percent bandwidths implyless sensitivity to dispersion effects.
(3) Antenna. The length of the antennas can be reduced by a factor commensurate with theincrease in frequency. Again, this may be significant for spacecraft design and dynamics.This advantage will be limited, of course, by the lowest frequency required, rather thanthe upper bound.
(4) Cross-track clutter suppression. With shorter antennas, the design may admitconsideration of cross-track interferometric means to suppress off-nadir clutter.
(5) Fresnel diameter. The Fresnel diameter shrinks as the square root of (1/frequency), so afrequency higher by, say, a factor of four would cut the Fresnel zone in half. At 20 MHz,for example, the Fresnel diameter would be about 2.5 km, which is getting closer to themore aggressive along-track resolutions in demand for certain applications.
(6) Doppler enhancements. Doppler frequency increases in proportion to center frequency. Atthe higher frequencies there is more (potentially useful) Doppler structure in a group ofsignals, which could be exploited to improve along-track resolution and soundingperformance under favorable circumstances. Again, one can tailor the processing strategyto the nature of the observed reflections, since the data will be processed on the ground.
(7) Resolution. Whereas resolution in general is inversely proportional to bandwidth, thattheoretical limit is progressively more difficult to meet for large percent bandwidthsignals. Stated alternatively, low frequencies cannot readily support resolutions thatapproach the wavelength of the radar.
On the other hand, there also would be disadvantages to a higher frequency. The principal issuesinclude:
(1) Clutter. Competing clutter signals arise primarily from scatterers that lie off-nadir and tothe side of the sounder’s surface track, and appear at the same radar range as the desiredsignals from depth. Surface slopes having nadir-facing gradients of only a few degrees orless will compete with signals from the top internal kilometer or less. Along-track clutterwill be suppressed by Doppler filtering. In general, off-nadir scattering is due primarily tofeatures whose facets face the radar and have length scales comparable to the illuminatingwavelength. At 15 MHz, which could be considered as an upper frequency bound, thecorresponding free-space wavelength would be 20 meters, in contrast to the longer 60-

05_Radar_White_Paper_v11.doc 19 04/03/01
meter wavelength of 5 MHz radiation. As the wavelength is decreased, the population ofqualifying scatterers may be expected to increase. Furthermore, reflecting facets that tendto face the radar will give rise to larger backscatter. Smaller facets tend to have largermean slopes. In short, higher frequency implies increased clutter.
(2) Ionospheric Correction. Additional clutter will impact ionospheric correction since thesurface return can no longer be considered as the point spread function for the ionosphere.
(3) Signal loss due to surface roughness. At larger wavelength, the surface of Mars behaveslike a well-polished mirror; as the wavelength is shortened, this condition will not holdand as a result both the surface and subsurface reflections will degrade.
(4) For shorter wavelengths, the spacecraft real-time orbit knowledge requirements becomesmore stringent. The orbit knowledge accuracy is critical to on-board data reduction.
(5) Adjacent orbit processing. Shorter wavelength also reduces maximum orbit separation.This could eliminate the possibility of adjacent orbit processing which is needed forclutter reduction.
(6) Penetration depth. The subsurface radio attenuation characteristic is not known. As aresult, a high-frequency radar will be at risk of not meeting its maximum penetrationdepth science requirement. This is particularly of concern since it will not be able tobenefit from the MARSIS science data.
(7) Synergy with MARSIS. A lack of frequency overlap with MARSIS will limit cross-analysis with MARSIS data.
(8) Radar penetration into lossy media in general is proportional to wavelength, all elseequal. However, this fact can be turned to advantage. If the sounder’s objective is the topkilometer rather than five kilometers, a radar whose frequency is, say, three times higherthan it was for MARSIS actually represents a more conservative and robust designapproach.
D. Galactic NoiseThe galactic noise plays an important role in medium and high frequency regime. This noise sourceis significantly stronger than the electronic thermal noise. As a result, the galactic noise will be thelimiting factor on the sensitivity of the radar. The galactic noise will decrease as the operationfrequency increases.
E. Electromagnetic CompatibilityElectromagnetic compatibility between radar and the spacecraft and other science instrument is animportant issue that needs adequate attention. Radars by definition generate large E-fields (impact ofradar on the spacecraft) while requiring an interference-free environment for reception of weaksubsurface echoes (impact of the spacecraft on the radar). Both of these issues need to be addressedand incorporated in the design of the spacecraft.
F. Potentials for Mission Enrichment
The self-noise generated from surface clutter in competition with subsurface signals may arise as alimiting factor. This effect is most likely to be significant for shallow sounding. Further, many areasof interest may lie in relatively rough terrain, such as near crater rims and surface ridges. In such

05_Radar_White_Paper_v11.doc 20 04/03/01
circumstances, the ability of any radar sounder to suppress these unwanted returns will be modest atbest if the data analysis is restricted only to data collected along a single pass of the satellite.
The combination of the nominal MRO ’05 orbit properties and the very long wavelengths requiredby the radar sounder leads to rich potential means of enhanced performance. The candidate strategiesall rely on the availability of data from adjacent orbits. Such data can be processed eitherincoherently, or coherently. Techniques for coherent interferometry have been applied verysuccessfully to large percent bandwidth long-wave radar data (Ulander, 1998). This potential wouldbe best met by a near-repeat orbit plan, rather than the nominal exact-repeat pattern nowcontemplated in the ’05 mission planning.
As a logical extension, data from a sequence of several adjacent orbits could be coherently processedto accumulate an effective 2-dimensional aperture. If correctly organized and constrained, such a“creeping orbit” strategy could be sufficient to support a quasi-holographic downward-looking depthimager. The first-order benefits of this strategy would be unambiguously to suppress cross-trackclutter, and to increase cross-track resolution. Performance would depend on the frequency selected,and on orbit control and knowledge.

05_Radar_White_Paper_v11.doc 21 04/03/01
5. MARSIS and The MRO Sounder
In this section, first a review of MARSIS will be presented in which a brief overview of MARSISdesign will be discussed. Next, the proposed sounder for the MRO will be presented and thepotential improvements over MARSIS will be outlined.
The following comment was prepared as an introduction to a comparison of MARSIS and MRO.The "requirement" that the antenna be aligned across-track for MARSIS is not true for MRO.MARSIS has a much tighter spec on the cross-track antenna pattern so that they could use data fromthe monopole to (partially) cancel clutter from the side. This is not needed on MRO, as there is to beno monopole. IF the antenna were to be aligned cross-track, the 2005 Project had loaded the s/cmass (and cost and risk) budget with more than approximately 16 kg to cover a second degree offreedom in the solar panels. However, this is not needed. The "optimum" configuration would seethe antenna long axis orthogonal to the solar panels. In turn, the s/c always should be oriented suchthat the solar panels fully faced the sun. In addition to simplifying the s/c, there is an added sciencebenefit. This geometry would result in crossing orbits (ascending and descending) to have the samepolarization of the surface/subsurface relative to local features. In response to any lineations, suchalignment would be essential for both clutter cancellation through cross-over analysis, and forgenerating maximal coherence for orbit-orbit interferometry.
A. MARSIS at MarsThe main objective of the MARSIS sounder on Mars Express is to image subsurface features,especially area-extensive layers, to a depth of 5 km with depth resolution of about 100m in situ.(Picardi et al., 2000). MARSIS performance will be constrained by its orbit, and by certain featuresof its design. The Mars Express orbit is highly inclined (~86 degrees) and elliptical, having periapsisheight above the Martian surface of ~250 km, apoapsis height of ~10142 km, and a period of ~6.75hours, from which about 25 minutes are available each orbit for sounder observations. The radarwhen in the subsurface sounding mode below 800 km will utilize a 30-microsecond or a 250-microsecond long linear fm pulse sweeping a 1-MHz bandwidth, centered at 1.8 MHz, 3 MHz, 4MHz, or 5 MHz. One or two of these frequencies will be used at a time, depending on the operatingmode. Rejection of clutter from scatterers spread in Doppler will be accomplished by Dopplerfiltering. Scatterers spread across-track, and hence possibly in range/Doppler competition with thedesired signals from depth, will be partially suppressed by clutter cancellation techniques derivedfrom a second asymmetric antenna pattern. The longer pulse length of 250 microseconds is to becompressed to the equivalent of 1 microsecond after processing, for an effective time-bandwidthproduct (TBP) of 250 (Picardi et al., 2000).
Marsis’s main on-board processing task is reducing the data redundancy and increasing signal SNR.This is achieved by a presumming operation which reduces the data rate by a factor of ~200. Inorder to preserve the doppler information, many of MARSIS operation modes carry out thepresumming operation over 3 or 5 separate doppler channels. The presummed data are thentransmitted to the ground for ionospheric correction and range compression. In addition to thenormal processed data modes, MARSIS has a raw data mode where raw data can be downlinked forselected spots.

05_Radar_White_Paper_v11.doc 22 04/03/01
MARSIS uses two principal strategies to help overcome the range sidelobe problem: the option of ashorter pulse (30 µs), and ground-based (and hence more readily optimized) range-compression. It isexpected that the MARSIS processed signals will have a dynamic range that is less than 50 dB. Thisimplies that the sidelobe suppression requirement is -60 dB relative to the peak at 80 µs delay (~5km depth), under the conditions that the signals from the surface and from depth have the samereflectivity prior to attenuation, and that a 10 dB signal-to-noise ratio (SNR) is desired for reliabledetection of the deeper layer. The main uncertainty that can degrade signal compression accuracy,and hence cause increased sidelobe levels, is ionospheric dispersion. This ionospheric dispersionmust be accurately estimated if an optimized compression algorithm is to be effective. Suchoptimization is more readily achieved if the primary processing is implemented adaptively on theground rather than in autonomous on-board algorithms. A number of factors that were considered indelaying the range compression to the ground-processing stage are given below.
Disadvantages to on-board dedispersion:
1. Due to the real-time nature of the on-board processing, the estimation of the ionosphere can notbe accurate enough to suppress the sidelobes effectively.
2. Any on-board correction would be unknown unless the ionosphere dedispersion information isdownlinked at the cost of reducing the science data rate by a factor of 2.
Advantages to range compression during ground processing:
1. Higher quality range-compression at no cost to the science data rate.2. Ionospheric information is contained in the surface return which would have been discarded
during on-board processing (a secondary science value at no cost).
More details on the MARSIS design may be found in the Appendices 2 and 3.
B. The Radar Sounder on MRO
The nominal orbit being considered for the ’05 orbiter is similar in latitudinal coverage to that ofMars Express, having an inclination of 93 degrees. The similarity ends there, however. The ’05baseline orbit is to be circular at 400 km height above the mean surface, and sun-synchronous with aperiod of about 118 minutes. These facts have profound beneficial impact on the design of a newgeneration of radar sounder. The lower mean altitude of MRO means that the radar’s transmittedenergy will be stronger at the surface by as much as four times that available from the Mars Expressorbit, which should translate into better depth penetration and subsurface imaging. In contrast toMARSIS, the ’05 sounder has the freedom to concentrate its observations on the dark side of theplanet (spacecraft resources permitting) which will allow lower radar frequencies, which in turn willmaximize surface penetration. Increased distance between the radar’s mean frequency and theplasma cutoff frequency will help to minimize ionospheric signal perturbations. Because of thereduced spacecraft velocity of MRO over the surface, greater integration time will be available,which can be exploited to reduce end-to-end data rate, and to increase the quality of the deriveddepth profiles. Furthermore, the ’05 orbit period is about one-quarter that of MARSIS. Thus, asounder on MRO will be able to collect subsurface data approximately ten times more rapidly than

05_Radar_White_Paper_v11.doc 23 04/03/01
MARSIS. Not all of this potential can be realized, however. The average science data rate fromMRO will be only about three times larger than that of Mars Express.
Several design concepts have been identified for a second-generation radar sounder for MRO thatpromise to provide performance enhancements in comparison to MARSIS. These concepts areexplored in more detail in section 5.
C. A Radar Sounder for MRO (ASI)
Given the nominal characteristics of the 2005 mission, one can envisage an instrument to supportinvestigations that complement the results of MARSIS. Note that MARSIS was designed beforeMGS data were obtained and interpreted. Likewise, its scientific requirements were established onthe basis of knowledge of Mars at that time (Picardi et al., 2000). The then dominant constraint wasthat the depth of the cryosphere bottom was large, ranging from 2.3 km at the equator to 6.5 km atthe poles (see for example Water on Mars, by M. Carr -Chapter 2 and discussion therein). Themodels also suggested that the hydrosphere could be at even greater depth, depending on choice ofmodel key parameters, such as layer thermal conductivity and thermal inertia, porosity andgeothermal gradients. On the basis of that knowledge, the MARSIS radar was designed with theprimary objective to map the distribution of water, both liquid and solid, in the upper portions of thecrust of Mars, assuming that the nominal depth of the melting isotherm ranges in the range 0 m -5000 m (Picardi et al., 1999). The results gathered by MARSIS should provide unprecedentedknowledge of a planet at broad regional level, and will be extremely important for the reconnaissanceof large and well-defined ice and water reservoirs.
The new knowledge developed thanks to MGS indicates that sedimentary processes are morecomplex than anticipated before, and that they are possibly related to the water history on Mars.Moreover some of the MOC images seem to indicate the presence of shallow ice/water reservoirs.Given the comparative maturity at this time of our insight into the likely Martian subsurfacestructure, one can surmise certain limitations in the MARSIS design. These may become evidentparticularly when sounding regions where the interface between desiccated regolith and permafrostand/or permafrost and aquifers is not sharply defined, but rather shows a gradual transition. Anotherpotential limitation of MARSIS is related to the difference between horizontal and verticalresolutions. For example, at 250 km (the Mars Express periapsis altitude), the horizontal resolutionwill be about 5 km x 10 km, while the vertical in situ resolution is designed to be 50 m - 100 m,depending on material dielectric properties. These resolutions are relatively coarse, which can makethe correlation between the surface geomorphology and the radar reconstructed stratigraphy quitecomplex.
Our understanding of the Martian near-subsurface would be improved with more detailedinformation of the upper several hundred meters of the Martian crust than MARSIS is able toprovide. Better differentiation of the physical features of the crust would be achieved throughdeconvolution, and with finer resolution. Post-detection deconvolution would help to suppressextraneous surface scattering and certain aspects of signal self-noise. Correctly implemented, thiswould improve estimates of the dielectric constants derived from the sounding profiles, and thusprovide better characterization of the physical nature of deeper subsurface interfaces. An instrument

05_Radar_White_Paper_v11.doc 24 04/03/01
able to penetrate a few hundreds of meters below the surface with a finer horizontal resolution and avertical resolution (on the order of 10 m - 20 m) would help to achieve these objectives. Moreoversuch an instrument should provide a unique insight into the Martian stratigraphy at scalescomparable to those of optical images, thus offering a tremendous improvement in the understandingof sedimentary processes and recent geologic activity.
For the previous reasons a second generation radar sounder for the ’05 MRO mission might bedescribed by the following high-level parameters:
Penetration Depth: 300 m –1000 mVertical Resolution 10-20 mHorizontal resolution 300 m-1000 m
These numbers suggest that more emphasis should be placed on the higher frequency bands than areavailable on MARSIS, and that a wider bandwidth signal must be used.
D. Marrying Objectives and Constraints
Prior to introducing alternative concepts for subsurface imaging at Mars, it is helpful to take note ofcertain considerations that are likely to dominate the measurement environment. First, the relativelylong free-space wavelengths (60 m to 300 m) required to achieve useful penetration imply that theprincipal mode of reflection will be coherent from nominally horizontal quasi-smooth layers, eitherat the surface or below. In this context, “quasi-smooth” means that the surface has mean verticalvariations of less than about one-tenth of the illuminating wavelength (in situ). The reflected powerfrom such surfaces goes only as 1/R2 (where R is the total effective range from the radar to thesurface), as opposed to 1/R3 or 1/R4 for quasi-rough or isolated scatterers, respectively. Thus, thesmoother layers will dominate. This implies that the spatial resolution that any radar might achievewill be limited below (for such surfaces) by their effective area, for which the Fresnel diameter is areasonable approximation. (Fresnel diameter is proportional to the square root of wavelength.) Towithin a factor of two or so, the Fresnel diameters seen from a radar at 400 km altitude vary fromabout 5 km (at 5 MHz) to about 11 km (at 1 MHz). Attempts to achieve along-track spatialresolution below these numbers in general will be fruitless for such features. Therefore, a reasonableradar design will take advantage of all means of signal averaging and integration subject to aneffective data posting upper bound of about 5 km along track, at the surface. This characteristicmakes sense from an applications viewpoint as well, since larger (potential) bodies of ice or waterlayers should have more significance than smaller ones.
Second, although it makes sense for the sounder design to be influenced primarily by extensivequasi-smooth surface features, the instrument also should support higher-resolution imaging alongtrack. If the sounder is operated coherently, then there will be a trade-off between coherent andincoherent pulse-to-pulse integration. The principal strategies and benefits of these options have beendemonstrated using radar sounder data from the Greenland ice sheet (Raney, Gotwols, and Jensen,2000). The trick is to strike a balance between initial pulse-to-pulse coherent integration (pre-summing), and parallel Doppler processing with partially coherent integration (Raney, 1998).Parallel Doppler processing is less effective for quasi-smooth layers than for more spatiallydifferentiated scatterers.

05_Radar_White_Paper_v11.doc 25 04/03/01
Third, there is an inherent trade-off between penetration and depth resolution. Unless aninterferometric measurement is undertaken, wavelength establishes the effective lower bound ondepth resolution. Penetration is favored by longer wavelength (lower frequency), whereas the latter isfavored by shorter wavelength (higher frequency). For reference, note that the shortest wavelengthused by MARSIS is about 60 m in free space, or on the order of 24 m in situ. Now it is notreasonable to assume that layers of interest will always lie deeper on the dark side of the planet,where they would be relatively open to long-wave probing. Likewise, it is not reasonable thatclosely-nested layers nearer to the surface should lie always on the solar side of the planet. Onestrategy would be to probe the surface with a signal that can elicit useful data either from depth orwith finer depth resolution. This objective can be met with a signal comprising a full span offrequencies (say 1.3 MHz – 5 MHz), or by designing a coverage strategy that would emphasize eitherdepth or resolution, depending on solar illumination.
Due to the ionospheric dispersion, high quality profiles require intensive and adaptive signalprocessing. This is best accomplished on the ground, subject to the constraints of science down-linkdata rate. On-board signal processing should be exploited to reduce the data rate and volume, but atno loss of science value. If computational resources permit, selected depth profiles should begenerated on-board. These should be included in the data telemetry, and would serve as near-real-time confirmation of radar sounder mode and operation. The above is essentially the MARSISapproach.
05_Radar_White_Paper_v11.doc 26 04/03/01
6. Second Generation Radar Sounder Design Options
There are several options available that would enhance a radar sounder’s capabilities at Mars. Theseinclude variations on the MARSIS design (Section A), alternative waveform designs such as theStepped Frequency Modulation (Section B), a Ricker Wavelet Modulation (Section C), or an InverseDispersion Waveform (Section D), and a High Frequency Surface Penetration approach (Section E).An outline of a conceptual approach from the IAS (Italy) is alsosummarized (Section F). In all cases,the design should make full use of available power, both in the instrument design and in the signalprocessing algorithms. The main message of this section is to illustrate concepts through which asecond generation radar sounder can be implemented that would provide sounding data from the ’05opportunity that would (1) be responsive to the MRO science requirements, and (2) providesignificant science data beyond those expected from MARSIS.
A. MARSIS Heritage Sounder
This option builds on MARSIS heritage but makes appropriate modifications to improve shallowsounding performance. One requirement for shallow sounding is finer vertical resolution, whichrequires a larger bandwidth. Although MARSIS spans a bandwidth of 4 MHz, those bands are notcontinuous nor are they easily combined to achieve larger effective bandwidth. One could design aradar with multiple bands similar to MARSIS, but which overlap, and provide for near-simultaneousoperation. For example, there could be a total of four bands each with a 1.3 MHz bandwidth,covering from the lowest frequency at 1.4 MHz to 6 MHz with band overlaps of 0.2 MHz. Bandoverlap would help to maintain cross-band calibration and frequency continuity.
Two distinct operation modes could be supported: shallow sounding mode (surface to 1 km), anddeep sounding mode (surface to 5 km). This radar would operate with full bandwidth at the shallowsounding mode and at reduced bandwidth at the deep sounding mode.
A variety of pulse patterns can be considered. In one pulsing scheme, a single fixed PRF (pulserepetition frequency) is assumed. However, the pulsing pattern within the PRI (pulse repetitioninterval) can be changed depending whether the operation is in the deep or the shallow mode. In thedeep sounding mode, within a given PRI two longer chirps are transmitted with an effectivebandwidth equivalent to one or two bands depending whether pulse 1 and 2 are from the same bandor different bands. In the shallow sounding mode, there are four shorter chirps covering all or asubset of bands. This mode will have the highest possible system bandwidth.
The PRF is selected such that there is only one set of pulses in transit at a given time. This will meanthis design will have a PRF of few hundred Hz (200-300) depending on the orbit altitude. In order toimprove signal-to-noise ratio (SNR), the total transmitted energy is maximized by increasing thechirp length to the maximum allowed.
05_Radar_White_Paper_v11.doc 27 04/03/01
Based on the lowest band frequency selection for this example, an optimum antenna length is about60 m . The antenna length may be reduced by increasing the radar operating frequency. It is alsopossible to reduce the antenna length at the expense of the antenna radiation efficiency at the lowestfrequency band. Another problem facing the proposed sounder is a relatively large bandwidth tocenter-frequency ratio which is in the range of 30% to 100%. Achieving a uniform high radiationefficiency across the band is a difficult engineering challenge. One means of partially avoiding thisproblem is to have four dipoles, one for each of the four center frequencies. Such an antenna couldbe implemented with four wires, all of which could be supported in one radio-transparent tube.
A more detailed discussion of this design is presented in Appendix 4.
B. Stepped Frequency Modulation
It has been recognized for many years in the field of ground-penetrating radar (GPR) that thepreferred approaches avoid sidelobe generation. If energy budgets allow, a simple short pulse hasbeen proven to be most effective, the so-called brute strength method. An alternative is to transmitthe spectrum that corresponds to a short pulse. One means of doing this that has proven to be verysuccessful in the field of GPR is the so-called stepped frequency technique (Izuka et al., 1984 ).
The stepped frequency technique would appear to be well-suited to the constraints to be encounteredat Mars. The concept may be visualized as transmitting a discrete Fourier transform of a short pulse,which appears as a family of N continuous wave (quasi-cw) burst transmissions, each at a differentfrequency. In this sense, the stepped-frequency approach is the dual in transform space of the shortpulse. Design principles for this class of radar are well known (Wehner, 1995). The general schemeis to transmit a sequence of quasi-cw bursts that are uniformly separated in frequency. In a dispersiveenvironment, it makes sense to sweep from higher to lower frequencies so that the effects ofdispersion would increase the time separation between cw samples, rather than to crowd or overlapthem in time. Resolution is limited by the inverse of the bandwidth spanned by the transmittedfrequencies, and the unambiguously imaged range interval (scaled by the in situ propagationvelocity) is determined by the inverse of the difference between transmitted frequencies. In a step-frequency radar, the frequency step (δf) determines the unambiguous range, and the product N δf setsthe total signal bandwidth, hence establishing the range resolution. In effect, the stepped frequencyapproach is a discrete version of linear fm encoding. The stepped-frequency approach accommodatesalternative Doppler processing strategies very readily, and can be configured to support along-trackresolutions from 5 km to less than 1 km, as the surface situations warrant.
As with any large TBP approach, imperfections in matched signal coherence can lead to increasedside-lobes. However, these side-lobes can be controlled more effectively in a stepped-frequencysystem than those of a long linear fm modulation technique because the dispersion estimationalgorithm can rely on a discrete set of known quasi-cw tones rather than a continuous spectrum. Theeffects of dispersion in either the antenna or the ionosphere can be estimated by measurementsderived from the first-surface return, similar to the scheme to be used for MARSIS data. In thestepped-frequency case the relative propagation delay at each discrete frequency can be observedindependently, which should support more accurate results than are possible from a chirp signal. The

05_Radar_White_Paper_v11.doc 28 04/03/01
objective is to shift the time-reference for each of the cw constituents such that their relativecoherence (phase registration) is restored.
C. Ricker Wavelet Modulation
As has been appreciated for many years, radar sounding is far better served by unity time-bandwidthproduct short pulse modulations that can be detected in simple time sequence, than by longer codedpulses that require correlation techniques for their transformation into time-resolved waveforms(Daniels, 1999). A short pulse approach is an obvious design that might be considered for a Martianradar sounder. However, there are two disadvantages to a straight-forward approach. First, and mostobvious, much less energy can be packed into a short pulse than a long one. For example, a 1-microsecond pulse of the same peak power as a 30 microsecond pulse would be 30 times lessenergetic, which would imply about a 14 dB disadvantage in detection SNR. However, if the peakpower of the shorter pulse could be increased, the trade-off would be less severe. In the event,therefor, that there were excess peak power available, and that the dominant performance constraintwas self-clutter from sidelobes and the like, then a simple short pulse radar sounder would qualify asa candidate solution.
However, at Mars there is a second and more substantive consideration: the effects of dispersion. If ashort pulse were radiated by the radar, after two-way propagation its constituent frequencies wouldbe spread out, effectively broadening the pulse. For example, more than 30 microseconds ofdifferential delay may occur across the bandwidth of a moderate-resolution pulse (Safaeinili andJordan, 2000). Thus, a 1-microsecond transmitted pulse after perfect flat-surface reflection would betransformed into a ~30-microsecond received pulse, which would defeat the purpose of the shortpulse paradigm.
The Ricker wavelet, which is a special shape of the short pulse paradigm, has been shown to havefavorably low sidelobes, especially in application to radar sounding into a lossy medium (Daniels,1999). However, the ionospheric dispersion would prevent a Ricker wavelet from being used, justlike any other short pulse scheme. There is an alternative, however. Combine the step-frequencyapproach and the Ricker wavelet approach. In effect, the radar’s signal would consist of a sequenceof the weighted discrete frequency components of the spectrum of a Ricker wavelet.
D. Inverse Dispersion Modulation
There is a special case of signal modulation that would take advantage of the dispersivecharacteristics of the ionosphere. The pulse frequency modulation could be adapted to the dispersioncharacteristics observed in real time. There are two aspects to this concept: (1) dispersion estimation,and (2) signal modulation. Dispersion can be estimated from the spectral distribution imposed upon asimple short pulse transmission. The radar would transmit a sequence of short probing pulses,followed by a sequence of coded pulses whose modulation would be adapted to the prevailingdispersive environment. The technique requires sufficient on-board processing power to implement aspectral analysis of the received probing pulses, whose output would control the modulation to be

05_Radar_White_Paper_v11.doc 29 04/03/01
applied to the signal generator for the depth sounding pulses. The short probing pulses would giverise to surface reflections that would be sufficient to estimate the two-way propagation dispersionproperties. Spectral analysis would consist essentially of a Fourier transform of the envelope of theaveraged surface returns from the short pulses.
Once the dispersion was characterized, the radar signal generator would then use the frequencycharacteristic to create the desired signal modulation. At this point there are two options. Oneobvious choice is to generate a signal modulation that is the inverse of the ionospheric dispersion.Thus, the received pulses would be compressed naturally following their two-way propagation. Thishas the disadvantage of requiring that the receiver have a very large dynamic range. There also mayremain sidelobe interference problems, since the pulse as it probes the surface will in general havetime-bandwidth product greater than unity. Although an obvious possibility, this method is notnecessarily the best available.
The alternative modulation strategy would be to program the pulse modulation to match the inverseof one-way propagation. Thus, each probing pulse in effect goes through a matched pulsecompression filter as it propagates to the surface. Assuming reciprocity, the one-way dispersioncharacteristic is in effect a frequency scaling (by one half) of the two-way dispersion. As a result ofthe one-way inverse dispersion modulation, the surface would be illuminated by true short pulses.The signals from the surface and from depth returned to the radar would be dispersed by the returnpath through the ionosphere. The principal advantages of this approach are that the system dynamicrange requirements would be less than for the two-way inverse dispersion modulation, and that thesidelobe problem should be categorically minimized relative to all other options. One disadvantageof this approach may be the reduction in the science data rate by a factor of two since it is necessaryto down-link the variable transmitted chirp along with the radar data for each frame.

05_Radar_White_Paper_v11.doc 30 04/03/01
7. Science Objectives versus Radar Sounders
As summarized in Table 1, some of the 22 specific itemized subsurface science objectives describedabove in Section 3D will be met by MARSIS, but others will not. Many of those that may not be wellmet by MARSIS would be better served by a suitable Second Generation instrument. The discussionthat follows elaborates on the specific items enumerated in the table.
Table 1. Summary of science questions related to radar sounding.Capability to Address Science Questions
MARSIS 2nd Gen. RadarQuestion # Link to MEPAG
HierarchyShallow
(<1000 m)Deep (>1000
m)Shallow
(<1000 m)Deep (>1000
m)
Saturated/Unsaturated Frozen GroundD1-I IA-1, IIA-1, IIIA-1, IVA-3 3 2 1 1D1-ii IA-1, IIA-1, IIIA-1, IVA-3 3 2 1 1D1-iii IA-1, IIA-1, IIIA-1, IVA-3 3 2 1 1D1-iv IA-1, IIA-1, IIIA-1, IVA-3 3 3 3 3Massive Bodies of Segregated Ground IceD2-I IA-1, IIA-1, IIIA-1 2 2 1 2D2-ii IA-1, IIA-1, IIIA-1 2 2 1 2D2-iii IA-1, IIA-1, IIIA-1 2 2 1 1Liquid WaterD3-I IA-1, IIA-1, IIIA-1, IVA-3 2 1 1 1D3-ii IA-1, IIA-1, IIIA-1, IVA-3 2 NA 1 NAD3-iii IA-1, IIA-1, IIIA-1, IVA-3 NA 3 NA 2D3-iv IA-1, IIA-1, IIIA-1, IVA-3 NA 3 NA 2Polar Layered DepositsD4-I IIIA-1 3 2 1 2D4-ii IIIA-1 3 3 1 3D4-iii IIIA-1 3 3 2 3D4-iv IIIA-1 2 1 1 1D4-v IIIA-1 3 2 1 2Gas Hydrates and Liquid CO2D5-i IIIA-1 3 2 1 2Local and Regional Variations in Crustal Lithology and StructureD6-i IIIA-6 2 2 1 2D6-ii IIIA-6 2 2 1 2
Ratings scale: 1 = high, 2 = medium, 3 = lowAssumptions in ranking capabilities of MARSIS and 2nd generation sounder to address science questions:
1. MARSIS performs reasonably close to its design.2. The 2nd generation sounder has the following improvements over MARSIS: high resolution shallow subsurface
capability, and better global coverage due to a better orbit.3. The 2nd generation sounder has a deep sounder mode at least as capable as MARSIS.
For convenience, abbreviations are used in the following comaprisons. These are:MS=MARSIS shallow, MD=MARSIS deep, 2S=2nd generation shallow, 2D=2nd generation deep.

05_Radar_White_Paper_v11.doc 31 04/03/01
1. Saturated/Unsaturated Frozen Ground:i. How does the depth of desiccation vary geographically?This is assumed to be mostly a shallow phenomenon, so MS is low. Ice and rock are difficult to
distinguish, so MD is medium. 2S is high due to shallow location. 2D is high due to bettergeographic coverage.
ii. How does the saturation state of the crust vary stratigraphically and geographically beneaththe shallowest occurrence of ground ice?
Basically the same argument as above, although the question may need to be rephrased (“theshallowest occurrence”) to keep the deep capability relevant.
iii. How large is the variability of both of the above at m- to km- size scales?Same as above, though 2D and 2S get extra points for being higher resolution.
2. Massive Bodies of Segregated Ground Icei. Is there evidence of massive bodies of segregated ground ice, resulting from the ponded
discharge of the outflow channels or the presence of an ancient ocean, in the northernplains?
The only 1 on this one is for the 2S, if the bodies are thin and near the surface. Others are 2because ice vs. rock is hard for any radar to distinguish.
ii. Can such deposits be identified within/beneath large impact basins/craters?Same reasoning as above.iii. If so, what is the depth/distribution of these ice bodies?An extra point for 2D for better geographic coverage.
3. Liquid Water:i. Is there a water table on Mars and, if so, what is its three dimensional configuration?These radars are optimized to detect water, and if water is there they should see it. So all get a 1,
except MS, since precise depth determinations are difficult for MARSIS in the first few 100m, compared to a higher resolution sounder.
ii. Do hydrothermal or other near-surface reservoirs of liquid water/brine exist? If so, what istheir spatial distribution?
Similar reasoning here, limited to shallow depths.
4. Polar Layered Deposits:i. What is the thickness, extent and continuity of the layers within the polar deposits?PLD layers are thin, so MARSIS won’t be able to say much in the shallow zone. Neither radar
may be able to do this at depth, but there won’t be much difference between the two.ii. Is there geophysical evidence of prior variations in vertical and areal extent?I don’t see how a radar sounder addresses this one.iii. Is there evidence of flow in the internal structure or other characteristic of the caps?This wil be very hard to see. It implies deformation, which means non-horizontal layers. The
orbital sounding geometry is not conducive to such structure. I suppose if you saw thereflections from flat layers disappear in some areas...but this could be due to other effects.
iv. Is there evidence of past or present basal melting or basal lakes?

05_Radar_White_Paper_v11.doc 32 04/03/01
Present basal melting should jump out at you. Maybe the shallow categories should be “NA” forthis one, since its too cold within 1 km.
v. Are there peripheral ice deposits that may have been associated with local discharges ofsubpolar or subpermafrost groundwater?
This one is similar to the “frozen ground” questions above.
5. Gas Hydrates and Liquid CO2:i. What is the 3-dimensonal distribution/concentration of gas hydrates and liquid CO2 in the
crust?Neither radar has an advantage in distinguishing CO2 from other materials, so I treat it the same
as frozen ground.
6. Local and Regional Variations in Crustal Lithology and Structure:i. What is the 3-dimensional tectonic, volcanic and sedimentary structure of the crust?Even though it’s way down the list, this may turn out to be the most important kind of data we
get. There could be strong contrasts at shallow depths, so MS still would see them, just not athigh resolution – so it gets a 2 not a 3.
ii. How does the porosity of the crust vary geographically and at depth?Not going to be easy to separate this out from other effects. Porosity, composition and pore-
filling material can all trade off one another to make variations in dielectric constant. Wentwith the default 2212.

05_Radar_White_Paper_v11.doc 33 04/03/01
8. Engineering constraints on addition of a radar sounder to ’05Orbiter
There is not a baseline mapping orbit design for the Mars '05 Orbiter per se.We do have a strawman mapping orbit under consideration –
General Characteristics:- Sun-synchronous with an equatorial crossing time of 3:00 PM local mean solar time (LMST)
(This implies a polar inclination of around ~93 deg)- Near circular at an altitude of around 400 km (e.g. 375 km by 425 km, 350 km by 450 km). We
are assumming a repeating groundtrack will be required and would derive the repeat parametersbased upon science requirements. Within the range of altitudes we are considering, there the arenumber of options.
- We are also considering orbits with lower altitudes (e.g. 200 km x 400 km, 200 km x 200 km)The repeat cycles for these orbits are more limited. (For various reasons, I personally do nobelieve that we could fly a 200 km circular orbit but we are keeping the option open until we canevaluate it.)
- Assumptions on daily average data volume: Average data rate for the first 1.5 years of themission is 20 gigabits/day, and this instrument would get 10% of that. Average data rate for thesubsequent year is 60 gigabits/day, and we would get 30% of that.
period - 117 minutessun-synchronous93 degree inclination
9. Technology R&D needsWe believe technologies to implement a dual-mode radar already exist, but there is a need for ashort technical study to determine an optimum radar configuration including signal processingalgorithms.
We believe technologies to implement a dual-mode radar already exist, but there is a need for a shorttechnical study to determine an optimum radar configuration including signal processing algorithms.Space-qualified technology for implementing a radar with sub-band chirp readily exists. Synthesizersand arbitrary waveform generators for producing a variety of transmitter waveforms have beendeveloped for military and civilian applications. These can be readily adopted for implementing adual-mode radar that operates in step-frequency mode for shallow sounding and chirped mode fordeep sounding of Martian soil. However, many of these latest waveform generation technologiesmay not be space qualified and research to space qualify these may be required. Also a detailedtechnical study of antenna configuration for sub-band chirp radar must be conducted to determine theeffect of unused elements on the radiation pattern of the element being used for transmission andreception.

05_Radar_White_Paper_v11.doc 34 04/03/01
10. References
Clifford, S. M., 1993. A model for the hydrologic and climatic behavior of water on Mars, J.Geophys. Res. 98, 10,973-11,016.
Clifford, S. M., 1998. Mars: The effect of stratigraphic variations in regolith diffusive properties onthe evolution and vertical distribution of equatorial ground ice, Lunar Planet. Sci. Conf.XXVIII.
Clifford, S. M. and T. J. Parker, 2000. The evolution of the Martian hydrosphere: Implications forthe Fate of a primordial ocean and the current state of the northern plains, Icarus, in press.
Daniels, D. J., 1999. Resolution of Ultra-Wideband Radar Signals, IEE Proceedings – Radar, SonarNavigation, 146 (4), August, 189-194
Evans, J. V. and T. Hagfors, 1968. Radar Astronomy, McGraw-Hill, New York.
Fanale, F. P., 1976. Martian volatiles: Their degassing history and geochemical fate. Icarus, 28,170-202.
Farmer, J. D., 1996. Hydrothermal processes on Mars: An assessment of present evidence, in:Evolution of Hydrothermal Ecosystems on Earth (and Mars?), G. Brock and Jamie Goode(eds.), 273-299.
Fisk, M. R. and S. J. Giovannoni, 1999. Sources of nutrients and energy for a deep biosphere onMars, J. Geophys. Res., 104, 11805-11815.
Hoffman, N. 2000. White Mars: A new model for Mars’ surface and atmosphere based on CO2,Icarus 146, 326-342.
Izuka, K., A.P. Freundorfer, K.H. Wu, H. Mori, H. Ogura, and V.K. Nguyen, Step-frequency radar, Journal of AppliedPhysics, vol. 56, no. 9, pp. 2572-2583, 1984.
Jakosky, B. M., B. G. Henderson and M. T. Melon, 1995. Chaotic obliquity and the nature of theMartian climate, J. Geophys. Res. 100, 1579-1584.
Kargel, J. S., K. L. Tanaka, V. R. Baker, G. Komatsu, and D. R. MacAyeal, 2000. Formation anddissociation of clatherate hydrates on Mars: Polar caps, northern plains, and highlands, LunarPlanet. Sci. Conf. XXXI, CD-ROM, Abstract #1891.
Komatsu, G., J. S. Kargel, V. R. Baker, R. G. Strom, G. G. Ori, C. Mosangini, and K. L. Tanaka,2000. A chaotic terrain formation hypothesis: Explosive outgas and outflow by dissociationof clathrate on Mars, Lunar Planet. Sci. Conf. XXXI, CD-ROM, Abstract #1434.
Kuzmin, R. O., 1983. Cryolithosphere of Mars, 140 pp., Izdatel’stvo Nauka, Moscow.

05_Radar_White_Paper_v11.doc 35 04/03/01
Laskar, J. and P. Robutel, 1993. The chaotic obliquity of the planets, Nature 361, 608-612.
Malin, M. C. and K. S. Edgett, 2000. Evidence for recent groundwater seepage and surface runoffon Mars, Science 288, 2330-2335.
Max, M. D. and S. M. Clifford, 2000. The state, potential distribution, and biological implications ofmethane in the Martian crust, J. Geophys. Res. 105, 4165-4171.
Miller, S. M. and W. D. Smythe, 1970. Carbon dioxide clathrate in the Martian ice cap, Science 170,531-533.
Milton, D. J., 1974. Carbon dioxide hydrate and floods on Mars, Science 183, 654-656.
Moussessian, A., R. L. Jordan, E. Rodriguez, A. Safaeinili, T. L. Akins, W. N. Edelstein, Y. Kim,and S. P. Gogineni, 2000. A New Coherent Radar for Ice Sounding in Greenland,Proceedings IEEE International Geoscience and Remote Sensing Symposium IGARSS2000,Honolulu, HI, July, 0-7803-6359-0/00, 484-486.
Noon, D. A., 1996. Stepped-Frequency Radar Design and Signal Processing Enhances GroundPenetrating Radar Performance, PhD Thesis, University of Queensland, Queensland,Australia, January.
Picardi et al., 1999. Mars Advanced Radar for Subsurface and Ionosphere Sounding (MARSIS),Technical Report Info-Com.
Picardi et al., 2000. MARSIS Experiment: Design and Operations Overview, Eighth InternationalConference on Ground Penetrating Radar, SPIE 4084, 228-233.
Raney, R. K., B. L. Gotwols, and J. R. Jensen, 2000. Processing Strategies for Doppler-ResolvedRadar Ice Sounding Data, Proceedings, IEEE Geoscience and Remote Sensing Symposium,Honolulu, Hawaii, (CD-ROM), IEEE 00CH37120C, 24-28 July.
Raney, R. K., 1999. Radar Altimetry, Vol. 17, Wiley Encyclopedia of Electrical and ElectronicsEngineering (J. G. Webster, ed), John Wiley & Sons, New York, 547-560.
Raney, R. K., 1998. The Delay/Doppler Radar Altimeter, IEEE Transactions Geoscience andRemote Sensing, 36 (5), 1578-1588
Rossbacher, L. A., and S. Judson, 1981. Ground ice on Mars: Inventory, distribution, and resultinglandforms, Icarus 45, 39-59.
Safaeinili, A. and R. L. Jordan, 2000. Low Frequency Radar Sounding Through Martian Ionosphere,Proceedings IEEE International Geoscience and Remote Sensing Symposium IGARSS2000,IEEE 0-7803-6362-0/00, July.

05_Radar_White_Paper_v11.doc 36 04/03/01
Sloan, E. D., Jr. 1997. Clathrate Hydrates of Natural Gases. Marcel Dekker, Inc., New York andBasel, 730 pp.
Stoker, C., 1998. Summary of the NASA Ames Mars Deep Water Sounding Workshop,http://astrobiology.arc.nasa.gov/workshops/1998/marswater/index.html.
Touma, J. and J. Wisdom, 1993. The chaotic obliquity of Mars, Science 259, 1294-1296.
Ulander, L. M. H., 1998. Ultra-Wide SAR Interferometry, IEEE Transactioins on Geoscience andRemote Sensing, 36 (5), 1540-1550.
Wallendahl, A. and A. H. Treimann, 1999. Geochemical models of low-temperature alteration ofMartian rocks, Lunar Planet. Sci. Conf. XXX, Abstract #1268, Lunar and Planetary Institute,Houston (CD-ROM).
Wehner, D. R., 1995. High-Resolution Radar, Second Edition, Artech House, Boston.

05_Radar_White_Paper_v11.doc 37 04/03/01
Figure 1.

05_Radar_White_Paper_v11.doc 38 04/03/01
Figure 2.

05_Radar_White_Paper_v11.doc 39 04/03/01
Figure 3.

05_Radar_White_Paper_v11.doc 40 04/03/01
Figure 4.

05_Radar_White_Paper_v11.doc 41 04/03/01
APPENDIX 1: Charter ( November 4, 2000)
A Mars radar sounding team will be formed to produce a white paper with analysis andrecommendations on the three questions posed below. We would like to launch this team ASAP,and request that they complete their work by the end of December. The information is needed asinput to decision-making related to the ’05 Orbiter. If possible, advice on the fourth question belowwould also be appreciated.
Proposed team:Prasad Gogenini [email protected] Raney [email protected] Grant [email protected] Safaeinili [email protected] Plaut [email protected] Clifford [email protected] W. Beaty [email protected]
The questions:1. Is there scientific value in placing a subsurface radar sounding instrument on the '05 Orbiter?
a. Assuming MARSIS delivers data in '03 as designed, what can we do that would offer anincremental step forward? (The '05 Orbiter will be in a different orbit than Mars Express, and themass and power allocations may be different.) Would there be significant value in improving thedeep sounding, in achieving finer resolution in the shallow region, or any other purpose? Is theincremental value enough that the scientific community will accept it?
b. Assuming MARSIS fails to deliver any data, what would we recommend for '05?c. Since we won't have an answer to the success/failure of MARSIS before a commitment to a
design of the '05 mission needs to be made, can the answers to the above two bullets besynthesized into a single recommended course of action?
2. If a recommendation is made for an '05 radar sounder, what are possible requirements andconceptual designs?
3. Can we put a sounder on the '05 Orbiter without significantly impacting the design of thespacecraft? This will involve discussions with Jim Graf.
Extra question (if you have time)4. Are there any approaches to ground-based sounding from the martian surface in 2007 that would
effectively complement orbital sounding? Is there a technique (GPR, E-M sounding, etc.) thatwould add value locally assuming that MARSIS shows us something?

05_Radar_White_Paper_v11.doc 42 04/03/01
APPENDIX 2: Capabilities of the MARSIS Radar Sounder
(from Mars Express proposal, February, 1998)
Note: The text below is directly quoted from the proposal document, with the exception that thefigures and equations have been omitted. The instrument referred to below as SSRA is now knownas MARSIS.
Resolution, Coverage and Data ContentThe SSRA will operate in a continuous mode at all available opportunities when the Mars Expressspacecraft is within 800 km of Mars. During each orbital pass, a swath of echo profiles will begathered with a footprint size at the surface of approximately 5 by 10 km, and a footprint spacingalong-track of 5 km. After about 2000 non-repeating orbits, the swaths result in full global coverage,contiguous at the equator and with substantial overlap at higher latitudes.
The flexibility in operating frequency of the instrument will allow optimization of the observationparameters depending on the conditions of the Martian environment. Data will be acquired in at least2 frequencies at any given time. The nominal subsurface sounding mode will use frequencies of 3.8MHz and 4.8 MHz during dayside operations and 1.9 MHz and 3.8 MHz during nightsideoperations. A third frequency of 2.8 MHz will be available for nightside operations, if such use ofthe four processing channels is deemed useful. The signals will be transmitted and processed with abandwidth of 1 MHz, which will provide a vertical (depth) resolution equivalent to 150 m in freespace. This resolution will correspond to a finer scale within the subsurface due to the difference inrefractive index; nominal vertical resolution for the expected materials is about 50-100 m.
Received signals will be digitally sampled at a rate of 2.5 MHz, processed on board in range andazimuth, and stored as digital 205-sample 16-bit profiles for subsequent downlink. Details of theradio frequency architecture and digital processing scheme are provided in section 3.3. In thenominal dual frequency mode, four echo profiles will be taken for each 5 by 10 km footprint; one foreach frequency, at both the primary and secondary antennas. During ground data processing andanalysis, echoes from the secondary (receive-only) antenna, which are expected to arise only fromoff-nadir surface “clutter,” will be used to remove surface echoes from the primary antenna profiles,thus isolating the subsurface reflections. Reduction of surface clutter by this technique is expected toimprove the detectability of subsurface interfaces by as much as 15 dB in some cases, adding perhaps1-2 km of signal penetration depth. As detailed in section 1.3.2 below, it is anticipated that interfacesas deep as 5 km will be detected under favourable circumstances, and that ice/water and dry/ice porefill interfaces should be detectable for most areas if they exist in the upper 1-3 km.
For each 5 by 10 km SSRA footprint, a suite of parameters will be retrieved. The source for theseparameters will be the four echo profiles (backscattered power as a function of time). During grounddata processing, each footprint profile set will be analysed for surface reflectivity at each frequency,echo dispersion at the surface (an indication of surface roughness), surface elevation, time delay tosubsurface reflector(s), intensity of subsurface reflection(s), and a measure of “confidence” that asubsurface interface was detected. These parameters will be incorporated into a global map database,to allow interpretation of local and regional behaviour, and for omparisons with other data sets.

05_Radar_White_Paper_v11.doc 43 04/03/01
Detailed analysis will be conducted for regions of interest. This will include modelling of theelectrical properties of the layers and interfaces. The modelling will result in estimates of thicknessof layers, depth to interfaces, dielectric properties of the materials, and an interpretation of theproperties of the materials, including composition. It is anticipated that the abrupt dielectric contraststhat should exist at a Martian water table would allow an unambiguous identification of liquid water.If small (~10s of km in lateral extent) aquifers are present, theresolution and processing scheme of the SSRA should allow their detection, unlike other systemsthat may require extensive, uniform layer and interface conditions. Boundaries involving thepresence and absence of ground ice will be more difficult to distinguish, but regional trends (withlatitude and elevation) should allow discrimination of ground ice boundaries.
To carry out ionospheric soundings, we propose to transmit monochromatic pulses with a nominalduration of 50 µsec, and a pulse repetition frequency of 125 Hz, thereby giving a range resolution ofabout 15 km, and a maximum range of 1200 km. In order to generate ionospheric plasma frequencyprofiles (similar to Figure 1-3), from which the topside electron density profile can be computed, thesounder frequency must be stepped over a frequency range thatextends from the plasma frequency at the spacecraft, which could be as low as 0.1 MHz, to themaximum plasma frequency in the ionosphere, which could be as high as 4.3 MHz (see Figure 1-4).As a nominal frequency scan for ionospheric sounding, we plan to step the sounder frequency over afrequency range from 0.1 MHz to 5.4 MHz in 10 kHz steps, thereby generating a sounding profilewith 531 frequencies. The time required to acquire such an ionospheric profile would be 4.24seconds, which if the soundings are repeated in contiguous sequences, would give ahorizontal resolution of about 20 km.
Subsurface interface detectionDetection of a crustal interface between layers of differing material, (e.g., ice-bearing versus liquidwater-bearing rock) by the SSRA requires that a set of conditions be met. The most criticalconditions are:
• The interface represents a contrast in the real dielectric constant,• Attenuation of the signal during its round-trip from the instrument and through the crust issmall enough,• The competing signals, primarily from the surface “clutter”, do not mask the subsurfaceecho.
In this section, we examine the implications of these requirements with respect to the depths theSSRA can be expected detect certain kinds of interfaces.
When the transmitted wave encounters the surface, a fraction of the energy is transmitted into thecrust, depending on the Fresnel reflection coefficient of the upper layer. A similar fraction of anyenergy reflected from depth will emerge from the surface on its return path. During two-waypropagation through the crustal media, energy losses will occur due to the dielectric loss propertiesof the media, and due to scattering by inhomogeneities. At a subsurface dielectric interface, thefraction of energy reflected depends on the ratio of the real dielectric constant across the interface.Each of these interactions is considered in the following estimation of depth detection capabilities.

05_Radar_White_Paper_v11.doc 44 04/03/01
In order to simulate the detection process, we have chosen combinations of materials and geometricconfigurations that represent a spectrum of best-case to worst-case scenarios likely to be encounteredon Mars. For crustal host-rock and pore-filling materials the following end-member properties areconsidered:
(Table 1-5. Summary of the assumptions of Mars subsurface material properties.)
The pore-filling material is assumed to be intimately mixed with the host material in proportionsdetermined by the porosity. The porosity fraction decays exponentially with depth, starting withsurface porosities of 20% and 50% (see Section 1.2.2). The dielectric properties of the mixture arecalculated using the Maxwell-Garnett formula. Two scenarios of pore-filling configurations areconsidered:
• Ice/water scenario: The porosity is saturated with ice from the surface down to a certaindepth, below
which liquid water is stable and becomes the pore-filling material.• Dry/ice scenario: The pore-filling material is considered to be gas (Martian atmosphere) to a
certain depth, below which ice fully occupies the porosity.
Attenuation due to dielectric losses can significantly reduce the energy of the wave. The followingfigures illustrate this effect.
(Fig. 1-5. Attenuation losses for mixtures of candidate materials in the crust at 3 MHz, as a functionof depth to an interface (ice/water and dry/ice scenarios) for a) basalt host, b) andesite host.)
Scattering within the volume of the crust by inhomogeneities such as embedded clasts and fractureswill also attenuate the signal. This effect will be significant if the size of the inhomogeneities iscomparable to the wavelength, and if they comprise a significant fraction of the volume. Rockpopulations at the landing sites (Golombek and Rapp, 1997; Golombek et al, 1998), which may beconsidered representative of the megaregolith, do not have a sufficientcomponent of clasts at the scale of 10s of m to affect signals at the SSRA wavelengths (62-158 m).Joints, fractures and faults within the crust may also introduce volume scattering, but this effect isdifficult to quantify with current data. Extensively “shattered” regions may significantly attenuate theSSRA signal, making interface detection difficult.
As the spherical wave front propagates into the subsurface at nadir, other parts of the same wavefront illuminate other areas on the surface at non-zero incidence angles. Some portion of this non-nadir surface illumination will be scattered back to the radar. While this is not a problem for smoothsurfaces because the scattering law decreases very rapidly with incidence angle, for rough surfacesthe off-nadir scattering contribution may be significant enough to mask the weaker subsurface echo.To quantify this effect, we model the surface backscatter as the result of astatistically characterized surface roughness, at scales relevant to the scattering phenomena.
Simple approximate methods can be applied for surfaces which present a unique roughness scale,with either a large correlation length (a gently undulating surface), or a very small rms height (aslightly rough surface) compared to the incident wavelength. Specifically, the Kirchhoff method can
05_Radar_White_Paper_v11.doc 45 04/03/01
be applied for gently undulating surfaces, and the Small Perturbation Method can be applied toslightly rough surfaces. Validity conditions apply to these two models (Ulaby et al, 1986; Fung etal,1992). For Mars we consider the contributions to the scattering at two scales of roughness, thedivide between the scales being essentially the radar wavelength. Section 1.2.3 and Table 1-4 givethe range of roughness parameters of the Martian surface that were considered for the surfacescattering simulation.
The surface backscatter contribution, which depends on incidence angle, can also be portrayed asfunction of the “equivalent depth” of the subsurface competing return, for a given dielectric medium.Figures 1-6 and 1-7 show the large-scale and small-scale backscatter contributions, as a function ofequivalent depth, at the two bounding frequencies of the SSRA.
(Fig. 1-6: Large-scale scattering contribution a) 1.9 MHz b) 4.8 MHz. Correlation lengths (l) are1500-2500 m, and rms slopes are 0.5°-5°.)(Fig. 1-7: Small-scale scattering contribution a) 1.9 MHz b) 4.8 MHz. Rms heights (sh) are 0.1-1 m,and rms slopes (rms) are 6°-34°.)
Figure 1-6 shows that for the large scale, the decay rate of the surface term depends mainly on therms slope value. There is also no significant variation with frequency. For the small scale, Fig. 1-7shows substantially no decay of the backscattered power with the incidence angle. Interactionsbetween the two different scales must be taken into account when combining the two contributions.No significant variation of the small-scale term is expected with large-scale tilts, because of thesmall incidence angles and small large-scale rms slopes. As a consequence the mutual interactionsbetween the large and small scales are very weak, and the total surface backscatter can be evaluatedin first approximation by simply summing up the two scale contributions. Examining of the figuresand considering that a maximum dynamic range of 60 dB is expected for the SSRA, the surfaceclutter contribution will likely be the limiting factor for the penetration depth for the roughest large-scale surface conditions, i.e., when the rms slope isbigger than 3-48 (0.05-0.06 rad.).
Under the simplifying assumption of small fractional bandwidth, the Fresnel term of the echoreflected by the subsurface interface can be expressed as (Porcello et al., 1974):
(equation here)
where the first factor represents the reflection loss on the subsurface layer interface, the second factoraccounts for the losses due to transmission through the surface layer and the last term indicates theloss due to the propagation of the signal into the upper layer from depth 0 to the depth of theinterface.
We have modeled the performance of a simple radar sounder, first utilizing only along-track Dopplerfiltering for reduction of surface clutter. The following charts show the expected level of returnsfrom subsurface interfaces attenuated by the intervening layer (heavy line), compared with thesurface returns that arrive at the same time. The depth at which the subsurface line intercepts thesurface line indicates the maximum detection depth for that scenario.

05_Radar_White_Paper_v11.doc 46 04/03/01
(Fig. 1-8. Interface detection simulations in the presence of surface clutter for a simple sounder.These results are for a basalt host rock with a surface porosity of 35%. a) ice/water interface at 1.9MHz, b) ice/water interface at 4.8 MHz, c) dry/ice interface at 1.9 MHz, d) dry/ice interface at 4.8MHz.)
These simulations show that although some of the smooth surface scenarios allow detection ofinterfaces to depths up to 3 km, the surface clutter masks the subsurface echo in many situations.Utilising a second receiving antenna with a nadir-null antenna pattern can be shown to reduce thestrength of the surface term by 10-20 dB, depending on the surface roughness. The improvementfactor in clutter cancellation by this technique can be expressed as (van Zyl, 1997):
(equation here)
where g1(. ) and g2(. ) represent the uncertainty in antenna pattern knowledge (as a function ofincidence angles) for the primary and secondary antennas, respectively. Note that this factor dependsonly on the knowledge of the antenna patterns, not the pattern functions themselves.
If subsurface echoes are received at two frequencies, they should be fairly different in power, thanksto the material attenuation which is linearly (in dB) dependent on the frequency. Hence if the surfacecontribution at the two frequencies is similar, it is possible to both estimate the ratio of Fresnelreflection coefficients at the subsurface interface, and to reduce the surface clutter contribution byproperly combining the echoes received at the two frequencies. The surface clutter suppression factorusing the two frequency approach can be in the range of 10-30 dB.The following table summarizes the maximum detection depth for Ice/Water interface and the rangeof subsurface characteristics considered, at the four operating frequencies of the SSRA. Values werederived from calculations that included the effects of surface clutter cancellation.

05_Radar_White_Paper_v11.doc 47 04/03/01
APPENDIX 3: MARSIS Experience and Technical Issues InImplementing A Radar Sounder
The purpose of this section is to provide some technical information that may be helpful in exploringdifferent scenarios for future radar sounder missions to Mars.
MARSIS Background
MARSIS is a low-frequency sounder optimized to achieve its science goals within the allocatedmass, power and implementation time requirements specified by Mars Express spacecraft. Tounderstand the design philosophy which will be outlined in the following, we need to state theinstrument’s science objectives.
MARSIS Science Goals
Primary:
To detect water (if it exists) in the first 5 km of the Martian surface.
Secondary:
To characterize Martian ionosphere using ionospheric sounding techniques
To achieve the primary objective, MARSIS is designed as a low-frequency (1.3 MHz – 5.5 MHz)system with 1 MHz bandwidth for each individual channel in the subsurface sounding mode. Thechoice of frequency is dictated by the expected attenuation characteristics of the Martian subsurfacethat is currently estimated to be 4-10 db/km for frequency range of 1.5 to 6 MHz. A doubling offrequency will roughly double these attenuation rates.
To achieve the secondary goal, MARSIS is capable of sounding the ionosphere at any frequencyfrom 0.1 MHz to 5.5 MHz using a 10 KHz tone.
MARSIS instrument has a single transmitter with 3 distinct matching networks for the followingbands:
3. 0.1-1.3 MHz4. 1.3-2.3 MHz5. 2.5-5.5 MHz
There are two receive channels which accommodates a dipole and a monopole antenna. Thetransmission is only through the dipole channel.

05_Radar_White_Paper_v11.doc 48 04/03/01
There is a dedicated on-board processing capability using two DSP chips. The on-board processingis required for data reduction and on-board chirp compression and ionospheric compensation fortracking and acquisition.
MARSIS Constraints
Mass 15 kgPower 70 WAntenna Length 40 m dipoleMaximum E-Field Emission 50 v/mOrbit ~8 hr elliptical orbit with 30 minutes below 800km altitudeSun Mostly daytime operation with no deep night access
MARSIS Science Processing Philosophy
The current form of the MARSIS science processing unit is the result of a balance between downlinkdata rate and science data quality. It is preferable to reduce the raw data as much as possible toreduce the data rate to the ground. However, there is a point beyond which the science content of thedata is seriously impacted. For example, MARSIS radar data is affected by the Martian ionosphere.A correction for the ionosphere is necessary for both radar operation and science processing. Sinceprocessing resources on-board are limited, a special on-board processing scheme was designed toallow downlink of the data in a form that would make it possible to do a more accurate ionosphericcompensation on the ground. An on-board ionospheric correction scheme is still implemented forradar operation purposes but its accuracy does not need to reach the level required in the scienceprocessing step.
Radar Sounder Design Issues
MARSIS is designed to image subsurface to a depth of 5 km with a resolution of about 100 m. Thissystem is not well-suited for studying near surface features in the first km of the surface. In order todesign a system to probe the near surface effectively, the following issues, among others, have to beaddressed:
A. Low frequency operation through the ionosphericB. High relative bandwidth (e.g. 5 MHz at 5 MHz center frequency)C. Innovative high-bandwidth antenna dipole designD. Controlling the spacecraft generated EMI and reducing spacecraft susceptibility to E-field
generated by the radarE. Capability to store raw data during radar operation possibly as much as 0.5 -1 GbitsF. Capability to have adjacent orbits for two-dimensional analysis of data
All of the above items can be overcome given sufficient time. We believe it is possible to meet the‘07 or ‘09 mission requirements, however, meeting the requirements for an ’05 mission requires amore rigorous study.

05_Radar_White_Paper_v11.doc 49 04/03/01
Low Frequency and Ionosphere
Low frequency of operation is imperative in order to obtain depth of peneteration. However, thisrequirement is contradictory to the ionospheric limitation which prohibits us from operation atfrequencies close to the peak plasma frequency. Based on our current knowledge, the daysideoperation is limited to frequencies above 3.5 MHz. The night-side operation may be possible atfrequencies as low as 1 MHz.
The Martian ionosphere will degrade the signal by 1) attenuating the signal and 2) dispersing thesignal. The attenuation level depends on the solar zenith angle. The attenuation levels may be toohigh for dayside operation. The ionospheric dispersion degrades the final image resolution andsignal-to-noise ratio. The correction for the dispersion can be applied on-board, however, anaccurate correction for ionospheric correction is possible on the ground. In the MARSIS design, thededispersion process is carried out on-board for tracking and signal acquisition purposes and thescience data is dedispersed on the ground. The choice to carry out the dedispersion of the sciencedata on the ground will not increase the data rate since the along track processing will still be carriedout on-board.
High Relative Bandwidth
MARSIS has a 1 MHz bandwidth which will yield roughly a 100 m resolution for subsurface. Weneed at least 5 times as much resolution if we are focusing on the first one-km and are looking forfiner details.
The driving factor in this design is the total bandwidth of the radar. Let’s consider an overalbandwidth of 4.6 MHz. This system has four bands each 1.3 MHz wide with 0.2 MHz overlapbetween the bands. Assuming a refractive index of 2.2, the nominal resolution in the medium is 16m.
Due to high relative bandwidth of the proposed system, the wide-band antenna and transmittermatching will be challenging. In order to achieve the best matching and radiation efficiency, theantenna can be made of four separate dipoles within the same physical structure. Each of the dipoleswill be matched through its dedicated matching network with the transmitter.
The receive channels include four independent receivers connected to the corresponding dipoleantenna.
Innovative Antenna Design
The relative large operational bandwidth will require new approaches in designing the lightweightantenna. This item will be described in more detail in Appendix 4.
EMI and Susceptibility Requirement

05_Radar_White_Paper_v11.doc 50 04/03/01
Radars generate large E-field and require very quiet environment for detecting weak signals. Both ofthese issues will push the spacecraft EMI requirements to the limit.
Raw Data Storage and Downlink
Due to complications of ionosphere, a high quality processing can only be achieved on the ground.This means at least part of the data needs to be preprocessed on-board and then downlinked forfurther analysis on the ground. This will increase the need for larger storage on board (e.g. usingcompact flash, etc).
Along Track Resolution
The along track resolution by a radar sounder depends on its frequency of operation, syntheticaperture size, and more importantly, the surface characteristics. For Mars, considering availablesurface roughness information from recent MOLA data, the ideal sounder resolution is between 1-5km. An instrument design for a better resolution will not be able to fully utilize its capabilities.
Improving SNR
A sufficiently high signal-to-noise ratio (SNR) is paramount in achieving the science goals of themission. The main method for improving the SNR is signal averaging either through chirpcompression, presumming or a combination of the two. Raising the instantaneous output power,although effective, is not practical because of engineering limitations on peak power levels.Increasing the SNR either through long-chirp implementation or high PRF design will translate intohigher average power consumption and a higher processing load. MARSIS has a maximum dynamicrange of 46 db which is achieved by using a long-pulse scheme at low PRF. Due to recentinformation about the Martian surface roughness and backscattering characteristics, it is possible toconsider a higher PRF system with shorter pulse length since range ambiguity is not going to be aproblem.
Clutter issue and Two-Dimensional Aperture synthesis
The issue of clutter for near surface may be a serious limiting factor. Further, many of the points ofinterest, as demonstrated so far, may lie in rough areas or at the crater rims. Radar soundingprocessing over this type of sites requires access to a two-dimensional aperture which may beobtained through adjacent orbit data. This type of data processing is possible on the ground if rawdata mentioned in the above section is provided.
High Resolution Radar Sounder
A radar capable of sounding the first 1 km of the surface can provide valuable science return. Thisradar sounder will also be complementary to MARSIS. One of the main challenges in implementingsuch a radar is to achieve high bandwidth at low frequencies. We believe the bandwidth and theclutter issue to be the primary challenges in implementing a shallow sounder.
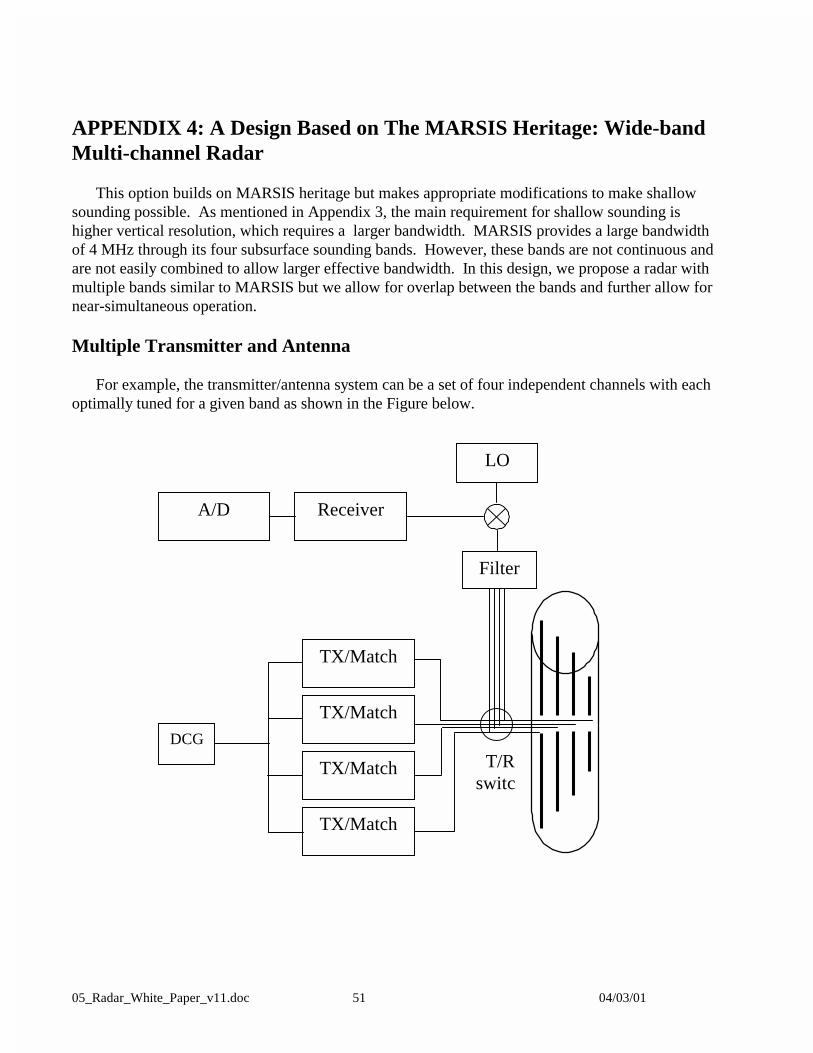
05_Radar_White_Paper_v11.doc 51 04/03/01
APPENDIX 4: A Design Based on The MARSIS Heritage: Wide-bandMulti-channel Radar
This option builds on MARSIS heritage but makes appropriate modifications to make shallowsounding possible. As mentioned in Appendix 3, the main requirement for shallow sounding ishigher vertical resolution, which requires a larger bandwidth. MARSIS provides a large bandwidthof 4 MHz through its four subsurface sounding bands. However, these bands are not continuous andare not easily combined to allow larger effective bandwidth. In this design, we propose a radar withmultiple bands similar to MARSIS but we allow for overlap between the bands and further allow fornear-simultaneous operation.
Multiple Transmitter and Antenna
For example, the transmitter/antenna system can be a set of four independent channels with eachoptimally tuned for a given band as shown in the Figure below.
DCG
TX/Match
TX/Match
TX/Match
TX/Match
T/Rswitc
LO
Filter
ReceiverA/D

05_Radar_White_Paper_v11.doc 52 04/03/01
The existence of four dipole wires (one for each channel) will significantly enhancetransmitter/antenna coupling and increase radiation efficiency. This is a significant difference fromthe MARSIS design. This advantage is gained with minimal implementation and mass penalty sinceall of the dipole wires will be within the same physical structure which needs to be as long as thelongest dipole.
The frequency channels may be continuous or disjointed based on the measurement objectives.We envision the bands be overlapping and cover a continuous frequency band. An example of such afrequency band selection is given in the following table. There are a total of four bands with thelowest frequency at 1.4 MHz with a 1.3 MHz bandwidth. Each band is overlapping the other by 0.2MHz. This overlap will assure cross-band calibration and frequency continuity.
Operation Modes
Two distinct operation mode are considered:
1. Shallow sounding mode (surface to 1 km)2. Deep sounding mode (surface to 5 km)
The radar will operate with full bandwidth at the shallow sounding mode and at reduced bandwidthat the deep sounding mode.
An example of the pulsing scheme is shown below. In the propose pulsing scheme, a singlefixed PRF (pulse repetition frequency) is assumed. However, the pulsing scheme within the PRI(pulse repetition interval) can be changed depending whether the operation is in the deep or theshallow mode.
In the deep sounding mode, within a given PRI two longer chirps are transmitted with an effectivebandwidth equivalent to one or two bands depending whether pulse 1 and 2 are from the same bandor different bands.
In the shallow sounding mode, there are four shorter chirps covering all or a subset of bands. Thismode will have the highest possible system bandwidth.
The PRF is selected such that there is only one set of pulses in the air at a given time. This willmean this design will have a PRF of few hundred Hz (200-300) depending on the orbit altitudechoice. In order to improve SNR, the total transmitted energy is maximized by increasing the chirplength to maximum allowed.
B a n d S ta r t F re q u e n c y E n d F re q u e n c y1 1 .4 2 .72 2 .5 3 .83 3 .6 4 .94 4 .7 6

05_Radar_White_Paper_v11.doc 53 04/03/01
Antenna
Based on the lowest band frequency selection, an optimum antenna length is about 60 m. Currently,MARSIS is employing a 40 m dipole antenna along with a 7 m monopole antenna.
Mass and Power Estimate
Based on our experience with MARSIS radar that has a mass of 15 kg, it is expected that theproposed radar will have a mass of 20 kg with 5 kg margin (or 25 kg). Based on the 2005 orbiterdesign team comments, after inclusion of the 20 kg radar, spacecraft can still maintain a 28% massreserve.
Also, Extrapolating from the MARSIS power requirement, it is expected that the proposed radar willrequire 100 W for its operation. Based on comments from the 2005 orbiter design team, thisrequirement should be easily met.
Possible Orbit Requirements
A lower orbit is favored by a radar sounder since it provides better SNR and better along trackresolution. For this design, a circular orbit at 250 km is preferred but in the absence of this option,an elliptical orbit of 250 by 450 is acceptable.
An adjacent orbital separation of 3 km or less at the equator is desired to achieve two-dimensionalaperture synthesis capability over certain “focus areas”.
TC
TG
Pulse 1 Pulse 2 Pulse 3 Pulse 4
TPRI
TC
TG
Pulse 1 Pulse 2
Shallow (<1 km)
Deep (< 5 km)
TPRIPulse choice: Bands 1 or 2
Pulse choice: Bands 1,2,3, 4

05_Radar_White_Paper_v11.doc 54 04/03/01
APPENDIX 5: Independent analysis prepared by ASI.
Editorial note: The following analysis was prepared by the technical staff in ASI under theleadership of Angioletta Coradini, and submitted on Jan. 16, 2001. It is incorporated here verbatim,so that the ASI perspective can be clearly framed. This analysis has not been completely validatedby the other authors of this report. If there are questions, please contact:
Roberto OroseiIstituto di Astrofisica Spaziale - CNRArea di Ricerca di Roma Tor VergataVia del Fosso del Cavaliere, 100I-00133 RomaItalyPhone: + 39 06 4993 4450Fax: + 39 06 2066 0188E-mail: [email protected]
Introduction to the description of the High Resolution Sounder
The new knowledge developed thanks to MGS indicates that sedimentary processes are morecomplex than anticipated before, and that they are possibly related to the water history on Mars.Moreover some of the MOC images seem to indicate the presence of shallow ice/water reservoirs.Given the nominal characteristics of the 2005 mission, one can envisage an instrument to supportinvestigations that complement the results of MARSIS. An instrument able to penetrate a fewhundreds of meters below the surface with a finer horizontal resolution and a vertical resolution (onthe order of 10 m - 20 m) would provide a unique insight into the Martian stratigraphy at scalescomparable to those of optical images, thus offering a tremendous improvement in the understandingof sedimentary processes and recent geologic activity.
A concept for such a radar sounder has been developed and is presented in below. The study for thedefinition of a lower-penetration, higher-resolution radar (or channel) has been performedunder the assumption that the modeling of the radar pulse propagation in the subsurface thatwas performed for the MARSIS experiment can be extended to shorter, yet comparable,wavelengths.
An important point in this design is that only one matching circuit is necessary for the transmissionat the different frequencies of operation, so that the “real stepped frequency” technique can beused, without decreasing the PRF, thus allowing clutter cancellation by use of Dopplerfiltering. This reduced complexity, together with the smaller antenna allowed by the usehigher frequencies, translates into a reduction of the required mass: current estimates allowfor a 40% mass reduction with respect to MARSIS.
The benefits of operating at higher frequencies are summarized in Section 4 C. Additionally, there isalso a significant reduction of the impact of the instrument on the spacecraft, in terms ofelectromagnetic compatibility, as shown in the 1/8/01 memo by A. Whittlesey on the MROEMC needs.

05_Radar_White_Paper_v11.doc 55 04/03/01
The Mars High Resolution Advanced Radar for the 2005 MRO
The new knowledge developed thanks to MGS indicates that sedimentary processes are morecomplex than anticipated before, and that they are possibly related to the water history onMars. Moreover some of the MOC images seem to indicate the presence of shallow ice/waterreservoirs. Given the nominal characteristics of the 2005 mission, one can envisage aninstrument to support investigations that complement the results of MARSIS. An instrumentable to penetrate a few hundreds of meters below the surface with a finer horizontalresolution and a vertical resolution (on the order of 10 m - 20 m) would provide a uniqueinsight into the Martian stratigraphy at scales comparable to those of optical images, thusoffering a tremendous improvement in the understanding of sedimentary processes and recentgeologic activity.
For these reasons, a concept for a radar sounder in the ’05 MRO mission has been developedaccording to the following high-level parameters:
Penetration Depth: 300 m –1000 mVertical Resolution 10-20 mHorizontal resolution 300 m-1000 m
The study for the definition of a lower-penetration, higher-resolution radar (or channel) has beenperformed under the assumption that the modeling of the radar pulse propagation in thesubsurface that was performed for the MARSIS experiment can be extended to shorter, yetcomparable, wavelengths.
Although a multitude of different chemical compositions is present at the surface of Mars, it isnecessary to select a few representative materials as most meaningful for electromagneticstudies. We have chosen (following the MARSIS proposal) andesite and basalt, because thevalues of their dielectric constant can be considered end members of the range in which thefirst layer of the Martian surface materials may vary.
The dielectric properties of the crust end-member materials, together with those of the water and icefilling the pores, are listed in the following table:
CRUST MATERIAL PORE-FILLING MATERIALAndesite Basalt Solid H2O (Ice) Liquid H2O (Water)
εr 3.5 7.1 3.15 88Tan δ 0.005 0.014 0.00022 0.0001
Tab. 1: Summary of the subsurface material dielectric properties.
The reference model representing the most likely detection scenario is the following:
Ice/water interface detection scenario: according to the model, the porosity of the Martian regolith ismaximum at the surface and its decay with the increasing depth is given by the exponentiallaw with a decay constant that can be assumed of the order of 2.8 km.
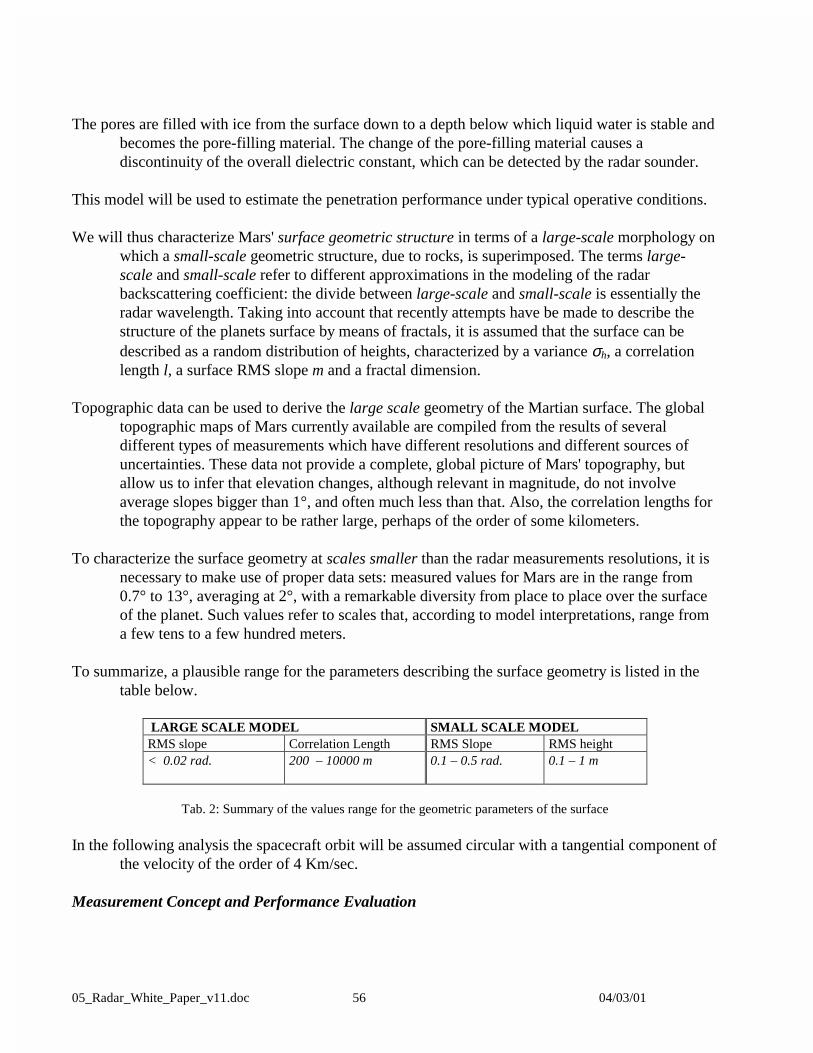
05_Radar_White_Paper_v11.doc 56 04/03/01
The pores are filled with ice from the surface down to a depth below which liquid water is stable andbecomes the pore-filling material. The change of the pore-filling material causes adiscontinuity of the overall dielectric constant, which can be detected by the radar sounder.
This model will be used to estimate the penetration performance under typical operative conditions.
We will thus characterize Mars' surface geometric structure in terms of a large-scale morphology onwhich a small-scale geometric structure, due to rocks, is superimposed. The terms large-scale and small-scale refer to different approximations in the modeling of the radarbackscattering coefficient: the divide between large-scale and small-scale is essentially theradar wavelength. Taking into account that recently attempts have be made to describe thestructure of the planets surface by means of fractals, it is assumed that the surface can bedescribed as a random distribution of heights, characterized by a variance σh, a correlationlength l, a surface RMS slope m and a fractal dimension.
Topographic data can be used to derive the large scale geometry of the Martian surface. The globaltopographic maps of Mars currently available are compiled from the results of severaldifferent types of measurements which have different resolutions and different sources ofuncertainties. These data not provide a complete, global picture of Mars' topography, butallow us to infer that elevation changes, although relevant in magnitude, do not involveaverage slopes bigger than 1°, and often much less than that. Also, the correlation lengths forthe topography appear to be rather large, perhaps of the order of some kilometers.
To characterize the surface geometry at scales smaller than the radar measurements resolutions, it isnecessary to make use of proper data sets: measured values for Mars are in the range from0.7° to 13°, averaging at 2°, with a remarkable diversity from place to place over the surfaceof the planet. Such values refer to scales that, according to model interpretations, range froma few tens to a few hundred meters.
To summarize, a plausible range for the parameters describing the surface geometry is listed in thetable below.
LARGE SCALE MODEL SMALL SCALE MODELRMS slope Correlation Length RMS Slope RMS height< 0.02 rad. 200 – 10000 m 0.1 – 0.5 rad. 0.1 – 1 m
Tab. 2: Summary of the values range for the geometric parameters of the surface
In the following analysis the spacecraft orbit will be assumed circular with a tangential component ofthe velocity of the order of 4 Km/sec.
Measurement Concept and Performance Evaluation
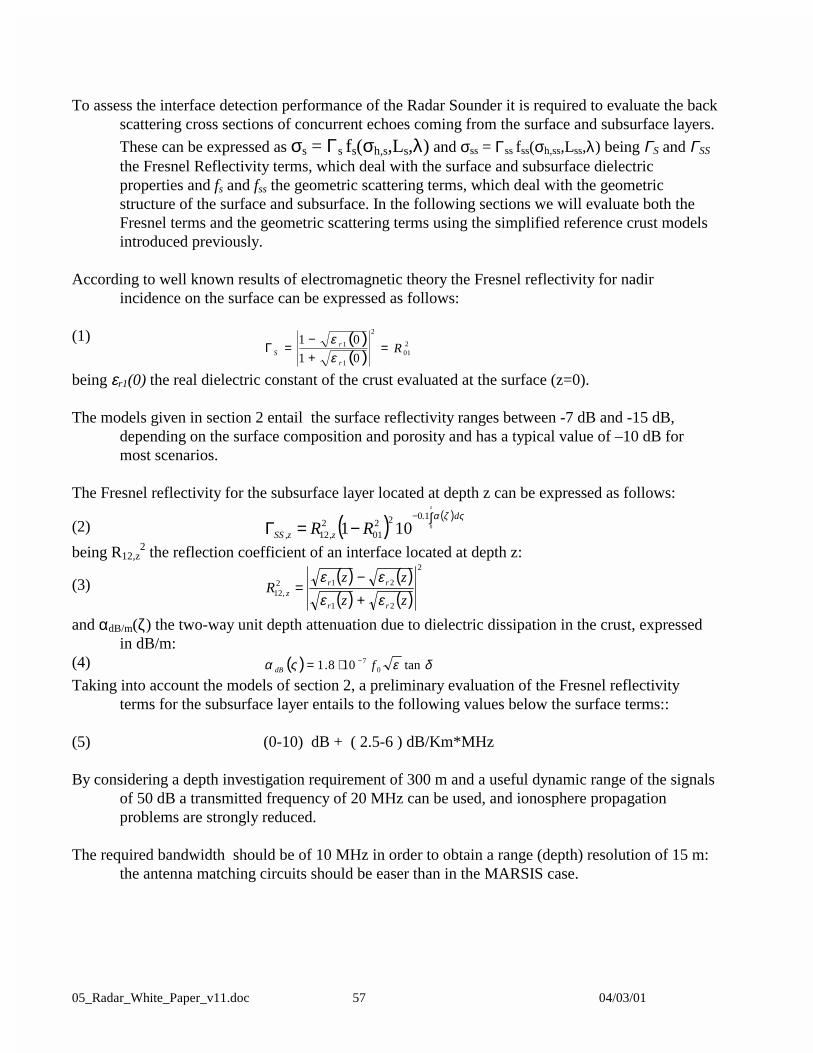
05_Radar_White_Paper_v11.doc 57 04/03/01
To assess the interface detection performance of the Radar Sounder it is required to evaluate the backscattering cross sections of concurrent echoes coming from the surface and subsurface layers.
These can be expressed as σs = Γs fs(σh,s,Ls,λ) and σss = Γss fss(σh,ss,Lss,λ) being ΓS and ΓSS
the Fresnel Reflectivity terms, which deal with the surface and subsurface dielectricproperties and fs and fss the geometric scattering terms, which deal with the geometricstructure of the surface and subsurface. In the following sections we will evaluate both theFresnel terms and the geometric scattering terms using the simplified reference crust modelsintroduced previously.
According to well known results of electromagnetic theory the Fresnel reflectivity for nadirincidence on the surface can be expressed as follows:
(1) ( )( )
201
2
1
1
01
01R
r
rS =
+−
=Γεε
being εr1(0) the real dielectric constant of the crust evaluated at the surface (z=0).
The models given in section 2 entail the surface reflectivity ranges between -7 dB and -15 dB,depending on the surface composition and porosity and has a typical value of –10 dB formost scenarios.
The Fresnel reflectivity for the subsurface layer located at depth z can be expressed as follows:
(2) ( ) ( )∫−−=Γ
z
d.
z,z,SS RR 0
102201
212 101
ςζα
being R12,z2 the reflection coefficient of an interface located at depth z:
(3) ( ) ( )( ) ( )
2
21
212,12
zz
zzR
rr
rrz εε
εε+−
=
and αdB/m(ζ) the two-way unit depth attenuation due to dielectric dissipation in the crust, expressedin dB/m:
(4) ( ) δεςα tan108.1 07 fdB
−⋅=
Taking into account the models of section 2, a preliminary evaluation of the Fresnel reflectivityterms for the subsurface layer entails to the following values below the surface terms::
(5) (0-10) dB + ( 2.5-6 ) dB/Km*MHz
By considering a depth investigation requirement of 300 m and a useful dynamic range of the signalsof 50 dB a transmitted frequency of 20 MHz can be used, and ionosphere propagationproblems are strongly reduced.
The required bandwidth should be of 10 MHz in order to obtain a range (depth) resolution of 15 m:the antenna matching circuits should be easer than in the MARSIS case.

05_Radar_White_Paper_v11.doc 58 04/03/01
The minimum surface back scattering coefficient (for nadir incidence) can be computed using aworst case RMS slope of 0.02 rad (Tab.2) and the lower value of Γs , according to thegeometric optics we have:
(6) 2s
s0
m2
Γ=σ dB16
dB
0 ≥σ
The SNR equation can be written, by considering incoherent backscattering model, [1] as:
(7)0
5.23
032p
KTvH)4(
DC2GP
N
S
π
∆σλ=
and the minimum signal to noise ratio is shown in the attached table, taking into account verypreliminary design parameters.
H=400 kmDB
Pp (10 W) 10G2 0λ3 41σ0 16
64π3 -33H2.5 -140
K(1.38 10-23) 228Te=TF.
Kraus Mod. -49√2∆ (∆=10 m) 6.5D.C. (20%) -7
v0 (4 Km/sec) -36Single Look S/N 36.5
In order to obtain the spatial resolution, in along track direction, of the 300 m it is necessary to applythe SAR approach and the synthetic aperture is given by :
(8)s
AZ L2
HR
λ= → LS = 10 Km
The application of the synthetic aperture entails the reduction of the surface clutter.
The selection of the pulse repetition frequency, in order to avoid spectral aliasing, is given by the:
(9) PRF = 2*2 v0 / λ = 1/T → v0T = λ / 4 ≅ 4 m
The 4 m given the space in the orbit to perform radar interrogation, and the values of PRF (200-1000Hz) not allow to use an “useful” step frequency concept.
The same synthetic aperture concept must be applied in cross track direction, so that we need radarreturn echoes, on ground, from many orbits.

05_Radar_White_Paper_v11.doc 59 04/03/01
References
[1] G.Picardi, S.Sorge, R.Seu, G.Fedele, C.Federico, R.Orosei, "Mars Advanced Radar forSubsurface and Ionosphere Sounding (MARSIS): models and system analysis", InfocomTechnical Rep. N.MRS-001/005/99, March 1999
[2] G.Picardi, J.Plaut, W.Johnson, L. Borgarelli, R.Jordan, D.Gurnett, S.Sorge, R.Seu, R.Orosei,“The Subsurface Sounding Radar Altimeter in the Mars Express mission”, proposal to ESA,Infocom document n. N188-23/2/1998, February 1998