analysis of the impact of a yard waste ban on landfill ... · yard waste ban on landfill quantities...
TRANSCRIPT
Analysis of the Impact of a Yard Waste Ban On Landfill Quantities and Household Costs FINAL REPORT
SEPTEMBER 15, 2004
PREPARED FOR: Delaware Solid Waste Authority Dover, Delaware
PREPARED BY: D S M ENVIRONMENTAL SERVICES, INC. P.O. Box 466, 23 Thrasher Road, Ascutney, VT 05030

Final Report, September 15, 2004
TABLE OF CONTENTS
EXECUTIVE SUMMARY ...........................................................................................................E.1 INTRODUCTION............................................................................................................................. 1 SECTION 1: ...................................................................................................................................... 2
Comparison to Mid-Atlantic State Data ..................................................................................... 2 States Outside of the Mid-Atlantic Region with Yard Waste Bans.......................................... 7 Conclusions.................................................................................................................................. 10
SECTION 2: .................................................................................................................................... 11
Landscaper Services ................................................................................................................... 11 Conclusions.................................................................................................................................. 16
SECTION 3: .................................................................................................................................... 17
Collection Programs ................................................................................................................... 17 Conclusions.................................................................................................................................. 24
SECTION 4: .................................................................................................................................... 26
Tree Services................................................................................................................................ 26 Conclusions.................................................................................................................................. 28
SECTION 5: .................................................................................................................................... 29
Minimal Technology Composting Methodology ...................................................................... 29 Low Technology Composting Methodology ............................................................................. 30 Intermediate Technology Composting Methodology .............................................................. 31 High Technology Composting Methodology ............................................................................ 32 Yard Waste Composting Cost Analysis .................................................................................... 33 Conclusion ................................................................................................................................... 41
SECTION 6: .................................................................................................................................... 42
Waste Hauler Survey.................................................................................................................. 42 New Jersey ................................................................................................................................... 43 Conclusion ................................................................................................................................... 44
SECTION 7: .................................................................................................................................... 45 SECTION 8: .................................................................................................................................... 47
Summary...................................................................................................................................... 47 Conclusions.................................................................................................................................. 48 Demand for New Yard Waste Processing Capacity ................................................................ 49 Costs to Provide Alternative Yard Waste Processing Capacity ............................................. 49 Separate Collection Costs........................................................................................................... 50 Cautions ....................................................................................................................................... 50
APPENDIX A.................................................................................................................................. 51

Final Report, September 15, 2004 E.1
EXECUTIVE SUMMARY
The Delaware Solid Waste Authority (DSWA), Delaware Department of Natural Resources and Environmental Control (DNREC) and the Governor’s Recycling Public Advisory Council (RPAC) entered into a Memorandum of Agreement (MOA) on January 6, 2004, in an effort to increase the diversion of recyclables for the solid waste stream and minimize the quantity of solid waste requiring disposal. DSWA determined that further data acquisition and a realistic assessment of the quantity of yard waste generated in the State is necessary, especially in light of DNREC’s “start of action” to implement a yard waste ban statewide. The potential for a yard waste ban also requires an analysis of the facilities necessary to handle and process yard waste under the ban. DSWA contracted with DSM Environmental Services, Inc. (DSM) to undertake certain tasks necessary to address yard waste generation, the potential impact of a ban on yard waste disposal at DSWA landfills, and the potential costs associated with separate collection and processing of the banned yard waste. The specific tasks undertaken by DSM were:
• Task 1: Verify per capita yard waste generation in Delaware; • Task 2: Survey landscapers and lawn maintenance firms to determine residential yard waste
quantities and locations of off-site disposal/composting currently occurring; • Task 3: Survey municipalities to determine residential yard waste quantities and locations of
off-site disposal/composting currently occurring; • Task 4: Estimate the impact of a yard waste disposal ban; and, • Task 5: Analyze costs for composting facilities necessary to manage yard waste banned
materials. DSWA also requested that DSM evaluate, under the same scope of services, market prices for dual stream and single stream materials produced by a recycling processing facility. This task has been addressed under separate cover to DSWA.
Summary & Conclusions
Summary
• DSM estimates that 50,200 (rounded) tons per year of residential yard waste is currently diverted from disposal by the state’s landscapers, tree services, municipalities and at DSWA facilities. Table E.1 presents the amount by sector:

Final Report, September 15, 2004 E.2
TABLE E.1
Residential Yard Waste Diverted in the State of Delaware
By Annual Tons % of Total Landscapers 11,718 24 Tree Services 25,000 50 Municipalities 9,006 18 DSWA 4,500 8
TOTAL TONS 50,224
• Table E.2 summarizes current estimated statewide yard waste recycling rates, and the annual amount of residential yard waste material diverted from disposal. Table E.2 also projects the percentage of yard waste that would be diverted from disposal in the event a yard waste ban was implemented statewide in Delaware, as well as the expected statewide yard waste recycling rate under a yard waste ban E.1:
Table E.2
Annual Delaware Yard Waste Recycling Off-site of Residences
Pre Yard Waste Ban Post Yard Waste Ban
Yard waste mixed with MSW and disposed in DSWA landfills 95,600 tons 31,000 tons
New off-site yard waste being recovered 45,2001
Yard waste diverted, mulched and used by DSWA landfills 4,500 tons 4,500 tons
Current off-site yard waste managed other than at DSWA facilities 45,724 45,724
Total off-site yard waste 145,824 126,424
Total off-site yard waste recycled 50,224 95,424
% of yard waste recycled 34% 75%
(1) Exclusive of yard waste left on site.
Table E.2 assumes that after the institution of a yard waste ban, approximately 30% of yard waste currently being disposed at DSWA landfills or 19,372 tons of material will remain on-site at residences through use of mulching lawn mowers and backyard composting. This is the reason that Table E.2 projects a decline in total yard waste leaving residents after implementation of a ban.
E.1 DSM was tasked to analyze residential yard waste generation and disposal. According to the 1997 SCS Engineers report approximately 8,840 additional tons of yard waste from businesses and institutions also is disposed at DSWA facilities. DSM believes that businesses and institutions would behave much like residents with respect to yard waste disposition after a yard waste ban.

Final Report, September 15, 2004 E.3
Conclusions
• DSM continues to believe that the most reliable data on yard waste disposal for the State of Delaware is the 1997 SCS Engineers waste composition study conducted for DSWA. When the SCS data are averaged across the entire population of Delaware and applied to year 2003 population estimates, current disposal at DSWA landfills is approximately 95,600 tons (rounded) per year of both residential and commercial wastes, with residential waste comprising 90%, or 86,000 annual tons (rounded), of this total.
• Based on surveys conducted by DSM, it is estimated that an additional 50,200 tons
(rounded) of residential yard waste were diverted in 2003, either to DSWA landfills for use as landfill cover, or through municipal and private mulching and composting operations.
• There is no universal definition of “yard waste”. Therefore, attempts to compare current
deliveries of yard waste to DSWA facilities to deliveries in adjoining states with yard waste bans is, at best a difficult exercise. Yard waste can be defined to include only grass clippings and leaf waste, or it can include brush, tree trimmings, stumps, land-clearing debris, and in some cases other organics including separated food wastes.
• There is also no universal definition of “yard waste bans” with some counties and states
enforcing bans on deliveries of all but minimal quantities of yard waste contained in mixed solid waste loads, and other states simply banning trucks carrying only yard waste from disposal at landfills. In addition, the level of enforcement varies widely, as does the provision of alternative collection systems available to residents and businesses for separate management of yard wastes. All of these variations impact on delivery of yard waste to landfills in “yard waste ban” states.
• One fact remains clear however, despite the definition of yard waste or the type of yard
waste ban – states or counties with landfill bans receive significantly less yard waste on a per capita basis then those without bans. As a consequence, there are currently 23 states with some type of a yard waste landfill ban in place.
• Recent waste composition analyses at landfills in Montgomery and Anne Arundel Counties
in Maryland, and statewide in Pennsylvania where yard waste bans (with varying definitions) are in place show per capita yard waste disposal rates averaging 76 pounds per capita across all waste streams.
• Therefore, if Delaware were to enact a yard waste ban, it is likely that total yard waste
tonnages delivered to DSWA landfills would fall over time to 31,000 tons per year (rounded), based on current population levels.
Demand for New Yard Waste Processing Capacity
• DSM’s surveys of landscapers and tree services indicates that the impact of a yard waste ban on these entities would be minimal. Ninety-six percent of the grass and 80 percent of the leaves, as well as virtually all of the tree service material is currently not delivered to DSWA landfills, but instead goes to existing private mulching and composting operations.

Final Report, September 15, 2004 E.4
• With the exception of Wilmington and Middletown, a yard waste ban at DSWA facilities
would also not impact the Incorporated Areas currently collecting yard waste separately because each Incorporated Area makes their own provisions for the disposition of the yard waste they collect.
• There are limited data from which to draw conclusions about how much of the material not
delivered to DSWA facilities would remain on-site or be delivered to existing non-DSWA facilities. For lack of better data, DSM has estimated that roughly 30 percent of the yard waste material diverted from DSWA landfills due to a yard waste ban would remain on-site through the expanded use of mulching lawn mowers and on-site mulching and composting operations. An additional amount would be diverted to existing and new privately operated sites developed/used by landscapers, lawn care companies, mulching operations, tree services, and municipalities.
• This would require that new capacity be developed by DSWA, other municipalities and/or
the private sector for approximately 45,200 tons (rounded) of yard waste annually, based on current population.
Costs to Provide Alternative Yard Waste Processing Capacity
• DSM developed generic cost estimates for various levels of yard waste composting technologies and sizes. These ranged from low technology sites using only a gravel pad and a front-end loader with a capacity to accept between 1,000 and 4,000 tons of yard waste annually, to high capacity sites with dedicated windrow turners, and or “ag-bag” sites using plastic ag-bags and forced aeration with the capacity to handle up to 8,000 tons, or more, per year.
• Because of the low density of yard waste, especially leaves and brush, which makes long
distance transport expensive, and the ability to manage composting with relatively limited environmental impacts (when managed correctly), it is DSM’s conclusion that low and intermediate technology composting sites scattered throughout Delaware, as opposed to larger, centralized facilities make the most sense. These facilities can be constructed and operated at tipping fees ranging from $32 to $48 per ton, exclusive of any materials sales revenue.
• Assuming that five to seven low and intermediate technology sites were developed around
Delaware, the initial capital investment is estimated to range from $358,000 to $700,000, assuming such facilities are located on existing DSWA sites. These figures would increase if private operators were required to include purchase of land for a buffer around facilities.
Final Report, September 15, 2004 E.5
Separate Collection Costs
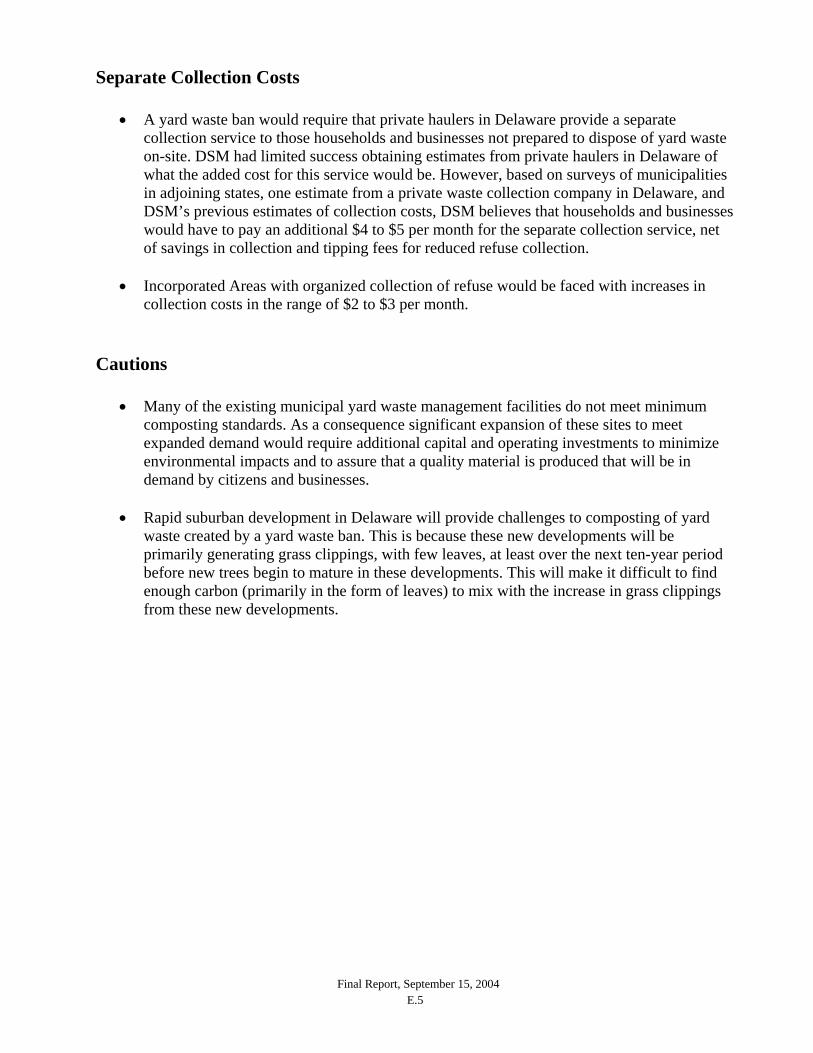
• A yard waste ban would require that private haulers in Delaware provide a separate collection service to those households and businesses not prepared to dispose of yard waste on-site. DSM had limited success obtaining estimates from private haulers in Delaware of what the added cost for this service would be. However, based on surveys of municipalities in adjoining states, one estimate from a private waste collection company in Delaware, and DSM’s previous estimates of collection costs, DSM believes that households and businesses would have to pay an additional $4 to $5 per month for the separate collection service, net of savings in collection and tipping fees for reduced refuse collection.
• Incorporated Areas with organized collection of refuse would be faced with increases in
collection costs in the range of $2 to $3 per month. Cautions
• Many of the existing municipal yard waste management facilities do not meet minimum composting standards. As a consequence significant expansion of these sites to meet expanded demand would require additional capital and operating investments to minimize environmental impacts and to assure that a quality material is produced that will be in demand by citizens and businesses.
• Rapid suburban development in Delaware will provide challenges to composting of yard
waste created by a yard waste ban. This is because these new developments will be primarily generating grass clippings, with few leaves, at least over the next ten-year period before new trees begin to mature in these developments. This will make it difficult to find enough carbon (primarily in the form of leaves) to mix with the increase in grass clippings from these new developments.

Final Report, September 15, 2004 1
INTRODUCTION The Delaware Solid Waste Authority (DSWA), Delaware Department of Natural Resources and Environmental Control (DNREC) and the Governor’s Recycling Public Advisory Council (RPAC) entered into a Memorandum of Agreement (MOA) on January 6, 2004, in an effort to increase the diversion of recyclables for the solid waste stream and minimize the quantity of solid waste requiring disposal. DSWA determined that further data acquisition and a realistic assessment of the quantity of yard waste generated in the State is necessary, especially in light of DNREC’s “start of action” to implement a yard waste ban statewide. The potential for a yard waste ban also requires an analysis of the facilities necessary to handle and process yard waste under the ban. DSWA contracted with DSM Environmental Services, Inc. (DSM) to undertake certain tasks necessary to address yard waste generation, the potential impact of a ban on yard waste disposal at DSWA landfills, and the potential costs associated with separate collection and processing of the banned yard waste. The specific tasks undertaken by DSM were:
• Task 1: Verify per capita yard waste generation in Delaware; • Task 2: Survey landscapers and lawn maintenance firms to determine residential yard waste
quantities and locations of off-site disposal/composting currently occurring; • Task 3: Survey municipalities to determine residential yard waste quantities and locations of
off-site disposal/composting currently occurring; • Task 4: Estimate the impact of a yard waste disposal ban; and, • Task 5: Analyze costs for composting facilities necessary to manage yard waste banned
materials. DSWA also requested that DSM evaluate, under the same scope of services, market prices for dual stream and single stream materials produced by a recycling processing facility. This task has been addressed under separate cover to DSWA. For the purposes of this report, DSM defines Municipal Solid Waste (MSW) as all solid waste generated in an area except industrial and agricultural wastes. Generally MSW excludes hazardous wastes, except to the extent that this enters the municipal waste stream as household hazardous waste. MSW sometimes includes construction and demolition debris and other special wastes that may enter the municipal waste stream via residents. MSW is often defined to mean all solid wastes that a public authority accepts responsibility for managing in some way.
As a component of MSW, DSM defines residential solid waste as wastes generated by the normal activities of households including, but not limited to, yard wastes, food wastes, rubbish, ashes, and bulky wastes.
Also as a component of MSW, DSM defines commercial solid waste as including all types of solid wastes generated by stores, offices, restaurants, warehouses, and other non-manufacturing activities, excluding industrial wastes.

Final Report, September 15, 2004 2
SECTION 1: VERIFICATION OF PER CAPITA
YARD WASTE GENERATION Tasks 1 and 4 have been combined in this section because data collection was combined from surrounding states comparing yard waste ban and non-yard waste ban data. Comparison to Mid-Atlantic State Data DSM obtained yard waste data from surrounding Mid-Atlantic states to determine how much yard waste was disposed (on a per capita basis, for comparison to Delaware) and to determine what the impact of a yard waste ban in Delaware might be. For purposes of this report, yard waste generation is defined as yard waste collected for both disposal and for diversion to composting operations1. By adding both figures, generation rates can be compared to the amount of yard waste collected in Delaware. When comparing data from state to state, several considerations must be kept in mind. First, yard waste is not universally defined. In all cases, yard waste includes grass and leaves (unless grass is separately broken out). In some cases it also includes brush and wood waste. However the distinction between large brush vs. wood waste (> 4” or > 6”) is not universal. DSM attempted to exclude tree stumps and large wood waste from the comparisons; although as discussed below it is not clear that the data always exclude this material. Second, not all waste composition studies distinguish between residential waste and waste from commercial, institutional and industrial sources. Therefore estimates for yard waste disposed may include just residential waste or commercial and institutional wastes as well. Clearly, adding commercial/business and institutional wastes, when comparing based on per capita disposal rates, can increase the per capita generation rate. To compensate for the impact of commercial waste on per capita disposal, DSM attempted to distinguish per capita yard waste disposed from residential streams only, when such data were available. As with disposal data, yard waste diversion data may also include non-household material. In addition, it may include brush, branches, tree stumps and, in some cases, food wastes. Because of varying definitions of yard waste, and varying methods of recording waste composition, per capita yard waste disposal and diversion vary significantly from state-to-state even within the same geographic area. Finally, and equally important, per capita yard waste disposal and diversion are driven by the institution of yard waste bans. As with the definition of yard waste however, there are many different types of “yard waste bans”. Some bans, especially those enacted at the county level, or at the landfill level, may be fully enforced bans where truckloads are regularly monitored during
1 As agreed in the scope of services for this project, DSM has not attempted to gather data on gross generation of yard waste, including amounts left on the lawn or managed through back yard composting or mulching. Data have only been gathered on reported disposal, and reported delivery to alternative processing facilities in surrounding states.
Final Report, September 15, 2004 3
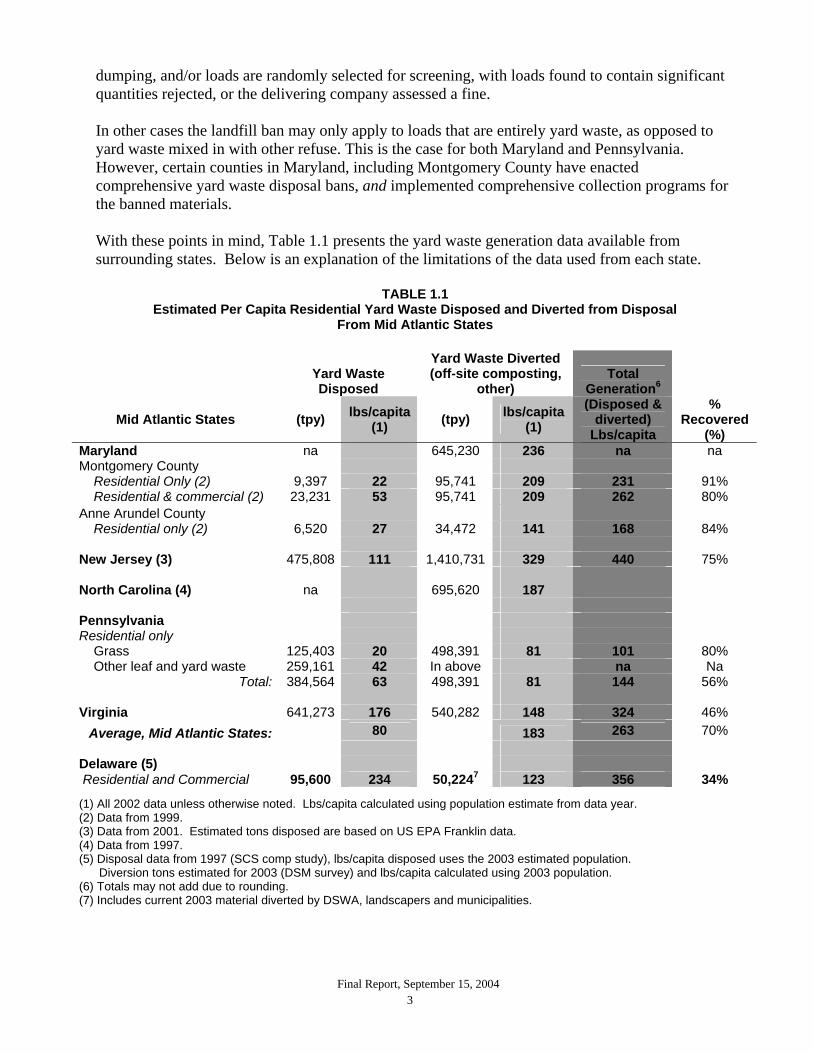
dumping, and/or loads are randomly selected for screening, with loads found to contain significant quantities rejected, or the delivering company assessed a fine. In other cases the landfill ban may only apply to loads that are entirely yard waste, as opposed to yard waste mixed in with other refuse. This is the case for both Maryland and Pennsylvania. However, certain counties in Maryland, including Montgomery County have enacted comprehensive yard waste disposal bans, and implemented comprehensive collection programs for the banned materials. With these points in mind, Table 1.1 presents the yard waste generation data available from surrounding states. Below is an explanation of the limitations of the data used from each state.
TABLE 1.1 Estimated Per Capita Residential Yard Waste Disposed and Diverted from Disposal
From Mid Atlantic States
Yard Waste Disposed
Yard Waste Diverted (off-site composting,
other) Total
Generation6
Mid Atlantic States (tpy) lbs/capita (1) (tpy) lbs/capita
(1) (Disposed &
diverted) Lbs/capita
% Recovered
(%) Maryland na 645,230 236 na na Montgomery County Residential Only (2) 9,397 22 95,741 209 231 91% Residential & commercial (2) 23,231 53 95,741 209 262 80% Anne Arundel County Residential only (2) 6,520 27 34,472 141 168 84% New Jersey (3) 475,808 111 1,410,731 329 440 75% North Carolina (4) na 695,620 187 Pennsylvania Residential only Grass 125,403 20 498,391 81 101 80% Other leaf and yard waste 259,161 42 In above na Na
Total: 384,564 63 498,391 81 144 56% Virginia 641,273 176 540,282 148 324 46%
Average, Mid Atlantic States: 80 183 263 70% Delaware (5) Residential and Commercial 95,600 234 50,2247 123 356 34%
(1) All 2002 data unless otherwise noted. Lbs/capita calculated using population estimate from data year. (2) Data from 1999. (3) Data from 2001. Estimated tons disposed are based on US EPA Franklin data. (4) Data from 1997. (5) Disposal data from 1997 (SCS comp study), lbs/capita disposed uses the 2003 estimated population. Diversion tons estimated for 2003 (DSM survey) and lbs/capita calculated using 2003 population. (6) Totals may not add due to rounding. (7) Includes current 2003 material diverted by DSWA, landscapers and municipalities.

Final Report, September 15, 2004 4
Maryland The State of Maryland bans separately collected loads of yard trimming from disposal. Recent waste composition data from the state of Maryland are not available. However, Table 1.1 does include yard waste diversion as reported by county governments to the Maryland Department of the Environment for 2002. More importantly, Montgomery County has had a yard waste ban in effect since 1994 and also keeps detailed records of yard waste collected for composting with certified truck scale weights used to record all incoming loads delivered to the County composting facility and recycling center. As shown in Table 1.1, in FY 2003, a total of 95,741 tons of leaves and grass were brought to the County composting facility which includes 14,563 tons of mulch that was loaded out from the recycling center. Combining the tonnage from these two facilities and dividing by the county’s 2002 population (918,000 residents) yields per capita diversion of 209 pounds in FY 2003. Note that this is yard waste material set-out for collection or delivered to drop-off locations, and is over and above materials that are mulched or composted on-site. Montgomery County also conducted a waste composition analysis in 1999 which included an analysis of the amount of yard waste delivered to disposal facilities. A recent Washington post article, “Drowning in a Tidal Wave of Trash”, by Steve Silverman, April, 11, 2004 discusses the significant increase in waste generation and the amount of recyclable material disposed of rather than recycled. He references the yard waste ban implemented in 1994 in Montgomery County that reduced the estimated 139,000 tons of yard and grass waste from being disposed in landfills or incinerators by 90%. Mr. Silverman is the Montgomery County Council President. Anne Arundel County also has a comprehensive yard waste collection program, and conducted a waste composition analysis in 1999 which shows similar per capita disposal rates to those in Montgomery County. Included in Table 1.1 is yard waste diverted from residential waste in 1999, the year that the waste composition study was completed.
New Jersey New Jersey has a statewide ban on disposal of leaves only. The New Jersey DEP publishes an annual report estimating the amount of solid waste generated and recycled. Estimates for generation were developed using the US EPA Franklin Associates Report of waste composition (a percentage of total MSW) modified to better reflect New Jersey’s waste stream. Yard waste generation for 2001 (the most recent year available) is estimated to be 1,886,539 tons, which is equivalent to 444 pounds per capita. In contrast, measured yard waste recycled (as reported to the NJ DEP by state recycling and composting facilities) totals 1,410,731 tons or 332 pounds per capita recycled. Yard waste reported as recycled includes leaves, grass clippings, stumps, brush and other lawn and garden trimmings from homes, institutions, commercial and industrial sources. New Jersey data are not comparable with surrounding state data because the quantities are based on total generation (using the Franklin Associates national model) rather than the amount available for disposal, as measured by a state specific waste composition study. As such, although the data are

Final Report, September 15, 2004 5
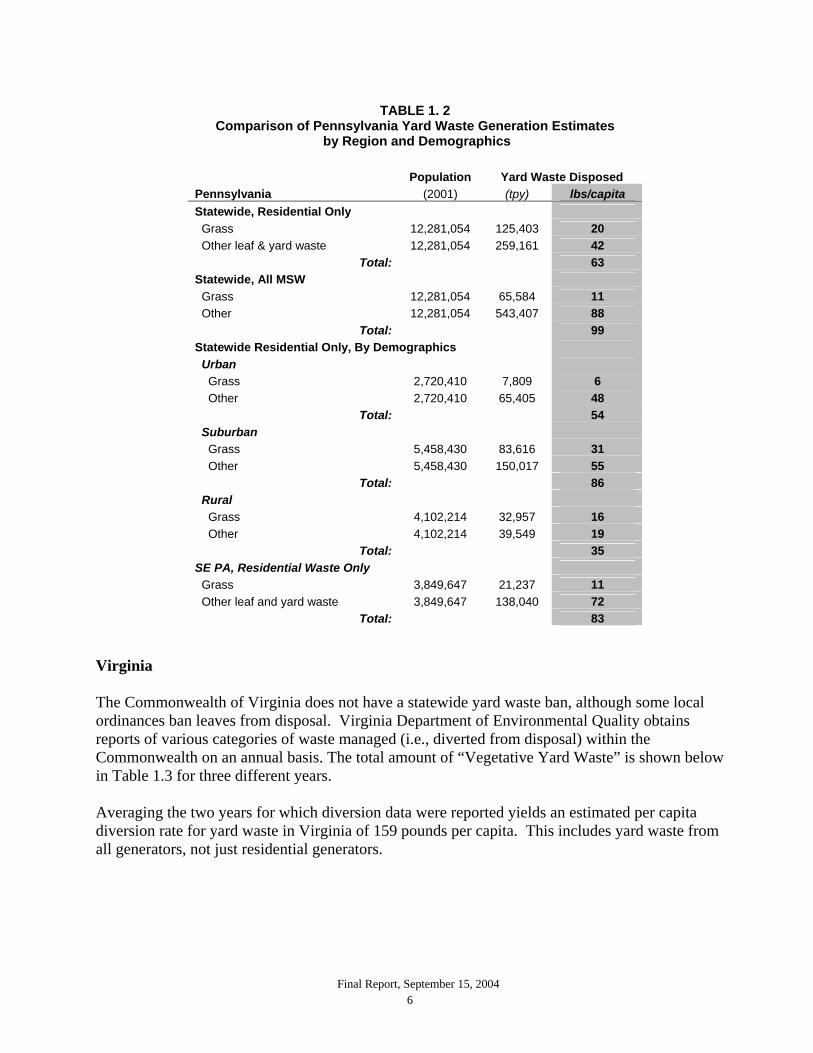
included in Table 1.1 because New Jersey borders Delaware, DSM has not used the data in the analysis of the impact of a yard waste ban on deliveries to Delaware landfills. Pennsylvania Pennsylvania’s ban on yard waste disposal is not really a comprehensive ban, but instead a restriction on the disposal of "truckloads composed primarily of leaf waste." The definition of "leaf waste" does not include grass clippings. This, in effect only bans truckloads comprised of 50% or more of yard waste. In addition, Pennsylvania regulations allow vegetation from land clearing activities to be used as "clean fill", as well as disposed in Construction/Demolition landfills. Pennsylvania performed a statewide waste characterization study in 2001. The study was done to determine the type and amount of recoverable materials disposed of in the state, by region, and by generator type (urban, suburban, rural). There were thirty-eight material categories of which two were yard waste–grass and yard waste-other. The yard waste-other category included “yard waste other than grass clippings such as leaves, garden trimmings, and brush up to 4 inches in diameter.” Based on the statewide study RW Beck estimated that 125,403 tons of grass and 259,161 tons of yard waste-other were being disposed in residential waste in the State in 2001, the year the study was conducted. The population of Pennsylvania was 12,281,054 at the time of the study, which equates to an average of 63 pounds per capita of residential yard waste being disposed on an annual basis. The Study also broke down the state into demographic categories -- urban, suburban and rural -- and into regions. The southeast region (population 3,849,647) borders Delaware. Residential waste generated in this region contained an estimated 160,000 tons (rounded) of grass and other yard waste, averaging 83 pounds per capita per year of grass and leaf and yard waste. There were significant differences in the quantity of yard waste found in urban, suburban and rural residential waste. As one would expect, per capita disposal is highest in suburban areas, and lowest in rural areas, with urban areas in-between. This is consistent with the fact that urban residents have smaller (or no) yards, suburban residents have larger yards, but less space to manage the yard waste on-site, while rural residents have more space to manage yard waste on-site. Table 1.2 presents more detailed data on yard waste generation for Pennsylvania based on the 2001 waste composition study.
Final Report, September 15, 2004 6
TABLE 1. 2 Comparison of Pennsylvania Yard Waste Generation Estimates
by Region and Demographics
Population Yard Waste Disposed Pennsylvania (2001) (tpy) lbs/capita Statewide, Residential Only Grass 12,281,054 125,403 20 Other leaf & yard waste 12,281,054 259,161 42
Total: 63 Statewide, All MSW Grass 12,281,054 65,584 11 Other 12,281,054 543,407 88
Total: 99 Statewide Residential Only, By Demographics Urban Grass 2,720,410 7,809 6 Other 2,720,410 65,405 48
Total: 54 Suburban Grass 5,458,430 83,616 31 Other 5,458,430 150,017 55
Total: 86 Rural Grass 4,102,214 32,957 16 Other 4,102,214 39,549 19
Total: 35 SE PA, Residential Waste Only Grass 3,849,647 21,237 11 Other leaf and yard waste 3,849,647 138,040 72
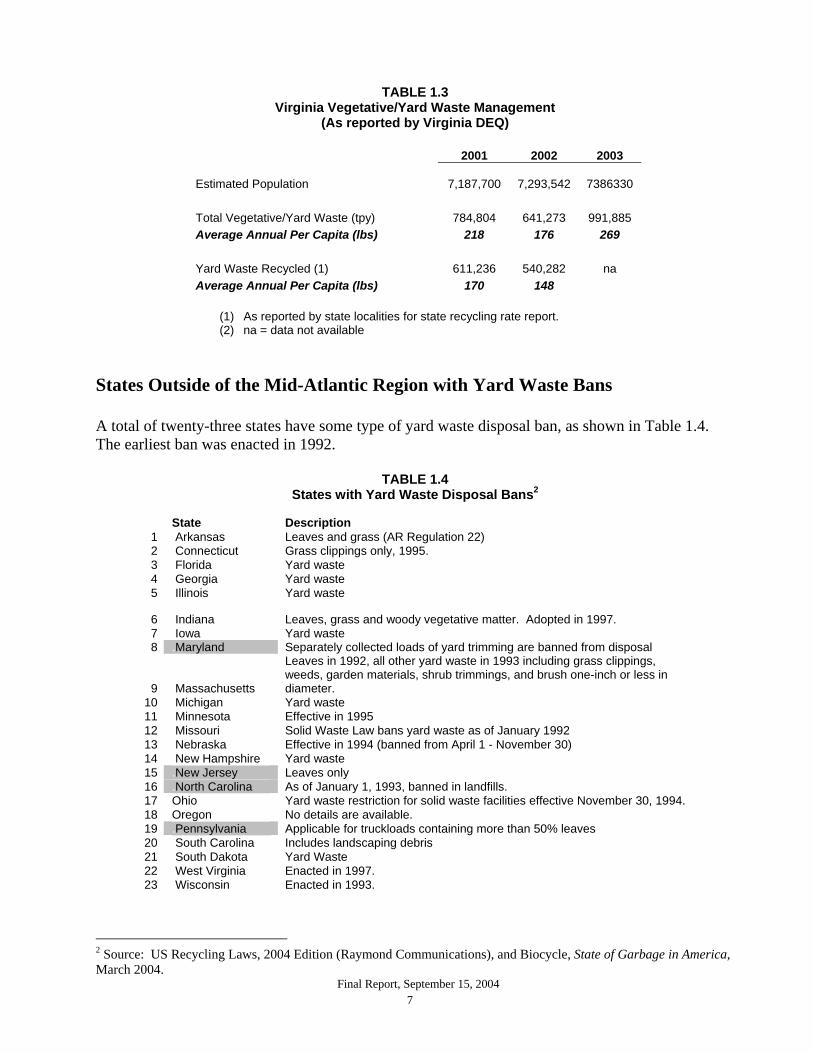
Total: 83 Virginia The Commonwealth of Virginia does not have a statewide yard waste ban, although some local ordinances ban leaves from disposal. Virginia Department of Environmental Quality obtains reports of various categories of waste managed (i.e., diverted from disposal) within the Commonwealth on an annual basis. The total amount of “Vegetative Yard Waste” is shown below in Table 1.3 for three different years. Averaging the two years for which diversion data were reported yields an estimated per capita diversion rate for yard waste in Virginia of 159 pounds per capita. This includes yard waste from all generators, not just residential generators.
Final Report, September 15, 2004 7
TABLE 1.3
Virginia Vegetative/Yard Waste Management (As reported by Virginia DEQ)
2001 2002 2003
Estimated Population
7,187,700 7,293,542 7386330 Total Vegetative/Yard Waste (tpy) 784,804 641,273 991,885 Average Annual Per Capita (lbs) 218 176 269 Yard Waste Recycled (1) 611,236 540,282 na Average Annual Per Capita (lbs) 170 148
(1) As reported by state localities for state recycling rate report. (2) na = data not available
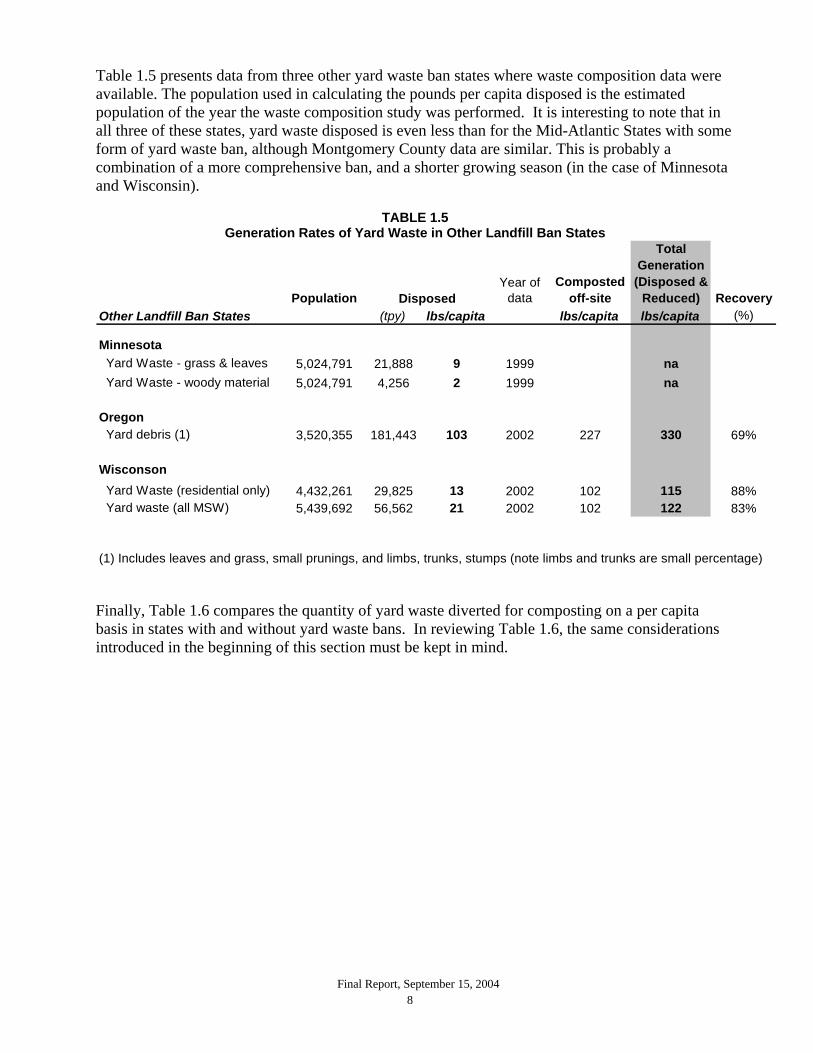
States Outside of the Mid-Atlantic Region with Yard Waste Bans A total of twenty-three states have some type of yard waste disposal ban, as shown in Table 1.4. The earliest ban was enacted in 1992.
TABLE 1.4 States with Yard Waste Disposal Bans2
State Description
1 .Arkansas Leaves and grass (AR Regulation 22) 2 .Connecticut Grass clippings only, 1995. 3 .Florida Yard waste 4 .Georgia Yard waste 5 .Illinois Yard waste
6 .Indiana Leaves, grass and woody vegetative matter. Adopted in 1997. 7 .Iowa Yard waste 8 .Maryland Separately collected loads of yard trimming are banned from disposal
9 .Massachusetts
Leaves in 1992, all other yard waste in 1993 including grass clippings, weeds, garden materials, shrub trimmings, and brush one-inch or less in diameter.
10 .Michigan Yard waste 11 .Minnesota Effective in 1995 12 .Missouri Solid Waste Law bans yard waste as of January 1992 13 .Nebraska Effective in 1994 (banned from April 1 - November 30) 14 .New Hampshire Yard waste 15 .New Jersey Leaves only 16 .North Carolina As of January 1, 1993, banned in landfills. 17 Ohio Yard waste restriction for solid waste facilities effective November 30, 1994. 18 Oregon No details are available. 19 .Pennsylvania Applicable for truckloads containing more than 50% leaves 20 .South Carolina Includes landscaping debris 21 .South Dakota Yard Waste 22 .West Virginia Enacted in 1997. 23 .Wisconsin Enacted in 1993.
2 Source: US Recycling Laws, 2004 Edition (Raymond Communications), and Biocycle, State of Garbage in America, March 2004.
Final Report, September 15, 2004 8
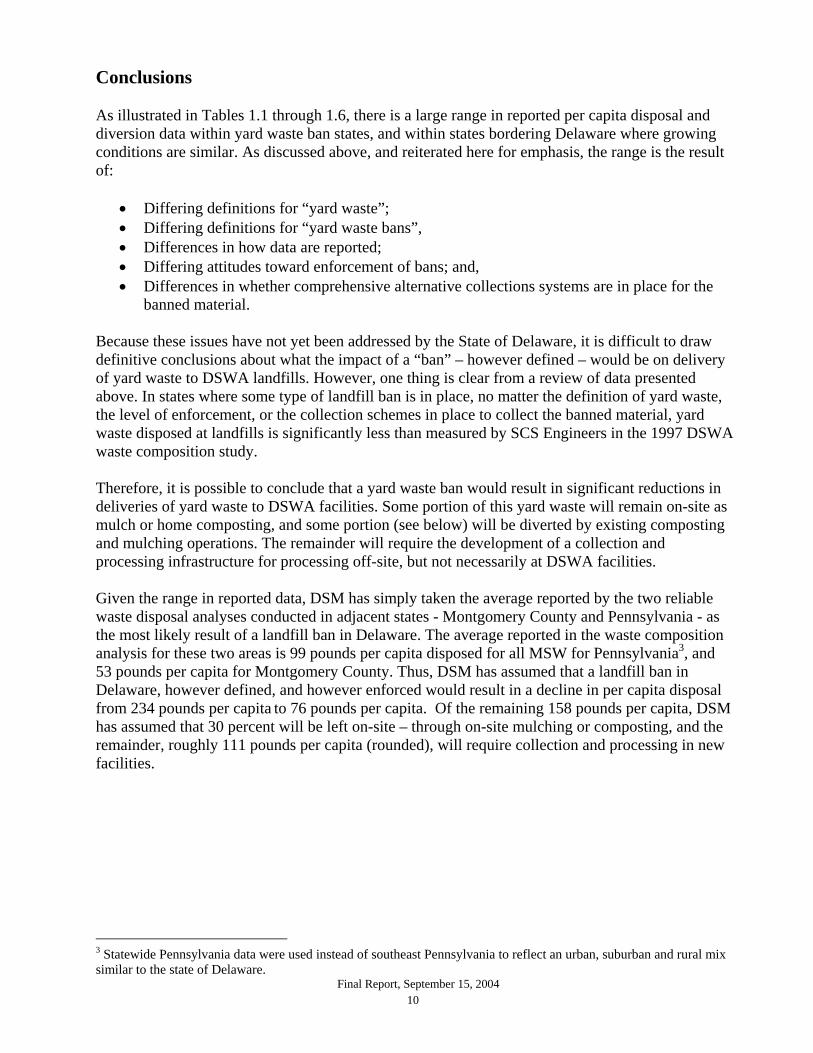
Table 1.5 presents data from three other yard waste ban states where waste composition data were available. The population used in calculating the pounds per capita disposed is the estimated population of the year the waste composition study was performed. It is interesting to note that in all three of these states, yard waste disposed is even less than for the Mid-Atlantic States with some form of yard waste ban, although Montgomery County data are similar. This is probably a combination of a more comprehensive ban, and a shorter growing season (in the case of Minnesota and Wisconsin).
TABLE 1.5 Generation Rates of Yard Waste in Other Landfill Ban States
PopulationYear of
dataComposted
off-site
Total Generation
(Disposed & Reduced) Recovery
Other Landfill Ban States (tpy) lbs/capita lbs/capita lbs/capita (%)
Minnesota Yard Waste - grass & leaves 5,024,791 21,888 9 1999 na Yard Waste - woody material 5,024,791 4,256 2 1999 na
Oregon Yard debris (1) 3,520,355 181,443 103 2002 227 330 69%
Wisconson Yard Waste (residential only) 4,432,261 29,825 13 2002 102 115 88% Yard waste (all MSW) 5,439,692 56,562 21 2002 102 122 83%
Disposed
(1) Includes leaves and grass, small prunings, and limbs, trunks, stumps (note limbs and trunks are small percentage)
Finally, Table 1.6 compares the quantity of yard waste diverted for composting on a per capita basis in states with and without yard waste bans. In reviewing Table 1.6, the same considerations introduced in the beginning of this section must be kept in mind.

Final Report, September 15, 2004 9
TABLE 1. 6
Comparison of Per Capita Yard Waste Diversion in States with and Without Yard Waste Bans
TABLE 1.6.A States Without Yard Waste Bans
Calendar Year 2002 Population Organics Diverted (1) Pounds per Capita State (census estimate) (tpy) (lbs/year) .Arizona 5,441,125 316,124 116 .Colorado 4,501,051 15,871 7 .Delaware (2) 805,945 32,360 80 .Kentucky 4,089,822 16,645 8 .Louisiana 4,476,192 83,444 37 .Maine 1,294,894 50,084 77 .Nevada 2,167,455 12,675 12 .New Mexico 1,852,044 12,122 13 .Oregon 3,520,355 443,966 252 .Tennessee 5,789,796 162,347 56 .Vermont 616,408 29,626 96 .Virginia 7,287,829 540,282 148 .Washington 6,067,060 539,717 178 Average, per capita: 83
TABLE 1.6.B States With Yard Waste Bans (where data were available)
Population Organics Diverted (1) Pounds per Capita State (census estimate) (tpy) (lbs/year) .Connecticut 3,458,587 235,816 136 .Hawaii 1,240,663 794,091 1,280 .Iowa 2,935,840 294,978 201 .Maryland 5,450,525 645,230 237 .Massachusetts 6,421,800 443,147 138 .Michigan 10,043,221 739,904 147 .Minnesota 5,024,791 167,529 67 .Missouri 5,669,544 394,966 139 .New Hampshire 1,274,405 37,114 58 .New Jersey 8,575,252 1,410,731 329 .North Carolina 8,305,820 648,068 156 .Pennsylvania 12,328,827 498,391 81 .South Carolina 4,103,770 72,500 35 .South Dakota 760,437 134,712 354 .West Virginia 1,804,884 680 1 .Wisconsin 5,439,692 225,240 83 Average, per capita 215 (1) Source: Biocycle, 2004 unless bolded. If bold, state reported records used instead. (2) DSWA reported total to DSM @ 80,000 tpy which included 50,000 tpy reported by one processor.
Final Report, September 15, 2004 10
Conclusions As illustrated in Tables 1.1 through 1.6, there is a large range in reported per capita disposal and diversion data within yard waste ban states, and within states bordering Delaware where growing conditions are similar. As discussed above, and reiterated here for emphasis, the range is the result of:
• Differing definitions for “yard waste”; • Differing definitions for “yard waste bans”, • Differences in how data are reported; • Differing attitudes toward enforcement of bans; and, • Differences in whether comprehensive alternative collections systems are in place for the
banned material. Because these issues have not yet been addressed by the State of Delaware, it is difficult to draw definitive conclusions about what the impact of a “ban” – however defined – would be on delivery of yard waste to DSWA landfills. However, one thing is clear from a review of data presented above. In states where some type of landfill ban is in place, no matter the definition of yard waste, the level of enforcement, or the collection schemes in place to collect the banned material, yard waste disposed at landfills is significantly less than measured by SCS Engineers in the 1997 DSWA waste composition study. Therefore, it is possible to conclude that a yard waste ban would result in significant reductions in deliveries of yard waste to DSWA facilities. Some portion of this yard waste will remain on-site as mulch or home composting, and some portion (see below) will be diverted by existing composting and mulching operations. The remainder will require the development of a collection and processing infrastructure for processing off-site, but not necessarily at DSWA facilities. Given the range in reported data, DSM has simply taken the average reported by the two reliable waste disposal analyses conducted in adjacent states - Montgomery County and Pennsylvania - as the most likely result of a landfill ban in Delaware. The average reported in the waste composition analysis for these two areas is 99 pounds per capita disposed for all MSW for Pennsylvania3, and 53 pounds per capita for Montgomery County. Thus, DSM has assumed that a landfill ban in Delaware, however defined, and however enforced would result in a decline in per capita disposal from 234 pounds per capita to 76 pounds per capita. Of the remaining 158 pounds per capita, DSM has assumed that 30 percent will be left on-site – through on-site mulching or composting, and the remainder, roughly 111 pounds per capita (rounded), will require collection and processing in new facilities.
3 Statewide Pennsylvania data were used instead of southeast Pennsylvania to reflect an urban, suburban and rural mix similar to the state of Delaware.

Final Report, September 15, 2004 11
SECTION 2: LANDSCAPER SURVEY
A previous study by the University of Delaware4 surveyed residents regarding their behavior in handling yard waste. The results indicated that eight percent of households in Delaware contract with landscapers to remove grass from the property and five percent contract with landscapers to remove leaves. Four percent of households contracted with landscapers to remove brush and prunings. Given the number of households relying on landscapers, one of DSM’s tasks was to conduct a survey of landscapers to determine how they are managing yard waste, and what the impact of a ban would be on these, typically, small businesses. DSM gathered information regarding landscaper collection and disposition of yard wastes by surveying a sample of the state’s landscaper community. Information was gathered from twenty-two landscapers. This sample represents approximately seventeen (17%) of the landscapers listed as operating within the state. Table 2.1 summarizes the distribution of the landscapers by county. 5
TABLE 2.1 Landscapers Surveyed
County Total
Landscapers by County
% of Total
Landscapers Surveyed by DSM1
% Respondents by County
New Castle 81 61% 17 21%
Kent 17 13% 3 18%
Sussex 34 26% 7 21%
TOTAL 132 100% 22 17%
(1) DSM surveyed a total of 22 landscapers, but, some landscapers work in multiple counties, they were counted in each county they work in. The total in this column reflects that fact.
Landscaper Services Typically, landscapers provide services for grass, leaves, prunings and wood removal. In some cases (the other in Table 2.2) landscapers also provide miscellaneous services such as fencing, sod establishment, and snow removal.
4 Ratledge, E.C. (1999), Recycling in Delaware: Public Actions and Perceptions

Final Report, September 15, 2004 12
TABLE 2.2 Landscaper Services
Services Provided Number providing specific services % of Total Respondents
Grass Cutting 18 82%
Fall Leaf Removal 18 82%
Shrub Pruning 22 100%
Tree & Wood Removal 15 68%
Other 2 9%
Total Surveyed 22
As can be seen, the primary services offered are shrub pruning, leaf removal and grass cutting. For larger brush and wood, the service provided was infrequent and most often at the end of winter or after a storm. As such, the respondents did not offer any reliable estimate of how much material was generated on an annual basis. Clients Serviced Table 2.3 provides an indication of the relative size of the landscaping companies surveyed based on the number of clients serviced on a weekly basis.
TABLE 2.3 Size Of Landscaper Client Base
Clients per Week % of Respondents
5-25 47%
26-100 35%
101-200 12%
> 200 6%
100%
As can be seen, many of these enterprises are quite small, generally a sole-proprietorship with a single crew of 2 to 3 people. The largest company surveyed operated six crews. Grass Generation Although a few landscapers provide lawn maintenance service all year round, the majority provide service from late March through October. Based on the grass-growing season, the majority of the volume of material generated reportedly occurs from April through mid-July on a typical year. Then, due to lack of moisture and elevated temperatures, grass growth drops substantially in late July and August, picking up again during September.

Final Report, September 15, 2004 13
Table 2.4 indicates the breakdown of responses regarding removal of grass from the property. In those cases where grass was not removed, the primary reason was the use of mulching mowers.
TABLE 2.4 Landscaper Grass Removal
% of Grass Removed % of Respondents
100% 17%
≥ 50% < 100% 17%
≥ 5% < 50% 22%
> 0% < 5% 11%
0% (none removed) 33%
100%
As can be seen, approximately one-third of the respondents leave all the grass on the property. Another third of the responses indicate at least 50% of the material generated by their service is left on the property. Those respondents that removed grass from the lawn estimated removing 3 to 4 bags per half acre. This translates to approximately 1 cubic yard per acre. Table 2.5 reflects the number of acres serviced by respondents on a weekly basis. A majority of the respondents tended to service ¼ to ½ acre lawns.
TABLE 2.5 Landscaper Acres Serviced Per Week
Acres per Week % of Respondents
1-10 35%
11-30 17%
31-75 41%
> 75 7%
100% Leaf Generation As would be expected, the majority of leaf cleanup occurs during a 4-6 week period from late October through mid-December. There is also a small amount of leaves generated during spring cleanup. Most of this is handled in a similar fashion as grass management during this time of year. During this intensive leaf season, the landscapers may take on more crews to service an expanded (seasonal) client list. Table 2.6 reflects the range of clients per week that landscapers service during the leaf season.

Final Report, September 15, 2004 14
TABLE 2.6
Landscaper Leaf Season Clients
Clients per Week % of Respondents
1-25 37.5%
26-100 37.5%
> 100 25%
100% When dividing the number of clients serviced by the tonnage reported of leaves collected, a clean-up rate of approximately 530 pounds per client per season was reported. Table 2.7 presents the breakdown of responses regarding removal of leaves from the property. In those cases where leaves were not removed, the primary reason reported was that the leaves were diverted to backyard composting or reduced by mulching mowers and left to decompose. As illustrated by Table 2.7, 90% of the landscapers remove all leaves from the property.
TABLE 2.7 Landscaper Leaf Removal
% of Leaves Removed % of Respondents
100% 90%
50% - 100% 10%
< 50% 0%
100%
Leaf and Grass Disposal DSM’s objective in surveying landscapers was to ascertain what percentage of the material collected by landscapers went to DSWA facilities. Table 2.8 summarizes the results of DSM’s survey of landscapers and how they indicated they disposed of the of the yard waste they removed from the property.
TABLE 2.8
Landscaper Disposition Of Grass And Leaves
Material Non-DSWA Alternatives (tons/week) % of Total DSWA
(tons/week) % of Total
Grass 26 96% 1 4%
Leaves 368 80% 93 20%
As can be seen, only four percent of the grass removed by landscapers reaches DSWA facilities. During leaf season, only 20 percent of the leaves removed by landscapers are disposed of at DSWA facilities. Respondents were somewhat reticent to say where they do take leaves and grass, but

Final Report, September 15, 2004 15
those that responded mentioned alternatives such as local farms, their own site, where they create a mulch/compost product, and infrequently mulching companies. The following table takes these weekly figures from the sample of landscapers surveyed and projects the annual tons that could be generated. If one were to assume the high grass season of 20 weeks and a leaf season of four weeks, the annual amount of leaves and grass being diverted to DSWA facilities by the surveyed landscapers is approximately 372 tons of leaves and 20 tons of grass.
Table 2.9 Projection of Annual Landscapers Leaves and Grass Going to DSWA
Survey Sample
Weekly Amount (tons)
Annual Season (weeks)
Projected Annual Amount from Survey
Sample (tons)
Annual Amount Projected for All
States Landscapers (tons)
Grass 1 20 20 118 Leaves 93 4 372 2188
Total 94 392 2306 DSM surveyed approximately 17 % of the landscapers within the state. Assuming the survey is representative of the average landscaper, and then projecting our total of 392 tons of leaves and grass across the entire landscaper population yields an estimate of 2300 annual tons (rounded) disposed of at DSWA facilities by landscapers. This 2300 annual tons is approximately 50% of the 4500 tons of yard waste6 that DSWA recorded receiving in the 2003 season. The remaining source separated material tonnage arriving at DSWA facilities could therefore be attributed to residential brush delivery, commercial accounts and municipalities. The material generated by landscapers but diverted from DSWA facilities is summarized in the table below. The total is a statewide projection based on 17% of the state’s landscapers participating in the survey.
Table 2.10 Landscaper Material Diverted from DSWA Facilities
Survey Sample
Weekly Amount (tons)
Annual Season (weeks)
Projected Annual Amount from Survey
Sample (tons)
Annual Amount Projected for All
Landscapers (tons)
Grass 26 20 520 3059
Leaves 368 4 1472 8659
Total Diverted
11,718
6 Provided to DSM by DSWA 7/12/2004. It represents yard waste diverted, mulched and used at DSWA landfills.

Final Report, September 15, 2004 16
Brush and Wood Although estimates were given by the respondents regarding the amount of grass and leaves that they disposed of on a weekly basis, the respondents could not estimate the amount of prunings or wood removed from the site. For the prunings, the material was mixed in with the grass or leaves, so a separate estimate could not be made for the quantity of this material. For larger brush and wood, respondents provided an estimate of the percentage of what was generated being diverted to a DSWA facility, but due to the infrequent nature of this service, they did not have a sound estimate of the quantity of material. Table 2.10 summarizes the percentage of larger brush removed that is destined for a DSWA facility.
TABLE 2.11 Landscaper Disposition of Brush
Brush Generated Destined for DSWA % of Respondents
100% 40%
50% 10%
0% 50%
100%
Although 50 % of the respondents indicated some brush removed from clients was destined for DSWA facilities, a general theme voiced by many of the landscapers was their preference to chip the material and either leave it on site or stockpile it, for use on other landscaping projects. Taking it to a DSWA facility was a last resort due to the high tipping fee and high transport cost, and it was usually only done during post-storm cleanup. Conclusions When combining information from this survey with previous information gathered about homeowner management of yard waste, one can begin to understand the degree of impact landscapers have on the management of yard waste in the state. Landscapers are servicing only approximately eight percent of the households in the state. Of these households, only 24 percent of grass and leaves is taken to DSWA facilities. What is evident is that leaves rather than grass have a greater impact upon what is diverted to DSWA facilities. However, for both yard waste streams, many landscapers have found alternative diversion strategies to avoid paying the DSWA tipping fee. Given that 96 percent of the grass and 80 percent of the leaves removed by the surveyed landscapers goes to non-DSWA facilities, it is DSM’s conclusion that in the event of a yard waste ban at DSWA facilities, landscapers could find alternative disposal/utilization locations for the remaining material currently disposed of at DSWA facilities.
Final Report, September 15, 2004 17
SECTION 3: SURVEY OF MUNICIPAL YARD WASTE PROGRAMS
DSM gathered information on municipal collection and disposition of yard wastes by interviewing persons responsible for managing yard waste, and observing existing composting/mulching operations from a sample of eighteen Incorporated Areas in Delaware. This sample represents twenty-three percent (23%) of the entire State’s population, but eighty percent (80%) of the State’s population in Incorporated Areas7. Communities surveyed included:
Arden Millsboro Ardencroft New Castle Ardentown Newark Bellefonte Newport Delaware City Rehoboth Beach Dover Seaford Elsmere Ocean View Georgetown Townsend Middletown Wilmington
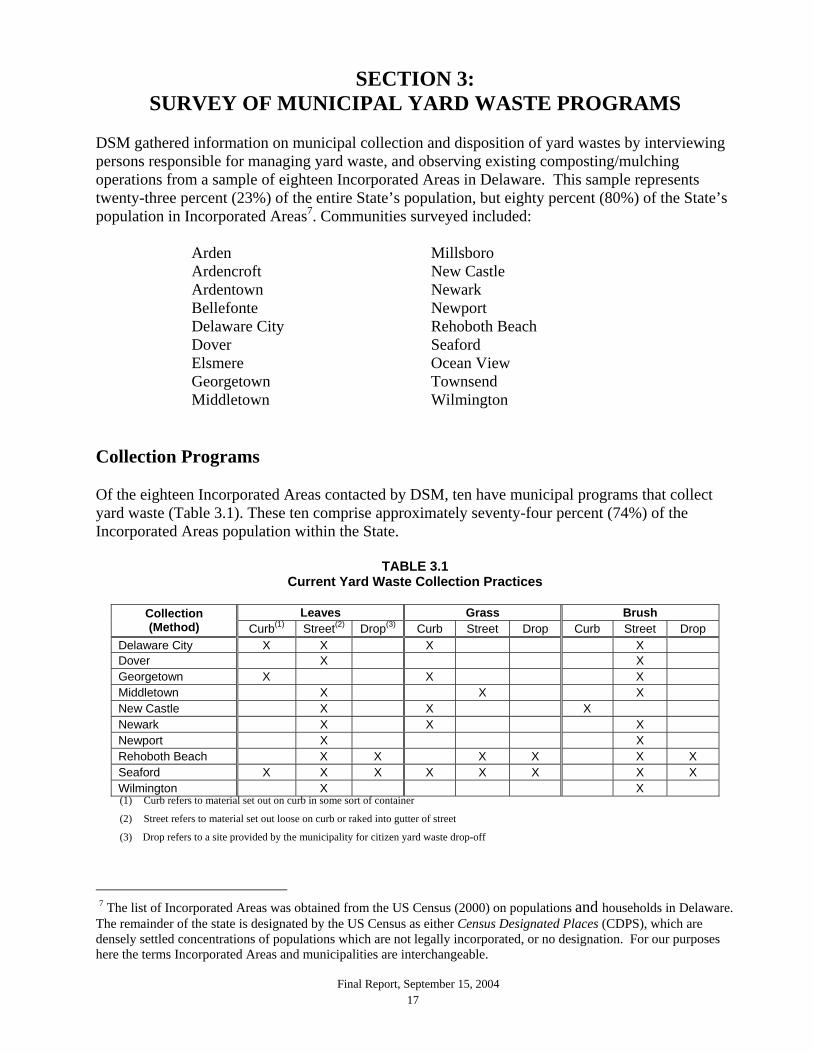
Collection Programs Of the eighteen Incorporated Areas contacted by DSM, ten have municipal programs that collect yard waste (Table 3.1). These ten comprise approximately seventy-four percent (74%) of the Incorporated Areas population within the State.
TABLE 3.1 Current Yard Waste Collection Practices
Leaves Grass Brush Collection
(Method) Curb(1) Street(2) Drop(3) Curb Street Drop Curb Street Drop Delaware City X X X X Dover X X Georgetown X X X Middletown X X X New Castle X X X Newark X X X Newport X X Rehoboth Beach X X X X X X Seaford X X X X X X X X Wilmington X X (1) Curb refers to material set out on curb in some sort of container
(2) Street refers to material set out loose on curb or raked into gutter of street
(3) Drop refers to a site provided by the municipality for citizen yard waste drop-off
7 The list of Incorporated Areas was obtained from the US Census (2000) on populations and households in Delaware. The remainder of the state is designated by the US Census as either Census Designated Places (CDPS), which are densely settled concentrations of populations which are not legally incorporated, or no designation. For our purposes here the terms Incorporated Areas and municipalities are interchangeable.
Final Report, September 15, 2004 18
As illustrated by Table 3.1, all ten surveyed Incorporated Areas collect leaves and brush. Seven, excluding Wilmington, Newport and Dover, also collect grass. Although Middletown and Delaware City offer leaf collection all year, all surveyed municipalities reported that the majority of material is collected over a four to six week period in the fall. Some also reported a spike of leaf collection during early spring, during the period of initial yard clean up and maintenance. The majority of surveyed municipalities estimate that close to 100 % of the households participated in the leaf collection program. Grass collection is offered throughout the grass-growing season. May, June and early July are the largest grass generating months, with somewhat less generation in April, August, September and October. 8 Some communities felt that all households participated regularly in the grass collection programs. Others, such as Middletown and Newark, estimated that 50% or less of the households participate. Brush collection seemed to be year-round for most communities. However, brush did not have a specific program similar to grass and leaves. Often, brush was picked up when grass was set out for collection. Alternatively, some surveyed municipalities only collected brush when residents called and scheduled a pick-up. Some surveyed municipalities also provided drop-off areas where residents could bring brush. Most surveyed municipalities indicated that at one time or another during the year almost all residents took advantage of brush collection or drop-off program. Collected Yard Waste Quantities The quality of information regarding amounts of yard waste collected varied among the municipalities surveyed. Four survey communities, Rehoboth Beach, Wilmington, Newark and Delaware City provided actual information regarding specific amounts of yard waste collected. For two surveyed municipalities that did not provide historic data on materials collected, DSM was able to estimate quantities by measurement of existing yard waste piles at the municipal sites. Such an estimate was possible if the piles were segregated by year. Based on assumptions regarding size reduction of material, an estimate of the original volume of material collected on the street was made. This could then be translated into weight using a standard density coefficient. Where piles had been mixed, whether by material or year, or material had been removed from the municipality at the time of the site visit, an estimate of the amount of material generated had to be made. Such estimates require: 1) knowing what material was targeted for collection; 2) utilization of a coefficient of yard waste generation per household; and 3) combining the generation coefficient with an assumption of the participation rate for materials collected. Table 3.2 reflects DSM’s best estimate of yard waste collected in 2003, by weight, from the surveyed municipalities. Table 3.2 is segregated by the method utilized to estimate the amount of material collected. The results are reported in annual tons. The amount collected by surveyed municipalities totaled 9006 tons.
8 Delaware City was the only community that supplied monthly records of total yard waste collected. However, last summer was unusually wet so the length of the high grass season may have been somewhat extended.

Final Report, September 15, 2004 19
TABLE 3.2
Annual Yard Waste Tonnage Collected (Annual Tons)
Community Recorded (1) Pile Dimension Measurement(2) Estimated(3) Total
Delaware City 160 160
Dover 2500 2500
Georgetown 407 407
Middletown 653 653
New Castle 500 500
Newark 2520 2520
Newport 77 77
Rehoboth Beach 1034 1034
Seaford 530 530
Wilmington 625 625
Total 4339 3000
1667 9006
(1) Tonnages provided by community (2) Tonnages estimated from volumes at municipal disposal/mulching site (3) Estimated tonnages based upon number of households, generation rate per household, 75% participation assumed
Factors impacting the accuracy of these numbers are as follows. First, it is likely that Table 3.2 underestimates the total brush collected. This can be attributed in a large part to the fact that brush collection was not recorded separately by surveyed municipality, other than Seaford, and estimates by brush pile size were not possible due to the fact that communities mixed multi-year brush and other woody debris together. Second, Table 3.2 may overestimate grass generation. This is due to the fact there is no collected data on household participation in the grass collection program. The estimates provided by those interviewed ranged from 100 % down to as low as 20%, but these could not be substantiated by any recorded data. The numbers in the table that are demarcated as estimates are based on a yard waste household generation coefficient assuming a 75% participation rate in the yard waste collection programs. Unlike grass collection, there is far greater certainty from those interviewed regarding participation in leaf collection. Most felt that the majority (close to 100%) of residences participated in the leaf collection program, with the majority of material being collected during the fall leaf season. Yard Waste Diversion Of all the municipalities that have instituted a separate collection program, only Wilmington and Middletown are sending their material to DSWA facilities. Deliveries to DSWA facilities from these two municipalities are approximately 1278 tons (Table 3.2). The other municipalities use a combination of passive composting/mulching, or simply stockpile the collected material at a designated site within the municipality.

Final Report, September 15, 2004 20
Delaware City Delaware City contracts with a private firm that provides weekly service to all households for grass and brush collection. A single crew collects yard waste in plastic bags and subsequently debags the material at a site within the community. It is reported that almost all the 750 households participate in the separate weekly yard waste collection, with approximately 10% participating in any one week. During the height of the grass season this can be as many as 125 bags that need debagging per week. It is also reported that 80% of the households set out their leaves in the fall. For this six-week period, two crews have been collecting leaves in plastic bags. At the height of the leaf season this translated to 500 bags per week being debagged. The private collector has recently purchased a tow-behind leaf vacuum unit and projects that a single crew can service the entire community during leaf season. This will necessitate re-educating the community to not bag their leaves but instead rake them to the curb. The company collecting the yard waste transfers the material to their landscaping business site in town. The leaves and grass are mulched, but not composted. The wood and brush are processed by a tub-grinder, which is contracted to service the site once a year. All material is used by the landscaper or sold to others that are looking for top-dressing and/or soil amendments. The current site is small and at capacity for handling Delaware City’s yard waste. During specific times of year, neighbors have voiced complaints of odor, and during the site visit, run-off from the brush pile was observed migrating off-site.
Dover Dover collects leaves and brush but not grass. Brush is collected at the curbside when a resident calls for pick-up. Leaves are primarily collected for three months in the fall and early winter, with a supplemental collection during spring-clean out. Dover estimates that almost all the 7500 households rake their leaves to the curb for collection by City crews. During the leaf season, the City has three tow-behind vacuum units on the street and operates an additional vacuum unit mounted on a truck for areas that are hard to access with the other equipment. Dover maintains a municipal leaf and yard waste site. It was apparent during DSM’s site visit that Dover had more than one season of leaves on site. In addition there was a large pile of brush and wood that had not been sized reduced. On questioning, the City indicated that there were no plans for collecting grass. They feel that the site they currently utilize would be too small to receive grass. Based on pile sizes, it is estimated that approximately 2500 tons of leaves are collected annually, with at least two years of material presently on the site.

Final Report, September 15, 2004 21
Georgetown
Georgetown collects leaves, grass and brush from residents. Leaves and grass are collected in plastic bags curbside. Brush is set out on the curb for collection. Leaves are collected primarily from October to early December. Grass is collected from April through October, and brush is collected all year but only when residents call for a pick-up. Georgetown estimates that there is a very high participation rate in setting out both grass and leaves. Brush setout is spotty so it is hard to determine how many households participate through the year. During the grass season, a two-man crew goes out with a packer to collect grass. During leaf season another truck and an additional worker is added to each crew. The material is taken to a small (1.5 acre) site, where it is first debagged then piled for passive mulching.
Middletown Middletown provides weekly leaf and yard waste collection to all households throughout the year using the street crew. The municipality is divided into five collection routes, each being serviced once per week. It is estimated approximately 50 percent of the municipality’s 5000 households participate in the weekly grass and brush collection. The street crews used to collect material in bags with brush loose. They now have three vacuum units, with impellers, for leaves. Intensive leaf collection season goes from October to mid-December. Middletown estimates that almost all the households participate in the leaf collection. Leaves, grass and brush are collected loose and put into a stake-body truck. Material is taken to a temporary disposal site, where the brush is chipped and used by town crews. They also encourage town residents to take chips. There is no composting operation at the site. The remaining material naturally mulches and the town utilizes some of the cleaner material. The bulk of the yard waste material is taken to DSWA’s Pine Tree Corners transfer station for disposal. No records are kept of material collected.
New Castle New Castle has historically collected leaves during the autumn and brush periodically set out on the curb. For the latter, they will respond to citizen’s request to collect the material. In addition, they periodically do a major collection of storm-generated brush and associated driftwood that washes up on the City’s shoreline. New Castle estimates that almost 100% of the community’s 1200 residents participate in the leaf collection, and through the year they estimate serving every house at least once for brush/prunings collection. There is no estimate of how much brush they collect, but based on last year’s volume on the City’s site they collected approximately 400 cubic yards of leaves. Residents rake the leaves to the curb, and the municipality collects the leaves with a tow-behind vacuum unit. Although they collect leaves throughout the year, the bulk of the material collected is

Final Report, September 15, 2004 22
for 4-6 weeks in the autumn. At that time, they may increase their single collection crew to three separate crews out on the streets. Leaves are taken to a town site and passively composted in windrows. It appears they are producing a mulch product, rather than compost. Currently, the municipality utilizes this material around planting beds and tree bases. The brush is piled, smaller material is chipped and the larger material is being stockpiled, with the expectation that a tub-grinder will be brought in at some time in the future. Currently, grass not left on the lawn may be going into the garbage stream. New Castle is considering starting a grass collection program, with grass set out in a separate container and collected weekly using a refuse packer truck. Grass will be taken to the municipal site to be composted with the leaves. A new recycling ordinance is currently winding its way through the local approval process that will, in effect, ban yard waste from the garbage stream.
Newark In 2003, Newark reportedly collected 357 tons of grass and 2163 tons of leaves. The preference from DPW is not to have to deal with this material because of the constant fielding of complaints from citizens. For leaves, they have one Vac-all (used the rest of year for drain cleanout), and three tow-behind vacuum units with impellers (for size reduction). The collection season runs approximately six weeks for leaves. During the heaviest part of the leaf season the four leaf vacuum-crews may only get to certain parts of the City once every week and a half. They do estimate close to 100% of the 7251 households participate in the leaf collection program in the fall. Grass and small brush is collected from containers on Saturday using the 7 packers they use to pick up refuse during the rest of the week. The City estimated as low as 20% and as high as 50% participation rate on any one Saturday collection day. If they still find grass set out separately on the regular trash day, they do not pick it up. It was observed that yard waste is still getting into the regular garbage. The City disposes of the collected material at a municipal site that is operated near or at capacity. Although windrows are formed, the City is creating mulch, not a compost product. Year-old material is placed outside the gate for residents to take. However, based on what was observed at the site, use of the material by residents and the City is not keeping up with the generation of mulch. Newport Newport had historically collected both grass and leaves. Grass was collected in containers, but was discontinued a few years ago. Leaves have previously been raked to the curb and then subsequently vacuumed and sized reduced and blown into a truck. Newport estimates that 100% of the 225 residences have participated in the collection program. Leaves are currently disposed of on an open parcel within the community. This parcel is up for sale so this option is no longer available. Newport is hoping to join with New Castle (see above) and send all their yard waste to the New Castle yard waste site. If this occurs, it is projected that leaves

Final Report, September 15, 2004 23
will continue to be collected via tow-behind vacuum units and the grass will be set out in containers and collected by a refuse packer that comes around once per week.
Rehoboth Beach Rehoboth Beach offers both curbside collection and a drop-off location for citizens’ yard waste. They collect leaves and brush material all year from approximately 3600 households. Rehoboth Beach does not separately collect grass, and assume that the majority of grass clippings are disposed with refuse. Leaves are raked to the curb, with most being collected in the autumn and during spring cleanup. During the fall and spring, material is collected once per week from all the households. The leaves are vacuumed and size-reduced before being blown into a truck. This material is taken to a 2.6-acre site and turned occasionally to create a mulch product. Brush and Christmas trees are also collected and chipped, and along with the mulch leaves, offered to residents who are willing to come to pick it up.
Seaford Seaford had historically collected grass, leaves and brush. They collect throughout the year but the leaf season produces the greatest volume. They also collect at the curb and provide a citizen drop-off site. They serve 100% of the 3400 households, and it is estimated that 80% participate in the yard waste collection program. Primarily, residents use plastic bags for setting-out leaves, grass and prunings. Brush is collected loose. During this leaf season, residents are asked not to bag leaves so that they can be collected at the curb by a vacuum unit. All the material is taken to a municipal site. Seaford contracts with a construction contractor to periodically come in with a machine to push material and do some selective grinding of woody items. The mulching piles observed were heavily contaminated with plastic and often the contractor would just push and spread the piles when the site needed leveling.
Wilmington
Wilmington’s leaf waste collection is offered from the beginning of October through mid-December and people are encouraged to rake leaves to curb, where the city collects using a combination of vacuum trucks and regular trucks with front loaders. Wilmington estimates that they collect 350 – 400 tons of leaves last year. Most leaves are picked up in storm gutters with vacuum units; however, they do offer special yard waste pick-up by appointment. Previously, Wilmington disposed of the leaves at a facility which mixed the leaves with Conectiv (electric utility) fly ash and with biosolids from Wilmington’s WWTF to produce landfill cover for DSWA landfills. Sludge disposal on the Cherry Island landfill has subsequently ceased. Wilmington now sends their material directly to the DSWA facility and pays a tipping fee for disposal.

Final Report, September 15, 2004 24
Information was also provided for Wilmington’s Parks Department. All material generated in the parks stays within the community. They take leaves to a park for passive composting, which results in a mulch product that are used within the parks. Periodically, they run out of room and then take leaves directly to a DSWA facility. But this is infrequent and they have no estimate of how much this may be. Limbs and brush are chipped and used on walking trails. Large trees are chopped up and made available as firewood to the public and employees.
Other Communities The following Incorporated Areas were also surveyed about their collection of yard waste. All indicated that they had no separate collection for yard waste.
• Arden • Ardencroft • Ardentown • Bellefonte • Elsmere • Millsboro • Ocean View • Townsend
Conclusions The information gathered through this municipal survey provides a good snapshot of how yard waste is being managed in Delaware’s Incorporated Areas. Based on those surveyed, smaller municipalities, with less then 1000 people, typically do not manage yard waste through a separate collection program. For those communities that do collect leaves, the preferred method is tow-behind vacuum units, with size reduction impellers that blow leaves into an enclosed truck. This collection method necessitates residents raking leaves into the street for collection. Participation in these leaf collection programs is high, with the majority of the leaves being collected over a 4 to 6 week period in the fall. Grass collection is not as prevalent within these communities and the method of grass collection varies from manual collection off the curb, to bagging and subsequent debagging, or use of barrels. Those interviewed indicated that participation in a grass collection program might not be as high as for leaves. The grass collection season runs from spring through the fall, with a large component collected in late spring and early summer. Brush generated by residents does not seem to follow any set collection schedule for this material alone. Often brush is set out with the grass and they are collected together. Many of the communities surveyed indicated they do collect brush in response to a call by residents. In addition, some communities have designated drop-off sites for brush. Brush collection can occur all year, with spikes in brush generation at the end of winter and after storm events.

Final Report, September 15, 2004 25
Except for Wilmington, all communities transfer their material to a yard waste site for further processing. Wilmington sends their collected material to DSWA. Middletown may recapture some chipped material for citizen use, but periodically removes the material from the municipal site and sends it to a DSWA facility. For the other communities, leaves and grass end up in piles. There is a spectrum of how well these piles are managed. One can say in most cases that these piles are passively composting and the quality of the end product is closer to mulch than compost9. Brush taken to these sites are often put into a brush pile, and although not observed, it was related that periodically a tub-grinder is brought on site to size reduce the material. Based on DSM’s observations, many municipal sites are constrained by space. This is partially attributed to the slow break down of leaves due to lack of turning, and the existence of piles from a number of previous collection seasons. In addition, at some sites the brush piles are quite large and would benefit from having the material size reduced. It is evident that municipal parks and public works are utilizing some of the material. In addition, residents can come and take material away. Most do not charge for the mulch that is produced. However, Seaford is charging resident $10.00 per yard, which reflects that there is some demand for the product. Based on what was observed at many of these municipal sites, both municipal departments and residents may be underutilizing this potentially valuable soil amendment material. This may be in part due to residents not knowing the material is available for the taking or that the quality of the end product is such that there is a limited demand for the material. In conclusion, it is evident that disposal of this material through mulching/composting is already a tested management strategy by a number of municipalities throughout the state, but much of the material seems to be aggregating on the sites greater than being utilized as a soil amendment. Challenges need to be overcome regarding increasing material collection and citizen participation as well as finding additional space to manage and recover this material for use as a soil amendment. A municipal training program on compost operation and end-use of the compost product would go a long way in making the existing municipal operations more sustainable.
9 See beginning of Section 5 for an expanded discussion of mulch vs. compost.

Final Report, September 15, 2004 26
SECTION 4: TREE SERVICE & MULCHING COMPANY SURVEY
DSM surveyed a small sample of tree services within the state. Unlike landscapers, tree companies were very reticent to talk to DSM. Therefore, DSM felt it important to supplement the information generated from the tree service survey by contacting mulching companies within the state. Based on the tree service survey, mulching companies were an alternative for disposal of the wood removed from a property. Tree Services The following table indicates the breakdown of tree services by county10. DSM’s survey reflects a sampling of approximately 14% of the tree services within Delaware.
TABLE 4.1 Tree Services
County Total Tree
Services by County
% of Total Identified by DSM
Tree Services Surveyed by DSM
% Respondents by County
New Castle 33 66% 4 12%
Kent 8 16% 2 25%
Sussex 9 18% 1 11%
TOTAL 50 7 14%
Professional tree services are brought in to remove large trees or branches and when landscapers are not capable of the clean up of fallen limbs. However, tree services also duplicate some of the property management activities of landscapers. The following table indicates the type of service provided by those tree service companies surveyed.
TABLE 4.2 Tree Services
Services Provided # Surveyed % of Survey Stump Grinding (SG) 4 57% Stump Removal (SR) 2 29%
Shrub Pruning (SP) 7 100%
Tree & Wood Removal (TW) 7 100%
Total Surveyed 7
Tree services also provide services for developers, primarily by cutting trees in preparation for land clearing. For this aspect of their work, respondents indicated making every effort to chip or cut the trees into firewood. When possible, larger trunks and stumps were reported to be buried on the site.
10 Some tree services work in multiple counties, they were counted in each county they work in. The total is the total # surveyed.

Final Report, September 15, 2004 27
Table 4.3 provides a portrait of the companies surveyed. Like landscapers, many are sole proprietorships, with one or two small crews. DSM did contact a nationally based tree service company that operates within Delaware; this company runs 10 crews that service the entire state.
TABLE 4.3 Tree Services
No. # Crews # Clients/Wk Est. CY/Wk
removed from sites
1 2 10 50 2 1 4 25
3 1 6 25
4 1 5 25
5 10 150 250
6 1 10 25
7 4 12 60
On a weekly basis the respondents estimated 460 cubic yards of material is removed from sites, with a majority in the form of chips. This would translate to approximately 120 tons per week. If one were to assume a tree service season from mid-April through October, or approximately 30 weeks, this would generate approximately 3600 annual tons. DSM sampled approximately 14% of the tree services within the state. If the 3600-ton amount was projected for the entire state, an estimate of 25,000 annual tons are removed from properties. Respondents to this survey refused to say specifically where they delivered material taken off of a property, but all indicated they do not take it to a DSWA facility. This is primarily because of the high disposal fees. They did say that some of this material is diverted to mulching companies, but did not indicate specifically which company or how much they diverted to this disposal alternative. In contacting the mulching companies, the operators anecdotally listed a sampling of their client base, which included some of the tree service companies surveyed by DSM. Mulching Companies The mulching companies contacted had permanent sites where they accepted wood, limbs, wood chips, brush and leaves. They would infrequently accept leaves and only from established clients. The fear was contaminants coming in within the leaves, which would damage the tub-grinders.
Table 4.4 reflects the break down, by county, of the mulching operations identified by DSM.
TABLE 4.4 Mulchers
County Total by County % of Total Surveyed by DSM
% Surveyed by County
New Castle 7 78% 7 100%
Kent 0 0% 0 NA
Sussex 2 22% 2 100% TOTAL 9 9

Final Report, September 15, 2004 28
Although tree services did divert some of their material to mulching companies, many reported that they avoid this option when possible due to the tipping fees charged. Reported tipping fees at mulching companies ranged from 25 to 35 dollars per ton. The mulch product these companies make is a partially decomposed wood-based product. Operators will often supplement this material with the addition of carbon black or iron oxide to create ornamental grades of mulch. When asked about composting, there was some interest in this process, but a general lack of understanding of how to create a compost cost effectively, although one mulching company was familiar with composting and showed an interest in expanding their operation to include composting of yard waste. Conclusions Based on DSM’s survey of tree services, approximately 25,000 tons of brush, trees and stumps are disposed off-site in Delaware annually. However, very little, if any, tree service material is finding its way into a DSWA facility because of the tipping fees charged by DSWA when compared to the alternatives for disposal – either mulching companies, or on-site disposal. The tree services’ preference is to leave chipped material on-site and/or bury larger land-cleared wood, but when this is not possible, this woody material is being diverted to mulching companies. In the event of a yard waste ban, the current practices by tree services probably would not change substantially. However, there is some indication that, with a yard waste ban, mulching operations may expand their services to accept additional yard waste, including leaves and grass. However to do so would require educating mulching companies about the composting process and how to institute quality control procedures to minimize contamination of yard waste by materials that could damage equipment.
Final Report, September 15, 2004 29
SECTION 5: YARD WASTE COMPOSTING TECHNOLOGIES AND COSTS
A yard waste ban will require alternative management for yard waste that is not allowed for disposal at DSWA landfills, and which is not left on-site. As discussed above, DSM estimates that approximately 111 pounds per capita per year will require off-site management. The question is what is the most efficient management strategy for roughly 45,200 new tons (rounded) of yard waste that is estimated to be recycled off-site of residents. DSM has developed cost estimates for different levels of yard waste management technologies. For purposes of this report, composting technologies have been sub-divided into four categories: minimal, low, intermediate and high technology options. Each is discussed below. Each technology assumes that there is at least a minimal level of management so that the collected yard wastes do not become anaerobic – and thus create offensive odors. It also should be noted that the final product created from the management and processing of yard waste needs to be utilized. Given our observations at many of the existing municipal operations, it appeared that a mulch product rather than a marketable grade of compost was being produced. Mulch is a partially decomposed leaf and/or wood base product that can provide a benefit to soils by increasing water holding capacity and/or aeration of the soil. The characteristic of mulch is that it will continue to rapidly decompose in the soil. During this process it will utilize soil nitrogen and increase the acidity of the soil. As such, mulch is excellent for keeping weeds from growing and reduces water loss from the soil. Correspondingly, mulch will inhibit the germination and growth of desired seedlings and could cause root hair damage and nitrogen chlorosis in young growing plants. Alternatively, compost is a stable, organic soil amendment, that provides similar soil structure and water retention benefits as seen in mulch but which can be safely applied to plants and seeded areas where mulch could not. Compost can be applied directly as a top dressing to existing grassed areas, mulch could not. Thus, continuing the decomposition process to the point that a stable compost is created will expand possible end uses for the material. This will be critical if a yard waste ban is imposed in Delaware given the large piles of under-utilized mulch currently being generated by many incorporated areas. Minimal Technology Composting Methodology Minimal level technology composting is the most basic method of composting yard waste. It requires the least amount of labor and equipment among the available options, but requires the longest composting period and the most land area. Material is piled into large windrows up to 12 feet tall and 25 feet wide at the base, and turned with a front-end loader approximately once a year. The material can be watered prior to formation of the windrows, although this is usually not necessary. Approximately three years are required to complete the process of composting using this method.
Final Report, September 15, 2004 30
Minimal level technology composting does not involve frequent aeration of the composting material. A large portion of the windrow will remain anaerobic between yearly turnings. As a consequence, offensive odors may be generated throughout the years, but are especially apparent during the pile turnings. The composting area should be located as far as possible from residences to avoid complaints. A buffer zone of at least 200 feet in each direction is recommended. Pros: • Requires minimal labor hours; • Requires minimal equipment time; • A large quantity of leaves per acre can be composted; • A compost pad need not be constructed. Cons: • Stabilization of compost product requires 3 years; • The composting area must be able to accommodate at least 3 years of material; • Leachate can be a problem if soil type has low percolation rate; • Large buffer zones are necessary to avoid odor complaints, especially during turning. Based on recent visits to current municipal operations within the State, many of the existing municipal composting sites could be classified as minimal technology operations. In some cases, municipalities utilize or distribute material after one or two years. On inspection, this material more closely resembles a mulch , rather than a stabilized compost product. Due to the potential for leachate generation, combined with the potential of odor migration off-site, and the end-use limitations of a non-stabilized final product, minimal technology alternatives should not be encouraged unless one can develop a site large enough to mitigate such impacts before they cross the property line. Low Technology Composting Methodology Low technology composting is the most common method of yard waste composting practiced in the United States. This method is intended to improve parameters for composting for faster production of stabilized compost without the purchase of specialized equipment. A front-end loader is the only piece of equipment required. Often, the front-loader is rented or borrowed from other operations on an as-needed basis, rather than left on-site. A land area of one acre for every 4000 to 6000 cubic yards of material is needed, with the allowance of a buffer zone. The site requires a soil pad to support heavy machinery and provide good drainage. Stabilization is achieved in 12 to 18 months, depending on the material and composting conditions. Post processing, such as screening or shredding, may occur if necessary. If necessary, yard waste material to be composted is initially watered to ensure a moisture content of 50 percent before formation into windrows. If grass is being incorporated, watering may not be required. Windrows 6 to 10 feet high and 15 to 20 feet wide at the base are formed with a front-end loader, allowing adequate spacing between windrows for loader access. After a month, windrows
Final Report, September 15, 2004 31
decrease substantially in size due to settling of material and rapid decomposition. At this point, two windrows can be combined to form one the original size. This conserves space and helps the windrows retain heat during the cooler winter months. Turning of the windrows both mixes and aerates the material. Turning schedules are based on temperature and moisture content monitoring. When the windrow temperature drops below 100 degrees F, or if the moisture content is significantly different from 50 percent, the windrows are turned and water added if necessary. However, it is important to avoid excess turning during cooler winter months, because the heat loss due to turning can slow the composting process. More frequent turning in the warmer months ensures adequate mixing and minimal odor generation. A distance of approximately 200 feet between the composting area and residences is required for noise as well as odor buffering. Pros: • No specialized equipment is needed; • Labor requirements are moderate and can be somewhat flexible. Cons: • Stabilization of compost product requires 12-18 months; • Site must accommodate more than one years’ material; • Post processing may be necessary to produce high quality compost. Intermediate Technology Composting Methodology Where land area limitations are important, intermediate level technology may be the most appropriate composting method. This method requires specialized windrow turning equipment to size reduce and aerate material for accelerated decomposition. Turning frequency is on the order of once a week. Stabilized compost can be produced in 4 to 8 months, depending on the material and the frequency of turning. For a fixed volume of input material, land area requirements for this composting method are higher than for low-level technology because windrow height is limited by the constraints of the windrow turner. Approximately 3000 cubic yards per acre can be composted, and a buffer zone of approximately 200 feet should be allowed. In addition, this method requires a composting pad that can withstand the frequent use of heavy equipment without forming ruts. A reinforced concrete pad is ideal, but thick compressed gravel pads, with back-blading as on-going maintenance, can suffice. An alternative approach involves reducing the initial volume of material without windrow turning equipment. A tub grinder or similar equipment may be used. Material is ground and adjusted to the proper moisture level prior to the formation of windrows. Then windrows can be turned using a front-end loader, avoiding the height constraints mentioned above. Up to 8000 to 9000 cubic yards per acre can be composted. The turning schedule described above should be followed. Post processing may also be desirable to improve the texture of the final product.

Final Report, September 15, 2004 32
Capital costs for both windrow turning and size reducing equipment are high, and the equipment is often not in constant use. This makes sharing arrangements with nearby municipalities possible. Time sharing arrangements have been made with as many as four communities for the use of a tub grinder. Capital costs can be shared in this way, although transportation and maintenance issues can be problematic under such arrangements. Pros: • Finished compost product can be removed from the site in less than 1 year; • Composting area need only accommodate 1 years’ material. Cons: • Capital cost of specialized equipment is high; • A concrete pad must be constructed or a soil pad may require high maintenance; • Labor requirements are higher than other composting methods. High Technology Composting Methodology High technology composting involves the utilization of static pile or in-vessel systems developed initially for the composting of sewage sludge. These systems are traditionally used for the co-composting of bio-solids or food waste with yard waste. In such situations, yard waste serves as an amendment or bulking agent for the other waste material. However, in cases where grass additions are high, such an in-vessel approach can be used to better manage the systems so to maintain aerobic conditions. These combinations of materials require more rigorous process control than is possible by the previously described technologies. Odor can be controlled more effectively with static pile or in-vessel composting. The cost of these technologies is high, and the decision to employ them will be based on the need to manage a waste stream consisting of more than yard waste. Static pile composting is accomplished by using a forced aeration system located under the pile of composting material. A temperature feedback system is preset to turn on blowers when the pile reaches a certain temperature. The forced air removes excess heat and aerates the pile. Under the optimized conditions produced by this method, the active composting process is completed in 3 to 5 weeks. The material is then moved to a curing pad where additional decomposition and drying will take place. The curing period generally lasts from 4 to 8 weeks. Many static aerated systems have been developed that are both modular in nature and can be easily located on a graded site. A power source and access to water would be the major fixed capital required. In-vessel systems include a number of technologies for aerating and mixing composting material within an enclosed vessel. Many of these technologies require the material to meet specific requirements in moisture content and particle size. Some of the technologies can be adapted for the co-composting of ground yard waste with sludge or solid waste, provided all the parameter specifications are met.

Final Report, September 15, 2004 33
Some of these systems do not complete the stabilization of the compost in the enclosed structure, so they require further composting using a subsequent step of windrow or static pile systems. For composting yard waste alone, it would be hard to make such permanent in-vessel systems economically viable. Pros: • Two waste streams can be handled at the same time in a complementary fashion; • Nutrient content of compost may be enhanced through the combination of materials. Cons: • A composting building or plastic structure including concrete pad must be constructed; • Labor requirement is higher to oversee process; • Waste streams other than yard waste can contribute significantly to odor problems. Yard Waste Composting Cost Analysis Cost analyses are presented for the low and intermediate methodology composting systems and a covered static aerated system. For the low and intermediate composting methodology analysis, facility sizes utilized reflect yard waste input volumes of 5000, 10,000 and 20,000 cubic yards. For the covered static aerated pile system, a yard waste input volume of 20,000 cubic yards was used. These input volumes seem reasonable considering the range of existing operations one currently sees in the state. The lower end of this range would reflect such community populations such as Middletown or New Castle. The high end of this range would be more reflective of the amount of material being generated in such municipalities as Newark or Dover. This section concludes with a comparison of cost per input ton of yard waste for all three methodologies. Low Composting Methodology For this analysis the low composting methodology reflects utilization of a loader to build, turn and aerate the yard waste windrows. Supplemental water addition may be required and turning events are initiated in response to pile temperature and oxygen content monitoring. Assumptions A key assumption underlying this analysis is that existing entities, such as municipalities and/or private companies, e.g. landscapers, tree services or mulching companies, will take on such composting activities. These entities typically already own equipment that can be utilized to build and turn windrows. As such, capital and O&M costs for such equipment will be based on the time the equipment is used for the composting operation. An acre of land is needed for each 5000 C.Y. of yard waste. It is assumed a stable compost product can be attained within 18 months of deposition on site. Volume reduction due to settling and decomposition of leaves is assumed to be 50 percent during the first year. However, if such a composting operation was not located at a site with an existing buffer, and if one were to assume a
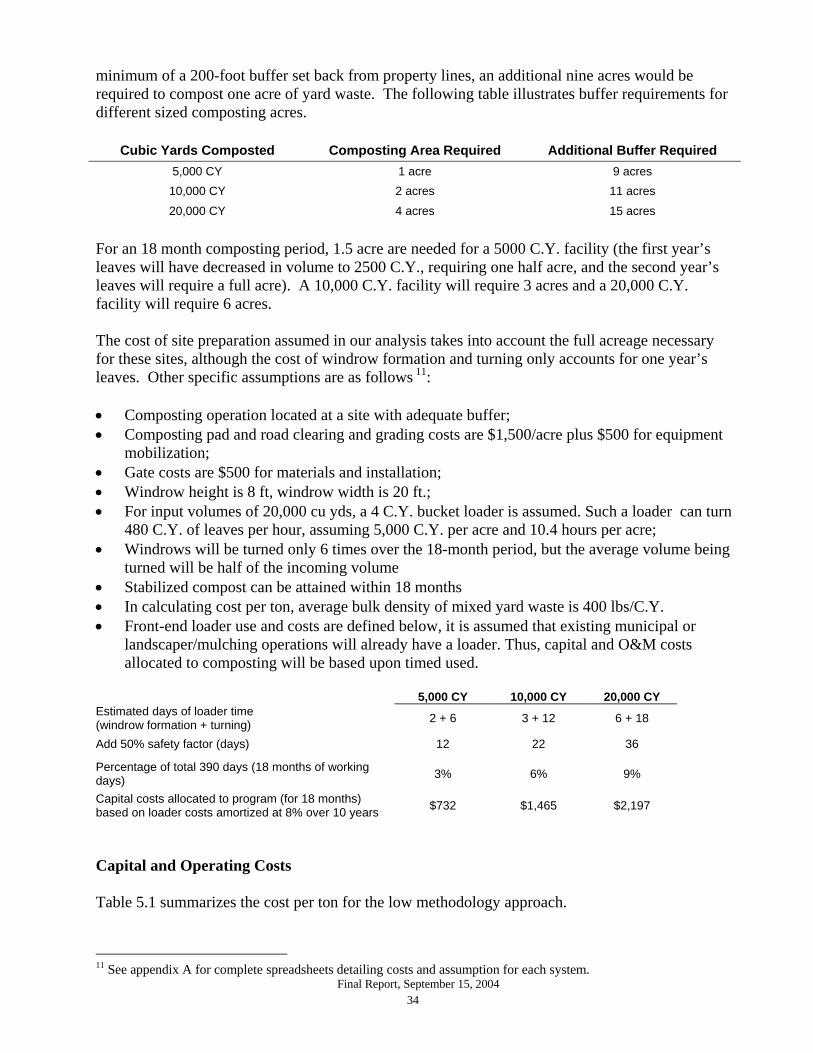
Final Report, September 15, 2004 34
minimum of a 200-foot buffer set back from property lines, an additional nine acres would be required to compost one acre of yard waste. The following table illustrates buffer requirements for different sized composting acres.
Cubic Yards Composted Composting Area Required Additional Buffer Required 5,000 CY 1 acre 9 acres
10,000 CY 2 acres 11 acres
20,000 CY 4 acres 15 acres
For an 18 month composting period, 1.5 acre are needed for a 5000 C.Y. facility (the first year’s leaves will have decreased in volume to 2500 C.Y., requiring one half acre, and the second year’s leaves will require a full acre). A 10,000 C.Y. facility will require 3 acres and a 20,000 C.Y. facility will require 6 acres. The cost of site preparation assumed in our analysis takes into account the full acreage necessary for these sites, although the cost of windrow formation and turning only accounts for one year’s leaves. Other specific assumptions are as follows 11: • Composting operation located at a site with adequate buffer; • Composting pad and road clearing and grading costs are $1,500/acre plus $500 for equipment
mobilization; • Gate costs are $500 for materials and installation; • Windrow height is 8 ft, windrow width is 20 ft.; • For input volumes of 20,000 cu yds, a 4 C.Y. bucket loader is assumed. Such a loader can turn
480 C.Y. of leaves per hour, assuming 5,000 C.Y. per acre and 10.4 hours per acre; • Windrows will be turned only 6 times over the 18-month period, but the average volume being
turned will be half of the incoming volume • Stabilized compost can be attained within 18 months • In calculating cost per ton, average bulk density of mixed yard waste is 400 lbs/C.Y. • Front-end loader use and costs are defined below, it is assumed that existing municipal or
landscaper/mulching operations will already have a loader. Thus, capital and O&M costs allocated to composting will be based upon timed used.
5,000 CY 10,000 CY 20,000 CY Estimated days of loader time (windrow formation + turning) 2 + 6 3 + 12 6 + 18
Add 50% safety factor (days) 12 22 36
Percentage of total 390 days (18 months of working days) 3% 6% 9%
Capital costs allocated to program (for 18 months) based on loader costs amortized at 8% over 10 years $732 $1,465 $2,197
Capital and Operating Costs Table 5.1 summarizes the cost per ton for the low methodology approach.
11 See appendix A for complete spreadsheets detailing costs and assumption for each system.

Final Report, September 15, 2004 35
TABLE 5.1 Low Technology Composting Facility Assuming 5000 CY/acre—18 months FACILITY SIZE
Input Volume (CY) 5,000 10,000 20,000
Input Weight (Tons) 1,000 2,000 4,000
CAPITAL COST Design & Permit Cost $ 6,150 $12,225 $ 24,375
Site Prep Cost
Maximum volume on site 7,500 15,000 30,000
Acres required 1.5 3 6
Land $37,500 $75,000 $150,000
Clearing/grading $ 3,000 $ 6,000 $ 12,000
Gate $ 500 $ 500 $ 500
Subtotal $41,000 $81,500 $162,500
Annualized debt payment
8% over 10 years $ 6,110 $12,146 $ 24,217
Equipment Costs
Front-end loader (based on percent of time used) $ 828 $ 1,656 $ 2,484
Subtotal, Annualized Capital Costs $13,088 $ 26,027 $51,076
OPERATIONAL COSTS
Tipping inspection $ 5,484 $14,479 $28,958 Labor cost
Windrow formation (hrs) 10 21 42 Laborer cost $ 264 $ 527 $ 1,055 Loader operator costs $ 316 $ 633 $ 1,266 Windrow turning (hrs) 63 125 250 Costs $ 1,272 $ 2,544 $ 5,088 Site supervision $ 1,118 $ 2,762 $ 5,525 Marketing specialist $ 2,633 $ 5,265 $ 10,530
Equipment O&M $ 4,800 $ 8,800 $ 14,400 Screening $ 500 $ 1,000 $ 2,000 Disposal of contaminants $ 1,170 $ 2,340 $ 4,680
Subtotal, Annualized Operation Costs $ 17,557 $38,350 $ 73,502
TOTAL ANNUALIZED COSTS $ 30,645 $64,377 $124,578 COST/TON $31 $32 $31
The only significant capital cost is the compost site (land and side preparation) and a front-end loader for forming and turning the windrows. These annual costs range from $31 per ton for the 1.5-acre site holding 5,000 cubic yards to $32 per ton for the 6-acre site holding 20,000 cubic yards.
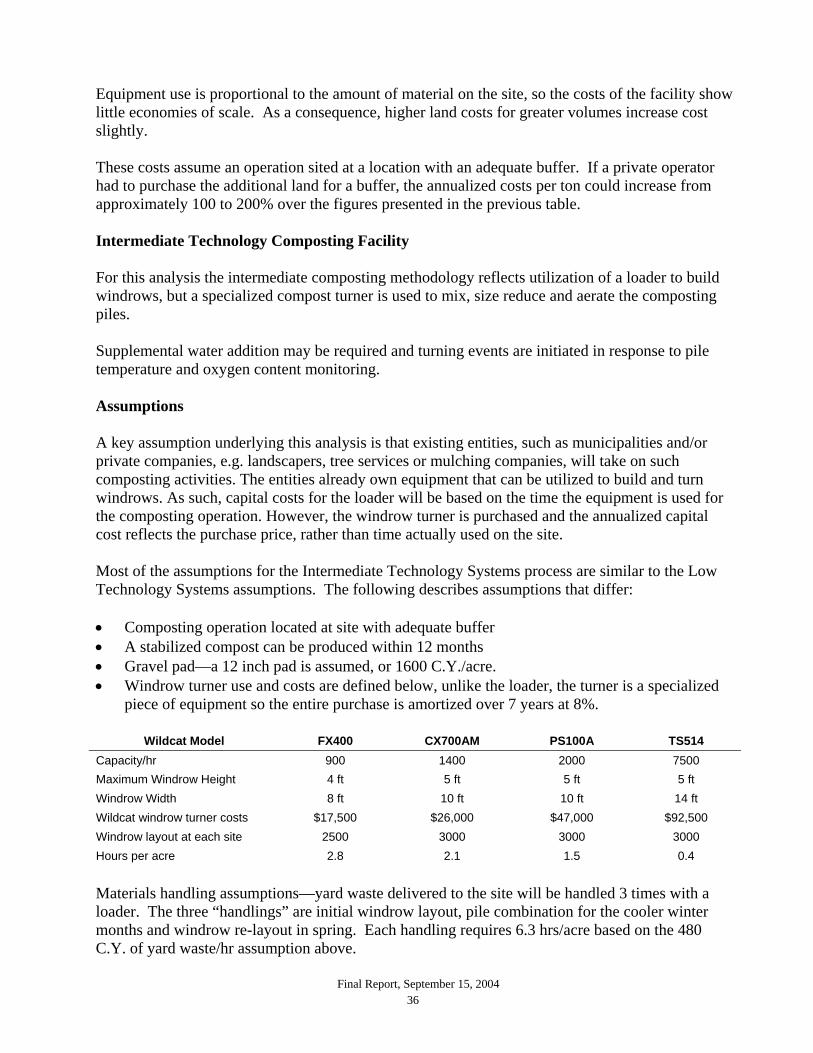
Final Report, September 15, 2004 36
Equipment use is proportional to the amount of material on the site, so the costs of the facility show little economies of scale. As a consequence, higher land costs for greater volumes increase cost slightly. These costs assume an operation sited at a location with an adequate buffer. If a private operator had to purchase the additional land for a buffer, the annualized costs per ton could increase from approximately 100 to 200% over the figures presented in the previous table. Intermediate Technology Composting Facility For this analysis the intermediate composting methodology reflects utilization of a loader to build windrows, but a specialized compost turner is used to mix, size reduce and aerate the composting piles. Supplemental water addition may be required and turning events are initiated in response to pile temperature and oxygen content monitoring. Assumptions A key assumption underlying this analysis is that existing entities, such as municipalities and/or private companies, e.g. landscapers, tree services or mulching companies, will take on such composting activities. The entities already own equipment that can be utilized to build and turn windrows. As such, capital costs for the loader will be based on the time the equipment is used for the composting operation. However, the windrow turner is purchased and the annualized capital cost reflects the purchase price, rather than time actually used on the site. Most of the assumptions for the Intermediate Technology Systems process are similar to the Low Technology Systems assumptions. The following describes assumptions that differ: • Composting operation located at site with adequate buffer • A stabilized compost can be produced within 12 months • Gravel pad—a 12 inch pad is assumed, or 1600 C.Y./acre. • Windrow turner use and costs are defined below, unlike the loader, the turner is a specialized
piece of equipment so the entire purchase is amortized over 7 years at 8%.
Wildcat Model FX400 CX700AM PS100A TS514 Capacity/hr 900 1400 2000 7500 Maximum Windrow Height 4 ft 5 ft 5 ft 5 ft Windrow Width 8 ft 10 ft 10 ft 14 ft Wildcat windrow turner costs $17,500 $26,000 $47,000 $92,500 Windrow layout at each site 2500 3000 3000 3000 Hours per acre 2.8 2.1 1.5 0.4
Materials handling assumptions—yard waste delivered to the site will be handled 3 times with a loader. The three “handlings” are initial windrow layout, pile combination for the cooler winter months and windrow re-layout in spring. Each handling requires 6.3 hrs/acre based on the 480 C.Y. of yard waste/hr assumption above.
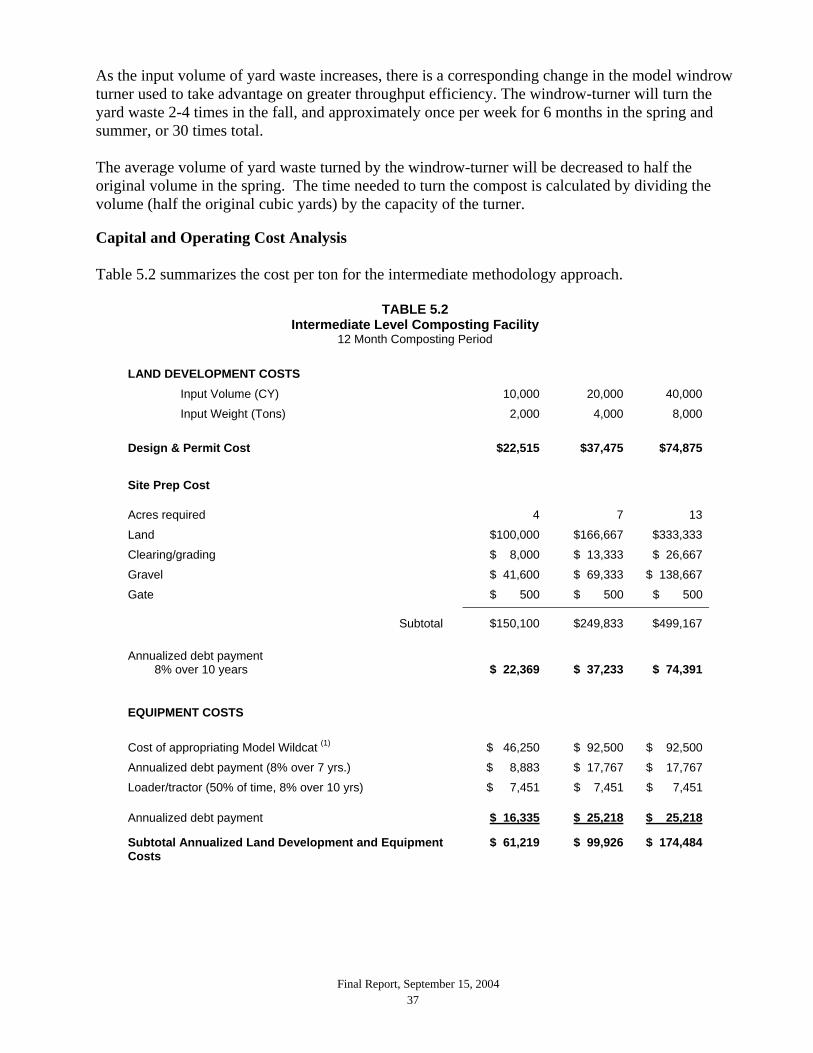
Final Report, September 15, 2004 37
As the input volume of yard waste increases, there is a corresponding change in the model windrow turner used to take advantage on greater throughput efficiency. The windrow-turner will turn the yard waste 2-4 times in the fall, and approximately once per week for 6 months in the spring and summer, or 30 times total. The average volume of yard waste turned by the windrow-turner will be decreased to half the original volume in the spring. The time needed to turn the compost is calculated by dividing the volume (half the original cubic yards) by the capacity of the turner. Capital and Operating Cost Analysis Table 5.2 summarizes the cost per ton for the intermediate methodology approach.
TABLE 5.2 Intermediate Level Composting Facility
12 Month Composting Period
LAND DEVELOPMENT COSTS
Input Volume (CY) 10,000 20,000 40,000
Input Weight (Tons) 2,000 4,000 8,000
Design & Permit Cost $22,515 $37,475 $74,875
Site Prep Cost Acres required 4 7 13
Land $100,000 $166,667 $333,333
Clearing/grading $ 8,000 $ 13,333 $ 26,667
Gravel $ 41,600 $ 69,333 $ 138,667
Gate $ 500 $ 500 $ 500
Subtotal $150,100 $249,833 $499,167
Annualized debt payment
8% over 10 years $ 22,369 $ 37,233 $ 74,391
EQUIPMENT COSTS
Cost of appropriating Model Wildcat (1) $ 46,250 $ 92,500 $ 92,500
Annualized debt payment (8% over 7 yrs.) $ 8,883 $ 17,767 $ 17,767
Loader/tractor (50% of time, 8% over 10 yrs) $ 7,451 $ 7,451 $ 7,451
Annualized debt payment $ 16,335 $ 25,218 $ 25,218
Subtotal Annualized Land Development and Equipment Costs
$ 61,219 $ 99,926 $ 174,484

Final Report, September 15, 2004 38
OPERATIONAL COSTS
Labor Costs
Daily tipping inspection $17,198 $34,397 $33,694
Windrow formation (hrs) 21 42 83
Laborer cost $ 352 $ 703 $ 1,406
Loader operator costs $ 422 $ 844 $ 1,688
Windrow combining/layout (hrs) 31 63 125
Loader operator cost $ 633 $ 1,266 $ 2,531
Wildcat turning (hrs) 23 47 93
Operator costs $ 473 $ 945 $ 1,890
Site supervision $ 2,885 $ 5,770 $ 6,276
Marketing specialist $ 5,265 $ 10,530 $ 10,530
Equipment O&M $ 3,771 $ 7,542 $15,083
Screening $ 1,000 $ 2,000 $ 4,000
Disposal of contaminants $ 2,340 $ 4,680 $ 9,360
TOTAL OPERATIONAL COSTS $34,339 $68,677 $86,458
TOTAL PRODUCTION COSTS $95,558 $168,603 $260,942
COST PER TON $48 $42 $33
These costs assume an operation sited at a location with an adequate buffer. If a private operator had to purchase the additional land for a buffer, the annualized cost per ton could increase as much as 100% over the figures presented in the previous table. High Technology Composting Facility For this analysis the high composting methodology reflects utilization of a two stage composting process. The first stage is the use of the Ag-bag approach, where incoming yard waste is put in enclosed bags with forced aeration through blowers. After 120 days, the material is removed to a secondary windrow composting operation for further material stabilization. A specialized windrow turner is used to mix, size reduce and aerate the piles. In addition, a loader to move material and build windrows and but a specialized compost turner is used to mix, size reduce and aerate the composting piles. Supplemental water addition may be required and turning events are initiated in response to pile temperature and oxygen content monitoring. A key assumption underlying this analysis is that existing entities, such as municipalities and/or private companies, e.g. landscapers, tree services or mulching companies, will take on such composting activities. The entities already own equipment that can be utilized to build and turn windrows. As such, capital costs for the loader will be based on the time the equipment is used for the composting operation. However, the bagging equipment and windrow turner is purchased; thus, the annualized cost reflects these purchases and not based upon the time this equipment is utilized on-site.

Final Report, September 15, 2004 39
Capital and Operating Cost Analysis The following Table 5.3 summarizes the cost per ton for the high methodology approach.
TABLE 5.3 HIGH LEVEL COMPOSTING FACILITY
AG-Bag Facility LAND DEVELOPMENT COSTS
Input Volume (CY) 20,000 Input Weight (tons) 4,000
Design and Permit Costs $ 41,025 Site Prep Costs
Acres required 9 Land $225,000 Cleaning and grading $ 18,000 Electric hook-up (3-phase) $ 30,000 Gate $ 500
Subtotal $273,500
Annualized debt payment (8% over 10 years) $ 40,760
EQUIPMENT COSTS
CT-5 Bagger $ 49,500 Blowers $ 16,370
Subtotal $ 65,870
8 % over 10 years $ 9,817
Loader $100,000 50% of time, 8% over 10 years $ 7,451
Cost of appropriating Model Wildcat $ 92,500 8% over 7 years $ 17,767
Subtotal Annualized Capital Costs $ 116,819
OPERATIONAL COSTS
Labor Costs Daily tipping inspection $ 34,397 Bag filling $ 1,160 Wildcat turnings $ 1,551 Site supervision $ 5,566 Marketing specialist $ 14,040
Equipment O&M $ 7,542 Electricity $ 4,950 Screening $ 2,000 Disposal
contaminants $ 4,680 used ag-bags $ 1,000
Subtotal, Annualized Operating Cost $ 76,885 TOTAL ANNUAL COST $193,705 COST PER TON $ 48.00
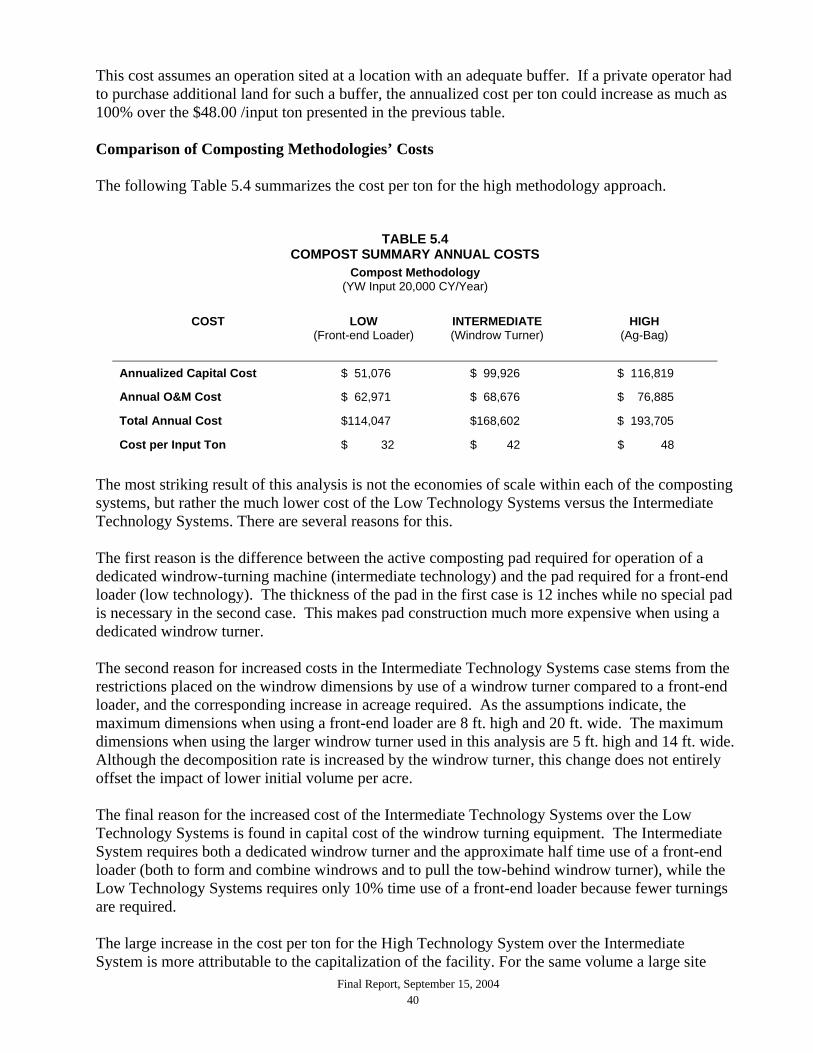
Final Report, September 15, 2004 40
This cost assumes an operation sited at a location with an adequate buffer. If a private operator had to purchase additional land for such a buffer, the annualized cost per ton could increase as much as 100% over the $48.00 /input ton presented in the previous table. Comparison of Composting Methodologies’ Costs The following Table 5.4 summarizes the cost per ton for the high methodology approach.
TABLE 5.4 COMPOST SUMMARY ANNUAL COSTS
Compost Methodology (YW Input 20,000 CY/Year)
COST LOW (Front-end Loader)
INTERMEDIATE (Windrow Turner)
HIGH (Ag-Bag)
Annualized Capital Cost $ 51,076 $ 99,926 $ 116,819
Annual O&M Cost $ 62,971 $ 68,676 $ 76,885
Total Annual Cost $114,047 $168,602 $ 193,705
Cost per Input Ton $ 32 $ 42 $ 48
The most striking result of this analysis is not the economies of scale within each of the composting systems, but rather the much lower cost of the Low Technology Systems versus the Intermediate Technology Systems. There are several reasons for this. The first reason is the difference between the active composting pad required for operation of a dedicated windrow-turning machine (intermediate technology) and the pad required for a front-end loader (low technology). The thickness of the pad in the first case is 12 inches while no special pad is necessary in the second case. This makes pad construction much more expensive when using a dedicated windrow turner. The second reason for increased costs in the Intermediate Technology Systems case stems from the restrictions placed on the windrow dimensions by use of a windrow turner compared to a front-end loader, and the corresponding increase in acreage required. As the assumptions indicate, the maximum dimensions when using a front-end loader are 8 ft. high and 20 ft. wide. The maximum dimensions when using the larger windrow turner used in this analysis are 5 ft. high and 14 ft. wide. Although the decomposition rate is increased by the windrow turner, this change does not entirely offset the impact of lower initial volume per acre. The final reason for the increased cost of the Intermediate Technology Systems over the Low Technology Systems is found in capital cost of the windrow turning equipment. The Intermediate System requires both a dedicated windrow turner and the approximate half time use of a front-end loader (both to form and combine windrows and to pull the tow-behind windrow turner), while the Low Technology Systems requires only 10% time use of a front-end loader because fewer turnings are required. The large increase in the cost per ton for the High Technology System over the Intermediate System is more attributable to the capitalization of the facility. For the same volume a large site

Final Report, September 15, 2004 41
footprint is required, although no specialized gravel pad is required for the Ag-bags. In addition, 3- phase power will need to be brought on to the site, with the associated purchase of blowers for the aerated system. Finally, there is specialized bagging equipment required to be purchased for this alternative, and the bags themselves require disposal. Conclusion Assuming that land and associated buffer is available, dispersed, low technology composting sites make the most sense for managing yard wastes banned from disposal at DSWA landfills. Low-level technology composting facilities can be constructed and operated for about $32 per input ton. If land is a constraint, and a greater throughput rate is required, or if there are sensitive receptors adjacent to a composting site, then more expensive higher technology facilities would need to be constructed, increasing costs to $42- $48 per input ton. However, the resulting compost is likely to be more marketable with a greater potential for some material sales revenue. Such costs do not reflect the purchase of land for a buffer. Based on the type and scale of the composting facility, the purchase of additional acreage for a buffer could increase the cost per input ton from 100% to 200%. However, it should be noted that there are many existing facilities operating around the country that have minimum buffers between the active compost operation and adjacent property lines. Such facilities can successfully operate due to a combination of choosing appropriate locations, closely managing the compost operation and utilizing methodologies that optimize the decomposition process and minimize the likelihood of odor generation.

Final Report, September 15, 2004 42
SECTION 6: ESTIMATED COSTS FOR SEPARATE COLLECTION
OF YARD WASTES
Waste Hauler Survey Delaware DSM surveyed municipalities and haulers in Delaware as well as the surrounding Mid-Atlantic States in an effort to estimate representative costs for subscription collection of separated leaf and yard wastes. A list of the licensed haulers in Delaware was obtained from DSWA, and a telephone survey conducted asking if they currently provided separate collection of yard waste, and if not, whether they could estimate the cost of providing separate collection as part of their subscription service. None of the hauling companies contacted in Delaware currently provides separate subscription service for yard waste. Only one company was willing to estimate what the costs might be if yard wastes were banned and a separate collection for yard waste were required. Assuming no tipping fee for disposal of the separated yard waste (DSM has estimated that cost separately in Section 5), this hauler estimated that the net cost, after allowing for potential savings in refuse collection costs associated with removing yard waste from the refuse would be approximately $4 - $5 per household per month. Organized curbside collection was estimated to be approximately $3 - $4 less per month. Companies contacted in Delaware included:
BFI Blue Hen-Buzzards Dispose-All Michael Leach Co Moor Disposal Service Tri-State Solutions Waste Management
Independent Disposal Surrounding States Given the difficulty DSM had in obtaining estimated costs from Delaware haulers, DSM surveyed numerous municipalities in New Jersey and Maryland in an attempt to learn what households in these municipalities were paying for separate collection. The majority of the municipalities or counties contacted provide the service as part of municipal operations and do not have line item costs for the collection program. Some of the municipalities contract for collection but do not have a separate cost itemized in the overall cost of providing leaf and yard waste collection services.

Final Report, September 15, 2004 43
Maryland Cecil County – Cecil County officials reported that no waste haulers offer special collection of leaf and yard waste. Instead, homeowners bring separated yard waste to the county drop-off and processing facility. Wicomico County – Wicomico County operates eleven transfer stations and one landfill within the county. No large haulers offer subscription yard waste collection within Wicomico County. Instead, material is brought to the transfer stations or landfill by landscapers, tree trimmers and the general public. Three businesses actively purchase the resulting mulch for landscaping use. Baltimore County – Collection occurs on the same schedule as recycling and is performed by 49 different private haulers. The County organized the program and administers the scheduling and collection of 230 different routes out of the Solid Waste Management Offices in Towson, Maryland. Materials that are collected are brought to the County composting facility for composting and then given away at no charge to customers. The separate yard waste collection service is offered to about 160,000 household units. The addition of the separate collection program increased the overall cost to the County by $1,000,000 per year. This is the equivalent of $6.25 per year, per household, for a total of 18 collections per year. (9 months, 2 times ea. month). Laurel Maryland – The Department of Public Works was contacted and it was confirmed that City crews and trucks perform a separate yard waste collection on the same day as the refuse. The City does not keep the two services separated in their line item budgets and was not able to provide a separate yard waste collection cost. New Jersey Madison – The Borough of Madison bids out a contract for yard waste collection for residents to use between the months of March and November. The Borough has a 2000 census population of 16,530 and 5,520 households and is located in the northern part of the state, east of Newark. Separate trucks travel the regular refuse route and collect yard waste set-outs along the route. Waste Management has the contract for 2004 in the amount of $129,880, which includes both collection and disposal. The quantity of yard waste collected in 2003 amounted to 3,472 cubic yards and includes leaves, grass, branches under a certain diameter and length, and garden wastes. The cost per household for this curbside service on an annual basis is $23.53, or $1.96 per month per household (over twelve months, or $2.35 per month over the ten-month collection season). In addition to curbside collection, the Borough uses their own crews to collect leaves raked to the curb during the fall according to a specified schedule and route. Kenilworth – The Borough of Kenilworth provides curbside collection of grass only during the summer months and brings the materials to their transfer yard where it is picked up by Rotondi and Sons for processing. There are 2,859 households in the Borough and they use a 25 cubic yard

Final Report, September 15, 2004 44
packer with two laborers and one driver to perform the grass collection. Costs are not broken out as a line item for this service. Montclair Township – Montclair provides separate curbside collection of grass clippings between April 1 and October 31 on a weekly basis. Costs have not been provided but may be available prior to the final draft of this report. Wyckoff – Wyckoff provides yard waste collection on a weekly basis to the residents of the city between the months of May and September. Costs have not been provided but may be available prior to the final draft of this report.
Conclusion DSM’s survey results, while limited, indicate that subscription service would cost a subscribing household between $4 and $5 per month over the course of the yard waste season. Organized collection would cost between $2 and $3 per month. These costs are consistent with DSM’s estimates for collection contained in the earlier RPAC report.

Final Report, September 15, 2004 45
SECTION 7: LOOKING TO THE FUTURE
In conducting surveys for this project, DSM had an opportunity to see most of the state of Delaware. What is evident from driving the secondary roads throughout the State is that there is substantial amount of land clearing and development occurring, especially in Kent and Sussex counties. One indication came from the manager in Middletown; he indicated that his community had grown from 6100 to 8500 residents since the year 2000. This is a 40 % increase in just four years, reflecting a 10% annual growth rate. From a composting perspective, yard waste coming from these new developments will be mostly grass. Those properties that are planting trees will not see a substantial generation of leaves for 15 to 20 years. A previous study by the University of Delaware surveyed residents regarding their behavior in handling yard waste. The results indicated that approximately 80% of the state residents have lawns. This same study indicated only 64% of those that have lawns have significant amounts of leaves in the fall. Due to the growth of new development one can expect that the percentage of houses with lawns that have significant leaf generation will drop. The reduction in this percentage will not only be because of the lack of mature trees within new developments but because in creating these new developments land is cleared and trees are completely removed. This is exacerbated when these developments are associated with the establishment of associated golf courses. Composting operators need to blend the different components of the yard waste in appropriate mixing ratios to both ensure an efficient decomposition process and to avoid potential nuisance conditions such as odor or leachate. One of the driving parameters is ensuring an appropriate carbon/nitrogen balance. The ideal is 25:1 carbon/nitrogen ratio. Too much nitrogen and there is potential for odors and water pollution. Too much carbon and the ability for the material to compost quickly is reduced, resulting in material building up on sites. Grass is high in nitrogen and leaves are high in carbon. Based on volume, the initial mixing ratio of grass to leaves is typically 1:3. As the decomposition process continues, grass can be reintroduced to partially decomposed material, with an eventual mixing ratio of approximately 1: 1.5 grass to leaves. With these operational constraints imposed upon any compost process, one can see that with the increase in the amount of grass being generated statewide in relation to leaves, compost operations could have a carbon deficit. To mitigate this situation, operators would either need to find a supplemental carbon source or procedures would need to be instituted at the household level to reduce the amount of grass taken from the property. Any supplemental carbon source would need to be available at no, or a very, low cost. If such amendment were expensive, smaller scale facilities might not be economically feasible. There have

Final Report, September 15, 2004 46
been examples where facilities in other states have used non-recycled paper. But this requires a pre-shredding of the material and is only viable when paper market prices are depressed. There does seem to be a source of possible carbon source from waste wood being generated by landscapers and tree services. However, this wood would need to be “hogged” through a hammer mill and then screened to a very small size12. Again, this pre-processing cost may make in economically unviable for smaller composting operations. The alternative is to minimize the amount of grass that would be taken off residential/commercial properties. The most obvious alternative is to increase the use of mulching mowers. From DSM’s survey, the majority of landscapers already use mulching mowers. This decision is driven both by materials handling costs and time spent with each client, again a cost consideration.
The majority of the households in Delaware do not have landscaping services, thus, to increase the use of mulching mowers, an educational effort would need to be mounted to inform residents of this alternative. However, education may not be enough for a homeowner to make a major purchase of a new lawn mower. Any large behavioral change would also require a mechanism to allow homeowners to realize a savings from reducing the amount of material they send off their property.
12 This is an estimate, the range is a bit broader based on the age of the incoming material, the moisture of the mixture and ambient conditions, including type of equipment used to turn, aerate and size reduce the material.

Final Report, September 15, 2004 47
SECTION 8: SUMMARY & CONCLUSIONS
Summary
• If one were to combine the amount of residential material diverted from disposal by the state’s landscapers, tree services, municipalities and at DSWA facilities, DSM estimates this to be approximately 50,000 tons per year. The following table reflects the amount by sector:
TABLE 8.1
Residential Yard Waste Diverted in the State of Delaware
By Annual Tons % of Total Landscapers1 11,718 24 Tree Services2 25,000 50 Municipalities3 9,006 18 DSWA4 4,500 8
TOTAL TONS 50,224 (1) See table 2.10 (2) See page 33 (3) See table 3.2 (4) Provided by DSWA 7/12/04
• The following Table 8.2 summarizes the annual amount of residential yard waste material diverted from disposal and it projects the percentage of yard waste that would be diverted from disposal in the event a yard waste ban was implemented statewide in Delaware13:
Table 8.2
Annual Delaware Yard Waste Recycling Off-site of Residences
Pre Yard Waste Ban Post Yard Waste Ban
Yard waste mixed with MSW and disposed in DSWA landfills 95,600 tons 31,000 tons
New off-site yard waste being recovered 45,2001
Yard waste diverted, mulched and used by DSWA landfills 4,500 tons 4,500 tons
Current off-site yard waste managed other than at DSWA facilities 45,724 45,724
Total off-site yard waste 145,824 126,424
Total off-site yard waste recycled 50,224 95,424
% of yard waste recycled 34% 75%
(2) Exclusive of yard waste left on site.
13 DSM was tasked to analyze residential yard waste generation and disposal. According to the 1997 SCS Engineers report approximately 8,840 additional tons of yard waste from businesses and institutions also is disposed at DSWA facilities. DSM believes that businesses and institutions would behave much like residents with respect to yard waste disposition after a yard waste ban.

Final Report, September 15, 2004 48
Table 8.2 assumes that after the institution of a yard waste ban, approximately 30% of yard waste currently being disposed at DSWA landfills or 19,372 tons of material will remain on-site at residences through use of mulching lawn mowers and backyard composting. This is the reason that Table 8.2 projects a decline in total yard waste laving residents after implementation of a ban. Conclusions
• DSM continues to believe that the most reliable data on yard waste disposal for the State of Delaware is the 1997 SCS Engineers waste composition study conducted for DSWA. When the SCS data are averaged across the entire population of Delaware and applied to year 2003 population estimates, current disposal at DSWA landfills is approximately 95,600 tons (rounded) per year of both residential and commercial wastes, with residential waste comprising 90%, or 86,000 annual tons (rounded), of this total.
• An additional 50,224 tons of residential yard waste are diverted each year, either to DSWA
landfills for use as landfill cover, or through municipal and private mulching and composting operations.
• There is no universal definition of “yard waste”. Therefore, attempts to compare current
deliveries of yard waste to DSWA facilities to deliveries in adjoining states with yard waste bans is, at best a difficult exercise. Yard waste can include only grass clippings and leaf waste, or it can include brush, tree trimmings, stumps, land-clearing debris, and in some cases other organics including separated food wastes.
• There is also no universal definition of “yard waste bans” with some counties and states
enforcing bans on deliveries of all but minimal quantities of yard waste contained in mixed solid waste loads, and other states simply banning trucks carrying only yard waste from disposal at landfills. In addition, the level of enforcement varies widely, as does the provision of alternative collection systems available to residents and businesses for separate management of yard wastes. All of these variations impact on delivery of yard waste to landfills in “yard waste ban” states.
• One fact remains clear however, despite the definition of yard waste or the type of yard
waste ban – states or counties with landfill bans receive significantly less yard waste on a per capita basis then those without bans. As a consequence, there are currently 23 states with some type of a yard waste landfill ban in place.
• Recent waste composition analyses at landfills in Montgomery and Anne Arundel Counties
in Maryland, and state-wide in Pennsylvania where yard waste bans (with varying definitions) are in place show per capita yard waste disposal rates averaging 76 pounds per capita across all waste streams.
• Therefore, if Delaware were to enact a yard waste ban, it is likely that total yard waste
tonnages delivered to DSWA landfills would fall over time to 31,000 tons per year (rounded), based on current population levels.

Final Report, September 15, 2004 49
Demand for New Yard Waste Processing Capacity
• DSM’s surveys of landscapers and tree services indicates that the impact of a yard waste ban on these entities would be minimal. Ninety-six percent of the grass and 80 percent of the leaves, as well as virtually all of the tree service material is currently not delivered to DSWA landfills, but instead goes to existing private mulching and composting operations.
• With the exception of the Wilmington and Middletown, a yard waste ban at DSWA
facilities would also not impact the Incorporated Areas currently collecting yard waste separately because each Incorporated Area makes their own provisions for the disposition of the yard waste they collect.
• There are limited data from which to draw conclusions about how much of the material not
delivered to DSWA facilities would remain on-site or be delivered to existing non-DSWA facilities. For lack of better data, DSM has estimated that roughly 30 percent of the yard waste material diverted from DSWA landfills due to a yard waste ban would remain on-site through the expanded use of mulching lawn mowers and on-site mulching and composting operations. An additional amount would be diverted to existing and new privately operated sites developed/used by landscapers, lawn care companies, mulching operations, tree services, and municipalities.
• This would require that new capacity be developed by DSWA, other municipalities and/or
the private sector for approximately 45,200 tons (rounded) of yard waste annually, based on current population.
Costs to Provide Alternative Yard Waste Processing Capacity
• DSM developed generic cost estimates for various levels of yard waste composting technologies and sizes. These ranged from low technology sites using only a gravel pad and a front-end loader with a capacity to accept between 1,000 and 4,000 tons of yard waste annually, to high capacity sites with dedicated windrow turners, and or “ag-bag” sites using plastic ag-bags and forced aeration with the capacity to handle up to 8000 tons, or more, per year.
• Because of the low density of yard waste, especially leaves and brush, which makes long
distance transport expensive, and the ability to manage composting with relatively limited environmental impacts (when managed correctly), it is DSM’s conclusion that low and intermediate technology composting sites scattered throughout Delaware, as opposed to larger, centralized facilities make the most sense. These facilities can be constructed and operated at tipping fees ranging from $32 to $48 per ton, exclusive of any materials sales revenue.
• Assuming that five to seven low and intermediate technology sites were developed around
Delaware, the initial capital investment is estimated to range from $358,000 to $700,000, assuming such facilities are located on existing DSWA sites. These figures would increase if private operators were required to include purchase of land for a buffer around facilities.

Final Report, September 15, 2004 50
Separate Collection Costs
• A yard waste ban would require that private haulers in Delaware provide a separate collection service to those households and businesses not prepared to dispose of yard waste on-site. DSM had limited success-obtaining estimates from private haulers in Delaware of what the added cost for this service would be. However, based on surveys of municipalities in adjoining states, one estimate from a private waste collection company in Delaware, and DSM’s previous estimates of collection costs, DSM believes that households and businesses would have to pay an additional $4 to $5 per month for the separate collection service, net of savings in collection and tipping fees for reduced refuse collection.
• Incorporated Areas with organized collection of refuse would be faced with increases in
collection costs in the range of $2 to $3 per month. Cautions
• Many of the existing municipal yard waste management facilities do not meet minimum composting standards. As a consequence significant expansion of these sites to meet expanded demand would require additional capital and operating investments to minimize environmental impacts and to assure that a quality material is produced that will be in demand by citizens and businesses.
• Rapid suburban development in Delaware will provide challenges to composting of yard
waste created by a yard waste ban. This is because these new developments will be primarily generating grass clippings, with few leaves, at least over the next ten-year period before new trees begin to mature in these developments. This will make it difficult to find enough carbon (primarily in the form of leaves) to mix with the increase in grass clippings from these new developments.

APPENDIX A
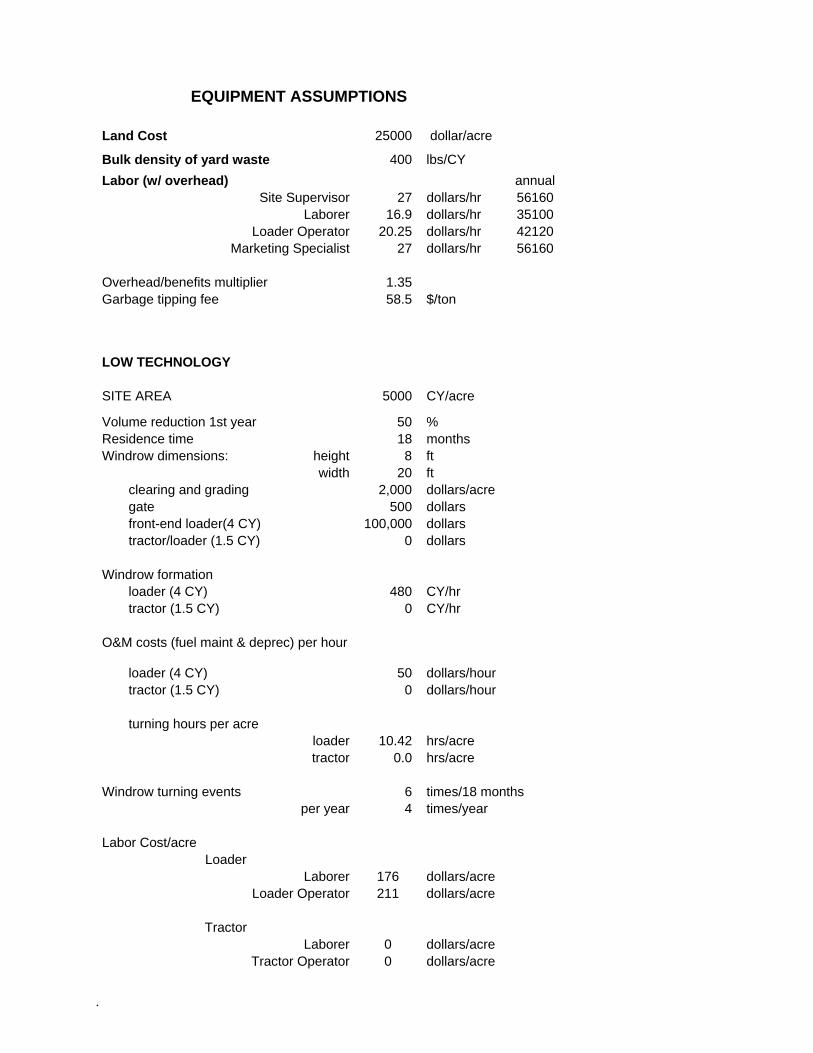
.
EQUIPMENT ASSUMPTIONS
Land Cost 25000 dollar/acre
Bulk density of yard waste 400 lbs/CY Labor (w/ overhead) annual
Site Supervisor 27 dollars/hr 56160 Laborer 16.9 dollars/hr 35100
Loader Operator 20.25 dollars/hr 42120 Marketing Specialist 27 dollars/hr 56160
Overhead/benefits multiplier 1.35 Garbage tipping fee 58.5 $/ton LOW TECHNOLOGY SITE AREA 5000 CY/acre
Volume reduction 1st year 50 % Residence time 18 months Windrow dimensions: height 8 ft
width 20 ft clearing and grading 2,000 dollars/acre gate 500 dollars front-end loader(4 CY) 100,000 dollars tractor/loader (1.5 CY) 0 dollars
Windrow formation loader (4 CY) 480 CY/hr tractor (1.5 CY) 0 CY/hr
O&M costs (fuel maint & deprec) per hour
loader (4 CY)
50 dollars/hour tractor (1.5 CY) 0 dollars/hour turning hours per acre
loader 10.42 hrs/acre tractor 0.0 hrs/acre
Windrow turning events 6 times/18 months
per year 4 times/year
Labor Cost/acre Loader
Laborer 176 dollars/acre Loader Operator 211 dollars/acre
Tractor
Laborer 0 dollars/acre Tractor Operator 0 dollars/acre

.
INTERMEDIATE TECHNOLOGY SITE AREA 3,000 CY/acre
Volume reduction 1st year 50 % clearing and grading 2,000 dollars/acre gravel pad 1600 CY/acre bank-run gravel cost 6.50 dollars/cy gate 500 dollars front-end loader (4 CY) 100,000 dollars tractor/loader (1.5 CY) 0 dollars O&M costs (fuel maint & deprec) per hour
loader (4 CY) 50 dollars/hour tractor (1.5 CY) 0 dollars/hour
windrow formation loader (4 CY) 480 CY/hr tractor (1.5 CY) 0 CY/hr windrow formation/combining windrows 3 times/12 months windrow turner 92,500 dollars
windrow dimensions: height 5 ft width 14 ft
turning capacity 7,500 CY/hr turning windrows 30 times/12 months
Screening Rental (assume 1 per year) 2000 dollars/20000 cu yds input

.
Low Methodology 5,000 CY 10,000 CY 20,000 CY Estimated days of loader time (windrow formation + turning) 2 + 6 3 + 12 6 + 18 Add 50% safety factor (days) 12 22 36 Percentage of total 390 days (18 months of working days) 3% 6% 9%
Loader capital cost of $100,000 amortized at 8% over 10 years $27,598 $27,598 $27,598 Capital Cost allocated to compost operation $828 $1,656 $2,484 based on usage at the site.
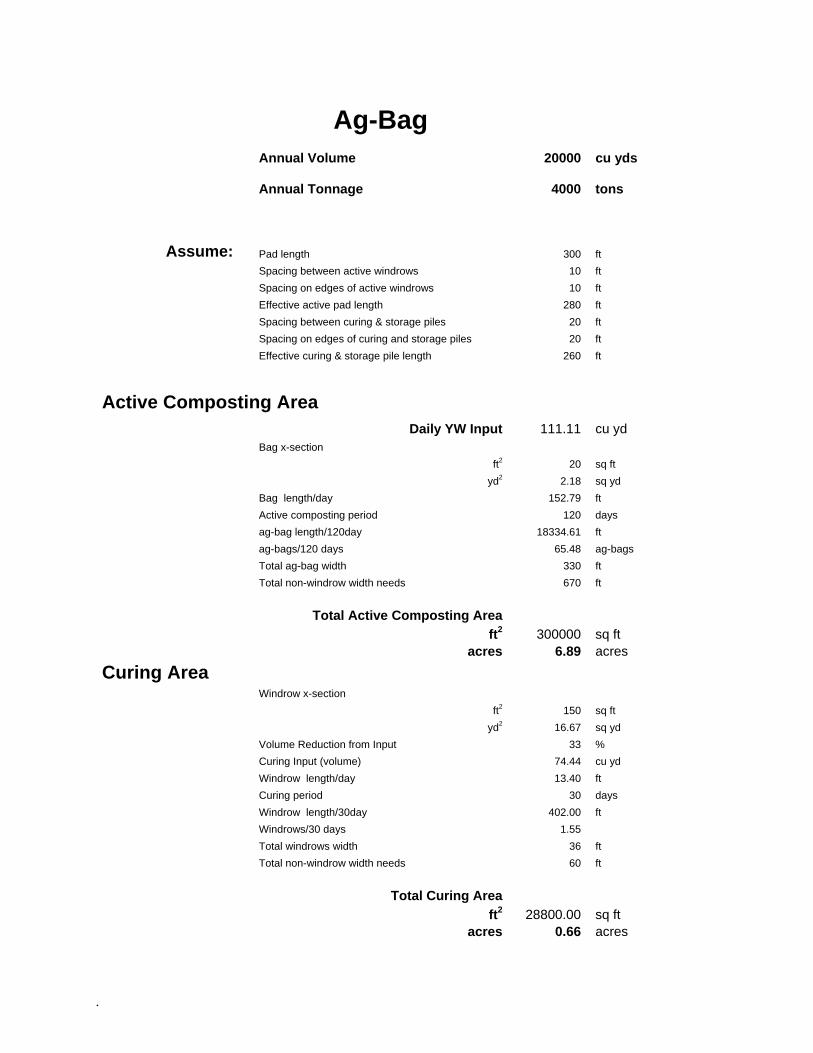
.
Ag-Bag
Annual Volume 20000 cu yds
Annual Tonnage 4000 tons
Assume: Pad length 300 ft Spacing between active windrows 10 ft Spacing on edges of active windrows 10 ft Effective active pad length 280 ft Spacing between curing & storage piles 20 ft Spacing on edges of curing and storage piles 20 ft Effective curing & storage pile length 260 ft
Active Composting Area
Daily YW Input 111.11 cu yd Bag x-section ft2 20 sq ft yd2 2.18 sq yd Bag length/day 152.79 ft Active composting period 120 days ag-bag length/120day 18334.61 ft ag-bags/120 days 65.48 ag-bags Total ag-bag width 330 ft Total non-windrow width needs 670 ft Total Active Composting Area ft2 300000 sq ft acres 6.89 acres
Curing Area Windrow x-section ft2 150 sq ft yd2 16.67 sq yd Volume Reduction from Input 33 % Curing Input (volume) 74.44 cu yd Windrow length/day 13.40 ft Curing period 30 days Windrow length/30day 402.00 ft Windrows/30 days 1.55 Total windrows width 36 ft Total non-windrow width needs 60 ft Total Curing Area ft2 28800.00 sq ft acres 0.66 acres

.
Ag-Bag (Cont’d)
Compost Storage Area Windrow x-section ft2 486 sq ft yd2 54.00 sq yd Volume Reduction from Input 50 % Curing Input (volume) 55.56 cu yd Windrow length/day 3.09 ft Storage period 90 days Windrow length/90day 277.78 ft Windrows/90 days 1.07 Total windrows width 36 Total non-windrow width needs 60
Total Compost Storage Area ft2 28800.00 acres 0.66 TOTAL ACREAGE REQUIRED 8.21 w/buffer 9.00

.
Ag-bag Input and Pile Configuration
YW Generation Annual 4000 ton/year Weekly 111 tons/week Daily 22 tons/day Density YW 400 lbs/cu yd Compost 1000 lbs/cu yd YW Generation Volume Annual 20000 cu yd/year Weekly 556 cu yd/week Daily 111 cu yard/day Active Weeks 36 weeks Bulking Mixing ratio (volume) leaves to grass 3:1 total input coefficient 4 Volume reduction (from input vol) Active 33 % Curing 50 % Active Pile dimensions ag-bag Ag-bag radius 5 ft x-section dimension (square feet) 20 ft Curing Pile dimensions Windrow height (feet) 10 ft Windrow width (feet) 18 ft x-section dimension (square feet) 150 sq ft Storage pile dimensions Windrow height (feet) 18 ft Windrow width (feet) 36 ft x-section dimension (square feet) 486 sq ft Composting Stage duration (days) active 120 days curing 30 days storage 90 days Total on site 240 days