analysis of the atmospheric composition during the summer 2013
TRANSCRIPT

ACPD14, 23075–23123, 2014
Analysis of theatmospheric
composition duringthe summer 2013
L. Menut et al.
Title Page
Abstract Introduction
Conclusions References
Tables Figures
J I
J I
Back Close
Full Screen / Esc
Printer-friendly Version
Interactive Discussion
Discussion
Paper
|D
iscussionP
aper|
Discussion
Paper
|D
iscussionP
aper|
Atmos. Chem. Phys. Discuss., 14, 23075–23123, 2014www.atmos-chem-phys-discuss.net/14/23075/2014/doi:10.5194/acpd-14-23075-2014© Author(s) 2014. CC Attribution 3.0 License.
This discussion paper is/has been under review for the journal Atmospheric Chemistryand Physics (ACP). Please refer to the corresponding final paper in ACP if available.
Analysis of the atmospheric compositionduring the summer 2013 over theMediterranean area using the CHARMEXmeasurements and the CHIMERE modelL. Menut1, S. Mailler1, G. Siour2, B. Bessagnet3, S. Turquety1, G. Rea1,R. Briant1, M. Mallet4, J. Sciare5, and P. Formenti2
1LMD, Laboratoire de Météorologie Dynamique, UMR CNRS 8539, Ecole Polytechnique,Ecole Normale Supérieure, Université P. M. Curie, Ecole Nationale des Ponts et Chaussées,Palaiseau, France2LISA, Laboratoire Inter-Universitaire des Systèmes Atmosphériques, UMR CNRS 7583,Université Paris Est Créteil et Université Paris Diderot, Institut Pierre Simon Laplace, Créteil,France3INERIS, Institut National de l’Environnement Industriel et des Risques, Verneuil en Halatte,60550, Parc Technologique ALATA, France4Laboratoire d’Aérologie, UMR CNRS 5560, Université P. Sabatier, Toulouse, France5LSCE, Laboratoire des Sciences du Climat et de l’Environnement, UMR CNRS 8212, CEA,Université Versailles St Quentin, Gif sur Yvette, France
23075

ACPD14, 23075–23123, 2014
Analysis of theatmospheric
composition duringthe summer 2013
L. Menut et al.
Title Page
Abstract Introduction
Conclusions References
Tables Figures
J I
J I
Back Close
Full Screen / Esc
Printer-friendly Version
Interactive Discussion
Discussion
Paper
|D
iscussionP
aper|
Discussion
Paper
|D
iscussionP
aper|
Received: 18 July 2014 – Accepted: 27 August 2014 – Published: 8 September 2014
Correspondence to: L. Menut ([email protected])
Published by Copernicus Publications on behalf of the European Geosciences Union.
23076

ACPD14, 23075–23123, 2014
Analysis of theatmospheric
composition duringthe summer 2013
L. Menut et al.
Title Page
Abstract Introduction
Conclusions References
Tables Figures
J I
J I
Back Close
Full Screen / Esc
Printer-friendly Version
Interactive Discussion
Discussion
Paper
|D
iscussionP
aper|
Discussion
Paper
|D
iscussionP
aper|
Abstract
The ADRIMED campaign provides measurements of all key parameters regarding at-mospheric composition in the Mediterranean area during the summer 2013. This is anopportunity to quantify the ability of current models to adequately represent the atmo-spheric composition in this complex region, which is influenced by anthropogenic emis-5
sions from Europe, Africa, the Middle-East and from shipping activities as well as min-eral dust emissions mostly from the arid areas in Africa, sea-salt emissions, biomassburning emissions and biogenic emissions from the vegetation. The CHIMERE modelin its present version is a chemistry-transport model which takes into account all theseprocesses. We show here by simulating the period from 5 June to 15 July 2013 with10
the CHIMERE model and comparing the results to both routine and specific ADRIMEDmeasurements that this model allows an adequate representation the atmosphericcomposition over the western Mediterranean, in terms of ozone concentration, par-ticulate matter (PM) and aerosol optical depth (AOD). It is also shown that the concen-trations of PM on all the considered area is dominated by mineral dust, even though15
local dust emissions in Europe are certainly overestimated by the model. A comparisonwith sulphate concentrations at Cape Corsica exhibits some discrepancies related tothe regridding of shipping emissions.
1 Introduction
Particulate matter is a major problem for regional air quality in Europe (EEA, 2013).20
During the last decade, the European legislation focused on particulate matter (PM)with PM10 (particles with a particle diameter below 10 µm) and even PM2.5 in the lastEuropean directive on air quality (air quality directive 2008/50/EC). PM is responsiblefor a loss of life expectancy particularly when we consider long-term exposure to PM2.5(Kloog et al., 2012; Martinelli et al., 2013).25
23077

ACPD14, 23075–23123, 2014
Analysis of theatmospheric
composition duringthe summer 2013
L. Menut et al.
Title Page
Abstract Introduction
Conclusions References
Tables Figures
J I
J I
Back Close
Full Screen / Esc
Printer-friendly Version
Interactive Discussion
Discussion
Paper
|D
iscussionP
aper|
Discussion
Paper
|D
iscussionP
aper|
However, studying the sources and sinks of aerosols is very difficult since a lot of dif-ferent components are included in these particulate matters: several chemical speciesor materials (organic matter, sulphates, nitrates, ammonium, mineral dust, sea salt,etc ...), with several sizes and shapes, several origins, lifetimes, potential direct and in-direct effects on radiation, clouds formations etc. (Rodriguez et al., 2007). In order to5
reduce potential damages due to too high aerosols concentrations, it is thus necessaryto improve our knowledge on all of these aspects.
Among many polluted regions in the world, Monks et al. (2009) highlight the Mediter-ranean area as a hot spot for its high variability of aerosol compositions and origin. Twomain circulations are identified over the Mediterranean area: a North to South flow in10
the lowest layers and a South to North flow in the middle and upper tropospheric layers(Millan et al., 2005).
Kubilay et al. (2003) presented the several characteristics of the South to NorthAfrican flow depending on the season: during the summer and autumn, the dust out-breaks are limited to upper troposphere and originated of Middle-East and North-Africa.15
The major dust outbreaks coming from central Sahara are observed during spring, withidentification of particles in the whole tropospheric column. In addition, two other semi-permanent systems are present: the Azores anticyclone at the Western edge of theMediterranean and a low pressure system in the East. This leads to frontal systemscoming from the Atlantic Ocean and crossing the sea from West to East, as presented20
by Scheeren et al. (2003). A simple synthesis of these results is summarised in Fig. 1.The strong Northern component of the flow pattern is due to a differential heating
between North Africa (bare soil), the Mediterranean sea (with a daily sea surface tem-perature cycle) and the land of Southern Europe (with a mixed-type vegetation) (Millanet al., 1997). This circulation dominates in the boundary layer (typically the first two25
kilometres above ground). Kallos et al. (1998) showed that this transport of pollutantsoccurs during all seasons, but mainly during summer (due to a lack in wet removal).This is also shown by Israelevich et al. (2012). Pollutants are found in the entire tro-posphere with time scales for transport of four to six days. They affect air quality in
23078
ACPD14, 23075–23123, 2014
Analysis of theatmospheric
composition duringthe summer 2013
L. Menut et al.
Title Page
Abstract Introduction
Conclusions References
Tables Figures
J I
J I
Back Close
Full Screen / Esc
Printer-friendly Version
Interactive Discussion
Discussion
Paper
|D
iscussionP
aper|
Discussion
Paper
|D
iscussionP
aper|
North Africa and the Middle East part of the Mediterranean region. Due to a lack of wetremoval during these periods, the only efficient mechanism becomes the dry removal,much more slower than the wet one.
An important part of aerosol mass in the Mediterranean area comes from the Africanmineral dust. They may be transported through the Atlantic Ocean towards United5
States and Europe (Kallos et al., 2006). For the particular case of Europe, the particlesare mainly transported in the free troposphere and mainly composed of mineral dustand, to a lesser extent, carbon due to fires. These particles may have two differentimpacts: (i) a direct impact through their sedimentation into the surface layer: they thuscontribute to the PM concentration in the boundary layer, (ii) an indirect impact through10
their effects on meteorology (dynamics and microphysics) and photochemistry.The need for a better understanding of the aerosols life cycle led to several dedicated
fields campaigns such as MINOS in Crete (Lelieveld et al., 2002), ESCOMPTE overMarseille in France (Mallet et al., 2006), EUCARII campaign (Kulmala et al., 2011) aswell as a lot of studies using surface measurements of aerosols concentrations (Querol15
et al., 2009), airborne measurements (Dulac and Chazette, 2003), optical thicknessesdeduced from sunphotometers (Kubilay et al., 2003) or satellite data (Barnaba andGobbi, 2004). More recently, remote-sensing surface measurements were dedicated tothe quantification of dust optical properties and direct radiative forcing as in Bergamoet al. (2008); Basart et al. (2009); Mallet et al. (2013).20
These measurements have been accompanied by significant regional model devel-opments. Depending on the studied aerosol type, modelling studies have helped tobetter quantify the sources, transport and radiative impact of mineral dust, (Pérez et al.,2011; Nabat et al., 2012; Menut et al., 2013b; de la Paz et al., 2013), sea salt, (Jiménez-Guerrero et al., 2011) and vegetation fires (Turquety et al., 2014), among others.25
The major part of these studies was devoted to the analysis of past events. An-other possible use of these modelling systems is for short-term forecast. Over Europe,numerous regional systems were designed these last years (Menut and Bessagnet,2010). In general, they calculate separately aerosol types, such as anthropogenic and
23079
ACPD14, 23075–23123, 2014
Analysis of theatmospheric
composition duringthe summer 2013
L. Menut et al.
Title Page
Abstract Introduction
Conclusions References
Tables Figures
J I
J I
Back Close
Full Screen / Esc
Printer-friendly Version
Interactive Discussion
Discussion
Paper
|D
iscussionP
aper|
Discussion
Paper
|D
iscussionP
aper|
mineral dust. However, an accurate forecast needs to take into account all aerosoltypes in the same model to be fully representative of the regional atmospheric com-position. In the present study we use such a complete system with the WRF andCHIMERE models. Integrating recent developments described in Menut et al. (2013a),the CHIMERE chemistry-transport model takes into account anthropogenic, biogenic,5
sea-salt, mineral dust and vegetation fires emissions. All these species constitutea complex mixture remotely transported and deposited.
During the summer 2013, the ADRIMED field campaign was organised to bet-ter understand the aerosol properties over the Mediterranean basin (Mallet, 2014).ADRIMED, that deals with the aerosols, radiations and climate interaction, is a part10
of the international CHARMEX (CHemistry-AeRosol Mediterranean EXperiment) pro-gram (Dulac et al., 2013). In order to launch intensive observations periods (especiallyaircraft operations) with the best probability of interesting events, many models wereused to forecast the meteorology and chemical concentrations, including the WRF-CHIMERE system.15
The purpose of this paper is to fully evaluate the simulations undertaken during thecampaign using a wide set of surface, in situ and remote sensing observations. Sec-tion 2 presents the experimental framework of the ADRIMED campaign and the wholeset of data (surface, soundings, aircraft measurements, satellite) used in this study.Section 3 presents the modelling system and the settings. Sections. 4, 5 and 6 present20
gaseous, aerosols optical depth and aerosols concentrations results for the studiedperiod, respectively. Conclusions and perspectives are presented in Sect. 7.
2 The Mediterranean area and the ADRIMED project
This study is undertaken in the framework of the “Aerosol Direct Radiative Impact onthe regional climate in the MEDiterranean region” (ADRIMED) project. ADRIMED is25
part of the international ChArMEx program (Dulac et al., 2013). CHARMEX aims at
23080

ACPD14, 23075–23123, 2014
Analysis of theatmospheric
composition duringthe summer 2013
L. Menut et al.
Title Page
Abstract Introduction
Conclusions References
Tables Figures
J I
J I
Back Close
Full Screen / Esc
Printer-friendly Version
Interactive Discussion
Discussion
Paper
|D
iscussionP
aper|
Discussion
Paper
|D
iscussionP
aper|
assessing the present and future state of atmospheric chemistry in the Mediterraneanarea, and its impact on the regional climate, air quality, and marine ecosystems.
The main goal of ADRIMED is to assess the impacts of the direct and semi-directradiative effect of aerosols on the regional climate of the Mediterranean. The projectstrategy is based on an integrated approach combining an intensive experimental field5
campaign and regional modelling of meteorology and chemistry-transport.The experimental part of the project was done during the summer 2013 (June and
July). All measurements showed that summer was not a highly polluted period. Theobserved gaseous and particles concentrations were moderate and often a complexmixture of many different sources: anthropogenic activities, biogenic emissions from10
vegetations, mineral dust transport and vegetation fires.Figure 2 presents the location of vegetation fires detected during the whole summer
2013. The calculation was performed using the high-resolution vegetation model usedin this study and presented in Turquety et al. (2014). The week number of first firedetection ranges from 1 (the first week of June 2013) to 12 (the last week of Septem-15
ber 2013). It shows a majority of first fire event during the weeks 8 to 12, i.e. duringSeptember. These fires are mainly located in Portugal and Russia, and in a lesser ex-tent, in Greece. For each model grid cell, the number of fire events is presented i.e. thenumber of different fires for each area (the data are projected on the model mesh pre-sented hereafter). For a large majority of diagnosed fires, this number is one, showing20
there were not a lot of fires during this summer.
2.1 The routine surface measurements
Over the Mediterranean area, the routine measurements are mainly performed forchemical concentrations and not meteorological variables. In fact, there is no organisednetwork able to distribute mesonet stations data with variables such as 2 m tempera-25
ture, relative humidity and 10 m wind speed. These variables are measured country bycountry and not always reachable. In this study, the comparisons between measured
23081

ACPD14, 23075–23123, 2014
Analysis of theatmospheric
composition duringthe summer 2013
L. Menut et al.
Title Page
Abstract Introduction
Conclusions References
Tables Figures
J I
J I
Back Close
Full Screen / Esc
Printer-friendly Version
Interactive Discussion
Discussion
Paper
|D
iscussionP
aper|
Discussion
Paper
|D
iscussionP
aper|
and modelled meteorological variables will be limited to the measurements performeddirectly during and for the ADRIMED experiment.
For regulatory pollutants (such as PM10, PM2.5, O3), many measurements are rou-tinely performed and well organised in homogeneous databases. For instance the EEA(European Environmental Agency) is responsible for the AirBase database, it contains5
air quality monitoring data and information submitted by the participating countriesthroughout Europe (http://www.eea.europa.eu/). Concentrations are hourly recordedand this study will focus on ozone and PM10 surface concentrations. Due to the coarsemodel resolution (50km×50km), the comparison of NO2 is irrelevant, and has there-fore not been performed. In order to calculate scores and study time series, we re-10
tained specific sites with a first set of 8 “coastal background” stations and a second setof 9 “continental background” stations. Their location is displayed in Fig. 3 and detailsabout their localization is explained in Table 1. They were chosen to be representativeof various locations around the Mediterranean Sea: Spain, France and Italy, includingBaleares, Corsica and Lampedusa islands. From all available routine stations, the se-15
lected stations are all “background” stations. This choice is mandatory if we want tocompare surface concentrations to regional model, knowing that the simulations pre-sented here have a 50km×50km horizontal resolution.
2.2 The specific ADRIMED measurements
The experimental part included in-situ surface at two super (Lampedusa and Cape20
Corsica) and secondary (Minorca, Granada) sites, aircrafts (ATR-42 and Falcon-20aircrafts) and spaceborne observations, as presented in Mallet (2014).
2.2.1 Surface measurements
For surface measurements, the super-sites of Lampedusa and Cape Corsica wereequipped to monitor the main aerosol properties as the complete particle size distribu-25
tion (fine and coarse fraction), the chemical composition, possible mixing, total mass
23082

ACPD14, 23075–23123, 2014
Analysis of theatmospheric
composition duringthe summer 2013
L. Menut et al.
Title Page
Abstract Introduction
Conclusions References
Tables Figures
J I
J I
Back Close
Full Screen / Esc
Printer-friendly Version
Interactive Discussion
Discussion
Paper
|D
iscussionP
aper|
Discussion
Paper
|D
iscussionP
aper|
concentration, scattering and absorption, particle vertical profiles as well as downwardshortwave (SW) and longwave (LW) fluxes. In addition, a quite similar in-situ instrumen-tation has been deployed onboard the ATR-42 for estimating microphysical, chemicaland optical properties within aerosol plumes located in altitude and not detectable atthe surface stations. In parallel, remote-sensing observations (passive and active) have5
been performed onboard the Falcon-20 during the 17 June to 5 July period to deriveaerosol loading and microphysical properties for the whole atmospheric column as wellas aerosol vertical profiles.
2.3 Airborne measurements
The ATR-42 aircraft was operated by the SAFIRE CNRS, CNES and Météo-France joint10
laboratory. Nine flights were done during the studied period. The flight numbers, dateand decimal hour, corresponding Julian day of flight are reported in Table 2. Trajectoriesare very different from one flight to another and are represented in Fig. 4.
2.4 The satellite measurements
Numerous satellite observations are available, but only the MODIS (Moderate Resolu-15
tion Imaging Spectroradiometer) data will be compared in this study to model outputs.Other satellite data will be more precisely analysed in companion papers, always forthe ADRIMED campaign analysis.
The MODIS satellite products have been used for many years to study the amountand origin of aerosols in the Mediterranean area troposphere. Barnaba and Gobbi20
(2004) used these data to split relative contributions of aerosols on AOD (Aerosol Op-tical Depth). They showed that for the same particle size, its origin (maritime, continen-tal or desert dust) may induce an AOD variability of one order of magnitude. Duringthe studied year of 2001, the total amount of aerosol emissions was found to be thelargest for dust (119 kTons day−1 with lowest values during winter), followed by maritime25
23083
ACPD14, 23075–23123, 2014
Analysis of theatmospheric
composition duringthe summer 2013
L. Menut et al.
Title Page
Abstract Introduction
Conclusions References
Tables Figures
J I
J I
Back Close
Full Screen / Esc
Printer-friendly Version
Interactive Discussion
Discussion
Paper
|D
iscussionP
aper|
Discussion
Paper
|D
iscussionP
aper|
aerosols (111 kTons day−1 more or less constant during the year) and finally continentalaerosols (33 kTons day−1 with largest value during summer).
More recently, Levy et al. (2010) evaluated the MODIS AOD product over land, bycomparison to AERONET sunphotometer data. They showed that there is a high corre-lation (R = 0.9) between the two AOD products, with a mean bias of ±0.05. In this study,5
we combine the two MODIS sensors, AQUA and TERRA, to build an unified AOD prod-uct, including the Deep Blue algorithm result (Hsu et al., 2004). Even if some biases areobserved over long periods, Levy et al. (2010) showed this can be a problem only forlong-term trends studies. For this study, it is reasonable to consider that MODIS dataare completely relevant for comparisons to model outputs during the ADRIMED period.10
The AOD estimated at 550 nm is used in this study. Some sensitivity studies (Kaufmanet al., 1997; Tanré et al., 1997) estimated the expected error of MODIS retrievals as±(0.03+0.05×AOD) over ocean and ±(0.05+0.2×AOD) over land.
3 The modelling system
The modelling system is composed of several models: the WRF regional meteorolog-15
ical model, the CHIMERE chemistry-transport model and additional individual modelsfor emissions fluxes estimations. All these models are integrated in a modelling plat-form usable both in analysis and forecast mode. For the vegetation fires emissions,satellite data are analysed to be used by the high resolution fire model (Turquety et al.,2014). The biogenic and mineral dust emissions fluxes depend on the meteorology,20
when the anthropogenic emissions are only dependent on the week day. The simula-tion was performed from the 1 June to the 15 July 2013.
3.1 The meteorological model WRF
The meteorological parameters are modelled with the non-hydrostatic WRF regionalmodel in its version 3.2.1 (Skamarock et al., 2007). The model is used with a constant25
23084

ACPD14, 23075–23123, 2014
Analysis of theatmospheric
composition duringthe summer 2013
L. Menut et al.
Title Page
Abstract Introduction
Conclusions References
Tables Figures
J I
J I
Back Close
Full Screen / Esc
Printer-friendly Version
Interactive Discussion
Discussion
Paper
|D
iscussionP
aper|
Discussion
Paper
|D
iscussionP
aper|
horizontal resolution of 50km×50km and 32 vertical levels from the surface to 50 hPa,as displayed in Fig. 5. This resolution enables simulations over a very large domain,including all kind of sources (anthropogenic, biogenic, mineral dust and fires) as wellas various long-range transport events often observed between Africa and Europe.
The Single Moment-5 class microphysics scheme is used allowing for mixed phase5
processes and super cooled water (Hong et al., 2004). The radiation scheme isRRTMG scheme with the MCICA method of random cloud overlap (Mlawer et al.,1997). The surface layer scheme is based on Monin–Obukhov with Carslon–Bolandviscous sub-layer. The surface physics is calculated using the Noah Land SurfaceModel scheme with four soil temperature and moisture layers (Chen and Dudhia, 2001).10
The planetary boundary layer physics is processed using the Yonsei University scheme(Hong et al., 2006) and the cumulus parameterization uses the ensemble scheme ofGrell and Devenyi (2002).
The global meteorological fields of NCEP/GFS are hourly read by WRF using nudg-ing techniques and for the main atmospheric variables (pressure, temperature, humid-15
ity, wind). In order to preserve both large-scale circulations and small scale gradientsand variability, the “spectral nudging” was chosen. This nudging was evaluated in re-gional models, as presented in Von Storch et al. (2000). In this study, the spectral nudg-ing was selected to be applied for all wavelength greater than ≈ 2000 km (wavenum-bers less than 3 in latitude and longitude, for wind, temperature and humidity and only20
above 850 hPa). This configuration allows the regional model to create its own struc-tures within the boundary layer but to follow the large scale meteorological fields.
3.2 The chemistry-transport model CHIMERE
CHIMERE is a chemistry-transport model able to simulate concentrations fields ofgaseous and aerosols species at a regional scale. The model is off-line and thus needs25
pre-calculated meteorological fields to run. In this study, we used the version fully de-scribed in Menut et al. (2013a). The simulations are performed over the same horizon-
23085
ACPD14, 23075–23123, 2014
Analysis of theatmospheric
composition duringthe summer 2013
L. Menut et al.
Title Page
Abstract Introduction
Conclusions References
Tables Figures
J I
J I
Back Close
Full Screen / Esc
Printer-friendly Version
Interactive Discussion
Discussion
Paper
|D
iscussionP
aper|
Discussion
Paper
|D
iscussionP
aper|
tal domain as the one used for WRF. For the vertical grid, the 32 vertical levels areprojected on the 20 levels of the CHIMERE mesh, defined from the surface to 300 hPa.
The gaseous species are calculated using the MELCHIOR 2 scheme and theaerosols using the scheme developed by Bessagnet et al. (2004). This module takesinto account species such as sulphate, nitrate, ammonium, primary organic matter5
(POM) and elemental carbon (EC), secondary organic aerosols (SOA), sea salt, dustand water. These aerosols are represented using ten bins, from 40 nm to 40 µm, indiameter. The life cycle of these aerosols is completely represented with nucleation ofsulphuric acid, coagulation, adsorption/desorption, wet and dry deposition and scav-enging. This scavenging is both represented by coagulation with cloud droplets and10
precipitation. The formation of SOA is also taken into account.The anthropogenic emissions are estimated using the same methodology as the
one described in Menut et al. (2012) but with the HTAP (Hemispheric Transport of AirPollution) annual totals as input data. These masses were prepared by the EDGARTeam, using inventories based on MICS-Asia, EPA-US/Canada and TNO databases15
(http://edgar.jrc.ec.europa.eu/htap_v2). Biogenic emissions are calculated using theMEGAN emissions scheme (Guenther et al., 2006) which provides fluxes of isopreneand monoterpenes. In addition to this version, several processes were improved andadded in the framework of this study. First, the mineral dust emissions are now calcu-lated using new soil and surface databases (Menut et al., 2013b) and with a spatial20
extension of potentially emitting areas in Europe as described in Briant et al. (2014).Second, chemical species emissions fluxes produced by vegetation fires are estimatedusing the new high resolution fire model presented in Turquety et al. (2014). And, fi-nally, the photolysis rates are explicitly calculated using the FastJX radiation module(version 7.0b), (Wild et al., 2000; Bian and Prather, 2002). The modelled AOD is ob-25
tained by summing the optical depth produced by FastJX for the 600 nm wavelengthover the whole atmospheric column.
23086

ACPD14, 23075–23123, 2014
Analysis of theatmospheric
composition duringthe summer 2013
L. Menut et al.
Title Page
Abstract Introduction
Conclusions References
Tables Figures
J I
J I
Back Close
Full Screen / Esc
Printer-friendly Version
Interactive Discussion
Discussion
Paper
|D
iscussionP
aper|
Discussion
Paper
|D
iscussionP
aper|
4 Analysis of ozone concentrations
The first step of comparisons between measurements and model is devoted to theanalysis of ozone. This gaseous species reflects the amount of photo-oxidant pollution,especially during summertime periods. Two kinds of data are used in this section: (i) theroutine surface measurements of the AirBase background stations and (ii) the airborne5
measurements done for ADRIMED with the ATR aircraft. The AirBase measurementsare regular in time, being hourly, and are able to quantify if the model is able to simulateboth the background values and the peaks during high pollution events. But, beingonly at the surface, these measurements are not dedicated to provide an informationon the model behaviour in the whole troposphere and thus to have an interpretation10
on the ozone long range transport. The ATR measurements are thus complementaryto surface observations, providing vertical ozone profiles at a given time. But unlikesurface observations, they are very specific and do not reflect the overall situation ofthe atmospheric pollution over the whole Mediterranean area. The simulation resolutionbeing ∆x = ∆y = 50km, comparisons are not done with NO2 surface measurements for15
questions of representativeness.
4.1 Ozone surface concentrations time series
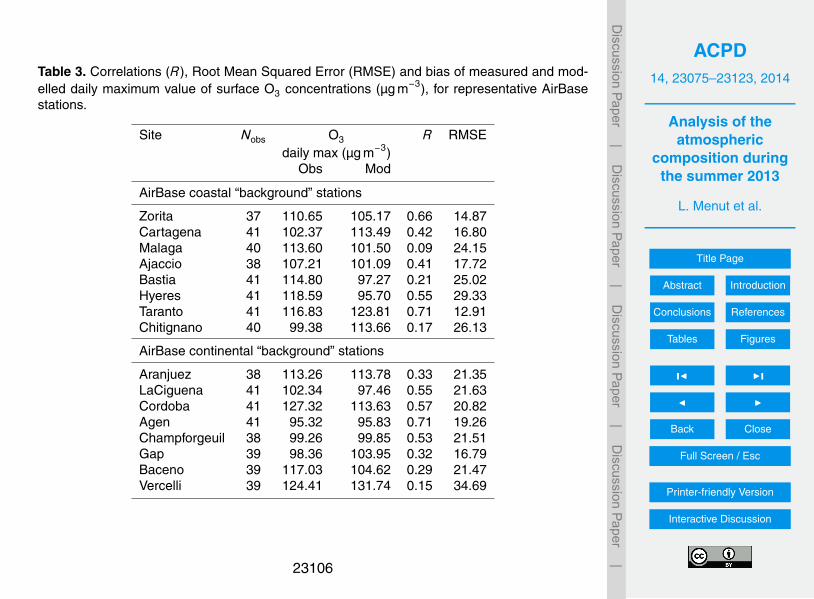
For ozone, scores are calculated for daily maximum and daily mean values. Resultsare presented in Table 3 (daily maximum) and Table 4 (daily mean). The correspondingtime series are presented in Fig. 6 for the daily maximum values only (the time series for20
the hourly values and over a period of more than one month are not readable). Resultsare split as a function of the AirBase surface station type, coastal or continental.
The scores reported in Table 3 are representative of the ability of the model to catchextreme events. Depending on the location, the model simulates lower or higher maxi-mum daily values, compared to the measurements. But for all stations, the differences25
between the two is never more than 20 µg m−3. The correlations are also very dis-persed, with values ranging from 0.09 to 0.71. One can expect to have better corre-
23087
ACPD14, 23075–23123, 2014
Analysis of theatmospheric
composition duringthe summer 2013
L. Menut et al.
Title Page
Abstract Introduction
Conclusions References
Tables Figures
J I
J I
Back Close
Full Screen / Esc
Printer-friendly Version
Interactive Discussion
Discussion
Paper
|D
iscussionP
aper|
Discussion
Paper
|D
iscussionP
aper|
lations over the continent than over the sea due to the formation processes of ozone.This is not always the case, showing the sensitivity of the model to estimate daily peaksover this complex region.
The scores in Table 4 are complementary and present scores for daily mean values.In this case, the complete diurnal cycle of the ozone formation is taken into account.5
The scores are often better than for the daily peaks, with values up to 0.74. The lesscorrelated results are obtained for the locations of Malaga, Bastia and Gap, as alreadydiagnosed with the daily peaks. This denotes a general inability of the model to repre-sent ozone formation and transport over these areas. For these three sites, the problemis related to the low model resolution: these three sites being in mountainous or island10
areas, the subgrid scale variability of ozone is difficult to model. The scores over theseMediterranean sites are generally lower than the usual predictions of CHIMERE usedin a forecast mode over the whole Europe (Honoré et al., 2008).
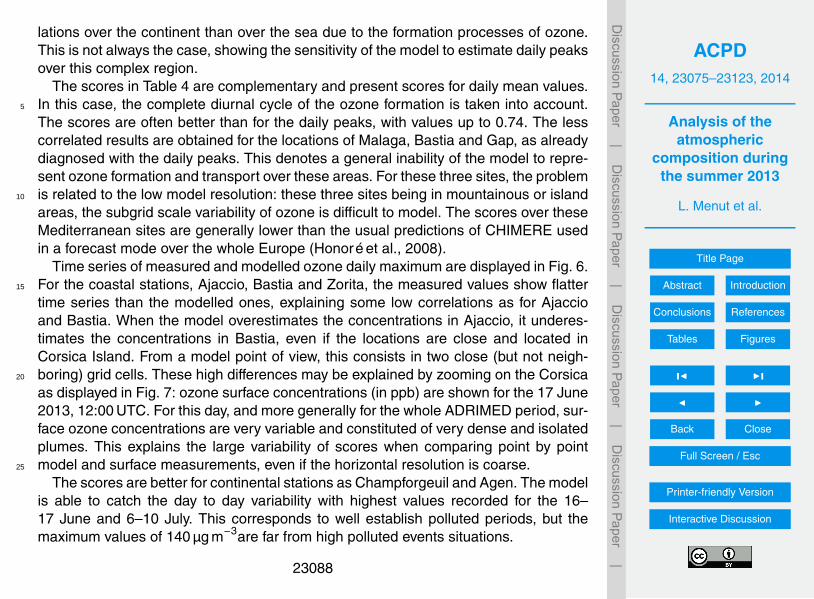
Time series of measured and modelled ozone daily maximum are displayed in Fig. 6.For the coastal stations, Ajaccio, Bastia and Zorita, the measured values show flatter15
time series than the modelled ones, explaining some low correlations as for Ajaccioand Bastia. When the model overestimates the concentrations in Ajaccio, it underes-timates the concentrations in Bastia, even if the locations are close and located inCorsica Island. From a model point of view, this consists in two close (but not neigh-boring) grid cells. These high differences may be explained by zooming on the Corsica20
as displayed in Fig. 7: ozone surface concentrations (in ppb) are shown for the 17 June2013, 12:00 UTC. For this day, and more generally for the whole ADRIMED period, sur-face ozone concentrations are very variable and constituted of very dense and isolatedplumes. This explains the large variability of scores when comparing point by pointmodel and surface measurements, even if the horizontal resolution is coarse.25
The scores are better for continental stations as Champforgeuil and Agen. The modelis able to catch the day to day variability with highest values recorded for the 16–17 June and 6–10 July. This corresponds to well establish polluted periods, but themaximum values of 140 µg m−3are far from high polluted events situations.
23088

ACPD14, 23075–23123, 2014
Analysis of theatmospheric
composition duringthe summer 2013
L. Menut et al.
Title Page
Abstract Introduction
Conclusions References
Tables Figures
J I
J I
Back Close
Full Screen / Esc
Printer-friendly Version
Interactive Discussion
Discussion
Paper
|D
iscussionP
aper|
Discussion
Paper
|D
iscussionP
aper|
4.2 Ozone, meteorological vertical profiles with the ATR flights
The ozone concentrations measured during the ATR flights are averaged from 1 Hzto a 5 mn time step. The number of averaged data is reported in Table 2. With themodel, the concentration corresponding to the location of the measurement is interpo-lated in time (between the two modelled hourly outputs), vertically (between the two5
model vertical levels) and horizontally (using a bilinear interpolation). The comparisonbetween the modelled and measured ozone concentrations is presented in Fig. 8. Thecorresponding altitude, temperature (in ◦C) and mean wind speed (in m s−1) are alsopresented, using the same abscissa axis.
Each flight lasts between two and three hours. In the altitude panels, we can see10
that the plane made several iso-altitude measurements, mainly at 4000 m and 6000 m.For meteorological data, the temperature is always very well simulated by the WRFmodel. The differences between model and measurements are very weak, except, forexample, for flights 30 and 31 where the temperature is slightly underestimated bythe model and in altitude. The wind is variable and there are differences between the15
model and measurements, mostly in terms of variability. Trends in wind are well simu-lated. Ozone is always a little over-estimated by the model, especially in altitude. Thisis probably a direct effect of boundary conditions that may be too strong for this period.The boundary chemical fields are derived from a global climate model and the summerof 2013 was moderated in terms of pollution: the climatology may thus induce a posi-20
tive bias in the model. These flights within the marine boundary layer are a very goodopportunity to evaluate ozone concentrations over the maritime surfaces. These con-centrations are usually very high in models due to a lack of deposition. For the parts offlights near the surface, the model is mostly closer to the measurement. There are twopeaks simulated by the model during flights 29 and 33 that are not measured: these25
modelled high ozone values correspond to local ozone plumes as presented in Fig. 7.However, the ozone peak close to the surface for the flight 30 is perfectly captured.
23089
ACPD14, 23075–23123, 2014
Analysis of theatmospheric
composition duringthe summer 2013
L. Menut et al.
Title Page
Abstract Introduction
Conclusions References
Tables Figures
J I
J I
Back Close
Full Screen / Esc
Printer-friendly Version
Interactive Discussion
Discussion
Paper
|D
iscussionP
aper|
Discussion
Paper
|D
iscussionP
aper|
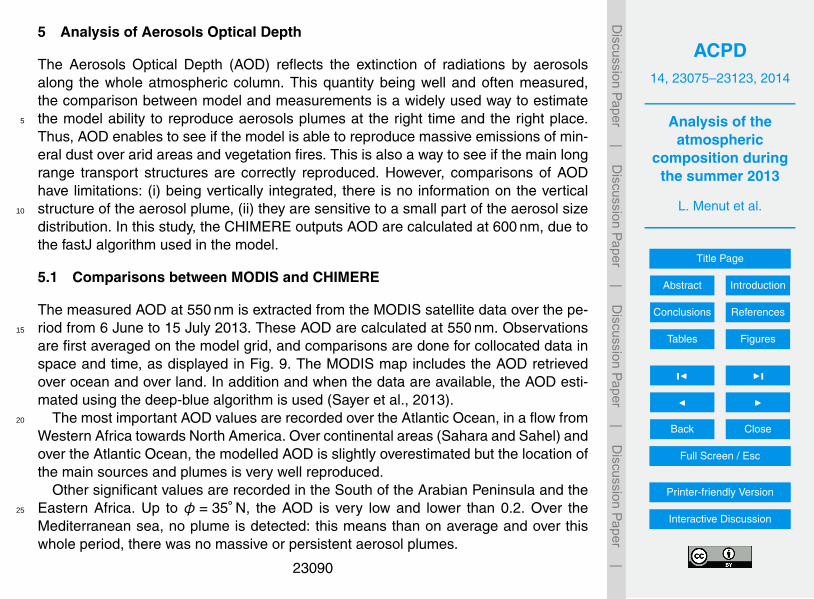
5 Analysis of Aerosols Optical Depth
The Aerosols Optical Depth (AOD) reflects the extinction of radiations by aerosolsalong the whole atmospheric column. This quantity being well and often measured,the comparison between model and measurements is a widely used way to estimatethe model ability to reproduce aerosols plumes at the right time and the right place.5
Thus, AOD enables to see if the model is able to reproduce massive emissions of min-eral dust over arid areas and vegetation fires. This is also a way to see if the main longrange transport structures are correctly reproduced. However, comparisons of AODhave limitations: (i) being vertically integrated, there is no information on the verticalstructure of the aerosol plume, (ii) they are sensitive to a small part of the aerosol size10
distribution. In this study, the CHIMERE outputs AOD are calculated at 600 nm, due tothe fastJ algorithm used in the model.
5.1 Comparisons between MODIS and CHIMERE
The measured AOD at 550 nm is extracted from the MODIS satellite data over the pe-riod from 6 June to 15 July 2013. These AOD are calculated at 550 nm. Observations15
are first averaged on the model grid, and comparisons are done for collocated data inspace and time, as displayed in Fig. 9. The MODIS map includes the AOD retrievedover ocean and over land. In addition and when the data are available, the AOD esti-mated using the deep-blue algorithm is used (Sayer et al., 2013).
The most important AOD values are recorded over the Atlantic Ocean, in a flow from20
Western Africa towards North America. Over continental areas (Sahara and Sahel) andover the Atlantic Ocean, the modelled AOD is slightly overestimated but the location ofthe main sources and plumes is very well reproduced.
Other significant values are recorded in the South of the Arabian Peninsula and theEastern Africa. Up to φ = 35◦ N, the AOD is very low and lower than 0.2. Over the25
Mediterranean sea, no plume is detected: this means than on average and over thiswhole period, there was no massive or persistent aerosol plumes.
23090
ACPD14, 23075–23123, 2014
Analysis of theatmospheric
composition duringthe summer 2013
L. Menut et al.
Title Page
Abstract Introduction
Conclusions References
Tables Figures
J I
J I
Back Close
Full Screen / Esc
Printer-friendly Version
Interactive Discussion
Discussion
Paper
|D
iscussionP
aper|
Discussion
Paper
|D
iscussionP
aper|
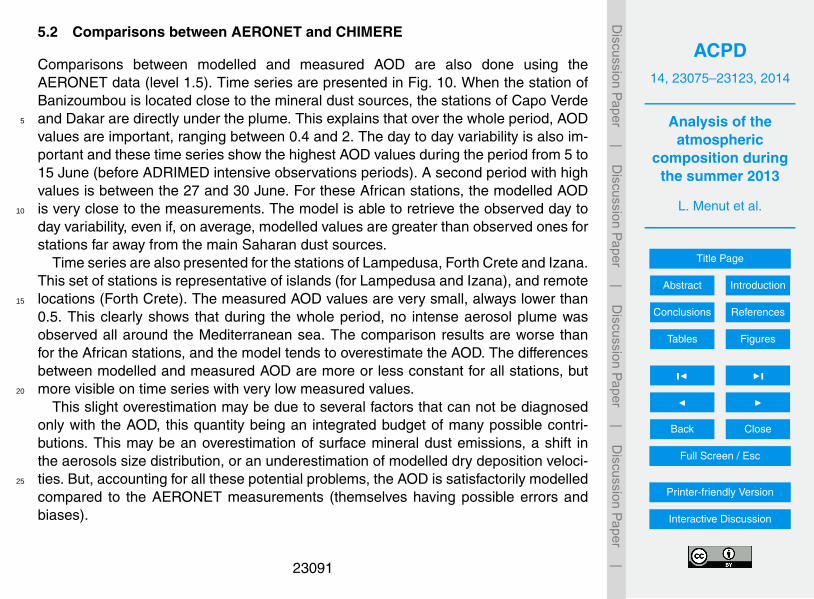
5.2 Comparisons between AERONET and CHIMERE
Comparisons between modelled and measured AOD are also done using theAERONET data (level 1.5). Time series are presented in Fig. 10. When the station ofBanizoumbou is located close to the mineral dust sources, the stations of Capo Verdeand Dakar are directly under the plume. This explains that over the whole period, AOD5
values are important, ranging between 0.4 and 2. The day to day variability is also im-portant and these time series show the highest AOD values during the period from 5 to15 June (before ADRIMED intensive observations periods). A second period with highvalues is between the 27 and 30 June. For these African stations, the modelled AODis very close to the measurements. The model is able to retrieve the observed day to10
day variability, even if, on average, modelled values are greater than observed ones forstations far away from the main Saharan dust sources.
Time series are also presented for the stations of Lampedusa, Forth Crete and Izana.This set of stations is representative of islands (for Lampedusa and Izana), and remotelocations (Forth Crete). The measured AOD values are very small, always lower than15
0.5. This clearly shows that during the whole period, no intense aerosol plume wasobserved all around the Mediterranean sea. The comparison results are worse thanfor the African stations, and the model tends to overestimate the AOD. The differencesbetween modelled and measured AOD are more or less constant for all stations, butmore visible on time series with very low measured values.20
This slight overestimation may be due to several factors that can not be diagnosedonly with the AOD, this quantity being an integrated budget of many possible contri-butions. This may be an overestimation of surface mineral dust emissions, a shift inthe aerosols size distribution, or an underestimation of modelled dry deposition veloci-ties. But, accounting for all these potential problems, the AOD is satisfactorily modelled25
compared to the AERONET measurements (themselves having possible errors andbiases).
23091

ACPD14, 23075–23123, 2014
Analysis of theatmospheric
composition duringthe summer 2013
L. Menut et al.
Title Page
Abstract Introduction
Conclusions References
Tables Figures
J I
J I
Back Close
Full Screen / Esc
Printer-friendly Version
Interactive Discussion
Discussion
Paper
|D
iscussionP
aper|
Discussion
Paper
|D
iscussionP
aper|
The Table 5 corresponds to statistical scores calculated over 10 AERONET stations.The number of observations is very variable from one station to another: if the Izanastations have 516 measurements values, the Forth Crete has only 108. These differ-ences are certainly due to the cloud screening algorithm applied on the raw sunpho-tometer data to ensure that provided AOD are only due to aerosols. The correlation is5
variable from one site to another with values ranging from 0.12 (Ilorin) to 0.76 (Izana)and 0.85 (Lampedusa). The RMSE is very large, of the order of magnitude of the AODvalue, showing the high variability of both model and measurements. Finally, modelperformances are good, showing that the new parameterizations of mineral dust im-plemented in CHIMERE are completely able to retrieve hourly and daily variability of10
aerosols due mainly to the dust load.
6 Analysis of PM10 concentrations
For the understanding of aerosols life cycle, the analysis of PM10 surface concentra-tions is complementary to the analysis of AOD. In this case, the information is onlyclose to the surface but the concentration is representative of the whole size distribu-15
tion spectrum up to a mean mass median diameter of 10 µm.
6.1 Surface concentrations time series
Table 6 lists the comparisons results. In order to compare the measurements and themodel data, values are daily averaged and in µg m−3. The number of values comparedis very variable and mostly between 700 and 1000, corresponding to hourly data over20
the whole period. Italian stations are different and measurements are only daily, lead-ing to a lower number of observations. Depending on the station the correlation rangesfrom very low (−0.03 for Cartagena and Agen, for example) to moderate (0.68 in Hy-eres, 0.65 in Vercelli). For a major part of the stations, the bias remains low and lessthan 5 µg m−3.25
23092

ACPD14, 23075–23123, 2014
Analysis of theatmospheric
composition duringthe summer 2013
L. Menut et al.
Title Page
Abstract Introduction
Conclusions References
Tables Figures
J I
J I
Back Close
Full Screen / Esc
Printer-friendly Version
Interactive Discussion
Discussion
Paper
|D
iscussionP
aper|
Discussion
Paper
|D
iscussionP
aper|
The corresponding time series of measured and modelled surface PM10 concentra-tions are presented in Fig. 11. On average, the background concentrations are wellmodelled for all sites. But some discrepancies appear when some peaks are mod-elled but not measured. For example, at the stations of Zorita, Malaga and Agen, largePM10 concentrations are modelled but the measurements do not show any peak. These5
peaks are sporadic and can thus be due to overestimated mineral dust or fires emis-sions. The lower bias on the AOD suggests that the whole column is correct, but thatthe surface concentrations are too large. This can be, partially, the problem of all deter-ministic Eulerian models, often too diffusive vertically. Another possibility is to have tooimportant local emissions. A way to better understand this overestimation is to analyze10
the aerosols composition, as presented in Sect. 6.2.
6.2 Modelled PM speciation
For each site, the modelled aerosols composition is presented as surface time seriesin Fig. 12. The concentrations are shown here for the whole aerosols size distribution,i.e. from 0.04 µm to 40 µm. This is thus logical to have surface concentrations higher15
than the ones presented for the PM10 time series. All presented species are describedas CHIMERE model species families (such as SOA) or primarily emitted species (suchas POM, EC and the rest of anthropogenic dust called PPM here). The complete ex-planations about these species are provided in Menut et al. (2013a). For all presentedtime series, the most important contribution comes from mineral dust, with, at least,20
50 % of the total mass. This mineral dust part is also responsible of the large peaksobserved on the PM10 concentrations. The second most important contribution corre-sponds to sea salts. This effect is particularly important for sites on islands or near thecoast as Lampedusa and Cape Corsica. For “continental background” stations such asChampforgeuil and Agen, the concentrations are lower than for the other stations and25
the relative part of sea salt becomes negligible. However, surface concentrations ofmineral dust remain important for these stations suggesting that modelled local emis-sions are too large. The last most important contribution is for sulphates with large
23093

ACPD14, 23075–23123, 2014
Analysis of theatmospheric
composition duringthe summer 2013
L. Menut et al.
Title Page
Abstract Introduction
Conclusions References
Tables Figures
J I
J I
Back Close
Full Screen / Esc
Printer-friendly Version
Interactive Discussion
Discussion
Paper
|D
iscussionP
aper|
Discussion
Paper
|D
iscussionP
aper|
concentrations modelled in Lampedusa and Malaga, among others. Finally, the rela-tive contributions of POM and EC are very low in the total, showing that this period wasnot influenced by large vegetation fires events.
In order to link the information of surface concentrations, aerosols composition andvertical structure, Fig. 13 presents vertical profiles for the same stations as in Fig. 125
and for the 21 June 2013 at 12:00 UTC. Over Lampedusa, the main part of the aerosolsprofile is due to the long range transport of mineral dust from Africa. This is also thecase for the Cape Corsica site, in altitude, with the same important plume at 3000 to4000 m a.g.l. (above ground level). In addition, a contribution of ≈ 50 % of sulphatesis observed close to the surface, certainly due to shipping emissions since CHIMERE10
does not take marine biogenic sulphur emissions.In Zorita, the contributions are mainly due to mineral dust, sulphates and sea salts.
There is no plume in altitude and the concentrations are low with a maximum of12 µg m−3. This is the same behaviour in Malaga and Agen. Finally, the vertical pro-file in Champforgeuil shows an important peak around 2000 m a.g.l.: this is partly due15
to the mineral dust observed in Lampedusa and Cape Corsica, with, in addition, nonnegligible concentrations of nitrates. For all these profiles, the vertical concentrationsseem realistic and the relative contributions of mineral dust correspond to the main partof the aerosol composition.
Measurements of Calcium and Sulphate performed at Cape Corsica provide some20
clues on the capability of CHIMERE to reproduce the concentrations of two major com-pound of PM (Fig. 14). Considering that most of the dust in this region comes from theSahara, a factor of 15 is used to convert Calcium in Dust (Putaud et al., 2004). Thisfactor is uncertain but is used only to study the temporal variability of dust concentra-tions. For mineral dust and for this specific site, the model has difficulties to retrieve25
the timing of peaks. Regarding sulphates, we clearly see an overestimate of the mod-elled concentrations. A closer look at the model results indicate a sulphate pattern dueto SO2 shipping emissions. However the timing of some peaks is well reproduced bythe model. This comparison shows the difficulty of the dust module to give the right
23094
ACPD14, 23075–23123, 2014
Analysis of theatmospheric
composition duringthe summer 2013
L. Menut et al.
Title Page
Abstract Introduction
Conclusions References
Tables Figures
J I
J I
Back Close
Full Screen / Esc
Printer-friendly Version
Interactive Discussion
Discussion
Paper
|D
iscussionP
aper|
Discussion
Paper
|D
iscussionP
aper|
dust concentrations at the surface. Even for better documented sources like shippingemissions, discrepancies related to the emission regridding of such lineic sources arecertainly responsible for the overestimation of the model simulations in this area.
7 Conclusions
In the framework of the CHARMEX project, a simulation of the atmospheric compo-5
sition was carried out at the regional scale with the WRF and CHIMERE models, formeteorology and chemistry-transport respectively.
The simulation period ranges from 1 June to 15 July of 2013 and covers the wholeperiod of the ADRIMED project intensive observation periods. The simulation domaincovers all of Europe and the Northern half of Africa which allows to take into account10
major sources of pollution: anthropogenic, biogenic as well as vegetation fires andmineral dust.
The key pollutants of air quality studies are compared between measurements andmodel. At the surface, ozone and PM10 were compared to surface measurements ofthe AirBase network and to ADRIMED specific measurements done at Lampedusa15
and Cape Corsica. Using all aerosols concentrations, the Aerosols Optical depth isdiagnosed and compared to the AERONET stations measurements. In addition, com-parisons are done between the ATR flights for ozone concentrations and some meteo-rological variables.
The error statistics showed that the model is able to reproduce surface ozone con-20
centrations, both the average values and the variability, even if we note an overestimateof ozone concentrations. The comparison between modelled and measured ozone con-centrations along the flight trajectories is very satisfactory and confirm the high ozoneconcentration close to the sea surface that commonly simulated in chemistry transportmodels, and the altitude ozone concentrations are also well captured.25
Regarding the PM10 ground concentrations the model is able to reproduce correctaverage values with rather low correlations. These low correlations are attributed to
23095

ACPD14, 23075–23123, 2014
Analysis of theatmospheric
composition duringthe summer 2013
L. Menut et al.
Title Page
Abstract Introduction
Conclusions References
Tables Figures
J I
J I
Back Close
Full Screen / Esc
Printer-friendly Version
Interactive Discussion
Discussion
Paper
|D
iscussionP
aper|
Discussion
Paper
|D
iscussionP
aper|
the flat time series or the difficulties to capture the dust peaks at the right time. Whenlooking at the AOD, the model performances are better meaning that the dust moduleis able to emit the right load of particles at the right time in arid zones. In Europe, thedust emissions are certainly overestimated. A comparison with sulphate concentra-tions in Cape Corsica exhibits some discrepancies related to the emission regridding5
of shipping emissions.
Acknowledgements. This study was partly funded by the French Ministry in charge of Ecology.We thank the SAFIRE joint laboratory and the CHARMEX program for providing us all campaignmeasurements used in this study. We thank the EEA for maintaining and providing the AirBasedatabase of pollutants surface concentrations over Europe. We thank the principal investigators10
and their staff for establishing and maintaining the AERONET sites used in this study: DidierTanré for Banizoumbou, Capo Verde and Dakar; Bernadette Chatenet and Jean-Louis Rajot forZinder and Cinzana; Daniela Meloni and Alcide Di Sarra for Lampedusa.
References
Barnaba, F. and Gobbi, G. P.: Aerosol seasonal variability over the Mediterranean region and15
relative impact of maritime, continental and Saharan dust particles over the basin fromMODIS data in the year 2001, Atmos. Chem. Phys., 4, 2367–2391, doi:10.5194/acp-4-2367-2004, 2004. 23079, 23083
Basart, S., Pérez, C., Cuevas, E., Baldasano, J. M., and Gobbi, G. P.: Aerosol characterizationin Northern Africa, Northeastern Atlantic, Mediterranean Basin and Middle East from direct-20
sun AERONET observations, Atmos. Chem. Phys., 9, 8265–8282, doi:10.5194/acp-9-8265-2009, 2009. 23079
Bergamo, A., Tafuro, A. M., Kinne, S., De Tomasi, F., and Perrone, M. R.: Monthly-averagedanthropogenic aerosol direct radiative forcing over the Mediterranean based on AERONETaerosol properties, Atmos. Chem. Phys., 8, 6995–7014, doi:10.5194/acp-8-6995-2008,25
2008. 23079Bessagnet, B., Hodzic, A., Vautard, R., Beekmann, M., Cheinet, S., Honoré, C., Liousse, C.,
and Rouil, L.: Aerosol modeling with CHIMERE: preliminary evaluation at the continentalscale, Atmos. Environ., 38, 2803–2817, 2004. 23086
23096
ACPD14, 23075–23123, 2014
Analysis of theatmospheric
composition duringthe summer 2013
L. Menut et al.
Title Page
Abstract Introduction
Conclusions References
Tables Figures
J I
J I
Back Close
Full Screen / Esc
Printer-friendly Version
Interactive Discussion
Discussion
Paper
|D
iscussionP
aper|
Discussion
Paper
|D
iscussionP
aper|
Bian, H. and Prather, M.: Fast-J2: accurate simulation of stratospheric photolysis in globalchemical models, J. Atmos. Chem., 41, 281–296, 2002. 23086
Briant, R., Menut, L., Siour, G., and Prigent, C.: Homogeneized modeling of mineral dust emis-sions over Europe and Africa using the CHIMERE model, Geosci. Model Dev. Discuss., 7,3441–3480, doi:10.5194/gmdd-7-3441-2014, 2014. 230865
Chen, F. and Dudhia, J.: Coupling an advanced land surface-hydrology model with the PennState-NCAR MM5 modeling system. Part I: Model implementation and sensitivity, Mon.Weather Rev., 129, 569–585, 2001. 23085
de la Paz, D., Vedrenne, M., Borge, R., Lumbreras, J., de Andrés, J. M., Pérez, J., Ro-driguez, E., Karanasiou, A., Moreno, T., Boldo, E., and Linares, C.: Modelling Saharan10
dust transport into the Mediterranean basin with CMAQ, Atmos. Environ., 70, 337–350,doi:10.1016/j.atmosenv.2013.01.013, 2013. 23079
Dulac, F. and Chazette, P.: Airborne study of a multi-layer aerosol structure in the easternMediterranean observed with the airborne polarized lidar ALEX during a STAAARTE cam-paign (7 June 1997), Atmos. Chem. Phys., 3, 1817–1831, doi:10.5194/acp-3-1817-2003,15
2003. 23079Dulac, F., Arboledas, L. A., Alastuey, A., Ancellet, G., Arndt, J., Attié, J.-L., Augustin, P.,
Becagli, S., Bergametti, G., Bocquet, M., Bordier, F., Bourdon, A., Bourrianne, T., Bravo-Aranda, J., Carrer, D., Ceamanos, X., Chazette, P., Chiapello, I., Comeron, A., D’Amico, G.,D’Anna, B., Delbarre, H., Denjean, C., Desboeufs, K., Descloitres, J., Diouri, M., Bia-20
gio, C. D., Iorio, T. D., Sarra, G. D., Doppler, L., Durand, P., Amraoui, L. E., Ellul, R.,Ferré, H., Fleury, L., Formenti, P., Freney, E., Gaimoz, C., Gerasopoulos, E., Goloub, P.,Gomez-Amo, J., Granados-Munoz, M., Grand, N., Grobner, J., Rascado, J.-L. G., Guieu, C.,Hadjimitsis, D., Hamonou, E., Hansson, H., Iarlori, M., Ioannou, S., Jambert, C., Jau-mouillé, E., Jeannot, M., Junkermann, W., Keleshis, C., Kokkalis, P., Lambert, D., Lau-25
rent, B., Léon, J.-F., Liousse, C., Bartolome, M. L., Losno, R., Mallet, M., Mamouri, R.-E.,Meloni, D., Menut, L., Montoux, N., Baquero, R. M., Nabat, P., Navas-Guzman, F., Nico-lae, D., Nicolas, J., Notton, G., Ohayon, W., Paoli, C., Papayannis, A., Pelon, J., Pey, J.,Pont, V., Pujadas, M., Querol, X., Ravetta, F., Renard, J.-B., Rizi, V., Roberts, G., Rou-jean, J.-L., Sartelet, K., Savelli, J.-L., Sciare, J., Sellegri, K., Sferlazzo, D., Sicard, M.,30
Smyth, A., Solmon, F., Tanré, D., Torres, B., Totems, J., Sanchez, A. T., Verdier, N., Vi-gnelles, D., Vincent, J., Wagner, F., Wang, Y., Wenger, J., and Yassaa, N.: Overview ofthe Project ChArMEx activities on Saharan Dust in the Mediterranean region, in: 7th Int.
23097

ACPD14, 23075–23123, 2014
Analysis of theatmospheric
composition duringthe summer 2013
L. Menut et al.
Title Page
Abstract Introduction
Conclusions References
Tables Figures
J I
J I
Back Close
Full Screen / Esc
Printer-friendly Version
Interactive Discussion
Discussion
Paper
|D
iscussionP
aper|
Discussion
Paper
|D
iscussionP
aper|
Workshop on Sand/Duststorms and Associated Dustfall, 2–4 December 2013, Frascati, Italy,http://dustworkshop2013.enea.it/presentations/index.php (last access: 2 September 2014),2013. 23080
EEA: Air quality in Europe, 2013 EEA report, 9, Copenhagen, Denmark, 2013. 23077Grell, G. A. and Devenyi, D.: A generalized approach to parameterizing convection com-5
bining ensemble and data assimilation techniques, Geophys. Res. Lett., 29, 1693,doi:10.1029/2002GL015311, 2002. 23085
Guenther, A., Karl, T., Harley, P., Wiedinmyer, C., Palmer, P. I., and Geron, C.: Estimatesof global terrestrial isoprene emissions using MEGAN (Model of Emissions of Gases andAerosols from Nature), Atmos. Chem. Phys., 6, 3181–3210, doi:10.5194/acp-6-3181-2006,10
2006. 23086Hong, S. Y., Dudhia, J., and Chen, S.: A revised approach to ice microphysical processes for
the bulk parameterization of clouds and precipitation, Mon. Weather Rev., 132, 103–120,2004. 23085
Hong, S. Y., Noh, Y., and Dudhia, J.: A new vertical diffusion package with an explicit treatment15
of entrainment processes, Mon. Weather Rev., 134, 2318–2341, doi:10.1175/MWR3199.1,2006. 23085
Honoré, C., Rouïl, L., Vautard, R., Beekmann, M., Bessagnet, B., Dufour, A., Elichegaray, C.,Flaud, J., Malherbe, L., Meleux, F., Menut, L., Martin, D., Peuch, A., Peuch, V., and Pois-son, N.: Predictability of European air quality: the assessment of three years of opera-20
tional forecasts and analyses by the PREV’AIR system, J. Geophys. Res., 113, D04301,doi:10.1029/2007JD008761, 2008. 23088
Hsu, N., Tsay, S., King, M., and Herman, J.: Aerosol properties over bright-reflecting sourceregions, IEEE T. Geosci. Remote, 42, 557–569, 2004. 23084
Israelevich, P., Ganor, E., Alpert, P., Kishcha, P., and Stupp, A.: Predominant transport paths25
of Saharan dust over the Mediterranean Sea to Europe, J. Geophys. Res., 117, D02205,doi:10.1029/2011JD016482, 2012. 23078
Jiménez-Guerrero, P., Jorba, O., Pay, M. T., Montávez, J. P., Jerez, S., Gómez-Navarro, J. J.,and Baldasano, J. M.: Comparison of two different sea-salt aerosol schemes as implementedin air quality models applied to the Mediterranean Basin, Atmos. Chem. Phys., 11, 4833–30
4850, doi:10.5194/acp-11-4833-2011, 2011. 23079
23098
ACPD14, 23075–23123, 2014
Analysis of theatmospheric
composition duringthe summer 2013
L. Menut et al.
Title Page
Abstract Introduction
Conclusions References
Tables Figures
J I
J I
Back Close
Full Screen / Esc
Printer-friendly Version
Interactive Discussion
Discussion
Paper
|D
iscussionP
aper|
Discussion
Paper
|D
iscussionP
aper|
Kallos, G., Kotroni, V., Lagouvardos, K., and Papadopoulos, A.: On the long-rangetransport of air pollutants from Europe to Africa, Geophys. Res. Lett., 25, 619–622doi:10.1029/97GL03319, 1998. 23078
Kallos, G., Papadopoulos, A., Katsafados, P., and Nickovic, S.: Transatlantic Saha-ran dust transport: model simulation and results, J. Geophys. Res., 111, D09204,5
doi:10.1029/2005JD006207, 2006. 23079Kaufman, Y., Tanré, D., Remer, L., Vermote, E., Chi, A., and Holben, B.: Operational remote
sensing of tropospheic aerosol over land from EOS moderate resolution imaging spectrora-diometer, J. Geophys. Res., 102, 17051–17067, 1997. 23084
Kloog, I., Coull, B., Zanobetti, A., Koutrakis, P., and Schwartz, J.: Acute and chronic10
effects of particles on hospital admissions in New-England, PLoS One, 7, e34664,doi:10.1371/journal.pone.0034664, 2012. 23077
Kubilay, N., Cokacar, T., and Oguz, T.: Optical properties of mineral dust outbreaks over thenortheastern Mediterranean, J. Geophys. Res., 108, D214666, doi:10.1029/2003JD003798,2003. 23078, 2307915
Kulmala, M., Asmi, A., Lappalainen, H. K., Baltensperger, U., Brenguier, J.-L., Facchini, M. C.,Hansson, H.-C., Hov, Ø., O’Dowd, C. D., Pöschl, U., Wiedensohler, A., Boers, R.,Boucher, O., de Leeuw, G., Denier van der Gon, H. A. C., Feichter, J., Krejci, R., Laj, P.,Lihavainen, H., Lohmann, U., McFiggans, G., Mentel, T., Pilinis, C., Riipinen, I., Schulz, M.,Stohl, A., Swietlicki, E., Vignati, E., Alves, C., Amann, M., Ammann, M., Arabas, S., Ar-20
taxo, P., Baars, H., Beddows, D. C. S., Bergström, R., Beukes, J. P., Bilde, M., Burkhart, J. F.,Canonaco, F., Clegg, S. L., Coe, H., Crumeyrolle, S., D’Anna, B., Decesari, S., Gilar-doni, S., Fischer, M., Fjaeraa, A. M., Fountoukis, C., George, C., Gomes, L., Hallo-ran, P., Hamburger, T., Harrison, R. M., Herrmann, H., Hoffmann, T., Hoose, C., Hu, M.,Hyvärinen, A., Hõrrak, U., Iinuma, Y., Iversen, T., Josipovic, M., Kanakidou, M., Kiendler-25
Scharr, A., Kirkevåg, A., Kiss, G., Klimont, Z., Kolmonen, P., Komppula, M., Kristjánsson, J.-E., Laakso, L., Laaksonen, A., Labonnote, L., Lanz, V. A., Lehtinen, K. E. J., Rizzo, L. V.,Makkonen, R., Manninen, H. E., McMeeking, G., Merikanto, J., Minikin, A., Mirme, S., Mor-gan, W. T., Nemitz, E., O’Donnell, D., Panwar, T. S., Pawlowska, H., Petzold, A., Pienaar, J. J.,Pio, C., Plass-Duelmer, C., Prévôt, A. S. H., Pryor, S., Reddington, C. L., Roberts, G.,30
Rosenfeld, D., Schwarz, J., Seland, Ø., Sellegri, K., Shen, X. J., Shiraiwa, M., Siebert, H.,Sierau, B., Simpson, D., Sun, J. Y., Topping, D., Tunved, P., Vaattovaara, P., Vakkari, V.,Veefkind, J. P., Visschedijk, A., Vuollekoski, H., Vuolo, R., Wehner, B., Wildt, J., Wood-
23099
ACPD14, 23075–23123, 2014
Analysis of theatmospheric
composition duringthe summer 2013
L. Menut et al.
Title Page
Abstract Introduction
Conclusions References
Tables Figures
J I
J I
Back Close
Full Screen / Esc
Printer-friendly Version
Interactive Discussion
Discussion
Paper
|D
iscussionP
aper|
Discussion
Paper
|D
iscussionP
aper|
ward, S., Worsnop, D. R., van Zadelhoff, G.-J., Zardini, A. A., Zhang, K., van Zyl, P. G., Kermi-nen, V.-M., S Carslaw, K., and Pandis, S. N.: General overview: European Integrated projecton Aerosol Cloud Climate and Air Quality interactions (EUCAARI) – integrating aerosol re-search from nano to global scales, Atmos. Chem. Phys., 11, 13061–13143, doi:10.5194/acp-11-13061-2011, 2011. 230795
Lelieveld, J., Berresheim, H., Borrmann, S., Crutzen, P. J., Dentener, F. J., Fischer, H.,Feichter, J., Flatau, P. J., Heland, J., Holzinger, R., Korrmann, R., Lawrence, M. G.,Levin, Z., Markowicz, K. M., Mihalopoulos, N., Minikin, A., Ramanathan, V., Reus, M. D.,Roelofs, G. J., Scheeren, H. A., Sciare, J., Schlager, H., Schultz, M., Siegmund, P., Steil, B.,Stephanou, E. G., Stier, P., Traub, M., Warneke, C., Williams, J., and Ziereis, H.: Global air10
pollution crossroads over the Mediterranean, Science, 298, 794–799, 2002. 23079Levy, R. C., Remer, L. A., Kleidman, R. G., Mattoo, S., Ichoku, C., Kahn, R., and Eck, T. F.:
Global evaluation of the Collection 5 MODIS dark-target aerosol products over land, Atmos.Chem. Phys., 10, 10399–10420, doi:10.5194/acp-10-10399-2010, 2010. 23084
Mallet, M.: Overview of the ChArMEx-Aerosol Direct Radiative Forcing on the Mediterranean15
Climate (ADRIMED) project, in: AMA conference, 20–22 January 2014, Toulouse, 2014.23080, 23082
Mallet, M., Pont, V., Liousse, C., Roger, J., and Dubuisson, P.: Simulation of aerosol radiativeproperties with the ORISAM-RAD model during a pollution event (ESCOMPTE 2001), Atmos.Environ., 40, 7696–7705, doi:10.1016/j.atmosenv.2006.08.031, 2006. 2307920
Mallet, M., Dubovik, O., Nabat, P., Dulac, F., Kahn, R., Sciare, J., Paronis, D., and Léon, J. F.:Absorption properties of Mediterranean aerosols obtained from multi-year ground-based re-mote sensing observations, Atmos. Chem. Phys., 13, 9195–9210, doi:10.5194/acp-13-9195-2013, 2013. 23079
Martinelli, N., Olivieri, O., and Girelli, D.: Air particulate matter and cardiovascular disease: a25
narrative review, Eur. J. Intern. Med., 24, 295–302, doi:10.1016/j.ejim.2013.04.001, 2013.23077
Menut, L. and Bessagnet, B.: Atmospheric composition forecasting in Europe, Ann. Geophys.,28, 61–74, doi:10.5194/angeo-28-61-2010, 2010. 23079
Menut, L., Goussebaile, A., Bessagnet, B., Khvorostiyanov, D., and Ung, A.: Impact of realistic30
hourly emissions profiles on modelled air pollutants concentrations, Atmos. Environ., 49,233–244, 2012. 23086
23100

ACPD14, 23075–23123, 2014
Analysis of theatmospheric
composition duringthe summer 2013
L. Menut et al.
Title Page
Abstract Introduction
Conclusions References
Tables Figures
J I
J I
Back Close
Full Screen / Esc
Printer-friendly Version
Interactive Discussion
Discussion
Paper
|D
iscussionP
aper|
Discussion
Paper
|D
iscussionP
aper|
Menut, L., Bessagnet, B., Khvorostyanov, D., Beekmann, M., Blond, N., Colette, A., Coll, I.,Curci, G., Foret, G., Hodzic, A., Mailler, S., Meleux, F., Monge, J.-L., Pison, I., Siour, G., Tur-quety, S., Valari, M., Vautard, R., and Vivanco, M. G.: CHIMERE 2013: a model for regionalatmospheric composition modelling, Geosci. Model Dev., 6, 981–1028, doi:10.5194/gmd-6-981-2013, 2013a. 23080, 23085, 230935
Menut, L., Perez Garcia-Pando, C., Haustein, K., Bessagnet, B., Prigent, C., and Alfaro, S.:Relative impact of roughness and soil texture on mineral dust emission fluxes modeling, J.Geophys. Res., 118, 6505–6520, doi:10.1002/jgrd.50313, 2013b. 23079, 23086
Millan, M., Salvador, R., Mantilla, E., and Kallos, G.: Photo-oxidant dynamics in the WesternMediterranean in Summer: results from European research projects, J. Geophys. Res., 102,10
D7, 8811–8823, 1997. 23078Millan, M., Estrela, M. J., Sanz, M. J., Mantilla, E., Martan, M., Pastor, F., Salvador, R.,
Vallejo, R., Alonso, L., Gangoiti, G., Ilardia, J., Navazo, M., Albizuri, A., Artano, B., Cic-cioli, P., Kallos, G., Carvalho, R. A., Andreas, D., Hoff, A., Werhahn, J., and Seufert, G.,and Versino, B.: Climatic feedbacks and desertification: the Mediterranean model, J. Climate,15
18, 684–701, 2005. 23078Mlawer, E., Taubman, S., Brown, P., Iacono, M., and Clough, S.: Radiative transfer for inhomo-
geneous atmospheres: RRTM a validated correlated-k model for the longwave, J. Geophys.Res., 102, 16663–16682, 1997. 23085
Monks, P., Granier, C., Fuzzi, S., Stohl, A., Williams, M., Akimoto, H., Amann, M., Bak-20
lanov, A., Baltensperger, U., Bey, I., Blake, N., Blake, R., Carslaw, K., Cooper, O., Den-tener, F., Fowler, D., Fragkou, E., Frost, G., Generoso, S., Ginoux, P., Grewe, V., Guen-ther, A., Hansson, H., Henne, S., Hjorth, J., Hofzumahaus, A., Huntrieser, H., Isaksen, I.,Jenkin, M., Kaiser, J., Kanakidou, M., Klimont, Z., Kulmala, M., Laj, P., Lawrence, M.,Lee, J., Liousse, C., Maione, M., McFiggans, G., Metzger, A., Mieville, A., Moussiopou-25
los, N., Orlando, J., O’Dowd, C., Palmer, P., Parrish, D., Petzold, A., Platt, U., Pöschl, U.,Prévôt, A., Reeves, C., Reimann, S., Rudich, Y., Sellegri, K., Steinbrecher, R., Simpson, D.,ten Brink, H., Theloke, J., van der Werf, G., Vautard, R., Vestreng, V., Vlachokostas, C., andvon Glasow, R.: Atmospheric composition change – global and regional air quality, Atmos.Environ., 43, 5268–5350, doi:10.1016/j.atmosenv.2009.08.021, 2009. 2307830
Nabat, P., Solmon, F., Mallet, M., Kok, J. F., and Somot, S.: Dust emission size distributionimpact on aerosol budget and radiative forcing over the Mediterranean region: a regional cli-
23101
ACPD14, 23075–23123, 2014
Analysis of theatmospheric
composition duringthe summer 2013
L. Menut et al.
Title Page
Abstract Introduction
Conclusions References
Tables Figures
J I
J I
Back Close
Full Screen / Esc
Printer-friendly Version
Interactive Discussion
Discussion
Paper
|D
iscussionP
aper|
Discussion
Paper
|D
iscussionP
aper|
mate model approach, Atmos. Chem. Phys., 12, 10545–10567, doi:10.5194/acp-12-10545-2012, 2012. 23079
Pérez, C., Haustein, K., Janjic, Z., Jorba, O., Huneeus, N., Baldasano, J. M., Black, T.,Basart, S., Nickovic, S., Miller, R. L., Perlwitz, J. P., Schulz, M., and Thomson, M.: Atmo-spheric dust modeling from meso to global scales with the online NMMB/BSC-Dust model5
– Part 1: Model description, annual simulations and evaluation, Atmos. Chem. Phys., 11,13001–13027, doi:10.5194/acp-11-13001-2011, 2011. 23079
Putaud, J.-P., Van Dingenen, R., Dell’Acqua, A., Raes, F., Matta, E., Decesari, S., Fac-chini, M. C., and Fuzzi, S.: Size-segregated aerosol mass closure and chemical compositionin Monte Cimone (I) during MINATROC, Atmos. Chem. Phys., 4, 889–902, doi:10.5194/acp-10
4-889-2004, 2004. 23094Querol, X., Pey, J., Pandolfi, M., Alastuey, A., Cusack, M., Pereza, N., Moreno, T., Viana, M.,
Mihalopoulos, N., Kallo, G., and Kleanthous, S.: African dust contributions to mean ambientPM10 mass-levels across the Mediterranean Basin, Atmos. Environ., 43, 4266–4277, 2009.2307915
Rodriguez, S., Querol, X., Alastuey, A., and de la Rosa, J.: Atmospheric particulate matter andair quality in the Mediterranean: a review, Environ. Chem. Lett., 5, 1–7, doi:10.1007/s10311-006-0071-0, 2007. 23078
Sayer, A. M., Hsu, N. C., Bettenhausen, C., and Jeong, M.-J.: Validation and uncertainty es-timates for MODIS Collection 6 “Deep Blue” aerosol data, J. Geophys. Res.Atmos., 118,20
7864–7872, doi:10.1002/jgrd.50600, 2013. 23090Scheeren, H. A., Lelieveld, J., Roelofs, G. J., Williams, J., Fischer, H., de Reus, M.,
de Gouw, J. A., Warneke, C., Holzinger, R., Schlager, H., Klüpfel, T., Bolder, M.,van der Veen, C., and Lawrence, M.: The impact of monsoon outflow from India and South-east Asia in the upper troposphere over the eastern Mediterranean, Atmos. Chem. Phys., 3,25
1589–1608, doi:10.5194/acp-3-1589-2003, 2003. 23078Skamarock, W., Klemp, J., Dudhia, J., Gill, D., Barker, D., Wang, W., and Powers, J.: A descrip-
tion of the advanced research WRF version 2, NCAR/TN-468+STR, NCAR Technical Note,Boulder, Colorado, USA, 2007. 23084
Tanré, D., Kaufman, Y., Herman, M., and Mattoo, S.: Remote sensing of aerosol properties over30
oceans using the MODIS/EOS sprectral radiances, J. Geophys. Res., 102, 16971–16988,doi:10.1029/96JD03437, 1997. 23084
23102
ACPD14, 23075–23123, 2014
Analysis of theatmospheric
composition duringthe summer 2013
L. Menut et al.
Title Page
Abstract Introduction
Conclusions References
Tables Figures
J I
J I
Back Close
Full Screen / Esc
Printer-friendly Version
Interactive Discussion
Discussion
Paper
|D
iscussionP
aper|
Discussion
Paper
|D
iscussionP
aper|
Turquety, S., Menut, L., Bessagnet, B., Anav, A., Viovy, N., Maignan, F., and Wooster, M.: API-FLAME v1.0: high-resolution fire emission model and application to the Euro-Mediterraneanregion, Geosci. Model Dev., 7, 587–612, doi:10.5194/gmd-7-587-2014, 2014. 23079, 23081,23084, 23086
Von Storch, H., Langenberg, H., and Feser, F.: A spectral nudging technique for dynamical5
downscaling purposes, Mon. Weather Rev., 128, 3664–3673, 2000. 23085Wild, O., Zhu, X., and Prather, M. J.: Fast-J: Accurate simulation of in- and below-cloud photol-
ysis in tropospheric chemical models, J. Atmos. Chem., 37, 245–282, 2000. 23086
23103
ACPD14, 23075–23123, 2014
Analysis of theatmospheric
composition duringthe summer 2013
L. Menut et al.
Title Page
Abstract Introduction
Conclusions References
Tables Figures
J I
J I
Back Close
Full Screen / Esc
Printer-friendly Version
Interactive Discussion
Discussion
Paper
|D
iscussionP
aper|
Discussion
Paper
|D
iscussionP
aper|
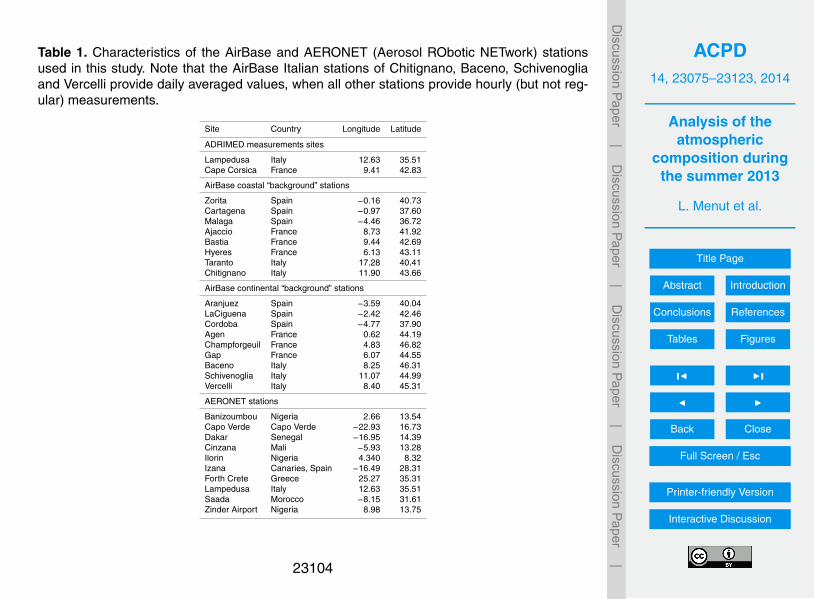
Table 1. Characteristics of the AirBase and AERONET (Aerosol RObotic NETwork) stationsused in this study. Note that the AirBase Italian stations of Chitignano, Baceno, Schivenogliaand Vercelli provide daily averaged values, when all other stations provide hourly (but not reg-ular) measurements.
Site Country Longitude Latitude
ADRIMED measurements sites
Lampedusa Italy 12.63 35.51Cape Corsica France 9.41 42.83
AirBase coastal “background” stations
Zorita Spain −0.16 40.73Cartagena Spain −0.97 37.60Malaga Spain −4.46 36.72Ajaccio France 8.73 41.92Bastia France 9.44 42.69Hyeres France 6.13 43.11Taranto Italy 17.28 40.41Chitignano Italy 11.90 43.66
AirBase continental “background” stations
Aranjuez Spain −3.59 40.04LaCiguena Spain −2.42 42.46Cordoba Spain −4.77 37.90Agen France 0.62 44.19Champforgeuil France 4.83 46.82Gap France 6.07 44.55Baceno Italy 8.25 46.31Schivenoglia Italy 11.07 44.99Vercelli Italy 8.40 45.31
AERONET stations
Banizoumbou Nigeria 2.66 13.54Capo Verde Capo Verde −22.93 16.73Dakar Senegal −16.95 14.39Cinzana Mali −5.93 13.28Ilorin Nigeria 4.340 8.32Izana Canaries, Spain −16.49 28.31Forth Crete Greece 25.27 35.31Lampedusa Italy 12.63 35.51Saada Morocco −8.15 31.61Zinder Airport Nigeria 8.98 13.75
23104

ACPD14, 23075–23123, 2014
Analysis of theatmospheric
composition duringthe summer 2013
L. Menut et al.
Title Page
Abstract Introduction
Conclusions References
Tables Figures
J I
J I
Back Close
Full Screen / Esc
Printer-friendly Version
Interactive Discussion
Discussion
Paper
|D
iscussionP
aper|
Discussion
Paper
|D
iscussionP
aper|
Table 2. List of ATR flights for the tropospheric measurements of meteorological variables,ozone (O3) and carbon monoxyde (CO) concentrations (ppb). Ndata corresponds to the numberof data after averaging the high temporal frequency of aircraft measurements to a constant5 mn time step.
Flight no. Date Jday Decimal hour Ndata
28 14 Jun 2013 165 9.05 4629 16 Jun 2013 167 7.55 3630 16 Jun 2013 167 11.49 4031 17 Jun 2013 168 6.76 3932 17 Jun 2013 168 11.18 3233 19 Jun 2013 170 11.04 4934 20 Jun 2013 171 9.83 5435 22 Jun 2013 173 7.57 4736 22 Jun 2013 173 12.75 40
23105
ACPD14, 23075–23123, 2014
Analysis of theatmospheric
composition duringthe summer 2013
L. Menut et al.
Title Page
Abstract Introduction
Conclusions References
Tables Figures
J I
J I
Back Close
Full Screen / Esc
Printer-friendly Version
Interactive Discussion
Discussion
Paper
|D
iscussionP
aper|
Discussion
Paper
|D
iscussionP
aper|
Table 3. Correlations (R), Root Mean Squared Error (RMSE) and bias of measured and mod-elled daily maximum value of surface O3 concentrations (µg m−3), for representative AirBasestations.
Site Nobs O3 R RMSEdaily max (µg m−3)
Obs Mod
AirBase coastal “background” stations
Zorita 37 110.65 105.17 0.66 14.87Cartagena 41 102.37 113.49 0.42 16.80Malaga 40 113.60 101.50 0.09 24.15Ajaccio 38 107.21 101.09 0.41 17.72Bastia 41 114.80 97.27 0.21 25.02Hyeres 41 118.59 95.70 0.55 29.33Taranto 41 116.83 123.81 0.71 12.91Chitignano 40 99.38 113.66 0.17 26.13
AirBase continental “background” stations
Aranjuez 38 113.26 113.78 0.33 21.35LaCiguena 41 102.34 97.46 0.55 21.63Cordoba 41 127.32 113.63 0.57 20.82Agen 41 95.32 95.83 0.71 19.26Champforgeuil 38 99.26 99.85 0.53 21.51Gap 39 98.36 103.95 0.32 16.79Baceno 39 117.03 104.62 0.29 21.47Vercelli 39 124.41 131.74 0.15 34.69
23106

ACPD14, 23075–23123, 2014
Analysis of theatmospheric
composition duringthe summer 2013
L. Menut et al.
Title Page
Abstract Introduction
Conclusions References
Tables Figures
J I
J I
Back Close
Full Screen / Esc
Printer-friendly Version
Interactive Discussion
Discussion
Paper
|D
iscussionP
aper|
Discussion
Paper
|D
iscussionP
aper|
Table 4. Correlations (R), Root Mean Squared Error (RMSE) and bias of measured and mod-elled of hourly surface O3 concentrations (µg m−3), for representative AirBase stations.
Site Nobs O3 R RMSEhourly (µg m−3)
Obs Mod
AirBase coastal “background” stations
Zorita 815 74.00 84.93 0.62 30.45Cartagena 956 73.40 93.72 0.49 31.08Malaga 907 87.18 87.79 0.28 25.26Ajaccio 892 72.96 79.92 0.45 25.15Bastia 978 90.82 76.05 0.30 27.80Hyeres 983 86.49 67.72 0.57 31.10Taranto 575 90.15 98.12 0.69 20.25Chitignano 892 72.39 88.83 0.51 28.14
AirBase continental “background” stations
Aranjuez 841 79.69 83.14 0.63 22.84LaCiguena 978 72.30 78.95 0.54 25.31Cordoba 945 90.95 89.43 0.74 19.41Agen 977 64.59 74.89 0.61 26.05Champforgeuil 836 61.86 76.23 0.57 33.59Gap 917 66.08 90.93 0.21 36.75Baceno 913 86.26 91.30 0.51 21.35Vercelli 898 85.06 93.69 0.66 27.87
23107
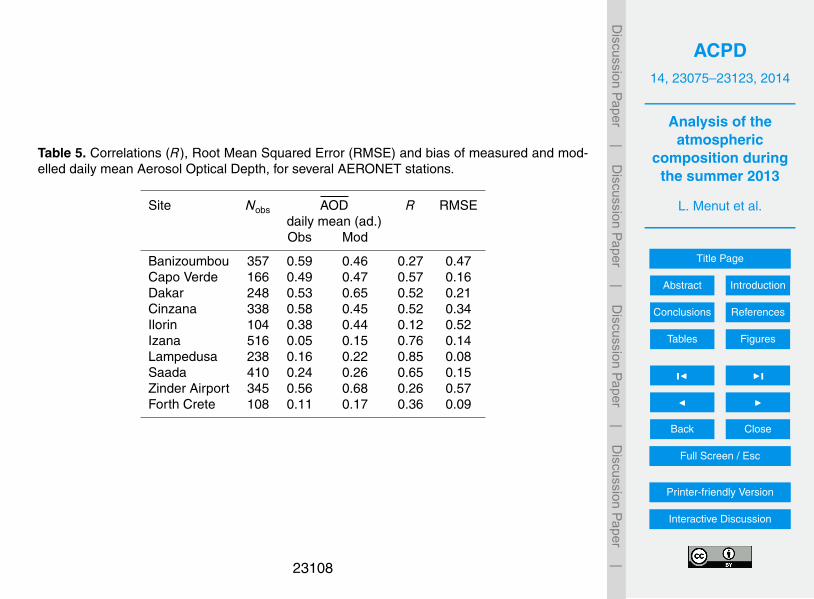
ACPD14, 23075–23123, 2014
Analysis of theatmospheric
composition duringthe summer 2013
L. Menut et al.
Title Page
Abstract Introduction
Conclusions References
Tables Figures
J I
J I
Back Close
Full Screen / Esc
Printer-friendly Version
Interactive Discussion
Discussion
Paper
|D
iscussionP
aper|
Discussion
Paper
|D
iscussionP
aper|
Table 5. Correlations (R), Root Mean Squared Error (RMSE) and bias of measured and mod-elled daily mean Aerosol Optical Depth, for several AERONET stations.
Site Nobs AOD R RMSEdaily mean (ad.)Obs Mod
Banizoumbou 357 0.59 0.46 0.27 0.47Capo Verde 166 0.49 0.47 0.57 0.16Dakar 248 0.53 0.65 0.52 0.21Cinzana 338 0.58 0.45 0.52 0.34Ilorin 104 0.38 0.44 0.12 0.52Izana 516 0.05 0.15 0.76 0.14Lampedusa 238 0.16 0.22 0.85 0.08Saada 410 0.24 0.26 0.65 0.15Zinder Airport 345 0.56 0.68 0.26 0.57Forth Crete 108 0.11 0.17 0.36 0.09
23108

ACPD14, 23075–23123, 2014
Analysis of theatmospheric
composition duringthe summer 2013
L. Menut et al.
Title Page
Abstract Introduction
Conclusions References
Tables Figures
J I
J I
Back Close
Full Screen / Esc
Printer-friendly Version
Interactive Discussion
Discussion
Paper
|D
iscussionP
aper|
Discussion
Paper
|D
iscussionP
aper|
Table 6. Correlation (R), bias and RMSE for the daily mean PM10 (µg m−3) surface concentra-tions (except for the Lampedusa measurements corresponding to Total Suspended Particles).
Site Nobs PM10 R RMSEdaily mean (µg m−3)
Obs Mod
ADRIMED measurements sites
Lampedusa 700 36.76 33.78 0.20 18.07Cape Corsica 527 11.62 27.67 0.09 19.11
AirBase coastal “background” stations
Zorita 816 16.25 16.13 0.58 8.99Cartagena 955 21.62 24.26 −0.02 12.73Malaga 905 32.53 31.17 −0.08 19.85Ajaccio 733 20.93 27.21 0.12 11.07Bastia 887 21.10 25.20 0.10 9.15Hyeres 955 29.26 26.36 0.69 6.27Taranto 935 19.79 21.45 0.48 7.05
AirBase continental “background” stations
Chitignano 72 10.35 19.80 0.57 9.66Aranjuez 843 23.24 15.18 0.42 12.78LaCiguena 976 23.19 14.81 0.46 10.05Cordoba 941 21.56 23.94 0.23 18.38Agen 983 14.47 16.61 −0.04 9.69Champforgeuil 972 15.89 17.51 0.16 9.78Gap 822 12.93 13.69 0.57 4.99Baceno 33 7.88 12.26 0.37 9.06Schivenoglia 73 26.93 20.88 0.20 13.77Vercelli 40 16.08 19.40 0.62 7.21
23109
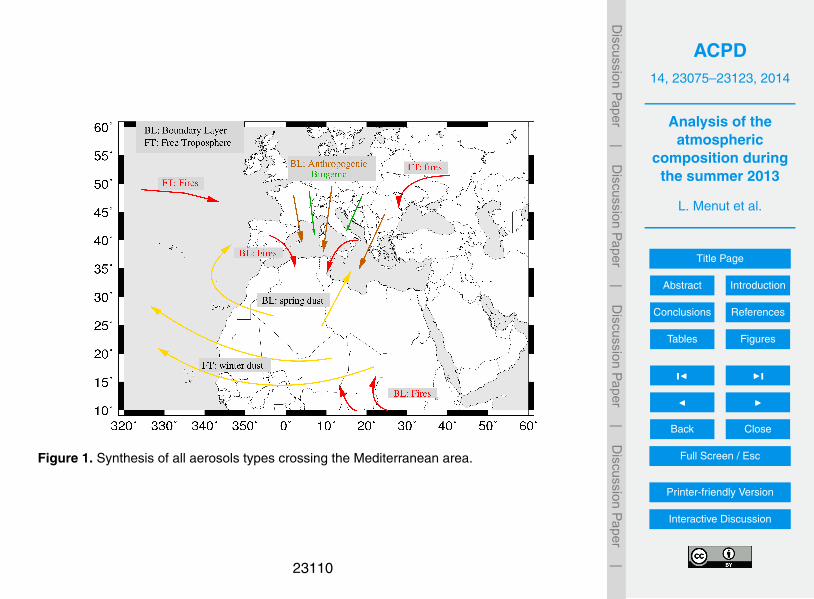
ACPD14, 23075–23123, 2014
Analysis of theatmospheric
composition duringthe summer 2013
L. Menut et al.
Title Page
Abstract Introduction
Conclusions References
Tables Figures
J I
J I
Back Close
Full Screen / Esc
Printer-friendly Version
Interactive Discussion
Discussion
Paper
|D
iscussionP
aper|
Discussion
Paper
|D
iscussionP
aper|
2 L.Menut et al.: Analysis of the atmospheric composition during the summer 2013
Fig. 1. Synthesis of all aerosols types crossing the Mediterraneanarea.
the boundary layer (typically the first two kilometres above45
ground). (Kallos et al., 1998) showed that this transport ofpollutants occurs during all seasons, but mainly during sum-mer (due to a lack in wet removal). This is also shown byIsraelevich et al. (2012). Pollutants are found in the entiretroposphere with time scales for transport of four to six days.50
They affect air quality in North Africa and the Middle Eastpart of the Mediterranean region. Due to a lack of wet re-moval during these periods, the only efficient mechanism be-comes the dry removal, much more slower than the wet one.
An important part of aerosol mass in the Mediterranean55
area comes from the African mineral dust. They may betransported through the Atlantic Ocean towards United Statesand Europe (Kallos et al., 2006). For the particular case ofEurope, the particles are mainly transported in the free tropo-sphere and mainly composed of mineral dust and, to a lesser60
extent, carbon due to fires. These particles may have twodifferent impacts: (i) a direct impact through their sedimen-tation into the surface layer: they thus contribute to the PMconcentration in the boundary layer, (ii) an indirect impactthrough their effects on meteorology (dynamics and micro-65
physics) and photochemistry.The need for a better understanding of the aerosols life cy-
cle led to several dedicated fields campaigns such as MINOSin Crete (Lelieveld et al., 2002), ESCOMPTE over Mar-seille in France, (Mallet et al., 2006), EUCARII campaign,70
(Kulmala et al., 2011) as well as a lot of studies using sur-face measurements of aerosols concentrations (Querol et al.,2009), airborne measurements, (Dulac and Chazette, 2003),optical thicknesses deduced from sunphotometers (Kubilayet al., 2003) or satellite data, (Barnaba and Gobbi, 2004).75
More recently, remote-sensing surface measurements werededicated to the quantification of dust optical properties anddirect radiative forcing as in (Bergamo et al., 2008; Basartet al., 2009; Mallet et al., 2013).
These measurements have been accompanied by signifi-80
cant regional model developments. Depending on the studiedaerosol type, modelling studies have helped to better quantifythe sources, transport and radiative impact of mineral dust,(Perez et al., 2011; Nabat et al., 2012; Menut et al., 2013b;de la Paz et al., 2013), sea salt, (Jimenez-Guerrero et al.,85
2011) and vegetation fires, (Turquety et al., 2014), amongothers.
The major part of these studies was devoted to the anal-ysis of past events. Another possible use of these mod-elling systems is for short-term forecast. Over Europe, nu-90
merous regional systems were designed these last years,(Menut and Bessagnet, 2010). In general, they calculateseparately aerosol types, such as anthropogenic and mineraldust. However, an accurate forecast needs to take into ac-count all aerosol types in the same model to be fully rep-95
resentative of the regional atmospheric composition. In thepresent study we use such a complete system with the WRFand CHIMERE models. Integrating recent developments de-scribed in Menut et al. (2013a), the CHIMERE chemistry-transport model takes into account anthropogenic, biogenic,100
sea-salt, mineral dust and vegetation fires emissions. Allthese species constitute a complex mixture remotely trans-ported and deposited.
During the summer 2013, the ADRIMED field campaignwas organised to better understand the aerosol properties105
over the Mediterranean basin (Mallet (2014)). ADRIMED,that deals with the aerosols, radiations and climate interac-tion, is a part of the international CHARMEX (CHemistry-AeRosol Mediterranean EXperiment) program (Dulac et al.(2013)). In order to launch intensive observations periods110
(especially aircraft operations) with the best probability of in-teresting events, many models were used to forecast the me-teorology and chemical concentrations, including the WRF-CHIMERE system.
The purpose of this paper is to fully evaluate the simu-115
lations undertaken during the campaign using a wide set ofsurface, in situ and remote sensing observations. Section 2presents the experimental framework of the ADRIMED cam-paign and the whole set of data (surface, soundings, air-craft measurements, satellite) used in this study. Section 3120
presents the modelling system and the settings. Sections 4, 5and 6 present gaseous, aerosols optical depth and aerosolsconcentrations results for the studied period, respectively.Conclusions and perspectives are presented in Section 7.
2 The Mediterranean area and the ADRIMED project125
This study is undertaken in the framework of the ”AerosolDirect Radiative Impact on the regional climate in theMEDiterranean region” (ADRIMED) project. ADRIMEDis part of the international ChArMEx program (Dulac et al.,2013). CHARMEX aims at assessing the present and future130
state of atmospheric chemistry in the Mediterranean area,
Figure 1. Synthesis of all aerosols types crossing the Mediterranean area.
23110
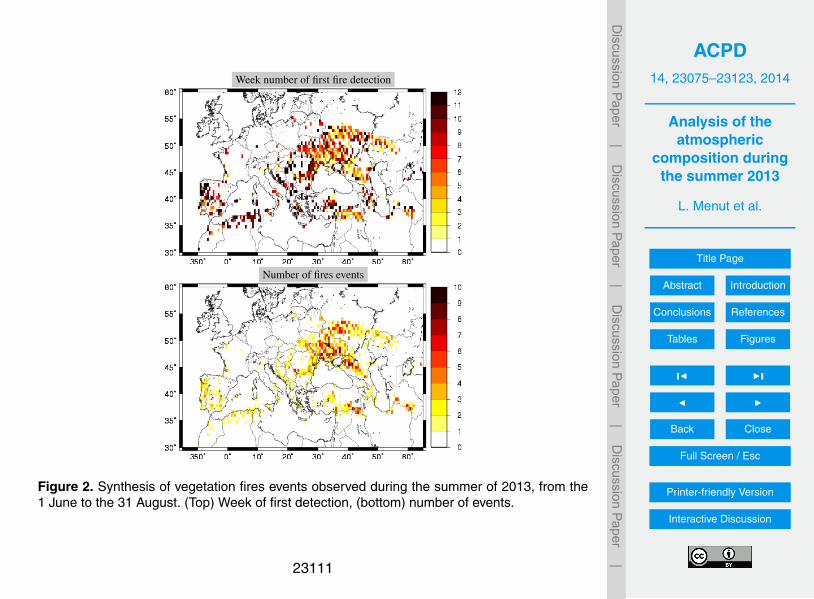
ACPD14, 23075–23123, 2014
Analysis of theatmospheric
composition duringthe summer 2013
L. Menut et al.
Title Page
Abstract Introduction
Conclusions References
Tables Figures
J I
J I
Back Close
Full Screen / Esc
Printer-friendly Version
Interactive Discussion
Discussion
Paper
|D
iscussionP
aper|
Discussion
Paper
|D
iscussionP
aper|
L.Menut et al.: Analysis of the atmospheric composition during the summer 2013 3
and its impact on the regional climate, air quality, and ma-rine ecosystems.
The main goal of ADRIMED is to assess the impacts ofthe direct and semi-direct radiative effect of aerosols on the135
regional climate of the Mediterranean. The project strategyis based on an integrated approach combining an intensiveexperimental field campaign and regional modelling of me-teorology and chemistry-transport.
The experimental part of the project was done during the140
summer 2013 (June and July). All measurements showedthat summer was not a highly polluted period. The observedgaseous and particles concentrations were moderate and of-ten a complex mixture of many different sources: anthro-pogenic activities, biogenic emissions from vegetations, min-145
eral dust transport and vegetation fires.
Week number of first fire detection
Number of fires events
Fig. 2. Synthesis of vegetation fires events observed during the sum-mer of 2013, from the 1st June to the 31 August. [top] week of firstdetection, [bottom] number of events.
Figure 2 presents the location of vegetation fires detectedduring the whole summer 2013. The calculation was per-formed using the high-resolution vegetation model used inthis study and presented in Turquety et al. (2014). The week150
number of first fire detection ranges from 1 (the first weekof June 2013) to 12 (the last week of September 2013). Itshows a majority of first fire event during the weeks 8 to 12,
i.e. during September. These fires are mainly located in Por-tugal and Russia, and in a lesser extent, in Greece. For each155
model grid cell, the number of fire events is presented i.e. thenumber of different fires for each area (the data are projectedon the model mesh presented hereafter). For a large majorityof diagnosed fires, this number is one, showing there werenot a lot of fires during this summer.160
2.1 The routine surface measurements
Fig. 3. Locations of the AirBase stations providing O3 and PM10
measurements used in this study.
Over the Mediterranean area, the routine measurementsare mainly performed for chemical concentrations and notmeteorological variables. In fact, there is no organised net-work able to distribute mesonet stations data with variables165
such as 2 m temperature, relative humidity and 10 m windspeed. These variables are measured country by country andnot always reachable. In this study, the comparisons betweenmeasured and modelled meteorological variables will be lim-ited to the measurements performed directly during and for170
the ADRIMED experiment.For regulatory pollutants (such as PM10, PM2.5, O3),
many measurements are routinely performed and well organ-ised in homogeneous databases. For instance the EEA (Euro-pean Environmental Agency) is responsible for the AirBase175
database, it contains air quality monitoring data and informa-tion submitted by the participating countries throughout Eu-rope (http://www.eea.europa.eu/). Concentrations are hourlyrecorded and this study will focus on ozone and PM10 surfaceconcentrations. Due to the coarse model resolution (50 × 50180
km), the comparison of NO2 is irrelevant, and has thereforenot been performed. In order to calculate scores and studytime series, we retained specific sites with a first set of 8”coastal background” stations and a second set of 9 ”con-tinental background” stations. Their location is displayed in185
Figure 3 and details about their localization is explained inTable 1. They were chosen to be representative of variouslocations around the Mediterranean Sea: Spain, France and
Figure 2. Synthesis of vegetation fires events observed during the summer of 2013, from the1 June to the 31 August. (Top) Week of first detection, (bottom) number of events.
23111

ACPD14, 23075–23123, 2014
Analysis of theatmospheric
composition duringthe summer 2013
L. Menut et al.
Title Page
Abstract Introduction
Conclusions References
Tables Figures
J I
J I
Back Close
Full Screen / Esc
Printer-friendly Version
Interactive Discussion
Discussion
Paper
|D
iscussionP
aper|
Discussion
Paper
|D
iscussionP
aper|
L.Menut et al.: Analysis of the atmospheric composition during the summer 2013 3
and its impact on the regional climate, air quality, and ma-rine ecosystems.
The main goal of ADRIMED is to assess the impacts ofthe direct and semi-direct radiative effect of aerosols on the135
regional climate of the Mediterranean. The project strategyis based on an integrated approach combining an intensiveexperimental field campaign and regional modelling of me-teorology and chemistry-transport.
The experimental part of the project was done during the140
summer 2013 (June and July). All measurements showedthat summer was not a highly polluted period. The observedgaseous and particles concentrations were moderate and of-ten a complex mixture of many different sources: anthro-pogenic activities, biogenic emissions from vegetations, min-145
eral dust transport and vegetation fires.
Week number of first fire detection
Number of fires events
Fig. 2. Synthesis of vegetation fires events observed during the sum-mer of 2013, from the 1st June to the 31 August. [top] week of firstdetection, [bottom] number of events.
Figure 2 presents the location of vegetation fires detectedduring the whole summer 2013. The calculation was per-formed using the high-resolution vegetation model used inthis study and presented in Turquety et al. (2014). The week150
number of first fire detection ranges from 1 (the first weekof June 2013) to 12 (the last week of September 2013). Itshows a majority of first fire event during the weeks 8 to 12,
i.e. during September. These fires are mainly located in Por-tugal and Russia, and in a lesser extent, in Greece. For each155
model grid cell, the number of fire events is presented i.e. thenumber of different fires for each area (the data are projectedon the model mesh presented hereafter). For a large majorityof diagnosed fires, this number is one, showing there werenot a lot of fires during this summer.160
2.1 The routine surface measurements
Fig. 3. Locations of the AirBase stations providing O3 and PM10
measurements used in this study.
Over the Mediterranean area, the routine measurementsare mainly performed for chemical concentrations and notmeteorological variables. In fact, there is no organised net-work able to distribute mesonet stations data with variables165
such as 2 m temperature, relative humidity and 10 m windspeed. These variables are measured country by country andnot always reachable. In this study, the comparisons betweenmeasured and modelled meteorological variables will be lim-ited to the measurements performed directly during and for170
the ADRIMED experiment.For regulatory pollutants (such as PM10, PM2.5, O3),
many measurements are routinely performed and well organ-ised in homogeneous databases. For instance the EEA (Euro-pean Environmental Agency) is responsible for the AirBase175
database, it contains air quality monitoring data and informa-tion submitted by the participating countries throughout Eu-rope (http://www.eea.europa.eu/). Concentrations are hourlyrecorded and this study will focus on ozone and PM10 surfaceconcentrations. Due to the coarse model resolution (50 × 50180
km), the comparison of NO2 is irrelevant, and has thereforenot been performed. In order to calculate scores and studytime series, we retained specific sites with a first set of 8”coastal background” stations and a second set of 9 ”con-tinental background” stations. Their location is displayed in185
Figure 3 and details about their localization is explained inTable 1. They were chosen to be representative of variouslocations around the Mediterranean Sea: Spain, France and
Figure 3. Locations of the AirBase stations providing O3 and PM10 measurements used in thisstudy.
23112
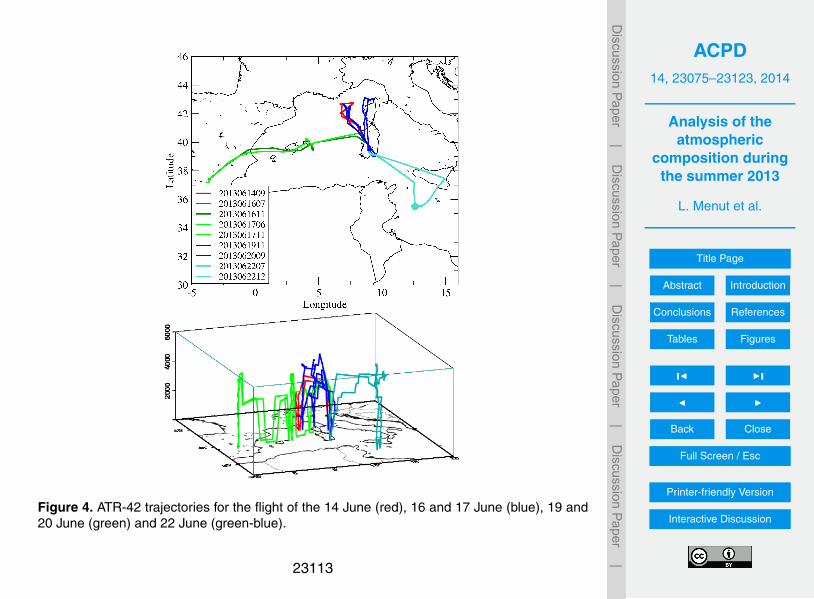
ACPD14, 23075–23123, 2014
Analysis of theatmospheric
composition duringthe summer 2013
L. Menut et al.
Title Page
Abstract Introduction
Conclusions References
Tables Figures
J I
J I
Back Close
Full Screen / Esc
Printer-friendly Version
Interactive Discussion
Discussion
Paper
|D
iscussionP
aper|
Discussion
Paper
|D
iscussionP
aper|
4 L.Menut et al.: Analysis of the atmospheric composition during the summer 2013
Italy, including Baleares, Corsica and Lampedusa islands.From all available routine stations, the selected stations are190
all ’background’ stations. This choice is mandatory if wewant to compare surface concentrations to regional model,knowing that the simulations presented here have a 50 km ×50 km horizontal resolution.
Site Country Longitude LatitudeADRIMED measurements sitesLampedusa Italy 12.63 35.51Cape Corsica France 9.41 42.83AirBase coastal ’background’ stationsZorita Spain -0.16 40.73Cartagena Spain -0.97 37.60Malaga Spain -4.46 36.72Ajaccio France 8.73 41.92Bastia France 9.44 42.69Hyeres France 6.13 43.11Taranto Italy 17.28 40.41Chitignano Italy 11.90 43.66AirBase continental ’background’ stationsAranjuez Spain -3.59 40.04LaCiguena Spain -2.42 42.46Cordoba Spain -4.77 37.90Agen France 0.62 44.19Champforgeuil France 4.83 46.82Gap France 6.07 44.55Baceno Italy 8.25 46.31Schivenoglia Italy 11.07 44.99Vercelli Italy 8.40 45.31AERONET stationsBanizoumbou Nigeria 2.66 13.54Capo Verde Capo Verde -22.93 16.73Dakar Senegal -16.95 14.39Cinzana Mali -5.93 13.28Ilorin Nigeria 4.340 8.32Izana Canaries, Spain -16.49 28.31Forth Crete Greece 25.27 35.31Lampedusa Italy 12.63 35.51Saada Morocco -8.15 31.61Zinder Airport Nigeria 8.98 13.75
Table 1. Characteristics of the AirBase and AERONET (AerosolRObotic NETwork) stations used in this study. Note that the Air-Base Italian stations of Chitignano, Baceno, Schivenoglia and Ver-celli provide daily averaged values, when all other stations providehourly (but not regular) measurements.
2.2 The specific ADRIMED measurements195
The experimental part included in-situ surface at two su-per (Lampedusa and Cape Corsica) and secondary (Minorca,Granada) sites, aircrafts (ATR-42 and Falcon-20 aircrafts)and spaceborne observations, as presented in Mallet (2014).
2.2.1 Surface measurements200
For surface measurements, the super-sites of Lampedusa andCape Corsica were equipped to monitor the main aerosolproperties as the complete particle size distribution (fine andcoarse fraction), the chemical composition, possible mixing,total mass concentration, scattering and absorption, parti-205
cle vertical profiles as well as downward shortwave (SW)and longwave (LW) fluxes. In addition, a quite similar in-situ instrumentation has been deployed onboard the ATR-42for estimating microphysical, chemical and optical propertieswithin aerosol plumes located in altitude and not detectable210
at the surface stations. In parallel, remote-sensing observa-tions (passive and active) have been performed onboard theFalcon-20 during the 17/06 to 05/07 period to derive aerosolloading and microphysical properties for the whole atmo-spheric column as well as aerosol vertical profiles.215
2.3 Airborne measurements
Fig. 4. ATR-42 trajectories for the flight of the 14 June (red), 16 and17 June (blue), 19 and 20 June (green) and 22 June (green-blue).
Figure 4. ATR-42 trajectories for the flight of the 14 June (red), 16 and 17 June (blue), 19 and20 June (green) and 22 June (green-blue).
23113

ACPD14, 23075–23123, 2014
Analysis of theatmospheric
composition duringthe summer 2013
L. Menut et al.
Title Page
Abstract Introduction
Conclusions References
Tables Figures
J I
J I
Back Close
Full Screen / Esc
Printer-friendly Version
Interactive Discussion
Discussion
Paper
|D
iscussionP
aper|
Discussion
Paper
|D
iscussionP
aper|
L.Menut et al.: Analysis of the atmospheric composition during the summer 2013 5
The ATR-42 aircraft was operated by the SAFIRE CNRS,CNES and Meteo-France joint laboratory. Nine flights weredone during the studied period. The flight numbers, date anddecimal hour, corresponding Julian day of flight are reported220
in Table 2. Trajectories are very different from one flight toanother and are represented in Figure 4.
Flight no Date Jday Decimal hour Ndata
28 20130614 165 9.05 4629 20130616 167 7.55 3630 20130616 167 11.49 4031 20130617 168 6.76 3932 20130617 168 11.18 3233 20130619 170 11.04 4934 20130620 171 9.83 5435 20130622 173 7.57 4736 20130622 173 12.75 40
Table 2. List of ATR flights for the tropospheric measurements ofmeteorological variables, ozone (O3) and carbon monoxyde (CO)concentrations (ppb). Ndata corresponds to the number of data af-ter averaging the high temporal frequency of aircraft measurementsto a constant 5mn time step.
2.4 The satellite measurements
Numerous satellite observations are available, but only theMODIS (Moderate Resolution Imaging Spectroradiometer)225
data will be compared in this study to model outputs. Othersatellite data will be more precisely analysed in companionpapers, always for the ADRIMED campaign analysis.
The MODIS satellite products have been used for manyyears to study the amount and origin of aerosols in the230
Mediterranean area troposphere. Barnaba and Gobbi (2004)used these data to split relative contributions of aerosols onAOD (Aerosol Optical Depth). They showed that for thesame particle size, its origin (maritime, continental or desertdust) may induce an AOD variability of one order of mag-235
nitude. During the studied year of 2001, the total amount ofaerosol emissions was found to be the largest for dust (119kTons/day with lowest values during winter), followed bymaritime aerosols (111 kTons/day more or less constant dur-ing the year) and finally continental aerosols (33 kTons/day240
with largest value during summer).More recently, Levy et al. (2010) evaluated the MODIS
AOD product over land, by comparison to AERONET sun-photometer data. They showed that there is a high correlation(R=0.9) between the two AOD products, with a mean bias of245
± 0.05. In this study, we combine the two MODIS sensors,AQUA and TERRA, to build an unified AOD product, in-cluding the Deep Blue algorithm result, Hsu et al. (2004).Even if some biases are observed over long periods, Levyet al. (2010) showed this can be a problem only for long-250
term trends studies. For this study, it is reasonable to considerthat MODIS data are completely relevant for comparisons to
model outputs during the ADRIMED period. The AOD esti-mated at 550 nm is used in this study. Some sensitivity stud-ies (Kaufman et al. (1997); Tanre et al. (1997)) estimated the255
expected error of MODIS retrievals as ±(0.03+0.05×AOD)over ocean and ±(0.05+0.2×AOD) over land.
3 The modelling system
The modelling system is composed of several models:the WRF regional meteorological model, the CHIMERE260
chemistry-transport model and additional individual modelsfor emissions fluxes estimations. All these models are inte-grated in a modelling plat-form usable both in analysis andforecast mode. For the vegetation fires emissions, satellitedata are analysed to be used by the high resolution fire model,265
(Turquety et al., 2014). The biogenic and mineral dust emis-sions fluxes depend on the meteorology, when the anthro-pogenic emissions are only dependent on the week day. Thesimulation was performed from the 1st June to the 15th July2013.270
3.1 The meteorological model WRF
The meteorological parameters are modelled with the non-hydrostatic WRF regional model in its version 3.2.1 (Ska-marock et al. (2007)). The model is used with a constanthorizontal resolution of 50 km × 50 km and 32 vertical lev-275
els from the surface to 50 hPa, as displayed in Figure 5. Thisresolution enables simulations over a very large domain, in-cluding all kind of sources (anthropogenic, biogenic, mineraldust and fires) as well as various long-range transport eventsoften observed between Africa and Europe.280
Fig. 5. The simulation domain for WRF and CHIMERE. A Lambertconformal projection is used with a constant horizontal resolutionof 50 km × 50 km. Colors represent the 2m temperature (in Kelvin)for the 21 June 12:00 UTC, and the vectors represent the 10m windspeed.
Figure 5. The simulation domain for WRF and CHIMERE. A Lambert conformal projection isused with a constant horizontal resolution of 50km×50km. Colors represent the 2 m tempera-ture (in Kelvin) for the 21 June 12:00 UTC, and the vectors represent the 10 m wind speed.
23114

ACPD14, 23075–23123, 2014
Analysis of theatmospheric
composition duringthe summer 2013
L. Menut et al.
Title Page
Abstract Introduction
Conclusions References
Tables Figures
J I
J I
Back Close
Full Screen / Esc
Printer-friendly Version
Interactive Discussion
Discussion
Paper
|D
iscussionP
aper|
Discussion
Paper
|D
iscussionP
aper|
8 L.Menut et al.: Analysis of the atmospheric composition during the summer 2013
Ajaccio Bastia Zorita
Malaga Champforgeuil Agen
Fig. 6. Time series of daily maximum of O3 surface concentrations for some selected AirBase sites, continental and coastal stations.
Fig. 7. Surface ozone concentrations (ppb) map for the 17 June2013, 12:00 UTC.
horizontally (using a bilinear interpolation). The comparison440
between the modelled and measured ozone concentrations ispresented in Figure 8. The corresponding altitude, temper-ature (in oC) and mean wind speed (in m s−1) are also pre-sented, using the same abscissa axis.
Each flight lasts between two and three hours. In the al-445
titude panels, we can see that the plane made several iso-altitude measurements, mainly at 4000m and 6000m. Formeteorological data, the temperature is always very well sim-ulated by the WRF model. The differences between modeland measurements are very weak, except, for example, for450
flights 30 and 31 where the temperature is slightly underes-timated by the model and in altitude. The wind is variableand there are differences between the model and measure-ments, mostly in terms of variability. Trends in wind arewell simulated. Ozone is always a little over-estimated by the455
model, especially in altitude. This is probably a direct effectof boundary conditions that may be too strong for this period.
The boundary chemical fields are derived from a global cli-mate model and the summer of 2013 was moderated in termsof pollution: the climatology may thus induce a positive bias460
in the model. These flights within the marine boundary layerare a very good opportunity to evaluate ozone concentrationsover the maritime surfaces. These concentrations are usuallyvery high in models due to a lack of deposition. For the partsof flights near the surface, the model is mostly closer to the465
measurement. There are two peaks simulated by the modelduring flights 29 and 33 that are not measured: these mod-elled high ozone values correspond to local ozone plumes aspresented in Figure 7. However, the ozone peak close to thesurface for the flight 30 is perfectly captured.470
5 Analysis of Aerosols Optical Depth
The Aerosols Optical Depth (AOD) reflects the extinction ofradiations by aerosols along the whole atmospheric column.This quantity being well and often measured, the compari-son between model and measurements is a widely used way475
to estimate the model ability to reproduce aerosols plumesat the right time and the right place. Thus, AOD enables tosee if the model is able to reproduce massive emissions ofmineral dust over arid areas and vegetation fires. This is alsoa way to see if the main long range transport structures are480
correctly reproduced. However, comparisons of AOD havelimitations: (i) being vertically integrated, there is no infor-mation on the vertical structure of the aerosol plume, (ii) theyare sensitive to a small part of the aerosol size distribution.In this study, the CHIMERE outputs AOD are calculated at485
600 nm, due to the fastJ algorithm used in the model.
Figure 6. Time series of daily maximum of O3 surface concentrations for some selected Air-Base sites, continental and coastal stations.
23115

ACPD14, 23075–23123, 2014
Analysis of theatmospheric
composition duringthe summer 2013
L. Menut et al.
Title Page
Abstract Introduction
Conclusions References
Tables Figures
J I
J I
Back Close
Full Screen / Esc
Printer-friendly Version
Interactive Discussion
Discussion
Paper
|D
iscussionP
aper|
Discussion
Paper
|D
iscussionP
aper|
8 L.Menut et al.: Analysis of the atmospheric composition during the summer 2013
Ajaccio Bastia Zorita
Malaga Champforgeuil Agen
Fig. 6. Time series of daily maximum of O3 surface concentrations for some selected AirBase sites, continental and coastal stations.
Fig. 7. Surface ozone concentrations (ppb) map for the 17 June2013, 12:00 UTC.
horizontally (using a bilinear interpolation). The comparison440
between the modelled and measured ozone concentrations ispresented in Figure 8. The corresponding altitude, temper-ature (in oC) and mean wind speed (in m s−1) are also pre-sented, using the same abscissa axis.
Each flight lasts between two and three hours. In the al-445
titude panels, we can see that the plane made several iso-altitude measurements, mainly at 4000m and 6000m. Formeteorological data, the temperature is always very well sim-ulated by the WRF model. The differences between modeland measurements are very weak, except, for example, for450
flights 30 and 31 where the temperature is slightly underes-timated by the model and in altitude. The wind is variableand there are differences between the model and measure-ments, mostly in terms of variability. Trends in wind arewell simulated. Ozone is always a little over-estimated by the455
model, especially in altitude. This is probably a direct effectof boundary conditions that may be too strong for this period.
The boundary chemical fields are derived from a global cli-mate model and the summer of 2013 was moderated in termsof pollution: the climatology may thus induce a positive bias460
in the model. These flights within the marine boundary layerare a very good opportunity to evaluate ozone concentrationsover the maritime surfaces. These concentrations are usuallyvery high in models due to a lack of deposition. For the partsof flights near the surface, the model is mostly closer to the465
measurement. There are two peaks simulated by the modelduring flights 29 and 33 that are not measured: these mod-elled high ozone values correspond to local ozone plumes aspresented in Figure 7. However, the ozone peak close to thesurface for the flight 30 is perfectly captured.470
5 Analysis of Aerosols Optical Depth
The Aerosols Optical Depth (AOD) reflects the extinction ofradiations by aerosols along the whole atmospheric column.This quantity being well and often measured, the compari-son between model and measurements is a widely used way475
to estimate the model ability to reproduce aerosols plumesat the right time and the right place. Thus, AOD enables tosee if the model is able to reproduce massive emissions ofmineral dust over arid areas and vegetation fires. This is alsoa way to see if the main long range transport structures are480
correctly reproduced. However, comparisons of AOD havelimitations: (i) being vertically integrated, there is no infor-mation on the vertical structure of the aerosol plume, (ii) theyare sensitive to a small part of the aerosol size distribution.In this study, the CHIMERE outputs AOD are calculated at485
600 nm, due to the fastJ algorithm used in the model.
Figure 7. Surface ozone concentrations (ppb) map for the 17 June 2013, 12:00 UTC.
23116

ACPD14, 23075–23123, 2014
Analysis of theatmospheric
composition duringthe summer 2013
L. Menut et al.
Title Page
Abstract Introduction
Conclusions References
Tables Figures
J I
J I
Back Close
Full Screen / Esc
Printer-friendly Version
Interactive Discussion
Discussion
Paper
|D
iscussionP
aper|
Discussion
Paper
|D
iscussionP
aper|
L.Menut et al.: Analysis of the atmospheric composition during the summer 2013 9
20130614 9.05 flight 28 20130616 7.55 flight 29 20130616 11.49 flight 30
20130617 6.76 flight 31 20130617 11.18 flight 32 20130619 11.04 flight 33
20130620 9.83 flight 34 20130622 7.57 flight 35 20130622 12.75 flight 36
Fig. 8. O3 concentrations, temperature and wind speed along the flight trajectories.
5.1 Comparisons between MODIS and CHIMERE
The measured AOD at 550nm is extracted from the MODISsatellite data over the period from 6 June to 15 July 2013.These AOD are calculated at 550 nm. Observations are first490
averaged on the model grid, and comparisons are done for
collocated data in space and time, as displayed in Figure 9.The MODIS map includes the AOD retrieved over ocean andover land. In addition and when the data are available, theAOD estimated using the deep-blue algorithm is used ( Sayer495
et al. (2013)).The most important AOD values are recorded over the At-
Figure 8. O3 concentrations, temperature and wind speed along the flight trajectories.
23117

ACPD14, 23075–23123, 2014
Analysis of theatmospheric
composition duringthe summer 2013
L. Menut et al.
Title Page
Abstract Introduction
Conclusions References
Tables Figures
J I
J I
Back Close
Full Screen / Esc
Printer-friendly Version
Interactive Discussion
Discussion
Paper
|D
iscussionP
aper|
Discussion
Paper
|D
iscussionP
aper|
10 L.Menut et al.: Analysis of the atmospheric composition during the summer 2013
MODIS CHIMERE
Fig. 9. Comparison of Aerosol Optical Depth measured by MODIS (left) and modelled with CHIMERE (right). This AOD corresponds tothe mean averaged value over the period from 6 June to 15 July 2013.
lantic Ocean, in a flow from Western Africa towards NorthAmerica. Over continental areas (Sahara and Sahel) and overthe Atlantic Ocean, the modelled AOD is slightly overesti-500
mated but the location of the main sources and plumes isvery well reproduced.
Other significant values are recorded in the South of theArabian Peninsula and the Eastern Africa. Up to φ=35 oN,the AOD is very low and lower than 0.2. Over the Mediter-505
ranean sea, no plume is detected: this means than on averageand over this whole period, there was no massive or persis-tent aerosol plumes.
5.2 Comparisons between AERONET and CHIMERE
Comparisons between modelled and measured AOD are also510
done using the AERONET data (level 1.5). Time series arepresented in Figure 10. When the station of Banizoumbouis located close to the mineral dust sources, the stations ofCapo Verde and Dakar are directly under the plume. This ex-plains that over the whole period, AOD values are important,515
ranging between 0.4 and 2. The day to day variability is alsoimportant and these time series show the highest AOD val-ues during the period from 5 to 15 June (before ADRIMEDintensive observations periods). A second period with highvalues is between the 27 and 30 June. For these African sta-520
tions, the modelled AOD is very close to the measurements.The model is able to retrieve the observed day to day vari-ability, even if, on average, modelled values are greater thanobserved ones for stations far away from the main Saharandust sources.525
Time series are also presented for the stations of Lampe-dusa, Forth Crete and Izana. This set of stations is repre-sentative of islands (for Lampedusa and Izana), and remotelocations (Forth Crete). The measured AOD values are verysmall, always lower than 0.5. This clearly shows that dur-530
ing the whole period, no intense aerosol plume was observedall around the Mediterranean sea. The comparison results
are worse than for the African stations, and the model tendsto overestimate the AOD. The differences between modelledand measured AOD are more or less constant for all stations,535
but more visible on time series with very low measured val-ues.
This slight overestimation may be due to several factorsthat can not be diagnosed only with the AOD, this quantitybeing an integrated budget of many possible contributions.540
This may be an overestimation of surface mineral dust emis-sions, a shift in the aerosols size distribution, or an underesti-mation of modelled dry deposition velocities. But, account-ing for all these potential problems, the AOD is satisfactorilymodelled compared to the AERONET measurements (them-545
selves having possible errors and biases).The Table 5 corresponds to statistical scores calculated
over 10 AERONET stations. The number of observations isvery variable from one station to another: if the Izana stationshave 516 measurements values, the Forth Crete has only 108.550
These differences are certainly due to the cloud screeningalgorithm applied on the raw sunphotometer data to ensurethat provided AOD are only due to aerosols. The correla-tion is variable from one site to another with values rangingfrom 0.12 (Ilorin) to 0.76 (Izana) and 0.85 (Lampedusa). The555
RMSE is very large, of the order of magnitude of the AODvalue, showing the high variability of both model and mea-surements. Finally, model performances are good, showingthat the new parameterizations of mineral dust implementedin CHIMERE are completely able to retrieve hourly and daily560
variability of aerosols due mainly to the dust load.
6 Analysis of PM10 concentrations
For the understanding of aerosols life cycle, the analysis ofPM10 surface concentrations is complementary to the analy-sis of AOD. In this case, the information is only close to the565
surface but the concentration is representative of the whole
Figure 9. Comparison of Aerosol Optical Depth measured by MODIS (left) and modelled withCHIMERE (right). This AOD corresponds to the mean averaged value over the period from6 June to 15 July 2013.
23118
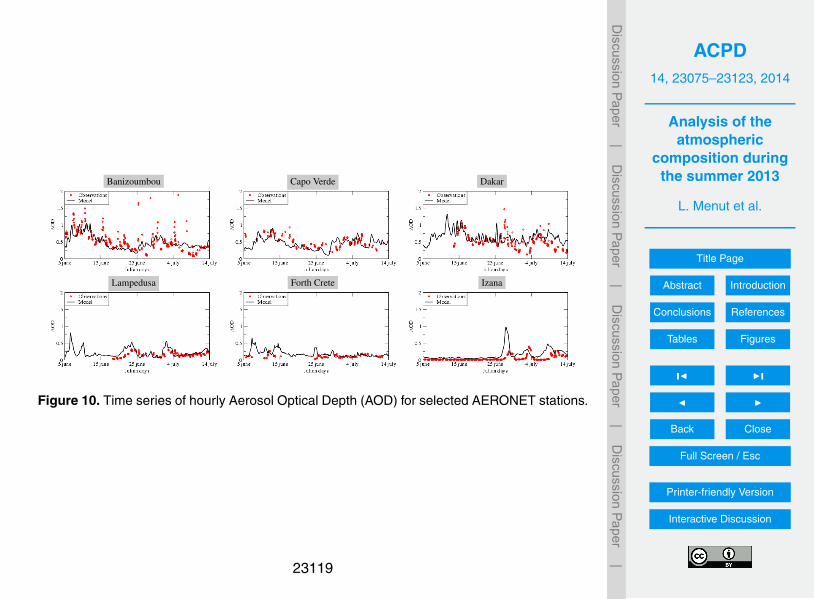
ACPD14, 23075–23123, 2014
Analysis of theatmospheric
composition duringthe summer 2013
L. Menut et al.
Title Page
Abstract Introduction
Conclusions References
Tables Figures
J I
J I
Back Close
Full Screen / Esc
Printer-friendly Version
Interactive Discussion
Discussion
Paper
|D
iscussionP
aper|
Discussion
Paper
|D
iscussionP
aper|
L.Menut et al.: Analysis of the atmospheric composition during the summer 2013 11
Banizoumbou Capo Verde Dakar
Lampedusa Forth Crete Izana
Fig. 10. Time series of hourly Aerosol Optical Depth (AOD) for selected AERONET stations
Site Nobs AOD R RMSEdaily mean (ad.)Obs Mod
Banizoumbou 357 0.59 0.46 0.27 0.47Capo Verde 166 0.49 0.47 0.57 0.16Dakar 248 0.53 0.65 0.52 0.21Cinzana 338 0.58 0.45 0.52 0.34Ilorin 104 0.38 0.44 0.12 0.52Izana 516 0.05 0.15 0.76 0.14Lampedusa 238 0.16 0.22 0.85 0.08Saada 410 0.24 0.26 0.65 0.15Zinder Airport 345 0.56 0.68 0.26 0.57Forth Crete 108 0.11 0.17 0.36 0.09
Table 5. Correlations (R), Root Mean Squared Error (RMSE) andbias of measured and modelled daily mean Aerosol Optical Depth,for several AERONET stations.
size distribution spectrum up to a mean mass median diame-ter of 10 µm.
6.1 Surface concentrations time series
Table 6 lists the comparisons results. In order to compare570
the measurements and the model data, values are daily aver-aged and in µg m−3. The number of values compared is veryvariable and mostly between 700 and 1000, corresponding tohourly data over the whole period. Italian stations are dif-ferent and measurements are only daily, leading to a lower575
number of observations. Depending on the station the corre-lation ranges from very low (-0.03 for Cartagena and Agen,for example) to moderate (0.68 in Hyeres, 0.65 in Vercelli).For a major part of the stations, the bias remains low and lessthan 5 µg m−3.580
The corresponding time series of measured and modelled
Site Nobs PM10 R RMSEdaily mean (µg m−3)
Obs ModADRIMED measurements sitesLampedusa 700 36.76 33.78 0.20 18.07Cape Corsica 527 11.62 27.67 0.09 19.11AirBase coastal ’background’ stationsZorita 816 16.25 16.13 0.58 8.99Cartagena 955 21.62 24.26 -0.02 12.73Malaga 905 32.53 31.17 -0.08 19.85Ajaccio 733 20.93 27.21 0.12 11.07Bastia 887 21.10 25.20 0.10 9.15Hyeres 955 29.26 26.36 0.69 6.27Taranto 935 19.79 21.45 0.48 7.05AirBase continental ’background’ stationsChitignano 72 10.35 19.80 0.57 9.66Aranjuez 843 23.24 15.18 0.42 12.78LaCiguena 976 23.19 14.81 0.46 10.05Cordoba 941 21.56 23.94 0.23 18.38Agen 983 14.47 16.61 -0.04 9.69Champforgeuil 972 15.89 17.51 0.16 9.78Gap 822 12.93 13.69 0.57 4.99Baceno 33 7.88 12.26 0.37 9.06Schivenoglia 73 26.93 20.88 0.20 13.77Vercelli 40 16.08 19.40 0.62 7.21
Table 6. Correlation (R), bias and RMSE for the daily mean PM10
(µg m−3) surface concentrations (except for the Lampedusa mea-surements corresponding to Total Suspended Particles).
surface PM10 concentrations are presented in Figure 11. Onaverage, the background concentrations are well modelledfor all sites. But some discrepancies appear when some peaksare modelled but not measured. For example, at the stations585
of Zorita, Malaga and Agen, large PM10 concentrations are
Figure 10. Time series of hourly Aerosol Optical Depth (AOD) for selected AERONET stations.
23119

ACPD14, 23075–23123, 2014
Analysis of theatmospheric
composition duringthe summer 2013
L. Menut et al.
Title Page
Abstract Introduction
Conclusions References
Tables Figures
J I
J I
Back Close
Full Screen / Esc
Printer-friendly Version
Interactive Discussion
Discussion
Paper
|D
iscussionP
aper|
Discussion
Paper
|D
iscussionP
aper|
12 L.Menut et al.: Analysis of the atmospheric composition during the summer 2013
Lampedusa Cape Corsica Zorita
Malaga Champforgeuil Agen
Fig. 11. Time series of daily averaged PM10 surface concentrations for the ADRIMED sites (Lampedusa and Cape Corsica) and some se-lected AirBase sites, continental and coastal stations (except for the Lampedusa measurements corresponding to Total Suspended Particles).
modelled but the measurements do not show any peak. Thesepeaks are sporadic and can thus be due to overestimated min-eral dust or fires emissions. The lower bias on the AOD sug-gests that the whole column is correct, but that the surface590
concentrations are too large. This can be, partially, the prob-lem of all deterministic Eulerian models, often too diffusivevertically. Another possibility is to have too important localemissions. A way to better understand this overestimation isto analyze the aerosols composition, as presented in the next595
section.
6.2 Modelled PM speciation
For each site, the modelled aerosols composition is presentedas surface time series in Figure 12. The concentrations areshown here for the whole aerosols size distribution, i.e. from600
0.04 µm to 40 µm. This is thus logical to have surface con-centrations higher than the ones presented for the PM10 timeseries. All presented species are described as CHIMEREmodel species families (such as SOA) or primarily emittedspecies (such as POM, EC and the rest of anthropogenic dust605
called PPM here). The complete explanations about thesespecies are provided in Menut et al. (2013a). For all pre-sented time series, the most important contribution comesfrom mineral dust, with, at least, 50% of the total mass. Thismineral dust part is also responsible of the large peaks ob-610
served on the PM10 concentrations. The second most im-portant contribution corresponds to sea salts. This effect isparticularly important for sites on islands or near the coast asLampedusa and Cape Corsica. For ’continental background’stations such as Champforgeuil and Agen, the concentrations615
are lower than for the other stations and the relative part ofsea salt becomes negligible. However, surface concentrationsof mineral dust remain important for these stations suggest-
ing that modelled local emissions are too large. The last mostimportant contribution is for sulphates with large concentra-620
tions modelled in Lampedusa and Malaga, among others. Fi-nally, the relative contributions of POM and EC are very lowin the total, showing that this period was not influenced bylarge vegetation fires events.
In order to link the information of surface concentra-625
tions, aerosols composition and vertical structure, Figure 13presents vertical profiles for the same stations as in Figure 12and for the 21 June 2013 at 12:00 UTC. Over Lampedusa,the main part of the aerosols profile is due to the long rangetransport of mineral dust from Africa. This is also the case630
for the Cape Corsica site, in altitude, with the same impor-tant plume at 3000 to 4000m AGL (Above Ground Level). Inaddition, a contribution of ≈ 50 % of sulphates is observedclose to the surface, certainly due to shipping emissions sinceCHIMERE does not take marine biogenic sulphur emissions.635
In Zorita, the contributions are mainly due to mineral dust,sulphates and sea salts. There is no plume in altitude and theconcentrations are low with a maximum of 12 µg m−3. Thisis the same behaviour in Malaga and Agen. Finally, the verti-cal profile in Champforgeuil shows an important peak around640
2000 m AGL: this is partly due to the mineral dust observedin Lampedusa and Cape Corsica, with, in addition, non neg-ligible concentrations of nitrates. For all these profiles, thevertical concentrations seem realistic and the relative contri-butions of mineral dust correspond to the main part of the645
aerosol composition.Measurements of Calcium and Sulphate performed at
Cape Corsica provide some clues on the capability ofCHIMERE to reproduce the concentrations of two majorcompound of PM (Figure 14). Considering that most of the650
dust in this region comes from the Sahara, a factor of 15 isused to convert Calcium in Dust (Putaud et al. (2004)). This
Figure 11. Time series of daily averaged PM10 surface concentrations for the ADRIMED sites(Lampedusa and Cape Corsica) and some selected AirBase sites, continental and coastal sta-tions (except for the Lampedusa measurements corresponding to Total Suspended Particles).
23120
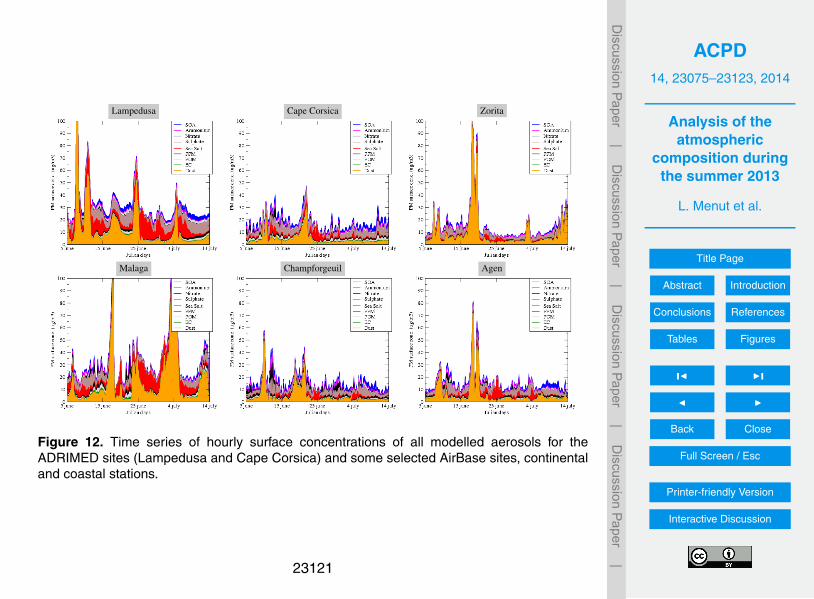
ACPD14, 23075–23123, 2014
Analysis of theatmospheric
composition duringthe summer 2013
L. Menut et al.
Title Page
Abstract Introduction
Conclusions References
Tables Figures
J I
J I
Back Close
Full Screen / Esc
Printer-friendly Version
Interactive Discussion
Discussion
Paper
|D
iscussionP
aper|
Discussion
Paper
|D
iscussionP
aper|
L.Menut et al.: Analysis of the atmospheric composition during the summer 2013 13
Lampedusa Cape Corsica Zorita
Malaga Champforgeuil Agen
Fig. 12. Time series of hourly surface concentrations of all modelled aerosols for the ADRIMED sites (Lampedusa and Cape Corsica) andsome selected AirBase sites, continental and coastal stations.
factor is uncertain but is used only to study the temporal vari-ability of dust concentrations. For mineral dust and for thisspecific site, the model has difficulties to retrieve the timing655
of peaks. Regarding sulphates, we clearly see an overesti-mate of the modelled concentrations. A closer look at themodel results indicate a sulphate pattern due to SO2 shippingemissions. However the timing of some peaks is well repro-duced by the model. This comparison shows the difficulty of660
the dust module to give the right dust concentrations at thesurface. Even for better documented sources like shippingemissions, discrepancies related to the emission regriddingof such lineic sources are certainly responsible for the over-estimation of the model simulations in this area.665
7 Conclusions
In the framework of the CHARMEX project, a simulation ofthe atmospheric composition was carried out at the regionalscale with the WRF and CHIMERE models, for meteorologyand chemistry-transport respectively.670
The simulation period ranges from 1st June to 15 July of2013 and covers the whole period of the ADRIMED projectintensive observation periods. The simulation domain coversall of Europe and the Northern half of Africa which allows to
take into account major sources of pollution: anthropogenic,675
biogenic as well as vegetation fires and mineral dust.The key pollutants of air quality studies are compared be-
tween measurements and model. At the surface, ozone andPM10 were compared to surface measurements of the Air-Base network and to ADRIMED specific measurements done680
at Lampedusa and Cape Corsica. Using all aerosols concen-trations, the Aerosols Optical depth is diagnosed and com-pared to the AERONET stations measurements. In addition,comparisons are done between the ATR flights for ozoneconcentrations and some meteorological variables.685
The error statistics showed that the model is able to re-produce surface ozone concentrations, both the average val-ues and the variability, even if we note an overestimate ofozone concentrations. The comparison between modelledand measured ozone concentrations along the flight trajec-690
tories is very satisfactory and confirm the high ozone con-centration close to the sea surface that commonly simulatedin chemistry transport models, and the altitude ozone con-centrations are also well captured.
Regarding the PM10 ground concentrations the model is695
able to reproduce correct average values with rather low cor-relations. These low correlations are attributed to the flat timeseries or the difficulties to capture the dust peaks at the righttime. When looking at the AOD, the model performances are
Figure 12. Time series of hourly surface concentrations of all modelled aerosols for theADRIMED sites (Lampedusa and Cape Corsica) and some selected AirBase sites, continentaland coastal stations.
23121
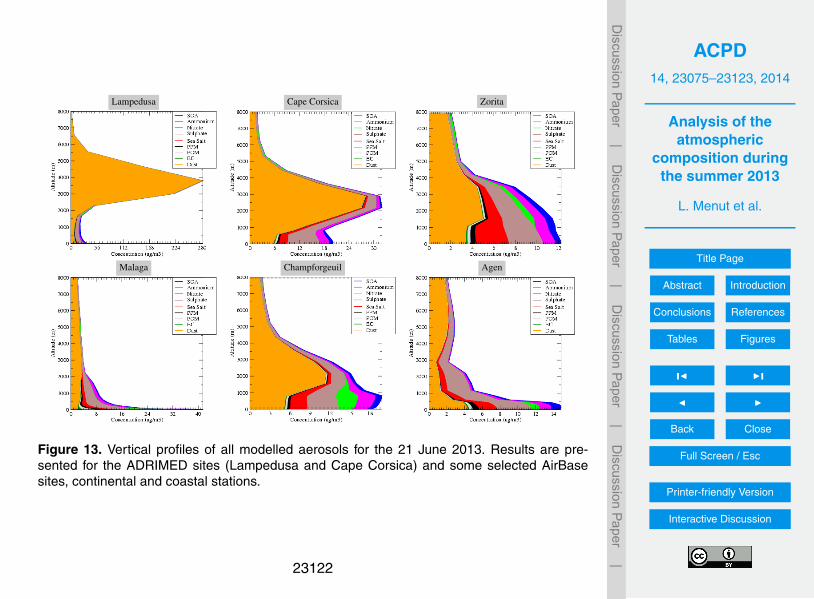
ACPD14, 23075–23123, 2014
Analysis of theatmospheric
composition duringthe summer 2013
L. Menut et al.
Title Page
Abstract Introduction
Conclusions References
Tables Figures
J I
J I
Back Close
Full Screen / Esc
Printer-friendly Version
Interactive Discussion
Discussion
Paper
|D
iscussionP
aper|
Discussion
Paper
|D
iscussionP
aper|
14 L.Menut et al.: Analysis of the atmospheric composition during the summer 2013
Lampedusa Cape Corsica Zorita
Malaga Champforgeuil Agen
Fig. 13. Vertical profiles of all modelled aerosols for the 21 June 2013. Results are presented for the ADRIMED sites (Lampedusa and CapeCorsica) and some selected AirBase sites, continental and coastal stations.
better meaning that the dust module is able to emit the right700
load of particles at the right time in arid zones. In Europe, thedust emissions are certainly overestimated. A comparisonwith sulphate concentrations in Cape Corsica exhibits somediscrepancies related to the emission regridding of shippingemissions.705
Acknowledgements. This study was partly funded by the FrenchMinistry in charge of Ecology. We thank the SAFIRE joint labo-ratory and the CHARMEX program for providing us all campaignmeasurements used in this study. We thank the EEA for maintainingand providing the AirBase database of pollutants surface concen-710
trations over Europe. We thank the principal investigators and theirstaff for establishing and maintaining the AERONET sites used inthis study: Didier Tanre for Banizoumbou, Capo Verde and Dakar;Bernadette Chatenet and Jean-Louis Rajot for Zinder and Cinzana;Daniela Meloni and Alcide Di Sarra for Lampedusa.715
References
Barnaba, F. and Gobbi, G.: Aerosol seasonal variability over theMediterranean region and relative impact of maritime, continen-tal and Saharan dust particles over the basin from MODIS datain the year 2001, Atmospheric Chemistry and Physics, 4, 2367–720
2391, 2004.
Basart, S., Perez, C., Cuevas, E., Baldasano, J. M., and Gobbi,G. P.: Aerosol characterization in Northern Africa, NortheasternAtlantic, Mediterranean Basin and Middle East from direct-sunAERONET observations, Atmospheric Chemistry and Physics,725
9, 8265–8282, doi:10.5194/acp-9-8265-2009, 2009.Bergamo, A., Tafuro, A. M., Kinne, S., De Tomasi, F., and Perrone,
M. R.: Monthly-averaged anthropogenic aerosol direct radia-tive forcing over the Mediterranean based on AERONET aerosolproperties, Atmospheric Chemistry and Physics, 8, 6995–7014,730
doi:10.5194/acp-8-6995-2008, 2008.Bessagnet, B., Hodzic, A., Vautard, R., Beekmann, M., Cheinet,
S., Honore, C., Liousse, C., and Rouil, L.: Aerosol modelingwith CHIMERE: preliminary evaluation at the continental scale,Atmospheric Environment, 38, 2803–2817, 2004.735
Bian, H., , and Prather, M.: Fast-J2: accurate simulation of strato-spheric photolysis in global chemical models, J Atmos Chem,41, 281–296, 2002.
Briant, R., Menut, L., Siour, G., and Prigent, C.: Homogeneizedmodeling of mineral dust emissions over Europe and Africa us-740
ing the CHIMERE model, Geoscientific Model DevelopmentDiscussion, 7, 3441–3480, 2014.
Chen, F. and Dudhia, J.: Coupling an advanced land surface-hydrology model with the Penn State-NCAR MM5 model-ing system. Part I: Model implementation and sensitivity, Mon745
Weather Rev, 129(4), 569–585, 2001.de la Paz, D., Vedrenne, M., Borge, R., Lumbreras, J., de Andres,
Figure 13. Vertical profiles of all modelled aerosols for the 21 June 2013. Results are pre-sented for the ADRIMED sites (Lampedusa and Cape Corsica) and some selected AirBasesites, continental and coastal stations.
23122
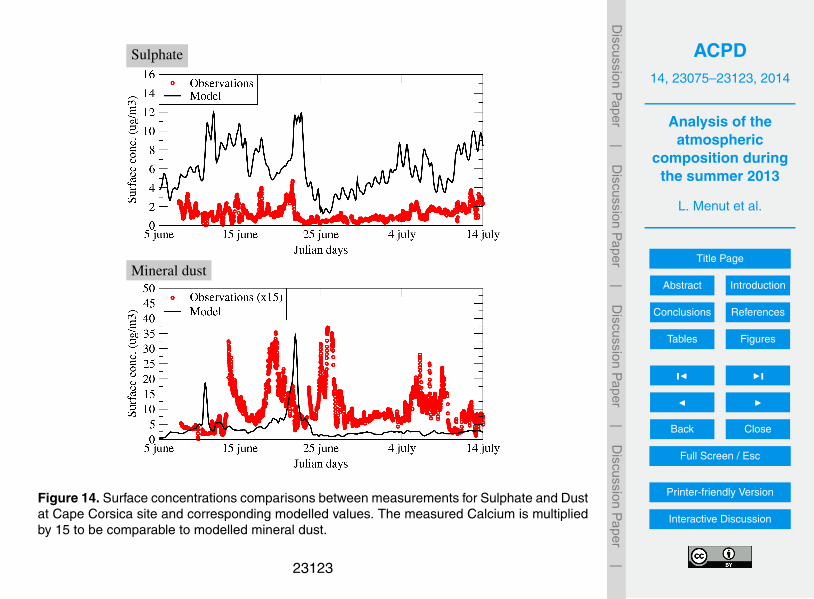
ACPD14, 23075–23123, 2014
Analysis of theatmospheric
composition duringthe summer 2013
L. Menut et al.
Title Page
Abstract Introduction
Conclusions References
Tables Figures
J I
J I
Back Close
Full Screen / Esc
Printer-friendly Version
Interactive Discussion
Discussion
Paper
|D
iscussionP
aper|
Discussion
Paper
|D
iscussionP
aper|
L.Menut et al.: Analysis of the atmospheric composition during the summer 2013 15
Sulphate
Mineral dust
Fig. 14. Surface concentrations comparisons between measure-ments for Sulphate and Dust at Cape Corsica site and correspond-ing modelled values. The measured Calcium is multiplied by 15 tobe comparable to modelled mineral dust.
J. M., Perez, J., Rodriguez, E., Karanasiou, A., Moreno, T.,Boldo, E., and Linares, C.: Modelling Saharan dust transportinto the Mediterranean basin with CMAQ, Atmospheric Environ-750
ment, 70, 337–350, doi:10.1016/j.atmosenv.2013.01.013, 2013.Dulac, F. and Chazette, P.: Airbrne study of a multi-layer aerosol
structure in the eastern Mediterranean observed with the air-borne polarized lidar ALEX during a STAAARTE campaign (7june 1997)., Atmospheric Chemistry and Physics, 3, 1817–1831,755
2003.Dulac, F., Arboledas, L. A., Alastuey, A., Ancellet, G., Arndt, J.,
Attie, J.-L., Augustin, P., Becagli, S., Bergametti, G., Bocquet,M., Bordier, F., Bourdon, A., Bourrianne, T., Bravo-Aranda, J.,Carrer, D., Ceamanos, X., Chazette, P., Chiapello, I., Comeron,760
A., D’Amico, G., D’Anna, B., Delbarre, H., Denjean, C., Des-boeufs, K., Descloitres, J., Diouri, M., Biagio, C. D., Iorio, T. D.,Sarra, G. D., Doppler, L., Durand, P., Amraoui, L. E., Ellul, R.,Ferre, H., Fleury, L., Formenti, P., Freney, E., Gaimoz, C., Gera-sopoulos, E., Goloub, P., Gomez-Amo, J., Granados-Munoz, M.,765
Grand, N., Grobner, J., Rascado, J.-L. G., Guieu, C., Hadjim-itsis, D., Hamonou, E., Hansson, H., Iarlori, M., Ioannou, S.,Jambert, C., Jaumouille, E., Jeannot, M., Junkermann, W., Ke-leshis, C., Kokkalis, P., Lambert, D., Laurent, B., Leon, J.-F., Li-ousse, C., Bartolome, M. L., Losno, R., Mallet, M., Mamouri,770
R.-E., Meloni, D., Menut, L., Montoux, N., Baquero, R. M.,Nabat, P., Navas-Guzman, F., Nicolae, D., Nicolas, J., Notton,G., Ohayon, W., Paoli, C., Papayannis, A., Pelon, J., Pey, J., Pont,V., Pujadas, M., Querol, X., Ravetta, F., Renard, J.-B., Rizi, V.,Roberts, G., Roujean, J.-L., Sartelet, K., Savelli, J.-L., Sciare, J.,775
Sellegri, K., Sferlazzo, D., Sicard, M., Smyth, A., Solmon, F.,Tanre, D., Torres, B., Totems, J., Sanchez, A. T., Verdier, N., Vi-gnelles, D., Vincent, J., Wagner, F., Wang, Y., Wenger, J., andYassaa, N.: Overview of the Project ChArMEx activities on Sa-haran Dust in the Mediterranean region, in: 7th Int. Workshop on780
Sand/Duststorms and Associated Dustfall, 2-4 Dec. 2013, Fras-cati, Italy, 2013.
EEA: Air quality in Europe, 2013 EEA report, 9, –, 2013.Grell, G. A. and Devenyi, D.: A generalized approach to pa-
rameterizing convection combining ensemble and data assimila-785
tion techniques, Geophys. Res. Lett., 29(14), 1693, doi:10.1029/2002GL015311, 2002.
Guenther, A., Karl, T., Harley, P., Wiedinmyer, C., Palmer, P., andGeron, C.: Estimates of global terrestrial isoprene emissions us-ing MEGAN (Model of Emissions of Gases and Aerosols from790
Nature), Atmos. Chem. Phys., 6, 3181–3210, 2006.Hong, S. Y., Dudhia, J., and Chen, S.: A revised approach to ice
microphysical processes for the bulk parameterization of cloudsand precipitation, Mon Weather Rev, 132, 103–120, 2004.
Hong, S. Y., Noh, Y., and Dudhia, J.: A new vertical diffusion pack-795
age with an explicit treatment of entrainment processes, MonWeather Rev, 134, 2318–2341, doi:10.1175/MWR3199.1, 2006.
Honore, C., Rouıl, L., Vautard, R., Beekmann, M., Bessagnet, B.,Dufour, A., Elichegaray, C., Flaud, J., Malherbe, L., Meleux, F.,Menut, L., Martin, D., Peuch, A., Peuch, V., and Poisson, N.:800
Predictability of European air quality: The assessment of threeyears of operational forecasts and analyses by the PREV’AIRsystem, Journal of Geophysical Research, 113, D04 301, doi:10.1029/2007JD008761, 2008.
Hsu, N., Tsay, S., King, M., and Herman, J.: Aerosol properties805
over bright-reflecting source regions, IEEE T. Geosci. Remote,42, 557–569, 2004.
Israelevich, P., Ganor, E., Alpert, P., Kishcha, P., and Stupp, A.: Pre-dominant transport paths of Saharan dust over the MediterraneanSea to Europe, Journal of Geophysical Research, 117, D02 205,810
2012.Jimenez-Guerrero, P., Jorba, O., Pay, M. T., Montavez, J. P., Jerez,
S., Gomez-Navarro, J. J., and Baldasano, J. M.: Comparisonof two different sea-salt aerosol schemes as implemented inair quality models applied to the Mediterranean Basin, Atmo-815
spheric Chemistry and Physics, 11, 4833–4850, doi:10.5194/acp-11-4833-2011, http://www.atmos-chem-phys.net/11/4833/2011/, 2011.
Kallos, G., Kotroni, V., Lagouvardos, K., and Papadopoulos, A.: Onthe long-range transport of air pollutants from Europe to Africa,820
Geophys. Res. Lett ., 25, 1998.Kallos, G., Papadopoulos, A., Katsafados, P., and Nickovic, S.:
Transatlantic Saharan dust transport: Model simulation and re-sults, J. Geophys. Res., 111, doi:10.1029/2005JD006207, 2006.
Kaufman, Y., Tanre, D., Remer, L., Vermote, E., Chi, A., and Hol-825
ben, B.: Operational remote sensing of tropospheic aerosol overland from EOS moderate resolution imaging spectroradiometer,J Geophys Res, 102, 17 051 – 17 067, 1997.
Kloog, I., Coull, B., Zanobetti, A., Koutrakis, P., and Schwartz, J.:Acute and chronic effects of particles on hospital admissions in830
New-England, PLoS One, 7, e34 664, 2012.Kubilay, N., Cokacar, T., and Oguz, T.: Optical properties of min-
eral dust outbreaks over the northeastern Mediterranean, Journalof Geophysical Research, 108, 4666 D21, 2003.
Figure 14. Surface concentrations comparisons between measurements for Sulphate and Dustat Cape Corsica site and corresponding modelled values. The measured Calcium is multipliedby 15 to be comparable to modelled mineral dust.
23123