analysis of state of vermont employee engagement survey
TRANSCRIPT
1 1
Employee Engagement Survey Results - 2014
Analysis of State of Vermont
Employee Engagement Survey Results – 2021
Prepared by:
Vermont Department of Human Resources June 2021
Employee Engagement Survey Results - 2021 1
Table of Contents
Introduction ............................................................................................................................................................................ 3
Using the Report ..................................................................................................................................................................... 3
Methodology ........................................................................................................................................................................... 4
Table 1 Response Rate by Department ....................................................................................................................... 7
Table 2 Job Type .......................................................................................................................................................... 8
Table 3 Gender............................................................................................................................................................. 8
Table 4 Generation .................................................................................................................................................. 8
Table 5 Identification ................................................................................................................................................... 8
Table 6 Management Level.......................................................................................................................................... 9
Employee Engagement Survey Items: Summary of Key Findings ........................................................................................ 10
Job Duties and their Relationship to the Mission and Goals of Your Agency or Department .......................................... 10
Table 7 Job Duties and their Relationship to the Mission and Goals of your Agency or Department – All Respondents.................................................................................................................................................. 10
Table 8 Job Duties and their Relationship to the Mission and Goals of your Agency or Department by Department . ....................................................................................................................................................................... 12
Communication and Input within your Organization ....................................................................................................... 14
Table 9 Communication and Input within your Organization – All Respondents..................................................... 14
Table 10 Communication and Input within your Organization by Department ...................................................... 16
Relationships and Morale in your Organization ............................................................................................................... 18
Table 11 Relationships and Morale in your Organization – All Respondents .......................................................... 18
Table 12 Relationships and Morale in your Organization by Department .............................................................. 20
Your Supervisor ................................................................................................................................................................. 22
Table 13 Your Supervisor – All Respondents .......................................................................................................... 22
Table 14 Your Supervisor by Department................................................................................................................ 24
Workload, Staffing and Resources .................................................................................................................................... 28
Table 15 Workload, Staffing and Resources – All Respondents ............................................................................. 28
Table 16 Workload, Staffing and Resources by Department................................................................................... 30
Compensation and Benefits .............................................................................................................................................. 32
Table 17 Compensation and Benefits – All Respondents ........................................................................................ 32
Table 18 Compensation and Benefits by Department ............................................................................................ 34
Overall Job Satisfaction ..................................................................................................................................................... 36
Table 19 Overall Job Satisfaction – All Respondents ............................................................................................... 36
Table 20 Overall Job Satisfaction by Department ................................................................................................... 37

Employee Engagement Survey Results - 2021 2
Diversity, Equity and Inclusion (DEI) ................................................................................................................................. 38
Table 21 Diversity, Equity & Inclusion – All Respondents ....................................................................................... 39
Table 22 Diversity, Equity and Inclusion items by Department ............................................................................... 40
Engagement Survey Items – Summary and Trends .............................................................................................................. 44
Table 23 Job Duties and their Relationship to the Mission and Goals of your Agency or Department - 2014 – 2021 Trends ......................................................................................................................................................... 44
Table 24 Communication and Input within your Organization - 2014 - 2021 Trends ............................................. 45
Table 25 Relationships and Morale in your Organization - 2014 - 2021 Trends ..................................................... 46
Table 26 Your Supervisor - 2014 - 2021 Trends ....................................................................................................... 47
Table 27 Workload, Staffing and Resources - 2014 – 2021 Trends ......................................................................... 48
Table 28 Compensation and Benefits - 2014 – 2021 Trends ................................................................................... 49
Table 29 Overall Job Satisfaction - 2014 – 2021 Trends .......................................................................................... 50
Engagement Survey Items by Demographic Questions ........................................................................................................ 51
Employee Engagement Results ............................................................................................................................................. 53
Table 30- Engagement Scores - 2014 to 2021 .............................................................................................................. 53
Table 31 – Employee Engagement Model .................................................................................................................... 54
Table 32 – Components of Employee Engagement – 2021 Averages .......................................................................... 55
Table 33 – Employee Engagement Components – 2014 to 2021 ................................................................................. 56
Table 33 – Employee Engagement Crosstabulations .................................................................................................... 58
Table 34 2021 Scores for Employee Engagement and Components by Department ............................................. 59
Qualitative Analysis of Open-Ended Question Responses .................................................................................................... 60
Table 34 Themes found in Open-Ended Responses ................................................................................................ 61
Special Section: Ranking ................................................................................................................................................... 67
Table 33 Characteristics Indicated as Most Needing a Focus on Improvement ...................................................... 67
Table 33 Characteristics Indicated as Most Successfully Addressed ....................................................................... 68
Special Section: “Year Ago” Comparison .......................................................................................................................... 69
Table 35 How do you feel NOW about the following statements compared to LAST YEAR (before the pandemic/March 2020). ............................................................................................................................. 69
Appendix A – List of Survey Items ..................................................................................................................................... 74
Appendix B – 2021 Responses to Survey Questions by Department Compared with Statewide (Excel File) .................. 79
Appendix C – Cross Tabulation of 2021 Responses to Survey Questions by Demographic Questions (Excel File) .......... 79
Appendix D – 2021 Engagement Scores by Department Compared to Statewide (Excel File) ........................................ 79
Appendix E - Rankings by Department Compared to Statewide. (Excel File) ................................................................... 79
Employee Engagement Survey Results - 2021 3
Introduction In 2013, the Department of Human Resources (DHR) implemented the first statewide survey assessing employee engagement to address the goal of developing workforce excellence using meaningful performance targets and measures. The State of Vermont Employee Engagement Survey has been conducted annually since and provides important information for DHR to stay current on the status of employee engagement in Vermont State Government. This survey process allows us to measure how employees feel about their daily work and about the State of Vermont as an employer. In addition, results can be compared to prior years to examine trends and establish goals for improved engagement. The 2020 survey was distributed early in March of 2020. On March 13th Governor Scott declared state of emergency because of the COVID-19 pandemic. That survey was never analyzed because of extremely low response since many employees were deployed to address the pandemic and its impacts. In addition, many employees who were able to do so were ordered to work remotely from home. The 2021 survey was distributed in an unprecedented environment. First, many employees had been working for over a year on a remote basis and at the time of the survey guidance as to return to work had not yet been issued. Second, for over a year, employees in many departments had been under unprecedented workload pressures because of the State's response to the pandemic and its impacts. Finally, the Legislature was discussing possible restructuring of the employee pension plan due to the increasing problem of unfunded liabilities. All these things had an impact on responses to the survey and will be noted in the discussion of results. While there are several ways to define employee engagement; simply stated it is the degree to which an individual is committed to an organization and the extent to which he/she works to fulfill and advance a stated mission. The 2021 survey contained questions in the areas of: • The relationship between job duties and the organization’s mission/goals; • Communication and input; • Relationships and morale within the organization; • The employee’s relationship with supervisor; • The impact of workload, staffing and resources; and • Compensation and benefits. In addition, for 2021 several special sections were added, including the opportunity for employees to rank factors related to employees’ engagement and satisfaction that were either being successfully addressed in their Department or they felt needed improvement; there was a section on employee perception of diversity, equity, and inclusion issues; and there was a section to allow employees to compare whether certain key elements of employee engagement and satisfaction were better or worse compared to the previous year (pre pandemic).
Using the Report The 2021 Engagement Survey provides a great deal of data from which stakeholders can glean information to improve organizational practices.
Employee Engagement Survey Results - 2021 4
The analysis provided in this report is designed to be used by Agencies and Departments, as well as by DHR, as a guide to identify areas of success and improvement, and areas that may require additional investigation for next steps. It is meant to begin a process of discussion and dialogue that can result in improving staff relations, service to customers, organizational communication processes, and supervisory practices. The primary audiences for this report are all DHR stakeholders: DHR Divisions whose purpose is to provide leadership in employee hiring, retention and development; and Agency and Department leadership and managers, who can work with DHR to determine how best to use this information. Methodology
Survey Instrument
The 2021 State of Vermont Employee Engagement Survey was designed to measure engagement across the Executive Branch of Vermont State Government. The core survey structure remained the same as the 2019 survey. (After a review of the 2013 results in 2014 several new items were added, and others were revised for clarity). The 2021 survey contained questions in the areas of:
• Relationship of job duties to the mission and goals of the agency/department (6 items) • Communication and input with the organization (4 items) • Relationships and morale in the organization (9 items) • Relationship with supervisor (12 items) • Workload, staffing and resources (7 items) • Compensation and benefits (6 items)
The items selected for this survey are standard employee satisfaction and/or engagement items and track substantially with the questions and categories studied in the far-reaching landmark Gallup employee engagement poll. The survey also assessed overall job satisfaction. Survey items appeared as statements for which respondents were instructed to select from a five-point scale of agreement: Strongly Agree, Agree, Neither Agree nor Disagree, Disagree, and Strongly Disagree. See Appendix A for a list of all survey items. Survey Administration The survey was administered electronically via Survey Monkey. An email invitation was sent to all Executive Branch classified and exempt employees1 using their “preferred” email address as indicated in VTHR on March 29, 2021. The survey was active from March 29 through April 9, 2021. The survey sample included all classified and exempt employees of the Executive Branch employed during the survey period, 7,985 employees.
1 The Department of State’s Attorneys and Sheriffs was not including in the sample.
Employee Engagement Survey Results - 2021 5
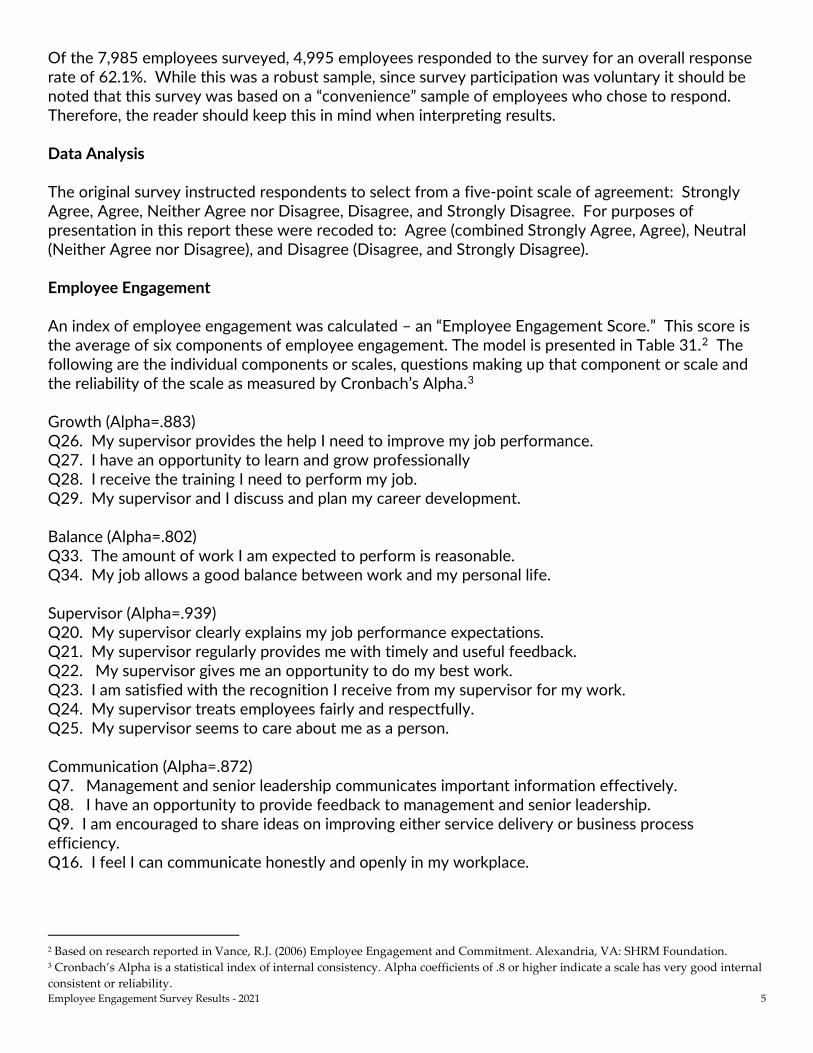
Of the 7,985 employees surveyed, 4,995 employees responded to the survey for an overall response rate of 62.1%. While this was a robust sample, since survey participation was voluntary it should be noted that this survey was based on a “convenience” sample of employees who chose to respond. Therefore, the reader should keep this in mind when interpreting results. Data Analysis The original survey instructed respondents to select from a five-point scale of agreement: Strongly Agree, Agree, Neither Agree nor Disagree, Disagree, and Strongly Disagree. For purposes of presentation in this report these were recoded to: Agree (combined Strongly Agree, Agree), Neutral (Neither Agree nor Disagree), and Disagree (Disagree, and Strongly Disagree). Employee Engagement An index of employee engagement was calculated – an “Employee Engagement Score.” This score is the average of six components of employee engagement. The model is presented in Table 31.2 The following are the individual components or scales, questions making up that component or scale and the reliability of the scale as measured by Cronbach’s Alpha.3 Growth (Alpha=.883) Q26. My supervisor provides the help I need to improve my job performance. Q27. I have an opportunity to learn and grow professionally Q28. I receive the training I need to perform my job. Q29. My supervisor and I discuss and plan my career development. Balance (Alpha=.802) Q33. The amount of work I am expected to perform is reasonable. Q34. My job allows a good balance between work and my personal life. Supervisor (Alpha=.939) Q20. My supervisor clearly explains my job performance expectations. Q21. My supervisor regularly provides me with timely and useful feedback. Q22. My supervisor gives me an opportunity to do my best work. Q23. I am satisfied with the recognition I receive from my supervisor for my work. Q24. My supervisor treats employees fairly and respectfully. Q25. My supervisor seems to care about me as a person. Communication (Alpha=.872) Q7. Management and senior leadership communicates important information effectively. Q8. I have an opportunity to provide feedback to management and senior leadership. Q9. I am encouraged to share ideas on improving either service delivery or business process efficiency. Q16. I feel I can communicate honestly and openly in my workplace.
2 Based on research reported in Vance, R.J. (2006) Employee Engagement and Commitment. Alexandria, VA: SHRM Foundation. 3 Cronbach’s Alpha is a statistical index of internal consistency. Alpha coefficients of .8 or higher indicate a scale has very good internal consistent or reliability.
Employee Engagement Survey Results - 2021 6
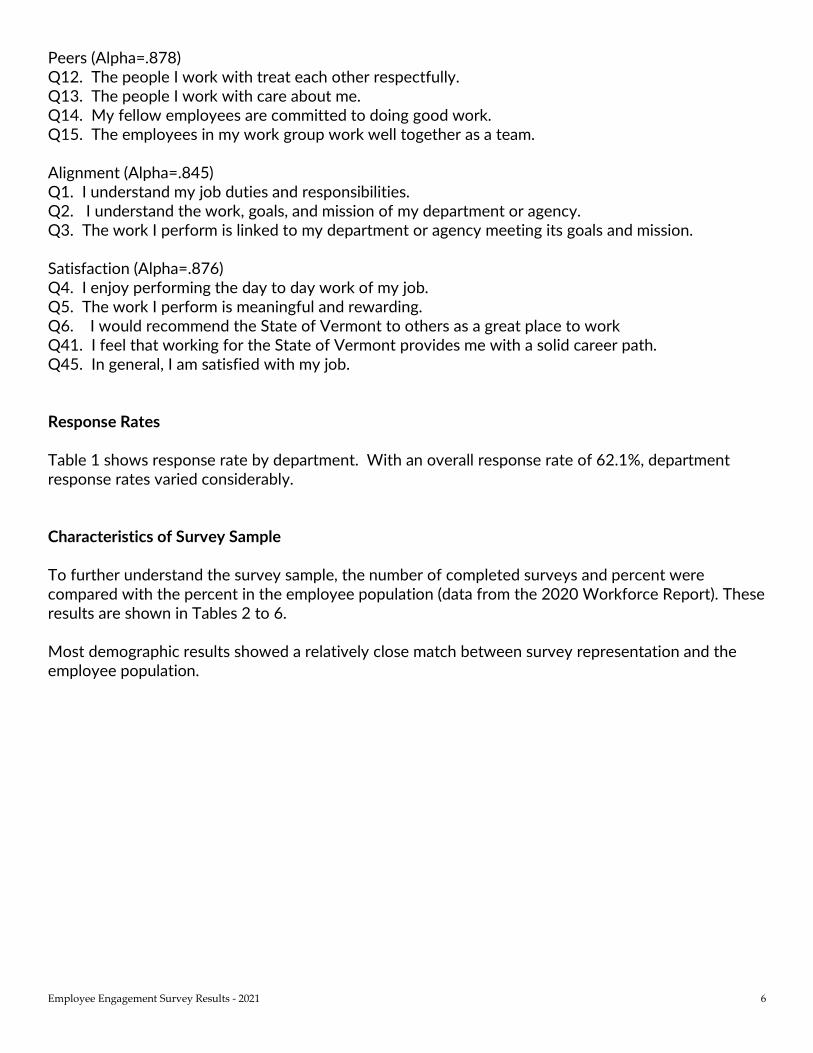
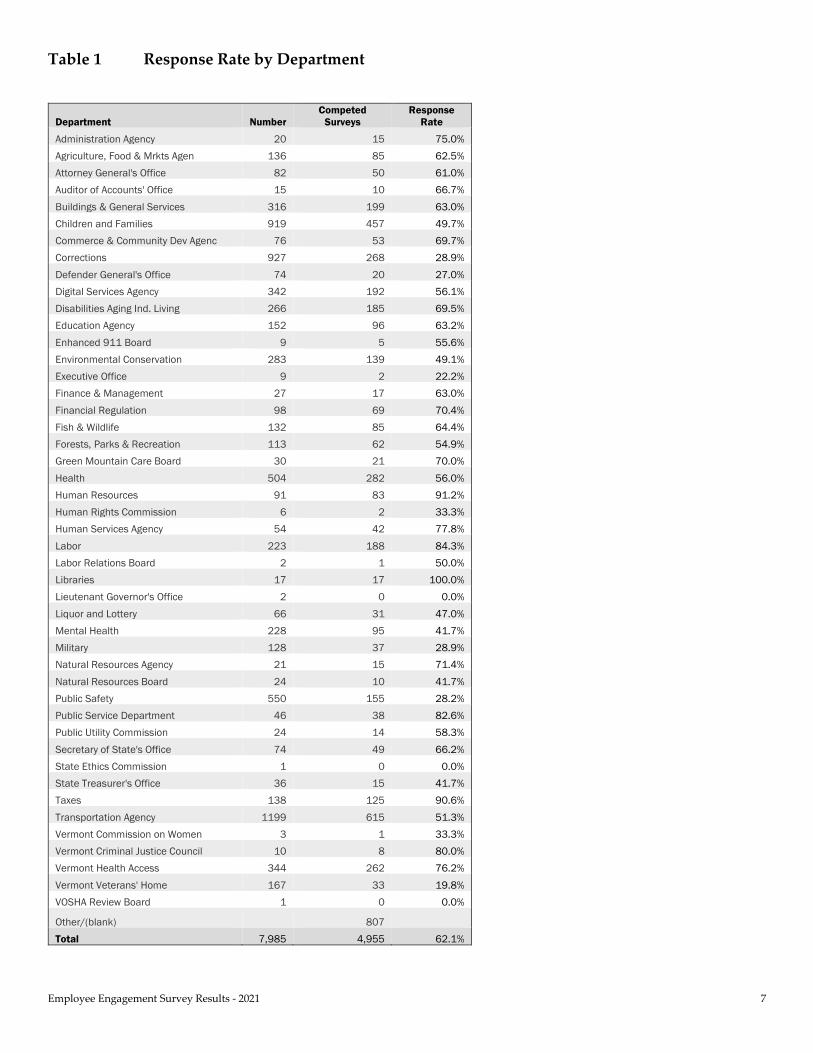
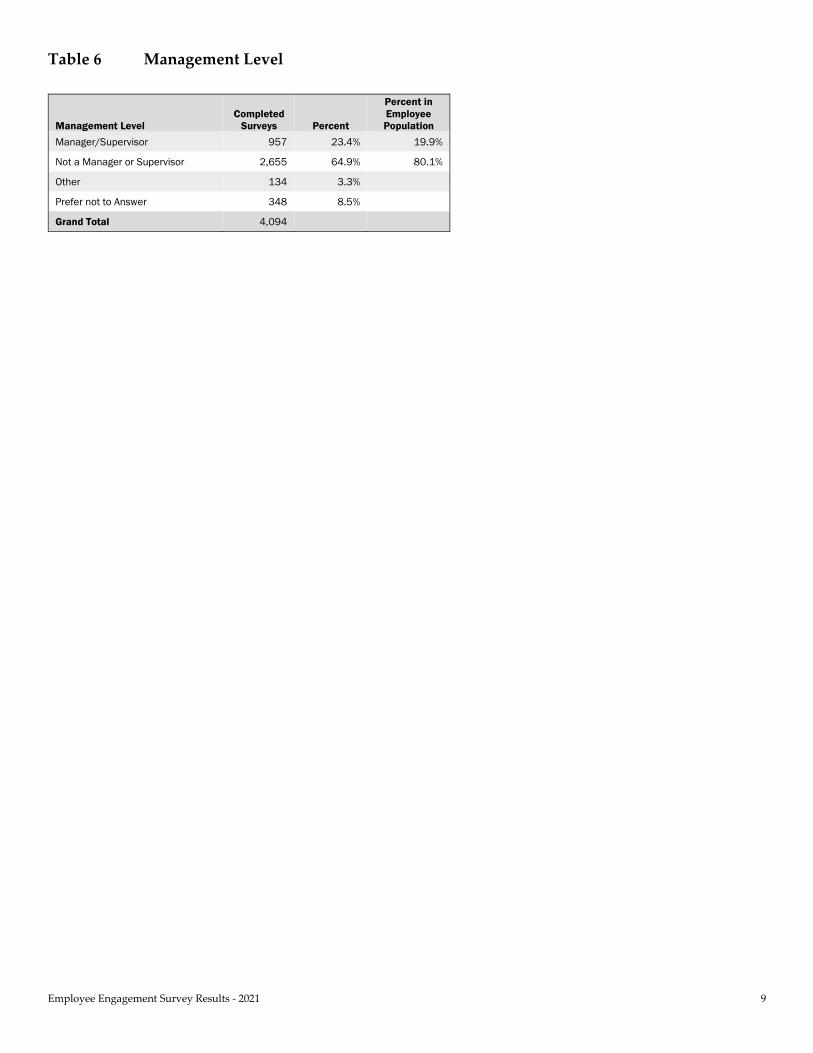
Peers (Alpha=.878) Q12. The people I work with treat each other respectfully. Q13. The people I work with care about me. Q14. My fellow employees are committed to doing good work. Q15. The employees in my work group work well together as a team. Alignment (Alpha=.845) Q1. I understand my job duties and responsibilities. Q2. I understand the work, goals, and mission of my department or agency. Q3. The work I perform is linked to my department or agency meeting its goals and mission. Satisfaction (Alpha=.876) Q4. I enjoy performing the day to day work of my job. Q5. The work I perform is meaningful and rewarding. Q6. I would recommend the State of Vermont to others as a great place to work Q41. I feel that working for the State of Vermont provides me with a solid career path. Q45. In general, I am satisfied with my job. Response Rates Table 1 shows response rate by department. With an overall response rate of 62.1%, department response rates varied considerably. Characteristics of Survey Sample To further understand the survey sample, the number of completed surveys and percent were compared with the percent in the employee population (data from the 2020 Workforce Report). These results are shown in Tables 2 to 6. Most demographic results showed a relatively close match between survey representation and the employee population.
Employee Engagement Survey Results - 2021 7
Table 1 Response Rate by Department
Department Number Competed
Surveys Response
Rate
Administration Agency 20 15 75.0% Agriculture, Food & Mrkts Agen 136 85 62.5% Attorney General's Office 82 50 61.0% Auditor of Accounts' Office 15 10 66.7% Buildings & General Services 316 199 63.0% Children and Families 919 457 49.7% Commerce & Community Dev Agenc 76 53 69.7% Corrections 927 268 28.9% Defender General's Office 74 20 27.0% Digital Services Agency 342 192 56.1% Disabilities Aging Ind. Living 266 185 69.5% Education Agency 152 96 63.2% Enhanced 911 Board 9 5 55.6% Environmental Conservation 283 139 49.1% Executive Office 9 2 22.2% Finance & Management 27 17 63.0% Financial Regulation 98 69 70.4% Fish & Wildlife 132 85 64.4% Forests, Parks & Recreation 113 62 54.9% Green Mountain Care Board 30 21 70.0% Health 504 282 56.0% Human Resources 91 83 91.2% Human Rights Commission 6 2 33.3% Human Services Agency 54 42 77.8% Labor 223 188 84.3% Labor Relations Board 2 1 50.0% Libraries 17 17 100.0% Lieutenant Governor's Office 2 0 0.0% Liquor and Lottery 66 31 47.0% Mental Health 228 95 41.7% Military 128 37 28.9% Natural Resources Agency 21 15 71.4% Natural Resources Board 24 10 41.7% Public Safety 550 155 28.2% Public Service Department 46 38 82.6% Public Utility Commission 24 14 58.3% Secretary of State's Office 74 49 66.2% State Ethics Commission 1 0 0.0% State Treasurer's Office 36 15 41.7% Taxes 138 125 90.6% Transportation Agency 1199 615 51.3% Vermont Commission on Women 3 1 33.3% Vermont Criminal Justice Council 10 8 80.0% Vermont Health Access 344 262 76.2% Vermont Veterans' Home 167 33 19.8% VOSHA Review Board 1 0 0.0%
Other/(blank) 807 Total 7,985 4,955 62.1%

Employee Engagement Survey Results - 2021 8
Table 2 Job Type
Job Type Completed
Surveys Percent
Percent in Employee Population
Classified 2,867 71.3% 92.3%
Exempt 339 8.4% 7.7%
Don't Know 524 13.0% Prefer not to Answer 293 7.3%
Total 4,023
Table 3 Gender
Gender Completed
Surveys Percent
Percent in Employee Population
Woman 2,227 55.2% 51.3%
Man 1,431 35.4% 48.7%
Non-Binary 33 8.6%
Prefer not to answer 346 16.2%
Total 4,037
Table 4 Generation
Generation Completed
Surveys Percent
Percent in Employee Population
Gen Z 47 1.2% 1.7%
Millennial 1171 29.0% 33.0%
Gen X 1,606 39.8% 44.0%
Baby Boomer 878 21.7% 24.1%
Pre-Baby Boomer 11 30.0% 0.2%
Prefer not to Answer 327 8.1%
Total 4,040
Table 5 Identification
Do you identify as any of the following groups: American Indian or Alaskan Native (Non-Hispanic or Latino), Asian (Non-Hispanic or Latino), Black or African American (Non-Hispanic or Latino), Hispanic or Latino, Native Hawaiian or Other Pacific Islander(Non-Hispanic or Latino), or Two or More Races (Non-Hispanic Or Latino)?
Completed Surveys Percent
Percent in Employee Population
Yes 173 4.2% 4.2%
No 3431 84.2% 95.8%
Prefer not to Answer 471 11.6%
Total 4,075
Employee Engagement Survey Results - 2021 9
Table 6 Management Level
Management Level Completed
Surveys Percent
Percent in Employee Population
Manager/Supervisor 957 23.4% 19.9%
Not a Manager or Supervisor 2,655 64.9% 80.1%
Other 134 3.3%
Prefer not to Answer 348 8.5%
Grand Total 4,094

10 Employee Engagement Survey Results – 2021
Employee Engagement Survey Items: Summary of Key Findings
Job Duties and their Relationship to the Mission and Goals of Your Agency or Department
Table 7 displays percent agreement for all respondents to survey statements for “Job Duties and their Relationship to the Mission and Goals of your Agency or Department.” The table also shows the percent agreement for the same question in the 2019 survey and a percent change from 2019 to 2021 in agreement. Table 7 Job Duties and their Relationship to the Mission and Goals of your Agency or Department – All Respondents
90.8%
89.3%
88.0%
74.2%
73.9%
60.9%
5.9%
7.3%
8.8%
17.6%
18.2%
22.3%
3.3%
3.3%
3.2%
8.2%
7.8%
16.8%
92.5%
90.2%
89.2%
78.4%
75.1%
71.6%
-1.7%
-0.9%
-1.2%
-4.2%
-1.2%
-10.7%
Q1. I understand my job duties and responsibilities.
Q2. I understand the work, goals, and mission of my department or agency.
Q3. The work I perform is linked to my department or agency meeting itsgoals and mission.
Q4. I enjoy the performing the day to day work of my job.
Q5. The work I perform is meaningful and rewarding.
Q6. I would recommend the State of Vermont to others as a great place towork.
% Agree % Neutral % Disagree 2019 Agree % Change

11 Employee Engagement Survey Results - 2021
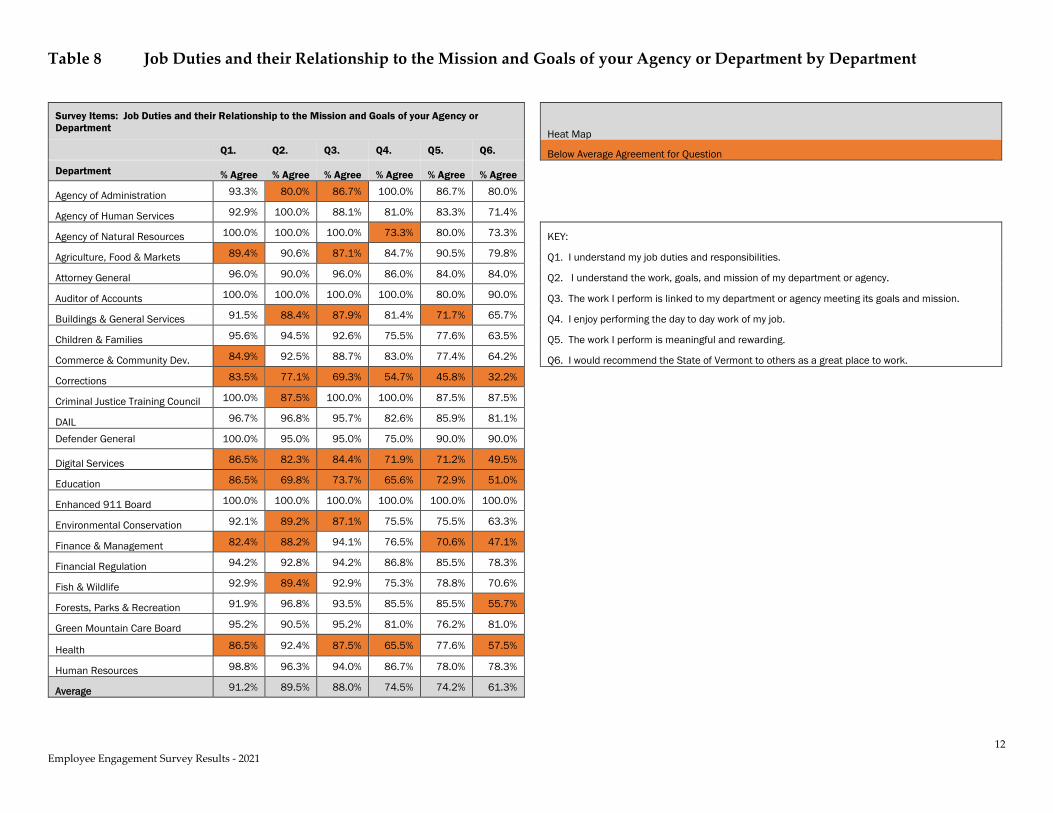
More than 90% of respondents agreed that they understand their job duties and responsibilities (90.8%). A high level of agreement was also seen when asked if they understood the work, goals, and mission of their department or agency (89.3%) and that the work they perform is linked to their department or agency meeting its goals and mission (88.0%). These all remain relatively unchanged from the 2019 survey results. To a lesser extent, respondents agreed that they enjoy performing the day-to-day work of their job (74.2%) and that the work they perform is meaningful and rewarding (73.9%). Again, these remain relatively unchanged from the 2019 survey results. The lowest agreement was found among all respondents when asked if they would recommend the State of Vermont to others as a great place to work (60.9%). This is a substantial drop (-10.7%) in agreement compared to that found in the 2019 survey (71.6%). Table 8 displays percent agreement for respondents by department to survey statements for “Job Duties and their Relationship to the Mission and Goals of your Agency or Department.” A “heat map” of responses is used to visually represent levels of agreement that are below the average for that question. This is a visual tool to make cross department comparisons.
12 Employee Engagement Survey Results - 2021
Table 8 Job Duties and their Relationship to the Mission and Goals of your Agency or Department by Department
Survey Items: Job Duties and their Relationship to the Mission and Goals of your Agency or Department
Heat Map Q1. Q2. Q3. Q4. Q5. Q6. Below Average Agreement for Question Department % Agree % Agree % Agree % Agree % Agree % Agree Agency of Administration 93.3% 80.0% 86.7% 100.0% 86.7% 80.0% Agency of Human Services 92.9% 100.0% 88.1% 81.0% 83.3% 71.4% Agency of Natural Resources 100.0% 100.0% 100.0% 73.3% 80.0% 73.3% KEY:
Agriculture, Food & Markets 89.4% 90.6% 87.1% 84.7% 90.5% 79.8% Q1. I understand my job duties and responsibilities.
Attorney General 96.0% 90.0% 96.0% 86.0% 84.0% 84.0% Q2. I understand the work, goals, and mission of my department or agency.
Auditor of Accounts 100.0% 100.0% 100.0% 100.0% 80.0% 90.0% Q3. The work I perform is linked to my department or agency meeting its goals and mission.
Buildings & General Services 91.5% 88.4% 87.9% 81.4% 71.7% 65.7% Q4. I enjoy performing the day to day work of my job.
Children & Families 95.6% 94.5% 92.6% 75.5% 77.6% 63.5% Q5. The work I perform is meaningful and rewarding.
Commerce & Community Dev. 84.9% 92.5% 88.7% 83.0% 77.4% 64.2% Q6. I would recommend the State of Vermont to others as a great place to work.
Corrections 83.5% 77.1% 69.3% 54.7% 45.8% 32.2% Criminal Justice Training Council 100.0% 87.5% 100.0% 100.0% 87.5% 87.5% DAIL 96.7% 96.8% 95.7% 82.6% 85.9% 81.1% Defender General 100.0% 95.0% 95.0% 75.0% 90.0% 90.0% Digital Services 86.5% 82.3% 84.4% 71.9% 71.2% 49.5% Education 86.5% 69.8% 73.7% 65.6% 72.9% 51.0% Enhanced 911 Board 100.0% 100.0% 100.0% 100.0% 100.0% 100.0% Environmental Conservation 92.1% 89.2% 87.1% 75.5% 75.5% 63.3% Finance & Management 82.4% 88.2% 94.1% 76.5% 70.6% 47.1% Financial Regulation 94.2% 92.8% 94.2% 86.8% 85.5% 78.3% Fish & Wildlife 92.9% 89.4% 92.9% 75.3% 78.8% 70.6% Forests, Parks & Recreation 91.9% 96.8% 93.5% 85.5% 85.5% 55.7% Green Mountain Care Board 95.2% 90.5% 95.2% 81.0% 76.2% 81.0% Health 86.5% 92.4% 87.5% 65.5% 77.6% 57.5% Human Resources 98.8% 96.3% 94.0% 86.7% 78.0% 78.3% Average 91.2% 89.5% 88.0% 74.5% 74.2% 61.3%
13 Employee Engagement Survey Results - 2021
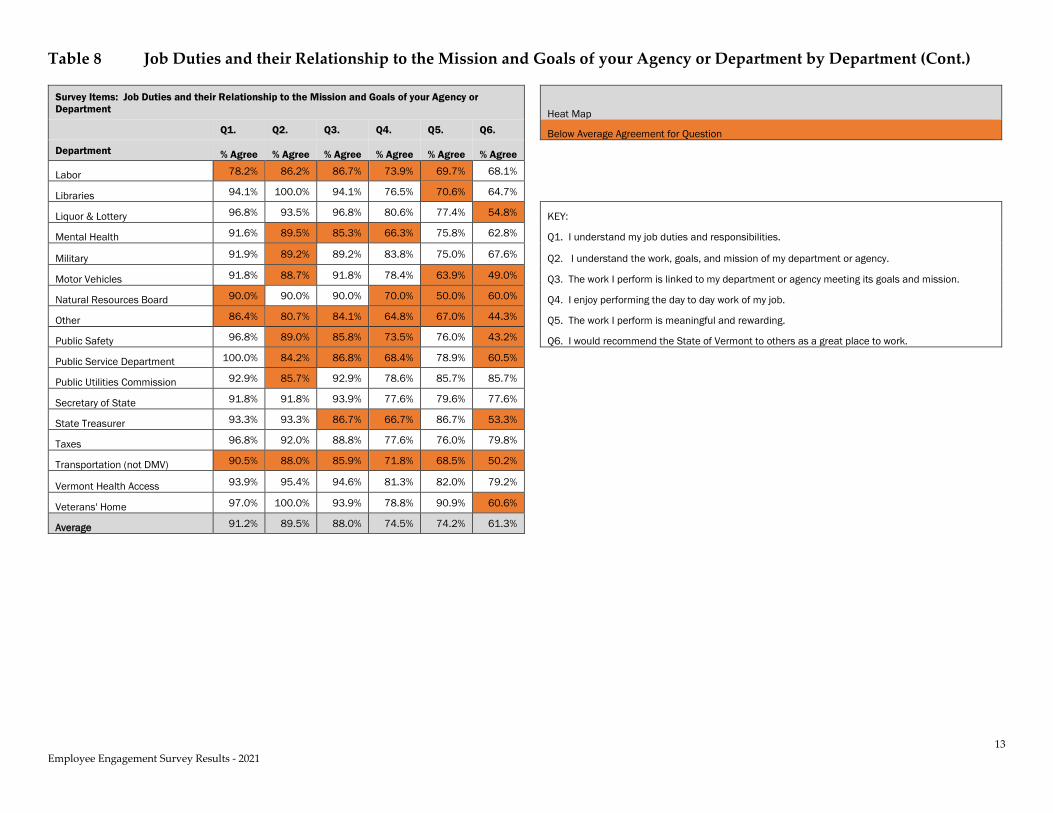
Table 8 Job Duties and their Relationship to the Mission and Goals of your Agency or Department by Department (Cont.)
Survey Items: Job Duties and their Relationship to the Mission and Goals of your Agency or Department
Heat Map Q1. Q2. Q3. Q4. Q5. Q6. Below Average Agreement for Question Department % Agree % Agree % Agree % Agree % Agree % Agree Labor 78.2% 86.2% 86.7% 73.9% 69.7% 68.1% Libraries 94.1% 100.0% 94.1% 76.5% 70.6% 64.7% Liquor & Lottery 96.8% 93.5% 96.8% 80.6% 77.4% 54.8% KEY:
Mental Health 91.6% 89.5% 85.3% 66.3% 75.8% 62.8% Q1. I understand my job duties and responsibilities.
Military 91.9% 89.2% 89.2% 83.8% 75.0% 67.6% Q2. I understand the work, goals, and mission of my department or agency.
Motor Vehicles 91.8% 88.7% 91.8% 78.4% 63.9% 49.0% Q3. The work I perform is linked to my department or agency meeting its goals and mission.
Natural Resources Board 90.0% 90.0% 90.0% 70.0% 50.0% 60.0% Q4. I enjoy performing the day to day work of my job.
Other 86.4% 80.7% 84.1% 64.8% 67.0% 44.3% Q5. The work I perform is meaningful and rewarding.
Public Safety 96.8% 89.0% 85.8% 73.5% 76.0% 43.2% Q6. I would recommend the State of Vermont to others as a great place to work.
Public Service Department 100.0% 84.2% 86.8% 68.4% 78.9% 60.5% Public Utilities Commission 92.9% 85.7% 92.9% 78.6% 85.7% 85.7% Secretary of State 91.8% 91.8% 93.9% 77.6% 79.6% 77.6% State Treasurer 93.3% 93.3% 86.7% 66.7% 86.7% 53.3% Taxes 96.8% 92.0% 88.8% 77.6% 76.0% 79.8% Transportation (not DMV) 90.5% 88.0% 85.9% 71.8% 68.5% 50.2% Vermont Health Access 93.9% 95.4% 94.6% 81.3% 82.0% 79.2% Veterans' Home 97.0% 100.0% 93.9% 78.8% 90.9% 60.6% Average 91.2% 89.5% 88.0% 74.5% 74.2% 61.3%
14 Employee Engagement Survey Results - 2021
Communication and Input within your Organization
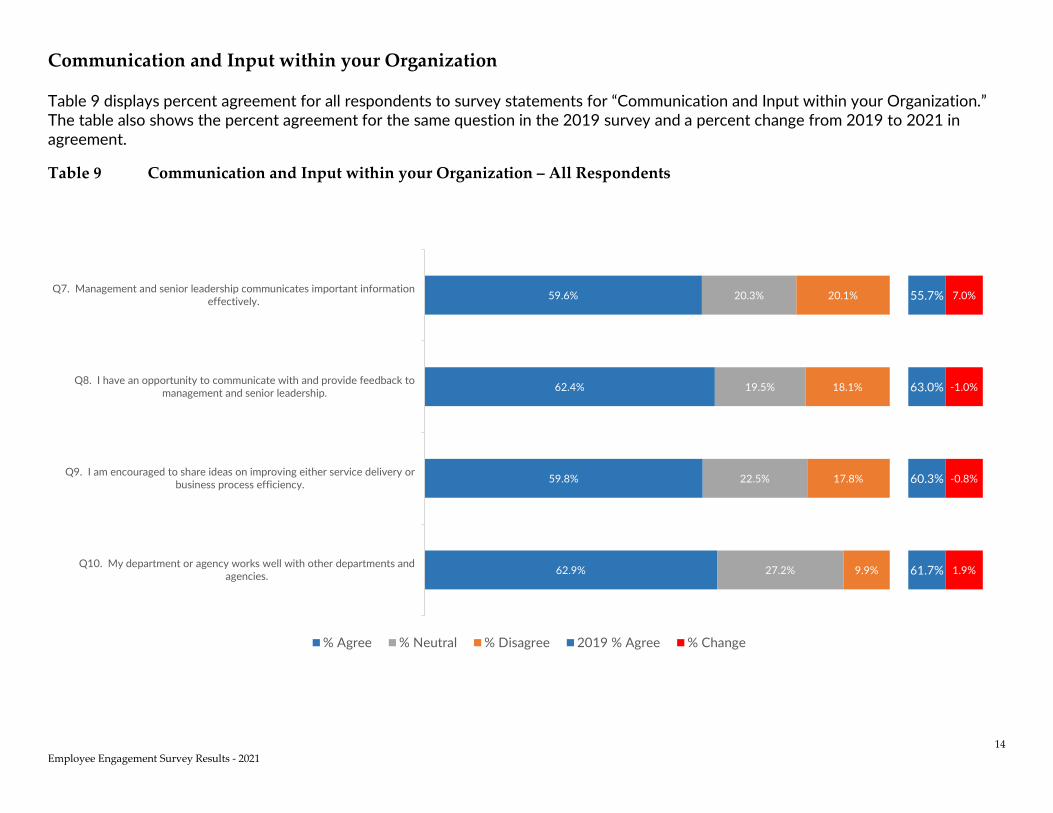
Table 9 displays percent agreement for all respondents to survey statements for “Communication and Input within your Organization.” The table also shows the percent agreement for the same question in the 2019 survey and a percent change from 2019 to 2021 in agreement.
Table 9 Communication and Input within your Organization – All Respondents
59.6%
62.4%
59.8%
62.9%
20.3%
19.5%
22.5%
27.2%
20.1%
18.1%
17.8%
9.9%
55.7%
63.0%
60.3%
61.7%
7.0%
-1.0%
-0.8%
1.9%
Q7. Management and senior leadership communicates important informationeffectively.
Q8. I have an opportunity to communicate with and provide feedback tomanagement and senior leadership.
Q9. I am encouraged to share ideas on improving either service delivery orbusiness process efficiency.
Q10. My department or agency works well with other departments andagencies.
% Agree % Neutral % Disagree 2019 % Agree % Change
15 Employee Engagement Survey Results - 2021
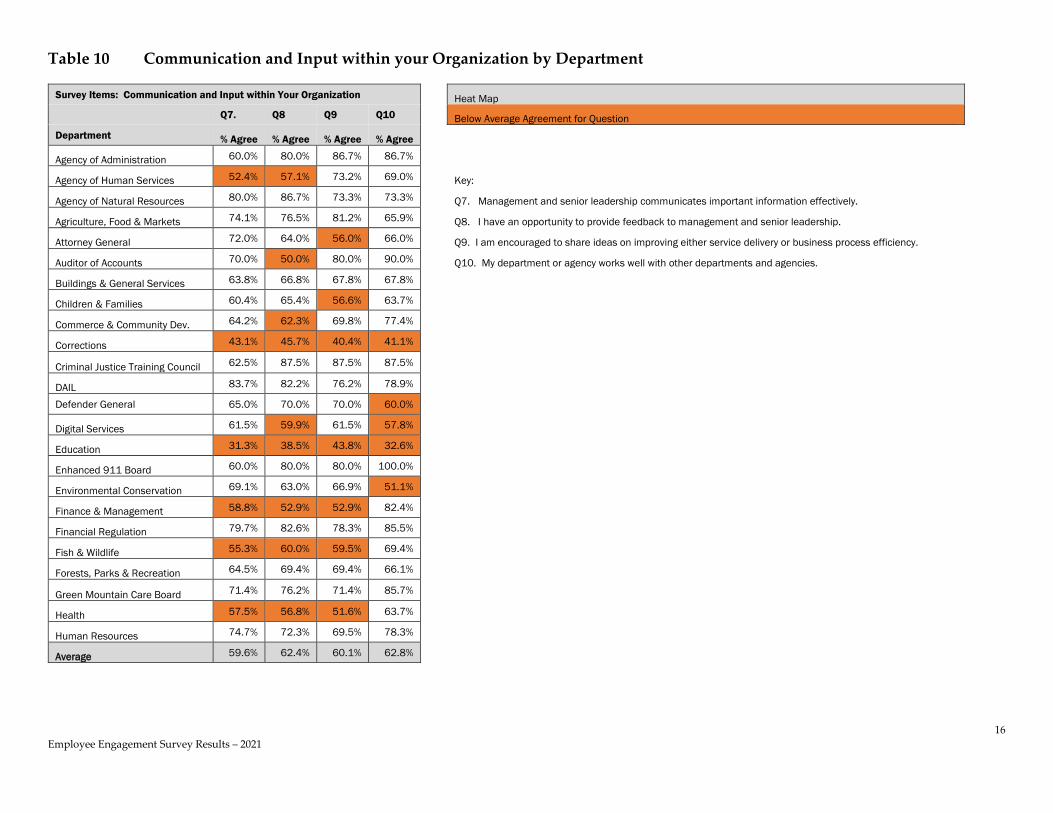
Nearly 60% (59.6%) of respondents agreed that management and senior leadership communicates important information in an effective manner. This is a modest increase (7.0%) over the 2019 survey response agreement. More respondents felt they had an opportunity to communicate with and provide feedback to management and senior leadership (62.4%), were encouraged to share ideas on improving either service delivery or business process efficiency (59.8%), and that their department or agency works well with other departments and agencies (62.9%). These all remain relatively unchanged from the 2019 survey results. Table 10 displays percent agreement for respondents by department to survey statements for “Communication and Input within your Organization.” A “heat map” of responses is used to visually represent levels of agreement that are below the average for that question. This is a visual tool to make cross department comparisons.
16 Employee Engagement Survey Results – 2021
Table 10 Communication and Input within your Organization by Department
Survey Items: Communication and Input within Your Organization Heat Map Q7. Q8 Q9 Q10 Below Average Agreement for Question Department % Agree % Agree % Agree % Agree Agency of Administration 60.0% 80.0% 86.7% 86.7% Agency of Human Services 52.4% 57.1% 73.2% 69.0% Key:
Agency of Natural Resources 80.0% 86.7% 73.3% 73.3% Q7. Management and senior leadership communicates important information effectively.
Agriculture, Food & Markets 74.1% 76.5% 81.2% 65.9% Q8. I have an opportunity to provide feedback to management and senior leadership.
Attorney General 72.0% 64.0% 56.0% 66.0% Q9. I am encouraged to share ideas on improving either service delivery or business process efficiency.
Auditor of Accounts 70.0% 50.0% 80.0% 90.0% Q10. My department or agency works well with other departments and agencies.
Buildings & General Services 63.8% 66.8% 67.8% 67.8% Children & Families 60.4% 65.4% 56.6% 63.7% Commerce & Community Dev. 64.2% 62.3% 69.8% 77.4% Corrections 43.1% 45.7% 40.4% 41.1% Criminal Justice Training Council 62.5% 87.5% 87.5% 87.5% DAIL 83.7% 82.2% 76.2% 78.9% Defender General 65.0% 70.0% 70.0% 60.0% Digital Services 61.5% 59.9% 61.5% 57.8% Education 31.3% 38.5% 43.8% 32.6% Enhanced 911 Board 60.0% 80.0% 80.0% 100.0% Environmental Conservation 69.1% 63.0% 66.9% 51.1% Finance & Management 58.8% 52.9% 52.9% 82.4% Financial Regulation 79.7% 82.6% 78.3% 85.5% Fish & Wildlife 55.3% 60.0% 59.5% 69.4% Forests, Parks & Recreation 64.5% 69.4% 69.4% 66.1% Green Mountain Care Board 71.4% 76.2% 71.4% 85.7% Health 57.5% 56.8% 51.6% 63.7% Human Resources 74.7% 72.3% 69.5% 78.3% Average 59.6% 62.4% 60.1% 62.8%
17 Employee Engagement Survey Results - 2021
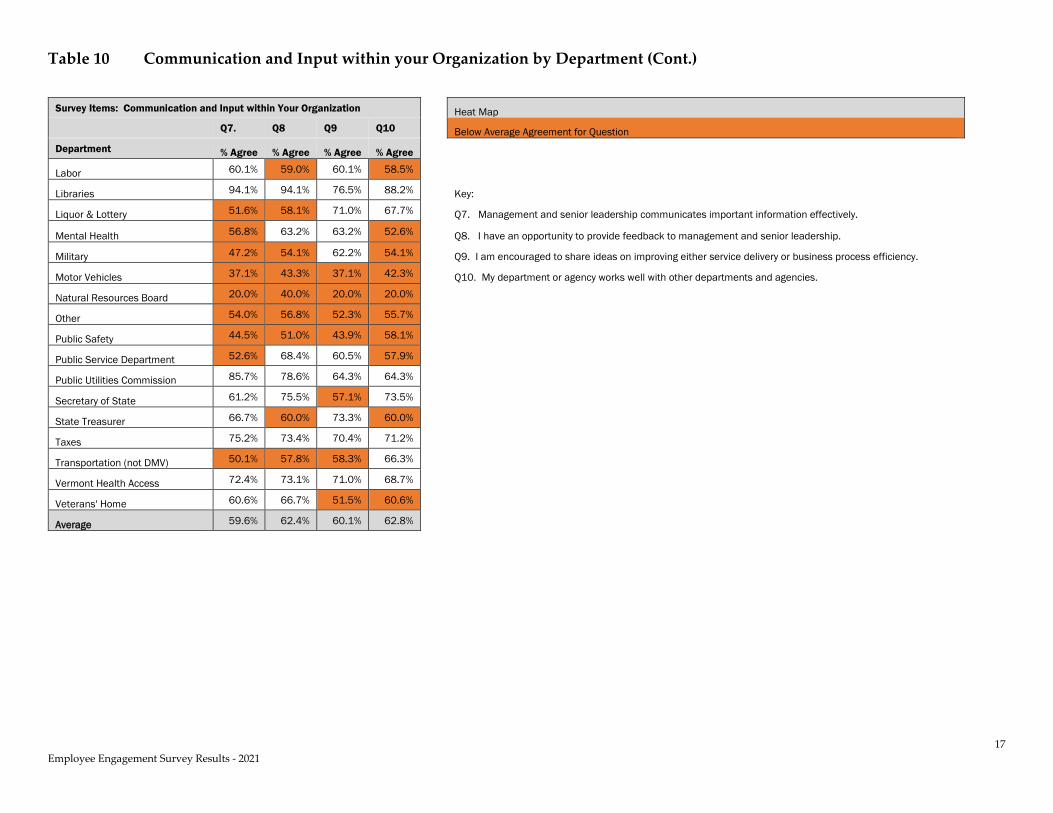
Table 10 Communication and Input within your Organization by Department (Cont.)
Survey Items: Communication and Input within Your Organization Heat Map Q7. Q8 Q9 Q10 Below Average Agreement for Question Department % Agree % Agree % Agree % Agree Labor 60.1% 59.0% 60.1% 58.5% Libraries 94.1% 94.1% 76.5% 88.2% Key:
Liquor & Lottery 51.6% 58.1% 71.0% 67.7% Q7. Management and senior leadership communicates important information effectively.
Mental Health 56.8% 63.2% 63.2% 52.6% Q8. I have an opportunity to provide feedback to management and senior leadership.
Military 47.2% 54.1% 62.2% 54.1% Q9. I am encouraged to share ideas on improving either service delivery or business process efficiency.
Motor Vehicles 37.1% 43.3% 37.1% 42.3% Q10. My department or agency works well with other departments and agencies.
Natural Resources Board 20.0% 40.0% 20.0% 20.0% Other 54.0% 56.8% 52.3% 55.7% Public Safety 44.5% 51.0% 43.9% 58.1% Public Service Department 52.6% 68.4% 60.5% 57.9% Public Utilities Commission 85.7% 78.6% 64.3% 64.3% Secretary of State 61.2% 75.5% 57.1% 73.5% State Treasurer 66.7% 60.0% 73.3% 60.0% Taxes 75.2% 73.4% 70.4% 71.2% Transportation (not DMV) 50.1% 57.8% 58.3% 66.3% Vermont Health Access 72.4% 73.1% 71.0% 68.7% Veterans' Home 60.6% 66.7% 51.5% 60.6% Average 59.6% 62.4% 60.1% 62.8%
18 Employee Engagement Survey Results - 2021
Relationships and Morale in your Organization
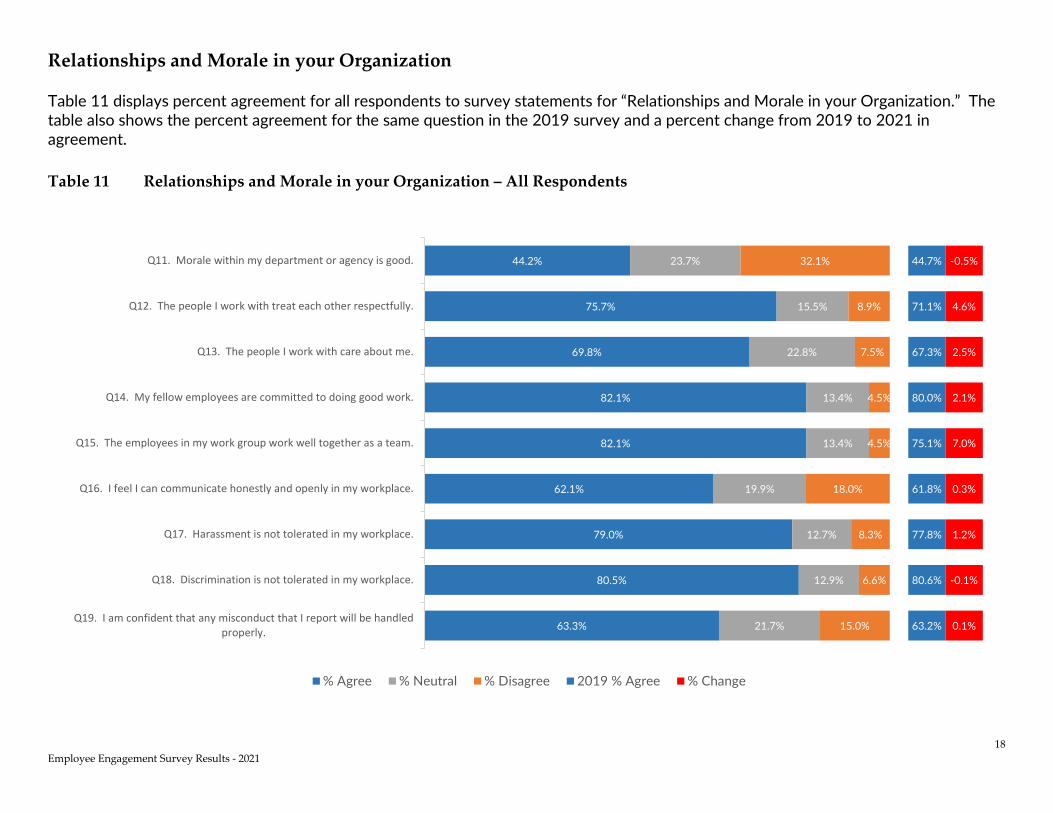
Table 11 displays percent agreement for all respondents to survey statements for “Relationships and Morale in your Organization.” The table also shows the percent agreement for the same question in the 2019 survey and a percent change from 2019 to 2021 in agreement. Table 11 Relationships and Morale in your Organization – All Respondents
44.2%
75.7%
69.8%
82.1%
82.1%
62.1%
79.0%
80.5%
63.3%
23.7%
15.5%
22.8%
13.4%
13.4%
19.9%
12.7%
12.9%
21.7%
32.1%
8.9%
7.5%
4.5%
4.5%
18.0%
8.3%
6.6%
15.0%
44.7%
71.1%
67.3%
80.0%
75.1%
61.8%
77.8%
80.6%
63.2%
-0.5%
4.6%
2.5%
2.1%
7.0%
0.3%
1.2%
-0.1%
0.1%
Q11. Morale within my department or agency is good.
Q12. The people I work with treat each other respectfully.
Q13. The people I work with care about me.
Q14. My fellow employees are committed to doing good work.
Q15. The employees in my work group work well together as a team.
Q16. I feel I can communicate honestly and openly in my workplace.
Q17. Harassment is not tolerated in my workplace.
Q18. Discrimination is not tolerated in my workplace.
Q19. I am confident that any misconduct that I report will be handledproperly.
% Agree % Neutral % Disagree 2019 % Agree % Change
19 Employee Engagement Survey Results - 2021
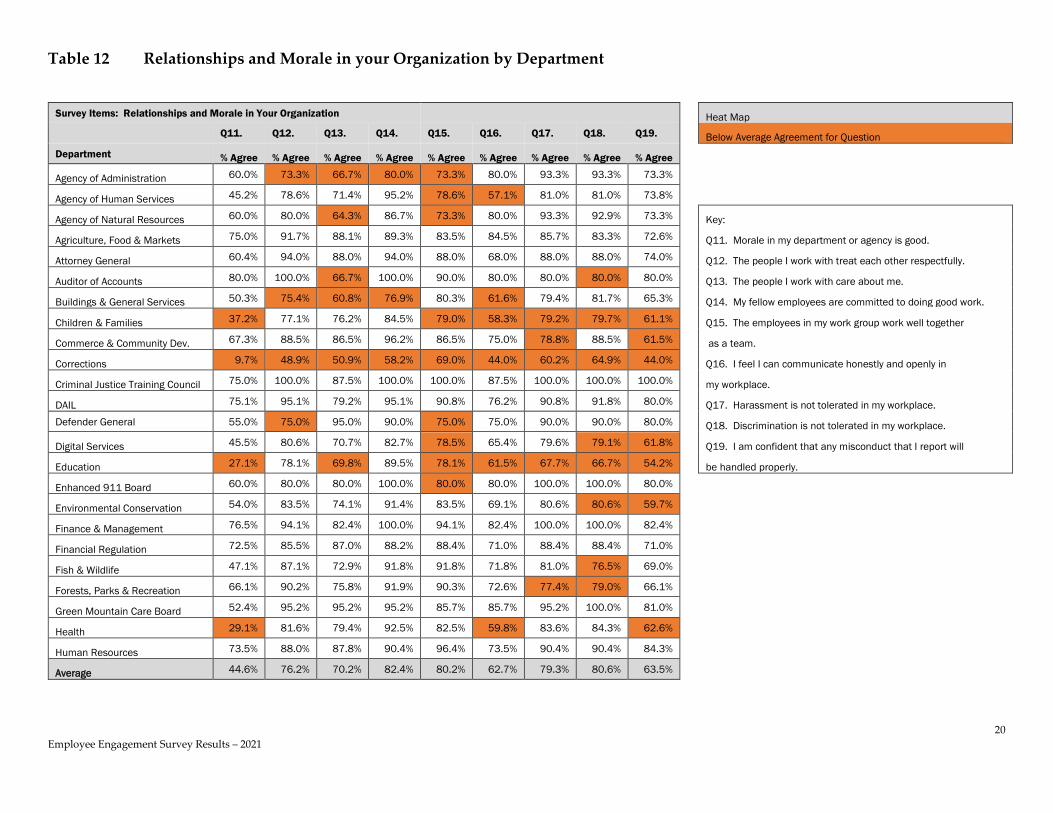
Less than half of respondents agreed that morale within their department or agency is good (44.2%); almost a third disagreed (32.1%). Over 70% of all respondents agreed that the people they work with treat each other respectfully (75.7%) and to a slightly lesser extent that the people they work with care about them (69.8%). These both showed small increases over agreement found in the 2019 survey. 82.1% agreed that their fellow employees are committed to doing good and that employees in their work group work well together as a team. The latter showed a modest increase (7.0%) over the 2019 survey response agreement. A little over 60% of respondents felt they can communicate honestly and openly in their workplace (62.1%), which had a relatively high percent disagreeing with the statement (18.0%). More than three out of four of all respondents agreed that harassment is not tolerated in their workplace (79.0%) and discrimination is not tolerated in their workplace (80.5%). Fewer respondents agreed that they were confident that any misconduct that they report will be handled properly (63.3%), which had a relatively high percent disagreeing with the statement (15.0%). All these questions showed little change in agreement from the 2019 survey results. Table 12 displays percent agreement for respondents by department to survey statements for “Relationships and Morale in your Organization.” A “heat map” of responses is used to visually represent levels of agreement that are below the average for that question. This is a visual tool to make cross department comparisons.
20 Employee Engagement Survey Results – 2021
Table 12 Relationships and Morale in your Organization by Department
Survey Items: Relationships and Morale in Your Organization Heat Map Q11. Q12. Q13. Q14. Q15. Q16. Q17. Q18. Q19. Below Average Agreement for Question Department % Agree % Agree % Agree % Agree % Agree % Agree % Agree % Agree % Agree Agency of Administration 60.0% 73.3% 66.7% 80.0% 73.3% 80.0% 93.3% 93.3% 73.3% Agency of Human Services 45.2% 78.6% 71.4% 95.2% 78.6% 57.1% 81.0% 81.0% 73.8% Agency of Natural Resources 60.0% 80.0% 64.3% 86.7% 73.3% 80.0% 93.3% 92.9% 73.3% Key:
Agriculture, Food & Markets 75.0% 91.7% 88.1% 89.3% 83.5% 84.5% 85.7% 83.3% 72.6% Q11. Morale in my department or agency is good.
Attorney General 60.4% 94.0% 88.0% 94.0% 88.0% 68.0% 88.0% 88.0% 74.0% Q12. The people I work with treat each other respectfully.
Auditor of Accounts 80.0% 100.0% 66.7% 100.0% 90.0% 80.0% 80.0% 80.0% 80.0% Q13. The people I work with care about me.
Buildings & General Services 50.3% 75.4% 60.8% 76.9% 80.3% 61.6% 79.4% 81.7% 65.3% Q14. My fellow employees are committed to doing good work.
Children & Families 37.2% 77.1% 76.2% 84.5% 79.0% 58.3% 79.2% 79.7% 61.1% Q15. The employees in my work group work well together
Commerce & Community Dev. 67.3% 88.5% 86.5% 96.2% 86.5% 75.0% 78.8% 88.5% 61.5% as a team.
Corrections 9.7% 48.9% 50.9% 58.2% 69.0% 44.0% 60.2% 64.9% 44.0% Q16. I feel I can communicate honestly and openly in
Criminal Justice Training Council 75.0% 100.0% 87.5% 100.0% 100.0% 87.5% 100.0% 100.0% 100.0% my workplace.
DAIL 75.1% 95.1% 79.2% 95.1% 90.8% 76.2% 90.8% 91.8% 80.0% Q17. Harassment is not tolerated in my workplace. Defender General 55.0% 75.0% 95.0% 90.0% 75.0% 75.0% 90.0% 90.0% 80.0% Q18. Discrimination is not tolerated in my workplace.
Digital Services 45.5% 80.6% 70.7% 82.7% 78.5% 65.4% 79.6% 79.1% 61.8% Q19. I am confident that any misconduct that I report will
Education 27.1% 78.1% 69.8% 89.5% 78.1% 61.5% 67.7% 66.7% 54.2% be handled properly.
Enhanced 911 Board 60.0% 80.0% 80.0% 100.0% 80.0% 80.0% 100.0% 100.0% 80.0% Environmental Conservation 54.0% 83.5% 74.1% 91.4% 83.5% 69.1% 80.6% 80.6% 59.7% Finance & Management 76.5% 94.1% 82.4% 100.0% 94.1% 82.4% 100.0% 100.0% 82.4% Financial Regulation 72.5% 85.5% 87.0% 88.2% 88.4% 71.0% 88.4% 88.4% 71.0% Fish & Wildlife 47.1% 87.1% 72.9% 91.8% 91.8% 71.8% 81.0% 76.5% 69.0% Forests, Parks & Recreation 66.1% 90.2% 75.8% 91.9% 90.3% 72.6% 77.4% 79.0% 66.1% Green Mountain Care Board 52.4% 95.2% 95.2% 95.2% 85.7% 85.7% 95.2% 100.0% 81.0% Health 29.1% 81.6% 79.4% 92.5% 82.5% 59.8% 83.6% 84.3% 62.6% Human Resources 73.5% 88.0% 87.8% 90.4% 96.4% 73.5% 90.4% 90.4% 84.3% Average 44.6% 76.2% 70.2% 82.4% 80.2% 62.7% 79.3% 80.6% 63.5%

21 Employee Engagement Survey Results - 2021
Table 12 Relationships and Morale in your Organization by Department (Cont.)
Survey Items: Relationships and Morale in Your Organization Heat Map Q11. Q12. Q13. Q14. Q15. Q16. Q17. Q18. Q19. Below Average Agreement for Question Department % Agree % Agree % Agree % Agree % Agree % Agree % Agree % Agree % Agree Labor 44.7% 74.3% 69.1% 77.7% 74.5% 55.9% 74.5% 76.5% 60.6% Libraries 82.4% 94.1% 76.5% 100.0% 94.1% 70.6% 94.1% 94.1% 76.5% Liquor & Lottery 41.9% 74.2% 63.3% 83.9% 80.6% 61.3% 83.9% 96.8% 74.2% Key:
Mental Health 38.9% 64.2% 63.8% 80.0% 76.8% 57.9% 70.5% 78.9% 57.9% Q11. Morale in my department or agency is good.
Military 54.1% 62.2% 51.4% 63.9% 67.6% 64.9% 75.7% 75.7% 54.3% Q12. The people I work with treat each other respectfully.
Motor Vehicles 23.7% 61.9% 57.9% 64.9% 74.2% 41.2% 75.3% 81.4% 48.5% Q13. The people I work with care about me.
Natural Resources Board 0.0% 70.0% 80.0% 70.0% 80.0% 30.0% 70.0% 70.0% 40.0% Q14. My fellow employees are committed to doing good work.
Other 34.1% 61.4% 60.2% 79.5% 72.7% 55.7% 70.1% 71.6% 53.4% Q15. The employees in my work group work well together
Public Safety 25.8% 72.7% 69.7% 81.2% 82.6% 54.8% 81.3% 80.0% 61.3% as a team.
Public Service Department 34.2% 81.6% 68.4% 89.5% 84.2% 65.8% 76.3% 81.6% 63.2% Q16. I feel I can communicate honestly and openly in
Public Utilities Commission 50.0% 71.4% 71.4% 85.7% 71.4% 50.0% 64.3% 57.1% 35.7% my workplace.
Secretary of State 51.0% 77.6% 67.3% 83.7% 69.4% 59.2% 87.8% 91.8% 81.6% Q17. Harassment is not tolerated in my workplace.
State Treasurer 33.3% 100.0% 93.3% 93.3% 100.0% 66.7% 93.3% 100.0% 86.7% Q18. Discrimination is not tolerated in my workplace.
Taxes 61.6% 76.8% 68.0% 83.2% 81.6% 71.2% 84.0% 81.5% 78.4% Q19. I am confident that any misconduct that I report will
Transportation (not DMV) 38.2% 72.8% 62.7% 75.8% 76.2% 63.4% 80.9% 80.9% 61.6% be handled properly.
Vermont Health Access 66.0% 77.4% 71.4% 84.2% 85.1% 69.8% 78.8% 81.6% 67.6% Veterans' Home 30.3% 30.3% 36.4% 63.6% 60.6% 45.5% 60.6% 69.7% 45.5% Average 44.6% 76.2% 70.2% 82.4% 80.2% 62.7% 79.3% 80.6% 63.5%
22 Employee Engagement Survey Results – 2021
Your Supervisor
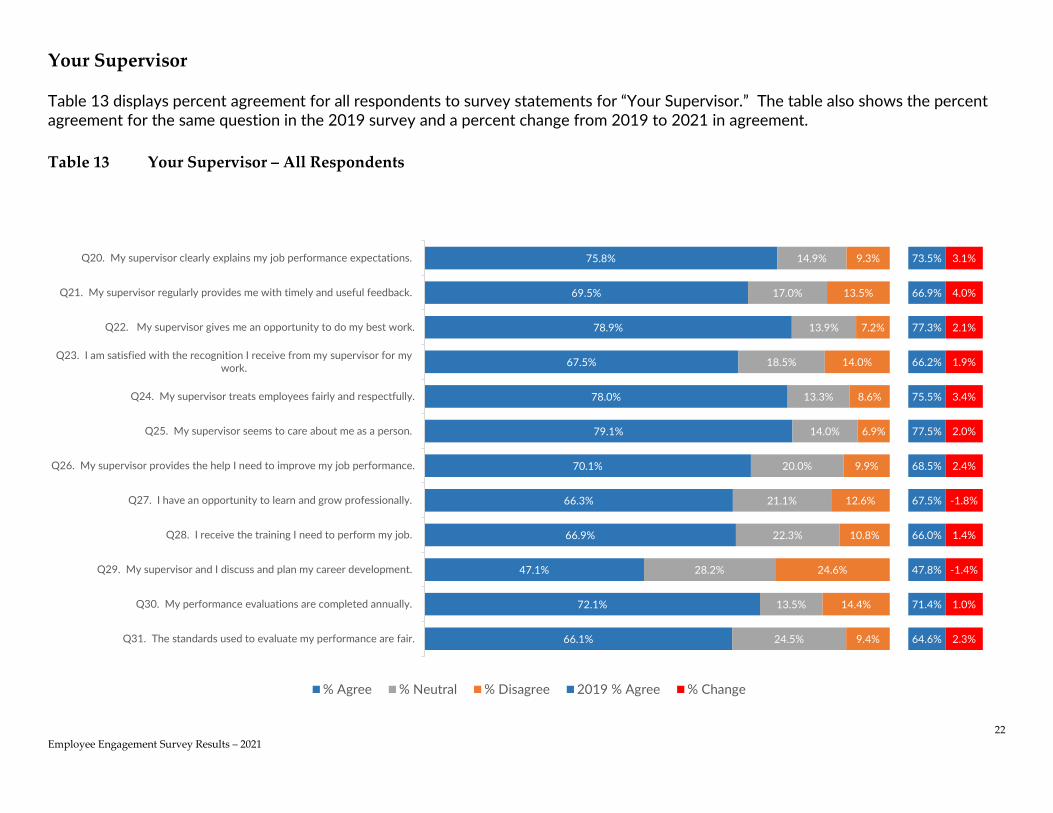
Table 13 displays percent agreement for all respondents to survey statements for “Your Supervisor.” The table also shows the percent agreement for the same question in the 2019 survey and a percent change from 2019 to 2021 in agreement. Table 13 Your Supervisor – All Respondents
75.8%
69.5%
78.9%
67.5%
78.0%
79.1%
70.1%
66.3%
66.9%
47.1%
72.1%
66.1%
14.9%
17.0%
13.9%
18.5%
13.3%
14.0%
20.0%
21.1%
22.3%
28.2%
13.5%
24.5%
9.3%
13.5%
7.2%
14.0%
8.6%
6.9%
9.9%
12.6%
10.8%
24.6%
14.4%
9.4%
73.5%
66.9%
77.3%
66.2%
75.5%
77.5%
68.5%
67.5%
66.0%
47.8%
71.4%
64.6%
3.1%
4.0%
2.1%
1.9%
3.4%
2.0%
2.4%
-1.8%
1.4%
-1.4%
1.0%
2.3%
Q20. My supervisor clearly explains my job performance expectations.
Q21. My supervisor regularly provides me with timely and useful feedback.
Q22. My supervisor gives me an opportunity to do my best work.
Q23. I am satisfied with the recognition I receive from my supervisor for mywork.
Q24. My supervisor treats employees fairly and respectfully.
Q25. My supervisor seems to care about me as a person.
Q26. My supervisor provides the help I need to improve my job performance.
Q27. I have an opportunity to learn and grow professionally.
Q28. I receive the training I need to perform my job.
Q29. My supervisor and I discuss and plan my career development.
Q30. My performance evaluations are completed annually.
Q31. The standards used to evaluate my performance are fair.
% Agree % Neutral % Disagree 2019 % Agree % Change
23 Employee Engagement Survey Results - 2021
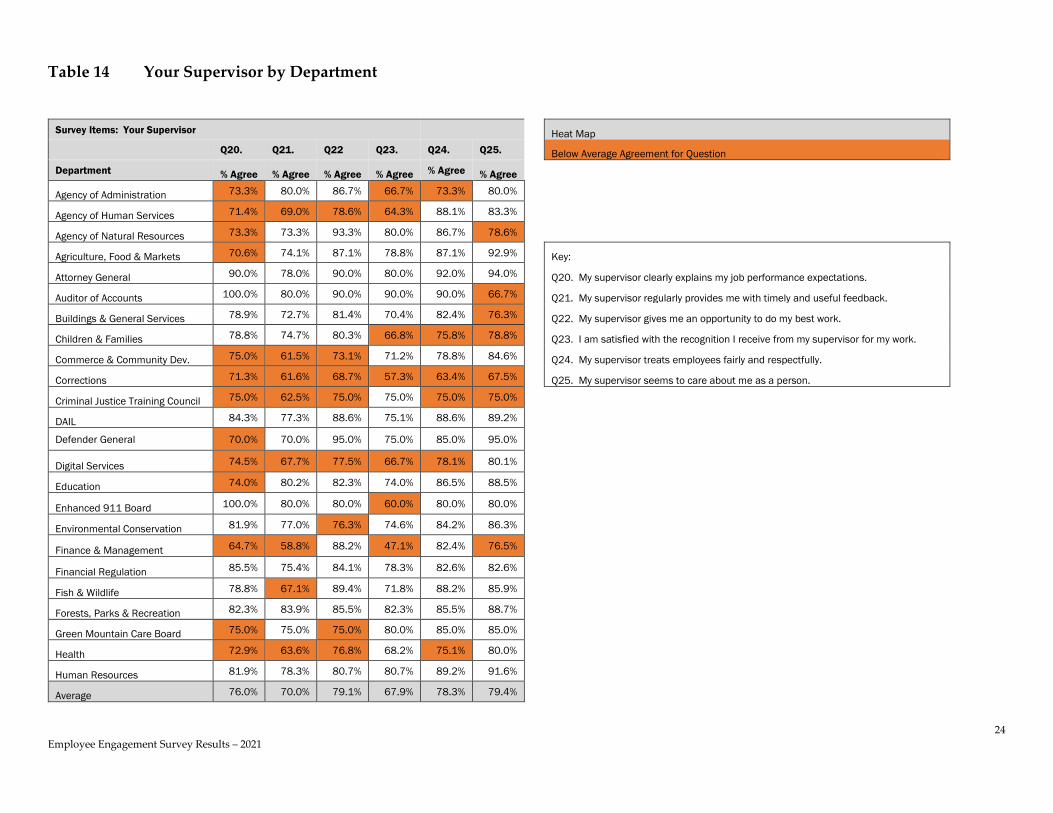
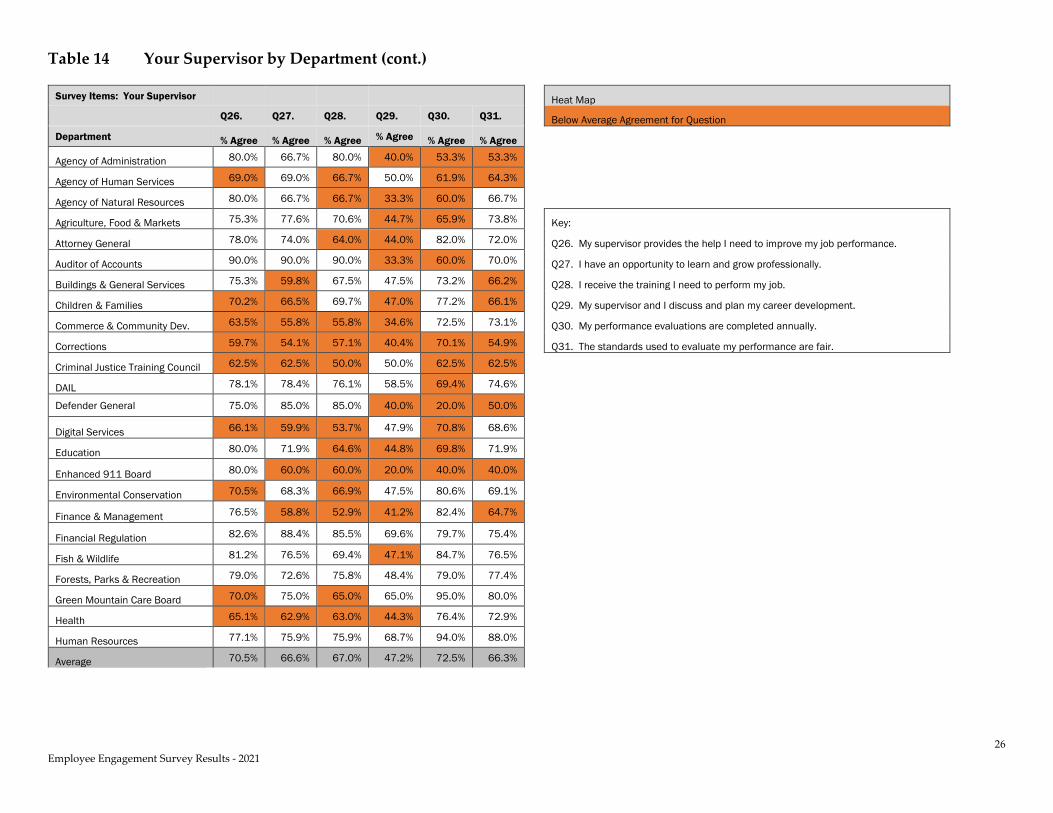
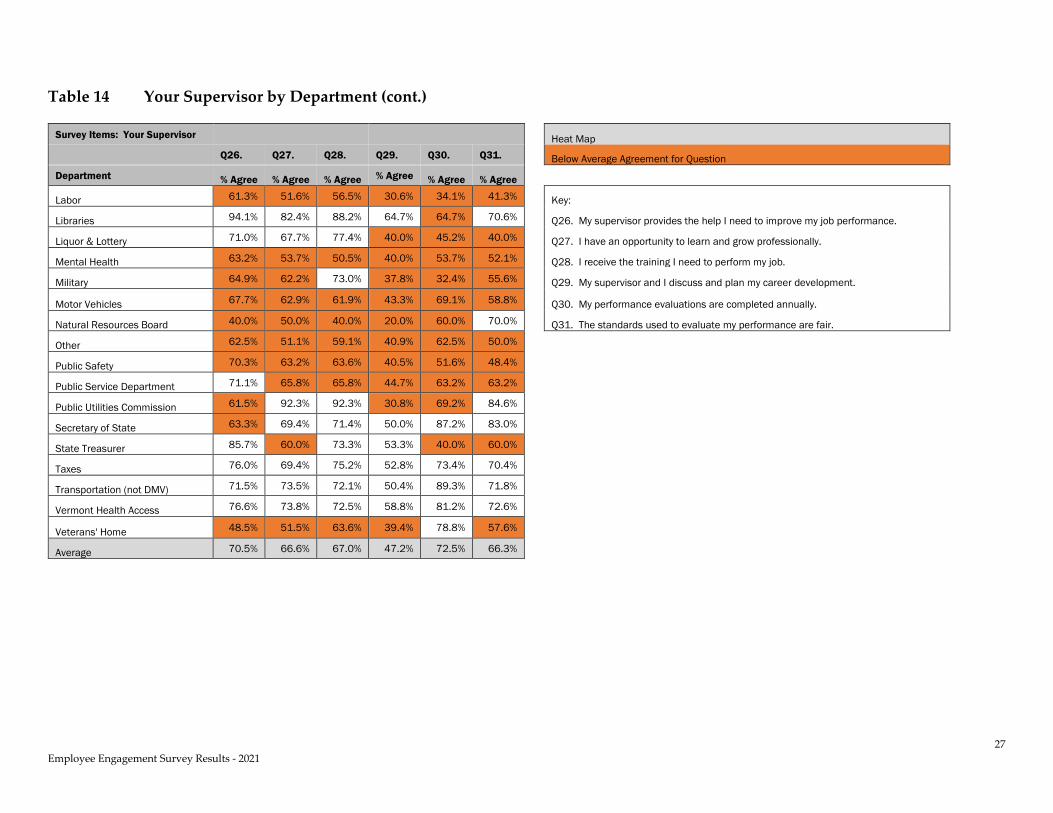
On average, approximately 70% agreed to the range of statements regarding their supervisor (Q20 – Q26), but with relatively high levels of “neutral” and “disagree” responses (on average 30%), which shows that these supervisory items have variability based on other factors, such as across departments. All these questions showed a slight but consistent increase over the 2019 survey results. The lowest agreement among all respondents was when asked if their supervisor discussed and planned their career development with them (47.1%). For all respondents, 72.1% agreed that their performance evaluations are completed annually. To a lesser extent, respondents agreed that the standards used to evaluate their performance were fair (66.1%), with a high level of “neutral” (24.5%), which shows respondents’ ambivalence about this statement. These showed little change in agreement from the results of the 2019 survey. Table 14 displays percent agreement for respondents by department to survey statements for “Your Supervisor.” A “heat map” of responses is used to visually represent levels of agreement that are below the average for that question. This is a visual tool to make cross department comparisons.
24 Employee Engagement Survey Results – 2021
Table 14 Your Supervisor by Department
Survey Items: Your Supervisor Heat Map Q20. Q21. Q22 Q23. Q24. Q25. Below Average Agreement for Question Department % Agree % Agree % Agree % Agree % Agree % Agree Agency of Administration 73.3% 80.0% 86.7% 66.7% 73.3% 80.0% Agency of Human Services 71.4% 69.0% 78.6% 64.3% 88.1% 83.3% Agency of Natural Resources 73.3% 73.3% 93.3% 80.0% 86.7% 78.6% Agriculture, Food & Markets 70.6% 74.1% 87.1% 78.8% 87.1% 92.9% Key:
Attorney General 90.0% 78.0% 90.0% 80.0% 92.0% 94.0% Q20. My supervisor clearly explains my job performance expectations.
Auditor of Accounts 100.0% 80.0% 90.0% 90.0% 90.0% 66.7% Q21. My supervisor regularly provides me with timely and useful feedback.
Buildings & General Services 78.9% 72.7% 81.4% 70.4% 82.4% 76.3% Q22. My supervisor gives me an opportunity to do my best work.
Children & Families 78.8% 74.7% 80.3% 66.8% 75.8% 78.8% Q23. I am satisfied with the recognition I receive from my supervisor for my work.
Commerce & Community Dev. 75.0% 61.5% 73.1% 71.2% 78.8% 84.6% Q24. My supervisor treats employees fairly and respectfully.
Corrections 71.3% 61.6% 68.7% 57.3% 63.4% 67.5% Q25. My supervisor seems to care about me as a person.
Criminal Justice Training Council 75.0% 62.5% 75.0% 75.0% 75.0% 75.0% DAIL 84.3% 77.3% 88.6% 75.1% 88.6% 89.2% Defender General 70.0% 70.0% 95.0% 75.0% 85.0% 95.0%
Digital Services 74.5% 67.7% 77.5% 66.7% 78.1% 80.1% Education 74.0% 80.2% 82.3% 74.0% 86.5% 88.5% Enhanced 911 Board 100.0% 80.0% 80.0% 60.0% 80.0% 80.0% Environmental Conservation 81.9% 77.0% 76.3% 74.6% 84.2% 86.3% Finance & Management 64.7% 58.8% 88.2% 47.1% 82.4% 76.5% Financial Regulation 85.5% 75.4% 84.1% 78.3% 82.6% 82.6% Fish & Wildlife 78.8% 67.1% 89.4% 71.8% 88.2% 85.9% Forests, Parks & Recreation 82.3% 83.9% 85.5% 82.3% 85.5% 88.7% Green Mountain Care Board 75.0% 75.0% 75.0% 80.0% 85.0% 85.0% Health 72.9% 63.6% 76.8% 68.2% 75.1% 80.0% Human Resources 81.9% 78.3% 80.7% 80.7% 89.2% 91.6% Average 76.0% 70.0% 79.1% 67.9% 78.3% 79.4%

25 Employee Engagement Survey Results - 2021
Table 14 Your Supervisor by Department (cont.)
Survey Items: Your Supervisor Heat Map Q20. Q21. Q22 Q23. Q24. Q25. Below Average Agreement for Question Department % Agree % Agree % Agree % Agree % Agree % Agree Labor 59.7% 57.0% 70.3% 57.8% 71.0% 72.0% Key:
Libraries 88.2% 88.2% 94.1% 88.2% 94.1% 88.2% Q20. My supervisor clearly explains my job performance expectations.
Liquor & Lottery 67.7% 54.8% 74.2% 61.3% 83.9% 67.7% Q21. My supervisor regularly provides me with timely and useful feedback.
Mental Health 69.5% 61.1% 70.5% 57.4% 70.5% 68.4% Q22. My supervisor gives me an opportunity to do my best work.
Military 62.2% 54.1% 73.0% 56.8% 73.0% 70.3% Q23. I am satisfied with the recognition I receive from my supervisor for my work.
Motor Vehicles 71.1% 58.8% 76.3% 57.3% 68.0% 73.2% Q24. My supervisor treats employees fairly and respectfully.
Natural Resources Board 50.0% 50.0% 50.0% 50.0% 50.0% 40.0% Q25. My supervisor seems to care about me as a person.
Other 70.5% 61.4% 61.4% 55.7% 68.2% 64.8% Public Safety 78.7% 67.7% 80.5% 66.5% 83.2% 78.1% Public Service Department 84.2% 76.3% 89.2% 68.4% 84.2% 81.6% Public Utilities Commission 84.6% 61.5% 84.6% 61.5% 53.8% 69.2% Secretary of State 72.9% 67.3% 77.6% 65.3% 75.5% 79.6% State Treasurer 86.7% 86.7% 86.7% 73.3% 80.0% 86.7% Taxes 82.3% 76.0% 80.8% 77.6% 84.7% 83.1% Transportation (not DMV) 74.4% 68.7% 81.4% 64.5% 76.2% 78.3% Vermont Health Access 81.2% 79.4% 80.9% 76.6% 84.7% 85.1% Veterans' Home 68.8% 69.7% 78.8% 45.5% 51.5% 60.6% Average 76.0% 70.0% 79.1% 67.9% 78.3% 79.4%
26 Employee Engagement Survey Results - 2021
Table 14 Your Supervisor by Department (cont.)
Survey Items: Your Supervisor Heat Map Q26. Q27. Q28. Q29. Q30. Q31. Below Average Agreement for Question Department % Agree % Agree % Agree % Agree % Agree % Agree Agency of Administration 80.0% 66.7% 80.0% 40.0% 53.3% 53.3% Agency of Human Services 69.0% 69.0% 66.7% 50.0% 61.9% 64.3% Agency of Natural Resources 80.0% 66.7% 66.7% 33.3% 60.0% 66.7% Agriculture, Food & Markets 75.3% 77.6% 70.6% 44.7% 65.9% 73.8% Key:
Attorney General 78.0% 74.0% 64.0% 44.0% 82.0% 72.0% Q26. My supervisor provides the help I need to improve my job performance.
Auditor of Accounts 90.0% 90.0% 90.0% 33.3% 60.0% 70.0% Q27. I have an opportunity to learn and grow professionally.
Buildings & General Services 75.3% 59.8% 67.5% 47.5% 73.2% 66.2% Q28. I receive the training I need to perform my job.
Children & Families 70.2% 66.5% 69.7% 47.0% 77.2% 66.1% Q29. My supervisor and I discuss and plan my career development.
Commerce & Community Dev. 63.5% 55.8% 55.8% 34.6% 72.5% 73.1% Q30. My performance evaluations are completed annually.
Corrections 59.7% 54.1% 57.1% 40.4% 70.1% 54.9% Q31. The standards used to evaluate my performance are fair.
Criminal Justice Training Council 62.5% 62.5% 50.0% 50.0% 62.5% 62.5% DAIL 78.1% 78.4% 76.1% 58.5% 69.4% 74.6% Defender General 75.0% 85.0% 85.0% 40.0% 20.0% 50.0%
Digital Services 66.1% 59.9% 53.7% 47.9% 70.8% 68.6% Education 80.0% 71.9% 64.6% 44.8% 69.8% 71.9% Enhanced 911 Board 80.0% 60.0% 60.0% 20.0% 40.0% 40.0% Environmental Conservation 70.5% 68.3% 66.9% 47.5% 80.6% 69.1% Finance & Management 76.5% 58.8% 52.9% 41.2% 82.4% 64.7% Financial Regulation 82.6% 88.4% 85.5% 69.6% 79.7% 75.4% Fish & Wildlife 81.2% 76.5% 69.4% 47.1% 84.7% 76.5% Forests, Parks & Recreation 79.0% 72.6% 75.8% 48.4% 79.0% 77.4% Green Mountain Care Board 70.0% 75.0% 65.0% 65.0% 95.0% 80.0% Health 65.1% 62.9% 63.0% 44.3% 76.4% 72.9% Human Resources 77.1% 75.9% 75.9% 68.7% 94.0% 88.0% Average 70.5% 66.6% 67.0% 47.2% 72.5% 66.3%
27 Employee Engagement Survey Results - 2021
Table 14 Your Supervisor by Department (cont.)
Survey Items: Your Supervisor Heat Map Q26. Q27. Q28. Q29. Q30. Q31. Below Average Agreement for Question Department % Agree % Agree % Agree % Agree % Agree % Agree Labor 61.3% 51.6% 56.5% 30.6% 34.1% 41.3% Key:
Libraries 94.1% 82.4% 88.2% 64.7% 64.7% 70.6% Q26. My supervisor provides the help I need to improve my job performance.
Liquor & Lottery 71.0% 67.7% 77.4% 40.0% 45.2% 40.0% Q27. I have an opportunity to learn and grow professionally.
Mental Health 63.2% 53.7% 50.5% 40.0% 53.7% 52.1% Q28. I receive the training I need to perform my job.
Military 64.9% 62.2% 73.0% 37.8% 32.4% 55.6% Q29. My supervisor and I discuss and plan my career development.
Motor Vehicles 67.7% 62.9% 61.9% 43.3% 69.1% 58.8% Q30. My performance evaluations are completed annually.
Natural Resources Board 40.0% 50.0% 40.0% 20.0% 60.0% 70.0% Q31. The standards used to evaluate my performance are fair.
Other 62.5% 51.1% 59.1% 40.9% 62.5% 50.0% Public Safety 70.3% 63.2% 63.6% 40.5% 51.6% 48.4% Public Service Department 71.1% 65.8% 65.8% 44.7% 63.2% 63.2% Public Utilities Commission 61.5% 92.3% 92.3% 30.8% 69.2% 84.6% Secretary of State 63.3% 69.4% 71.4% 50.0% 87.2% 83.0% State Treasurer 85.7% 60.0% 73.3% 53.3% 40.0% 60.0% Taxes 76.0% 69.4% 75.2% 52.8% 73.4% 70.4% Transportation (not DMV) 71.5% 73.5% 72.1% 50.4% 89.3% 71.8% Vermont Health Access 76.6% 73.8% 72.5% 58.8% 81.2% 72.6% Veterans' Home 48.5% 51.5% 63.6% 39.4% 78.8% 57.6% Average 70.5% 66.6% 67.0% 47.2% 72.5% 66.3%
28 Employee Engagement Survey Results – 2021
Workload, Staffing and Resources
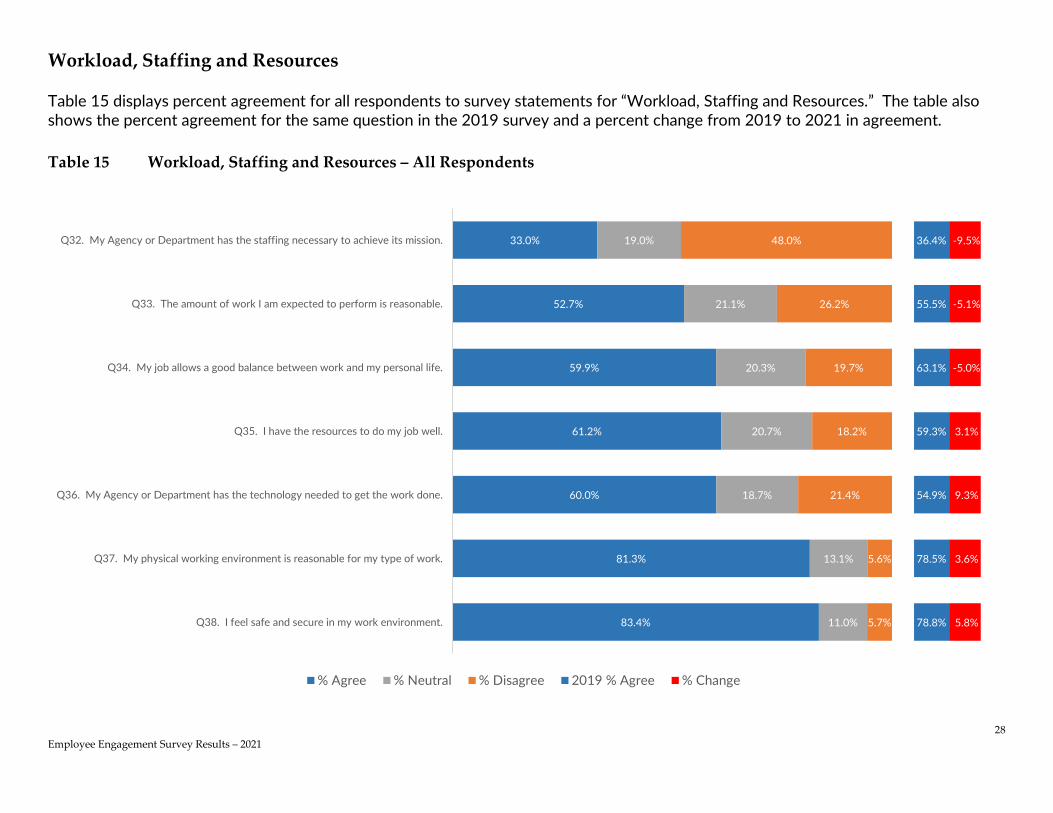
Table 15 displays percent agreement for all respondents to survey statements for “Workload, Staffing and Resources.” The table also shows the percent agreement for the same question in the 2019 survey and a percent change from 2019 to 2021 in agreement. Table 15 Workload, Staffing and Resources – All Respondents
33.0%
52.7%
59.9%
61.2%
60.0%
81.3%
83.4%
19.0%
21.1%
20.3%
20.7%
18.7%
13.1%
11.0%
48.0%
26.2%
19.7%
18.2%
21.4%
5.6%
5.7%
36.4%
55.5%
63.1%
59.3%
54.9%
78.5%
78.8%
-9.5%
-5.1%
-5.0%
3.1%
9.3%
3.6%
5.8%
Q32. My Agency or Department has the staffing necessary to achieve its mission.
Q33. The amount of work I am expected to perform is reasonable.
Q34. My job allows a good balance between work and my personal life.
Q35. I have the resources to do my job well.
Q36. My Agency or Department has the technology needed to get the work done.
Q37. My physical working environment is reasonable for my type of work.
Q38. I feel safe and secure in my work environment.
% Agree % Neutral % Disagree 2019 % Agree % Change
29 Employee Engagement Survey Results - 2021
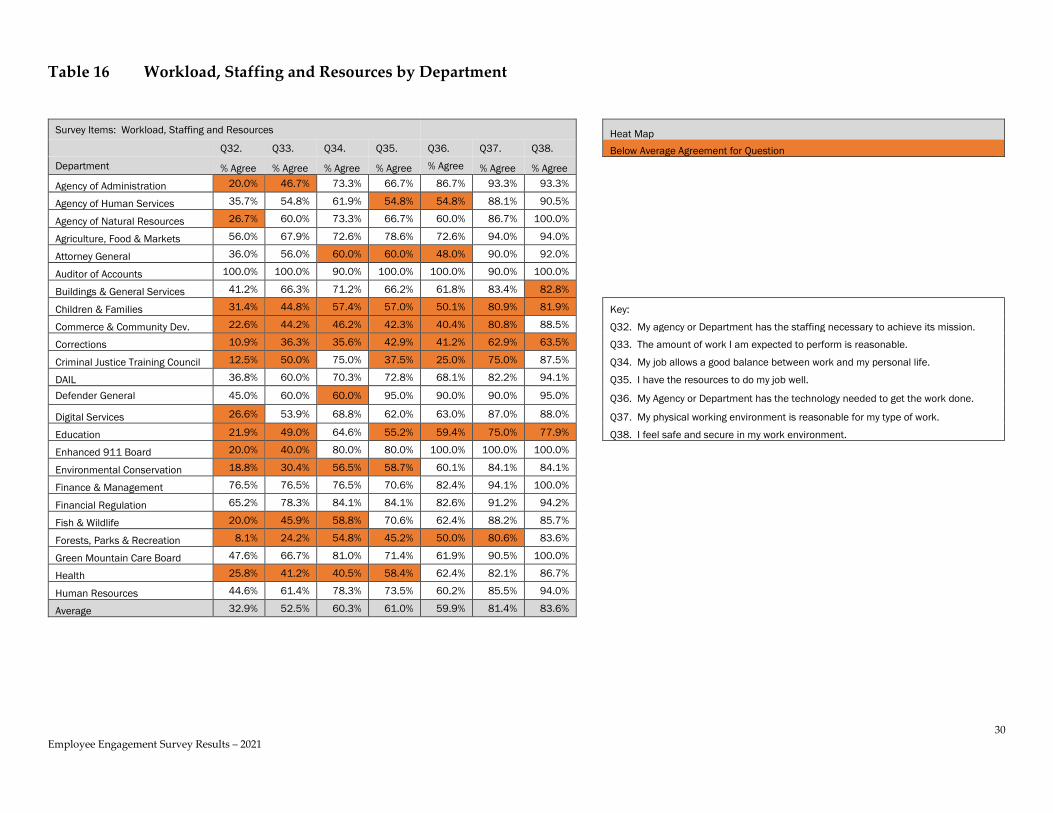
More respondents disagreed that their department or agency has the staffing and resources necessary to achieve its mission (48.0%) than agreed (33.0%). This was significantly greater disagreement than was found in the 2019 survey (-9.5%) While 52.7% of all respondents agreed that the amount of work, they are expected to perform is reasonable, more than a quarter (26.2%) disagreed. A higher percentage agreed that their job and work environment allow for a good balance between work and their personal life (59.9%). Both of these are down slightly from 2019 survey results. A majority of all respondents agreed that they have the resources to do their job well (60.0%) and that their department or agency had the technology needed to get the work done (60.0%). The percent agreeing that they had the technology needed to get the work done increased significantly (9.3%) compared to the 2019 survey results. Over three out of four of all respondents agreed that their physical working environment is reasonable for their type of work (81.3%) and that they feel safe and secure in their work environment (83.4%). Both of these had a slight increase from the 2019 survey results.
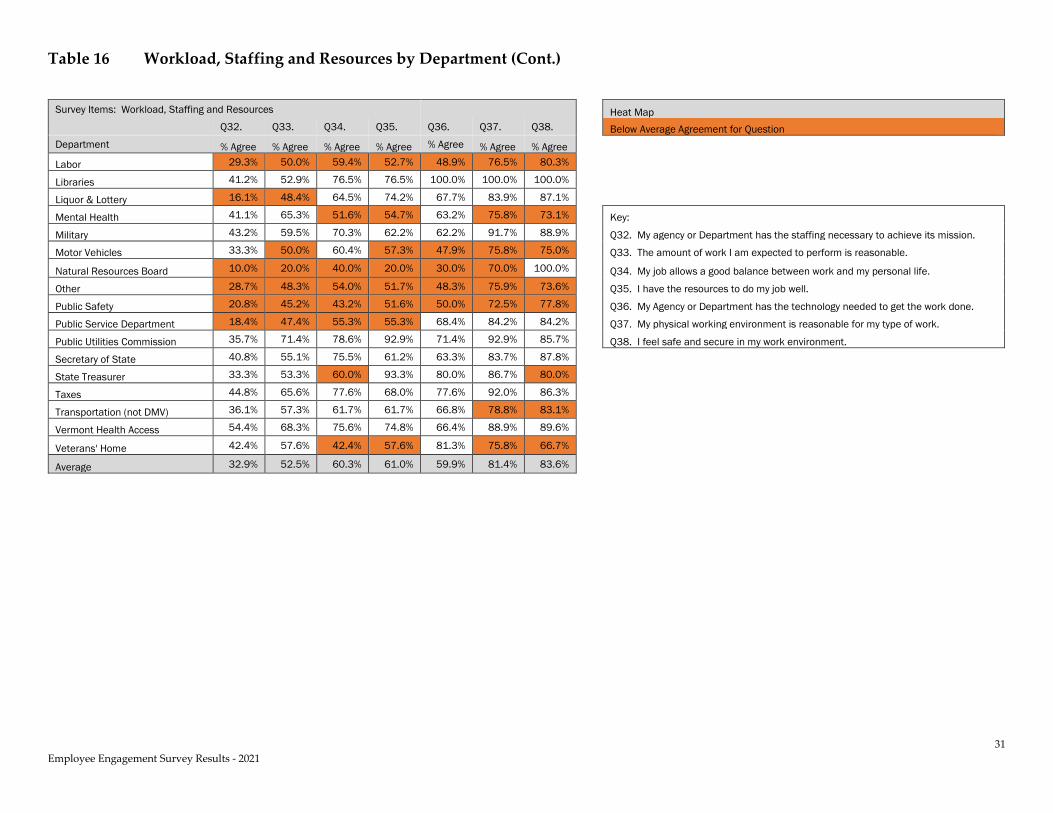
Table 16 displays percent agreement for respondents by department to survey statements for “Workload, Staffing and Resources.” A “heat map” of responses is used to visually represent levels of agreement that are below the average for that question. This is a visual tool to make cross department comparisons.
30 Employee Engagement Survey Results – 2021
Table 16 Workload, Staffing and Resources by Department
Survey Items: Workload, Staffing and Resources Heat Map Q32. Q33. Q34. Q35. Q36. Q37. Q38. Below Average Agreement for Question Department % Agree % Agree % Agree % Agree % Agree % Agree % Agree Agency of Administration 20.0% 46.7% 73.3% 66.7% 86.7% 93.3% 93.3% Agency of Human Services 35.7% 54.8% 61.9% 54.8% 54.8% 88.1% 90.5% Agency of Natural Resources 26.7% 60.0% 73.3% 66.7% 60.0% 86.7% 100.0% Agriculture, Food & Markets 56.0% 67.9% 72.6% 78.6% 72.6% 94.0% 94.0% Attorney General 36.0% 56.0% 60.0% 60.0% 48.0% 90.0% 92.0% Auditor of Accounts 100.0% 100.0% 90.0% 100.0% 100.0% 90.0% 100.0% Buildings & General Services 41.2% 66.3% 71.2% 66.2% 61.8% 83.4% 82.8% Children & Families 31.4% 44.8% 57.4% 57.0% 50.1% 80.9% 81.9% Key:
Commerce & Community Dev. 22.6% 44.2% 46.2% 42.3% 40.4% 80.8% 88.5% Q32. My agency or Department has the staffing necessary to achieve its mission.
Corrections 10.9% 36.3% 35.6% 42.9% 41.2% 62.9% 63.5% Q33. The amount of work I am expected to perform is reasonable.
Criminal Justice Training Council 12.5% 50.0% 75.0% 37.5% 25.0% 75.0% 87.5% Q34. My job allows a good balance between work and my personal life.
DAIL 36.8% 60.0% 70.3% 72.8% 68.1% 82.2% 94.1% Q35. I have the resources to do my job well. Defender General 45.0% 60.0% 60.0% 95.0% 90.0% 90.0% 95.0% Q36. My Agency or Department has the technology needed to get the work done.
Digital Services 26.6% 53.9% 68.8% 62.0% 63.0% 87.0% 88.0% Q37. My physical working environment is reasonable for my type of work.
Education 21.9% 49.0% 64.6% 55.2% 59.4% 75.0% 77.9% Q38. I feel safe and secure in my work environment.
Enhanced 911 Board 20.0% 40.0% 80.0% 80.0% 100.0% 100.0% 100.0% Environmental Conservation 18.8% 30.4% 56.5% 58.7% 60.1% 84.1% 84.1% Finance & Management 76.5% 76.5% 76.5% 70.6% 82.4% 94.1% 100.0% Financial Regulation 65.2% 78.3% 84.1% 84.1% 82.6% 91.2% 94.2% Fish & Wildlife 20.0% 45.9% 58.8% 70.6% 62.4% 88.2% 85.7% Forests, Parks & Recreation 8.1% 24.2% 54.8% 45.2% 50.0% 80.6% 83.6% Green Mountain Care Board 47.6% 66.7% 81.0% 71.4% 61.9% 90.5% 100.0% Health 25.8% 41.2% 40.5% 58.4% 62.4% 82.1% 86.7% Human Resources 44.6% 61.4% 78.3% 73.5% 60.2% 85.5% 94.0% Average 32.9% 52.5% 60.3% 61.0% 59.9% 81.4% 83.6%
31 Employee Engagement Survey Results - 2021
Table 16 Workload, Staffing and Resources by Department (Cont.)
Survey Items: Workload, Staffing and Resources Heat Map Q32. Q33. Q34. Q35. Q36. Q37. Q38. Below Average Agreement for Question Department % Agree % Agree % Agree % Agree % Agree % Agree % Agree Labor 29.3% 50.0% 59.4% 52.7% 48.9% 76.5% 80.3% Libraries 41.2% 52.9% 76.5% 76.5% 100.0% 100.0% 100.0% Liquor & Lottery 16.1% 48.4% 64.5% 74.2% 67.7% 83.9% 87.1% Mental Health 41.1% 65.3% 51.6% 54.7% 63.2% 75.8% 73.1% Key:
Military 43.2% 59.5% 70.3% 62.2% 62.2% 91.7% 88.9% Q32. My agency or Department has the staffing necessary to achieve its mission.
Motor Vehicles 33.3% 50.0% 60.4% 57.3% 47.9% 75.8% 75.0% Q33. The amount of work I am expected to perform is reasonable.
Natural Resources Board 10.0% 20.0% 40.0% 20.0% 30.0% 70.0% 100.0% Q34. My job allows a good balance between work and my personal life.
Other 28.7% 48.3% 54.0% 51.7% 48.3% 75.9% 73.6% Q35. I have the resources to do my job well.
Public Safety 20.8% 45.2% 43.2% 51.6% 50.0% 72.5% 77.8% Q36. My Agency or Department has the technology needed to get the work done.
Public Service Department 18.4% 47.4% 55.3% 55.3% 68.4% 84.2% 84.2% Q37. My physical working environment is reasonable for my type of work.
Public Utilities Commission 35.7% 71.4% 78.6% 92.9% 71.4% 92.9% 85.7% Q38. I feel safe and secure in my work environment.
Secretary of State 40.8% 55.1% 75.5% 61.2% 63.3% 83.7% 87.8% State Treasurer 33.3% 53.3% 60.0% 93.3% 80.0% 86.7% 80.0% Taxes 44.8% 65.6% 77.6% 68.0% 77.6% 92.0% 86.3% Transportation (not DMV) 36.1% 57.3% 61.7% 61.7% 66.8% 78.8% 83.1% Vermont Health Access 54.4% 68.3% 75.6% 74.8% 66.4% 88.9% 89.6% Veterans' Home 42.4% 57.6% 42.4% 57.6% 81.3% 75.8% 66.7% Average 32.9% 52.5% 60.3% 61.0% 59.9% 81.4% 83.6%

32 Employee Engagement Survey Results – 2021
Compensation and Benefits Table 17 displays percent agreement for all respondents to survey statements for “Compensation and Benefits.” The table also shows the percent agreement for the same question in the 2019 survey and a percent change from 2019 to 2021 in agreement.
Table 17 Compensation and Benefits – All Respondents
60.0%
71.9%
57.8%
73.4%
46.0%
64.7%
17.1%
16.7%
25.9%
16.7%
25.1%
21.3%
23.0%
11.5%
16.2%
9.9%
28.9%
14.0%
62.6%
80.9%
65.4%
79.6%
63.6%
80.2%
-4.2%
-11.1%
-11.6%
-7.8%
-27.7%
-19.3%
Q39. I am paid fairly for the work I do.
Q40. I feel that working for the State of Vermont provides me with good job security.
Q41. I feel that working for the State of Vermont provides me with a solid career path.
Q42. I understand my benefit plans.
Q43. I understand my retirement benefits.
Q44 Overall, I am satisfied with the benefits I receive.
% Agree % Neutral % Disagree 2019 % Agree % Change
33 Employee Engagement Survey Results - 2021
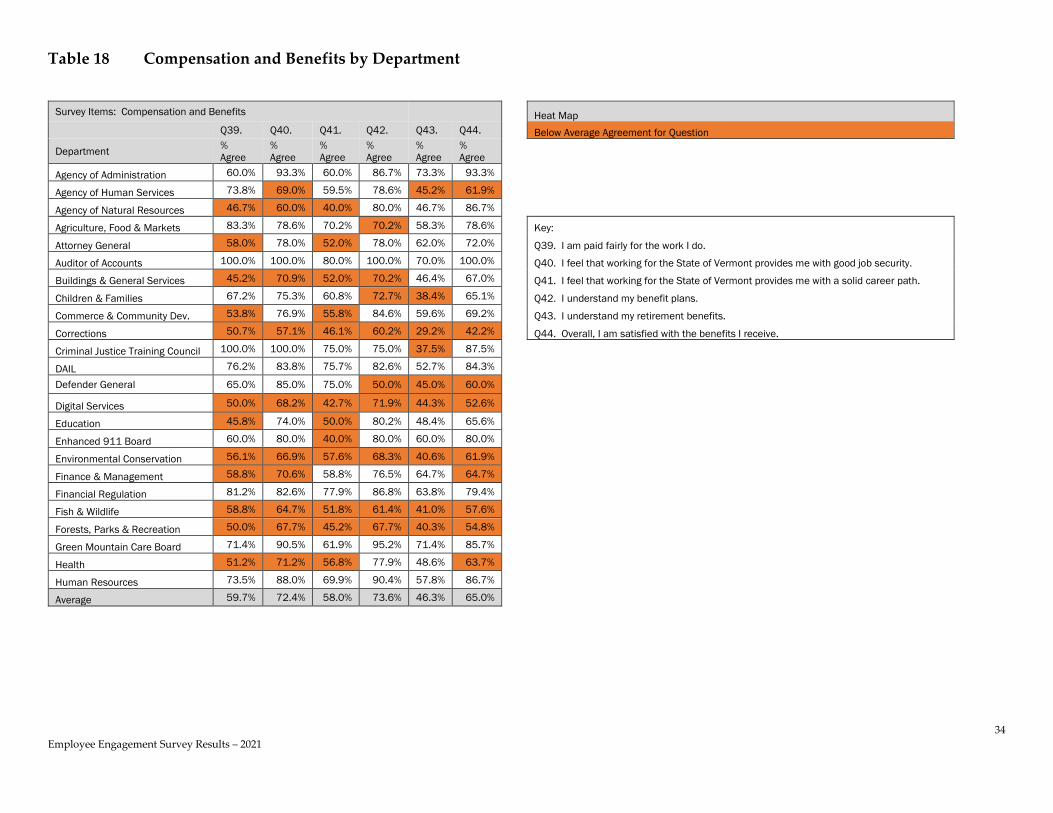
60.0% of all respondents agreed that they felt that they were paid fairly for the work they perform, while 23.0% disagreed. This is a slight decrease from 2019 survey results. Just over 70% of all respondents agreed that working for the State of Vermont provides them with good job security (71.9%), while to a lesser extent 57.8% agreed that that working for the State of Vermont provided them with a solid career path. Both of these are down significantly from the 2019 survey results (-11.1% and -11.6% respectively). Nearly three out of four respondents agreed that they understand their benefits plan (73.4%%). Less than half of respondents agreed they understood their retirement benefits (46.0%). This is down dramatically (-27.7%) from 2019 survey results. Overall, 64.7% agreed that they were satisfied with the benefits they received. This is down significantly (-19.3) from 2019 survey results. Table 18 displays percent agreement for respondents by department to survey statements for “Compensation and Benefits.” A “heat map” of responses is used to visually represent levels of agreement that are below the average for that question. This is a visual tool to make cross department comparisons.
34 Employee Engagement Survey Results – 2021
Table 18 Compensation and Benefits by Department
Survey Items: Compensation and Benefits Heat Map Q39. Q40. Q41. Q42. Q43. Q44. Below Average Agreement for Question
Department % Agree
% Agree
% Agree
% Agree
% Agree
% Agree
Agency of Administration 60.0% 93.3% 60.0% 86.7% 73.3% 93.3% Agency of Human Services 73.8% 69.0% 59.5% 78.6% 45.2% 61.9% Agency of Natural Resources 46.7% 60.0% 40.0% 80.0% 46.7% 86.7% Agriculture, Food & Markets 83.3% 78.6% 70.2% 70.2% 58.3% 78.6% Key:
Attorney General 58.0% 78.0% 52.0% 78.0% 62.0% 72.0% Q39. I am paid fairly for the work I do.
Auditor of Accounts 100.0% 100.0% 80.0% 100.0% 70.0% 100.0% Q40. I feel that working for the State of Vermont provides me with good job security.
Buildings & General Services 45.2% 70.9% 52.0% 70.2% 46.4% 67.0% Q41. I feel that working for the State of Vermont provides me with a solid career path.
Children & Families 67.2% 75.3% 60.8% 72.7% 38.4% 65.1% Q42. I understand my benefit plans.
Commerce & Community Dev. 53.8% 76.9% 55.8% 84.6% 59.6% 69.2% Q43. I understand my retirement benefits.
Corrections 50.7% 57.1% 46.1% 60.2% 29.2% 42.2% Q44. Overall, I am satisfied with the benefits I receive.
Criminal Justice Training Council 100.0% 100.0% 75.0% 75.0% 37.5% 87.5% DAIL 76.2% 83.8% 75.7% 82.6% 52.7% 84.3% Defender General 65.0% 85.0% 75.0% 50.0% 45.0% 60.0% Digital Services 50.0% 68.2% 42.7% 71.9% 44.3% 52.6% Education 45.8% 74.0% 50.0% 80.2% 48.4% 65.6% Enhanced 911 Board 60.0% 80.0% 40.0% 80.0% 60.0% 80.0% Environmental Conservation 56.1% 66.9% 57.6% 68.3% 40.6% 61.9% Finance & Management 58.8% 70.6% 58.8% 76.5% 64.7% 64.7% Financial Regulation 81.2% 82.6% 77.9% 86.8% 63.8% 79.4% Fish & Wildlife 58.8% 64.7% 51.8% 61.4% 41.0% 57.6% Forests, Parks & Recreation 50.0% 67.7% 45.2% 67.7% 40.3% 54.8% Green Mountain Care Board 71.4% 90.5% 61.9% 95.2% 71.4% 85.7% Health 51.2% 71.2% 56.8% 77.9% 48.6% 63.7% Human Resources 73.5% 88.0% 69.9% 90.4% 57.8% 86.7% Average 59.7% 72.4% 58.0% 73.6% 46.3% 65.0%

35 Employee Engagement Survey Results - 2021
Table 18 Compensation and Benefits by Department (Cont.)
Survey Items: Compensation and Benefits Heat Map Q39. Q40. Q41. Q42. Q43. Q44. Below Average Agreement for Question
Department % Agree
% Agree
% Agree
% Agree
% Agree
% Agree
Labor 62.2% 76.6% 61.7% 75.0% 49.2% 71.1% Libraries 58.8% 76.5% 52.9% 88.2% 70.6% 82.4% Liquor & Lottery 61.3% 61.3% 54.8% 74.2% 48.4% 77.4% Mental Health 67.4% 65.3% 50.5% 73.7% 46.3% 60.0% Key:
Military 62.2% 81.1% 56.8% 73.0% 51.4% 70.3% Q39. I am paid fairly for the work I do.
Motor Vehicles 51.5% 71.9% 53.6% 70.1% 45.4% 60.8% Q40. I feel that working for the State of Vermont provides me with good job security.
Natural Resources Board 70.0% 70.0% 60.0% 90.0% 20.0% 60.0% Q41. I feel that working for the State of Vermont provides me with a solid career path.
Other 55.7% 55.7% 42.0% 59.8% 36.8% 52.3% Q42. I understand my benefit plans.
Public Safety 59.4% 60.0% 50.3% 69.5% 44.5% 49.4% Q43. I understand my retirement benefits.
Public Service Department 65.8% 63.2% 60.5% 78.9% 50.0% 60.5% Q44. Overall, I am satisfied with the benefits I receive.
Public Utilities Commission 71.4% 85.7% 64.3% 78.6% 64.3% 78.6% Secretary of State 63.3% 87.8% 75.5% 79.2% 57.1% 85.7% State Treasurer 53.3% 80.0% 60.0% 93.3% 86.7% 60.0% Taxes 69.6% 84.0% 68.0% 80.8% 60.0% 75.2% Transportation (not DMV) 48.5% 67.1% 54.6% 68.3% 42.9% 58.1% Vermont Health Access 73.7% 84.7% 73.8% 82.1% 46.7% 77.5% Veterans' Home 69.7% 78.8% 75.8% 87.9% 66.7% 87.5% Average 59.7% 72.4% 58.0% 73.6% 46.3% 65.0%
36 Employee Engagement Survey Results – 2021
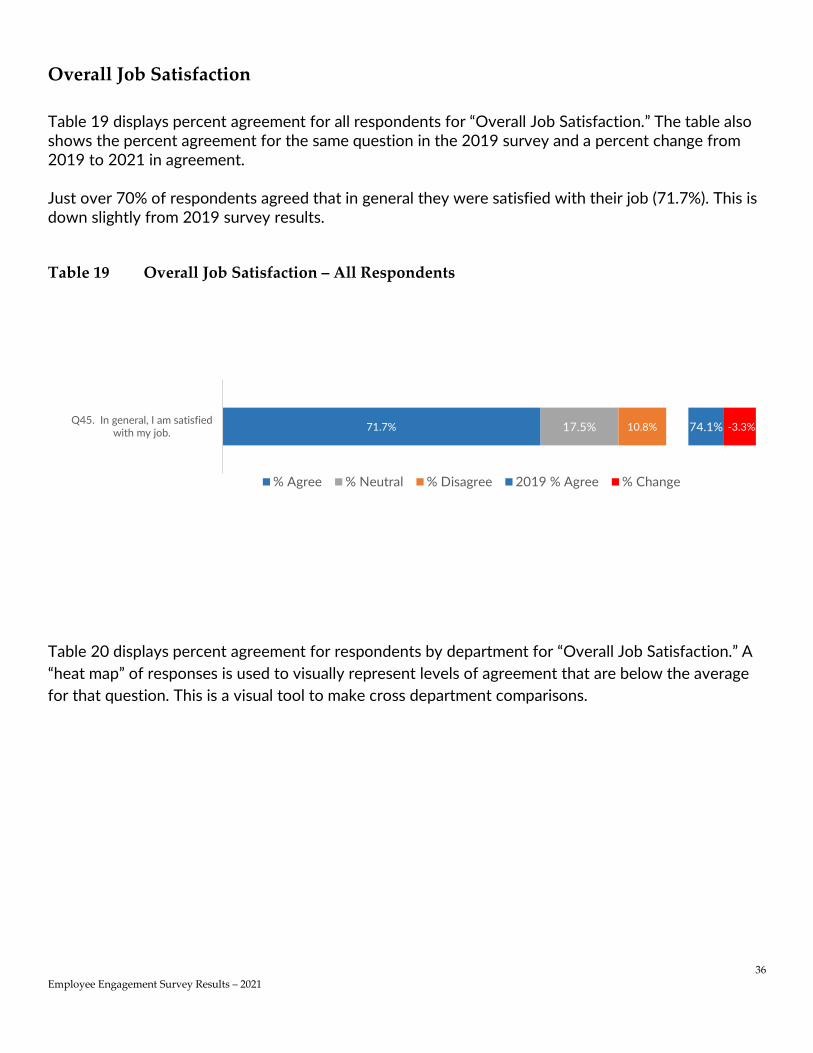
Overall Job Satisfaction Table 19 displays percent agreement for all respondents for “Overall Job Satisfaction.” The table also shows the percent agreement for the same question in the 2019 survey and a percent change from 2019 to 2021 in agreement. Just over 70% of respondents agreed that in general they were satisfied with their job (71.7%). This is down slightly from 2019 survey results.
Table 19 Overall Job Satisfaction – All Respondents
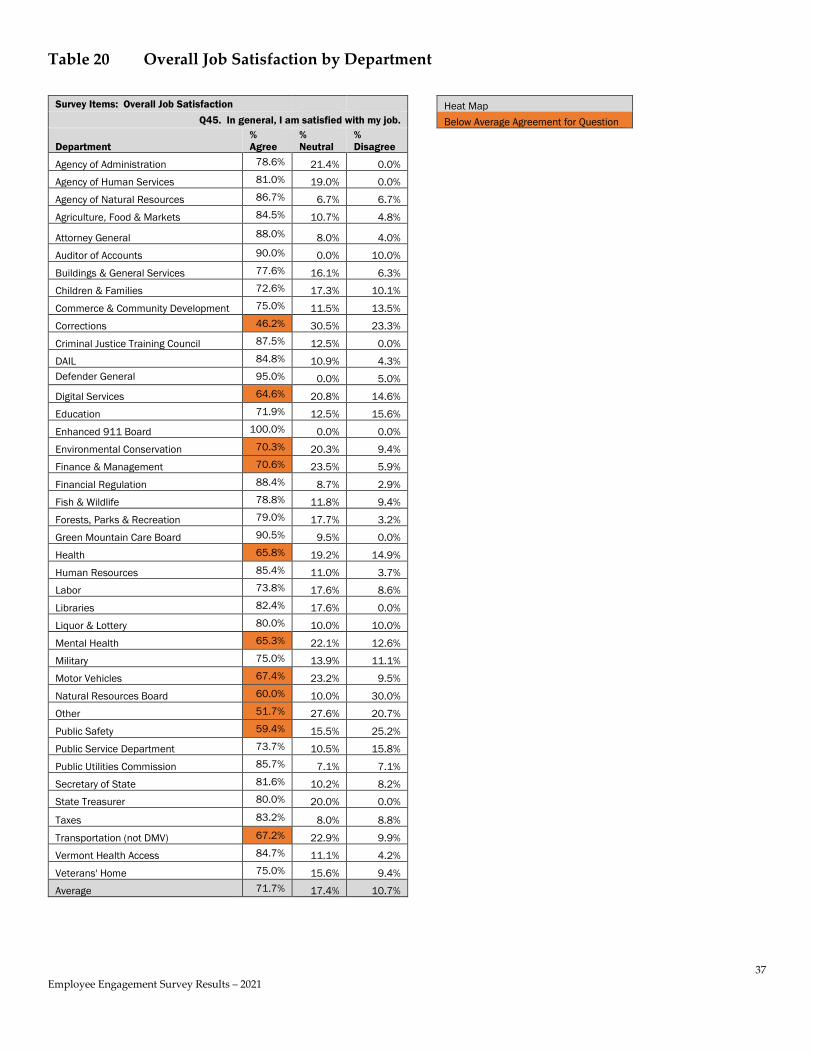
Table 20 displays percent agreement for respondents by department for “Overall Job Satisfaction.” A “heat map” of responses is used to visually represent levels of agreement that are below the average for that question. This is a visual tool to make cross department comparisons.
71.7% 17.5% 10.8% 74.1% -3.3%Q45. In general, I am satisfiedwith my job.
% Agree % Neutral % Disagree 2019 % Agree % Change
37 Employee Engagement Survey Results – 2021
Table 20 Overall Job Satisfaction by Department
Survey Items: Overall Job Satisfaction Heat Map Q45. In general, I am satisfied with my job. Below Average Agreement for Question
Department % Agree
% Neutral
% Disagree
Agency of Administration 78.6% 21.4% 0.0% Agency of Human Services 81.0% 19.0% 0.0% Agency of Natural Resources 86.7% 6.7% 6.7% Agriculture, Food & Markets 84.5% 10.7% 4.8% Attorney General 88.0% 8.0% 4.0% Auditor of Accounts 90.0% 0.0% 10.0% Buildings & General Services 77.6% 16.1% 6.3% Children & Families 72.6% 17.3% 10.1% Commerce & Community Development 75.0% 11.5% 13.5% Corrections 46.2% 30.5% 23.3% Criminal Justice Training Council 87.5% 12.5% 0.0% DAIL 84.8% 10.9% 4.3% Defender General 95.0% 0.0% 5.0% Digital Services 64.6% 20.8% 14.6% Education 71.9% 12.5% 15.6% Enhanced 911 Board 100.0% 0.0% 0.0% Environmental Conservation 70.3% 20.3% 9.4% Finance & Management 70.6% 23.5% 5.9% Financial Regulation 88.4% 8.7% 2.9% Fish & Wildlife 78.8% 11.8% 9.4% Forests, Parks & Recreation 79.0% 17.7% 3.2% Green Mountain Care Board 90.5% 9.5% 0.0% Health 65.8% 19.2% 14.9% Human Resources 85.4% 11.0% 3.7% Labor 73.8% 17.6% 8.6% Libraries 82.4% 17.6% 0.0% Liquor & Lottery 80.0% 10.0% 10.0% Mental Health 65.3% 22.1% 12.6% Military 75.0% 13.9% 11.1% Motor Vehicles 67.4% 23.2% 9.5% Natural Resources Board 60.0% 10.0% 30.0% Other 51.7% 27.6% 20.7% Public Safety 59.4% 15.5% 25.2% Public Service Department 73.7% 10.5% 15.8% Public Utilities Commission 85.7% 7.1% 7.1% Secretary of State 81.6% 10.2% 8.2% State Treasurer 80.0% 20.0% 0.0% Taxes 83.2% 8.0% 8.8% Transportation (not DMV) 67.2% 22.9% 9.9% Vermont Health Access 84.7% 11.1% 4.2% Veterans' Home 75.0% 15.6% 9.4% Average 71.7% 17.4% 10.7%
38 Employee Engagement Survey Results – 2021
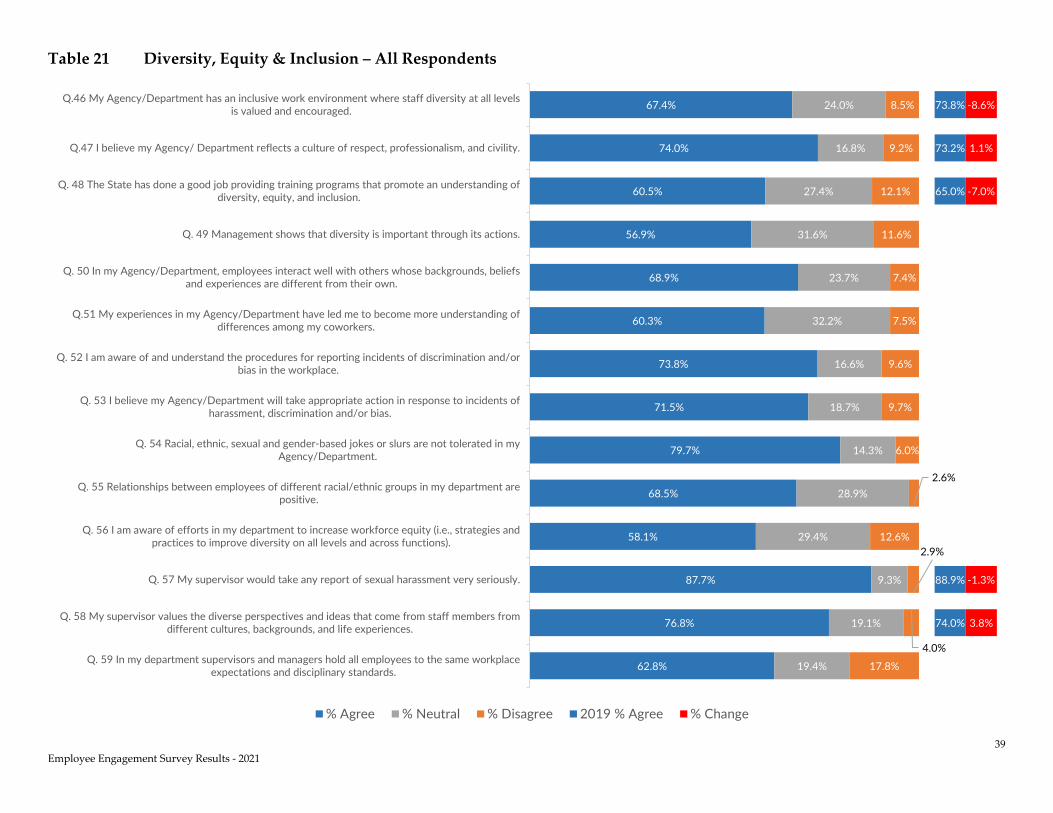
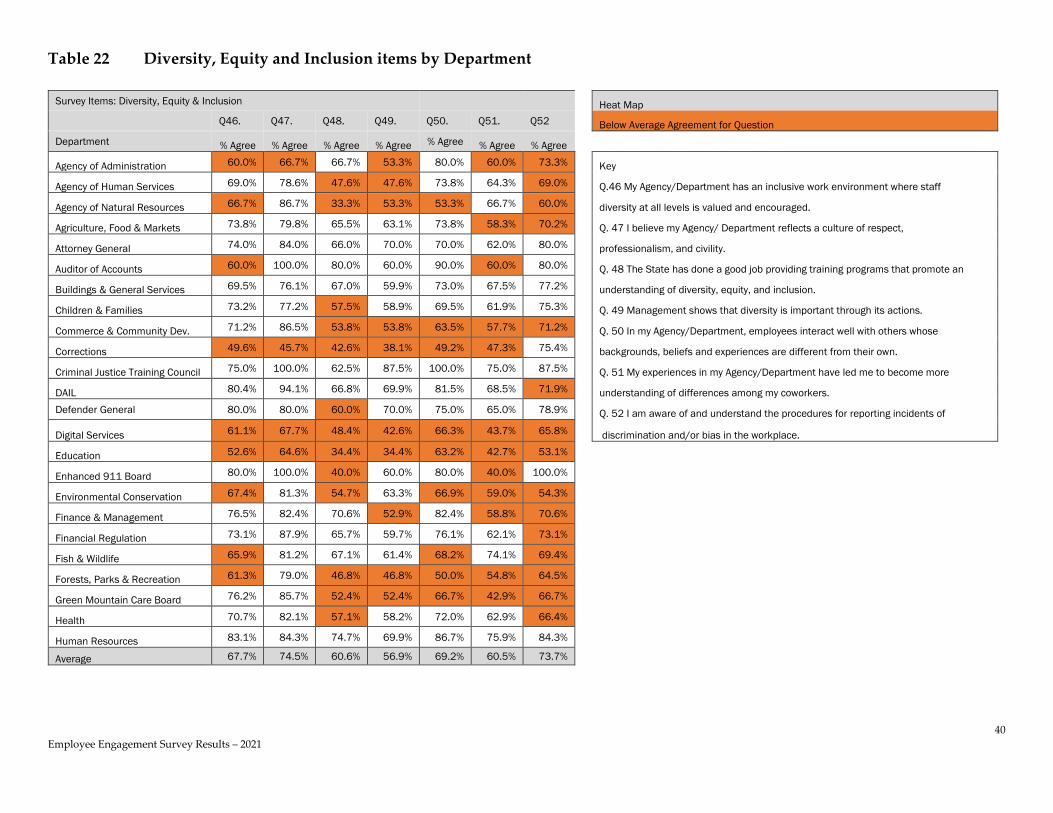
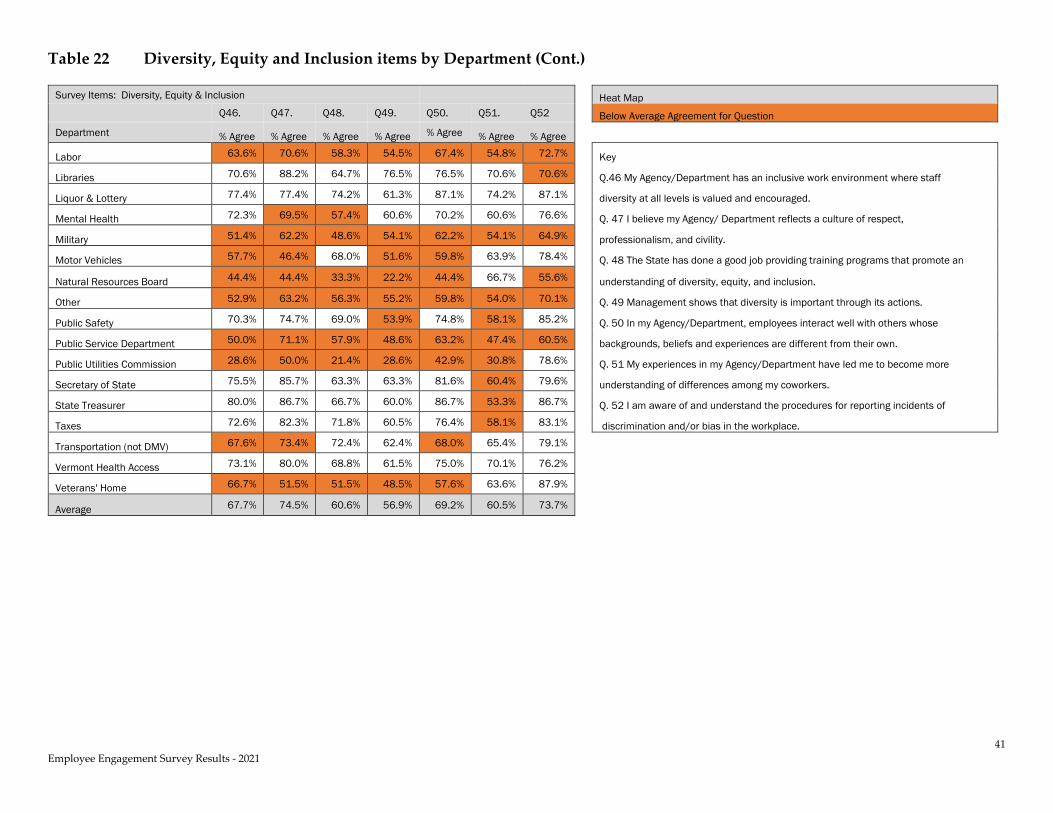
Diversity, Equity and Inclusion (DEI) Table 21 displays percent agreement for all respondents to survey statements that were designed to assess perceptions of issues related to diversity and inclusion. The table also shows the percent agreement for five questions that were also in the 2019 survey and a percent change from 2019 to 2021 in agreement. Over four out of five respondents agreed that their supervisor would take any report of sexual harassment very seriously (87.7%). This is a slight decrease from 2019 survey results. To a lesser extent, respondents agreed that racial, sexual, and gender-based jokes or slurs are not tolerated in their Agency/Department (79.7%), that their supervisor values the diverse perspectives and ideas that come from staff members from different cultures, backgrounds and life experiences (76.8%) and that they believed that their Agency/ Department reflects a culture of respect, professionalism and civility (74.0%). Levels of agreement have dropped since the 2019 survey when respondents were asked if their Agency/Department has an inclusive environment where staff diversity at all levels is valued and encouraged (-8.6%), and if the State has done a good job of providing training programs that promote an understanding of diversity, equity, and inclusion (-7.0%). The lowest agreement among all respondents was when asked if management shows that diversity is important through its actions (56.9%). Table 22 displays percent agreement for respondents by department to survey statements that were designed to assess perceptions of issues related to diversity and inclusion. A “heat map” of responses is used to visually represent levels of agreement that are below the average for that question. This is a visual tool to make cross department comparisons.
39 Employee Engagement Survey Results - 2021
Table 21 Diversity, Equity & Inclusion – All Respondents
67.4%
74.0%
60.5%
56.9%
68.9%
60.3%
73.8%
71.5%
79.7%
68.5%
58.1%
87.7%
76.8%
62.8%
24.0%
16.8%
27.4%
31.6%
23.7%
32.2%
16.6%
18.7%
14.3%
28.9%
29.4%
9.3%
19.1%
19.4%
8.5%
9.2%
12.1%
11.6%
7.4%
7.5%
9.6%
9.7%
6.0%
2.6%
12.6%2.9%
4.0%
17.8%
73.8%
73.2%
65.0%
88.9%
74.0%
-8.6%
1.1%
-7.0%
-1.3%
3.8%
Q.46 My Agency/Department has an inclusive work environment where staff diversity at all levelsis valued and encouraged.
Q.47 I believe my Agency/ Department reflects a culture of respect, professionalism, and civility.
Q. 48 The State has done a good job providing training programs that promote an understanding ofdiversity, equity, and inclusion.
Q. 49 Management shows that diversity is important through its actions.
Q. 50 In my Agency/Department, employees interact well with others whose backgrounds, beliefsand experiences are different from their own.
Q.51 My experiences in my Agency/Department have led me to become more understanding ofdifferences among my coworkers.
Q. 52 I am aware of and understand the procedures for reporting incidents of discrimination and/orbias in the workplace.
Q. 53 I believe my Agency/Department will take appropriate action in response to incidents ofharassment, discrimination and/or bias.
Q. 54 Racial, ethnic, sexual and gender-based jokes or slurs are not tolerated in myAgency/Department.
Q. 55 Relationships between employees of different racial/ethnic groups in my department arepositive.
Q. 56 I am aware of efforts in my department to increase workforce equity (i.e., strategies andpractices to improve diversity on all levels and across functions).
Q. 57 My supervisor would take any report of sexual harassment very seriously.
Q. 58 My supervisor values the diverse perspectives and ideas that come from staff members fromdifferent cultures, backgrounds, and life experiences.
Q. 59 In my department supervisors and managers hold all employees to the same workplaceexpectations and disciplinary standards.
% Agree % Neutral % Disagree 2019 % Agree % Change
40 Employee Engagement Survey Results – 2021
Table 22 Diversity, Equity and Inclusion items by Department
Survey Items: Diversity, Equity & Inclusion Heat Map Q46. Q47. Q48. Q49. Q50. Q51. Q52 Below Average Agreement for Question Department % Agree % Agree % Agree % Agree % Agree % Agree % Agree Agency of Administration 60.0% 66.7% 66.7% 53.3% 80.0% 60.0% 73.3% Key
Agency of Human Services 69.0% 78.6% 47.6% 47.6% 73.8% 64.3% 69.0% Q.46 My Agency/Department has an inclusive work environment where staff
Agency of Natural Resources 66.7% 86.7% 33.3% 53.3% 53.3% 66.7% 60.0% diversity at all levels is valued and encouraged.
Agriculture, Food & Markets 73.8% 79.8% 65.5% 63.1% 73.8% 58.3% 70.2% Q. 47 I believe my Agency/ Department reflects a culture of respect,
Attorney General 74.0% 84.0% 66.0% 70.0% 70.0% 62.0% 80.0% professionalism, and civility.
Auditor of Accounts 60.0% 100.0% 80.0% 60.0% 90.0% 60.0% 80.0% Q. 48 The State has done a good job providing training programs that promote an
Buildings & General Services 69.5% 76.1% 67.0% 59.9% 73.0% 67.5% 77.2% understanding of diversity, equity, and inclusion.
Children & Families 73.2% 77.2% 57.5% 58.9% 69.5% 61.9% 75.3% Q. 49 Management shows that diversity is important through its actions.
Commerce & Community Dev. 71.2% 86.5% 53.8% 53.8% 63.5% 57.7% 71.2% Q. 50 In my Agency/Department, employees interact well with others whose
Corrections 49.6% 45.7% 42.6% 38.1% 49.2% 47.3% 75.4% backgrounds, beliefs and experiences are different from their own.
Criminal Justice Training Council 75.0% 100.0% 62.5% 87.5% 100.0% 75.0% 87.5% Q. 51 My experiences in my Agency/Department have led me to become more
DAIL 80.4% 94.1% 66.8% 69.9% 81.5% 68.5% 71.9% understanding of differences among my coworkers. Defender General 80.0% 80.0% 60.0% 70.0% 75.0% 65.0% 78.9% Q. 52 I am aware of and understand the procedures for reporting incidents of
Digital Services 61.1% 67.7% 48.4% 42.6% 66.3% 43.7% 65.8% discrimination and/or bias in the workplace.
Education 52.6% 64.6% 34.4% 34.4% 63.2% 42.7% 53.1% Enhanced 911 Board 80.0% 100.0% 40.0% 60.0% 80.0% 40.0% 100.0% Environmental Conservation 67.4% 81.3% 54.7% 63.3% 66.9% 59.0% 54.3% Finance & Management 76.5% 82.4% 70.6% 52.9% 82.4% 58.8% 70.6% Financial Regulation 73.1% 87.9% 65.7% 59.7% 76.1% 62.1% 73.1% Fish & Wildlife 65.9% 81.2% 67.1% 61.4% 68.2% 74.1% 69.4% Forests, Parks & Recreation 61.3% 79.0% 46.8% 46.8% 50.0% 54.8% 64.5% Green Mountain Care Board 76.2% 85.7% 52.4% 52.4% 66.7% 42.9% 66.7% Health 70.7% 82.1% 57.1% 58.2% 72.0% 62.9% 66.4% Human Resources 83.1% 84.3% 74.7% 69.9% 86.7% 75.9% 84.3% Average 67.7% 74.5% 60.6% 56.9% 69.2% 60.5% 73.7%
41 Employee Engagement Survey Results - 2021
Table 22 Diversity, Equity and Inclusion items by Department (Cont.)
Survey Items: Diversity, Equity & Inclusion Heat Map Q46. Q47. Q48. Q49. Q50. Q51. Q52 Below Average Agreement for Question Department % Agree % Agree % Agree % Agree % Agree % Agree % Agree Labor 63.6% 70.6% 58.3% 54.5% 67.4% 54.8% 72.7% Key
Libraries 70.6% 88.2% 64.7% 76.5% 76.5% 70.6% 70.6% Q.46 My Agency/Department has an inclusive work environment where staff
Liquor & Lottery 77.4% 77.4% 74.2% 61.3% 87.1% 74.2% 87.1% diversity at all levels is valued and encouraged.
Mental Health 72.3% 69.5% 57.4% 60.6% 70.2% 60.6% 76.6% Q. 47 I believe my Agency/ Department reflects a culture of respect,
Military 51.4% 62.2% 48.6% 54.1% 62.2% 54.1% 64.9% professionalism, and civility.
Motor Vehicles 57.7% 46.4% 68.0% 51.6% 59.8% 63.9% 78.4% Q. 48 The State has done a good job providing training programs that promote an
Natural Resources Board 44.4% 44.4% 33.3% 22.2% 44.4% 66.7% 55.6% understanding of diversity, equity, and inclusion.
Other 52.9% 63.2% 56.3% 55.2% 59.8% 54.0% 70.1% Q. 49 Management shows that diversity is important through its actions.
Public Safety 70.3% 74.7% 69.0% 53.9% 74.8% 58.1% 85.2% Q. 50 In my Agency/Department, employees interact well with others whose
Public Service Department 50.0% 71.1% 57.9% 48.6% 63.2% 47.4% 60.5% backgrounds, beliefs and experiences are different from their own.
Public Utilities Commission 28.6% 50.0% 21.4% 28.6% 42.9% 30.8% 78.6% Q. 51 My experiences in my Agency/Department have led me to become more
Secretary of State 75.5% 85.7% 63.3% 63.3% 81.6% 60.4% 79.6% understanding of differences among my coworkers.
State Treasurer 80.0% 86.7% 66.7% 60.0% 86.7% 53.3% 86.7% Q. 52 I am aware of and understand the procedures for reporting incidents of
Taxes 72.6% 82.3% 71.8% 60.5% 76.4% 58.1% 83.1% discrimination and/or bias in the workplace.
Transportation (not DMV) 67.6% 73.4% 72.4% 62.4% 68.0% 65.4% 79.1% Vermont Health Access 73.1% 80.0% 68.8% 61.5% 75.0% 70.1% 76.2% Veterans' Home 66.7% 51.5% 51.5% 48.5% 57.6% 63.6% 87.9% Average 67.7% 74.5% 60.6% 56.9% 69.2% 60.5% 73.7%
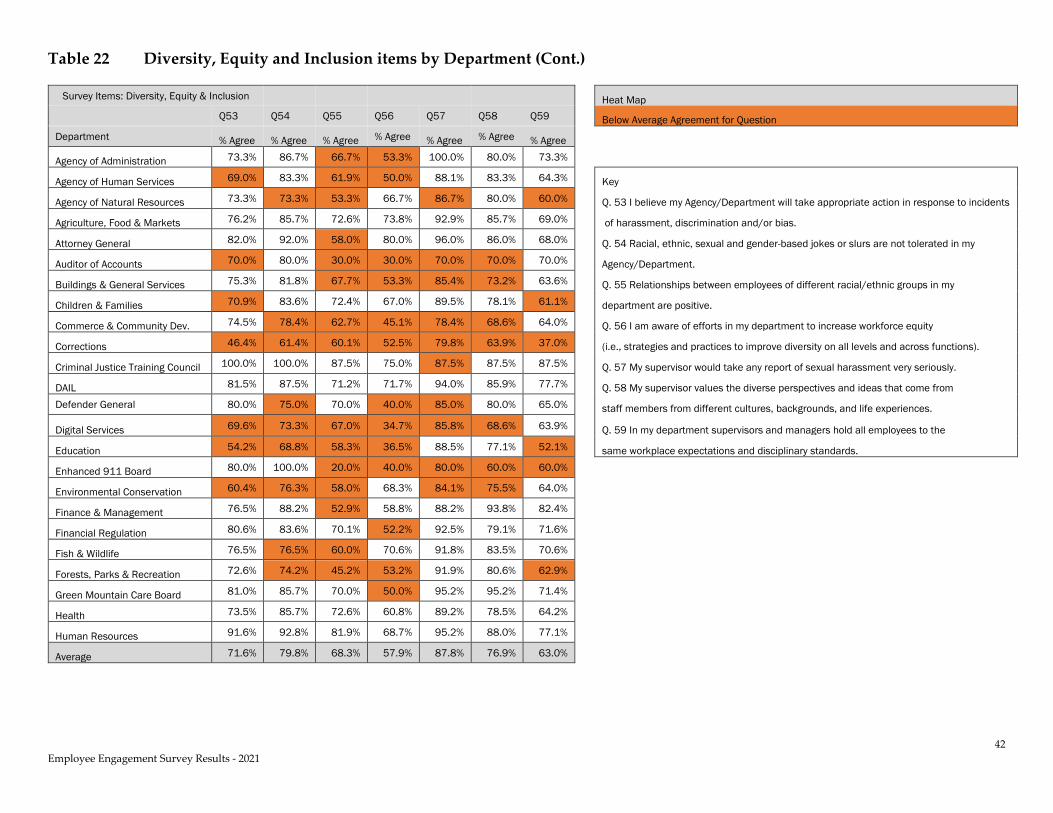
42 Employee Engagement Survey Results - 2021
Table 22 Diversity, Equity and Inclusion items by Department (Cont.)
Survey Items: Diversity, Equity & Inclusion Heat Map Q53 Q54 Q55 Q56 Q57 Q58 Q59 Below Average Agreement for Question Department % Agree % Agree % Agree % Agree % Agree % Agree % Agree Agency of Administration 73.3% 86.7% 66.7% 53.3% 100.0% 80.0% 73.3% Agency of Human Services 69.0% 83.3% 61.9% 50.0% 88.1% 83.3% 64.3% Key
Agency of Natural Resources 73.3% 73.3% 53.3% 66.7% 86.7% 80.0% 60.0% Q. 53 I believe my Agency/Department will take appropriate action in response to incidents
Agriculture, Food & Markets 76.2% 85.7% 72.6% 73.8% 92.9% 85.7% 69.0% of harassment, discrimination and/or bias.
Attorney General 82.0% 92.0% 58.0% 80.0% 96.0% 86.0% 68.0% Q. 54 Racial, ethnic, sexual and gender-based jokes or slurs are not tolerated in my
Auditor of Accounts 70.0% 80.0% 30.0% 30.0% 70.0% 70.0% 70.0% Agency/Department.
Buildings & General Services 75.3% 81.8% 67.7% 53.3% 85.4% 73.2% 63.6% Q. 55 Relationships between employees of different racial/ethnic groups in my
Children & Families 70.9% 83.6% 72.4% 67.0% 89.5% 78.1% 61.1% department are positive.
Commerce & Community Dev. 74.5% 78.4% 62.7% 45.1% 78.4% 68.6% 64.0% Q. 56 I am aware of efforts in my department to increase workforce equity
Corrections 46.4% 61.4% 60.1% 52.5% 79.8% 63.9% 37.0% (i.e., strategies and practices to improve diversity on all levels and across functions).
Criminal Justice Training Council 100.0% 100.0% 87.5% 75.0% 87.5% 87.5% 87.5% Q. 57 My supervisor would take any report of sexual harassment very seriously.
DAIL 81.5% 87.5% 71.2% 71.7% 94.0% 85.9% 77.7% Q. 58 My supervisor values the diverse perspectives and ideas that come from Defender General 80.0% 75.0% 70.0% 40.0% 85.0% 80.0% 65.0% staff members from different cultures, backgrounds, and life experiences.
Digital Services 69.6% 73.3% 67.0% 34.7% 85.8% 68.6% 63.9% Q. 59 In my department supervisors and managers hold all employees to the
Education 54.2% 68.8% 58.3% 36.5% 88.5% 77.1% 52.1% same workplace expectations and disciplinary standards.
Enhanced 911 Board 80.0% 100.0% 20.0% 40.0% 80.0% 60.0% 60.0% Environmental Conservation 60.4% 76.3% 58.0% 68.3% 84.1% 75.5% 64.0% Finance & Management 76.5% 88.2% 52.9% 58.8% 88.2% 93.8% 82.4% Financial Regulation 80.6% 83.6% 70.1% 52.2% 92.5% 79.1% 71.6% Fish & Wildlife 76.5% 76.5% 60.0% 70.6% 91.8% 83.5% 70.6% Forests, Parks & Recreation 72.6% 74.2% 45.2% 53.2% 91.9% 80.6% 62.9% Green Mountain Care Board 81.0% 85.7% 70.0% 50.0% 95.2% 95.2% 71.4% Health 73.5% 85.7% 72.6% 60.8% 89.2% 78.5% 64.2% Human Resources 91.6% 92.8% 81.9% 68.7% 95.2% 88.0% 77.1%
Average 71.6% 79.8% 68.3% 57.9% 87.8% 76.9% 63.0%
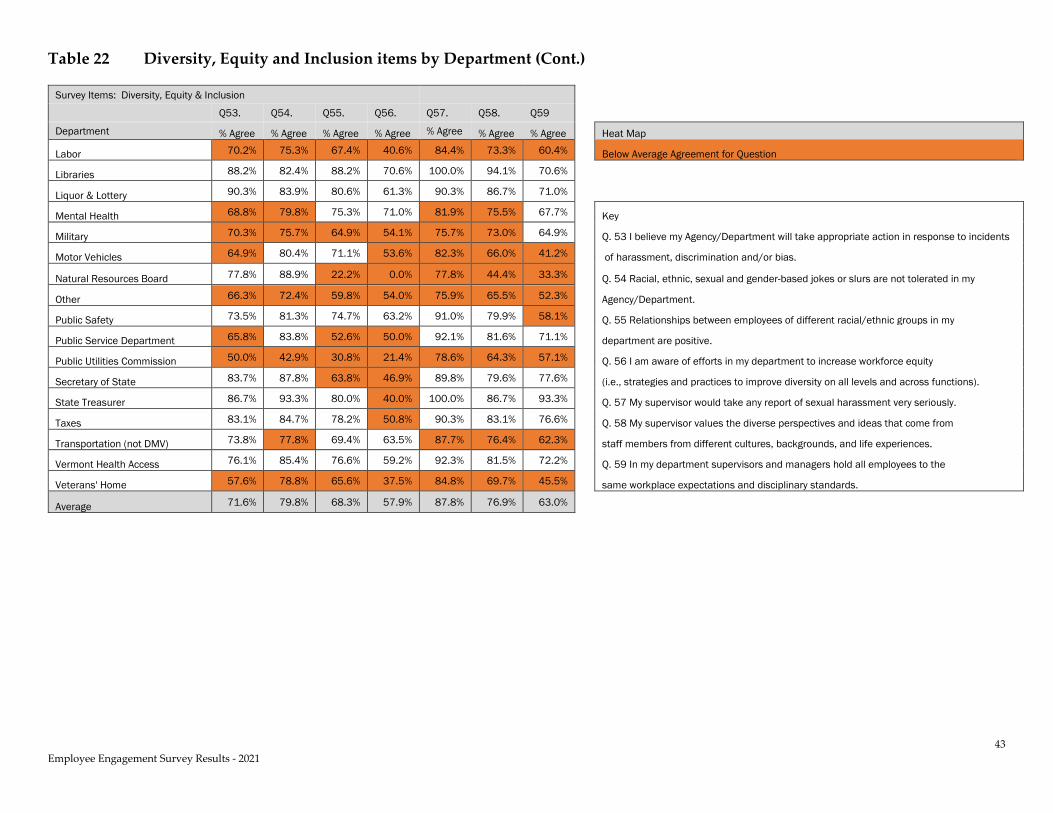
43 Employee Engagement Survey Results - 2021
Table 22 Diversity, Equity and Inclusion items by Department (Cont.)
Survey Items: Diversity, Equity & Inclusion Q53. Q54. Q55. Q56. Q57. Q58. Q59 Department % Agree % Agree % Agree % Agree % Agree % Agree % Agree Heat Map
Labor 70.2% 75.3% 67.4% 40.6% 84.4% 73.3% 60.4% Below Average Agreement for Question
Libraries 88.2% 82.4% 88.2% 70.6% 100.0% 94.1% 70.6% Liquor & Lottery 90.3% 83.9% 80.6% 61.3% 90.3% 86.7% 71.0% Mental Health 68.8% 79.8% 75.3% 71.0% 81.9% 75.5% 67.7% Key
Military 70.3% 75.7% 64.9% 54.1% 75.7% 73.0% 64.9% Q. 53 I believe my Agency/Department will take appropriate action in response to incidents
Motor Vehicles 64.9% 80.4% 71.1% 53.6% 82.3% 66.0% 41.2% of harassment, discrimination and/or bias.
Natural Resources Board 77.8% 88.9% 22.2% 0.0% 77.8% 44.4% 33.3% Q. 54 Racial, ethnic, sexual and gender-based jokes or slurs are not tolerated in my
Other 66.3% 72.4% 59.8% 54.0% 75.9% 65.5% 52.3% Agency/Department.
Public Safety 73.5% 81.3% 74.7% 63.2% 91.0% 79.9% 58.1% Q. 55 Relationships between employees of different racial/ethnic groups in my
Public Service Department 65.8% 83.8% 52.6% 50.0% 92.1% 81.6% 71.1% department are positive.
Public Utilities Commission 50.0% 42.9% 30.8% 21.4% 78.6% 64.3% 57.1% Q. 56 I am aware of efforts in my department to increase workforce equity
Secretary of State 83.7% 87.8% 63.8% 46.9% 89.8% 79.6% 77.6% (i.e., strategies and practices to improve diversity on all levels and across functions).
State Treasurer 86.7% 93.3% 80.0% 40.0% 100.0% 86.7% 93.3% Q. 57 My supervisor would take any report of sexual harassment very seriously.
Taxes 83.1% 84.7% 78.2% 50.8% 90.3% 83.1% 76.6% Q. 58 My supervisor values the diverse perspectives and ideas that come from
Transportation (not DMV) 73.8% 77.8% 69.4% 63.5% 87.7% 76.4% 62.3% staff members from different cultures, backgrounds, and life experiences.
Vermont Health Access 76.1% 85.4% 76.6% 59.2% 92.3% 81.5% 72.2% Q. 59 In my department supervisors and managers hold all employees to the
Veterans' Home 57.6% 78.8% 65.6% 37.5% 84.8% 69.7% 45.5% same workplace expectations and disciplinary standards.
Average 71.6% 79.8% 68.3% 57.9% 87.8% 76.9% 63.0%
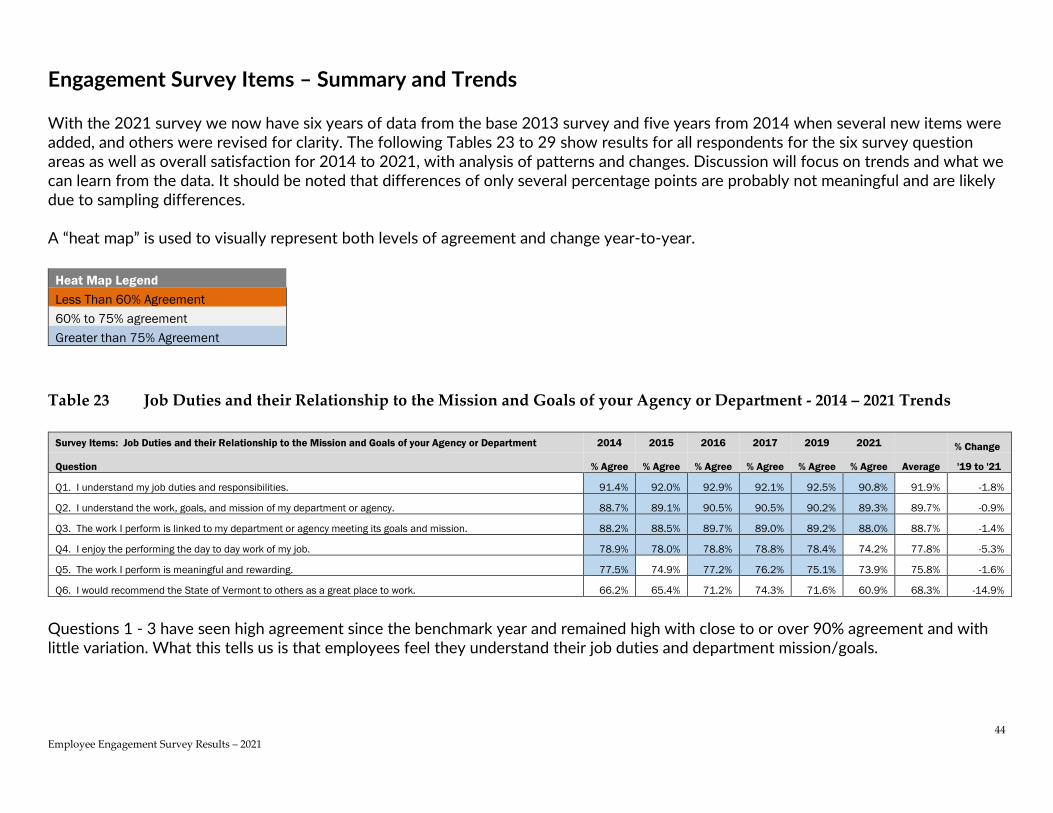
44 Employee Engagement Survey Results – 2021
Engagement Survey Items – Summary and Trends With the 2021 survey we now have six years of data from the base 2013 survey and five years from 2014 when several new items were added, and others were revised for clarity. The following Tables 23 to 29 show results for all respondents for the six survey question areas as well as overall satisfaction for 2014 to 2021, with analysis of patterns and changes. Discussion will focus on trends and what we can learn from the data. It should be noted that differences of only several percentage points are probably not meaningful and are likely due to sampling differences. A “heat map” is used to visually represent both levels of agreement and change year-to-year.
Heat Map Legend Less Than 60% Agreement 60% to 75% agreement Greater than 75% Agreement
Table 23 Job Duties and their Relationship to the Mission and Goals of your Agency or Department - 2014 – 2021 Trends
Survey Items: Job Duties and their Relationship to the Mission and Goals of your Agency or Department 2014 2015 2016 2017 2019 2021 % Change
Question % Agree % Agree % Agree % Agree % Agree % Agree Average '19 to '21
Q1. I understand my job duties and responsibilities. 91.4% 92.0% 92.9% 92.1% 92.5% 90.8% 91.9% -1.8%
Q2. I understand the work, goals, and mission of my department or agency. 88.7% 89.1% 90.5% 90.5% 90.2% 89.3% 89.7% -0.9%
Q3. The work I perform is linked to my department or agency meeting its goals and mission. 88.2% 88.5% 89.7% 89.0% 89.2% 88.0% 88.7% -1.4%
Q4. I enjoy the performing the day to day work of my job. 78.9% 78.0% 78.8% 78.8% 78.4% 74.2% 77.8% -5.3%
Q5. The work I perform is meaningful and rewarding. 77.5% 74.9% 77.2% 76.2% 75.1% 73.9% 75.8% -1.6%
Q6. I would recommend the State of Vermont to others as a great place to work. 66.2% 65.4% 71.2% 74.3% 71.6% 60.9% 68.3% -14.9%
Questions 1 - 3 have seen high agreement since the benchmark year and remained high with close to or over 90% agreement and with little variation. What this tells us is that employees feel they understand their job duties and department mission/goals.

45 Employee Engagement Survey Results - 2021
For 2021 agreement dropped below the 75% threshold for questions 4 and 5 for the first time in several years. While still high the drop is likely the result of workload and other pressures due to the pandemic. Still a significant number of employees report they enjoy performing the day to day work of their jobs and find their work meaningful and rewarding. The one item in this category that has shown significant variation is Q6. There was improvement from 2014 to 2019. From 66.2% to 71.6% (+8.1%). However, there was a drop of 3.6% from 2017 to 2019. And in 2021 there was a precipitous drop of nearly 15% to only 60.9% agreement that respondents would recommend the State of Vermont to others as a great place to work. This is very likely the result of discussions in the Legislature about pension reform, as well as workload and other pressures due to the pandemic.
Heat Map Legend Less Than 60% Agreement 60% to 75% agreement Greater than 75% Agreement
Table 24 Communication and Input within your Organization - 2014 - 2021 Trends
Survey Items: Communication and Input within Your Organization 2014 2015 2016 2017 2019 2021 % Change
Question % Agree % Agree % Agree % Agree % Agree % Agree Average '19 to '21 Q7. Management and senior leadership communicates important information effectively. 49.3% 51.8% 54.5% 56.3% 55.7% 59.6% 54.5% 7.0% Q8. I have an opportunity to communicate with and provide feedback to management and senior leadership. 58.2% 59.6% 63.0% 63.2% 63.0% 62.4% 61.6% -1.0% Q9. I am encouraged to share ideas on improving either service delivery or business process efficiency. 57.2% 58.6% 61.3% 62.6% 60.3% 59.8% 60.0% -0.8% Q10. My department or agency works well with other departments and agencies. 57.5% 60.4% 61.9% 63.4% 61.7% 62.9% 61.3% 1.9%
These items relate to internal communication and have only seen modest change – only half or a bit more agree to these items – none exceed the 75% agreement threshold. The notable question with positive change from 2014 to 2021 is Q7 - Management and senior leadership communicates important information effectively. From 49.3% to 59.6% (+20.9%). There was a 7% increase from the 2019 survey to the 2021 survey.
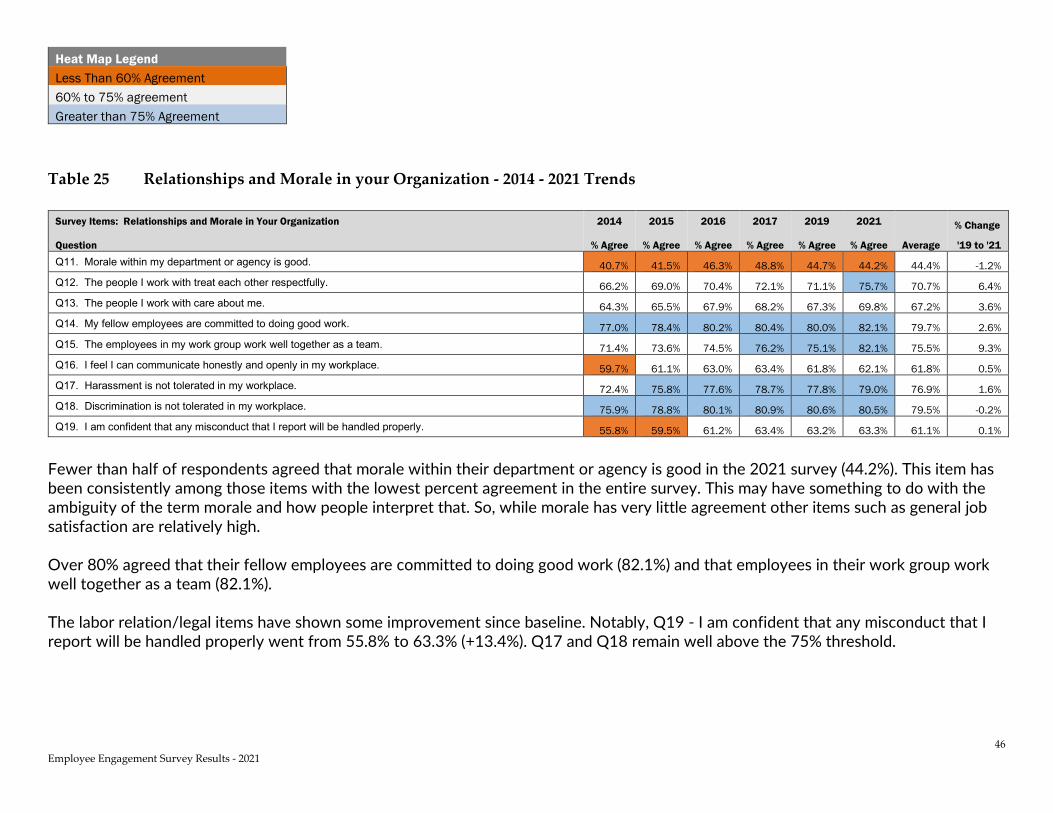
46 Employee Engagement Survey Results - 2021
Heat Map Legend Less Than 60% Agreement 60% to 75% agreement Greater than 75% Agreement
Table 25 Relationships and Morale in your Organization - 2014 - 2021 Trends
Survey Items: Relationships and Morale in Your Organization 2014 2015 2016 2017 2019 2021 % Change
Question % Agree % Agree % Agree % Agree % Agree % Agree Average '19 to '21 Q11. Morale within my department or agency is good. 40.7% 41.5% 46.3% 48.8% 44.7% 44.2% 44.4% -1.2% Q12. The people I work with treat each other respectfully. 66.2% 69.0% 70.4% 72.1% 71.1% 75.7% 70.7% 6.4% Q13. The people I work with care about me. 64.3% 65.5% 67.9% 68.2% 67.3% 69.8% 67.2% 3.6% Q14. My fellow employees are committed to doing good work. 77.0% 78.4% 80.2% 80.4% 80.0% 82.1% 79.7% 2.6% Q15. The employees in my work group work well together as a team. 71.4% 73.6% 74.5% 76.2% 75.1% 82.1% 75.5% 9.3% Q16. I feel I can communicate honestly and openly in my workplace. 59.7% 61.1% 63.0% 63.4% 61.8% 62.1% 61.8% 0.5% Q17. Harassment is not tolerated in my workplace. 72.4% 75.8% 77.6% 78.7% 77.8% 79.0% 76.9% 1.6% Q18. Discrimination is not tolerated in my workplace. 75.9% 78.8% 80.1% 80.9% 80.6% 80.5% 79.5% -0.2% Q19. I am confident that any misconduct that I report will be handled properly. 55.8% 59.5% 61.2% 63.4% 63.2% 63.3% 61.1% 0.1%
Fewer than half of respondents agreed that morale within their department or agency is good in the 2021 survey (44.2%). This item has been consistently among those items with the lowest percent agreement in the entire survey. This may have something to do with the ambiguity of the term morale and how people interpret that. So, while morale has very little agreement other items such as general job satisfaction are relatively high. Over 80% agreed that their fellow employees are committed to doing good work (82.1%) and that employees in their work group work well together as a team (82.1%). The labor relation/legal items have shown some improvement since baseline. Notably, Q19 - I am confident that any misconduct that I report will be handled properly went from 55.8% to 63.3% (+13.4%). Q17 and Q18 remain well above the 75% threshold.

47 Employee Engagement Survey Results - 2021
Heat Map Legend Less Than 60% Agreement 60% to 75% agreement Greater than 75% Agreement
Table 26 Your Supervisor - 2014 - 2021 Trends
Survey Items: Your Supervisor 2014 2015 2016 2017 2019 2021 % Change
Question % Agree % Agree % Agree % Agree % Agree % Agree Average '19 to '21 Q20. My supervisor clearly explains my job performance expectations. 67.0% 68.5% 71.4% 72.0% 73.5% 75.8% 71.4% 3.1% Q21. My supervisor regularly provides me with timely and useful feedback. 59.3% 60.9% 65.2% 65.5% 66.9% 69.5% 64.6% 4.0% Q22. My supervisor gives me an opportunity to do my best work. 73.0% 73.7% 75.9% 77.2% 77.3% 78.9% 76.0% 2.1% Q23. I am satisfied with the recognition I receive from my supervisor for my work. 60.9% 61.9% 64.6% 66.0% 66.2% 67.5% 64.5% 1.9% Q24. My supervisor treats employees fairly and respectfully. 70.5% 70.8% 74.2% 75.3% 75.5% 78.0% 74.1% 3.4% Q25. My supervisor seems to care about me as a person. 73.9% 75.0% 77.2% 77.2% 77.5% 79.1% 76.6% 2.0% Q26. My supervisor provides the help I need to improve my job performance. 62.9% 63.8% 67.1% 68.3% 68.5% 70.1% 66.8% 2.4% Q27. I have an opportunity to learn and grow professionally. 63.1% 64.5% 66.8% 67.8% 67.5% 66.3% 66.0% -1.8% Q28. I receive the training I need to perform my job. 59.6% 61.6% 65.4% 66.3% 66.0% 66.9% 64.3% 1.4% Q29. My supervisor and I discuss and plan my career development. 37.4% 41.0% 44.5% 46.3% 47.8% 47.1% 44.0% -1.4% Q30. My performance evaluations are completed annually. 56.8% 62.8% 64.6% 66.2% 71.4% 72.1% 65.6% 1.0% Q31. The standards used to evaluate my performance are fair. 53.1% 57.7% 59.9% 60.4% 64.6% 66.1% 60.3% 2.3%
On average, approximately 70% agreed to the range of statements regarding their supervisor (Q20 – Q26). Interestingly this group of questions all showed pattern of slight increases from 2019 to 2021. Of note is the increase in those reporting their evaluations completed annually to nearly 72.1% in 2021.
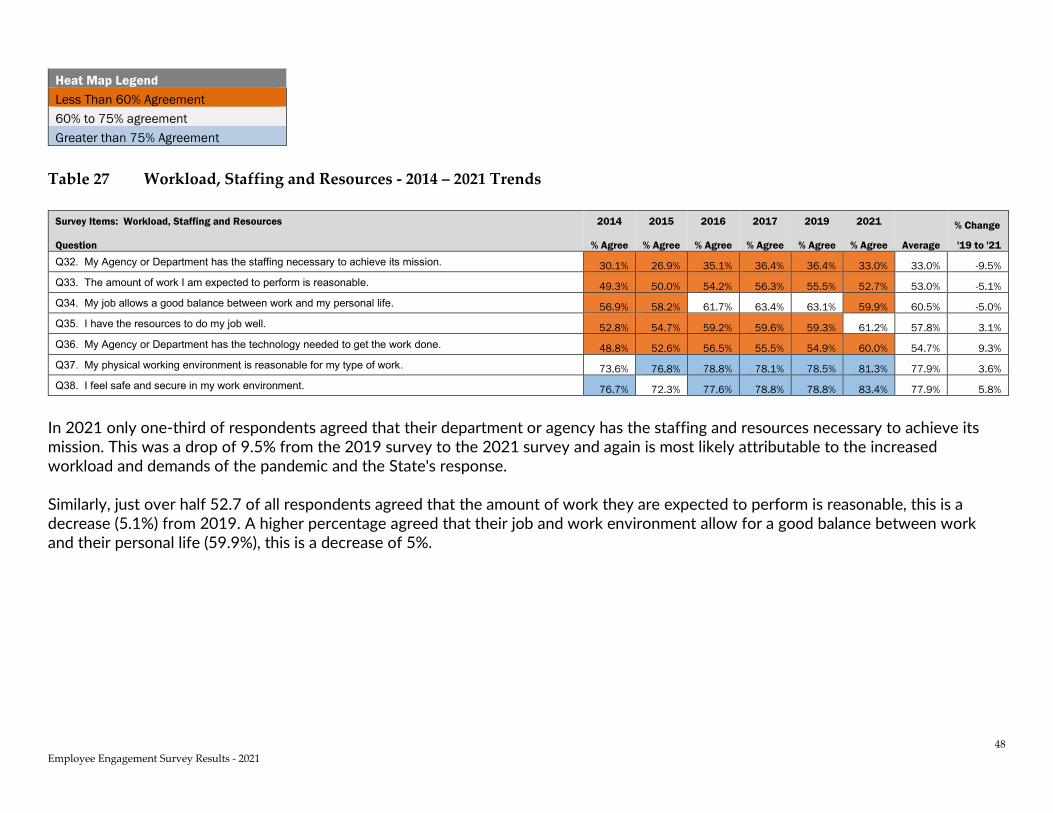
48 Employee Engagement Survey Results - 2021
Heat Map Legend Less Than 60% Agreement 60% to 75% agreement Greater than 75% Agreement
Table 27 Workload, Staffing and Resources - 2014 – 2021 Trends
Survey Items: Workload, Staffing and Resources 2014 2015 2016 2017 2019 2021 % Change
Question % Agree % Agree % Agree % Agree % Agree % Agree Average '19 to '21 Q32. My Agency or Department has the staffing necessary to achieve its mission. 30.1% 26.9% 35.1% 36.4% 36.4% 33.0% 33.0% -9.5% Q33. The amount of work I am expected to perform is reasonable. 49.3% 50.0% 54.2% 56.3% 55.5% 52.7% 53.0% -5.1% Q34. My job allows a good balance between work and my personal life. 56.9% 58.2% 61.7% 63.4% 63.1% 59.9% 60.5% -5.0% Q35. I have the resources to do my job well. 52.8% 54.7% 59.2% 59.6% 59.3% 61.2% 57.8% 3.1% Q36. My Agency or Department has the technology needed to get the work done. 48.8% 52.6% 56.5% 55.5% 54.9% 60.0% 54.7% 9.3% Q37. My physical working environment is reasonable for my type of work. 73.6% 76.8% 78.8% 78.1% 78.5% 81.3% 77.9% 3.6% Q38. I feel safe and secure in my work environment. 76.7% 72.3% 77.6% 78.8% 78.8% 83.4% 77.9% 5.8%
In 2021 only one-third of respondents agreed that their department or agency has the staffing and resources necessary to achieve its mission. This was a drop of 9.5% from the 2019 survey to the 2021 survey and again is most likely attributable to the increased workload and demands of the pandemic and the State's response. Similarly, just over half 52.7 of all respondents agreed that the amount of work they are expected to perform is reasonable, this is a decrease (5.1%) from 2019. A higher percentage agreed that their job and work environment allow for a good balance between work and their personal life (59.9%), this is a decrease of 5%.
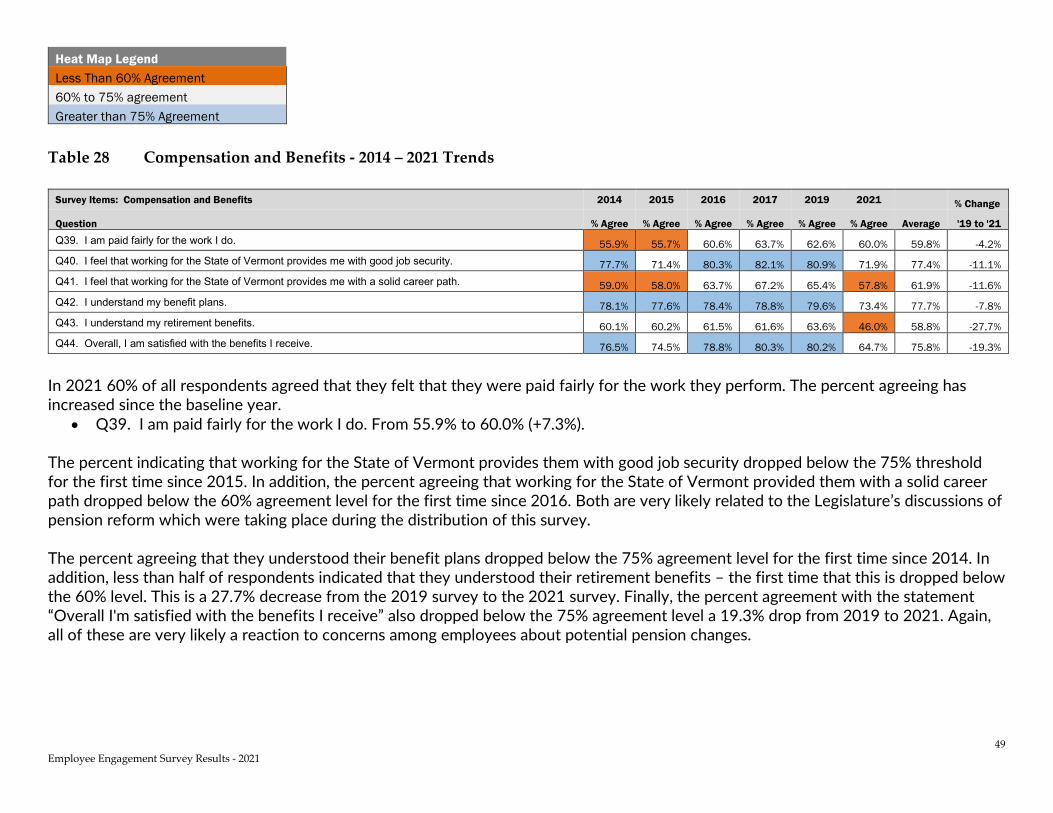
49 Employee Engagement Survey Results - 2021
Heat Map Legend Less Than 60% Agreement 60% to 75% agreement Greater than 75% Agreement
Table 28 Compensation and Benefits - 2014 – 2021 Trends
Survey Items: Compensation and Benefits 2014 2015 2016 2017 2019 2021 % Change
Question % Agree % Agree % Agree % Agree % Agree % Agree Average '19 to '21 Q39. I am paid fairly for the work I do. 55.9% 55.7% 60.6% 63.7% 62.6% 60.0% 59.8% -4.2% Q40. I feel that working for the State of Vermont provides me with good job security. 77.7% 71.4% 80.3% 82.1% 80.9% 71.9% 77.4% -11.1% Q41. I feel that working for the State of Vermont provides me with a solid career path. 59.0% 58.0% 63.7% 67.2% 65.4% 57.8% 61.9% -11.6% Q42. I understand my benefit plans. 78.1% 77.6% 78.4% 78.8% 79.6% 73.4% 77.7% -7.8% Q43. I understand my retirement benefits. 60.1% 60.2% 61.5% 61.6% 63.6% 46.0% 58.8% -27.7% Q44. Overall, I am satisfied with the benefits I receive. 76.5% 74.5% 78.8% 80.3% 80.2% 64.7% 75.8% -19.3%
In 2021 60% of all respondents agreed that they felt that they were paid fairly for the work they perform. The percent agreeing has increased since the baseline year.
• Q39. I am paid fairly for the work I do. From 55.9% to 60.0% (+7.3%). The percent indicating that working for the State of Vermont provides them with good job security dropped below the 75% threshold for the first time since 2015. In addition, the percent agreeing that working for the State of Vermont provided them with a solid career path dropped below the 60% agreement level for the first time since 2016. Both are very likely related to the Legislature’s discussions of pension reform which were taking place during the distribution of this survey. The percent agreeing that they understood their benefit plans dropped below the 75% agreement level for the first time since 2014. In addition, less than half of respondents indicated that they understood their retirement benefits – the first time that this is dropped below the 60% level. This is a 27.7% decrease from the 2019 survey to the 2021 survey. Finally, the percent agreement with the statement “Overall I'm satisfied with the benefits I receive” also dropped below the 75% agreement level a 19.3% drop from 2019 to 2021. Again, all of these are very likely a reaction to concerns among employees about potential pension changes.
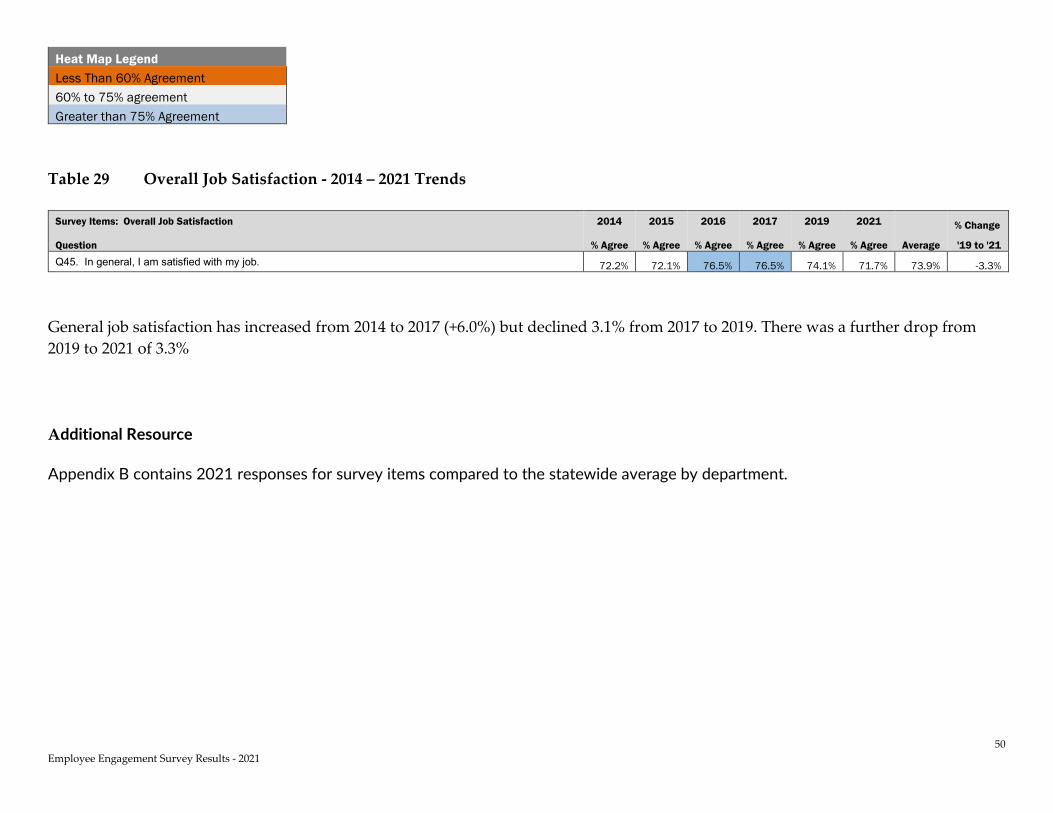
50 Employee Engagement Survey Results - 2021
Heat Map Legend Less Than 60% Agreement 60% to 75% agreement Greater than 75% Agreement
Table 29 Overall Job Satisfaction - 2014 – 2021 Trends
Survey Items: Overall Job Satisfaction 2014 2015 2016 2017 2019 2021 % Change
Question % Agree % Agree % Agree % Agree % Agree % Agree Average '19 to '21 Q45. In general, I am satisfied with my job. 72.2% 72.1% 76.5% 76.5% 74.1% 71.7% 73.9% -3.3%
General job satisfaction has increased from 2014 to 2017 (+6.0%) but declined 3.1% from 2017 to 2019. There was a further drop from 2019 to 2021 of 3.3% Additional Resource Appendix B contains 2021 responses for survey items compared to the statewide average by department.
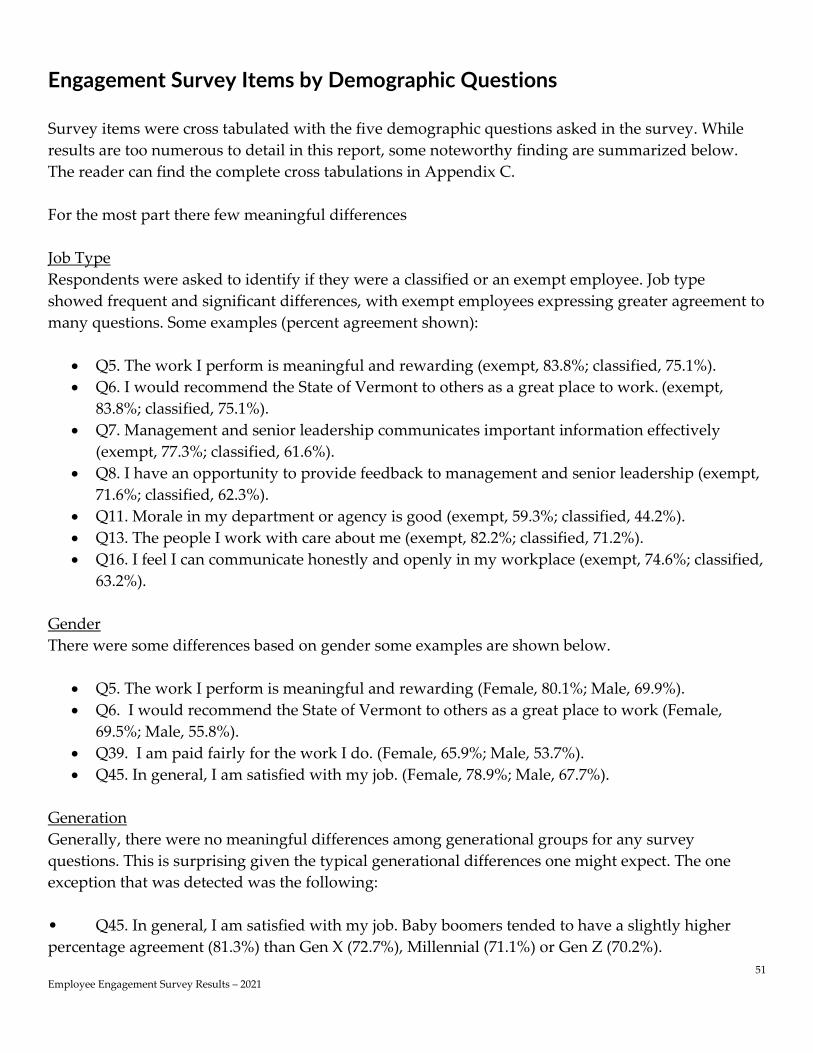
51 Employee Engagement Survey Results – 2021
Engagement Survey Items by Demographic Questions Survey items were cross tabulated with the five demographic questions asked in the survey. While results are too numerous to detail in this report, some noteworthy finding are summarized below. The reader can find the complete cross tabulations in Appendix C. For the most part there few meaningful differences Job Type Respondents were asked to identify if they were a classified or an exempt employee. Job type showed frequent and significant differences, with exempt employees expressing greater agreement to many questions. Some examples (percent agreement shown):
• Q5. The work I perform is meaningful and rewarding (exempt, 83.8%; classified, 75.1%). • Q6. I would recommend the State of Vermont to others as a great place to work. (exempt,
83.8%; classified, 75.1%). • Q7. Management and senior leadership communicates important information effectively
(exempt, 77.3%; classified, 61.6%). • Q8. I have an opportunity to provide feedback to management and senior leadership (exempt,
71.6%; classified, 62.3%). • Q11. Morale in my department or agency is good (exempt, 59.3%; classified, 44.2%). • Q13. The people I work with care about me (exempt, 82.2%; classified, 71.2%). • Q16. I feel I can communicate honestly and openly in my workplace (exempt, 74.6%; classified,
63.2%). Gender There were some differences based on gender some examples are shown below.
• Q5. The work I perform is meaningful and rewarding (Female, 80.1%; Male, 69.9%). • Q6. I would recommend the State of Vermont to others as a great place to work (Female,
69.5%; Male, 55.8%). • Q39. I am paid fairly for the work I do. (Female, 65.9%; Male, 53.7%). • Q45. In general, I am satisfied with my job. (Female, 78.9%; Male, 67.7%).
Generation Generally, there were no meaningful differences among generational groups for any survey questions. This is surprising given the typical generational differences one might expect. The one exception that was detected was the following: • Q45. In general, I am satisfied with my job. Baby boomers tended to have a slightly higher percentage agreement (81.3%) than Gen X (72.7%), Millennial (71.1%) or Gen Z (70.2%).
52 Employee Engagement Survey Results - 2021
EEO-4 Ethnic Groups Respondents were asked “Do you identify as any of the following groups: American Indian or Alaskan Native (Non-Hispanic or Latino), Asian (Non-Hispanic or Latino), Black or African American (Non-Hispanic or Latino), Hispanic or Latino, Native Hawaiian or Other Pacific Islander (Non-Hispanic or Latino), or Two or More Races (Non-Hispanic or Latino)?” For the most part, we did not find many meaningful differences among respondents answering yes but the “N” (sample size) was quite small (173) so our ability to detect differences was difficult. Some examples of where we did find important differences: NOTE: Yes = Identify as EEO-4 ethnic group as listed above. No = Did not identify as EEO-4 ethnic group as listed above.
• Q16. I feel I can communicate honestly and openly in my workplace (Yes, 55.8%; No, 65.4%). • Q17. Harassment is not tolerated in my workplace. (Yes, 70.3%; No, 81.7%). • Q18. Discrimination is not tolerated in my workplace. (Yes, 68.8%; No, 82.9%). • Q39. I am paid fairly for the work I do. (Yes, 49.7%; No, 62.2%). • Q50. In my Agency/Department, employees interact well with others whose backgrounds,
beliefs and experiences are different from their own. (Yes, 61.6%; No, 71.4%). Management Level Respondents were asked to identify if they were a manager/supervisor or not a manager or supervisor. Much like job type, there were frequent and significant differences, with managers/supervisors often expressing greater agreement to many questions. Some examples (percent agreement shown):
• Q8. I have an opportunity to provide feedback to management and senior leadership (manager/supervisor, 72.4%; not manager or supervisor, 60.7%).
• Q16. I feel I can communicate honestly and openly in my workplace (manager/supervisor, 71.9%; not manager or supervisor, 61.5%).
• Q33. The amount of work I am expected to perform is reasonable. (manager/supervisor, 44.7%; not manager or supervisor, 57.0%).
• Q46. My Agency/Department has an inclusive work environment where staff diversity at all levels is valued and encouraged. (manager/supervisor, 76.4%; not manager or supervisor, 66.7%).
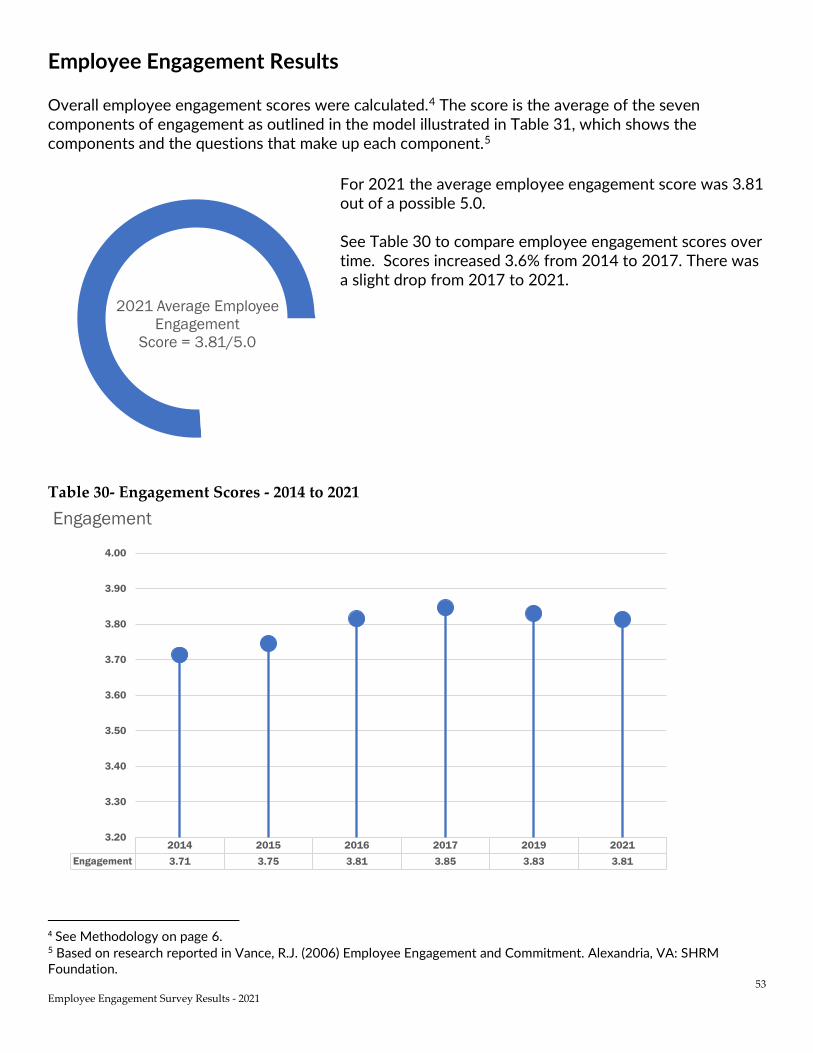
53 Employee Engagement Survey Results - 2021
Employee Engagement Results Overall employee engagement scores were calculated.4 The score is the average of the seven components of engagement as outlined in the model illustrated in Table 31, which shows the components and the questions that make up each component.5
For 2021 the average employee engagement score was 3.81 out of a possible 5.0. See Table 30 to compare employee engagement scores over time. Scores increased 3.6% from 2014 to 2017. There was a slight drop from 2017 to 2021.
Table 30- Engagement Scores - 2014 to 2021
4 See Methodology on page 6. 5 Based on research reported in Vance, R.J. (2006) Employee Engagement and Commitment. Alexandria, VA: SHRM Foundation.
2014 2015 2016 2017 2019 2021Engagement 3.71 3.75 3.81 3.85 3.83 3.81
3.20
3.30
3.40
3.50
3.60
3.70
3.80
3.90
4.00
Engagement
2021 Average Employee Engagement
Score = 3.81/5.0
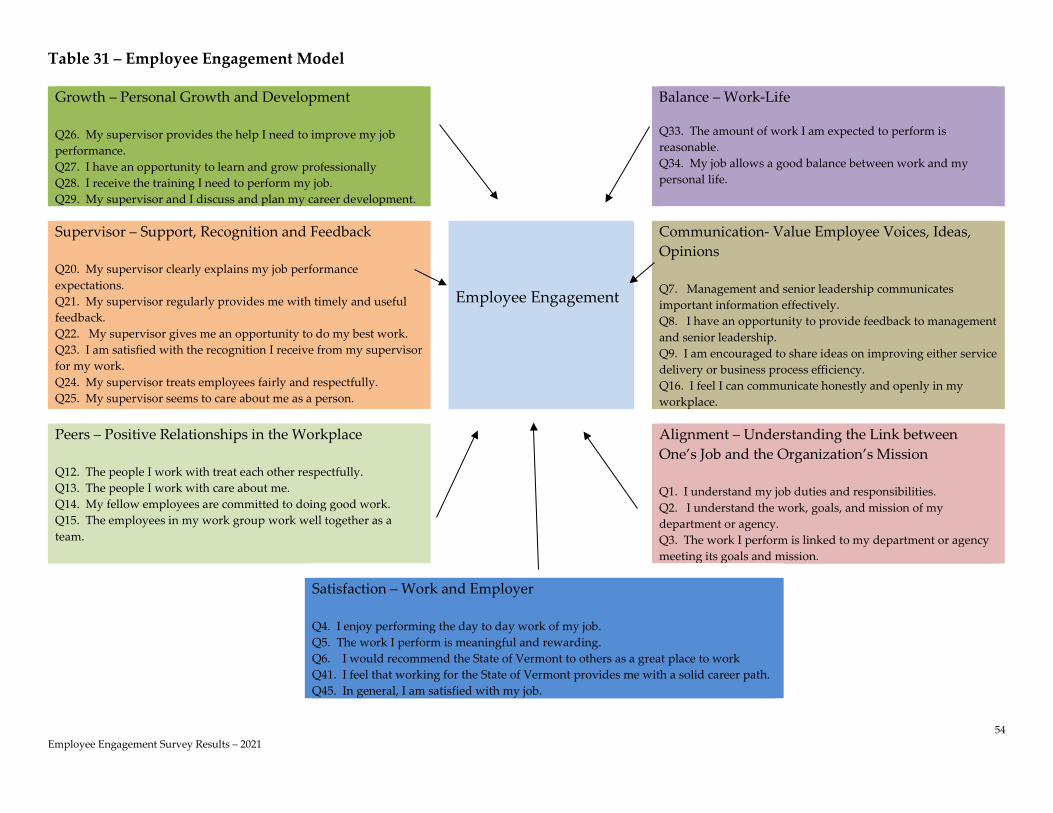
54 Employee Engagement Survey Results – 2021
Table 31 – Employee Engagement Model Growth – Personal Growth and Development Q26. My supervisor provides the help I need to improve my job performance. Q27. I have an opportunity to learn and grow professionally Q28. I receive the training I need to perform my job. Q29. My supervisor and I discuss and plan my career development.
Balance – Work-Life Q33. The amount of work I am expected to perform is reasonable. Q34. My job allows a good balance between work and my personal life.
Supervisor – Support, Recognition and Feedback Q20. My supervisor clearly explains my job performance expectations. Q21. My supervisor regularly provides me with timely and useful feedback. Q22. My supervisor gives me an opportunity to do my best work. Q23. I am satisfied with the recognition I receive from my supervisor for my work. Q24. My supervisor treats employees fairly and respectfully. Q25. My supervisor seems to care about me as a person.
Employee Engagement
Communication- Value Employee Voices, Ideas, Opinions Q7. Management and senior leadership communicates important information effectively. Q8. I have an opportunity to provide feedback to management and senior leadership. Q9. I am encouraged to share ideas on improving either service delivery or business process efficiency. Q16. I feel I can communicate honestly and openly in my workplace.
Peers – Positive Relationships in the Workplace Q12. The people I work with treat each other respectfully. Q13. The people I work with care about me. Q14. My fellow employees are committed to doing good work. Q15. The employees in my work group work well together as a team.
Alignment – Understanding the Link between One’s Job and the Organization’s Mission Q1. I understand my job duties and responsibilities. Q2. I understand the work, goals, and mission of my department or agency. Q3. The work I perform is linked to my department or agency meeting its goals and mission.
Satisfaction – Work and Employer
Q4. I enjoy performing the day to day work of my job. Q5. The work I perform is meaningful and rewarding. Q6. I would recommend the State of Vermont to others as a great place to work Q41. I feel that working for the State of Vermont provides me with a solid career path. Q45. In general, I am satisfied with my job.
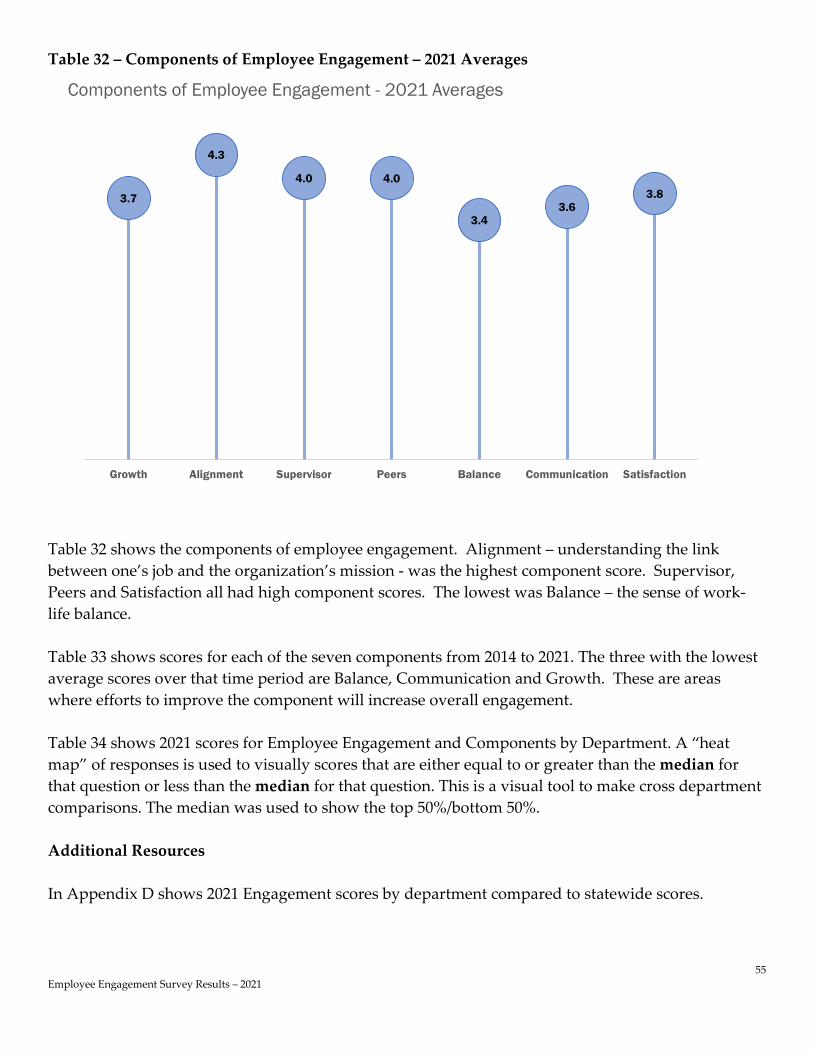
55 Employee Engagement Survey Results – 2021
Table 32 – Components of Employee Engagement – 2021 Averages
Table 32 shows the components of employee engagement. Alignment – understanding the link between one’s job and the organization’s mission - was the highest component score. Supervisor, Peers and Satisfaction all had high component scores. The lowest was Balance – the sense of work-life balance. Table 33 shows scores for each of the seven components from 2014 to 2021. The three with the lowest average scores over that time period are Balance, Communication and Growth. These are areas where efforts to improve the component will increase overall engagement. Table 34 shows 2021 scores for Employee Engagement and Components by Department. A “heat map” of responses is used to visually scores that are either equal to or greater than the median for that question or less than the median for that question. This is a visual tool to make cross department comparisons. The median was used to show the top 50%/bottom 50%. Additional Resources In Appendix D shows 2021 Engagement scores by department compared to statewide scores.
3.7
4.3
4.0 4.0
3.43.6
3.8
Growth Alignment Supervisor Peers Balance Communication Satisfaction
Components of Employee Engagement - 2021 Averages
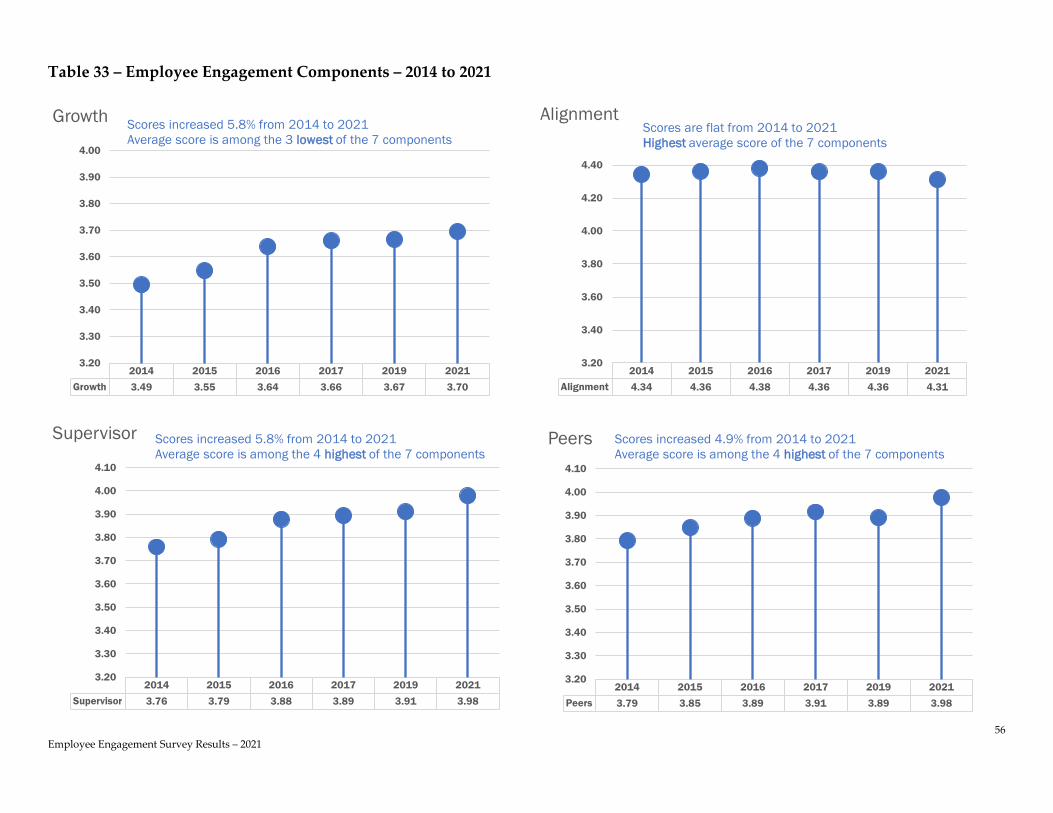
56 Employee Engagement Survey Results – 2021
Table 33 – Employee Engagement Components – 2014 to 2021
2014 2015 2016 2017 2019 2021Growth 3.49 3.55 3.64 3.66 3.67 3.70
3.20
3.30
3.40
3.50
3.60
3.70
3.80
3.90
4.00
Growth Scores increased 5.8% from 2014 to 2021Average score is among the 3 lowest of the 7 components
2014 2015 2016 2017 2019 2021Supervisor 3.76 3.79 3.88 3.89 3.91 3.98
3.20
3.30
3.40
3.50
3.60
3.70
3.80
3.90
4.00
4.10
Supervisor Scores increased 5.8% from 2014 to 2021Average score is among the 4 highest of the 7 components
2014 2015 2016 2017 2019 2021Alignment 4.34 4.36 4.38 4.36 4.36 4.31
3.20
3.40
3.60
3.80
4.00
4.20
4.40
AlignmentScores are flat from 2014 to 2021Highest average score of the 7 components
2014 2015 2016 2017 2019 2021Peers 3.79 3.85 3.89 3.91 3.89 3.98
3.20
3.30
3.40
3.50
3.60
3.70
3.80
3.90
4.00
4.10
Peers Scores increased 4.9% from 2014 to 2021Average score is among the 4 highest of the 7 components

57 Employee Engagement Survey Results - 2021
Table 33 – (cont.)
2014 2015 2016 2017 2019 2021Balance 3.29 3.34 3.45 3.47 3.45 3.39
3.20
3.30
3.40
3.50
3.60
3.70
3.80
3.90
4.00
Balance Scores increased 3.0% from 2014 to 2021Lowest average score of the 7 components
2014 2015 2016 2017 2019 2021Satisfaction 3.86 3.82 3.91 3.93 3.89 3.76
3.20
3.30
3.40
3.50
3.60
3.70
3.80
3.90
4.00
Satisfaction Scores are flat from 2014 to 2019. Score dropped -3.5% from 2019 to 2021.Average score is among the 4 highest of the 7 components
2014 2015 2016 2017 2019 2021Communication 3.42 3.48 3.54 3.65 3.64 3.57
3.20
3.30
3.40
3.50
3.60
3.70
3.80
3.90
4.00
Communication Scores increased 4.5% from 2014 to 2021Average score is among the 3 lowest of the 7 components
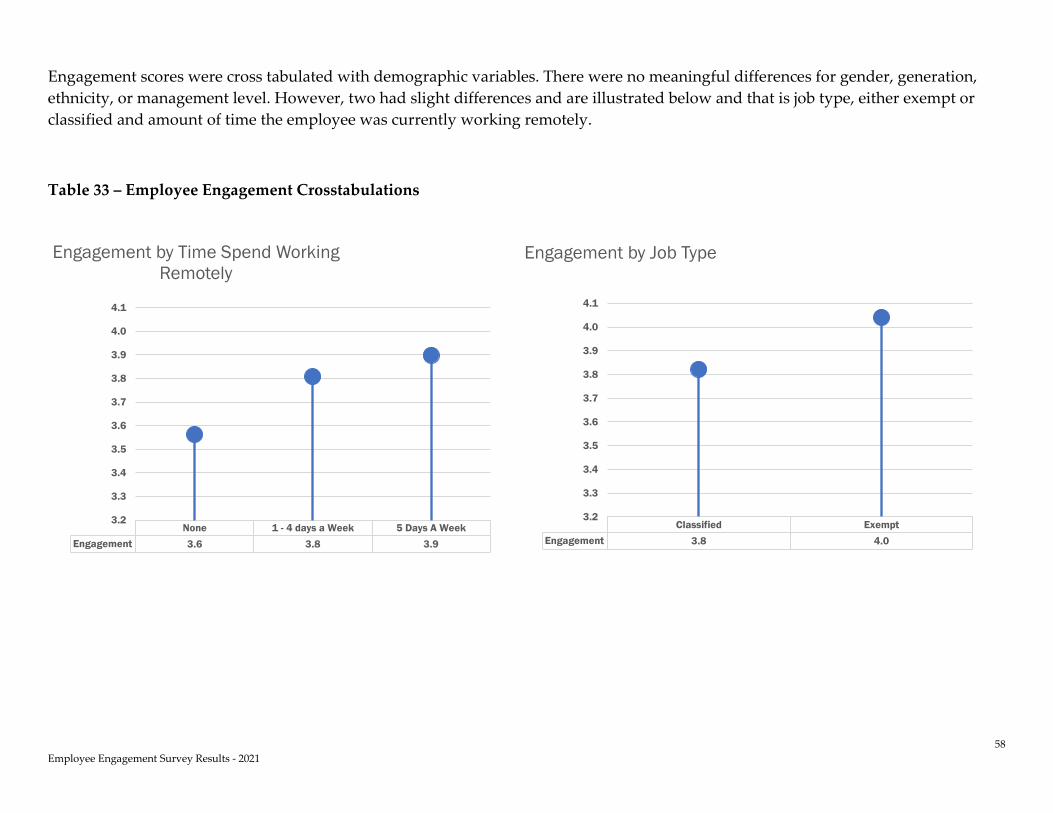
58 Employee Engagement Survey Results - 2021
Engagement scores were cross tabulated with demographic variables. There were no meaningful differences for gender, generation, ethnicity, or management level. However, two had slight differences and are illustrated below and that is job type, either exempt or classified and amount of time the employee was currently working remotely.
Table 33 – Employee Engagement Crosstabulations
None 1 - 4 days a Week 5 Days A WeekEngagement 3.6 3.8 3.9
3.2
3.3
3.4
3.5
3.6
3.7
3.8
3.9
4.0
4.1
Engagement by Time Spend Working Remotely
Classified ExemptEngagement 3.8 4.0
3.2
3.3
3.4
3.5
3.6
3.7
3.8
3.9
4.0
4.1
Engagement by Job Type

59 Employee Engagement Survey Results – 2021
Table 34 2021 Scores for Employee Engagement and Components by Department
Department Growth Balance Supervisor Communication Peers Alignment Satisfaction Engagement
Agency of Administration 3.9 3.6 4.2 4.2 4.1 4.3 4.2 4.1
Agency of Human Services 3.7 3.4 4.0 3.6 4.1 4.4 3.9 3.9
Agency of Natural Resources 3.6 3.6 4.0 3.9 3.9 4.4 3.8 3.9
Agriculture, Food & Markets 3.9 3.8 4.3 4.0 4.3 4.3 4.1 4.1
Attorney General 3.8 3.5 4.3 3.7 4.3 4.5 4.0 4.0
Auditor of Accounts 4.1 4.6 4.2 4.0 4.3 4.7 4.5 4.3
Buildings & General Services 3.7 3.7 4.0 3.7 3.9 4.4 3.9 3.9
Children & Families 3.7 3.2 4.0 3.5 4.0 4.4 3.8 3.8
Commerce & Community Dev. 3.5 3.1 3.9 3.7 4.2 4.3 3.8 3.8
Corrections 3.4 2.8 3.7 3.0 3.5 3.9 3.2 3.4
Criminal Justice Training Council 3.9 3.4 4.1 4.3 4.5 4.4 4.2 4.1
DAIL 4.0 3.6 4.2 4.0 4.4 4.5 4.2 4.1
Defender General 3.9 3.4 4.1 3.8 4.1 4.7 4.2 4.0
Digital Services 3.6 3.6 4.0 3.6 4.0 4.2 3.6 3.8
Education 3.7 3.4 4.1 3.1 4.0 4.0 3.6 3.7
Enhanced 911 Board 3.4 3.5 4.0 3.9 4.3 4.7 4.1 4.0
Environmental Conservation 3.7 3.1 4.1 3.7 4.1 4.3 3.7 3.8
Finance & Management 3.7 3.9 3.9 3.7 4.1 4.3 3.8 3.9
Financial Regulation 4.1 4.1 4.2 4.0 4.3 4.6 4.2 4.2
Fish & Wildlife 3.8 3.3 4.1 3.6 4.2 4.4 3.9 3.9
Forests, Parks & Recreation 3.9 3.1 4.2 3.8 4.2 4.4 3.8 3.9
Green Mountain Care Board 4.0 3.8 4.2 4.0 4.5 4.4 4.0 4.1
Health 3.6 2.9 3.9 3.4 4.2 4.2 3.7 3.7
Human Resources 4.0 3.8 4.3 3.9 4.3 4.6 4.1 4.1
Labor 3.4 3.4 3.8 3.6 3.9 4.2 3.8 3.7
Libraries 4.2 3.7 4.4 4.2 4.3 4.3 3.8 4.1
Liquor & Lottery 3.6 3.3 3.8 3.5 4.2 4.5 3.8 3.8
Mental Health 3.5 3.5 3.8 3.6 4.0 4.2 3.7 3.7
Military 3.7 3.7 3.8 3.5 3.7 4.4 3.9 3.8
Motor Vehicles 3.5 3.4 3.8 3.1 3.6 4.3 3.7 3.6
Natural Resources Board 3.0 2.7 3.2 2.6 3.9 4.4 3.4 3.3
Public Safety 3.6 3.0 3.9 3.2 3.9 4.3 3.5 3.6
Public Service Department 3.6 3.4 4.0 3.5 4.0 4.2 3.7 3.8
Public Utilities Commission 3.8 3.8 3.9 3.9 3.9 4.6 4.0 4.0
Secretary of State 3.7 3.6 4.0 3.7 4.0 4.4 4.0 3.9
State Treasurer 4.0 3.6 4.2 3.8 4.4 4.5 4.0 4.1
Taxes 3.8 3.7 4.1 3.9 4.0 4.4 3.9 4.0
Transportation (not DMV) 3.8 3.5 3.9 3.5 3.8 4.2 3.6 3.8
Vermont Health Access 3.9 3.8 4.2 3.8 4.1 4.4 4.0 4.0
Veterans' Home 3.6 3.3 3.8 3.5 3.4 4.4 4.0 3.7
Median 3.7 3.5 4.0 3.7 4.1 4.4 3.9 3.9
Heat Map Legend Above Median Score Below Median Score
60 Employee Engagement Survey Results – 2021
Qualitative Analysis of Open-Ended Question Responses Overview In addition to the 45 employee engagement survey items, an optional open-ended question was provided to survey participants:
Please provide any comments you may have about ways to make the State of Vermont a better place to work.
Out of the 4,955 employees who responded to the survey, 2,048 provided a response to the open-ended question for a response rate of 41%. A trained rater analyzed and coded each comment for major themes. Major themes were named based on what was interpreted to be the key idea or ideas expressed in the response (based on key words or phrases that were commonly used). In addition, the raters coded whether the comment theme expressed was clearly “a concern,” “positive,” or “neutral.” A multiple response analysis was conducted since a single respondent’s comment could be coded for up to five themes. The “N” is the number of respondents who selected that response option. The “Percent of Cases” is the percentage of the cases (i.e., survey respondents) accounted for by this category. This column's sum will be greater than 100%, but the individual percentages can be interpreted as the prevalence of that option among the survey sample. Results The 2,048 comments contained over 3,766 thematic ideas. The two top themes reflect the timing of this survey. As has been mentioned before in this report at the time of the survey the legislature was considering changes to the state's pension system. In addition, guidance on return to work had not yet been issued. Nearly 28% of all respondent comments contained expressions of concerns about reforms being proposed for the State of Vermont’s pension system. In addition, nearly 26% of all respondent comments contained positive comments related to remote work.
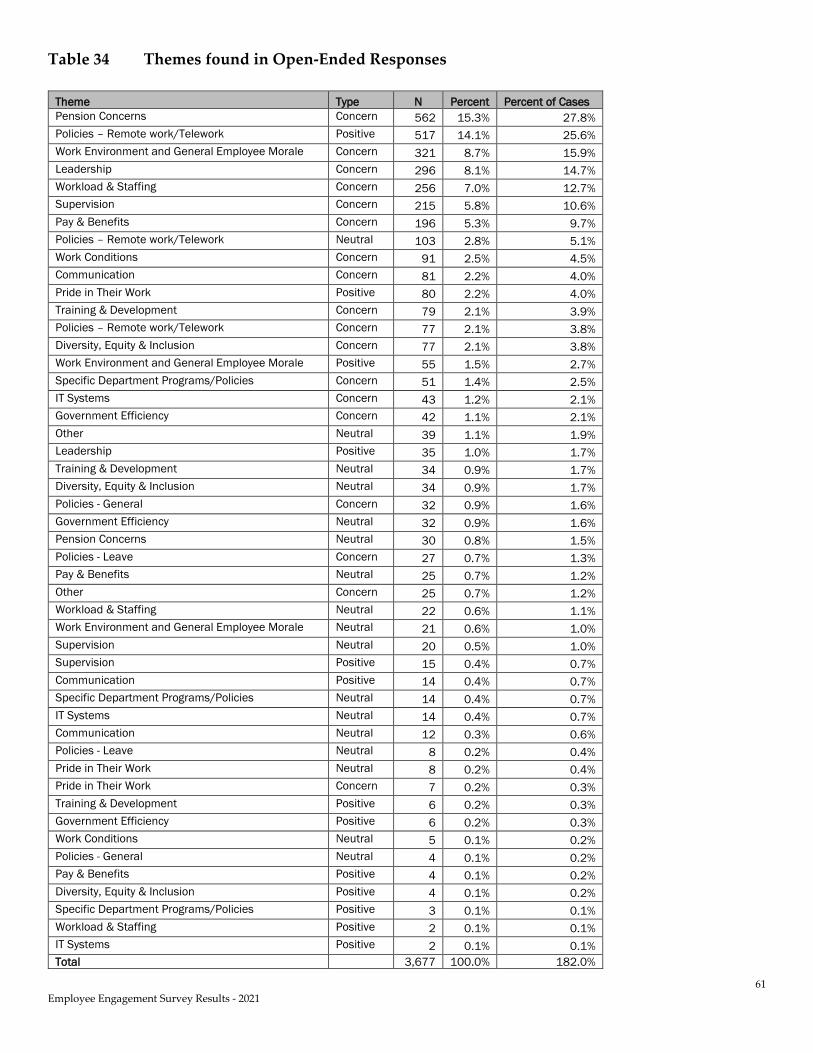
61 Employee Engagement Survey Results - 2021
Table 34 Themes found in Open-Ended Responses
Theme Type N Percent Percent of Cases Pension Concerns Concern 562 15.3% 27.8% Policies – Remote work/Telework Positive 517 14.1% 25.6% Work Environment and General Employee Morale Concern 321 8.7% 15.9% Leadership Concern 296 8.1% 14.7% Workload & Staffing Concern 256 7.0% 12.7% Supervision Concern 215 5.8% 10.6% Pay & Benefits Concern 196 5.3% 9.7% Policies – Remote work/Telework Neutral 103 2.8% 5.1% Work Conditions Concern 91 2.5% 4.5% Communication Concern 81 2.2% 4.0% Pride in Their Work Positive 80 2.2% 4.0% Training & Development Concern 79 2.1% 3.9% Policies – Remote work/Telework Concern 77 2.1% 3.8% Diversity, Equity & Inclusion Concern 77 2.1% 3.8% Work Environment and General Employee Morale Positive 55 1.5% 2.7% Specific Department Programs/Policies Concern 51 1.4% 2.5% IT Systems Concern 43 1.2% 2.1% Government Efficiency Concern 42 1.1% 2.1% Other Neutral 39 1.1% 1.9% Leadership Positive 35 1.0% 1.7% Training & Development Neutral 34 0.9% 1.7% Diversity, Equity & Inclusion Neutral 34 0.9% 1.7% Policies - General Concern 32 0.9% 1.6% Government Efficiency Neutral 32 0.9% 1.6% Pension Concerns Neutral 30 0.8% 1.5% Policies - Leave Concern 27 0.7% 1.3% Pay & Benefits Neutral 25 0.7% 1.2% Other Concern 25 0.7% 1.2% Workload & Staffing Neutral 22 0.6% 1.1% Work Environment and General Employee Morale Neutral 21 0.6% 1.0% Supervision Neutral 20 0.5% 1.0% Supervision Positive 15 0.4% 0.7% Communication Positive 14 0.4% 0.7% Specific Department Programs/Policies Neutral 14 0.4% 0.7% IT Systems Neutral 14 0.4% 0.7% Communication Neutral 12 0.3% 0.6% Policies - Leave Neutral 8 0.2% 0.4% Pride in Their Work Neutral 8 0.2% 0.4% Pride in Their Work Concern 7 0.2% 0.3% Training & Development Positive 6 0.2% 0.3% Government Efficiency Positive 6 0.2% 0.3% Work Conditions Neutral 5 0.1% 0.2% Policies - General Neutral 4 0.1% 0.2% Pay & Benefits Positive 4 0.1% 0.2% Diversity, Equity & Inclusion Positive 4 0.1% 0.2% Specific Department Programs/Policies Positive 3 0.1% 0.1% Workload & Staffing Positive 2 0.1% 0.1% IT Systems Positive 2 0.1% 0.1% Total 3,677 100.0% 182.0%
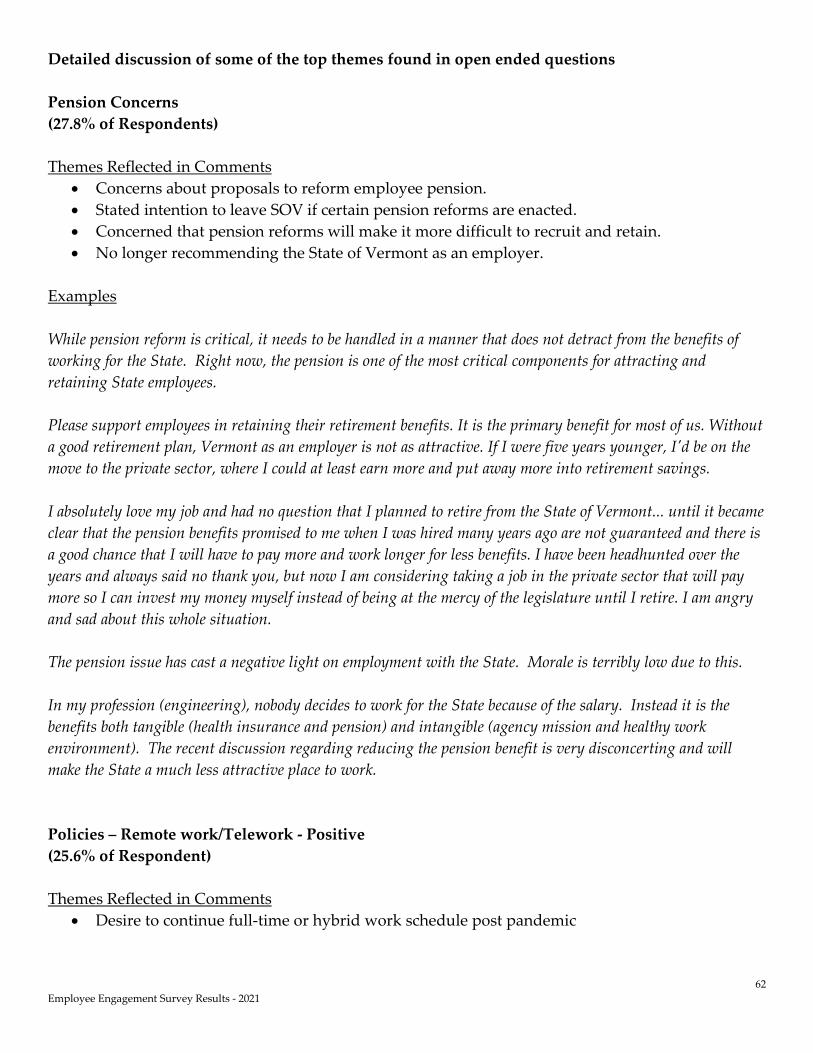
62 Employee Engagement Survey Results - 2021
Detailed discussion of some of the top themes found in open ended questions Pension Concerns (27.8% of Respondents) Themes Reflected in Comments
• Concerns about proposals to reform employee pension. • Stated intention to leave SOV if certain pension reforms are enacted. • Concerned that pension reforms will make it more difficult to recruit and retain. • No longer recommending the State of Vermont as an employer.
Examples While pension reform is critical, it needs to be handled in a manner that does not detract from the benefits of working for the State. Right now, the pension is one of the most critical components for attracting and retaining State employees. Please support employees in retaining their retirement benefits. It is the primary benefit for most of us. Without a good retirement plan, Vermont as an employer is not as attractive. If I were five years younger, I'd be on the move to the private sector, where I could at least earn more and put away more into retirement savings. I absolutely love my job and had no question that I planned to retire from the State of Vermont... until it became clear that the pension benefits promised to me when I was hired many years ago are not guaranteed and there is a good chance that I will have to pay more and work longer for less benefits. I have been headhunted over the years and always said no thank you, but now I am considering taking a job in the private sector that will pay more so I can invest my money myself instead of being at the mercy of the legislature until I retire. I am angry and sad about this whole situation. The pension issue has cast a negative light on employment with the State. Morale is terribly low due to this. In my profession (engineering), nobody decides to work for the State because of the salary. Instead it is the benefits both tangible (health insurance and pension) and intangible (agency mission and healthy work environment). The recent discussion regarding reducing the pension benefit is very disconcerting and will make the State a much less attractive place to work. Policies – Remote work/Telework - Positive (25.6% of Respondent) Themes Reflected in Comments
• Desire to continue full-time or hybrid work schedule post pandemic
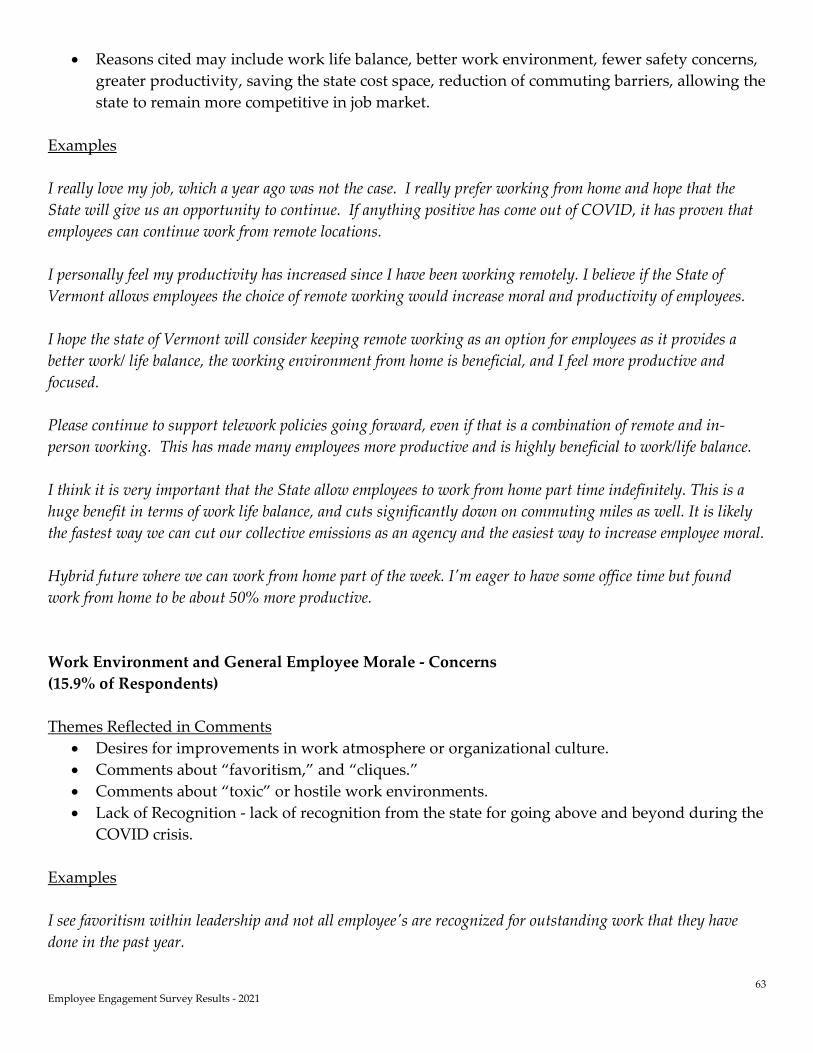
63 Employee Engagement Survey Results - 2021
• Reasons cited may include work life balance, better work environment, fewer safety concerns, greater productivity, saving the state cost space, reduction of commuting barriers, allowing the state to remain more competitive in job market.
Examples I really love my job, which a year ago was not the case. I really prefer working from home and hope that the State will give us an opportunity to continue. If anything positive has come out of COVID, it has proven that employees can continue work from remote locations. I personally feel my productivity has increased since I have been working remotely. I believe if the State of Vermont allows employees the choice of remote working would increase moral and productivity of employees. I hope the state of Vermont will consider keeping remote working as an option for employees as it provides a better work/ life balance, the working environment from home is beneficial, and I feel more productive and focused. Please continue to support telework policies going forward, even if that is a combination of remote and in-person working. This has made many employees more productive and is highly beneficial to work/life balance. I think it is very important that the State allow employees to work from home part time indefinitely. This is a huge benefit in terms of work life balance, and cuts significantly down on commuting miles as well. It is likely the fastest way we can cut our collective emissions as an agency and the easiest way to increase employee moral. Hybrid future where we can work from home part of the week. I'm eager to have some office time but found work from home to be about 50% more productive. Work Environment and General Employee Morale - Concerns (15.9% of Respondents) Themes Reflected in Comments
• Desires for improvements in work atmosphere or organizational culture. • Comments about “favoritism,” and “cliques.” • Comments about “toxic” or hostile work environments. • Lack of Recognition - lack of recognition from the state for going above and beyond during the
COVID crisis. Examples I see favoritism within leadership and not all employee's are recognized for outstanding work that they have done in the past year.
64 Employee Engagement Survey Results - 2021
We get the opportunity to fill these surveys out every year, but I rarely see any changes. If management has courses on how to be a manager, then there should be courses for staff on how to deal with toxic supervisors and/or directors. I work in a division where my supervisor is not allowed to be a leader, but has to be a follower and has to always agree with the unit's director. He is not allowed to advocate for his team. When we all spoke up, my supervisor and my director have quickly dismissed (gaslight) how we felt. I believe that staff should be respectful to their managers and supervisors, but I started to noticed that they don't treat us equally, and that we don't have a voice. Leadership – Concerns (14.7% of respondents) Themes Reflected in Comments
• Desire for more effective leadership. • Increased communication/listening to staff. have a night • Better working relationships between leaders and staff. • Treating staff respectfully and fairly. • Open to feedback. • (Comments coded here typically refer to department/agency management).
Examples Communication from upper management is lacking, as we often find out about what's going on after the field. There needs to be a better way to keep employees informed of important initiatives. I would encourage senior leadership in my Agency to respect the collective expertise of its staff. Not doing so is negatively affecting staff morale, especially at the least senior levels of the organization. Accountability among leadership regarding professionalism and respectful interactions needs to be addressed. Leadership communication from the top down is nonexistent. Our main source for information is VT Digger and WCAX. We don't feel valued for being experts in our respective fields. Workload & Staffing – Concerns (12.7% of Respondents) Themes Reflected in Comments
• Concerns about heavy workload • Concerns about staffing/workload their ability to provide services, • Concerns about understaffing • Improving hiring practices and filling vacancies in a timely manner
65 Employee Engagement Survey Results - 2021
Examples: We are experiencing huge increases in workload/project assignments and have fewer staff in our team. This workload is unsustainable and is resulting in a combination of not being able to complete tasks and staff anxiety and burn out. The site I work at is desperate for staff. Those that remain are over worked and exhausted, with no help in sight. We need mission critical communications equipment, we're told there's no money for it, yet management and casework staff got all new laptops, and the dep't is getting all new uniforms. I am actively searching for another job within the State, if the search for appropriate placement proves fruitless over the next few months I will leave State service. The public has the concept that the State has too many employees, but in reality, there are many areas in which efficient work cannot be completed because employees are overworked and time is limited. Being able to have additional positions would make the production, accuracy, efficiency of some programs much higher. Educate the public about this. We are woefully understaffed, and yet job responsibilities continue to get piled on with unreasonable expectations of continuing to have workloads that should be done by additional staff. The dedicated staff work hard and go "above and beyond" to get important work accomplished because they believe in the departments mission and think the work is important. However, it regularly (almost always) goes unrecognized and not appreciated, and only makes the situation worse in the long run because it perpetuated the unreasonable expectations, when leadership sees such great work being accomplished. Supervision – Concerns (10.6% of Respondents) Themes Reflected in Comments
• Reward and recognition of staff • Feedback on work performed • Performance evaluations • Effectively dealing with work-related interpersonal situations • Performance management/Holding employees accountable for work performance and
professional behavior. • (Comments coded here are related to one’s direct supervisor).
Examples SOV is a great place to work, but inexperienced supervision can affect morale and create unnecessary stress on employees. Accountability needs to become a major focus for the State of Vermont

66 Employee Engagement Survey Results - 2021
I think it is important to hold people accountable for their work and their productivity. It is hard to work in an environment where the supervisor cannot communicate effectively, as it commonly leads to a downward spiral of effects. First they cannot communicate what they wish to be done, so we do what we think they told us to do, and then they become upset when our actions did not yield the expected goal. Then, because we did not yield the desired results, we get another explanation and it only serves to confuse us even more I wish my supervisor had a more in-depth understanding of how to perform the duties of my position on a daily basis. There are aspects of the position that I think my supervisor could gain a better understanding and knowledge of actual daily operations. Pay & Benefits – Concerns (9.7% of Respondents) Themes Reflected in Comments • Pay for Performance/Raises based on merit not longevity. • Concerns about equity in job titles and the job classification process. • More competitive pay/based on market. The State really needs to bring the licensed trades people wage scale into a much more competitive comparison to the private sector, as there are fewer candidates from which to choose to fill existing positions as they are vacated by the older employees. Pay grades could be reevaluated and merit awards could be used more frequently. I also would like to see a change to personal leave time to consider offering that time regardless of sick time used. Parents often use more sick time due to sick kids which seems unfair to take their personal time away because they had to tend to a sick child. Create equity across pay grades and job descriptions across divisions and agencies. The state will need to consider what it is offering to folks that they can't get working for other companies if they want any hope of retaining employees and attracting new and young talent. My greatest concern is the lack of equity concerning salaries with private sector jobs More merit based and less seniority based. While understanding that those who have put in more time should benefit and that there are opportunities for merit based compensation, they are often used infrequently. It is difficult to hold people accountable which makes it challenging for those who work hard to be doing the work of those who just tow the line..
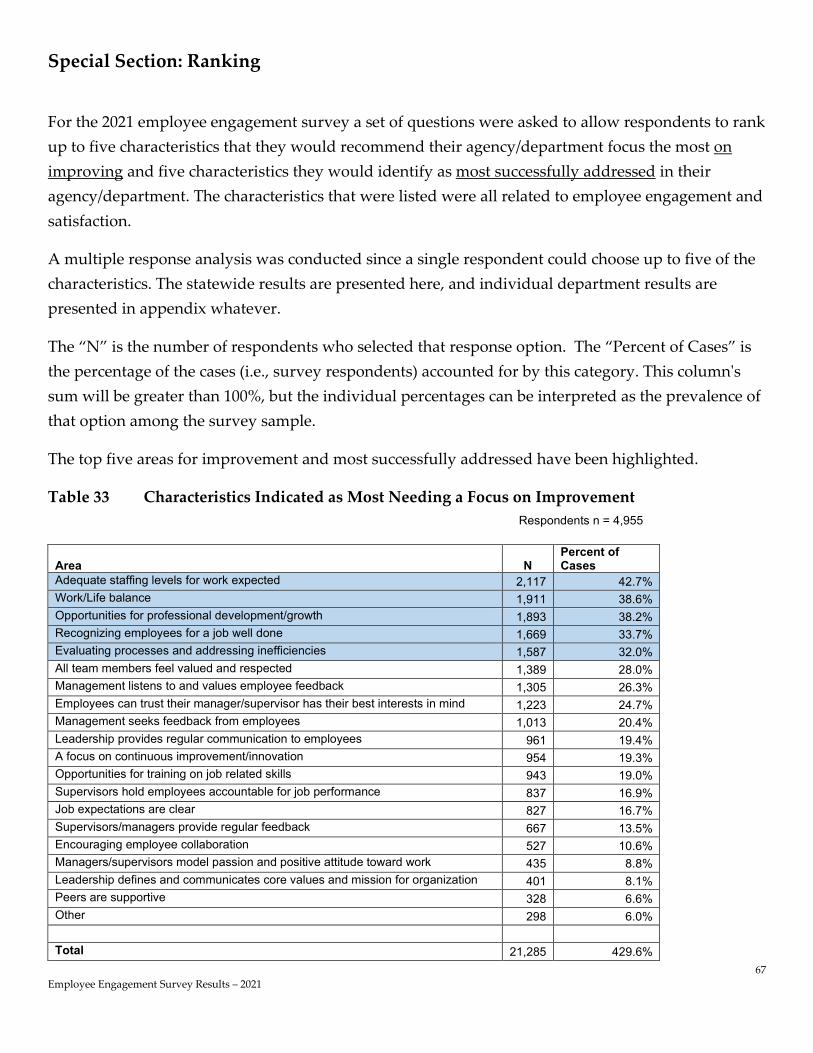
67 Employee Engagement Survey Results – 2021
Special Section: Ranking
For the 2021 employee engagement survey a set of questions were asked to allow respondents to rank up to five characteristics that they would recommend their agency/department focus the most on improving and five characteristics they would identify as most successfully addressed in their agency/department. The characteristics that were listed were all related to employee engagement and satisfaction.
A multiple response analysis was conducted since a single respondent could choose up to five of the characteristics. The statewide results are presented here, and individual department results are presented in appendix whatever.
The “N” is the number of respondents who selected that response option. The “Percent of Cases” is the percentage of the cases (i.e., survey respondents) accounted for by this category. This column's sum will be greater than 100%, but the individual percentages can be interpreted as the prevalence of that option among the survey sample.
The top five areas for improvement and most successfully addressed have been highlighted.
Table 33 Characteristics Indicated as Most Needing a Focus on Improvement Respondents n = 4,955
Area N Percent of Cases
Adequate staffing levels for work expected 2,117 42.7% Work/Life balance 1,911 38.6% Opportunities for professional development/growth 1,893 38.2% Recognizing employees for a job well done 1,669 33.7% Evaluating processes and addressing inefficiencies 1,587 32.0% All team members feel valued and respected 1,389 28.0% Management listens to and values employee feedback 1,305 26.3% Employees can trust their manager/supervisor has their best interests in mind 1,223 24.7% Management seeks feedback from employees 1,013 20.4% Leadership provides regular communication to employees 961 19.4% A focus on continuous improvement/innovation 954 19.3% Opportunities for training on job related skills 943 19.0% Supervisors hold employees accountable for job performance 837 16.9% Job expectations are clear 827 16.7% Supervisors/managers provide regular feedback 667 13.5% Encouraging employee collaboration 527 10.6% Managers/supervisors model passion and positive attitude toward work 435 8.8% Leadership defines and communicates core values and mission for organization 401 8.1% Peers are supportive 328 6.6% Other 298 6.0% Total 21,285 429.6%
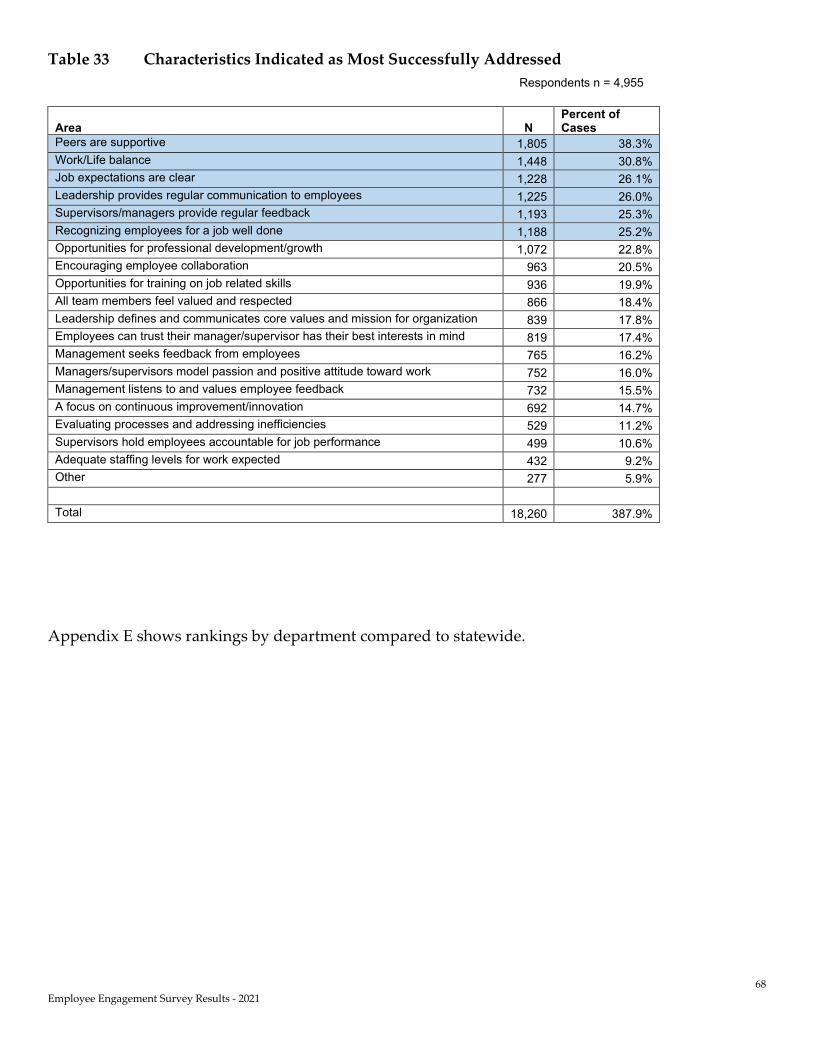
68 Employee Engagement Survey Results - 2021
Table 33 Characteristics Indicated as Most Successfully Addressed Respondents n = 4,955
Area N Percent of Cases
Peers are supportive 1,805 38.3% Work/Life balance 1,448 30.8% Job expectations are clear 1,228 26.1% Leadership provides regular communication to employees 1,225 26.0% Supervisors/managers provide regular feedback 1,193 25.3% Recognizing employees for a job well done 1,188 25.2% Opportunities for professional development/growth 1,072 22.8% Encouraging employee collaboration 963 20.5% Opportunities for training on job related skills 936 19.9% All team members feel valued and respected 866 18.4% Leadership defines and communicates core values and mission for organization 839 17.8% Employees can trust their manager/supervisor has their best interests in mind 819 17.4% Management seeks feedback from employees 765 16.2% Managers/supervisors model passion and positive attitude toward work 752 16.0% Management listens to and values employee feedback 732 15.5% A focus on continuous improvement/innovation 692 14.7% Evaluating processes and addressing inefficiencies 529 11.2% Supervisors hold employees accountable for job performance 499 10.6% Adequate staffing levels for work expected 432 9.2% Other 277 5.9% Total 18,260 387.9%
Appendix E shows rankings by department compared to statewide.

69 Employee Engagement Survey Results – 2021
Special Section: “Year Ago” Comparison
For the 2021 employee engagement survey a special section was included which asked respondents to think about how they feel now about a group of statements compared to last year before the pandemic. These questions were only asked of respondents who indicated that they were employed by the state of Vermont in March of 2020 (n = 4,126). The statements were ones that are used in the main body of the engagement survey and were on a response scale from “much worse” to “much better.” For purposes of this presentation “much worse” and “slightly worse” were combined and “slightly better” and “much better” were combined and neutral stayed the same.
Table 35 How do you feel NOW about the following statements compared to LAST YEAR (before the pandemic/March 2020).
23.4%
50.0%
39.9%
31.4%
28.2%
46.4%
48.4%
37.1%
34.5%
59.9%
54.1%
27.2%
37.1%
48.8%
61.5%
32.5%
37.9%
46.4%
48.6%
29.5%
22.5%
22.9%
22.9%
19.8%
10.3%
21.1%
13.6%
16.5%
16.8%
10.6%
I have the opportunity to learn and grow professionally.
My job allows a good balance between work and my personal life.
Management and senior leadership communicate important informationeffectively.
I have an opportunity to provide feedback to management and seniorleadership.
I understand the work, goals and mission of my Department/Agency.
In general, I'm satisfied with my job.
The employees in my work group work well together as a team.
My supervisor regularly provides me with timely and useful feedback.
I am satisfied with the recognition I received from my supervisor for mywork.
I feel I am productive in my job.
% Better % Neutral % Worse
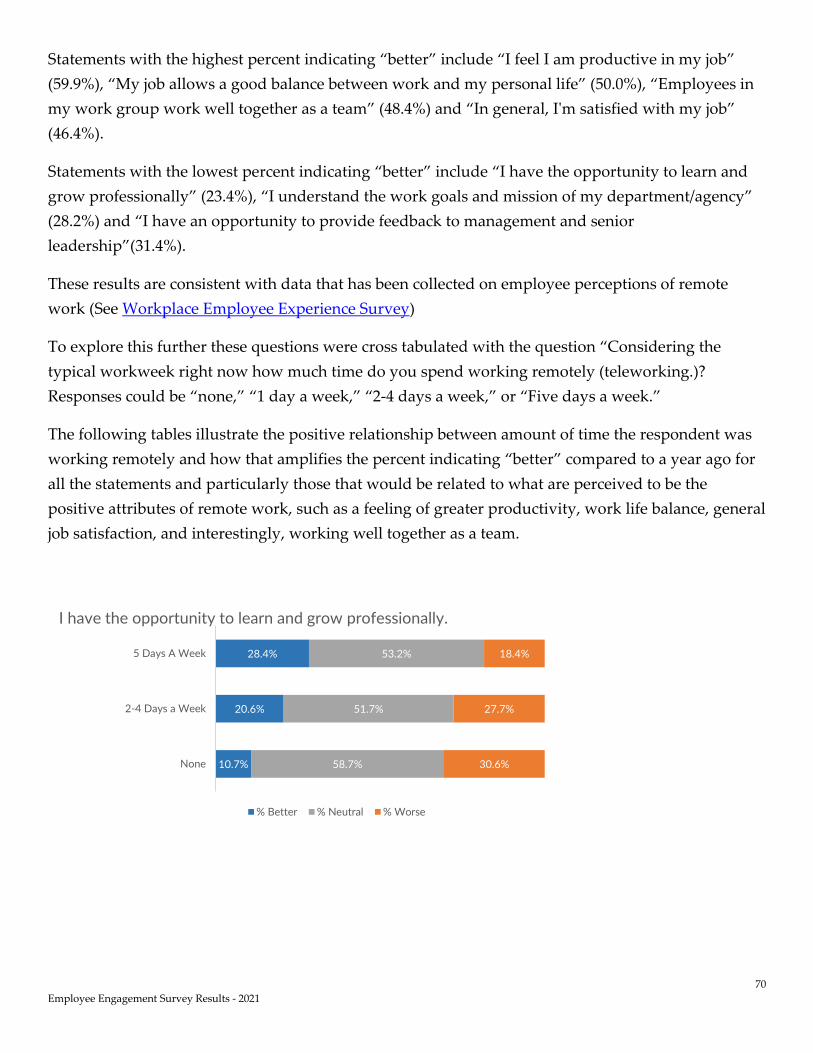
70 Employee Engagement Survey Results - 2021
Statements with the highest percent indicating “better” include “I feel I am productive in my job” (59.9%), “My job allows a good balance between work and my personal life” (50.0%), “Employees in my work group work well together as a team” (48.4%) and “In general, I'm satisfied with my job” (46.4%).
Statements with the lowest percent indicating “better” include “I have the opportunity to learn and grow professionally” (23.4%), “I understand the work goals and mission of my department/agency” (28.2%) and “I have an opportunity to provide feedback to management and senior leadership”(31.4%).
These results are consistent with data that has been collected on employee perceptions of remote work (See Workplace Employee Experience Survey)
To explore this further these questions were cross tabulated with the question “Considering the typical workweek right now how much time do you spend working remotely (teleworking.)? Responses could be “none,” “1 day a week,” “2-4 days a week,” or “Five days a week.”
The following tables illustrate the positive relationship between amount of time the respondent was working remotely and how that amplifies the percent indicating “better” compared to a year ago for all the statements and particularly those that would be related to what are perceived to be the positive attributes of remote work, such as a feeling of greater productivity, work life balance, general job satisfaction, and interestingly, working well together as a team.
10.7%
20.6%
28.4%
58.7%
51.7%
53.2%
30.6%
27.7%
18.4%
None
2-4 Days a Week
5 Days A Week
I have the opportunity to learn and grow professionally.
% Better % Neutral % Worse
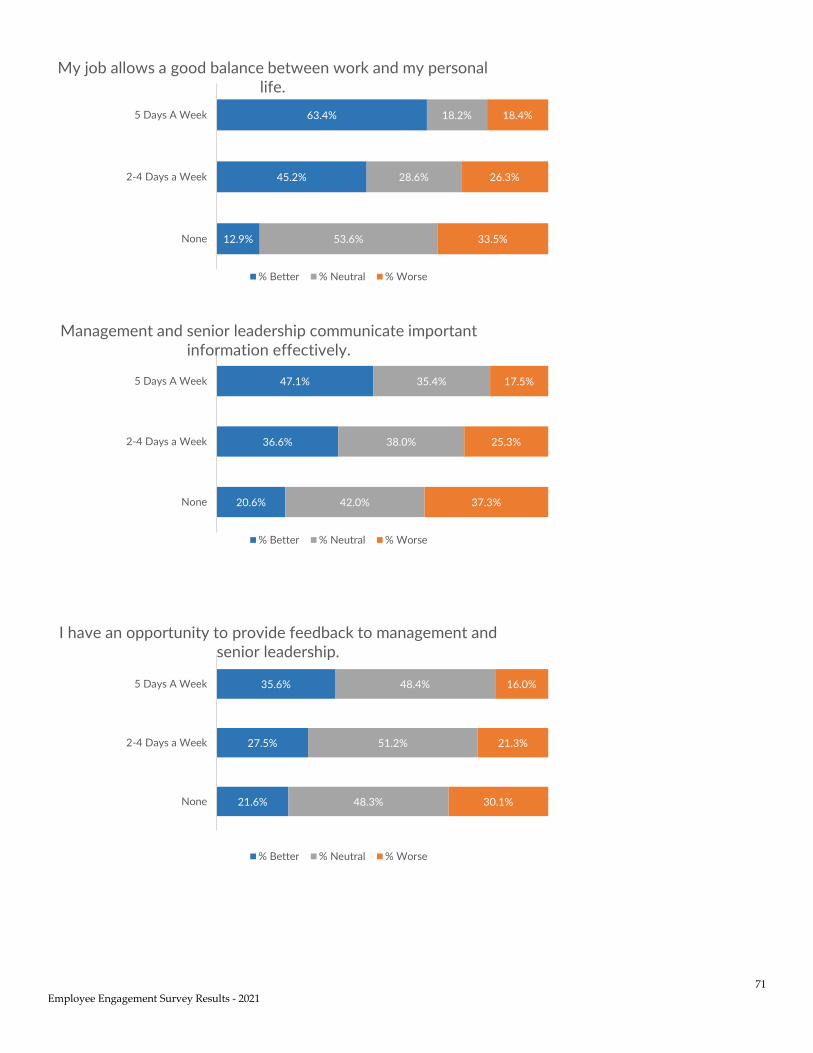
71 Employee Engagement Survey Results - 2021
12.9%
45.2%
63.4%
53.6%
28.6%
18.2%
33.5%
26.3%
18.4%
None
2-4 Days a Week
5 Days A Week
My job allows a good balance between work and my personal life.
% Better % Neutral % Worse
20.6%
36.6%
47.1%
42.0%
38.0%
35.4%
37.3%
25.3%
17.5%
None
2-4 Days a Week
5 Days A Week
Management and senior leadership communicate important information effectively.
% Better % Neutral % Worse
21.6%
27.5%
35.6%
48.3%
51.2%
48.4%
30.1%
21.3%
16.0%
None
2-4 Days a Week
5 Days A Week
I have an opportunity to provide feedback to management and senior leadership.
% Better % Neutral % Worse

72 Employee Engagement Survey Results - 2021
21.5%
25.2%
31.3%
59.3%
65.6%
61.0%
19.2%
9.1%
7.7%
None
2-4 Days a Week
5 Days A Week
I understand the work, goals and mission of my Department/Agency.
% Better % Neutral % Worse
22.1%
41.5%
55.8%
41.6%
37.0%
28.2%
36.3%
21.6%
16.1%
None
2-4 Days a Week
5 Days A Week
In general, I'm satisfied with my job.
% Better % Neutral % Worse
31.9%
44.6%
55.0%
46.9%
38.7%
34.8%
21.2%
16.6%
10.3%
None
2-4 Days a Week
5 Days A Week
The employees in my work group work well together as a team.
% Better % Neutral % Worse
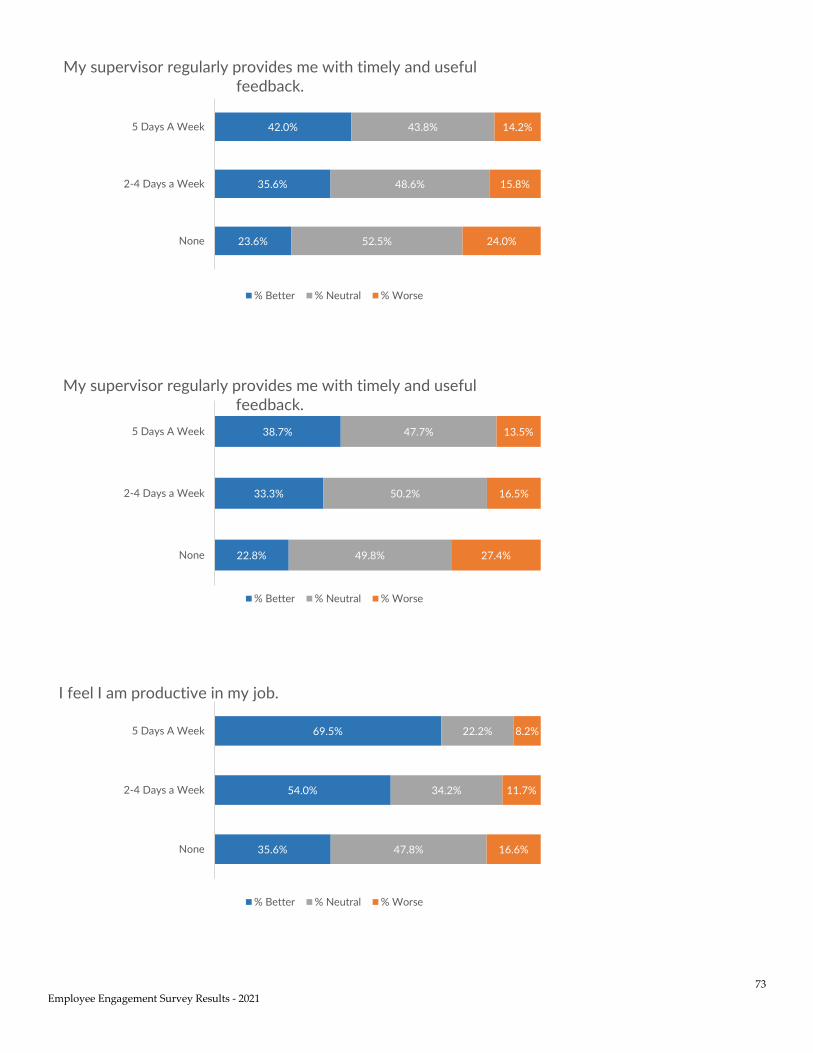
73 Employee Engagement Survey Results - 2021
23.6%
35.6%
42.0%
52.5%
48.6%
43.8%
24.0%
15.8%
14.2%
None
2-4 Days a Week
5 Days A Week
My supervisor regularly provides me with timely and useful feedback.
% Better % Neutral % Worse
22.8%
33.3%
38.7%
49.8%
50.2%
47.7%
27.4%
16.5%
13.5%
None
2-4 Days a Week
5 Days A Week
My supervisor regularly provides me with timely and useful feedback.
% Better % Neutral % Worse
35.6%
54.0%
69.5%
47.8%
34.2%
22.2%
16.6%
11.7%
8.2%
None
2-4 Days a Week
5 Days A Week
I feel I am productive in my job.
% Better % Neutral % Worse
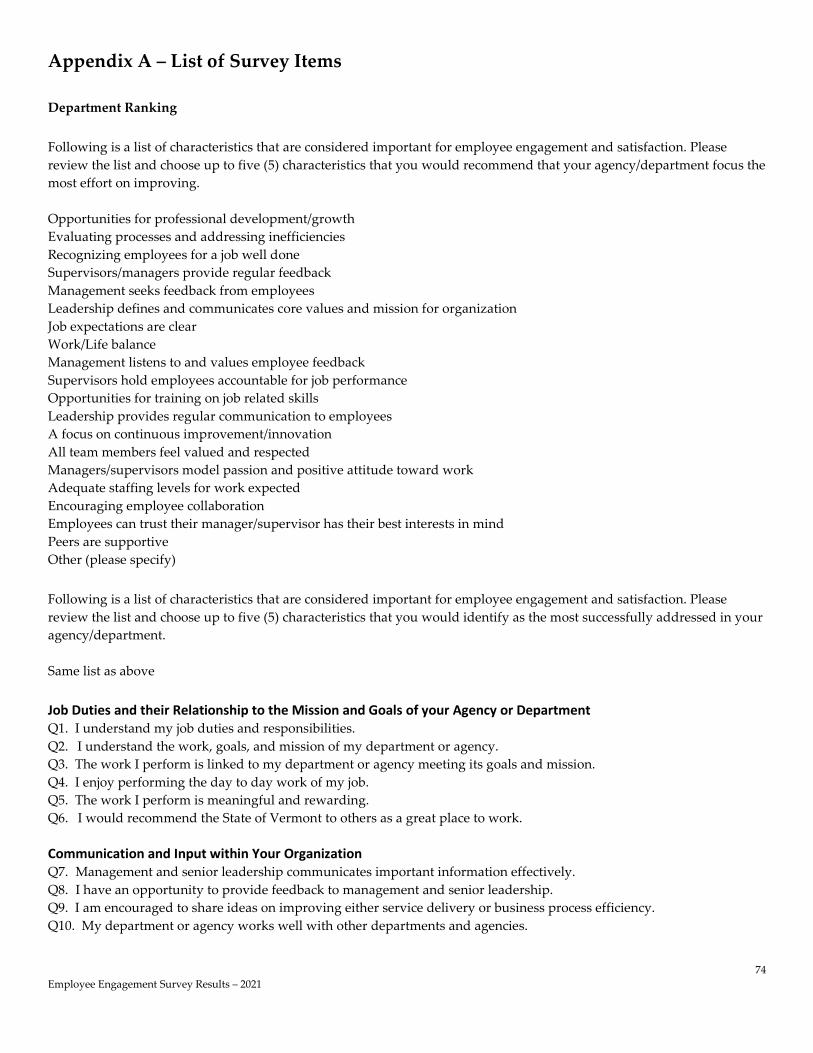
74 Employee Engagement Survey Results – 2021
Appendix A – List of Survey Items Department Ranking Following is a list of characteristics that are considered important for employee engagement and satisfaction. Please review the list and choose up to five (5) characteristics that you would recommend that your agency/department focus the most effort on improving. Opportunities for professional development/growth Evaluating processes and addressing inefficiencies Recognizing employees for a job well done Supervisors/managers provide regular feedback Management seeks feedback from employees Leadership defines and communicates core values and mission for organization Job expectations are clear Work/Life balance Management listens to and values employee feedback Supervisors hold employees accountable for job performance Opportunities for training on job related skills Leadership provides regular communication to employees A focus on continuous improvement/innovation All team members feel valued and respected Managers/supervisors model passion and positive attitude toward work Adequate staffing levels for work expected Encouraging employee collaboration Employees can trust their manager/supervisor has their best interests in mind Peers are supportive Other (please specify) Following is a list of characteristics that are considered important for employee engagement and satisfaction. Please review the list and choose up to five (5) characteristics that you would identify as the most successfully addressed in your agency/department. Same list as above Job Duties and their Relationship to the Mission and Goals of your Agency or Department Q1. I understand my job duties and responsibilities. Q2. I understand the work, goals, and mission of my department or agency. Q3. The work I perform is linked to my department or agency meeting its goals and mission. Q4. I enjoy performing the day to day work of my job. Q5. The work I perform is meaningful and rewarding. Q6. I would recommend the State of Vermont to others as a great place to work. Communication and Input within Your Organization Q7. Management and senior leadership communicates important information effectively. Q8. I have an opportunity to provide feedback to management and senior leadership. Q9. I am encouraged to share ideas on improving either service delivery or business process efficiency. Q10. My department or agency works well with other departments and agencies.

75 Employee Engagement Survey Results - 2021
Relationships and Morale in Your Organization Q11. Morale in my department or agency is good. Q12. The people I work with treat each other respectfully. Q13. The people I work with care about me. Q14. My fellow employees are committed to doing good work. Q15. The employees in my work group work well together as a team. Q16. I feel I can communicate honestly and openly in my workplace. Q17. Harassment is not tolerated in my workplace. Q18. Discrimination is not tolerated in my workplace. Q19. I am confident that any misconduct that I report will be handled properly. Your Supervisor Q20. My supervisor clearly explains my job performance expectations. Q21. My supervisor regularly provides me with timely and useful feedback. Q22. My supervisor gives me an opportunity to do my best work. Q23. I am satisfied with the recognition I receive from my supervisor for my work. Q24. My supervisor treats employees fairly and respectfully. Q25. My supervisor seems to care about me as a person. Q26. My supervisor provides the help I need to improve my job performance. Q27. I have an opportunity to learn and grow professionally. Q28. I receive the training I need to perform my job. Q29. My supervisor and I discuss and plan my career development. Q30. My performance evaluations are completed annually. Q31. The standards used to evaluate my performance are fair. Workload, Staffing and Resources Q32. My Agency or Department has the staffing necessary to achieve its mission. Q33. The amount of work I am expected to perform is reasonable. Q34. My job allows a good balance between work and my personal life. Q35. I have the resources to do my job well. Q36. My Agency or Department has the technology needed to get the work done. Q37. My physical working environment is reasonable for my type of work. Q38. I feel safe and secure in my work environment. Compensation and Benefits Q39. I am paid fairly for the work I do. Q40. I feel that working for the State of Vermont provides me with good job security. Q41. I feel that working for the State of Vermont provides me with a solid career path. Q42. I understand my benefit plans. Q43. I understand my retirement benefits. Q44. Overall, I am satisfied with the benefits I receive. Overall Satisfaction Q45. In general, I am satisfied with my job. Diversity, Equity & Inclusion Q46. My Agency/Department has an inclusive work environment where staff diversity at all levels is valued and encouraged. Q47. I believe my Agency/ Department reflects a culture of respect, professionalism, and civility. Q48. The State has done a good job providing training programs that promote an understanding of diversity, equity, and inclusion.
76 Employee Engagement Survey Results - 2021
Q49. Management shows that diversity is important through its actions. Q50. In my Agency/Department, employees interact well with others whose backgrounds, beliefs and experiences are different from their own. Q51. My experiences in my Agency/Department have led me to become more understanding of differences among my coworkers. Q52. I am aware of and understand the procedures for reporting incidents of discrimination and/or bias in the workplace. Q53. I believe my Agency/Department will take appropriate action in response to incidents of harassment, discrimination and/or bias. Q54. Racial, ethnic, sexual and gender-based jokes or slurs are not tolerated in my Agency/Department. Q55. Relationships between employees of different racial/ethnic groups in my department are positive. Q56. I am aware of efforts in my department to increase workforce equity (i.e., strategies and practices to improve diversity on all levels and across functions). Q57. My supervisor would take any report of sexual harassment very seriously. Q58. My supervisor values the diverse perspectives and ideas that come from staff members from different cultures, backgrounds, and life experiences. Q59. In my department supervisors and managers hold all employees to the same workplace expectations and disciplinary standards. Comments
Please provide any comments you may have about ways to make the State of Vermont a better place to work. Demographic Questions These questions are completely voluntary. They are used for statistical purposes to help us understand differences among various employee characteristics. Analysis is done such that no individual person could be identified. Q60. What type of employee are you?
• Classified • Exempt • Don't know • Prefer not to answer
Q61. What gender are you?
• Woman • Man • Non-binary • Prefer not to answer
Q62. What generation are you?
• Gen Z (1997 and later) • Millennial (1981 - 1996) • Gen X (1965 - 1980) • Baby Boomer (1946 - 1964) • Pre-Baby Boomer (1945 or earlier) • Prefer not to answer
Q63. Do you identify as any of the following groups: American Indian or Alaskan Native (Non-Hispanic or Latino), Asian (Non-Hispanic or Latino), Black or African American (Non-Hispanic or Latino), Hispanic or Latino, Native Hawaiian or Other Pacific Islander(Non-Hispanic or Latino), or Two or More Races (Non-Hispanic or Latino)?
77 Employee Engagement Survey Results - 2021
• Yes • No • Prefer not to answer
Q64. What is your management level?
• Manager/Supervisor • Not a manager or supervisor • Other • Prefer not to answer.
Q65. Where do you work? Administration Agency Agriculture, Food & Markets Attorney General Auditor of Accounts Buildings & General Services Children & Families Commerce & Community Development Corrections Criminal Justice Training Council DAIL Defender General Digital Services Agency Education Enhanced 911 Board Environmental Conservation Executive Office Finance & Management Financial Regulation Fish & Wildlife Forests, Parks & Recreation Green Mountain Care Board Health Human Resources Human Rights Commission Human Services Agency Labor Labor Relations Board Libraries Liquor Control Lottery Commission Mental Health Military Motor Vehicles Natural Resources Agency Natural Resources Board Other Public Safety Public Service Department Public Utilities Commission
78 Employee Engagement Survey Results - 2021
Secretary of State State Treasurer Taxes Transportation (not DMV) Vermont Commission on Women Vermont Health Access Veterans' Home VOSHA Review Board
79 Employee Engagement Survey Results - 2021
Appendix B – 2021 Responses to Survey Questions by Department Compared with Statewide (Excel File)
Appendix C – Cross Tabulation of 2021 Responses to Survey Questions by Demographic Questions (Excel File)
Appendix D – 2021 Engagement Scores by Department Compared to Statewide (Excel File)
Appendix E - Rankings by Department Compared to Statewide. (Excel File)