analysis of sediment yields within the auckland region...analysis of sediment yields within the...
TRANSCRIPT

Analysis of Sediment Yields within the Auckland Region June TR 2009/064
Auckland Regional Council
Technical Report No.064 June 2009
ISSN 1179-0504 (Print)
ISSN 1179-0512 (Online)
ISBN 978-1-877528-76-7

Reviewed by: Approved for ARC Publication by:
Name: Amy Taylor Name: Grant Barnes
Position: Project Leader Land Position: Group Manager Monitoring and
Research
Organisation: Auckland Regional Council Organisation: Auckland Regional Council
Date: 27 May 2009 Date: 27 May 2009
Recommended Citation: Hicks, D.M.; Hoyle, J.; Roulston, H. (2009). Analysis of Sediment Yields within
Auckland Region. Prepared by NIWA for Auckland Regional Council. Auckland
Regional Council Technical Report 2009/064.
© 2008 Auckland Regional Council
This publication is provided strictly subject to Auckland Regional Council's (ARC) copyright and other
intellectual property rights (if any) in the publication. Users of the publication may only access, reproduce and
use the publication, in a secure digital medium or hard copy, for responsible genuine non-commercial
purposes relating to personal, public service or educational purposes, provided that the publication is only
ever accurately reproduced and proper attribution of its source, publication date and authorship is attached to
any use or reproduction. This publication must not be used in any way for any commercial purpose without
the prior written consent of ARC. ARC does not give any warranty whatsoever, including without limitation,
as to the availability, accuracy, completeness, currency or reliability of the information or data (including third
party data) made available via the publication and expressly disclaim (to the maximum extent permitted in
law) all liability for any damage or loss resulting from your use of, or reliance on the publication or the
information and data provided via the publication. The publication and information and data contained within
it are provided on an "as is" basis.

Analysis of Sediment Yields within the Auckland Region
D. M. Hicks
J. Hoyle
H. Roulston
Prepared for
Auckland Regional Council
NIWA Client report: CHC2009-041
May 2009
NIWA Project: ARC09501
National Institute of Water & Atmospheric Research Ltd
10 Kyle Street, Riccarton, Christchurch, 8011
P O Box 8602, Christchurch, 8440, New Zealand
Phone +64 3 348 8987, Fax +64 3 348 5548
www.niwa.co.nz

Contents
1 Executive Summary 8
1.1 Study objectives and approach 8
1.2 Mean annual basin sediment yields 8
1.3 Relationship between sediment yields and catchment characteristics 9
1.4 Magnitude-frequency relationships for storm sediment yields 9
1.5 Potential application of results 9
2 Introduction 10
2.1 Background and purpose 10
2.2 Objectives 10
3 Background Information 11
3.1 Catchment locations 11
3.2 Catchment characteristics 12
3.3 Data collected for sediment yield analysis 15
3.3.1 Mahurangi catchments - Wylie Road, Redwood Forest and Mahurangi College 15
3.3.2 Okura catchments – Awanohi Stream and Weiti Forest 19
3.3.3 Barwick catchment 24
3.3.4 Long Bay catchments – Lower Vaughan and Lower Awaruku 24
3.3.5 Mangemangeroa catchment 26
4 Analysis Methods 29
4.1 The sediment concentration rating approach 29
4.2 The storm event sediment yield rating approach 31
4.3 The Monte Carlo approach 33
4.4 Determining magnitude-frequency relationships for event sediment yields 34
5 Results 35
5.1 Rating relationships 35
5.2 Sediment yields 35
5.3 Annual yield variability 38
5.4 Sediment yield vs. catchment characteristics 41
5.5 Application of results and recommendations for further sediment monitoring 43
5.6 Event-yield magnitude-frequency relations 43
6 Conclusions 45
7 References 46
8 Appendix 1: Time series and rating plots 48
8.1 Wylie Rd 48
8.1.1 Time series plots 48
8.1.2 Sediment concentration rating 49
8.1.3 Event sediment yield rating 49
8.2 Redwood Forest 50
8.2.1 Time series plots 50
8.2.2 Sediment concentration rating 52
8.2.3 Event sediment yield rating 53
8.3 Mahurangi College 54
8.3.1 Time series plots 54
8.3.2 Sediment concentration rating 56
8.3.3 Event sediment yield rating 57
8.4 Awanohi Stream 58
8.4.1 Time series plots 58
8.4.2 Sediment concentration rating 59
8.4.3 Event sediment yield rating 60
8.5 Weiti Forest 61
8.5.1 Time series plots 61
8.5.2 Sediment concentration rating 62
8.5.3 Event sediment yield rating 63
8.6 Barwick 64
8.6.1 Time series plots 64
8.6.2 Sediment concentration rating 65
8.7 Lower Vaughan – Long Bay 66
8.7.1 Time series plots 66
8.7.2 Sediment concentration rating 68
8.7.3 Event sediment yield rating 69
8.8 Lower Awaruku – Long Bay 71

8.8.1 Time series plots 71
8.8.2 Sediment concentration rating 73
8.8.3 Event sediment yield rating 74
8.9 Mangemangeroa 76
8.9.1 Time series plots 76
8.9.2 Sediment concentration rating 78
8.9.3 Event sediment yield rating 79
9 Appendix 2: Monthly sediment yields 81
9.1 Wylie Rd 81
9.1.1 Derived from sediment concentration rating 81
9.1.2 Derived from event yield rating 81
9.2 Redwood Forest 82
9.2.1 Derived from sediment concentration rating 82
9.2.2 Derived from event yield rating 82
9.3 Mahurangi College 83
9.3.1 Derived from sediment concentration rating 83
9.3.2 Derived from event yield rating 84
9.4 Awanohi Stream 85
9.4.1 Derived from sediment concentration rating 85
9.4.2 Derived from event yield rating 85
9.5 Weiti Forest 86
9.5.1 Derived from sediment concentration rating 86
9.5.2 Derived from event yield rating 86
9.6 Barwick 86
9.6.1 Derived from sediment concentration rating 86
9.7 Lower Vaughan – Long Bay 87
9.7.1 Derived from sediment concentration rating 87
9.7.2 Derived from event yield rating 87
9.8 Lower Awaruku – Long Bay 88
9.8.1 Derived from sediment concentration rating 88
9.8.2 Derived from event yield rating 88
9.9 Mangemangeroa 89
9.9.1 Derived from sediment concentration rating 89
9.9.2 Derived from event yield rating 89

Reviewed by: Approved for release by:
Andrew Swales Jochen Schmidt

Analysis of Sediment Yields within the Auckland Region 8
1 Executive Summary
1.1 Study objectives and approach
Measurements of suspended sediment yields during storms at nine basins in
Waitemata Formation terrane under various land uses in the Auckland region were
analysed to determine event sediment yields and mean annual sediment yields. The
mean annual yields were estimated using three approaches: (i) by developing
suspended sediment concentration vs. water discharge ratings and combining these
with the water discharge record; (ii) by developing event sediment yield vs. event peak
water discharge ratings and combining these with a peaks-over-threshold series of
peak discharges extracted from the discharge record; and (iii) by a Monte Carlo
approach that combined the event sediment yield vs. peak discharge rating with
repeated samplings of the event peak-discharge magnitude-frequency distribution for a
standard 20-year period.
1.2 Mean annual basin sediment yields
During their respective periods of data collection, the basin specific annual average
sediment yields (averaged from the estimates from the three analysis approaches)
were:
Wylie Road (pastoral) 200 ±2 t/km2/yr (1.28 years of flow data)
Redwood Forest (exotic forest, before
harvesting)
172 ±19 t/km2/yr (2.68 years of flow data)
Redwood Forest (exotic forest, post
harvesting)
241 ±35 t/km2/yr (0.98 years of flow data)
Mahurangi College (pastoral) 88 ±19 t/km2/yr (26.25 years of flow data)
Awanohi Stream (native vegetation) 74 ±12 t/km2/yr (6.25 years of flow data)
Weiti Forest (exotic vegetation) 82 ±13 t/km2/yr (0.56 years of flow data)
Barwick (urban) 13 t/km2/yr (0.48 years of flow data)
Lower Vaughan-Long Bay (pastoral) 98 ±18 t/km2/yr (6.07 years of flow data)
Lower Awaruku-Long Bay (urban) 40 ±11 t/km2/yr (3.25 years of flow data)
Mangemangeroa (pastoral) 89 ±7 t/km2/yr (8.10 years of flow data)
The 27 year flow record at the Mahurangi College site enabled an estimate of annual
variability in sediment yields due to inter annual hydrological variability. This showed
Analysis of Sediment Yields within the Auckland Region 9
annual sediment yield ranging over a factor-of-ten, with the three-year running-average
yield ranging over a factor-of-four.
1.3 Relationship between sediment yields and catchment characteristics
A correlation and multiple-regression analysis indicated that the variation in specific
sediment yield (SSY) in the dataset is due mainly to catchment rainfall (R), mean slope
(S), and land use. A predictive derived model is:
SSY (t/km2/yr) = (R (mm/yr) x S) ( 0.0035 %P + 0.0023 %F+ 0.00084 %U)
where %P, %F, and %U are the percentages of the catchment under pasture, mature
forest (whether native or exotic), and urbanised, respectively. This indicates that for a
given rainfall x slope product, the yields from forested areas are 2/3 those from pasture
areas, while the yields from urbanised areas are ¼ of those from pasture areas. A
comparison of yields from Redwood Forest between pre- and post-harvesting periods
showed that the forest harvesting increased the sediment yield by approximately 40%.
1.4 Magnitude-frequency relationships for storm sediment yields
A comparison of the event-yield magnitude-frequency relationships for all but the
Barwick catchment (which had too little data) showed that generally, the specific
sediment yields of events of given return period show similar variations among
catchments as do the average annual yields described above. The Mangemangeroa,
Vaughan, and Awaruku catchments showed sharply reduced event yields from events
with return periods smaller than about 3 months, suggesting either erosion threshold
or sediment exhaustion effects operating in these catchments.
1.5 Potential application of results
While the above results are based on only nine basins, most are statistically significant.
The study therefore offers promise that a model such as the one above, ideally
calibrated with more data, could provide the basis for a land use and rainfall driven
proxy for monitoring potential changes in sediment yield in the Auckland region. We
recommend ongoing sediment monitoring of sediment yield at a small number of key
sites in order to validate such predictions. Since all the study basins are formed in
Waitemata Formation terrane, the results may not apply to other lithologies, thus we
also recommend that sediment monitoring be extended to secure results for other
lithologies.
Analysis of Sediment Yields within the Auckland Region 10
2 Introduction
2.1 Background and purpose
Sustainable management of the Auckland region’s land and aquatic environment
requires ongoing monitoring of various environmental parameters. Sediment in
receiving-water bodies is of concern, thus monitoring of sediment loads and yields is
required to identify and quantify its sources, manage its effects, and to measure trends
and the effectiveness of management measures. Since it is a prohibitive undertaking
to continuously monitor sediment in every basin across the region, an alternative is to
develop an understanding of how sediment yields vary with differing land use and
basin hydrological and physical characteristics and from this sediment yield on a
regional basis can be proxied by monitoring land use and hydrological parameters such
as rainfall or runoff.
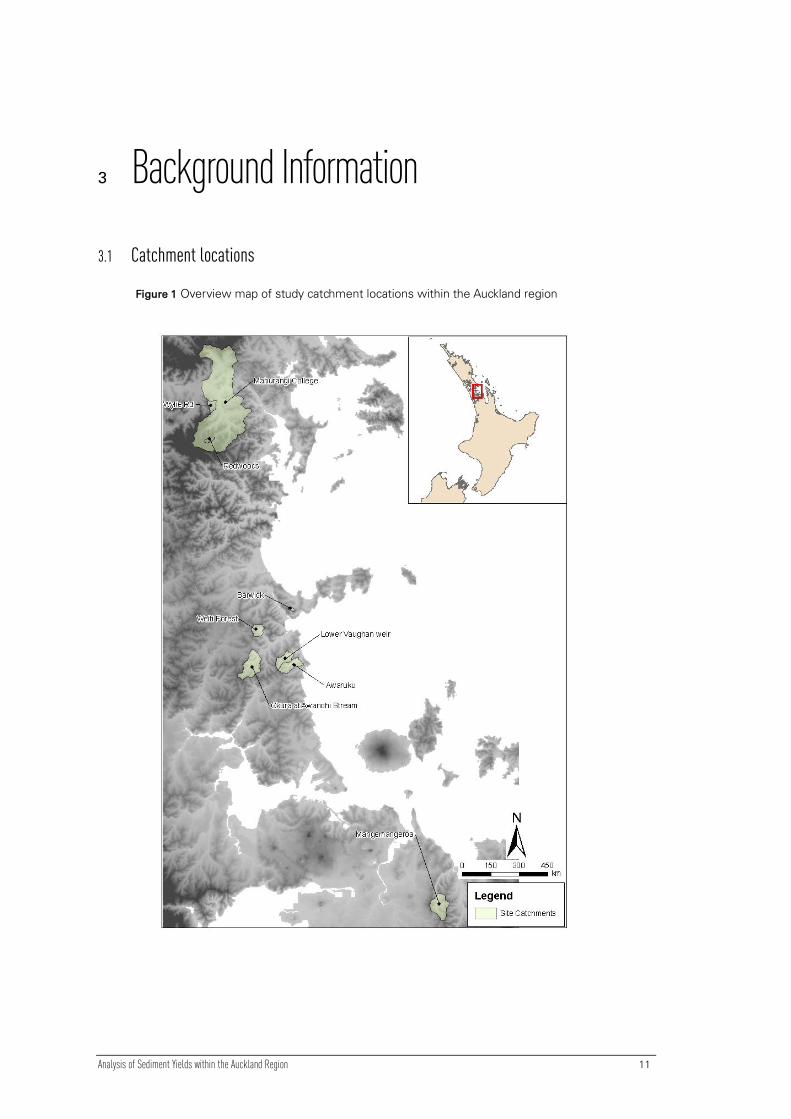
Towards this understanding, this report presents results from sediment yield studies at
nine catchments under various land uses in the Auckland region. The basins are (Figure
1, Table 1): Wylie Road, Redwood Forest, Mahurangi College, Awanohi Stream, Weiti
Forest, Barwick, Lower Vaughan–Long Bay, Lower Awaruku–Long Bay, and
Mangemangeroa. Catchment areas range from 0.2 to 48.8 km2.
This report is intended to supplement and update an investigation into sediment yields
from five different catchments within the Auckland region conducted in 1994 (Hicks,
1994).
2.2 Objectives
The objectives of the study are to:
• Determine mean annual sediment yield over the period of flow record for each of
the nine basins, and provide estimates of the yield averaged over a longer
reference period.
• Determine magnitude/frequency relationships for event sediment yields over the
sampling period for each of the nine basins.
• Collate or extract information on catchment slope, land-cover, land use, and
mean annual rainfall, and report with sediment yield results for each of the nine
basins.
• Provide a preliminary analysis of relationships between mean annual sediment
yield and event sediment yield in terms of catchment characteristics, including
rainfall, runoff, slope, land use, and lithology.
Analysis of Sediment Yields within the Auckland Region 11
3 Background Information
3.1 Catchment locations
Figure 1 Overview map of study catchment locations within the Auckland region
Analysis of Sediment Yields within the Auckland Region 12
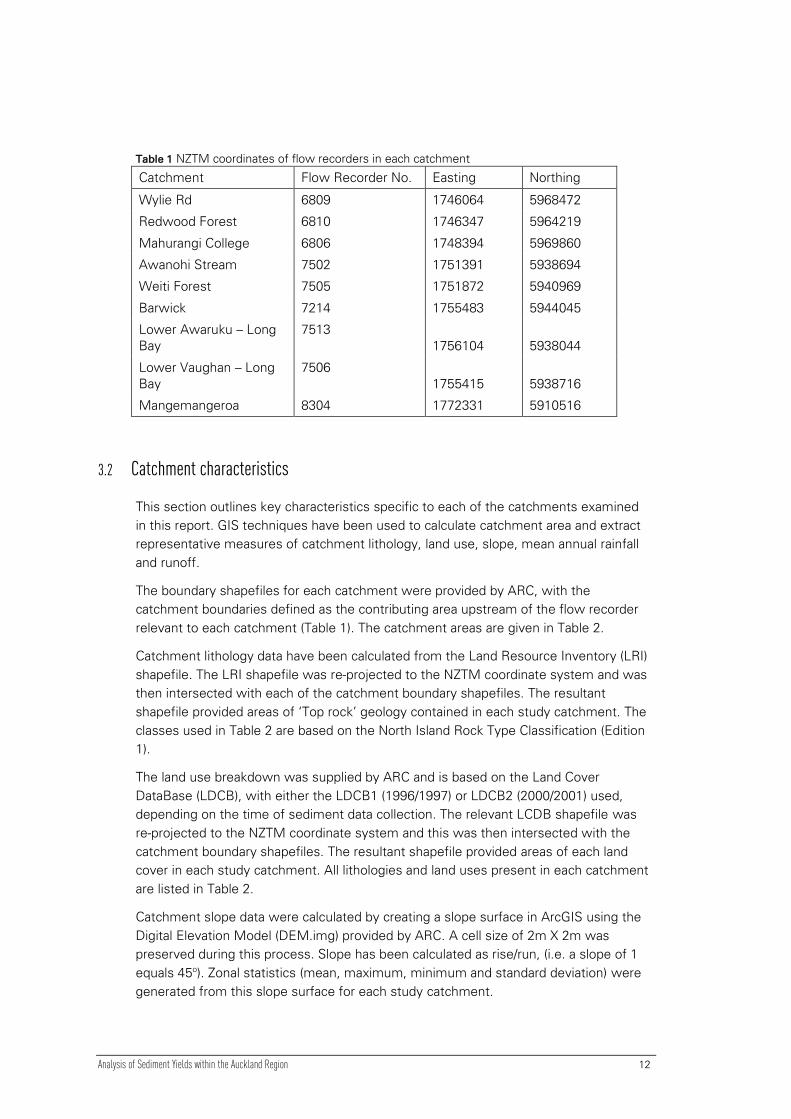
Table 1 NZTM coordinates of flow recorders in each catchment
Catchment Flow Recorder No. Easting Northing
Wylie Rd 6809 1746064 5968472
Redwood Forest 6810 1746347 5964219
Mahurangi College 6806 1748394 5969860
Awanohi Stream 7502 1751391 5938694
Weiti Forest 7505 1751872 5940969
Barwick 7214 1755483 5944045
Lower Awaruku – Long
Bay
7513
1756104 5938044
Lower Vaughan – Long
Bay
7506
1755415 5938716
Mangemangeroa 8304 1772331 5910516
3.2 Catchment characteristics
This section outlines key characteristics specific to each of the catchments examined
in this report. GIS techniques have been used to calculate catchment area and extract
representative measures of catchment lithology, land use, slope, mean annual rainfall
and runoff.
The boundary shapefiles for each catchment were provided by ARC, with the
catchment boundaries defined as the contributing area upstream of the flow recorder
relevant to each catchment (Table 1). The catchment areas are given in Table 2.
Catchment lithology data have been calculated from the Land Resource Inventory (LRI)
shapefile. The LRI shapefile was re-projected to the NZTM coordinate system and was
then intersected with each of the catchment boundary shapefiles. The resultant
shapefile provided areas of ‘Top rock’ geology contained in each study catchment. The
classes used in Table 2 are based on the North Island Rock Type Classification (Edition
1).
The land use breakdown was supplied by ARC and is based on the Land Cover
DataBase (LDCB), with either the LDCB1 (1996/1997) or LDCB2 (2000/2001) used,
depending on the time of sediment data collection. The relevant LCDB shapefile was
re-projected to the NZTM coordinate system and this was then intersected with the
catchment boundary shapefiles. The resultant shapefile provided areas of each land
cover in each study catchment. All lithologies and land uses present in each catchment
are listed in Table 2.
Catchment slope data were calculated by creating a slope surface in ArcGIS using the
Digital Elevation Model (DEM.img) provided by ARC. A cell size of 2m X 2m was
preserved during this process. Slope has been calculated as rise/run, (i.e. a slope of 1
equals 45o). Zonal statistics (mean, maximum, minimum and standard deviation) were
generated from this slope surface for each study catchment.
Analysis of Sediment Yields within the Auckland Region 13
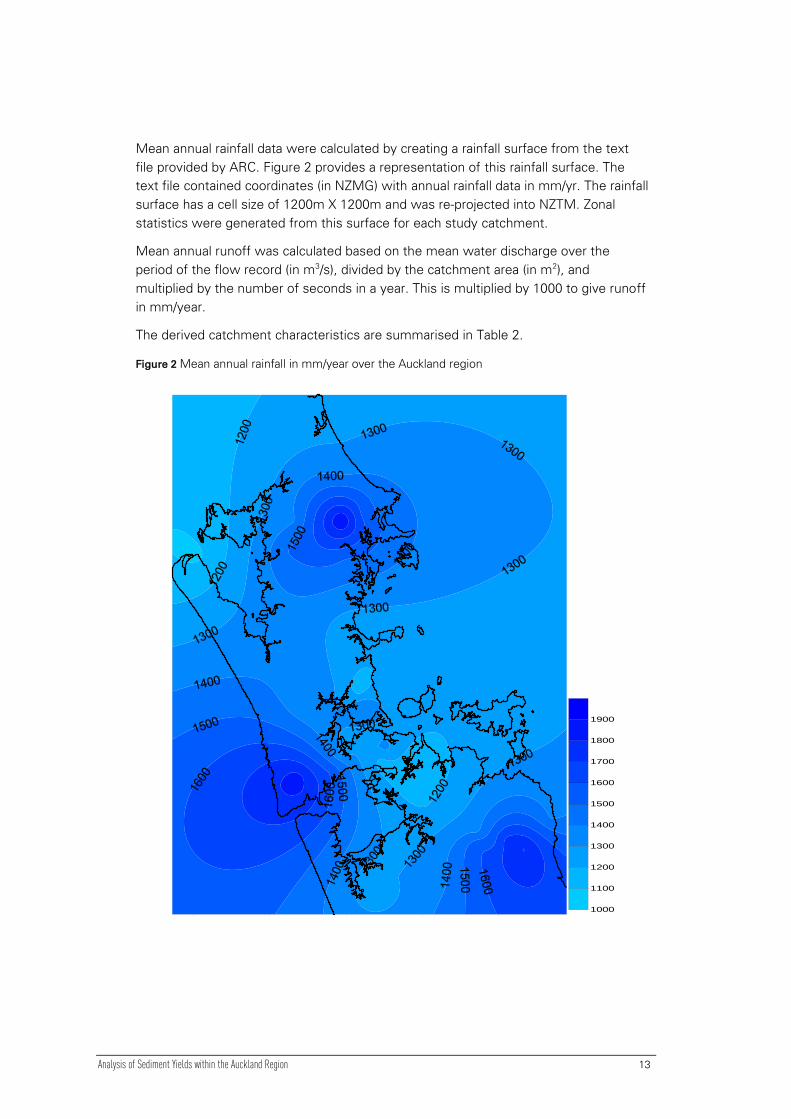
Mean annual rainfall data were calculated by creating a rainfall surface from the text
file provided by ARC. Figure 2 provides a representation of this rainfall surface. The
text file contained coordinates (in NZMG) with annual rainfall data in mm/yr. The rainfall
surface has a cell size of 1200m X 1200m and was re-projected into NZTM. Zonal
statistics were generated from this surface for each study catchment.
Mean annual runoff was calculated based on the mean water discharge over the
period of the flow record (in m3/s), divided by the catchment area (in m2), and
multiplied by the number of seconds in a year. This is multiplied by 1000 to give runoff
in mm/year.
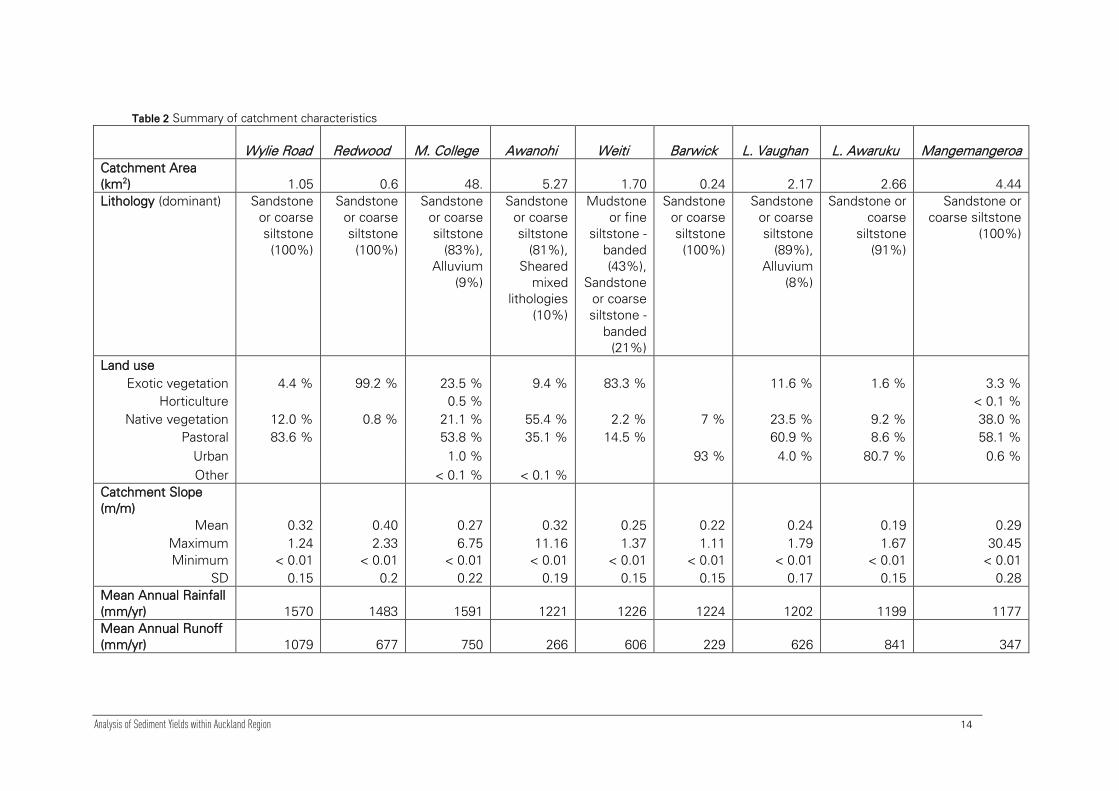
The derived catchment characteristics are summarised in Table 2.
Figure 2 Mean annual rainfall in mm/year over the Auckland region Mean Annual Rainfall
1000
1100
1200
1300
1400
1500
1600
1700
1800
1900
Analysis of Sediment Yields within Auckland Region 14
Table 2 Summary of catchment characteristics
Wylie Road Redwood M. College Awanohi Weiti Barwick L. Vaughan L. Awaruku
Mangemangeroa
Catchment Area
(km2) 1.05 0.6 48. 5.27 1.70 0.24 2.17 2.66 4.44
Lithology (dominant) Sandstone
or coarse
siltstone
(100%)
Sandstone
or coarse
siltstone
(100%)
Sandstone
or coarse
siltstone
(83%),
Alluvium
(9%)
Sandstone
or coarse
siltstone
(81%),
Sheared
mixed
lithologies
(10%)
Mudstone
or fine
siltstone -
banded
(43%),
Sandstone
or coarse
siltstone -
banded
(21%)
Sandstone
or coarse
siltstone
(100%)
Sandstone
or coarse
siltstone
(89%),
Alluvium
(8%)
Sandstone or
coarse
siltstone
(91%)
Sandstone or
coarse siltstone
(100%)
Land use
Exotic vegetation 4.4 % 99.2 % 23.5 % 9.4 % 83.3 % 11.6 % 1.6 % 3.3 %
Horticulture 0.5 % < 0.1 %
Native vegetation 12.0 % 0.8 % 21.1 % 55.4 % 2.2 % 7 % 23.5 % 9.2 % 38.0 %
Pastoral 83.6 % 53.8 % 35.1 % 14.5 % 60.9 % 8.6 % 58.1 %
Urban 1.0 % 93 % 4.0 % 80.7 % 0.6 %
Other < 0.1 % < 0.1 %
Catchment Slope
(m/m)
Mean 0.32 0.40 0.27 0.32 0.25 0.22 0.24 0.19 0.29
Maximum 1.24 2.33 6.75 11.16 1.37 1.11 1.79 1.67 30.45
Minimum < 0.01 < 0.01 < 0.01 < 0.01 < 0.01 < 0.01 < 0.01 < 0.01 < 0.01
SD 0.15 0.2 0.22 0.19 0.15 0.15 0.17 0.15 0.28
Mean Annual Rainfall
(mm/yr) 1570 1483 1591 1221 1226 1224 1202 1199 1177
Mean Annual Runoff
(mm/yr) 1079 677 750 266 606 229 626 841 347

Analysis of Sediment Yields within Auckland Region 15
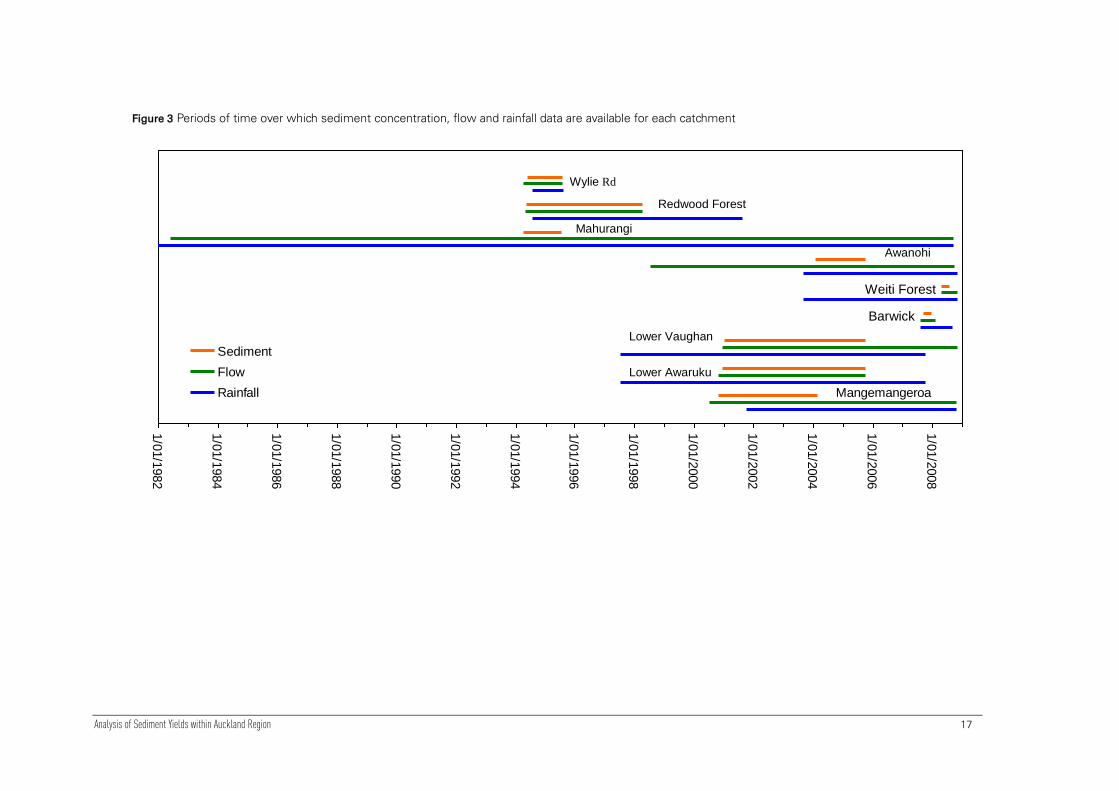
3.3 Data collected for sediment yield analysis
This section outlines the type of data collected in each catchment, when it was
collected, how it was collected, and the reason for sampling. The catchments have been
grouped into sub-regional groups, as catchments within each sub-region tend to have
the same method and reason for sampling. A timeline showing when the various types
of data were collected for each catchment is presented in Figure 3. A summary of the
total span of record for the sediment concentration, flow and rainfall data in each
catchment and the number of years of flow data available within that period of record
(i.e., period of record minus gaps in record) is presented in Table 3. Time-series plots of
water discharge and suspended sediment concentration at each site are included in
Appendix 1.
3.3.1 Mahurangi catchments - Wylie Road, Redwood Forest and Mahurangi College
The 48.83 km2 Mahurangi College catchment has a mixed land use. While pastoral
farming predominates, there are scattered patches of native bush and scrub, a
significant pine plantation, and an urban area (the Warkworth township). Wylies Road
and Redwood Forest are essentially single land use sub catchments of the larger
Mahurangi College catchment (Figure 4). The 1.05 km2 Wylies Road sub catchment is
pastoral (mostly sheep and beef farming). The 0.6 km2 Redwood Forest sub catchment
is within a commercial pine forest (classed as exotic vegetation) and was harvested
during the monitoring period, as detailed below.
Various studies relating to sediment yield have been conducted on these catchments. In
all cases, automated samples of suspended sediment were drawn from the stream,
collected as composited samples with 8 sub-samples to the bottle. Bottles are changed
when a trigger volume is reached and thus the bottles contain samples collected over
differing periods of time, depending on the stream flow. These samples can be
described as flow proportional sediment samples.
The Mahurangi Modelling Study was conducted to quantify sediment and other
contaminant output from the Mahurangi catchment to the Mahurangi Estuary. At the
beginning of 1994, ARC Environment and NIWA Ecosystems set up representative
catchment sites at the Mahurangi College, Wylie Road and Redwood Forest sites, along
with sampling stations in the harbour. The aim of this investigation was to collect data
from the catchment sites in order to calibrate a catchment model known as Basin New
Zealand (BNZ), while at the same time to collect water quality data in the harbour to
calibrate a hydrodynamic model known as System 21. These models were developed to
assist with planning and resource management decisions. Sediment samples were
collected simultaneously in all three catchments between July 1994 and June 1995. The
sampling methodology and a selection of the results from the Redwood Forest site are
presented in Becker and Ridley (1995), with further findings presented in Stroud and
Cooper (1997). In summary from these reports, the suspended sediment load for the

Analysis of Sediment Yields within Auckland Region 16
Wylies Road catchment (241 t/km2) was higher than that measured in the Redwood
Forest catchment (146 t/km2).
Analysis of Sediment Yields within Auckland Region 17
Figure 3 Periods of time over which sediment concentration, flow and rainfall data are available for each catchment
Continues
to 1921
1/0
1/1
982
1/0
1/1
984
1/0
1/1
986
1/0
1/1
988
1/0
1/1
990
1/0
1/1
992
1/0
1/1
994
1/0
1/1
996
1/0
1/1
998
1/0
1/2
000
1/0
1/2
002
1/0
1/2
004
1/0
1/2
006
1/0
1/2
008
Sediment
Flow
Rainfall Mangemangeroa
Barwick
Lower Vaughan
Wylie Rd
Redwood Forest
Awanohi
Weiti Forest
Mahurangi
Lower Awaruku

Analysis of Sediment Yields within Auckland Region 18
Figure 4 Aerial photograph (2006) and catchment boundaries of the Mahurangi College
catchment and the Wylie Road and Redwood Forest sub-catchments. The flow recorders
identified are at the downstream end of each catchment.
A study was also made of the sedimentation history and present day sedimentation
processes in the Mahurangi Estuary to determine how the estuary has responded to
historical changes in catchment sediment loads associated with landcover changes
following human settlement (Swales et al., 1997). The historical component of this
investigation included probing and coring the sediment column, stratigraphic analysis
of the cores, assessing channel infilling from historical soundings, determining
sediment accumulation rates from core stratigraphy and radiocarbon and pollen dating,
examining records of historical landcover, and estimating estuary sedimentation loads
from estuary infilling. These loads were compared with present day loads as computed

Analysis of Sediment Yields within Auckland Region 19
using the BNZ model described above. In summary, the estuary sedimentation load
deposited in the lower estuary since 1900 AD was found to average 702
tonnes/km2/yr, whereas the catchment suspended sediment load for the 20 years
preceding the report (1977-1997) averaged 448 tonnes/km2/yr.
In the 0.6 km2 Redwood Forest catchment, the sediment data were collected to
monitor the effects of the disturbance caused by roading and then logging on the
sediment loads carried by the Redwood Stream. Roading and salvage logging of the
basin commenced on 20 January 1997. General log harvesting commenced on 9 April
1997 and was completed on 11 February 1998. There were two periods of data
collection: the first (between May 1994 and July 1996) was in the pre harvest period
during which 546 bottles were collected and analysed for suspended sediment
concentration; the second was during the harvest period (between February 1997 and
March 1998) when 43 samples were collected and analysed for suspended sediment
concentration. Hicks and McKerchar (2000) observed no significant difference in
sediment concentration rating curves for the pre-harvest and harvesting periods, but
they did not examine event sediment yields.
For the Mahurangi College and Wylies Road catchments, the sediment concentration
data used in this study are essentially those obtained for the Mahurangi Modelling
Study over 1994/1995. During the sampling period, 21 flood events were captured in
the Wylies Road catchment and 34 in the Mahurangi College catchment. The additional
work carried out in the Redwood Forest catchment has provided a longer record of
sediment concentration data, with data available from 1994 – 1998 (Table 3).
Mahurangi has the longest flow record of all the catchments analysed in this study,
running from 11 June 1982 to 8 September 2008 with no gaps in the data record.
Redwood Forest has flow data collected over 4 years (from 10 May 1994 to 8 April
1998) with significant gaps (i.e., exceeding one week) between 22/5/1997 – 7/7/97 and
27/1/98 – 2/3/98. Wylie Road has a relatively short flow record from 19 April 1994 to 31
July 1995, but there are no gaps in this record.
3.3.2 Okura catchments – Awanohi Stream and Weiti Forest
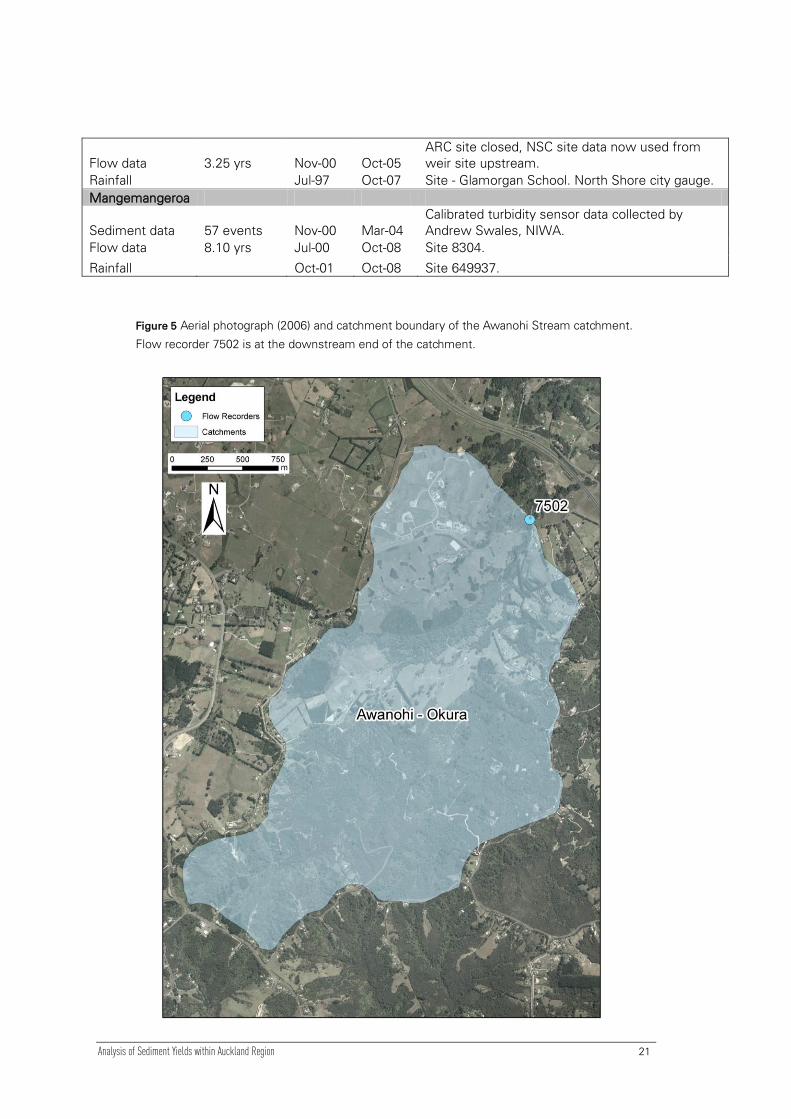
The Awanohi Stream and Weiti Forest catchments described in this study both drain
into the Okura Estuary. The 5.27 km2 Awanohi catchment is predominantly a mixture
of pastoral land and native bush and scrub (Figure 5). Two hundred and twenty-eight
discrete sediment samples were collected in this catchment using an automatic Isco
sampler between February 2004 and October 2005. Twelve events occurred during
this period, with peak discharges ranging from 189 to 19,655 l/s. The 1.7 km2 Weiti
Forest catchment is predominantly an exotic pine forest catchment with some pastoral
land (Figure 6). Ninety-eight discrete sediment samples were collected in this
catchment using an automatic Isco sampler between April and

Analysis of Sediment Yields within Auckland Region 20
Table 3 Data availability for the study sites. The second column shows the number of years of
flow record, excluding gaps, and the number of runoff events for which there is sediment
concentration data adequate for determining event sediment yield. The span of record indicates
the beginning and end dates of data collection.
Data by
Catchment
No.
years/events Span of Record Comment
Wylie Rd
Sediment data 21 events May-94 Jul-95
Sediment samples are composited 8 sub samples
to the bottle.
Flow data 1.28 yrs Apr-94 Jul-95
Rainfall Aug-94 Aug-95 Site - Mahurangi at Wylie Rd
Redwood Forest
Sediment data 34 events May-94 Mar-98
Sediment samples are composited 8 sub samples
to the bottle.
Flow data 3.67 yrs May-94 Apr-98 Level and flow rating in Hydstra and Tideda.
Rainfall Aug-94 Aug-01
Site - Mahurangi at Walkway. Good correlation
with nearby Mahurangi at Satellite dish.
Mahurangi
College
Sediment data 34 events Apr-94 Jul-95
Sediment samples are composited 8 sub samples
to the bottle.
Flow data 26.25 yrs Jun-82 Sept-08 Level and flow rating in Hydstra
Rainfall - Dec-94 Sep-08
Sites - Mahurangi at Satellite Dish and Mahurangi
at Sewage Treatment. There is also a composite
record back to 1921.
Awanohi Stream
Sediment data 12 events Feb-04 Oct-05
Discrete sediment samples collected using Isco
sampler.
Flow data 6.25 yrs Jul-98 Oct-08
The flow site closed from March 1999 to March
2003.
Rainfall Sep-03 Nov-08 Site – Awanohi
Weiti Forest
Sediment data 6 events Apr-08 Jul-08
Discrete sediment samples collected using Isco
sampler.
Flow data 0.56 yrs Apr-08 Nov-08 90 degree v-notch weir
Rainfall Sep-03 Nov-08 Site – Awanohi.
Barwick
Sediment data none Sep-07 Dec-07
Discrete sediment samples collected using Isco
sampler.
Flow data 0.48 yrs Aug-07 Feb-08
Pipe flow - stormwater system - Unidata sensor
used to measure velocity and depth
Rainfall Aug-07 Aug-08 Site – Barwick
Lower Vaughan
Sediment data 15 events Jan-01 Oct-05
Discrete sediment samples collected using Isco
sampler.
Flow data 6.07 yrs Dec-00 Nov-08 Site closed between Aug 2001 and June 2003.
Rainfall Jul-97 Oct-07 Site - Glamorgan School. North Shore city gauge
Lower Awaruku
Sediment data 16 events Dec-00 Oct-05
Discrete sediment samples collected using Isco
sampler.
Analysis of Sediment Yields within Auckland Region 21
Flow data 3.25 yrs Nov-00 Oct-05
ARC site closed, NSC site data now used from
weir site upstream.
Rainfall Jul-97 Oct-07 Site - Glamorgan School. North Shore city gauge.
Mangemangeroa
Sediment data 57 events Nov-00 Mar-04
Calibrated turbidity sensor data collected by
Andrew Swales, NIWA.
Flow data 8.10 yrs Jul-00 Oct-08 Site 8304.
Rainfall Oct-01 Oct-08 Site 649937.
Figure 5 Aerial photograph (2006) and catchment boundary of the Awanohi Stream catchment.
Flow recorder 7502 is at the downstream end of the catchment.

Analysis of Sediment Yields within Auckland Region 22
Figure 6 Aerial photograph (2006) and catchment boundary of the Weiti Forest catchment. Flow
recorder 7505 is at the downstream end of the catchment.

Analysis of Sediment Yields within Auckland Region 23
July 2008 (which is a limited record). Six events occurred during this period, with peak
discharges ranging from 60 to 2,614 l/s. Flow data is available from 20 July 1998 to 1
October 2008 in the Awanohi catchment; however, the flow site was closed between
22/3/1999 and 4/3/2003, leaving a 4-year gap in the record. The Weiti catchment has a
relatively short flow record from 14 April 2008 to 6 November 2008, but there are no
gaps in this record. The V-notch weir installed at the Okura – Weiti Stream flow
recording station can be seen in Figure 7.
A previous sediment yield related study was undertaken in the Okura region in 1999.
This aimed to predict the risks of ecologically damaging sediment events occurring in
the estuary as a consequence of land disturbance associated with varying degrees of
rural intensification. Various aspects of this investigation and their findings are
presented in reports by Stroud et al. (1999), Norkko et al. (1999), and Green and
Oldman (1999). Stroud et al. (1999) used the computer simulation model WAM
(Watershed Assessment Model) to make predictions of sediment input to the Okura
Estuary from the surrounding Okura catchment (covering both the Weiti and Awanohi
sub-catchments). WAM is a physically based model that does not need calibration, and
therefore no sediment concentration data were collected in the Weiti Forest or
Awanohi Stream catchments as part of that Okura study (Stroud et al., 1999).
Figure 7 Photograph of the V-notch weir at the Okura – Weiti Stream flow recording station (site
no. 7505).

Analysis of Sediment Yields within Auckland Region 24
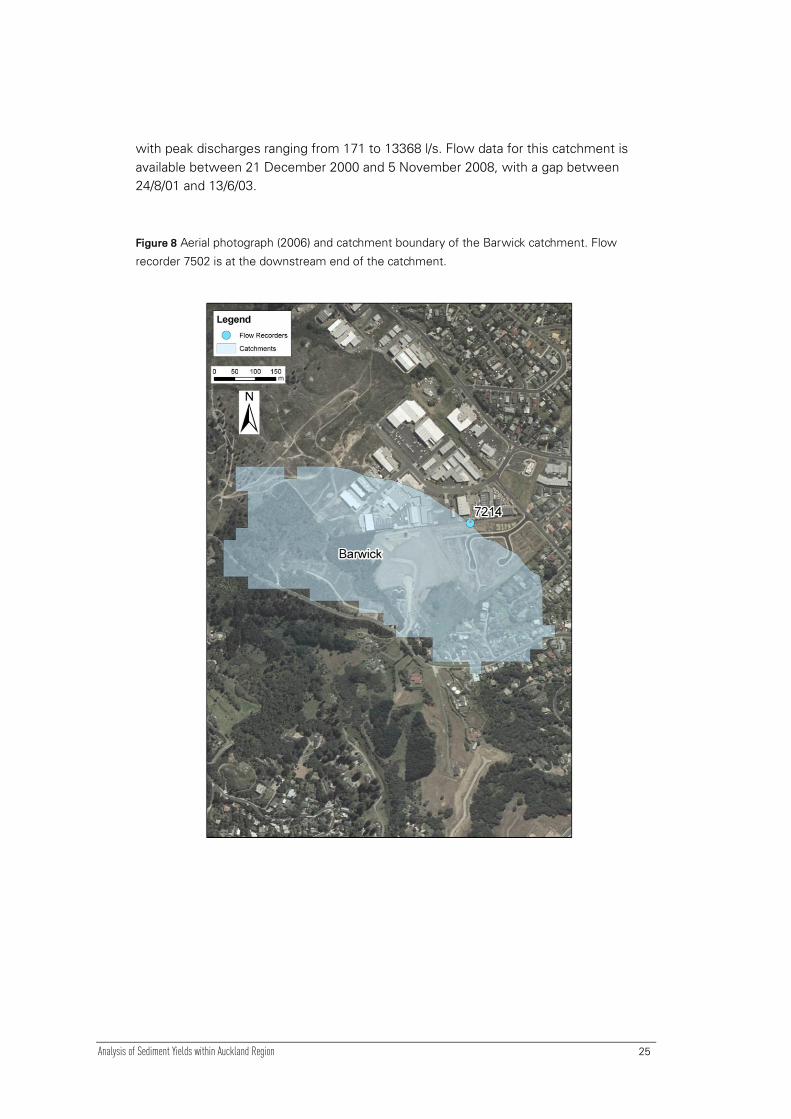
3.3.3 Barwick catchment
Barwick Estate is a small (0.24 km2) urban subdivision catchment that forms part of the
larger Whangaparoa catchment (Figure 8). Discrete sediment samples were collected
in this catchment using an automatic Isco sampler for the very short period between
September and December 2007. A continuous record of flow data is available over a
slightly longer period from 9 August 2007 to 1 February 2008. These data were
collected as part of an investigation to improve information on sediment entering
stormwater systems from small-lot developments (Hope, 2007). The aim was for data
to be collected over two periods: prior to the housing development and then during the
development process. The report provided by Hope (2007) only covers the period prior
to housing development while the catchment was in a grassed or ‘capped’ state, and 9
events are described. The data made available by the ARC for the present investigation
comprises a total of 44 samples, including 6 events. While the period of data collection
is essentially the same as that described in the Hope (2007) report, there appears to be
some discrepancy between the data used. Three of the events described in the Hope
(2007) report feature in the data provided (16/9/07, 18/10/07 and 6/12/07); however,
the remaining events described (2 in August and 4 in October) were not included in the
data provided for the present study. The limited sediment concentration data available
in the catchment prevented an event yield analysis; however, a sediment
concentration rating was established (see Sections 4 and 5.1).
3.3.4 Long Bay catchments – Lower Vaughan and Lower Awaruku
The 2.17 km2 Lower Vaughan and 2.66 km2 Lower Awaruku catchments sit adjacent to
each other in the Long Bay area (Figure 9). The Lower Vaughan is mainly pastoral, with
some native forest, while the Lower Awaruku is largely urban but has some native
forest and pasture. An initial sediment sampling program for this pair of catchments
was conducted by the Environmental Services section of the ARC during 2000 - 2002
in order to establish a means of determining the effects of future land use change in
this area. Results from this early investigation are presented in a draft report titled
‘Sediment Report.doc’ (author and date unknown). In both catchments, sediment
concentrations were only observed to be significant above a threshold flow (5.0 m3/s in
the Lower Vaughan and 5.5 m3/s in the Lower Awaruku), and an insufficient number of
events above the threshold flow occurred during the 2000-2002 sampling period. Since
that early report, additional flow and sediment data have been collected, and the
present report provides results from the full dataset.
In the Lower Awaruku catchment, a total of 258 discrete sediment samples were
collected between December 2000 and October 2005 using an automatic Isco
sampler. These samples cover 16 flood events with peak discharges ranging from
1462 to 8120 l/s. Events 2 – 4 were discarded during the data analysis as there were
insufficient sediment samples or sediment samples were not collected during the peak
of the flood. Flow data for this catchment is available between 1 November 2000 and 7
October 2005, with a gap between 21/3/02 and 26/11/03. In the Lower Vaughan
catchment, a total of 298 discrete sediment samples were collected between January
2001 and October 2005 using an Isco sampler. These samples cover 15 flood events
Analysis of Sediment Yields within Auckland Region 25
with peak discharges ranging from 171 to 13368 l/s. Flow data for this catchment is
available between 21 December 2000 and 5 November 2008, with a gap between
24/8/01 and 13/6/03.
Figure 8 Aerial photograph (2006) and catchment boundary of the Barwick catchment. Flow
recorder 7502 is at the downstream end of the catchment.

Analysis of Sediment Yields within Auckland Region 26
Figure 9 Aerial photograph (2006) and catchment boundaries of the Lower Awaruku and Lower
Vaughan catchments in Long Bay. Flow recorder sites 7506 and 7513 are at the downstream
ends of their respective catchments.
3.3.5 Mangemangeroa catchment
The 4.44 km2 Mangemangeroa catchment is located approximately 18 km east of
Auckland City. The catchment land use is predominantly a mixture of pasture and
native bush and scrub (Figure 10). Changes to the Manakau City Proposed District Plan
have allowed subdivision of this catchment, and its use is beginning to change from

Analysis of Sediment Yields within Auckland Region 27
farmland to lifestyle blocks of about 0.5–2 Ha. The Mangemangeroa Creek is one of
three tidal creeks that discharge to Whitford Bay.
Several earlier studies have investigated sediment yields from the Mangemangaroa
catchment. Heighway (1999) studied the effect of urban intensification on sediment
yields. This showed a quick response to storm runoff in the Mangemangeroa
catchment, with suspended sediment levels reduced to pre-storm levels within hours
and baseflow stream levels recovered after 9-10 hours. This study also stated that
suspended sediment levels in the stream are typically very low in comparison to other
studies (but it was unclear which studies Heighway was referring to). Oldman and
Swales (1999) used results from the BNZ model to examine the sediment loads that
would be delivered to the Mangemangeroa Creek estuary under allowable land use
development scenarios. The load results were then used with a numerical model to
predict sedimentation patterns in the estuary. The BNZ modelling predicted that
median erosion losses would be 8,480 tonnes/year under the existing land use from
the total catchment of the estuary.
The sediment data used in the present study were collected between November 2000
and March 2004 by Andrew Swales of NIWA, Hamilton, and Auckland Regional Council
Environmental Services, and is a different dataset to that used in either of the studies
described above. A hydrometric station was established above the tidal reach in a 4 m
wide, straight channel section of the Mangemangeroa Creek. The main record of
sediment concentration was secured with a Downing Model-3 optical backscatter
sensor (OBS) that was mounted 0.35 m above the bed. This provided a burst-averaged
record every 10 minutes. An Isco auto-sampler was used in flow-proportional mode
during storm runoff to collect samples beside the sensor in order to derive a calibration
relationship between the burst-averaged OBS sensor output and suspended sediment
concentration. The calibration samples were analysed for total suspended sediment
concentration and particle size, which was determined using a time-of-transition
stream-scanning laser particle-sizer. The OBS was calibrated using the ≤ 63 µm (silt-
clay) fraction concentration from the stormwater samples, and a separate relation was
obtained between silt-clay concentration and total sediment concentration based on
the particle size analysis results. Flow data is available between 14 July 2000 and 22
October 2008, with a gap between 2/3/2004 and 6/5/2004.

Analysis of Sediment Yields within Auckland Region 28
Figure 10 Aerial photograph (2006) and catchment boundary of the Mangemangeroa catchment.
Flow recorder 8304 is at the downstream end of the catchment.
Analysis of Sediment Yields within Auckland Region 29
4 Analysis Methods Three approaches were used to establish mean annual sediment yields for the nine
catchments in this investigation. The first was to establish a ‘sediment concentration
rating’ relationship between instantaneous suspended sediment concentration and
water discharge. The second was to determine an ‘event yield rating’ relationship
between individual event sediment yields and event hydrological magnitude (indexed
by event peak discharge). These two ratings were then applied across the full period of
flow record. The third approach was based on the event yield ratings, but employed a
Monte Carlo technique to make repeated estimates of the sediment yield over a 20-
year reference period. Further details on each approach are given below.
4.1 The sediment concentration rating approach
For each of the catchments with discrete sediment concentration records (Awanohi
Stream, Lower Vaughan – Long Bay, Lower Awaruku – Long Bay, Barwick and Weiti
Forest), the sediment concentration rating relationship was established by plotting
instantaneous suspended sediment concentration (SSC) versus instantaneous water
discharge (Q). This rating was then applied to the water discharge record to integrate
the sediment yield over the period of flow record. The sediment yield was also
integrated only during quickflow periods, as defined in section 4.2.
In the case of the Mangemangeroa catchment, the burst-averaged optical backscatter
records were converted to SSC using Equations 1 and 2 below (Andrew Swales,
NIWA, pers comm.).
973.49*347.0 avgsilt OBSC Equation 1.
silttotal CSSC *73.1 Equation 2.
where Csilt is the concentration of the suspended silt-clay fraction in mg/l, OBSavg is
OBS sensor output in mV, and SSCtotal is the total suspended sediment concentration
in mg/l. Equation 1 is the average of three calibrations undertaken during the
monitoring period. The three calibration relationships showed negligible variation in the
slope and constants, with R2> 0.99 in all cases. The maximum Csilt recorded was 1800
mg/l.
A variation on the instantaneous rating approach was needed for the Mahurangi
College, Redwood Forest, and Wylie Road catchments since at these sites composite
automatic sampling was employed. This meant that 8 sub-samples were composited
on a flow-proportional basis into each sample bottle, with each sub-sample triggered
when a fixed volume of water had passed by the site. Thus, the SSC of the total
sample in a sample bottle represents the flow-weighted SSC over the time required to
collect the 8 sub-samples into the bottle, and hence SSC was plotted against the mean
water discharge over the time required to collect the 8 sub-samples. When the rating

Analysis of Sediment Yields within Auckland Region 30
curve was applied to predict SSC during the process of calculating sediment yield, it
was therefore necessary to apply it in a way consistent with how it was derived. Thus,
sediment yield was integrated in steps of equal discharge volume through the flow
record, and the mean discharge over each step was input to the rating curve.
In the case of Redwood Forest, separate sediment rating curves were developed for
the pre-harvesting and post-harvesting periods (i.e., before and after 20 January 1997).
A LOWESS (Locally-Weighted Scatterplot Smoothing) approach was used to fit the
ratings for each catchment, with the LOWESS ratings represented by a series of
power step-functions. Since the data were transformed to their logarithms for curve-
fitting, the LOWESS curve was adjusted for log-transformation bias using the approach
of Ferguson (1986). This adjustment scales with the exponential of the local standard
error of the curve-fitting in log units, and was calculated during the LOWESS fitting
process (in a process similar to that detailed by Hicks et al., 2000). An example
LOWESS-fit rating curve for Mahurangi at College site is shown in Figure 11.
Approximating the bias-adjusted LOWESS curves with step-functions simplifies the
calculation of yields and induces no significant error.
In all cases, the residuals of the observed log SSC values compared to the log SSC
values predicted by the LOWESS fit were examined for normality and for a time trend.
Inspection of the event yield rating plots in log-log space showed that the residuals
(i.e., log of observed event yield minus log of predicted event yield, or log of the ratio
of observed to predicted yield) were homoschedastic with peak discharge (i.e., the
scatter was of similar magnitude irrespective of peak discharge). Normality was
evaluated with the Kolmogorov-Smirnov test at the 5% significance level, while a time-
trend was evaluated by testing the hypothesis that the coefficient on a linear relation
between log(observed/predicted event yield) was significantly different from zero at
the 5% significance level. No trend is indicated if the coefficient is not significantly
different from zero.

Analysis of Sediment Yields within Auckland Region 31
Figure 11. Example of a suspended sediment concentration rating from Mahurangi College
catchment. The rating applied is a bias-corrected Lowess fit rating.
Mahurangi at College
1
10
100
1000
10000
1 10 100 1000 10000 100000 1000000
Flow (l/s)
SS
C (
mg
/l)
SSC (mg/l)
Bias-correceted Lowess rating
4.2 The storm event sediment yield rating approach
The sediment concentration records for all catchments in this study were patchy,
either in terms of there being gaps in the data (i.e., not all runoff events were sampled)
or in terms of data quality (e.g., too few samples during a runoff event). Accordingly,
the strategy was to accurately measure the sediment yield from storm runoff events
with adequate data, and from these determine relationships between storm sediment
yield and an appropriate index of event hydrological magnitude (such as peak flow or
event runoff). The approach varied depending on whether the sediment concentration
record comprised discrete measurements or was a composited record.
For each of the catchments with discrete sediment concentration records (Awanohi
Stream, Lower Vaughan – Long Bay, Lower Awaruku – Long Bay, Barwick and Weiti
Forest), individual storms with sufficient sediment concentration data were identified.
Typically, we then added synthetic SSC data points to the beginning and end of the
events, since the auto samplers usually missed sampling these (if we did not add
these synthetic values, the TIDEDA software could interpolate high SSC values
between adjacent events). The SSC values we assigned to the start and end of events
were based on an appreciation of the typical concentrations at the tails of storm events
at a given site.
The times for the beginning and end of events were based on the beginning and end
of quickflow. Quickflow is the part of the water runoff from a rainstorm that moves
quickly through a basin; the remainder of the runoff, termed the ‘delayed flow’, arrives
in the stream channels more slowly after moving through the ground and other areas
of temporary storage. Following the procedure of Hewlett and Hibbert (1967),
hydrographs were examined to assess the typical quickflow separation slope for each
site. Also, a minimum value of quickflow runoff was set for each site in order to

Analysis of Sediment Yields within Auckland Region 32
discard tiny quickflow ‚events‛ generated by noise in the stage record. This approach
provides an objective, repeatable way of identifying the beginning and end of storm
events and for deciding whether a multi-peak hydrograph represents one event or
several. The same approach was used for generating series of events when the event
ratings were applied to determine mean annual sediment yields. The quickflow
separation slopes and event runoff minima are included in Table 5.
The sediment yield over discrete events was computed by direct integration of the
sediment concentration and discharge records using the PSIM module of the TIDEDA
hydrological software package. The PSIM module was also used to extract various
hydrological measures of each event, including the peak discharge.
A different procedure for determining event sediment yields was used for the
catchments with composited samples (Mahurangi College, Redwood Forest, and
Wylie Road). This involved making a plot of the time-cumulative load represented by
each sample bottle (for each bottle, this equalled the measured SSC x the mean water
discharge over the compositing period x the duration of the compositing period). This
cumulative plot was then interpolated at the beginning and ends of storm runoff
events, with the differences indicating the event sediment yields.
At the Mangemangeroa catchment, we simply used results on event sediment yields
provided by Andrew Swales (NIWA, Hamilton, pers. comm.).
For each catchment, the event sediment yields were plotted against peak discharge
(l/s), quickflow runoff (mm), and total runoff (mm). The storm sediment yields were
found to correlate best with the storm peak discharge, as has been found in previous
studies of a similar nature (Hicks, 1990). Usually, the event yield vs. peak discharge
relationship was represented best by a power-law regression. The exceptions were
Awanohi and Lower Awaruku, which were generally better represented by a linear
relationship, with a power relationship only applicable at lower discharges to ensure
that the rating produced zero sediment yield at a zero value of peak discharge. The
power-fit regressions were adjusted for log-bias using the bias-correction factor of
Duan (1983) – which gave essentially the same correction as did Ferguson’s (1986)
method. The event yield vs. peak discharge rating relationships established for each
catchment were then used to estimate the yields in all events over the duration of the
flow record, providing average annual sediment yield estimates.
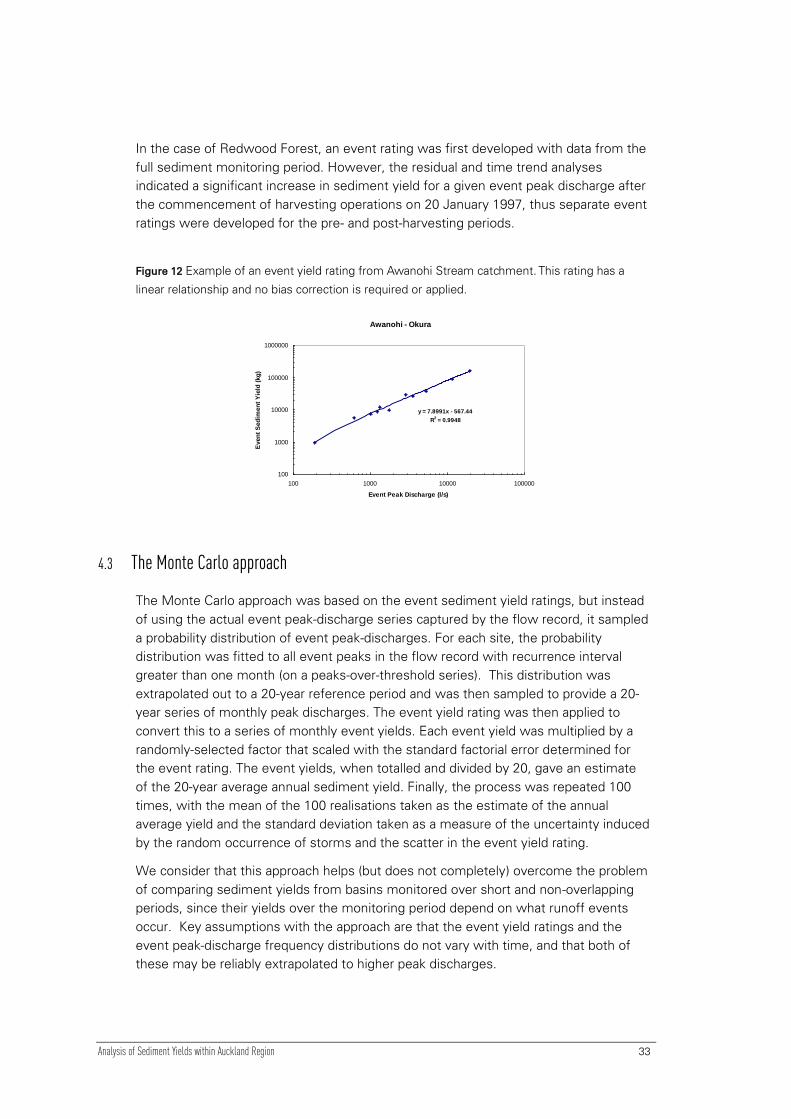
An example event yield rating is shown below for the Awanohi site (Figure 12).
Inspection of the event yield rating plots in log-log space showed that the residuals
(i.e., log of observed event yield minus log of predicted event yield, or log of the ratio
of observed to predicted yield) were homoschedastic with peak discharge (i.e., the
scatter was of similar magnitude irrespective of peak discharge) and were all normally
distributed (confirmed by the Kolmogorov-Smirnov test at the 5% significance level).
On this basis, a standard factorial error of the estimate was determined, and the
residuals were tested for a time-trend by testing the hypothesis that the coefficient on
a linear relation between log (observed/predicted event yield) was significantly
different from zero at the 5% significance level. No trend is indicated if the coefficient
is not significantly different from zero.
Analysis of Sediment Yields within Auckland Region 33
In the case of Redwood Forest, an event rating was first developed with data from the
full sediment monitoring period. However, the residual and time trend analyses
indicated a significant increase in sediment yield for a given event peak discharge after
the commencement of harvesting operations on 20 January 1997, thus separate event
ratings were developed for the pre- and post-harvesting periods.
Figure 12 Example of an event yield rating from Awanohi Stream catchment. This rating has a
linear relationship and no bias correction is required or applied.
Awanohi - Okura
y = 7.8991x - 567.44
R2 = 0.9948
100
1000
10000
100000
1000000
100 1000 10000 100000
Event Peak Discharge (l/s)
Even
t S
ed
imen
t Y
ield
(kg
)
4.3 The Monte Carlo approach
The Monte Carlo approach was based on the event sediment yield ratings, but instead
of using the actual event peak-discharge series captured by the flow record, it sampled
a probability distribution of event peak-discharges. For each site, the probability
distribution was fitted to all event peaks in the flow record with recurrence interval
greater than one month (on a peaks-over-threshold series). This distribution was
extrapolated out to a 20-year reference period and was then sampled to provide a 20-
year series of monthly peak discharges. The event yield rating was then applied to
convert this to a series of monthly event yields. Each event yield was multiplied by a
randomly-selected factor that scaled with the standard factorial error determined for
the event rating. The event yields, when totalled and divided by 20, gave an estimate
of the 20-year average annual sediment yield. Finally, the process was repeated 100
times, with the mean of the 100 realisations taken as the estimate of the annual
average yield and the standard deviation taken as a measure of the uncertainty induced
by the random occurrence of storms and the scatter in the event yield rating.
We consider that this approach helps (but does not completely) overcome the problem
of comparing sediment yields from basins monitored over short and non-overlapping
periods, since their yields over the monitoring period depend on what runoff events
occur. Key assumptions with the approach are that the event yield ratings and the
event peak-discharge frequency distributions do not vary with time, and that both of
these may be reliably extrapolated to higher peak discharges.
Analysis of Sediment Yields within Auckland Region 34
4.4 Determining magnitude-frequency relationships for event sediment yields
The event sediment yields generated from the flow record and event yield ratings, as
described in section 4.2, were used to produce event-yield magnitude-frequency plots.
Past experience has shown that these often contain useful information on the relative
importance of events of different return period (e.g., monthly compared with annual
events) and also sometimes show a land use effect (Hicks, 1994).
Analysis of Sediment Yields within Auckland Region 35
5 Results
5.1 Rating relationships
The sediment concentration ratings are plotted for each site in Appendix 1. Table 4
summarises the rating functions. The Redwood Forest data (Figure 23) are separated
between the pre- and post-harvesting periods, although the scatter is too large to
identify a significant overall difference in the rating relations (as Hicks and McKerchar,
2000, also found). Issues encountered during the data analysis at several sites are
discussed in Appendix 1.
The event analysis results are included in Appendix 1, along with the event yield rating
plots and plots showing how the residuals (observed yield / predicted yield) varied with
time. Table 5 summarises the event yield rating functions. The only site where the
residuals showed a significant time trend (at the 5% level) was at Redwood Forest
using the full dataset (Figure 25). On this basis, separate event yield ratings were fitted
for the pre-harvesting and post-harvesting periods (Figure 24).
The dataset at Barwick was too poor to complete an event yield analysis.
5.2 Sediment yields
The average annual specific sediment yields (t/km2/yr) derived by the three approaches
are listed in Table 6 and plotted on the top plot of Figure 13. The yields agree
reasonably well across the three approaches, although the sediment concentration
rating approach tends mostly to give a higher result than the event-yield approaches. In
part, this appears to be because the event-yield based approaches (which define
events in terms of discrete quickflow events that exceed a threshold quickflow runoff)
ignored sediment carried by the delayed flow (i.e., on event recessions after the
cessation of quickflow) and also ignored the sediment load carried by very small
events (typically with return periods less than 1 month). A measure of this effect was
found by using the sediment concentration rating approach to total just the sediment
load carried during quickflow events. The proportion of the load carried during
quickflow varied from 74% to 93% (Table 6). While this accounts for much of the
difference among yield estimates at some sites (e.g., Mahurangi, Awanohi), at other
sites the difference appears to be due more to sampling error in the rating relations
(which tends to be larger for the sediment concentration ratings). For example, it may
be that the sediment concentration rating approach is inclined to overestimate the load
during high winter base flows.
Because all of the approaches for estimating yields have advantages and
disadvantages, we suggest taking the average of the three results as representative,
with the standard deviation of the three results being indicative of the uncertainty
(there was only the sediment concentration rating based result determined from the

Analysis of Sediment Yields within Auckland Region 36
Barwick catchment, owing to the poor quantity of samples through runoff events).
These averaged yield results range from 13 t/km2/yr at the Barwick catchment up to
241 t/km2/yr at Redwood Forest after harvesting.
Table 4 Sediment concentration ratings determined for each catchment, including the overall
regression, standard factorial error and bias correction factor applicable to each.
SSC (mg/l) =
Overall
R2
Standard
Factorial
Error
Average Bias
Correction
Factor
Wylie Road
For Q<8.5: 11.54Q0.018
For Q < 58: 4.02Q0.51
For Q<373: 0.17Q1.29
For Q<1182: 192.36Q0.10
For Q>1182: 22.60Q0.41 0.74 1.86 1.06
Redwood pre-
harvesting
For Q<13: 21.4Q0.54
For Q<68: 3.67Q1.23
For Q<200: 371Q0.14
For Q<494: 0.1Q1.69
For Q>494: 2.81Q1.150 0.52 3.10 1.18
Redwood post-
harvesting
For Q<7: 0.566Q2.51
For Q<16: 163Q-0.39
For Q<35: 0.265Q1.92
For Q<91: 2.57Q1.28
For Q<162: 5.13Q1.13
For Q<262: 2538Q-0.087
For Q>262: 1.71Q1.22 0.66 3.10 1.18
Mahurangi College
For Q<1000: 12.1Q0.025
For Q<3190: 0.0163Q0.98
For Q<16730: 0.0057Q1.11
For Q<62630: 0.33Q0.69
For Q>62630: 0.149Q0.76 0.87 1.81 1.05
Awanohi
For Q< 1248: 1.3Q0.77
For Q>1248: 10.9Q0.47 0.82 1.78 1.04
Weiti
For Q<27: 9Q0.032
For Q<494: 0.162Q1.25
For Q>494: 1.82Q0.93 0.96 1.59 1.02
Barwick
For Q<1.64: 31Q0.26
For Q>1.64: 32Q0.2 0.21 3.22 1.2

Analysis of Sediment Yields within Auckland Region 37
Lower Vaughan For Q<300: 2.4Q0.57
For Q<1020: 0.87Q0.75
For Q<6342: 3.88Q0.532
For Q>6342: 1.62Q0.632 0.71 1.99 1.06
Lower Awaruku
For Q<120: 1.8Q0.752
For Q<580: 50.7Q0.055
For Q<3184: 0.136Q0.99
For Q>3184: 47.71Q0.259 0.44 2.25 1.1
Mangemangeroa
For Q<215: 0.176Q1.345
For Q<614: 123Q0.125
For Q<2864: 1.55Q0.807
For Q>2864: 1.15Q0.844 0.3 2.88 1.15
Table 5 Event yield ratings relating event sediment yield, Y (kg), to event peak discharge, Qp (l/s),
including the overall regression coefficient, standard factorial error, and bias correction factor
applicable to each. The bias correction factor is incorporated into the event yield relation’s
coeficient. Quickflow separation slope and minimum quickflow runoff are used to define storm
events (refer section 4.2).
Event Y (kg) =
Overall
R2
Standard
Factorial
Error
Bias
Correction
Factor
Quickflow
Separation
Slope
(ml/s2/km2)
Minimum
Quickflow
Runoff
(mm)
Wylie Road 1.01Qp1.19 0.9 1.6 1.12 1.0 1.0
Redwood pre-
harvesting 1.19Qp1.44 0.85 1.88 1.22
0.5 0.15
Redwood post-
harvesting 5.46Qp1.25 0.90 1.42 1.06
0.5 0.15
Mahurangi College 0.21Qp1.36 0.94 1.53 1.11 1.0 1.0
Awanohi
For Q<190: 4.9Qp1.05
For Q>190: 7.90Qp
567 0.98 1.19 N/A
0.9 1.0
Weiti 0.04Qp1.78 0.95 1.7 1.12 1.0 1.0
Barwick Too few events with adequate data to establish relationship
Lower Vaughan 0.39Qp1.209 0.85 2.25 1.18 2.6 1.0
Lower Awaruku
For Q<1520: 0.25Qp1.24
For Q>1520: 2.20Qp –
1185 0.87 1.42 N/A
2.0 1.0
Mangemangeroa
For Q>3354: 6.0Qp1.11
For Q<3354: 0.04Qp1.72 0.86 1.13 variable
1.5 1.0
Analysis of Sediment Yields within Auckland Region 38
Apart from the Barwick result, which should be viewed with caution owing to the short
(6 month) record period, these yield figures lie within the range of previous estimates
in the region. The harvesting at Redwood Forest appears to have increased the
sediment yield there by 24-53%, depending on the estimate, with an estimate-
averaged increase of 40%.
Monthly and annual sediment yields determined with the sediment concentration
rating and the event yield rating approaches are listed in Appendix 2.
5.3 Annual yield variability
An appreciation of the annual variability in sediment yield to be expected from year-to-
year variability in weather can be seen from Figure 14. This shows the annual specific
yields over the 26 calendar years of flow record at the Mahurangi College site as
estimated with the sediment concentration rating. The annual specific yield ranges
over a factor-of-ten, from 26 to 277 t/km2, with a mean of 109 t/km2 and a standard
deviation of 70 t/km2. Even the three-year running average yield ranges over a factor-
of-four. This hydrologically-driven annual variability indicates that yield estimates
among catchments with short and different record periods should be interpreted with
caution. The Mahurangi data shows no significant long-term trend with time.
Analysis of Sediment Yields within Auckland Region 39
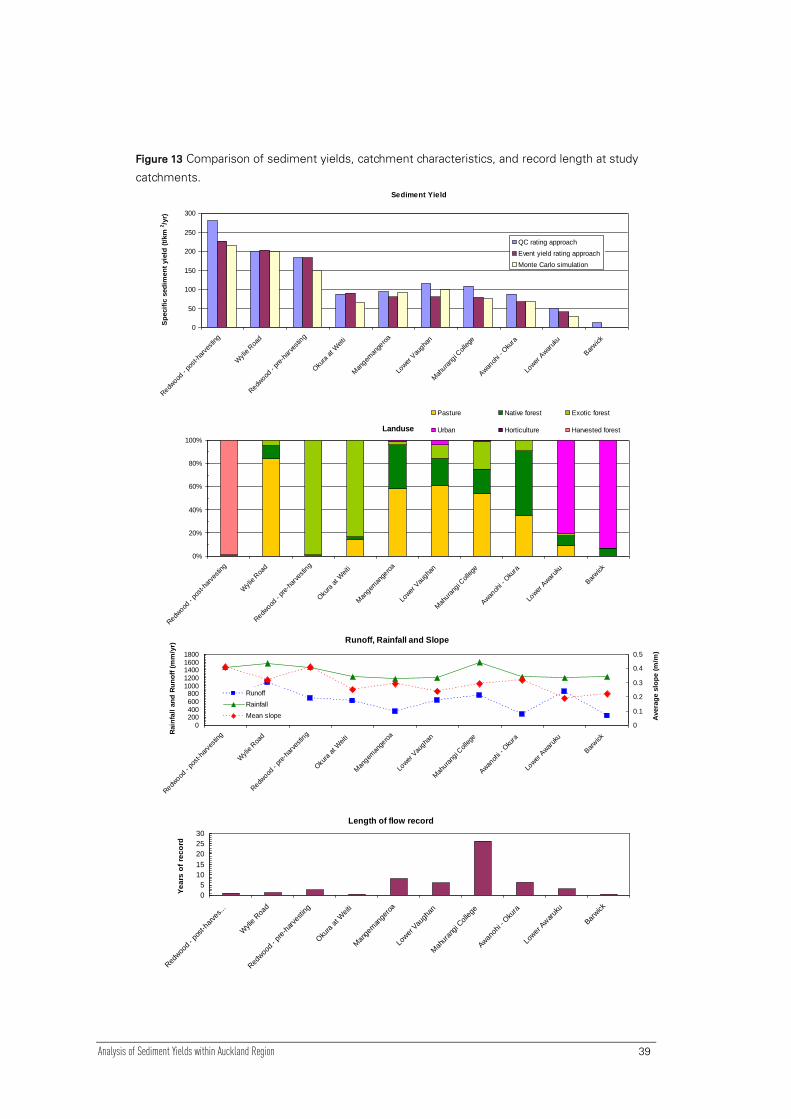
Figure 13 Comparison of sediment yields, catchment characteristics, and record length at study
catchments.
Sediment Yield
0
50
100
150
200
250
300
Redw
ood -
post-h
arve
sting
Wylie R
oad
Redw
ood -
pre-
harv
estin
g
Oku
ra a
t Weiti
Man
geman
gero
a
Lower
Vau
ghan
Mah
urang
i College
Awan
ohi -
Oku
ra
Lower
Awar
uku
Bar
wick
Sp
ecif
ic s
ed
imen
t yie
ld (
t/km
2/y
r)
QC rating approach
Event yield rating approach
Monte Carlo simulation
Landuse
0%
20%
40%
60%
80%
100%
Redw
ood -
post-h
arve
sting
Wylie R
oad
Redw
ood -
pre-
harv
estin
g
Oku
ra a
t Weiti
Man
geman
gero
a
Lower
Vau
ghan
Mah
urang
i College
Awan
ohi -
Oku
ra
Lower
Awar
uku
Bar
wick
Pasture Native forest Exotic forest
Urban Horticulture Harvested forest
Runoff, Rainfall and Slope
0200400600800
10001200140016001800
Redw
ood -
post-h
arve
sting
Wylie R
oad
Redw
ood -
pre-
harv
estin
g
Oku
ra a
t Weiti
Man
geman
gero
a
Lower
Vau
ghan
Mah
urang
i College
Awan
ohi -
Oku
ra
Lower
Awar
uku
Bar
wick
Rain
fall
an
d R
un
off
(m
m/y
r)
0
0.1
0.2
0.3
0.4
0.5A
vera
ge s
lop
e (
m/m
)
Runoff
Rainfall
Mean slope
Length of flow record
0
5
10
15
20
25
30
Red
woo
d - p
ost-h
arve
s...
Wylie R
oad
Red
woo
d - p
re-h
arve
sting
Oku
ra a
t Weiti
Man
gem
ange
roa
Lower
Vau
ghan
Mah
uran
gi C
ollege
Awan
ohi - O
kura
Lower
Awar
uku
Barwick
Ye
ars
of
rec
ord

Analysis of Sediment Yields within Auckland Region 40
Table 6 Summary of catchment characteristics and mean annual specific sediment yields established using sediment concentration rating, event yield rating
and Monte Carlo approaches. Data appear in order of decreasing sediment yield when ranked with Monte Carlo result. The ± term on the Monte Carlo result is
the standard deviation of the simulated yields. The % values following the sediment yields from the sediment concentration rating approach show the % of
the yield carried during quickflow events.
Catchment
Area (km2)
Years of
flow
data
Lithology
(% catchment area)
Land use
(% catchment area)
Mean
Slope
(m/m)
Mean
Annual
Rainfall
(mm/yr)
Runoff
(mm/yr)
Specific Sediment
Yield
Sediment
concentration rating
approach (t/km2/yr)
(% during quickflow
events)
Specific
Sediment Yield
Event yield
rating approach
(t/km2/yr)
Specific
Sediment
Yield
Monte Carlo
approach
(t/km2/yr)
Specific
Sediment
Yield
Average and
standard
deviation of
estimates
(t/km2/yr)
Wylie Road 1.05 1.28 Sandstone or coarse
siltstone (100%)
Pastoral (84%), Native
Vegetation (12%)
0.32 1570 1079 199.6
(93%)
202.9 199.1 ±28 200 ±2
Lower Vaughan 2.17 6.07 Sandstone or coarse
siltstone (89 %),
Alluvium (8%)
Pastoral (61%), Native
Vegetation (24%)
0.24 1202 625 115.6
(91%)
79.8 98.3 ±20 98 ±18
Mangemangeroa 4.44 8.1 Sandstone or coarse
siltstone (100%)
Pastoral (58%), Native
Vegetation (38%)
0.29 1177 347 93.7
(77%)
80.8 92.0 ±8 89 ±7
Mahurangi
College
48.83 26.25 Sandstone or coarse
siltstone (83%),
Alluvium (9%)
Pastoral (54%), Native
Vegetation (24%)
0.27 1591 750 108.9
(89%)
71.4 75.3 ±8 88 ±19
Okura at Weiti 1.70 0.56 Mudstone or fine
siltstone - banded
(43%), Sandstone or
coarse siltstone -
banded (21%)
Exotic Vegetation
(83%), Pastoral (15%)
0.25 1226 607 87.6
(85%)
90.7 66.1 ±18 82 ±13
Awanohi - Okura 5.27 6.25 Sandstone or coarse
siltstone (81%),
Sheared mixed
lithologies (10%)
Native Vegetation
(55%), Pastoral (35%)
0.32 1221 266 87.3
(85%)
67.2 67.0 ±5 79.0 ±12
Redwood Forest 0.6 3.67 Sandstone or coarse
siltstone (100%)
Exotic Vegetation
(99%), Native
Vegetation (1%)
0.40 1483 677 Pre-harvesting: 183
(83%)
Post-harvesting: 280
(82%)
183
227
150 ± 19
215 ±15
172 ± 19
241 ±35
Lower Awaruku 2.66 3.25 Sandstone or coarse
siltstone (91%)
Urban (81%), Native
Vegetation (9%)
0.19 1199 841 51.0
(74%)
41.0 29.0 ±2 40.0 ±11
Barwick 0.24 0.48 Sandstone or coarse
siltstone (100%)
Urban (93%), Native
Vegetation (7%)
0.22 1224 228 12.9
(-)
No event data No event
data
13

Analysis of Sediment Yields within Auckland Region 41
Figure 14 Annual specific sediment yields and three-year running average yield between 1982
and 2008 at the Mahurangi College site.
Mahurangi College Annual Specific Yields
0
50
100
150
200
250
300
1982
1984
1986
1988
1990
1992
1994
1996
1998
2000
2002
2004
2006
2008
Year
Sp
ecif
ic Y
ield
(t/
km
2)
Annual
3-year running average
Mean = 109 t/km2
5.4 Sediment yield vs. catchment characteristics
Relationships between specific sediment yield and catchment characteristics were
examined in three ways: from the plots on Figure 13, from a correlation matrix, and by
a multiple-regression analysis. In each case, the comparison was made in terms of the
average of the three yield-estimating approaches (as in the last column of Table 6).
Comparison of the sediment yield and land use plots in Figure 13 shows that the
highest yields are linked with forest harvesting (Redwood Forest) and the lowest yields
occur in the urban catchments (Lower Awaruku, Barwick). In between, there appears
to be a trend for sediment yield to increase as the percentage pasture cover increases
(and forest decreases). The exceptions to this trend are Redwood Forest during the
pre-harvesting phase and the Okura-Weiti catchment, both of which show a higher
yield than might be expected. The high pre-harvesting yield at Redwood Forest may
well reflect the steeper slopes and relatively high rainfall there. The yield figures for the
largely-forested Okura-Weiti catchment may be higher than the long-term average
owing to the short record (6 months in 2008), since Figure 14 suggests that 2008
produced higher than average sediment yields at Mahurangi. It is of note that –
allowing for the estimated uncertainty – there is marginal difference in the yields
among the Lower Vaughan, Mangemangeroa, Mahurangi College, Okura-Weiti, and
Okura-Awanohi catchments (their yields range from 79-98 t/km2/yr). Thus among
these catchments at least, a land use influence does not appear to be strong.
Analysis of Sediment Yields within Auckland Region 42
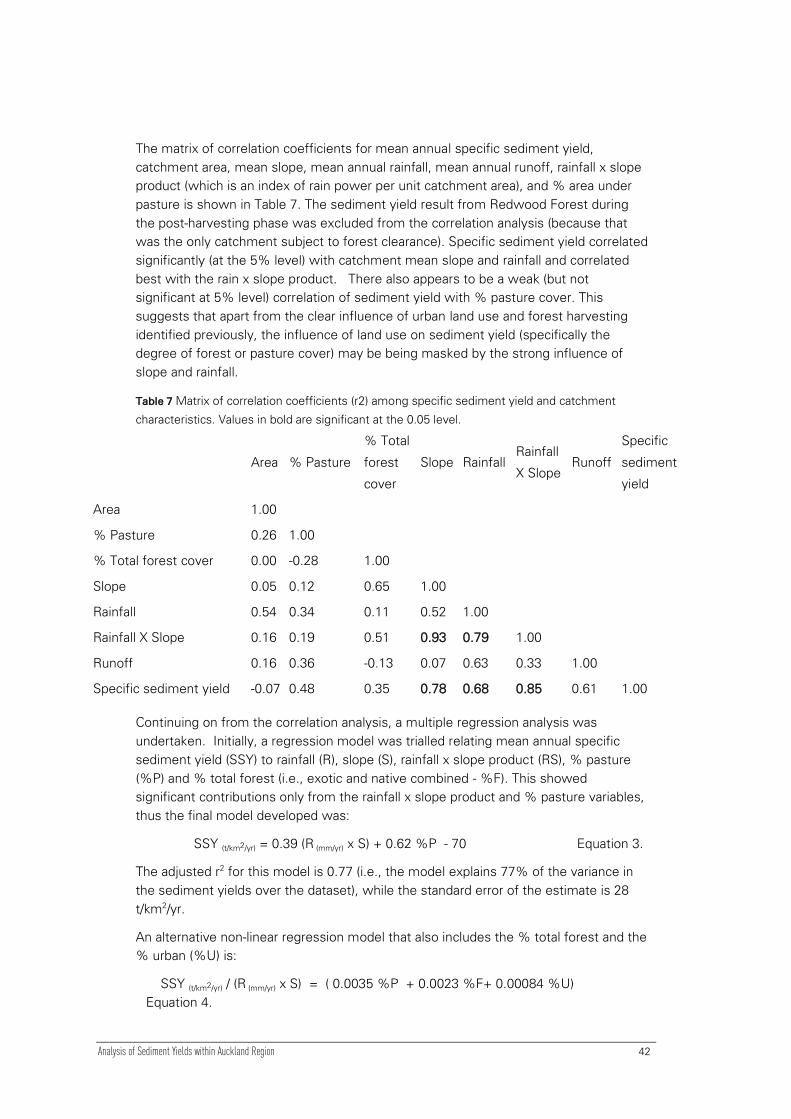
The matrix of correlation coefficients for mean annual specific sediment yield,
catchment area, mean slope, mean annual rainfall, mean annual runoff, rainfall x slope
product (which is an index of rain power per unit catchment area), and % area under
pasture is shown in Table 7. The sediment yield result from Redwood Forest during
the post-harvesting phase was excluded from the correlation analysis (because that
was the only catchment subject to forest clearance). Specific sediment yield correlated
significantly (at the 5% level) with catchment mean slope and rainfall and correlated
best with the rain x slope product. There also appears to be a weak (but not
significant at 5% level) correlation of sediment yield with % pasture cover. This
suggests that apart from the clear influence of urban land use and forest harvesting
identified previously, the influence of land use on sediment yield (specifically the
degree of forest or pasture cover) may be being masked by the strong influence of
slope and rainfall.
Table 7 Matrix of correlation coefficients (r2) among specific sediment yield and catchment
characteristics. Values in bold are significant at the 0.05 level.
Area % Pasture
% Total
forest
cover
Slope Rainfall Rainfall
X Slope Runoff
Specific
sediment
yield
Area 1.00
% Pasture 0.26 1.00
% Total forest cover 0.00 -0.28 1.00
Slope 0.05 0.12 0.65 1.00
Rainfall 0.54 0.34 0.11 0.52 1.00
Rainfall X Slope 0.16 0.19 0.51 0.93 0.79 1.00
Runoff 0.16 0.36 -0.13 0.07 0.63 0.33 1.00
Specific sediment yield -0.07 0.48 0.35 0.78 0.68 0.85 0.61 1.00
Continuing on from the correlation analysis, a multiple regression analysis was
undertaken. Initially, a regression model was trialled relating mean annual specific
sediment yield (SSY) to rainfall (R), slope (S), rainfall x slope product (RS), % pasture
(%P) and % total forest (i.e., exotic and native combined - %F). This showed
significant contributions only from the rainfall x slope product and % pasture variables,
thus the final model developed was:
SSY (t/km2/yr) = 0.39 (R (mm/yr) x S) + 0.62 %P - 70 Equation 3.
The adjusted r2 for this model is 0.77 (i.e., the model explains 77% of the variance in
the sediment yields over the dataset), while the standard error of the estimate is 28
t/km2/yr.
An alternative non-linear regression model that also includes the % total forest and the
% urban (%U) is:
SSY (t/km2/yr) / (R (mm/yr) x S) = ( 0.0035 %P + 0.0023 %F+ 0.00084 %U)
Equation 4.

Analysis of Sediment Yields within Auckland Region 43
In this model, which has an adjusted r2 of 0.93, both % pasture and % forest made a
significant contribution to the regression and the standard error of the estimate is
0.069. The coefficients identify relative yields from pasture, forest, and urban areas in
the proportions 1: 0.66: 0.24.
In summary, what this regression analysis indicates is that the variation in specific
sediment yield in the dataset is due mainly to catchment rainfall, mean slope, and land
use; and, for a given rainfall x slope product, the yields from forested areas are 2/3
those from pasture areas, while the yields from urbanised areas are ¼ of those from
pasture areas. Also, from the results from Redwood Forest, we can add that forest
harvesting increases the sediment yield by approximately 40%.
Finally, we note that the regression results are based on the assumption that the mean
annual sediment yields estimated for each catchment are stationary; that is, they
should not be expected to vary significantly with time and length of record. As
observed at Mahurangi (section 5.3), the yield figures averaged over only a few years
do vary significantly. Thus, some of the variance in yields among the study sites must
be assigned to sampling error associated with the timing and length of record. The
Monte Carlo approach, by predicting event peak flows and yields over a standard 20-
year reference period and also by allowing for sampling error in the event yield rating
relations, attempts to avoid this factor. That the mean annual sediment yields used for
the regression analysis are close to those derived just from the Monte Carlo approach
(to well within the standard error of the estimate of the regression models) provides
reassurance that the relationships indicated by the regressional models are functional
rather than simply due to chance.
5.5 Application of results and recommendations for further sediment monitoring
While we caution that this analysis is based on only nine basins, nonetheless, most of
the results are statistically significant. The study therefore offers promise that a model
of the form of Equation 4, ideally calibrated with more data, could provide the basis for
a land use and rainfall driven proxy for monitoring potential changes in sediment yield
in the Auckland region (such as for state-of-the-environment reporting). We
recommend ongoing sediment monitoring of sediment yield at a small number of key
sites in order to validate such predictions.
Also, since all of the study basins are formed in Waitemata Formation lithologies, we
recommend that sediment sampling be extended to cover catchments in other
lithologies across the Auckland region, notably the Onerahi Chaos terrane in the
northern part of the region and perhaps the greywacke terrain in the southeast.
5.6 Event-yield magnitude-frequency relations
Event yield magnitude-frequency relations provide an alternative approach for
comparing sediment yield among catchments. Figure 15 shows how, generally, the
event specific sediment yields of given return period show similar variations among

Analysis of Sediment Yields within Auckland Region 44
catchments as do the average annual yields described above. Thus, for example, the
lowest yields from annual events (return period 1 year) are from the urban Awaruku
catchment and the highest are from Redwood Forest and Wylies Road.
Also, such plots can contain additional information about sediment sources. In the case
of the study basins, the Mangemangeroa, Vaughan, and Awaruku magnitude-
frequency relations reduce more steeply at return periods smaller than about 3 months
(T ~ 0.25 yr). This suggests a difference in the nature of sediment sources in these
catchments, with erosion sites only contributing substantial sediment amounts during
larger, less common events. In turn, this hints at either an erosion threshold or
sediment exhaustion effect on erosion processes in these catchments.
Figure 15 A comparison of the magnitude-frequency distributions of event sediment yields at all
catchments. T is event return period on a peaks-over-threshold series.
Event-yield Magnitude-frequency Relations
0.1
1
10
100
1000
0.01 0.1 1 10
T (yr)
Ev
en
t s
ed
ime
nt
yie
ld (
t/k
m2)
Redwood (forest - post harvesting)
Redwood (forest - pre-harvest)
Wyllie (pasture)
Weiti (forest)
Mangemangeroa (pasture, forest)
Vaughn (pasture)
Mahurangi (pasture, forest)
Awanohi (forest, pasture)
Awaruku (urban)
Analysis of Sediment Yields within Auckland Region 45
6 Conclusions The main conclusions of this study of sediment yields from nine catchments in
Auckland’s Waitemata Formation terrane are as follows:
• Specific suspended sediment yields ranged from 13 t/km2/yr at the Barwick
catchment up to 241 t/km2/yr at Redwood Forest after harvesting. Apart from
the Barwick result, which should be viewed with caution owing to the short (6
month) record period, these yield figures lie within the range of previous
estimates in the region.
• The harvesting at Redwood Forest increased the sediment yield there by about
40%.
• The 27 year flow record at the Mahurangi College site indicated that annual
sediment yields there should have ranged over a factor-of-ten due to inter-annual
hydrological variability. The three-year running-average yield ranged over a factor-
of-four.
• A correlation and multiple-regression analysis indicated that the variation in
specific sediment yield in the dataset is due mainly to catchment rainfall, mean
slope, and land use. For a given rainfall x slope product, the yields from forested
areas are 2/3 those from pasture areas, while the yields from urbanised areas are
¼ of those from pasture areas.
• A comparison of the event-yield magnitude-frequency relationships for all but the
Barwick catchment (which had too little data) showed that generally, the specific
sediment yields of events of given return show similar variations among
catchments as do the average annual yields described above. Two pasture
catchments and one urban catchment showed evidence of either erosion
threshold or sediment exhaustion effects during small, frequently-occurring
events.
• The study offers the promise that an empirical sediment yield predictive model
driven by rainfall and land use could proxy for monitoring potential changes in
sediment yield in the Auckland region.
• We recommend ongoing monitoring of sediment yield at a small number of key
sites in order to validate such predictions, plus limited-term monitoring of
sediment yields in other lithologies so that the empirical model can be calibrated
and applied beyond the Waitemata Formation terrane.

Analysis of Sediment Yields within Auckland Region 46
7 References Becker, K. and Ridley, G. 1995. Mahurangi Modelling Study – Redwood Site. Working
Report Number 62. ARC Environment.
Duan, N. 1983. Smearing estimate: a non-parametric retransformation method. Journal
of the American Statistical Association 78: 605-610.
Ferguson, R.I. 1986. River loads underestimated by rating curves. Water Resources
Research 22: 74-76.
Green, M.O. and Oldman, J.W. 1999. Deposition of flood-borne sediment in Okura
estuary. Prepared by NIWA for Auckland Regional Council. NIWA Client
Report ARC90242.
Heighway, S.A. 1999. Sediment Yield from a Catchment undergoing Urban
Intensification. Masters Thesis. University of Auckland.
Hewlett, J.D. and Hibbert, R.A. 1967. Factors affecting the response of small
watersheds to precipitation in humid areas. In: Forest Hydrology (W.E.
Sopper and H.W. Lull, eds), Pergamon: 275-290.
Hicks, D.M. 1994. Storm Sediment Yields from Basins with Various Landuses in
Auckland Area. Prepared by NIWA for Auckland Regional Council. NIWA
Client Report ARC802/1
Hicks, D.M. and McKerchar, A.I. 2000. Redwood Stream sediment yield. Prepared by
NIWA for Auckland Regional Council. NIWA Client Report CHC00/39.
Hope, M. 2007. Wade Trib at Barwick Estate 09/08/2007 – 07/12/2007. Report for
Auckland Regional Council.
Hicks, D.M. 1990. Suspended sediment yields from pasture and exotic forest basins.
In: Proceedings of the 1990 NZ Hydrological Society Symposium, Taupo,
November 1990.
Hicks, D.M., Gomez, B., and Trustrum, N.E. 2000. Erosion thresholds and suspended
sediment yields, Waipaoa River Basin, New Zealand. Water Resources
Research 36: 1129-1142.
Norkko, A., Thrush, S.F., Hewitt, J.E., Norkko, J., Cummings, V.J., Ellis, J., Funnell, G.
and Schultz, D. 1999. Ecological effects of sediment deposition in Okura
Analysis of Sediment Yields within Auckland Region 47
estuary. Prepared by NIWA for Auckland Regional Council. NIWA Client
Report ARC90243.
Oldman, J.W., Swales, A. 1999. Mangemangeroa Estuary Numerical Modelling and
Sedimentation. Prepared by NIWA for Auckland Regional Council. NIWA
Client Report ARC70224.
Stroud, M.J., Cooper, AB. 1997 Modelling sediment load to the Mahurangi Estuary.
Prepared by NIWA for Auckland Regional Council. NIWA Client Report
ARC60211.
Stroud, M.J., Cooper, A.B., Bottcher, A.B., Hiscock, J.G. and Pickering, N.B. 1999.
Sediment runoff from the catchment of Okura estuary. Prepared by NIWA for
Auckland Regional Council. NIWA Client Report ARC9024/1.
Swales, A., Hume, T.M., Oldman, J.W. and Green, M.O. 1997. Mahurangi Estuary:
Sedimentation History and Recent Human Impacts. Prepared by NIWA for
Auckland Regional Council. NIWA Client Report ARC60201.

Analysis of Sediment Yields within Auckland Region 48
8 Appendix 1: Time series and rating plots
8.1 Wylie Rd
8.1.1 Time series plots
Figure 16 Time series plot of Wylie Road discharge record, indicating the magnitude and timing of
flood events.
0
10000
20000
24000
Flo
w l/s
19940401 9406 9407 9408 9409 9410 9411 9412 9501 9502 9503 9504 9505 9506 9507 YYMM
site 6809 Flow at Wylie Road Flow l/s
Figure 17 Time series plot of Wylie Road flow record with sediment over plotted in pink (with
scale on right vertical axis).
0
2000
4000
6000
8000
05/1
994
06/1
994
07/1
994
08/1
994
09/1
994
10/1
994
11/1
994
12/1
994
01/1
995
02/1
995
03/1
995
04/1
995
05/1
995
06/1
995
07/1
995
08/1
995
Date
Flo
w (
l/s)
0
200
400
600
800
1000
1200
1400S
ed
imen
t C
on
cen
trati
on
(m
g/l
)
Flow (l/s)
Sediment Concentration (mg/l)

Analysis of Sediment Yields within Auckland Region 49
8.1.2 Sediment concentration rating
Figure 18 Wylie Road sediment concentration rating
Sediment Concentration Rating - Wylie Road
1
10
100
1000
10000
1 10 100 1000 10000 100000
Flow (l/s)
Sed
imen
t C
on
cen
trati
on
(m
g/l
)
SSC (mg/l)
Bias-corrected Lowess rating
8.1.3 Event sediment yield rating
Figure 19 Event sediment yield rating for Wylie Road
Event Yields - Wylie Road
0.1
1
10
100
1000
100 1000 10000 100000
Event Peak Discharge - Qp (l/s)
Even
t S
ed
imen
t Y
ield
(t)
Event yield (t)
Power (Event yield (t))
Overall R2 0.74
R2 0.90

Analysis of Sediment Yields within Auckland Region 50
Figure 20 Event yield residuals at Wylie Road examining whether there is a significant change in
event yield over time. The trend over time was found to not be significant in this catchment.
Event Yield Residuals - Wylie Road
0.1
1
10
06
/19
94
08
/19
94
09
/19
94
11
/19
94
01
/19
95
02
/19
95
04
/19
95
05
/19
95
07
/19
95
09
/19
95
Date
Re
sid
ua
ls (
ob
se
rve
d/p
red
icte
d)
Obs/pred
Linear (Obs/pred)
8.2 Redwood Forest
8.2.1 Time series plots
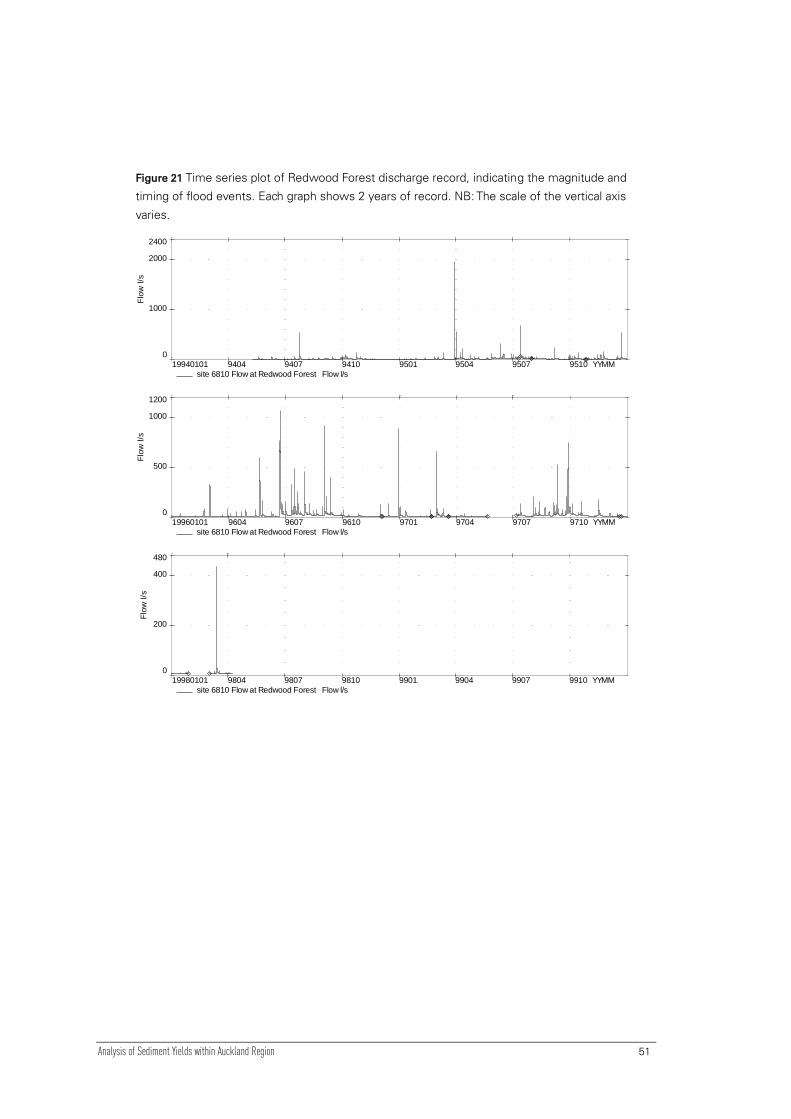
Analysis of Sediment Yields within Auckland Region 51
Figure 21 Time series plot of Redwood Forest discharge record, indicating the magnitude and
timing of flood events. Each graph shows 2 years of record. NB: The scale of the vertical axis
varies.
0
1000
2000
2400
Flo
w l/s
19940101 9404 9407 9410 9501 9504 9507 9510 YYMM
site 6810 Flow at Redwood Forest Flow l/s
0
500
1000
1200
Flo
w l/s
19960101 9604 9607 9610 9701 9704 9707 9710 YYMM
site 6810 Flow at Redwood Forest Flow l/s
0
200
400
480
Flo
w l/s
19980101 9804 9807 9810 9901 9904 9907 9910 YYMM
site 6810 Flow at Redwood Forest Flow l/s

Analysis of Sediment Yields within Auckland Region 52
Figure 22 Time series plot of Redwood Forest sediment concentration record with discharge over
plotted in blue (with scale on right vertical axis).
0
4000
8000
12000
16000
20000
05/1
994
12/1
994
06/1
995
01/1
996
07/1
996
02/1
997
08/1
997
03/1
998
Date
Sed
imen
t C
on
cen
trati
on
(m
g/l
)
0
100
200
300
400
500
600
700
800
900
1000
Dis
ch
arg
e (
l/s)
Sediment Concentration
Flow (l/s)
8.2.2 Sediment concentration rating
Figure 23 Redwood Forest sediment concentration rating
Sediment Concentration Ratings - Redwood Forest
1
10
100
1000
10000
100000
0.1 1 10 100 1000 10000
Discharge (l/s)
Se
dim
en
t C
on
ce
ntr
ati
on
(m
g/l)
Pre-harvesting bias-corrected
LOWESS rating
Pre-harvesting
Post-harvesting
Post-harvesting bias-corrected
LOWESS rating
A close inspection of the Redwood Forest sediment concentration rating data, and the residuals
from the LOWESS rating relations, showed a bias induced by a relatively small number of
samples collected in 1996. Effectively, what was happening was that the samples collected in
GAP
in
dataset

Analysis of Sediment Yields within Auckland Region 53
1996 were at times of high base flow, whereas the LOWESS-fit rating was dominated by the
more numerous samples collected during 1995 over a range of base flows. This meant that the
sediment concentration rating was over-estimating the sediment yield during the high base flow
period of 1996. For this reason, the sediment concentration rating based yield estimate during
the pre-harvesting phase was made for the period 10 May 1994 through 31 December 1995, for
which we were satisfied that the rating was representative. For this 1.63 year period, the
sediment yield determined from the sediment concentration rating approach (179 t) agreed well
with the yield integrated directly from the almost continuous span of composited auto-samples
(169 t), as reported by Hicks and McKerchar (2000).
8.2.3 Event sediment yield rating
Figure 24 Event yield rating at Redwood Forest
Event Yields - Redwood Forest
100
1000
10000
100000
10 100 1000 10000
Event Peak Discharge - Qp (l/s)
Ev
en
t S
ed
ime
nt
Yie
ld (
kg
)
Post-harvesting
Pre-harvesting
Power (Post-harvesting)
Power (Pre-harvesting)
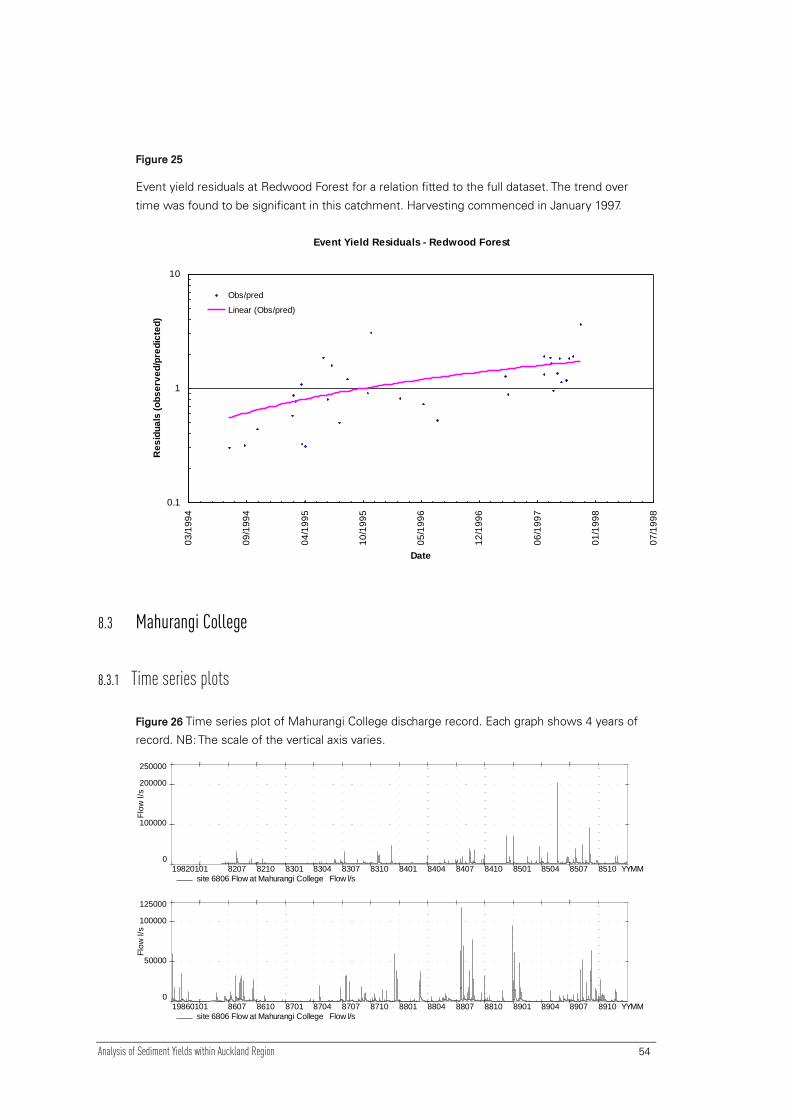
Analysis of Sediment Yields within Auckland Region 54
Figure 25
Event yield residuals at Redwood Forest for a relation fitted to the full dataset. The trend over
time was found to be significant in this catchment. Harvesting commenced in January 1997.
Event Yield Residuals - Redwood Forest
0.1
1
10
03
/19
94
09
/19
94
04
/19
95
10
/19
95
05
/19
96
12
/19
96
06
/19
97
01
/19
98
07
/19
98
Date
Re
sid
ua
ls (
ob
se
rve
d/p
red
icte
d)
Obs/pred
Linear (Obs/pred)
8.3 Mahurangi College
8.3.1 Time series plots
Figure 26 Time series plot of Mahurangi College discharge record. Each graph shows 4 years of
record. NB: The scale of the vertical axis varies.
0
100000
200000
250000
Flo
w l/s
19820101 8207 8210 8301 8304 8307 8310 8401 8404 8407 8410 8501 8504 8507 8510 YYMM
site 6806 Flow at Mahurangi College Flow l/s
0
50000
100000
125000
Flo
w l/s
19860101 8607 8610 8701 8704 8707 8710 8801 8804 8807 8810 8901 8904 8907 8910 YYMM
site 6806 Flow at Mahurangi College Flow l/s
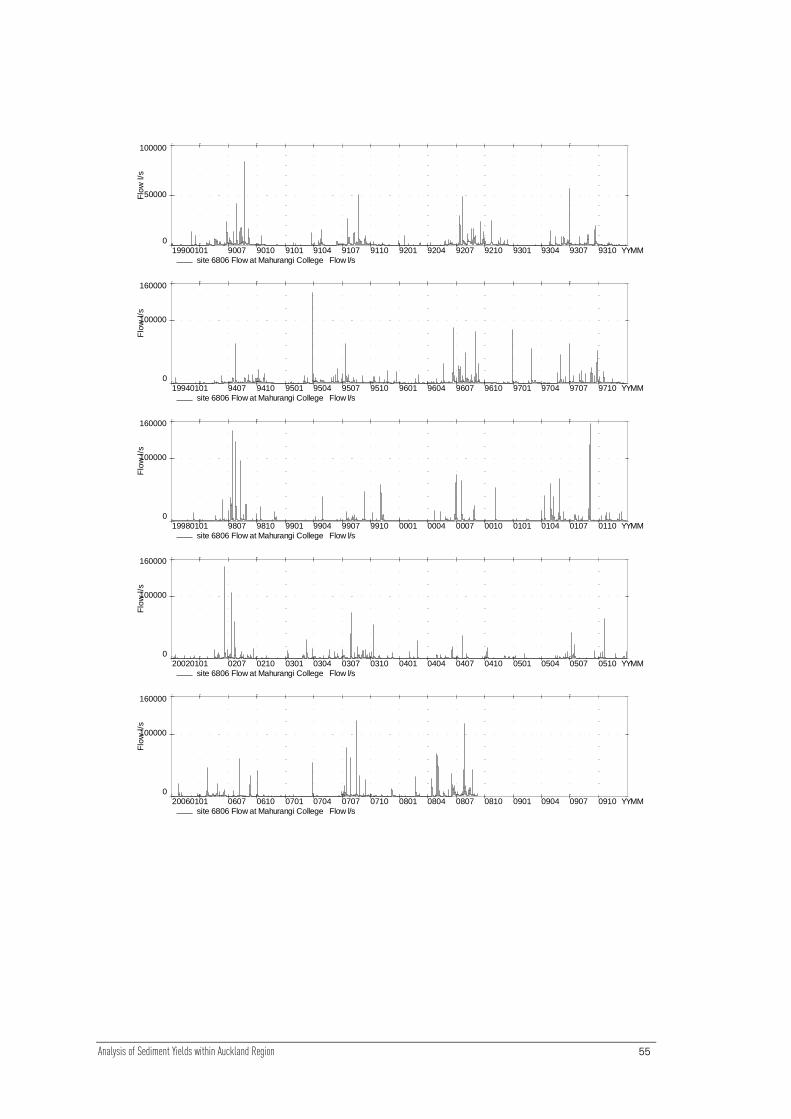
Analysis of Sediment Yields within Auckland Region 55
0
50000
100000F
low
l/s
19900101 9007 9010 9101 9104 9107 9110 9201 9204 9207 9210 9301 9304 9307 9310 YYMM
site 6806 Flow at Mahurangi College Flow l/s
0
100000
160000
Flo
w l/s
19940101 9407 9410 9501 9504 9507 9510 9601 9604 9607 9610 9701 9704 9707 9710 YYMM
site 6806 Flow at Mahurangi College Flow l/s
0
100000
160000
Flo
w l/s
19980101 9807 9810 9901 9904 9907 9910 0001 0004 0007 0010 0101 0104 0107 0110 YYMM
site 6806 Flow at Mahurangi College Flow l/s
0
100000
160000
Flo
w l/s
20020101 0207 0210 0301 0304 0307 0310 0401 0404 0407 0410 0501 0504 0507 0510 YYMM
site 6806 Flow at Mahurangi College Flow l/s
0
100000
160000
Flo
w l/s
20060101 0607 0610 0701 0704 0707 0710 0801 0804 0807 0810 0901 0904 0907 0910 YYMM
site 6806 Flow at Mahurangi College Flow l/s

Analysis of Sediment Yields within Auckland Region 56
Figure 27 Time series plot of Mahurangi College flow record with sediment over plotted in pink
(with scale on right vertical axis).
0
20000
40000
60000
80000
10000003/1
994
05/1
994
07/1
994
08/1
994
10/1
994
12/1
994
01/1
995
03/1
995
05/1
995
06/1
995
08/1
995
Date
Dis
ch
arg
e (
l/s)
0
200
400
600
800
1000
1200
1400
1600
Sed
imen
t C
on
cen
trati
on
(m
g/l
)
Discharge (l/s)
Sediment Concentration (mg/l)
8.3.2 Sediment concentration rating
Figure 28 Sediment concentration rating at Mahurangi College
Sediment Concentration Rating - Mahurangi at College
1
10
100
1000
10000
1 10 100 1000 10000 100000 1000000
Flow (l/s)
Sed
imen
t C
on
cen
trati
on
(m
g/l
)
SSC (mg/l)
Bias-corrected Lowess rating
Overall R2 0.87
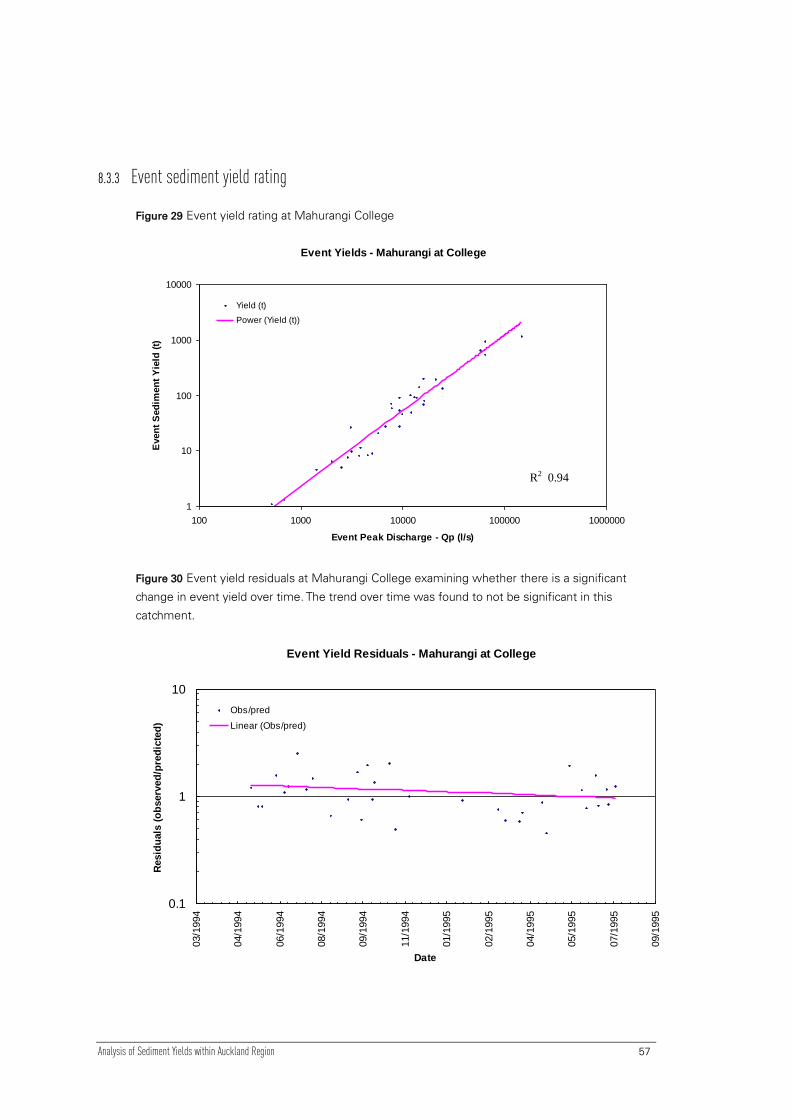
Analysis of Sediment Yields within Auckland Region 57
8.3.3 Event sediment yield rating
Figure 29 Event yield rating at Mahurangi College
Event Yields - Mahurangi at College
1
10
100
1000
10000
100 1000 10000 100000 1000000
Event Peak Discharge - Qp (l/s)
Even
t S
ed
imen
t Y
ield
(t)
Yield (t)
Power (Yield (t))
Figure 30 Event yield residuals at Mahurangi College examining whether there is a significant
change in event yield over time. The trend over time was found to not be significant in this
catchment.
Event Yield Residuals - Mahurangi at College
0.1
1
10
03/1
994
04/1
994
06/1
994
08/1
994
09/1
994
11/1
994
01/1
995
02/1
995
04/1
995
05/1
995
07/1
995
09/1
995
Date
Resid
uals
(o
bserv
ed
/pre
dic
ted
)
Obs/pred
Linear (Obs/pred)
R2 0.94
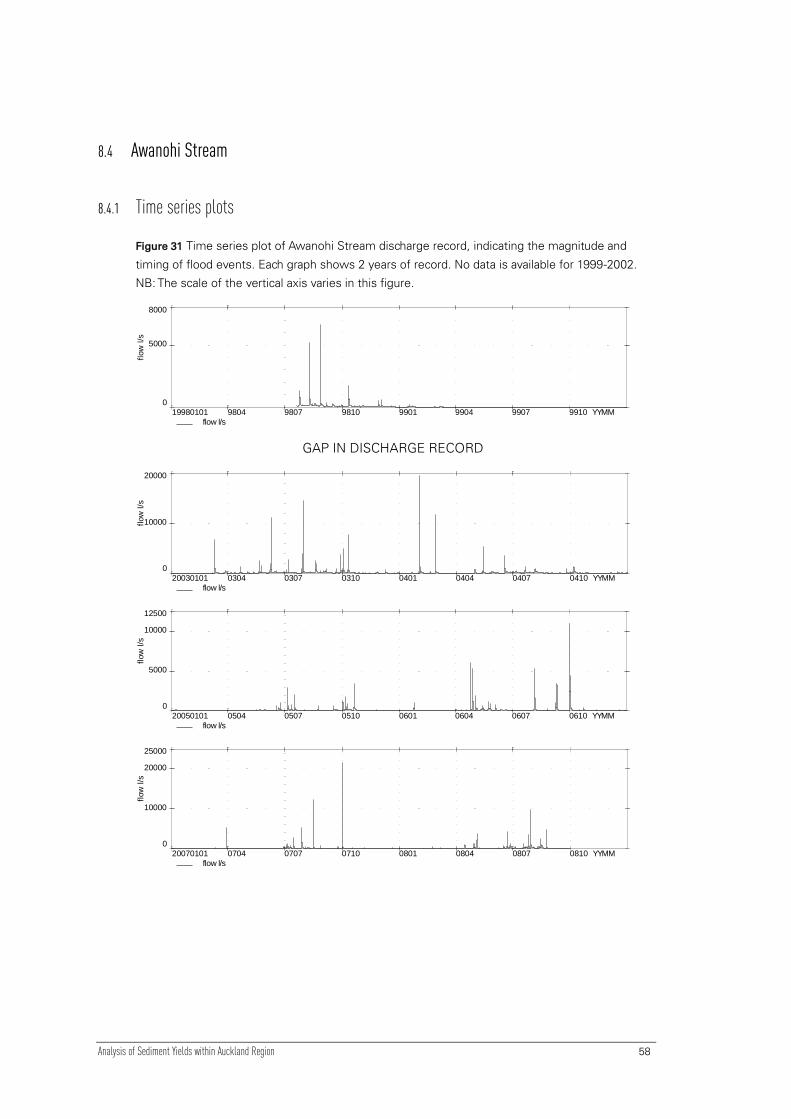
Analysis of Sediment Yields within Auckland Region 58
8.4 Awanohi Stream
8.4.1 Time series plots
Figure 31 Time series plot of Awanohi Stream discharge record, indicating the magnitude and
timing of flood events. Each graph shows 2 years of record. No data is available for 1999-2002.
NB: The scale of the vertical axis varies in this figure.
0
5000
8000
flow
l/s
19980101 9804 9807 9810 9901 9904 9907 9910 YYMM
flow l/s
GAP IN DISCHARGE RECORD
0
10000
20000
flow
l/s
20030101 0304 0307 0310 0401 0404 0407 0410 YYMM
flow l/s
0
5000
10000
12500
flow
l/s
20050101 0504 0507 0510 0601 0604 0607 0610 YYMM
flow l/s
0
10000
20000
25000
flow
l/s
20070101 0704 0707 0710 0801 0804 0807 0810 YYMM
flow l/s
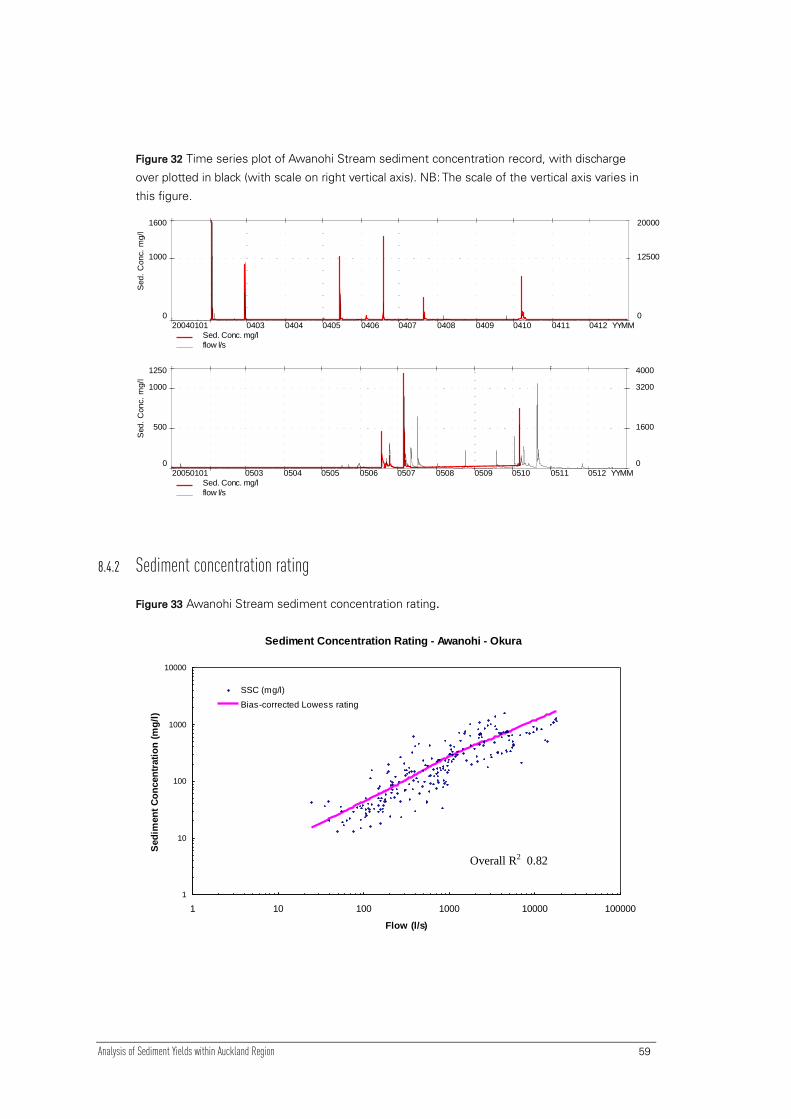
Analysis of Sediment Yields within Auckland Region 59
Figure 32 Time series plot of Awanohi Stream sediment concentration record, with discharge
over plotted in black (with scale on right vertical axis). NB: The scale of the vertical axis varies in
this figure.
0
1000
1600
Sed
. C
on
c.
mg/l
20040101 0403 0404 0405 0406 0407 0408 0409 0410 0411 0412 YYMM
Sed. Conc. mg/l
0
12500
20000
flow l/s
0
500
1000
1250
Sed
. C
on
c.
mg/l
20050101 0503 0504 0505 0506 0507 0508 0509 0510 0511 0512 YYMM
Sed. Conc. mg/l
0
1600
3200
4000
flow l/s
8.4.2 Sediment concentration rating
Figure 33 Awanohi Stream sediment concentration rating.
Sediment Concentration Rating - Awanohi - Okura
1
10
100
1000
10000
1 10 100 1000 10000 100000
Flow (l/s)
Sed
imen
t C
on
cen
trati
on
(m
g/l
)
SSC (mg/l)
Bias-corrected Lowess rating
Overall R2 0.82

Analysis of Sediment Yields within Auckland Region 60
8.4.3 Event sediment yield rating
Table 8 Event characteristics and yields for Awanohi Stream.
Start date
(yyyymmdd)
Start time
(hhmmss)
Quick
flow
sed.
yield
(kg)
Event
sed.
yield
(kg)
Quick
flow
(mm)
Total
runoff
(mm)
Peak
Discharge
(l/s)
Peak
sed.
Conc.
(mg/l)
Quick
flow
event
duration
(hr)
Event
1 20040202 000900 157113 157113 31.2 35.2 19655 1596 17.9
2 20040228 120900 88570 88625 35.8 43.6 11694 888 21.1
3 20040514 132400 35525 36853 10.4 15.5 5317 1004 19.6
4 20040604 022400 262 956 0.1 5.4 189 75 9.4
5 20040618 121800 26411 26640 8.7 12.6 3575 1353 21.1
6 20040720 193400 8318 8747 5.3 9.2 1242 359 18.4
7 20041007 070900 10208 12036 3.7 10.9 1331 710 23.2
8 20050618 093700 4569 5535 1.8 4 612 452 10.7
10 20050624 070400 6443 7285 6.3 14.5 1016 162 23.1
11 20050706 064400 28491 29690 8.9 20.8 2876 1162 31.4
12 20051006 205900 8867 9498 3.4 6.6 1767 745 11.4
Figure 34 Event yield rating for Awanohi Stream
Event Yields - Awanohi - Okura
100
1000
10000
100000
1000000
100 1000 10000 100000
Event Peak Discharge - Qp (l/s)
Even
t S
ed
imen
t Y
ield
(kg
)
Series1
Linear (Series1)
Overall R2 0.98
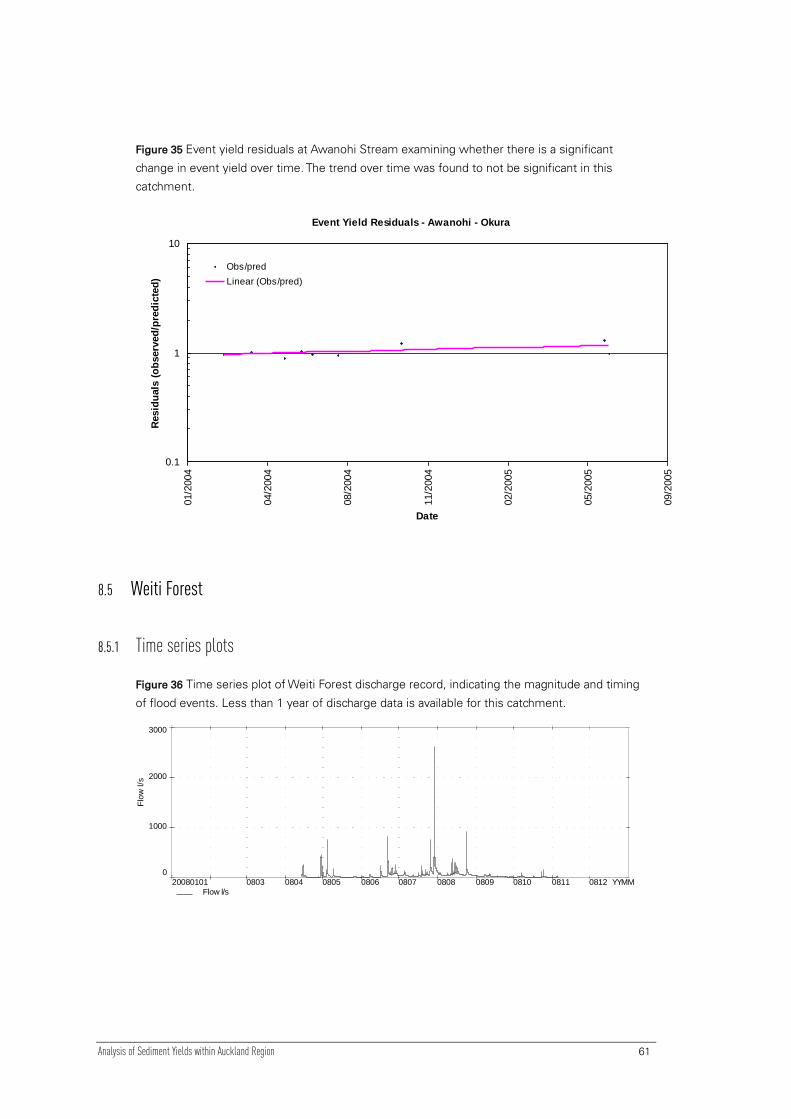
Analysis of Sediment Yields within Auckland Region 61
Figure 35 Event yield residuals at Awanohi Stream examining whether there is a significant
change in event yield over time. The trend over time was found to not be significant in this
catchment.
Event Yield Residuals - Awanohi - Okura
0.1
1
10
01/2
004
04/2
004
08/2
004
11/2
004
02/2
005
05/2
005
09/2
005
Date
Resid
uals
(o
bserv
ed
/pre
dic
ted
)
Obs/pred
Linear (Obs/pred)
8.5 Weiti Forest
8.5.1 Time series plots
Figure 36 Time series plot of Weiti Forest discharge record, indicating the magnitude and timing
of flood events. Less than 1 year of discharge data is available for this catchment.
0
1000
2000
3000
Flo
w l/s
20080101 0803 0804 0805 0806 0807 0808 0809 0810 0811 0812 YYMM
Flow l/s
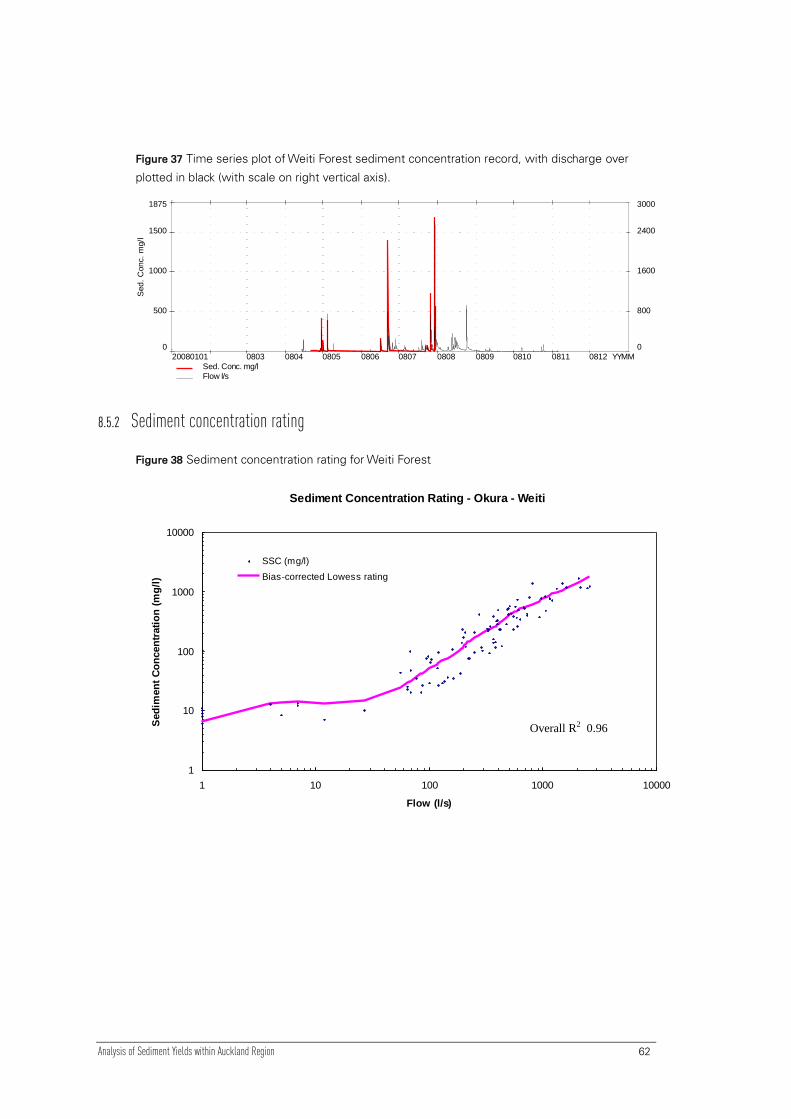
Analysis of Sediment Yields within Auckland Region 62
Figure 37 Time series plot of Weiti Forest sediment concentration record, with discharge over
plotted in black (with scale on right vertical axis).
0
500
1000
1500
1875
Sed.
Conc.
mg/l
20080101 0803 0804 0805 0806 0807 0808 0809 0810 0811 0812 YYMM
Sed. Conc. mg/l
0
800
1600
2400
3000
Flow l/s
8.5.2 Sediment concentration rating
Figure 38 Sediment concentration rating for Weiti Forest
Sediment Concentration Rating - Okura - Weiti
1
10
100
1000
10000
1 10 100 1000 10000
Flow (l/s)
Sed
imen
t C
on
cen
trati
on
(m
g/l
)
SSC (mg/l)
Bias-corrected Lowess rating
Overall R2 0.96
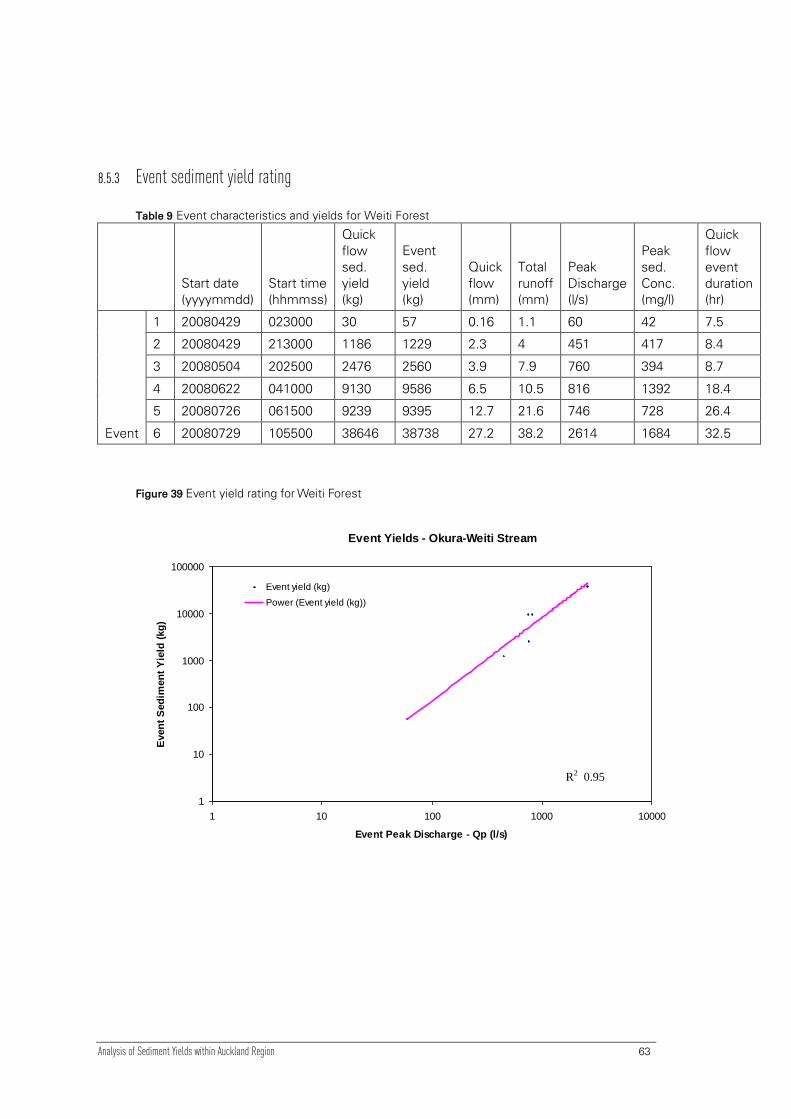
Analysis of Sediment Yields within Auckland Region 63
8.5.3 Event sediment yield rating
Table 9 Event characteristics and yields for Weiti Forest
Start date
(yyyymmdd)
Start time
(hhmmss)
Quick
flow
sed.
yield
(kg)
Event
sed.
yield
(kg)
Quick
flow
(mm)
Total
runoff
(mm)
Peak
Discharge
(l/s)
Peak
sed.
Conc.
(mg/l)
Quick
flow
event
duration
(hr)
Event
1 20080429 023000 30 57 0.16 1.1 60 42 7.5
2 20080429 213000 1186 1229 2.3 4 451 417 8.4
3 20080504 202500 2476 2560 3.9 7.9 760 394 8.7
4 20080622 041000 9130 9586 6.5 10.5 816 1392 18.4
5 20080726 061500 9239 9395 12.7 21.6 746 728 26.4
6 20080729 105500 38646 38738 27.2 38.2 2614 1684 32.5
Figure 39 Event yield rating for Weiti Forest
Event Yields - Okura-Weiti Stream
1
10
100
1000
10000
100000
1 10 100 1000 10000
Event Peak Discharge - Qp (l/s)
Even
t S
ed
imen
t Y
ield
(kg
)
Event yield (kg)
Power (Event yield (kg))
R2 0.95

Analysis of Sediment Yields within Auckland Region 64
Figure 40 Event yield residuals at Weiti Forest examining whether there is a significant change in
event yield over time. The trend over time was found to not be significant in this catchment.
Event Yield Residuals - Okura - Weiti Stream
0.1
1
10
04
/20
08
05
/20
08
06
/20
08
06
/20
08
07
/20
08
07
/20
08
08
/20
08
Date
Re
sid
ua
ls (
ob
se
rve
d/p
red
icte
d)
Obs/pred
Linear (Obs/pred)
8.6 Barwick
8.6.1 Time series plots
Figure 41 Time series plot of Barwick discharge record, indicating the magnitude and timing of
flood events. Less than 1 year of discharge data is available for this catchment.
0
200000
400000
600000
800000
937500
20070701 0709 0710 0711 0712 0801 0802 0803 0804 0805 0806 YYMM
Flow ml/s

Analysis of Sediment Yields within Auckland Region 65
Figure 42 Time series plot of Barwick sediment concentration record, with discharge overplotted
in black (with scale on right vertical axis). NB: Less than 6 months of sediment data is available
for this catchment
0
1000
2000
3000
20070701 0708 0709 0710 0711 0712 YYMM
Sed. Conc. mg/l
0
312500
625000
937500
Flow ml/s
8.6.2 Sediment concentration rating
Figure 43 Sediment concentration rating for Barwick catchment
Sediment Concentration Rating - Barwick
1
10
100
1000
10000
0.001 0.01 0.1 1 10 100 1000
Flow (l/s)
Sed
imen
t C
on
cen
trati
on
(m
g/l
)
SSC (mg/l)
Bias-corrected Lowess rating
Overall R2 0.21
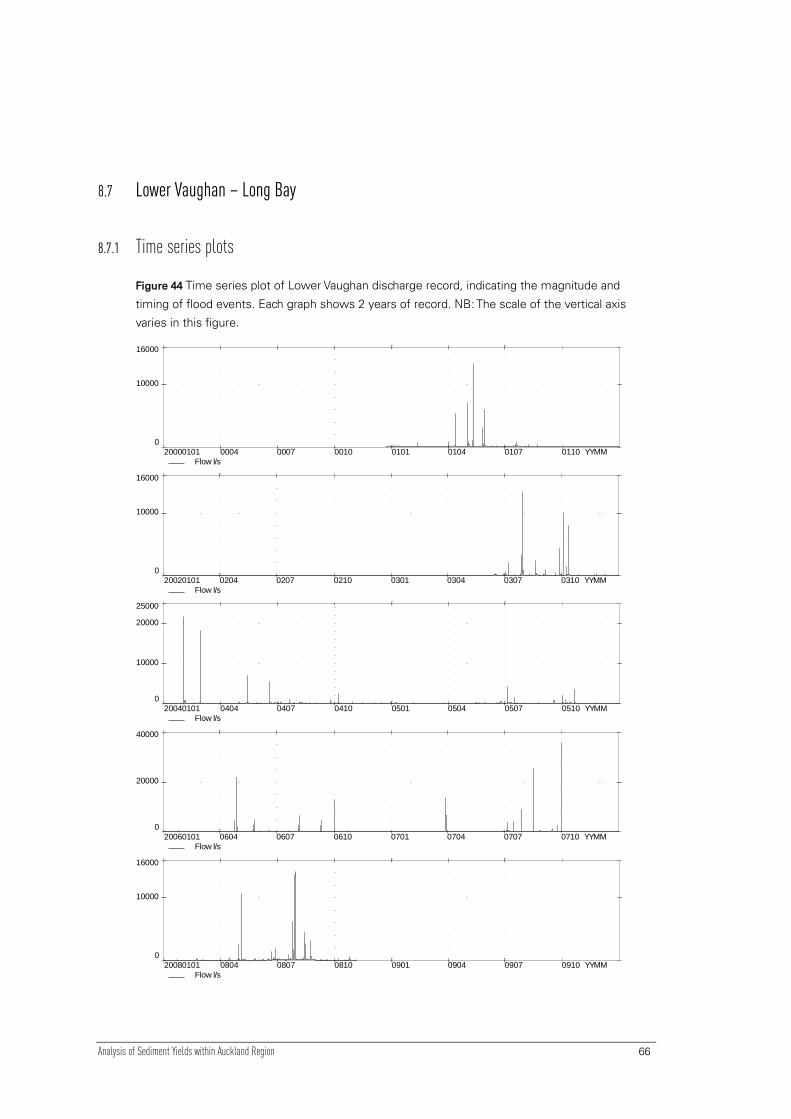
Analysis of Sediment Yields within Auckland Region 66
8.7 Lower Vaughan – Long Bay
8.7.1 Time series plots
Figure 44 Time series plot of Lower Vaughan discharge record, indicating the magnitude and
timing of flood events. Each graph shows 2 years of record. NB: The scale of the vertical axis
varies in this figure.
0
10000
16000
20000101 0004 0007 0010 0101 0104 0107 0110 YYMM
Flow l/s
0
10000
16000
20020101 0204 0207 0210 0301 0304 0307 0310 YYMM
Flow l/s
0
10000
20000
25000
20040101 0404 0407 0410 0501 0504 0507 0510 YYMM
Flow l/s
0
20000
40000
20060101 0604 0607 0610 0701 0704 0707 0710 YYMM
Flow l/s
0
10000
16000
20080101 0804 0807 0810 0901 0904 0907 0910 YYMM
Flow l/s

Analysis of Sediment Yields within Auckland Region 67
Figure 45 Time series plot of Lower Vaughan sediment concentration record, with discharge
overplotted in black (with scale on right vertical axis). There is a gap in the sediment
concentration record with the top graph displaying sediment concentration in period 1 and the
bottom two graphs displaying period 2. NB: The scale of the vertical axis varies in this figure.
0
500
800
20010101 0103 0104 0105 0106 0107 0108 0109 0110 0111 0112 YYMM
Sed. Conc. mg/l
0
10000
16000
Flow l/s
GAP IN SEDIMENT CONCENTRATION RECORD
0
500
1000
20040101 0403 0404 0405 0406 0407 0408 0409 0410 0411 0412 YYMM
Sed. Conc. mg/l
0
12500
25000
Flow l/s
0
500
800
20050101 0503 0504 0505 0506 0507 0508 0509 0510 0511 0512 YYMM
Sed. Conc. mg/l
0
3125
5000
Flow l/s

Analysis of Sediment Yields within Auckland Region 68
8.7.2 Sediment concentration rating
Figure 46 Sediment concentration rating for Lower Vaughan – Long Bay
Sediment Concentration Rating - Lower Vaughan - Long Bay
1
10
100
1000
1 10 100 1000 10000 100000
Flow (l/s)
Sed
imen
t C
on
cen
trati
on
(m
g/l
)
SSC (mg/l)
Bias-corrected Lowess rating
Overall R2 0.71

Analysis of Sediment Yields within Auckland Region 69
8.7.3 Event sediment yield rating
Table 10 Event characteristics and yields at Lower Vaughan – Long Bay
Start date
(yyyymmdd)
Start time
(hhmmss)
Quick
flow
sed.
yield
(kg)
Event
sed.
yield
(kg)
Quick
flow
(mm)
Total
runoff
(mm)
Peak
Discharge
(l/s)
Peak
sed.
Conc.
(mg/l)
Quick
flow
event
duration
(hr)
Event
1 20010111 90500 47 80 0.2 2.6 171 31 6.1
2 20010402 120500 409 442 3.9 8.5 856 54 12.6
3 20010412 180500 5036 5059 31.5 37.5 5280 114 15.8
4 20010502 154000 11238 11268 29.6 33.5 7111 340 10.4
5 20010511 180500 32861 32870 37.7 41.1 13386 684 10.8
6 20010525 203500 5634 5818 16.1 24.4 3164 501 15.1
7 20010525 152000 719 920 4.4 13.6 592 76 13.6
8 20010530 500 4929 4956 25.2 31.1 6074 209 13.0
9 20040514 222400 18697 18698 20.2 22.2 6935 847 7.6
10 20040618 124400 18223 18267 19.4 25.6 5542 858 16.8
11 20040720 204900 3495 3776 6.5 12.5 977 271 12.5
12 20041007 120900 9543 9631 9.2 12.0 2541 680 9.4
13 20050918 30900 1509 1723 3.0 6.1 766 305 8.0
14 20051002 121200 3694 3991 5.1 9.8 1996 639 10.4
15 20051006 215900 1824 1890 3.6 5.3 1150 327 6.4
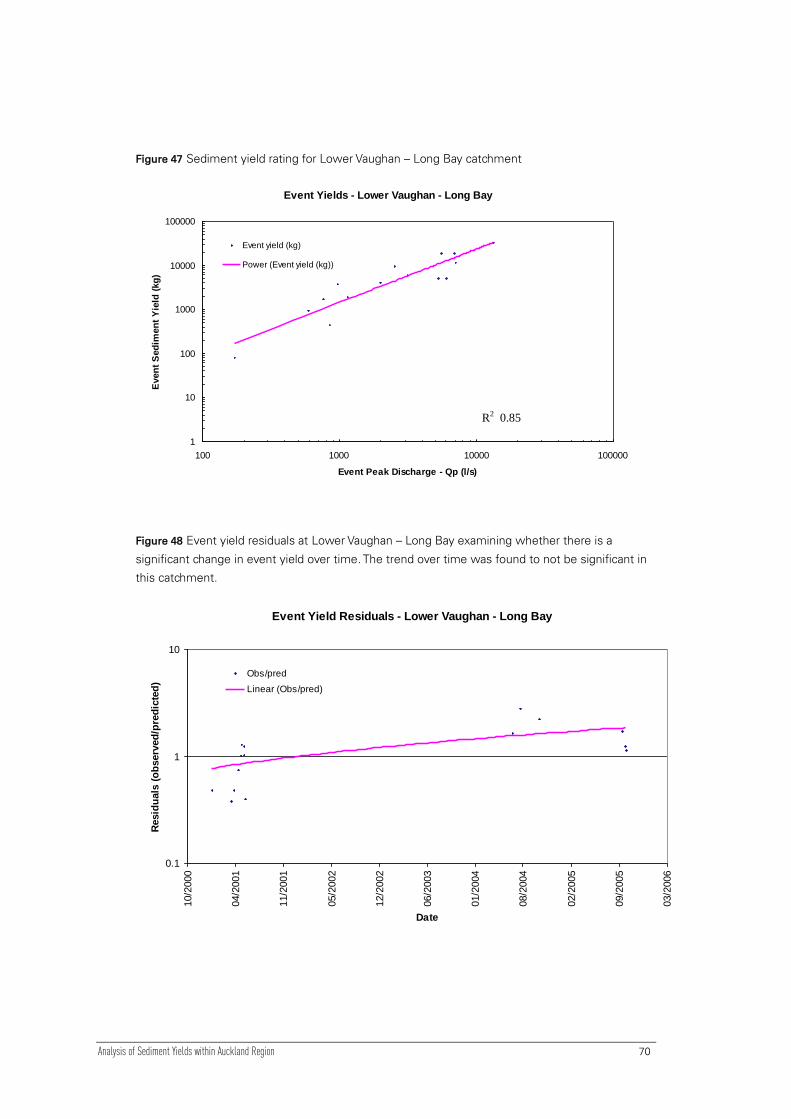
Analysis of Sediment Yields within Auckland Region 70
Figure 47 Sediment yield rating for Lower Vaughan – Long Bay catchment
Event Yields - Lower Vaughan - Long Bay
1
10
100
1000
10000
100000
100 1000 10000 100000
Event Peak Discharge - Qp (l/s)
Even
t S
ed
imen
t Y
ield
(kg
)
Event yield (kg)
Power (Event yield (kg))
Figure 48 Event yield residuals at Lower Vaughan – Long Bay examining whether there is a
significant change in event yield over time. The trend over time was found to not be significant in
this catchment.
Event Yield Residuals - Lower Vaughan - Long Bay
0.1
1
10
10/2
000
04/2
001
11/2
001
05/2
002
12/2
002
06/2
003
01/2
004
08/2
004
02/2
005
09/2
005
03/2
006
Date
Resid
uals
(o
bserv
ed
/pre
dic
ted
)
Obs/pred
Linear (Obs/pred)
R2 0.85
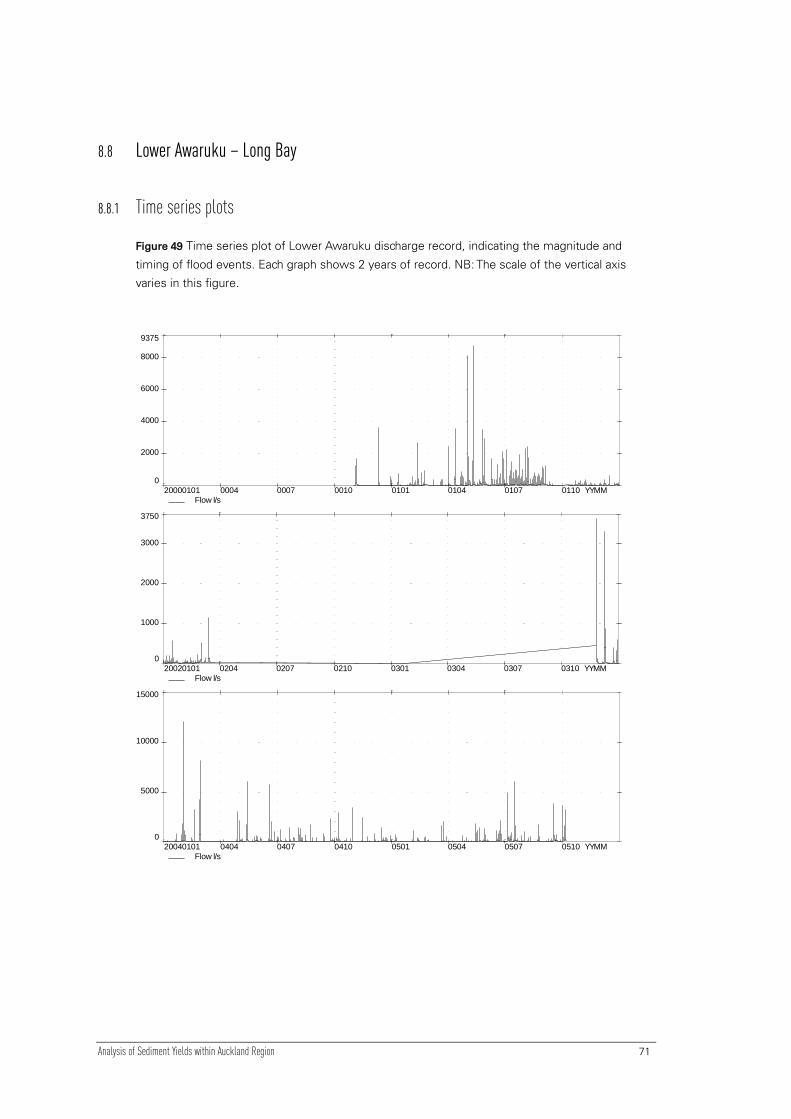
Analysis of Sediment Yields within Auckland Region 71
8.8 Lower Awaruku – Long Bay
8.8.1 Time series plots
Figure 49 Time series plot of Lower Awaruku discharge record, indicating the magnitude and
timing of flood events. Each graph shows 2 years of record. NB: The scale of the vertical axis
varies in this figure.
0
2000
4000
6000
8000
9375
20000101 0004 0007 0010 0101 0104 0107 0110 YYMM
Flow l/s
0
1000
2000
3000
3750
20020101 0204 0207 0210 0301 0304 0307 0310 YYMM
Flow l/s
0
5000
10000
15000
20040101 0404 0407 0410 0501 0504 0507 0510 YYMM
Flow l/s

Analysis of Sediment Yields within Auckland Region 72
Figure 50 Time series plot of Lower Awaruku sediment concentration record, with discharge over
plotted in black (with scale on right vertical axis). There is a gap in the sediment concentration
record with the top graph displaying sediment concentration in period 1 and the bottom two
graphs displaying period 2. NB: The scale of the vertical axis varies in this figure.
0
500
800
20010101 0103 0104 0105 0106 0107 0108 0109 0110 0111 0112 YYMM
Sed.Conc. mg/l
0
6250
10000
Flow l/s
GAP IN SEDIMENT CONCENTRATION RECORD
0
500
800
20040101 0403 0404 0405 0406 0407 0408 0409 0410 0411 0412 YYMM
Sed.Conc. mg/l
0
10000
16000
Flow l/s
0
200
400
625
20050101 0503 0504 0505 0506 0507 0508 0509 0510 0511 0512 YYMM
Sed.Conc. mg/l
0
2000
4000
6250
Flow l/s

Analysis of Sediment Yields within Auckland Region 73
8.8.2 Sediment concentration rating
Figure 51 Sediment concentration rating for Lower Awaruku – Long Bay
Sediment Concentration Rating - Lower Awaruku - Long Bay
1
10
100
1000
10000
1 10 100 1000 10000
Flow (l/s)
Sed
imen
t C
on
cen
trati
on
(m
g/l
)
SSC (mg/l)
Bias-corrected Lowess rating
Overall R2 0.44
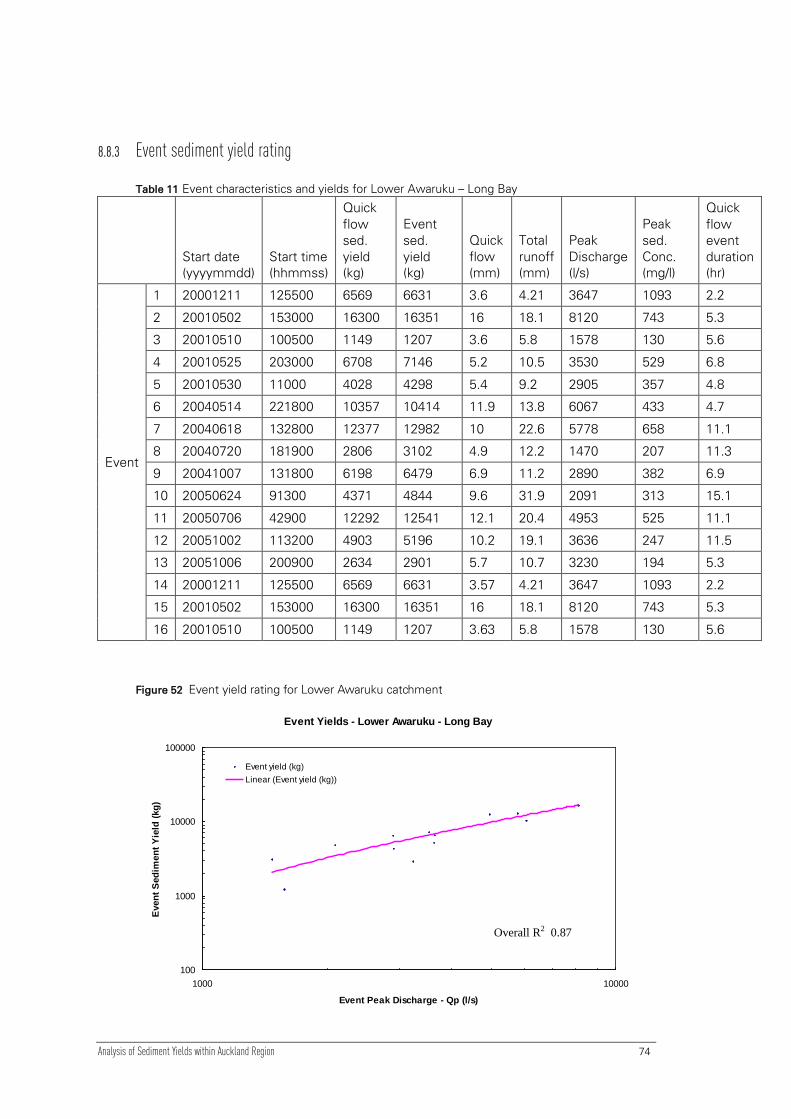
Analysis of Sediment Yields within Auckland Region 74
8.8.3 Event sediment yield rating
Table 11 Event characteristics and yields for Lower Awaruku – Long Bay
Start date
(yyyymmdd)
Start time
(hhmmss)
Quick
flow
sed.
yield
(kg)
Event
sed.
yield
(kg)
Quick
flow
(mm)
Total
runoff
(mm)
Peak
Discharge
(l/s)
Peak
sed.
Conc.
(mg/l)
Quick
flow
event
duration
(hr)
Event
1 20001211 125500 6569 6631 3.6 4.21 3647 1093 2.2
2 20010502 153000 16300 16351 16 18.1 8120 743 5.3
3 20010510 100500 1149 1207 3.6 5.8 1578 130 5.6
4 20010525 203000 6708 7146 5.2 10.5 3530 529 6.8
5 20010530 11000 4028 4298 5.4 9.2 2905 357 4.8
6 20040514 221800 10357 10414 11.9 13.8 6067 433 4.7
7 20040618 132800 12377 12982 10 22.6 5778 658 11.1
8 20040720 181900 2806 3102 4.9 12.2 1470 207 11.3
9 20041007 131800 6198 6479 6.9 11.2 2890 382 6.9
10 20050624 91300 4371 4844 9.6 31.9 2091 313 15.1
11 20050706 42900 12292 12541 12.1 20.4 4953 525 11.1
12 20051002 113200 4903 5196 10.2 19.1 3636 247 11.5
13 20051006 200900 2634 2901 5.7 10.7 3230 194 5.3
14 20001211 125500 6569 6631 3.57 4.21 3647 1093 2.2
15 20010502 153000 16300 16351 16 18.1 8120 743 5.3
16 20010510 100500 1149 1207 3.63 5.8 1578 130 5.6
Figure 52 Event yield rating for Lower Awaruku catchment
Event Yields - Lower Awaruku - Long Bay
100
1000
10000
100000
1000 10000
Event Peak Discharge - Qp (l/s)
Even
t S
ed
imen
t Y
ield
(kg
)
Event yield (kg)
Linear (Event yield (kg))
Overall R2 0.87

Analysis of Sediment Yields within Auckland Region 75
Figure 53 Event yield residuals at Lower Awaruku – Long Bay examining whether there is a
significant change in event yield over time. The trend over time was found to not be significant in
this catchment.
Event Yield Residuals - Lower Awaruku - Long Bay
0.1
1
10
03/2
000
10/2
000
04/2
001
11/2
001
05/2
002
12/2
002
06/2
003
01/2
004
08/2
004
02/2
005
09/2
005
03/2
006
Date
Resid
uals
(o
bserv
ed
/pre
dic
ted
)
Obs/pred
Linear (Obs/pred)
Overall R2 0.21

Analysis of Sediment Yields within Auckland Region 76
8.9 Mangemangeroa
8.9.1 Time series plots
Figure 54 Time series plot of Mangemangeroa discharge record, indicating the magnitude and
timing of flood events. Each graph shows 2 years of record. NB: The scale of the vertical axis
varies in this figure.
0
5000
8000
20000101 0004 0007 0010 0101 0104 0107 0110 YYMM
Flow l/s
0
5000
10000
20020101 0204 0207 0210 0301 0304 0307 0310 YYMM
Flow l/s
0
5000
10000
12500
20040101 0404 0407 0410 0501 0504 0507 0510 YYMM
Flow l/s
0
2000
4000
6250
20060101 0604 0607 0610 0701 0704 0707 0710 YYMM
Flow l/s
0
5000
8000
20080101 0804 0807 0810 0901 0904 0907 0910 YYMM
Flow l/s
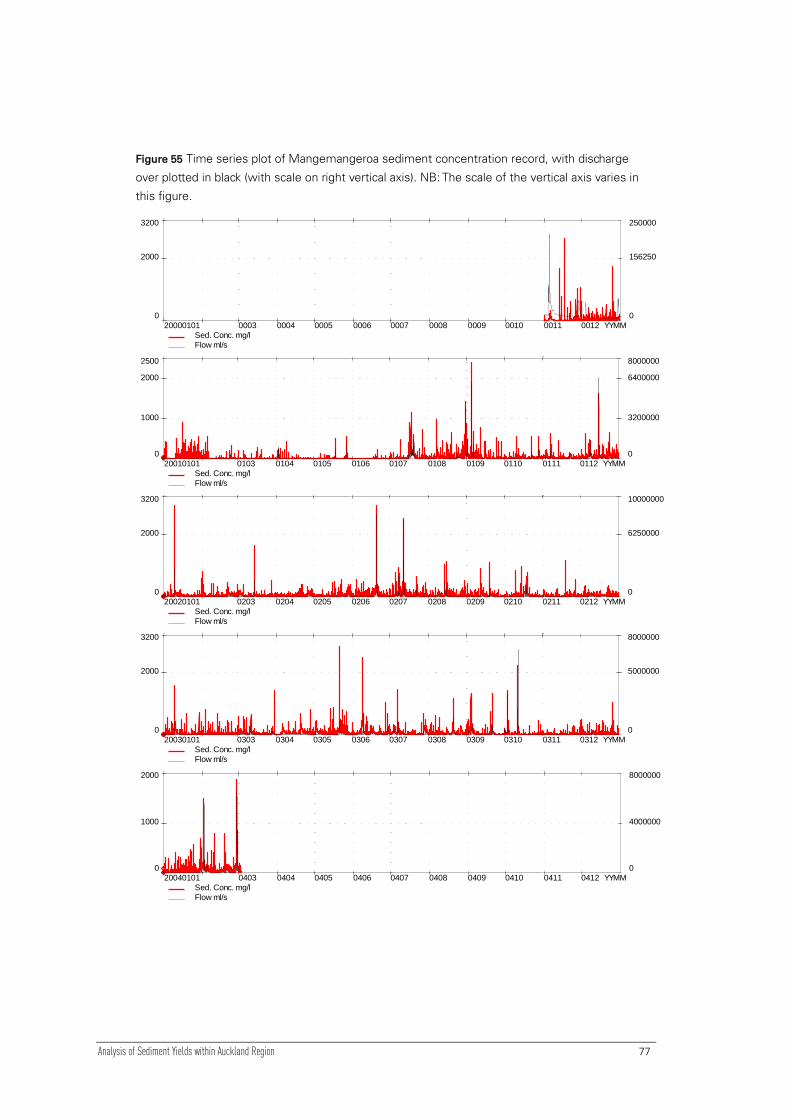
Analysis of Sediment Yields within Auckland Region 77
Figure 55 Time series plot of Mangemangeroa sediment concentration record, with discharge
over plotted in black (with scale on right vertical axis). NB: The scale of the vertical axis varies in
this figure.
0
2000
3200
20000101 0003 0004 0005 0006 0007 0008 0009 0010 0011 0012 YYMM
Sed. Conc. mg/l
0
156250
250000
Flow ml/s
0
1000
2000
2500
20010101 0103 0104 0105 0106 0107 0108 0109 0110 0111 0112 YYMM
Sed. Conc. mg/l
0
3200000
6400000
8000000
Flow ml/s
0
2000
3200
20020101 0203 0204 0205 0206 0207 0208 0209 0210 0211 0212 YYMM
Sed. Conc. mg/l
0
6250000
10000000
Flow ml/s
0
2000
3200
20030101 0303 0304 0305 0306 0307 0308 0309 0310 0311 0312 YYMM
Sed. Conc. mg/l
0
5000000
8000000
Flow ml/s
0
1000
2000
20040101 0403 0404 0405 0406 0407 0408 0409 0410 0411 0412 YYMM
Sed. Conc. mg/l
0
4000000
8000000
Flow ml/s

Analysis of Sediment Yields within Auckland Region 78
8.9.2 Sediment concentration rating
Figure 56 Sediment concentration rating for Mangemangeroa catchment.
Sediment Concentration Rating - Mangemangeroa
1
10
100
1000
10000
10 100 1000 10000
Flow (l/s)
Sed
imen
t C
on
cen
trati
on
(m
g/l
)
SSC (mg/l)
Bias-corrected Lowess rating
Data from flows less than 50 l/s were excluded from the sediment concentration rating fitting for
the Mangemangeroa site. This was because inspection of the sediment concentration time-
series data (Figure 56), generated from the OBS record, showed a very ‚noisy‛ signal at base
flows. Possibly this was due to the sensor detecting light back-scattered from the bed. For the
yield analysis, the LOWESS-fitted sediment concentration rating at flows above 50 l/s was
extrapolated to lower flows.
Overall R2 0.30

Analysis of Sediment Yields within Auckland Region 79
8.9.3 Event sediment yield rating
Figure 57 Event yield rating for Mangemangeroa catchment
Event Yields - Mangemangeroa
0.01
0.1
1
10
100
1000
100 1000 10000
Event Peak Discharge - Qp (l/s)
Even
t S
ed
imen
t Y
ield
(t)
Event yield (t)
Power (event yield (t)) - LOWESS
Figure 58 Event yield residuals at Mangemangeroa catchment examining whether there is a
significant change in event yield over time. The trend over time was found to not be significant in
this catchment.
Event Yield Residuals - Mangemangeroa
0.1
1
10
04/2
001
07/2
001
11/2
001
02/2
002
05/2
002
09/2
002
12/2
002
03/2
003
06/2
003
10/2
003
01/2
004
04/2
004
Date
Resid
uals
(o
bserv
ed
/pre
dic
ted
)
Overall R2 0.86
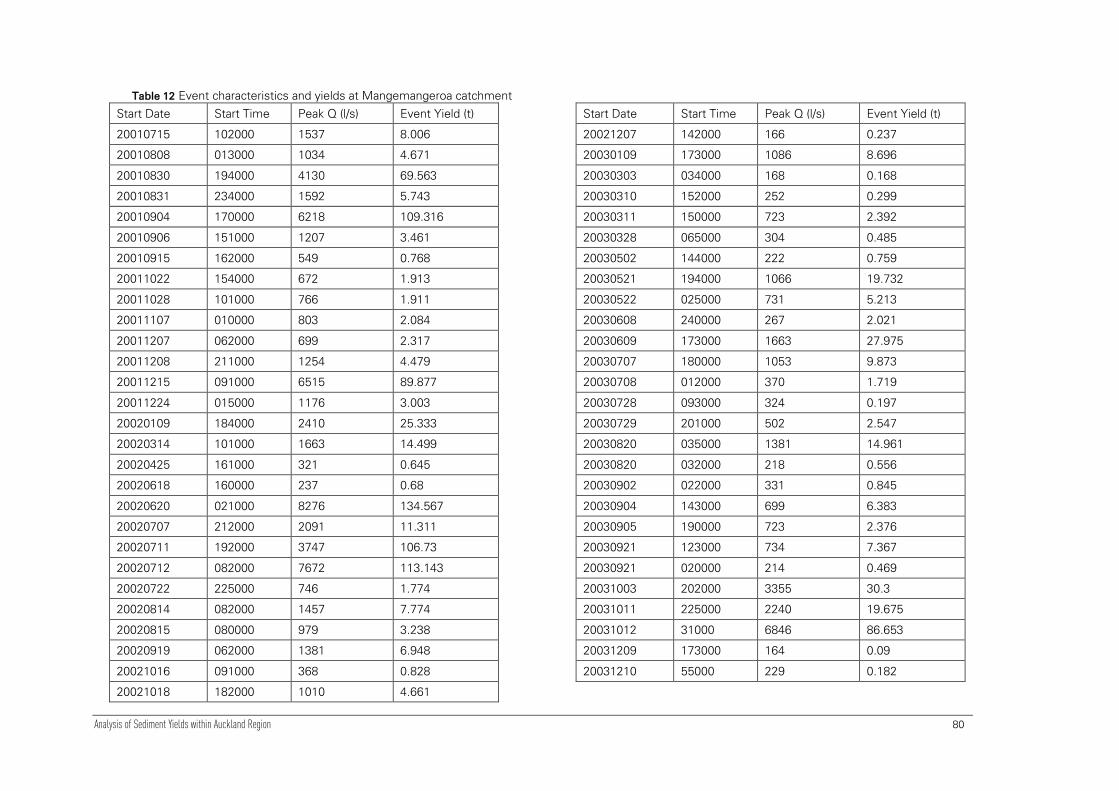
Analysis of Sediment Yields within Auckland Region 80
Table 12 Event characteristics and yields at Mangemangeroa catchment
Start Date Start Time Peak Q (l/s) Event Yield (t)
20010715 102000 1537 8.006
20010808 013000 1034 4.671
20010830 194000 4130 69.563
20010831 234000 1592 5.743
20010904 170000 6218 109.316
20010906 151000 1207 3.461
20010915 162000 549 0.768
20011022 154000 672 1.913
20011028 101000 766 1.911
20011107 010000 803 2.084
20011207 062000 699 2.317
20011208 211000 1254 4.479
20011215 091000 6515 89.877
20011224 015000 1176 3.003
20020109 184000 2410 25.333
20020314 101000 1663 14.499
20020425 161000 321 0.645
20020618 160000 237 0.68
20020620 021000 8276 134.567
20020707 212000 2091 11.311
20020711 192000 3747 106.73
20020712 082000 7672 113.143
20020722 225000 746 1.774
20020814 082000 1457 7.774
20020815 080000 979 3.238
20020919 062000 1381 6.948
20021016 091000 368 0.828
20021018 182000 1010 4.661
Start Date Start Time Peak Q (l/s) Event Yield (t)
20021207 142000 166 0.237
20030109 173000 1086 8.696
20030303 034000 168 0.168
20030310 152000 252 0.299
20030311 150000 723 2.392
20030328 065000 304 0.485
20030502 144000 222 0.759
20030521 194000 1066 19.732
20030522 025000 731 5.213
20030608 240000 267 2.021
20030609 173000 1663 27.975
20030707 180000 1053 9.873
20030708 012000 370 1.719
20030728 093000 324 0.197
20030729 201000 502 2.547
20030820 035000 1381 14.961
20030820 032000 218 0.556
20030902 022000 331 0.845
20030904 143000 699 6.383
20030905 190000 723 2.376
20030921 123000 734 7.367
20030921 020000 214 0.469
20031003 202000 3355 30.3
20031011 225000 2240 19.675
20031012 31000 6846 86.653
20031209 173000 164 0.09
20031210 55000 229 0.182
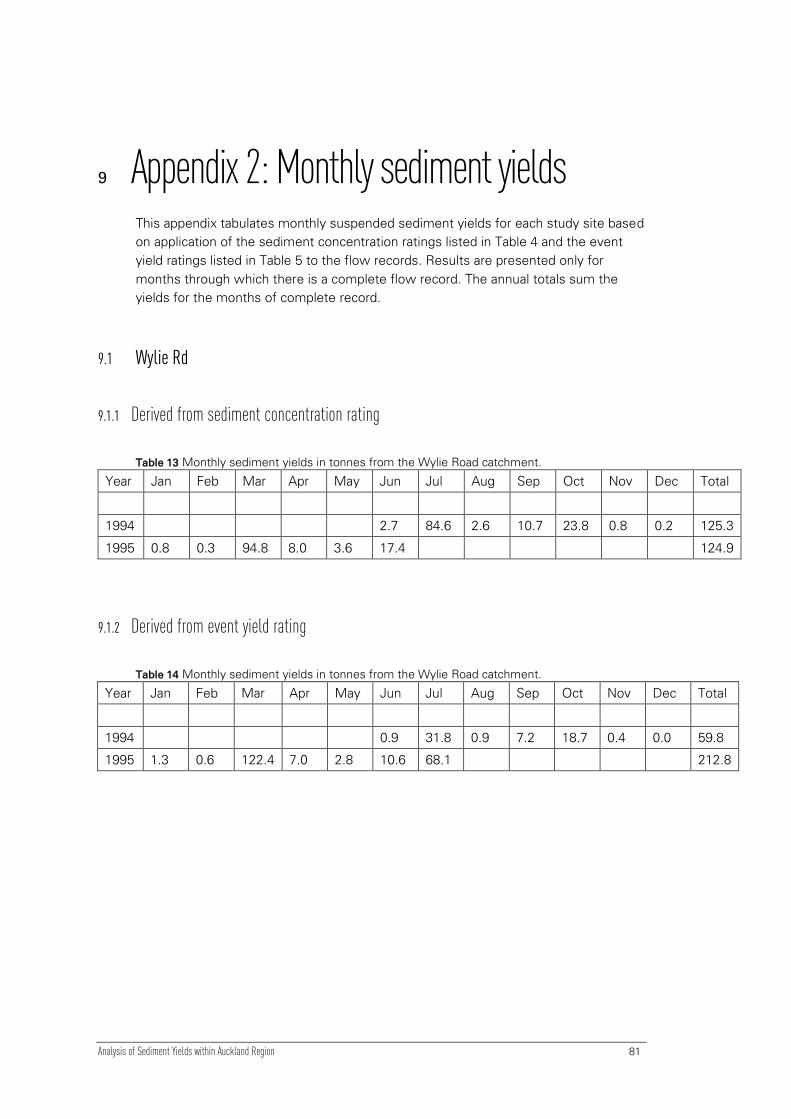
Analysis of Sediment Yields within Auckland Region 81
9 Appendix 2: Monthly sediment yields This appendix tabulates monthly suspended sediment yields for each study site based
on application of the sediment concentration ratings listed in Table 4 and the event
yield ratings listed in Table 5 to the flow records. Results are presented only for
months through which there is a complete flow record. The annual totals sum the
yields for the months of complete record.
9.1 Wylie Rd
9.1.1 Derived from sediment concentration rating
Table 13 Monthly sediment yields in tonnes from the Wylie Road catchment.
Year Jan Feb Mar Apr May Jun Jul Aug Sep Oct Nov Dec Total
1994 2.7 84.6 2.6 10.7 23.8 0.8 0.2 125.3
1995 0.8 0.3 94.8 8.0 3.6 17.4 124.9
9.1.2 Derived from event yield rating
Table 14 Monthly sediment yields in tonnes from the Wylie Road catchment.
Year Jan Feb Mar Apr May Jun Jul Aug Sep Oct Nov Dec Total
1994 0.9 31.8 0.9 7.2 18.7 0.4 0.0 59.8
1995 1.3 0.6 122.4 7.0 2.8 10.6 68.1 212.8
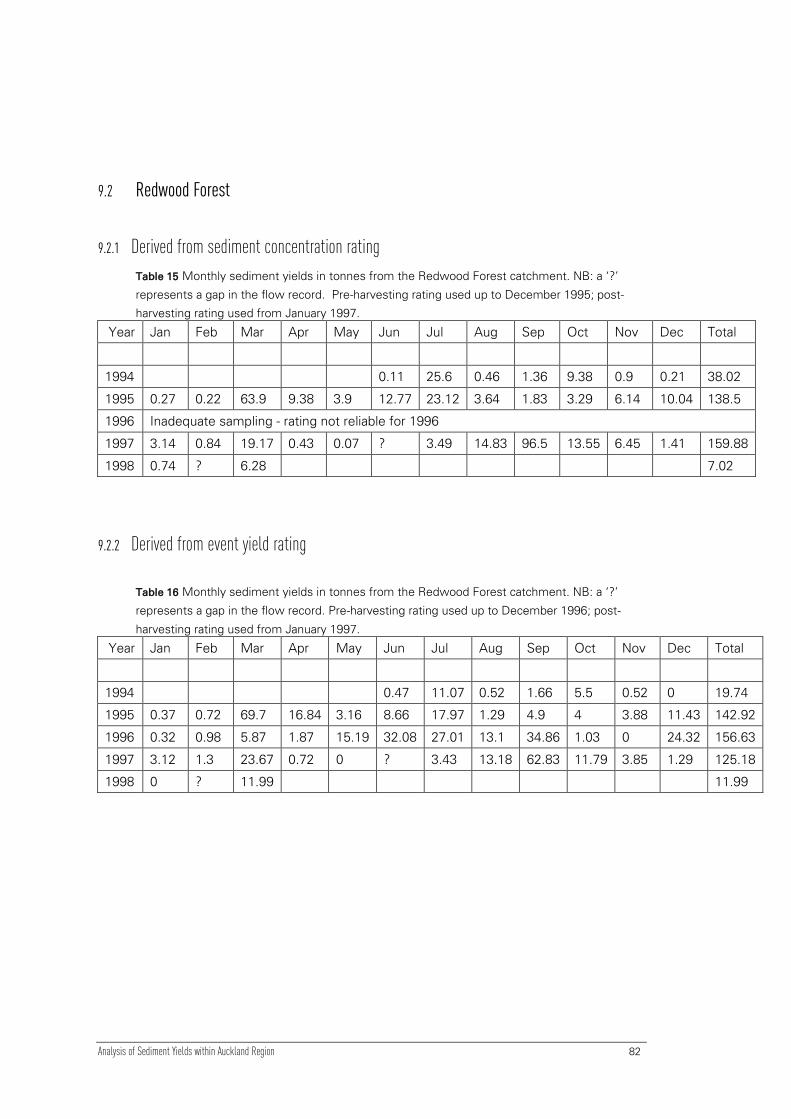
Analysis of Sediment Yields within Auckland Region 82
9.2 Redwood Forest
9.2.1 Derived from sediment concentration rating
Table 15 Monthly sediment yields in tonnes from the Redwood Forest catchment. NB: a ‘?’
represents a gap in the flow record. Pre-harvesting rating used up to December 1995; post-
harvesting rating used from January 1997.
Year Jan Feb Mar Apr May Jun Jul Aug Sep Oct Nov Dec Total
1994 0.11 25.6 0.46 1.36 9.38 0.9 0.21 38.02
1995 0.27 0.22 63.9 9.38 3.9 12.77 23.12 3.64 1.83 3.29 6.14 10.04 138.5
1996 Inadequate sampling - rating not reliable for 1996
1997 3.14 0.84 19.17 0.43 0.07 ? 3.49 14.83 96.5 13.55 6.45 1.41 159.88
1998 0.74 ? 6.28 7.02
9.2.2 Derived from event yield rating
Table 16 Monthly sediment yields in tonnes from the Redwood Forest catchment. NB: a ‘?’
represents a gap in the flow record. Pre-harvesting rating used up to December 1996; post-
harvesting rating used from January 1997.
Year Jan Feb Mar Apr May Jun Jul Aug Sep Oct Nov Dec Total
1994 0.47 11.07 0.52 1.66 5.5 0.52 0 19.74
1995 0.37 0.72 69.7 16.84 3.16 8.66 17.97 1.29 4.9 4 3.88 11.43 142.92
1996 0.32 0.98 5.87 1.87 15.19 32.08 27.01 13.1 34.86 1.03 0 24.32 156.63
1997 3.12 1.3 23.67 0.72 0 ? 3.43 13.18 62.83 11.79 3.85 1.29 125.18
1998 0 ? 11.99 11.99
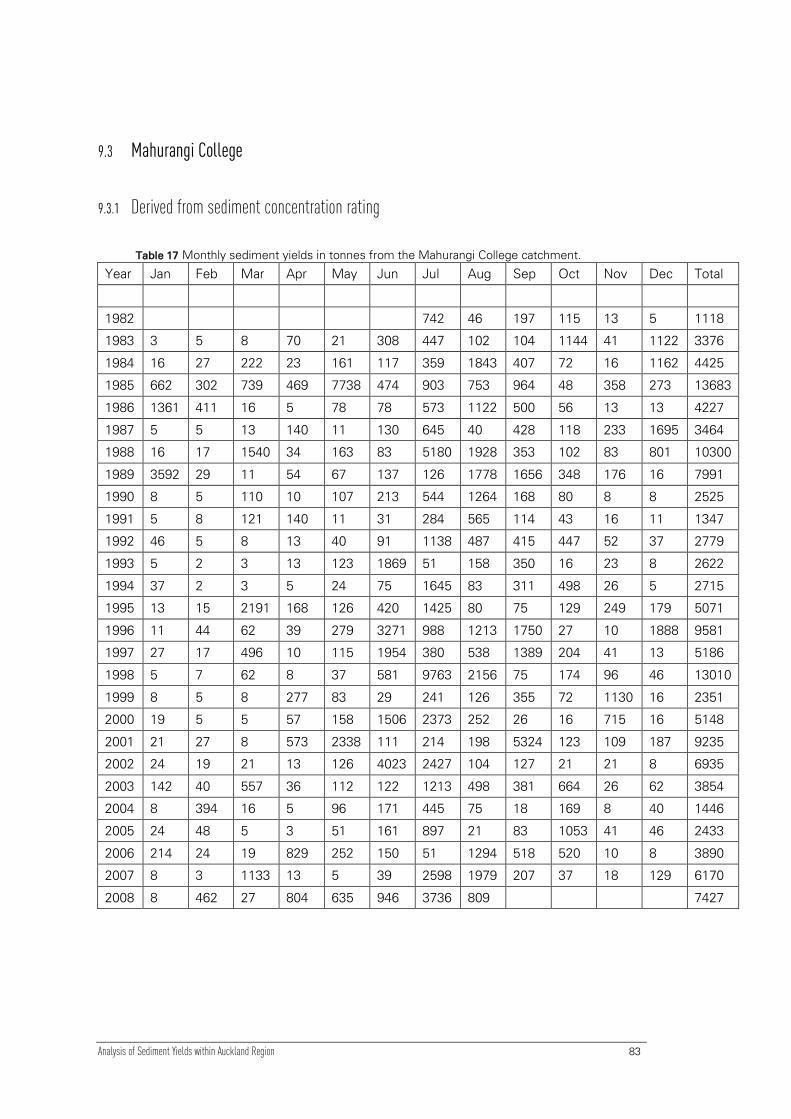
Analysis of Sediment Yields within Auckland Region 83
9.3 Mahurangi College
9.3.1 Derived from sediment concentration rating
Table 17 Monthly sediment yields in tonnes from the Mahurangi College catchment.
Year Jan Feb Mar Apr May Jun Jul Aug Sep Oct Nov Dec Total
1982 742 46 197 115 13 5 1118
1983 3 5 8 70 21 308 447 102 104 1144 41 1122 3376
1984 16 27 222 23 161 117 359 1843 407 72 16 1162 4425
1985 662 302 739 469 7738 474 903 753 964 48 358 273 13683
1986 1361 411 16 5 78 78 573 1122 500 56 13 13 4227
1987 5 5 13 140 11 130 645 40 428 118 233 1695 3464
1988 16 17 1540 34 163 83 5180 1928 353 102 83 801 10300
1989 3592 29 11 54 67 137 126 1778 1656 348 176 16 7991
1990 8 5 110 10 107 213 544 1264 168 80 8 8 2525
1991 5 8 121 140 11 31 284 565 114 43 16 11 1347
1992 46 5 8 13 40 91 1138 487 415 447 52 37 2779
1993 5 2 3 13 123 1869 51 158 350 16 23 8 2622
1994 37 2 3 5 24 75 1645 83 311 498 26 5 2715
1995 13 15 2191 168 126 420 1425 80 75 129 249 179 5071
1996 11 44 62 39 279 3271 988 1213 1750 27 10 1888 9581
1997 27 17 496 10 115 1954 380 538 1389 204 41 13 5186
1998 5 7 62 8 37 581 9763 2156 75 174 96 46 13010
1999 8 5 8 277 83 29 241 126 355 72 1130 16 2351
2000 19 5 5 57 158 1506 2373 252 26 16 715 16 5148
2001 21 27 8 573 2338 111 214 198 5324 123 109 187 9235
2002 24 19 21 13 126 4023 2427 104 127 21 21 8 6935
2003 142 40 557 36 112 122 1213 498 381 664 26 62 3854
2004 8 394 16 5 96 171 445 75 18 169 8 40 1446
2005 24 48 5 3 51 161 897 21 83 1053 41 46 2433
2006 214 24 19 829 252 150 51 1294 518 520 10 8 3890
2007 8 3 1133 13 5 39 2598 1979 207 37 18 129 6170
2008 8 462 27 804 635 946 3736 809 7427
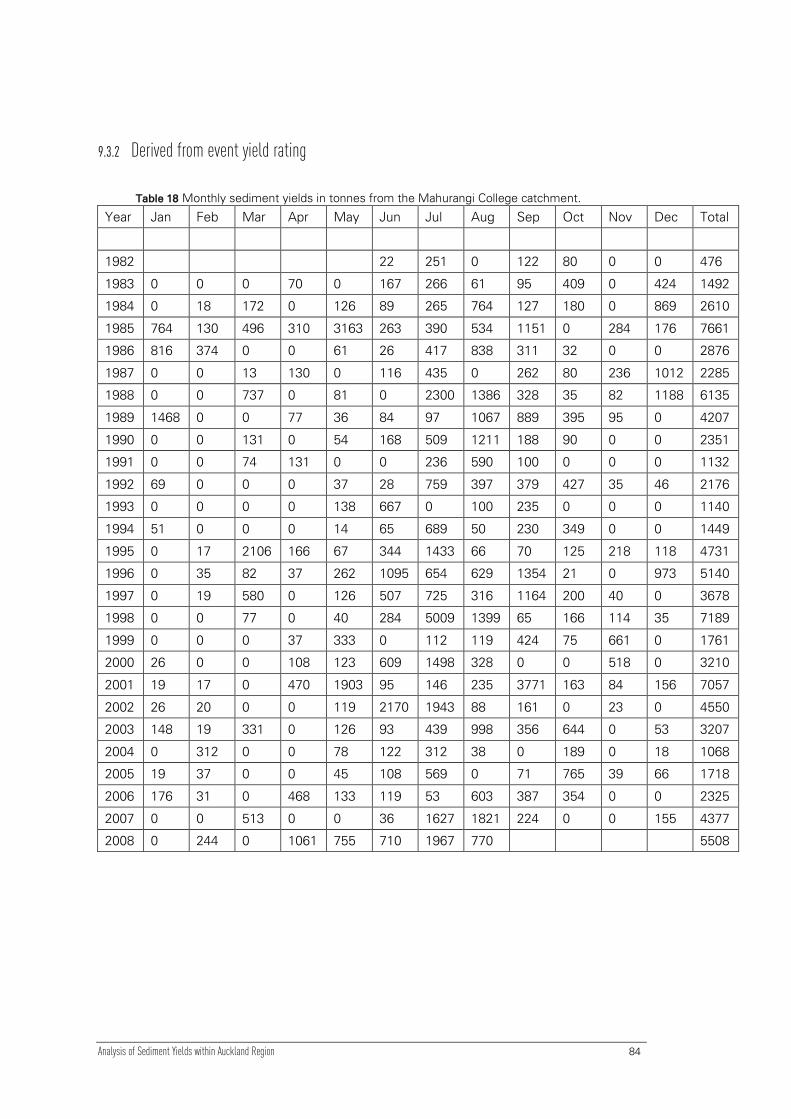
Analysis of Sediment Yields within Auckland Region 84
9.3.2 Derived from event yield rating
Table 18 Monthly sediment yields in tonnes from the Mahurangi College catchment.
Year Jan Feb Mar Apr May Jun Jul Aug Sep Oct Nov Dec Total
1982 22 251 0 122 80 0 0 476
1983 0 0 0 70 0 167 266 61 95 409 0 424 1492
1984 0 18 172 0 126 89 265 764 127 180 0 869 2610
1985 764 130 496 310 3163 263 390 534 1151 0 284 176 7661
1986 816 374 0 0 61 26 417 838 311 32 0 0 2876
1987 0 0 13 130 0 116 435 0 262 80 236 1012 2285
1988 0 0 737 0 81 0 2300 1386 328 35 82 1188 6135
1989 1468 0 0 77 36 84 97 1067 889 395 95 0 4207
1990 0 0 131 0 54 168 509 1211 188 90 0 0 2351
1991 0 0 74 131 0 0 236 590 100 0 0 0 1132
1992 69 0 0 0 37 28 759 397 379 427 35 46 2176
1993 0 0 0 0 138 667 0 100 235 0 0 0 1140
1994 51 0 0 0 14 65 689 50 230 349 0 0 1449
1995 0 17 2106 166 67 344 1433 66 70 125 218 118 4731
1996 0 35 82 37 262 1095 654 629 1354 21 0 973 5140
1997 0 19 580 0 126 507 725 316 1164 200 40 0 3678
1998 0 0 77 0 40 284 5009 1399 65 166 114 35 7189
1999 0 0 0 37 333 0 112 119 424 75 661 0 1761
2000 26 0 0 108 123 609 1498 328 0 0 518 0 3210
2001 19 17 0 470 1903 95 146 235 3771 163 84 156 7057
2002 26 20 0 0 119 2170 1943 88 161 0 23 0 4550
2003 148 19 331 0 126 93 439 998 356 644 0 53 3207
2004 0 312 0 0 78 122 312 38 0 189 0 18 1068
2005 19 37 0 0 45 108 569 0 71 765 39 66 1718
2006 176 31 0 468 133 119 53 603 387 354 0 0 2325
2007 0 0 513 0 0 36 1627 1821 224 0 0 155 4377
2008 0 244 0 1061 755 710 1967 770 5508

Analysis of Sediment Yields within Auckland Region 85
9.4 Awanohi Stream
9.4.1 Derived from sediment concentration rating
Table 19 Monthly sediment yields in tonnes from the Awanohi Stream catchment. NB: a ‘?’
represents a gap in the flow record
Year Jan Feb Mar Apr May Jun Jul Aug Sep Oct Nov Dec Total
1998 110.9 9.6 26.2 5.4 7.0 159.1
1999 1.3 0.0 ? ? ? ? ? ? ? ? ? ? 1.3
2000 ? ? ? ? ? ? ? ? ? ? ? ?
2001 ? ? ? ? ? ? ? ? ? ? ? ?
2002 ? ? ? ? ? ? ? ? ? ? ? ?
2003 ? ? ? 8.6 28.1 73.9 187.0 66.2 51.8 125.9 1.8 3.2 546.4
2004 0.5 283.5 1.3 0.0 40.2 28.8 21.7 14.7 5.2 11.8 0.0 2.1 409.9
2005 0.8 0.0 0.0 0.0 1.9 19.4 46.9 3.7 4.9 72.9 1.0 0.3 151.8
2006 3.7 0.0 0.0 83.2 39.6 11.9 0.3 113.6 40.7 228.5 0.8 0.3 522.6
2007 0.3 0.0 88.7 0.0 0.0 3.4 90.3 88.7 3.6 180.5 0.5 1.1 457.0
2008 0.0 1.7 0.3 11.7 38.0 54.2 218.3 88.4 0.8 413.3
9.4.2 Derived from event yield rating
Table 20 Monthly sediment yields in tonnes from the Awanohi Stream catchment. NB: a ‘?’
represents a gap in the flow record
Year Jan Feb Mar Apr May Jun Jul Aug Sep Oct Nov Dec Total
1998 18.25 92.2 0.0 13.2 3.8 4.4 131.9
1999 ? ? ? ? ? ? ? ? ? ? ?
2000 ? ? ? ? ? ? ? ? ? ? ? ? ?
2001 ? ? ? ? ? ? ? ? ? ? ? ? ?
2002 ? ? ? ? ? ? ? ? ? ? ? ? ?
2003 ? ? 56.75 9.8 31.2 102.0 63.5 151.5 43.0 111.2 0.0 5.5 574.5
2004 0.0 257.0 0.0 0.0 46.3 27.7 9.2 7.3 7.2 9.9 0.0 0.0 364.7
2005 0.0 0.0 0.0 0.0 0.0 11.7 48.4 5.0 5.1 55.6 0.0 0.0 125.9
2006 7.3 0.0 0.0 106.8 29.1 5.5 0.0 41.6 34.4 85.8 0.0 0.0 310.6
2007 0.0 0.0 40.5 0.0 0.0 44.1 84.7 101.4 0.0 170.7 0.0 0.0 441.4
2008 0.0 2.9 0.0 17.5 37.6 53.3 117.6 113.9 342.9

Analysis of Sediment Yields within Auckland Region 86
9.5 Weiti Forest
9.5.1 Derived from sediment concentration rating
Table 21 Monthly sediment yields in tonnes from the Weiti Forest catchment.
Year Jan Feb Mar Apr May Jun Jul Aug Sep Oct Nov Dec Total
2008 4.0 6.7 57.1 14.1 0.4 0.4 82.6
9.5.2 Derived from event yield rating
Table 22 Monthly sediment yields in tonnes from the Weiti Forest catchment.
Year Jan Feb Mar Apr May Jun Jul Aug Sep Oct Nov Dec Total
2008 3.0 6.4 8.0 56.8 12.7 0.0 0.0 87.0
9.6 Barwick
9.6.1 Derived from sediment concentration rating
Table 23 Monthly sediment yields in tonnes from the Barwick catchment.
Year Jan Feb Mar Apr May Jun Jul Aug Sep Oct Nov Dec Total
2007 0.40 0.14 0.16 0.70
2008 0.05 0.05
There was no event yield rating derived for the Barwick site, owing to the low quality
and short duration of the record.

Analysis of Sediment Yields within Auckland Region 87
9.7 Lower Vaughan – Long Bay
9.7.1 Derived from sediment concentration rating
Table 24 Monthly sediment yields in tonnes from the Lower Vaughan catchment. NB: a ‘?’
represents a gap in the flow record
Year Jan Feb Mar Apr May Jun Jul Aug Sep Oct Nov Dec Total
2001 1.1 1.3 0.1 23.3 96.9 1.6 4.7 ? ? ? ? ? 129.0
2002 ? ? ? ? ? ? ? ? ? ? ? ? 0.0
2003 ? ? ? ? ? ? 58.4 17.9 18.8 72.1 0.5 0.5 168.2
2004 0.2 142.9 0.7 0.5 18.5 15.7 7.5 4.1 2.4 6.2 1.1 2.4 202.2
2005 1.6 0.8 0.8 0.2 0.9 4.0 15.3 1.3 1.5 23.1 0.3 0.1 50.1
2006 0.9 0.0 0.1 82.9 23.8 5.9 1.3 30.5 22.5 94.6 0.7 0.9 264.0
2007 1.1 0.3 95.6 1.9 1.5 2.8 56.5 97.7 8.0 229.3 0.4 0.3 495.4
2008 0.0 0.3 0.1 4.1 32.9 10.6 141.6 24.5 0.6 1.3 216.1
9.7.2 Derived from event yield rating
Table 25 Monthly sediment yields in tonnes from the Lower Vaughan catchment. NB: a ‘?’
represents a gap in the flow record
Year Jan Feb Mar Apr May Jun Jul Aug Sep Oct Nov Dec Total
2001 0.2 1.0 0.0 13.8 81.7 0.0 1.7 0.6 ? ? ? ? 98.9
2002 ? ? ? ? ? ? ? ? ? ? ? ? 0.0
2003 ? ? ? ? ? 0.4 12.3 47.5 12.6 53.6 0.0 0.0 126.4
2004 0.0 126.3 0.0 0.0 18.1 13.2 2.3 0.6 1.5 5.1 0.0 0.0 167.0
2005 0.0 0.0 0.0 0.0 0.0 1.7 12.5 0.0 1.2 14.1 0.0 0.0 29.5
2006 0.6 0.0 0.0 82.6 17.4 0.9 0.7 20.9 14.9 70.7 0.0 0.0 208.7
2007 0.0 0.0 40.0 0.0 0.0 0.0 44.3 84.2 7.3 126.3 0.0 0.0 302.1
2008 0.0 0.0 0.0 5.4 29.8 6.8 58.4 18.0 0.0 0.9 119.2

Analysis of Sediment Yields within Auckland Region 88
9.8 Lower Awaruku – Long Bay
9.8.1 Derived from sediment concentration rating
Table 26 Monthly sediment yields in tonnes from the Lower Awaruku catchment. NB: a ‘?’
represents a gap in the flow record
Year Jan Feb Mar Apr May Jun Jul Aug Sep Oct Nov Dec Total
2000 4.6 4.6
2001 2.4 10.1 0.5 19.7 51.4 5.5 10.7 14.4 5.8 0.8 1.0 2.4 124.7
2002 0.7 0.6 ? ? ? ? ? ? ? ? ? ? 1.3
2003 ? ? ? ? ? ? ? ? ? ? ? 6.1 6.1
2004 3.6 81.6 1.2 3.7 27.6 19.5 11.8 8.3 5.8 11.3 2.2 8.0 184.5
2005 2.4 2.8 3.4 0.6 10.1 16.6 34.1 6.7 14.7 91.3
9.8.2 Derived from event yield rating
Table 27 Monthly sediment yields in tonnes from the Lower Awaruku catchment. NB: a ‘?’
represents a gap in the flow record
Year Jan Feb Mar Apr May Jun Jul Aug Sep Oct Nov Dec Total
2000 4.2 7.4 11.6
2001 0.9 7.3 0.0 12.2 53.5 6.2 6.4 8.8 3.0 0.0 0.0 0.7 99.1
2002 0.0 0.0 1.54 ? ? ? ? ? ? ? ? ? 1.5
2003 ? ? ? ? ? ? ? ? ? ? 9 7.6 16.6
2004 6.1 50.3 0.0 5.6 23.6 16.4 5.8 6.3 4.9 11.8 4.8 5.3 140.8
2005 0.9 3.0 6.2 0.0 12.0 9.3 26.1 4.0 8.1 15.0 84.6

Analysis of Sediment Yields within Auckland Region 89
9.9 Mangemangeroa
9.9.1 Derived from sediment concentration rating
Table 28 Monthly sediment yields in tonnes from the Mangemangeroa catchment. NB: a ‘?’
represents a gap in the flow record
Year Jan Feb Mar Apr May Jun Jul Aug Sep Oct Nov Dec Total
2000 61.1 28.0 1.3 1.8 0.3 92.5
2001 0.0 3.9 0.0 9.1 20.6 9.3 47.4 107.9 194.4 7.0 7.3 172.8 579.6
2002 11.0 0.7 11.2 1.0 2.1 119.8 185.6 14.2 11.7 7.0 1.8 1.1 367.2
2003 4.3 0.0 7.5 1.6 12.3 23.8 23.0 16.1 22.8 176.0 0.5 1.3 289.2
2004 0.8 270.2 ? ? ? 45.4 14.2 20.6 1.3 8.0 0.8 6.7 368.0
2005 0.3 0.0 7.5 0.0 0.0 0.0 229.5 6.2 11.7 100.2 0.3 0.3 355.8
2006 2.4 0.0 0.0 14.8 166.9 20.7 7.0 103.4 8.0 30.0 1.8 0.3 355.3
2007 1.3 0.0 9.6 1.3 1.3 7.5 159.9 27.1 2.1 16.6 0.5 2.1 229.4
2008 0.0 0.0 0.8 22.3 58.7 21.5 353.5 178.6 1.0 636.5
9.9.2 Derived from event yield rating
Table 29 Monthly sediment yields in tonnes from the Mangemangeroa catchment. NB: a ‘?’
represents a gap in the flow record
Year Jan Feb Mar Apr May Jun Jul Aug Sep Oct Nov Dec Total
2000 32.6 75.0 37.5 0.0 0.0 0.0 145.1
2001 0.0 0.0 0.0 5.5 7.0 0.0 33.2 68.7 119.6 6.9 4.2 123.1 368.2
2002 36.3 0.0 14.6 0.0 0.0 134.1 153.5 11.7 10.6 6.2 0.0 0.0 367.0
2003 7.0 0.0 0.0 0.0 6.8 14.6 6.7 10.6 10.4 157.6 0.0 0.0 213.7
2004 0.0 192.1 0 0 43.5 71.9 4.5 13.1 0.0 2.6 0.0 12.0 339.6
2005 0.0 0.0 22.1 0.0 0.0 0.0 307.2 9.9 29.5 78.4 0.0 0.0 447.1
2006 0.0 0.0 0.0 0.0 132.5 3.9 8.4 62.0 6.8 46.7 0.0 0.0 260.2
2007 0.0 0.0 10.9 0.0 0.0 9.4 128.1 31.9 0.0 24.5 0.0 0.0 204.8
2008 0.0 0.0 0.0 55.4 90.4 0.0 233.5 165.7 0.0 544.9