analysis of rcm midwifery cases at nmc a … analysis...2 results 1. the sample our 149 cases...
TRANSCRIPT

1
ANALYSIS OF RCM MIDWIFERY CASES AT NMC
A report for RCM staff, activists and Heads of Midwifery.
INTRODUCTION
The Nursing and Midwifery Council (NMC) regulates midwives and nurses in England, Northern Ireland, Scotland and Wales. It exists to protect the public, through setting standards of education, training, conduct and performance, by investigating allegations that an individual has fallen short of those standards and taking appropriate action. Every midwife and nurse is expected to be able to demonstrate her/his fitness to practice through possessing the skills, knowledge, good health and good character to do their job safely and effectively. Failure to be able to demonstrate fitness to practise can ultimately lead to removal from the register and therefore the inability to work as a midwife or nurse.
A referral to the NMC’s Fitness to Practice investigation process is therefore a very serious matter; it is potentially career ending. The Royal College of Midwives (RCM) is the professional body and trade union representing the UK’s midwives and maternity team. Our role is to represent members referred to the NMC, to ensure that they experience an open, transparent and fair process, that they have every opportunity to give account of themselves and their actions and that justice is done. The RCM does not defend poor practice and indeed may choose not to represent a member in circumstances that would bring the RCM and profession into disrepute, for example a midwife already found guilty of a serious criminal charge.
Until very recently the NMC has not been able to distinguish between nurses referred to the NMC and the much smaller number, given their much smaller overall number, of midwife referrals. It has therefore been impossible to analyse the causes and characteristics of midwife referrals and learn lessons that might prevent future cases.
The RCM represents 91% of the UK’s midwives; it is therefore likely that we represent a significant proportion of midwives referred to the NMC. This gives us access to a wealth of data on the demographics and experience of midwives referred and the opportunity to review whether the process works fairly and justly for all midwives.
METHODOLOGY
A senior experienced midwife with a background both in professional advice and employment relations was asked to review all RCM held case files for NMC referrals closed as completed between January 2013 and June 2015. A research template was developed to allow standardised collection of data covering the personal characteristics of the midwives referred, the causes and background to referrals, the progress of each case through to its conclusion and outcomes. The RCM’s data analyst conducted both single and multi-variable analysis in order for us to build a picture not just of the most common or average factors associated referral but also to test some implicit assumptions.
2
RESULTS
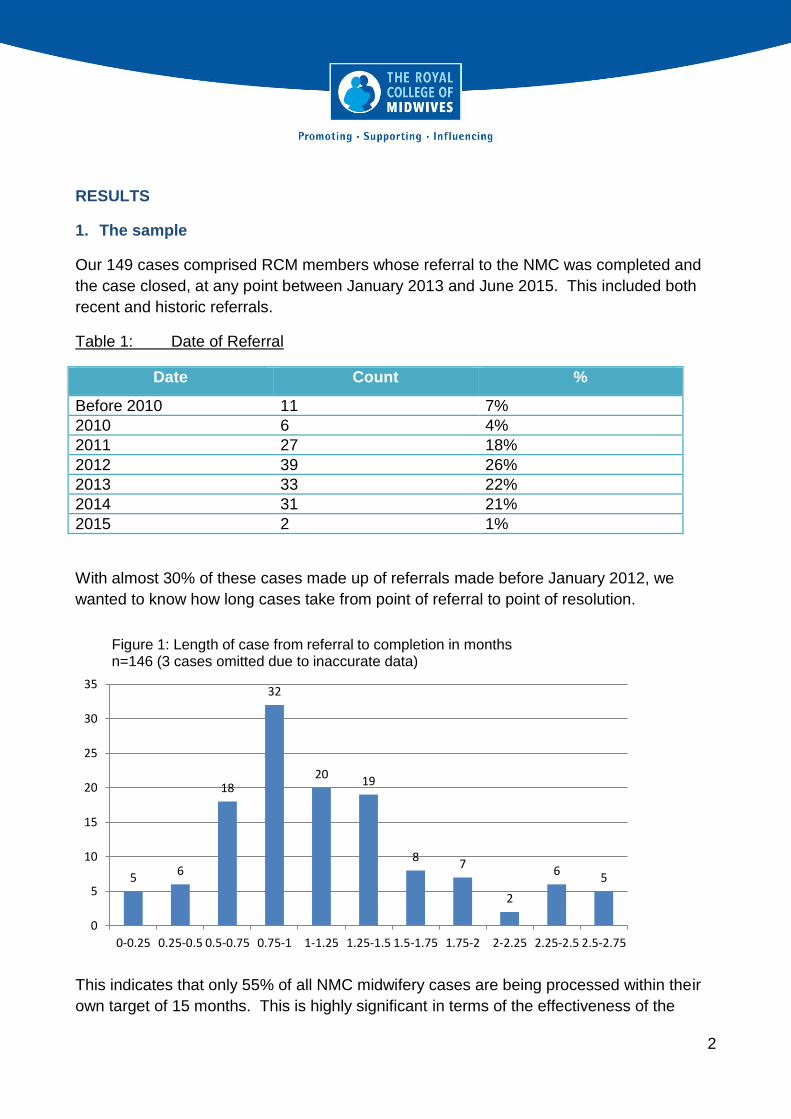
1. The sample
Our 149 cases comprised RCM members whose referral to the NMC was completed and
the case closed, at any point between January 2013 and June 2015. This included both
recent and historic referrals.
Table 1: Date of Referral
Date Count %
Before 2010 11 7%
2010 6 4%
2011 27 18%
2012 39 26%
2013 33 22%
2014 31 21%
2015 2 1%
With almost 30% of these cases made up of referrals made before January 2012, we
wanted to know how long cases take from point of referral to point of resolution.
This indicates that only 55% of all NMC midwifery cases are being processed within their
own target of 15 months. This is highly significant in terms of the effectiveness of the
5 6
18
32
20 19
8 7
2
6 5
0
5
10
15
20
25
30
35
0-0.25 0.25-0.5 0.5-0.75 0.75-1 1-1.25 1.25-1.5 1.5-1.75 1.75-2 2-2.25 2.25-2.5 2.5-2.75
Figure 1: Length of case from referral to completion in months n=146 (3 cases omitted due to inaccurate data)
3
regulator in protecting the public and in terms of the personal impact referral has on
individual midwives. Both deserve a swifter process. Later we explore whether there are
common factors linking the cases which are taking the NMC so long to action.
2. General profile of Midwives Referred.
From the data available we have built a simple profile of the characteristics of a midwife
referred to the NMC.
The average midwife referred to the NMC is 50 years old and has been practising for 20
years. She is white British and works full time as a Band 6 hospital midwife. She is more
likely than to be dual qualified, i.e. also hold a nursing qualification, works a mixed shift
pattern and has already been subject to a disciplinary or supervisory investigation.
Referrals originate in roughly equal numbers from employers, the LSA and the public and
most referrals are ultimately found no case to answer. The proportion of cases referred by
the public fell significantly in 2014 but rose again in 2015. Overwhelmingly the incident(s)
promoting referral occurred during the midwife’s current employment. It is most likely that
the result of referral will be a finding of no case to answer.
The most common factors associated with all midwife referrals are:
Lack of competence
Attitude and behaviour
Failure to escalate/failure to seek medical advice
Failure to monitor mother/baby adequately or failure to perform observations
Inadequate record keeping
Medication errors
Failure to interpret CTGs
It is uncommon for midwives to be referred for:
Theft
Inappropriate use of social media
Fraud
Breaching confidentiality
Sleeping on duty
Health
4
2 2 4 3
9
16
28
44
25
13
3
0
10
20
30
40
50
<20 or(blank)
20-24 25-29 30-34 35-39 40-44 45-49 50-54 55-59 60-64 65-70
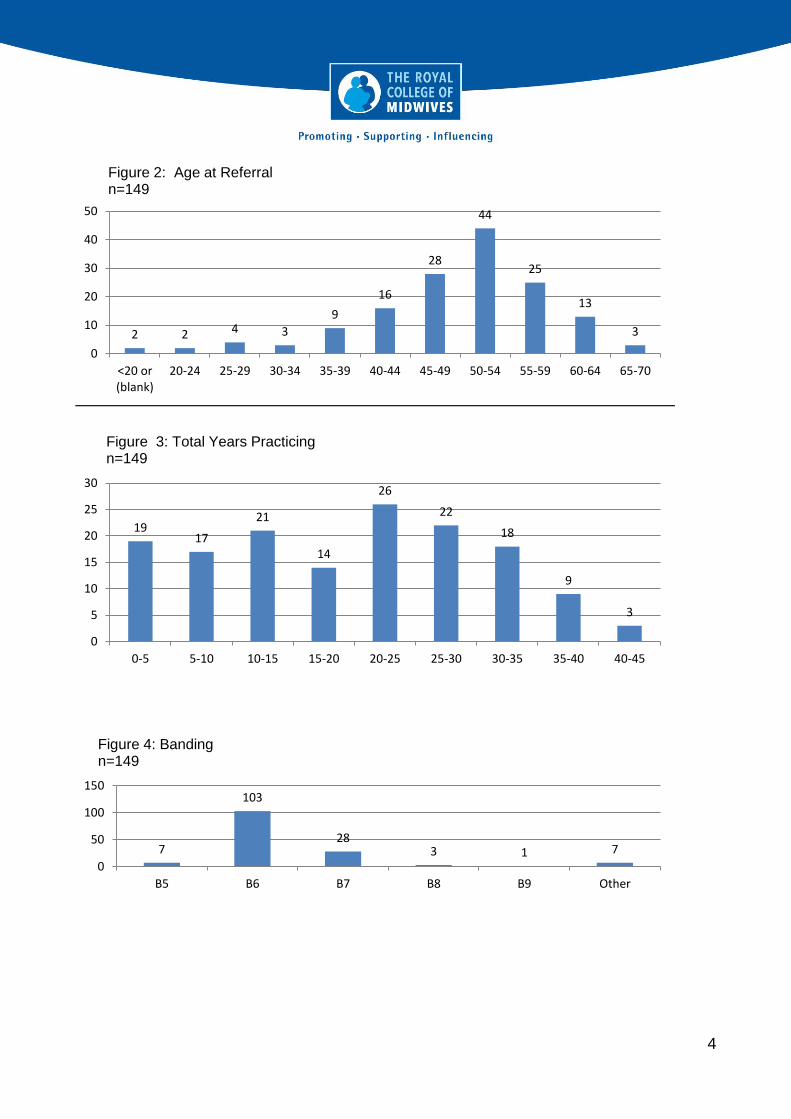
Figure 2: Age at Referral n=149
19 17
21
14
26
22
18
9
3
0
5
10
15
20
25
30
0-5 5-10 10-15 15-20 20-25 25-30 30-35 35-40 40-45
Figure 3: Total Years Practicing n=149
7
103
28 3 1 7
0
50
100
150
B5 B6 B7 B8 B9 Other
Figure 4: Banding n=149
5
3
107
38
1 0
50
100
150
Agency Full Time Part Time (blank)
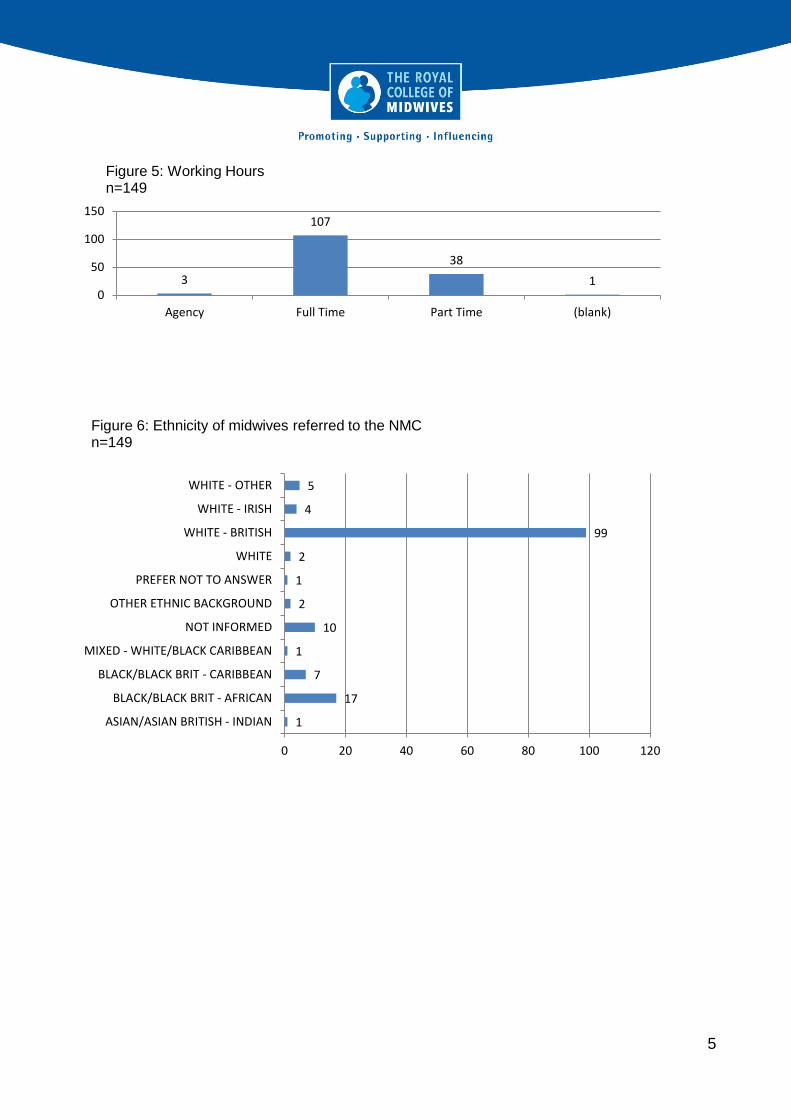
Figure 5: Working Hours n=149
1
17
7
1
10
2
1
2
99
4
5
0 20 40 60 80 100 120
ASIAN/ASIAN BRITISH - INDIAN
BLACK/BLACK BRIT - AFRICAN
BLACK/BLACK BRIT - CARIBBEAN
MIXED - WHITE/BLACK CARIBBEAN
NOT INFORMED
OTHER ETHNIC BACKGROUND
PREFER NOT TO ANSWER
WHITE
WHITE - BRITISH
WHITE - IRISH
WHITE - OTHER
Figure 6: Ethnicity of midwives referred to the NMC n=149

6
61%
32%
7%
Figure 7: Shift pattern n=149
Mixed Shifts Predominately Day Time Working Predominately Night Time Working
Dual 78%
Singly 22%
Figure 8: Qualification Status; midwife vs midwife/nurse n=149
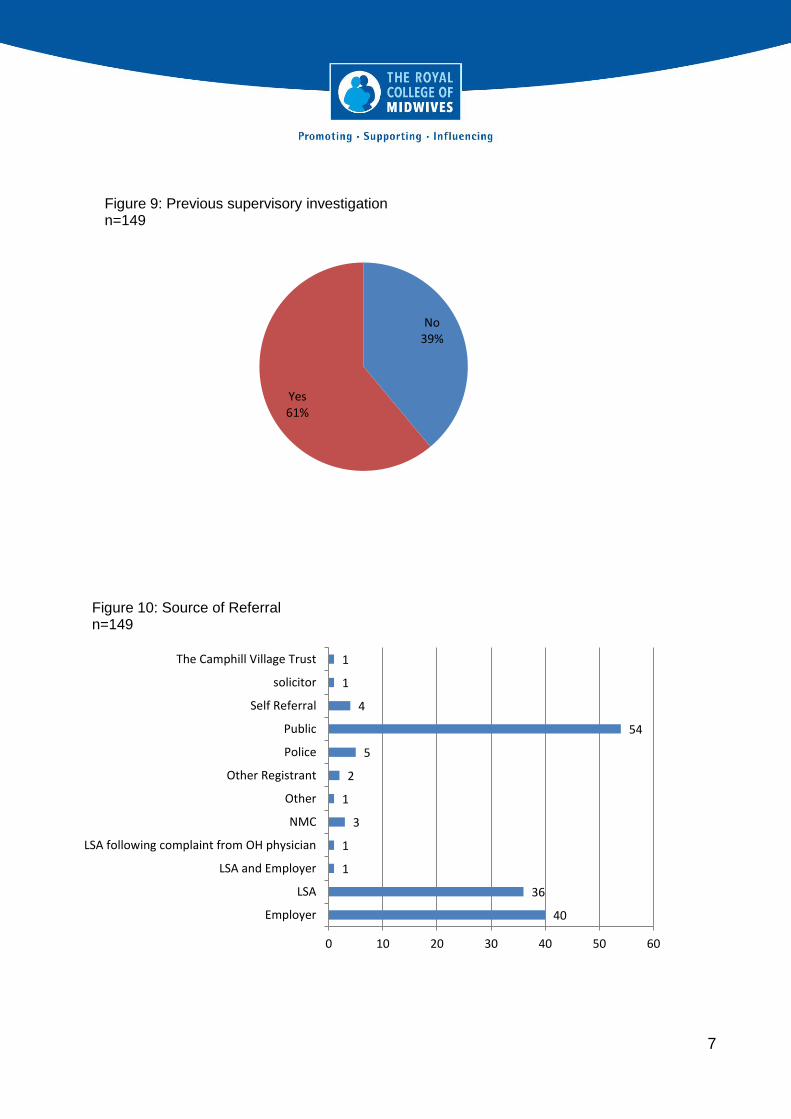
7
No 39%
Yes 61%
Figure 9: Previous supervisory investigation n=149
40
36
1
1
3
1
2
5
54
4
1
1
0 10 20 30 40 50 60
Employer
LSA
LSA and Employer
LSA following complaint from OH physician
NMC
Other
Other Registrant
Police
Public
Self Referral
solicitor
The Camphill Village Trust
Figure 10: Source of Referral n=149

8
8
1
2
3
1
90
37
4
3
0 10 20 30 40 50 60 70 80 90 100
Caution
Caution Order
Conditions of Practice
Conditions of Practice Order
Interim Suspension
No Case To Answer
Removal From Register
Suspension Order
(blank)
Figure 11: Case Outcomes n=149

9
ANALYSIS
1. The link between age and experience?
Our analysis indicates that it is generally older and more experienced midwives who are
referred to the NMC. Younger midwives and those at the beginning of their careers are
much less likely to be referred, only 5% of referrals are to midwives under 30 years and
less than a quarter are to midwives practising for less than 10 years. This would tend to
suggest that these midwives are less likely to be challenged about their practice.
However, if we look only at the 22% of referrals to singly qualified midwives, those without
a nursing qualification, the picture is somewhat different. Of this cohort, 15% are under 30
and 58% have been practising midwifery for less than 10 years.
We compared the age profile of members referred to the NMC with the age profile of RCM
qualified members (excluding students and MSWs) generally and this confirms that
younger members are significantly less likely to be referred.
2 2 4 3 9
16
28
44
25
13
3
0
10
20
30
40
50
<20 or(blank)
20-24 25-29 30-34 35-39 40-44 45-49 50-54 55-59 60-64 65-70
Co
un
t
Age
Figure 12: Age at Referral (n=149)
10
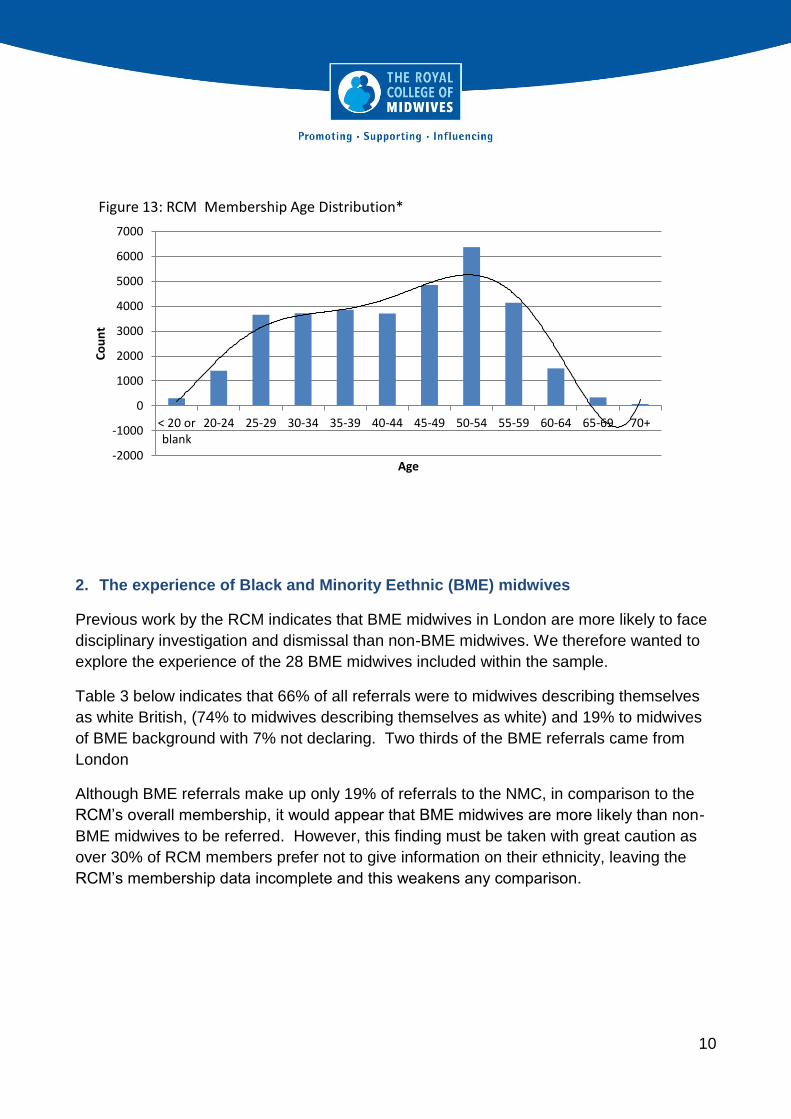
2. The experience of Black and Minority Eethnic (BME) midwives
Previous work by the RCM indicates that BME midwives in London are more likely to face
disciplinary investigation and dismissal than non-BME midwives. We therefore wanted to
explore the experience of the 28 BME midwives included within the sample.
Table 3 below indicates that 66% of all referrals were to midwives describing themselves
as white British, (74% to midwives describing themselves as white) and 19% to midwives
of BME background with 7% not declaring. Two thirds of the BME referrals came from
London
Although BME referrals make up only 19% of referrals to the NMC, in comparison to the
RCM’s overall membership, it would appear that BME midwives are more likely than non-
BME midwives to be referred. However, this finding must be taken with great caution as
over 30% of RCM members prefer not to give information on their ethnicity, leaving the
RCM’s membership data incomplete and this weakens any comparison.
-2000
-1000
0
1000
2000
3000
4000
5000
6000
7000
< 20 orblank
20-24 25-29 30-34 35-39 40-44 45-49 50-54 55-59 60-64 65-69 70+
Co
un
t
Age
Figure 13: RCM Membership Age Distribution*

11
Table 3: NMC Referrals by Ethnicity compared to total RCM Membership Ethnicity
Ethnicity Number of
Referrals
% of Referrals
% of RCM Membership
% Midwifery Workforce
HSCIC
Asian/Asian British - Indian
1 0.67% 0.53% 1.8%
Black/Black Brit - African
17 11.41% 2.26%
7.3% Black/Black Brit - Caribbean
7 4.70% 1.53%
Mixed - White/Black Caribbean
1 0.67% 0.36%
Not Informed 10 6.71% - 5.2%
Other Ethnic Background
2 1.34% 0.47% 0.7%
Prefer Not To Answer 1 0.67% 31.25
White 2 1.34% -
85% White - British 99 66.44% 59.24%
White - Irish 4 2.68% 2.61%
White - Other 5 3.36% 2.75%
The characteristics of the BME referrals are broadly similar to the non-BME referrals in
terms of age, banding and working pattern. None of the BME midwives referred was
qualified only as a midwife. They are more likely to be referred slightly earlier in their
careers and more frequently by their employer than by the public. BME midwives’ cases
are more likely to take a long time to complete and they are more likely to be removed
from the register. As we will see later when we explore the causes of referral, BME
midwives are more likely than non-BME midwives to be referred for issues ‘attitude and
behaviour’.
Table 4: Comparison of key referral characteristics by ethnicity
Characteristic BME Referrals
Non BME referrals
All Referrals
% Aged > 50yrs 54% 55% 57%
% Practising >20yrs 43% 55% 53%
% Band 6 79% 65% 71%
% Working Full Time 71% 73% 72%

12
Characteristic BME Referrals
Non BME Referrals
All Referrals
% Working Predominantly Mixed Shifts
61% 60% 61%
% Dual Qualified 100% 72% 78%
% Subject To Previous Supervisory Investigation
71% 60% 61%
% Referred By Employer 36% 25% 28%
% Referred By LSA 29% 25% 25%
% Referred By Public 25% 37% 36%
% Case Exceeds 15 Months 75% 37% 46%
% No Case To Answer 50% 62% 60%
% Removed From The Register 37% 25% 25%
3. The experience of midwives by route of referral
Of the 149 referrals, 132 (89%) originate from one of three sources: employers, usually but
not always following dismissal or disciplinary processes, the LSA Midwifery Officer
following a supervisory investigation and action and from the public who may refer on the
basis of concern or complaint about a midwife’s actions.
The experience of RCM staff representing members is of an increase in the number of
referrals from members of the public and this impacting onto the ability of the NMC to meet
its KPI for timely consideration and completion of investigations of 15 months from
completion to decision. Our analysis does confirm that the most significant difference
between cases and the route of referral is in the length of the case and its eventual
outcome.
Table 5: Case length by Referral Route
N=132
Employer LSA Public Grand Total
Unknown 1 1 2
<= NMC KPI of 15 Months
13.51 15.5 43 72
> NMC KPI of 15 Months 27 21 10 58
Grand Total 40.5 37.5 54 132
1 1 Joint LSA and Employer referral has been split

13
67% of cases referred by employers are NOT completed within 15 months
56% of cases referred by the LSAs are NOT completed within 15 months
19% of cases referred by the public are NOT completed within 15 months.
The faster turn around of cases referred by the public correlates with the outcomes, with
many more cases referred from the public being resolved at an early stage, most
commonly with a decision at an early stage in the process that there is no case to answer.
In almost 87% of cases referred by the public the NMC found no case to answer compared
to less than 40% of employer-referrals and a little over 27% of LSA referrals.
Table 6: Route of Referral
Route of Referral Number % found no case to answer
% removal from the register
Employer 40.5 40% 40%
LSA 37.5 27% 43%
Public 54 87% 4%
It is interesting to note that BME midwives appear to be less likely to be referred by the
public, see table 2 earlier. If they are therefore over-represented in the referrals from
employers, this could go some way to explaining why they have higher rates of removal
from the register. In 100% of the public referred cases of BME midwives, the NMC found
no case to answer. By contrast 100% of the BME midwives referred by the LSA
proceeded through to Conduct and Competency Committee Hearings and in 38% of these
was ‘no case to answer’ found. All other characteristics appear to be broadly similar
regardless of the referral route, with the exception that the LSA referrals contain a higher
proportion of part-time midwives: 33% as opposed to 20% amongst employer-referrals and
22% amongst public-referrals.
4. The experience of midwives by geography
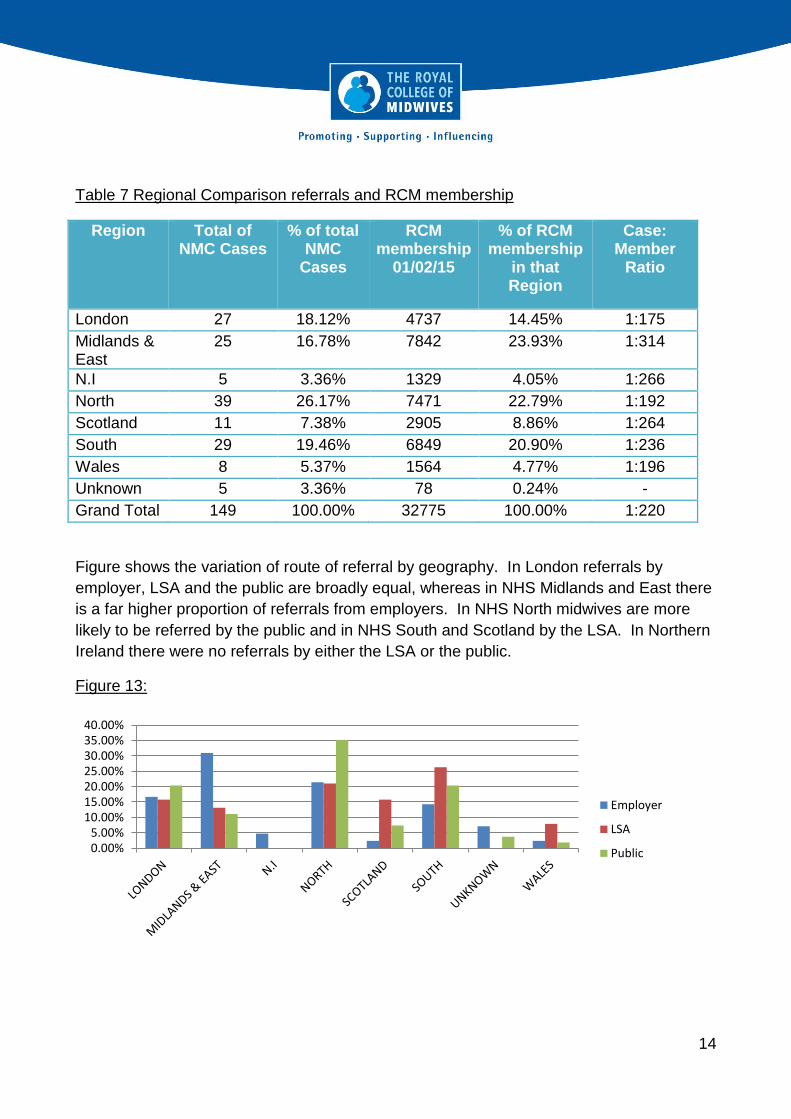
Also interesting to note is the regional distribution of referrals. Overall compared to our
membership size, midwives in London, in Wales and the North of England are more likely
to be referred to the NMC. Table 7 shows how in n London there is on average 1 referral
for every 175 members, whereas in Midlands and East of England it is only 1 referral for
every 314 members.
14
Table 7 Regional Comparison referrals and RCM membership
Region Total of NMC Cases
% of total NMC
Cases
RCM membership
01/02/15
% of RCM membership
in that Region
Case: Member
Ratio
London 27 18.12% 4737 14.45% 1:175
Midlands & East
25 16.78% 7842 23.93% 1:314
N.I 5 3.36% 1329 4.05% 1:266
North 39 26.17% 7471 22.79% 1:192
Scotland 11 7.38% 2905 8.86% 1:264
South 29 19.46% 6849 20.90% 1:236
Wales 8 5.37% 1564 4.77% 1:196
Unknown 5 3.36% 78 0.24% -
Grand Total 149 100.00% 32775 100.00% 1:220
Figure shows the variation of route of referral by geography. In London referrals by
employer, LSA and the public are broadly equal, whereas in NHS Midlands and East there
is a far higher proportion of referrals from employers. In NHS North midwives are more
likely to be referred by the public and in NHS South and Scotland by the LSA. In Northern
Ireland there were no referrals by either the LSA or the public.
Figure 13:
0.00%5.00%
10.00%15.00%20.00%25.00%30.00%35.00%40.00%
Employer
LSA
Public
15
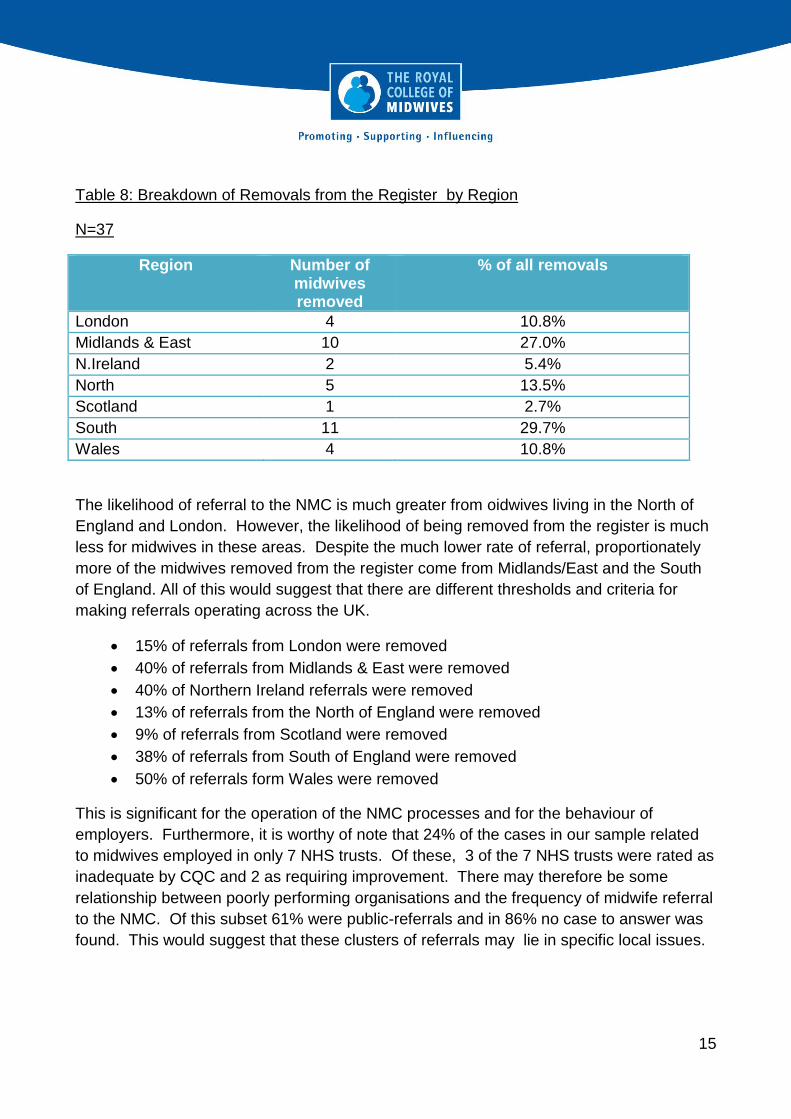
Table 8: Breakdown of Removals from the Register by Region
N=37
Region Number of midwives removed
% of all removals
London 4 10.8%
Midlands & East 10 27.0%
N.Ireland 2 5.4%
North 5 13.5%
Scotland 1 2.7%
South 11 29.7%
Wales 4 10.8%
The likelihood of referral to the NMC is much greater from oidwives living in the North of
England and London. However, the likelihood of being removed from the register is much
less for midwives in these areas. Despite the much lower rate of referral, proportionately
more of the midwives removed from the register come from Midlands/East and the South
of England. All of this would suggest that there are different thresholds and criteria for
making referrals operating across the UK.
15% of referrals from London were removed
40% of referrals from Midlands & East were removed
40% of Northern Ireland referrals were removed
13% of referrals from the North of England were removed
9% of referrals from Scotland were removed
38% of referrals from South of England were removed
50% of referrals form Wales were removed
This is significant for the operation of the NMC processes and for the behaviour of
employers. Furthermore, it is worthy of note that 24% of the cases in our sample related
to midwives employed in only 7 NHS trusts. Of these, 3 of the 7 NHS trusts were rated as
inadequate by CQC and 2 as requiring improvement. There may therefore be some
relationship between poorly performing organisations and the frequency of midwife referral
to the NMC. Of this subset 61% were public-referrals and in 86% no case to answer was
found. This would suggest that these clusters of referrals may lie in specific local issues.

16
5. Reason for Referral and Case Outcome.
Referral to the NMC on the grounds of Fitness to Practise covers a wide range of
allegations from clinical incompetence or failure through to professional behaviour. A
single referral can contain more than one allegation
Table 9: Referral Reason
Referral Reason Number % Referrals containing allegation
Failure to monitor mother/baby adequately or to perform observations
70 47%
Inadequate record keeping/documentation 63 42%
Failure to escalate/failure to seek medical advice
56 38%
Lack of competence 45 30%
Attitude and behaviour 34 30%
Dishonesty 25 17%
Failure to interpret ctgs 27 18%
Medication errors 22 15%
Criminal arrest, caution or similar 9 6%
Health issue (mental health) 7 5%
Substance abuse 7 5%
Breaching confidentiality 3 2%
Fraud 2 1%
Inappropriate use of social media 2 1%
Sleeping on duty 2 1%
Theft 1 1%
Health (physical health) 1 1%
This breakdown of reasons for referrals can be found reflected amongst midwives from the
7 trusts with the most referrals, singly qualified midwives, midwives by length of practice
and midwives subject to previous supervisory investigations suggesting a pretty
consistent pattern of referral triggers, irrespective of where and how the midwife works. It
also raises the possibility that conditions surrounding an incident that triggers referral may
be linked to staffing levels. Issues of failure to undertake duties: monitoring, recording and
escalating are associated with high workload and little chance for fresh eyes to spot a
colleague struggling.

17
6. Experience through the NMC process
The NMC investigatory process is staged with referrals initially screened, then considered
by a committee following preliminary investigation that may or may not decide to proceed
to a full inquiry. Midwives who are deemed to be potentially a risk to the public can be
suspended from practice and therefore denied the ability to work for some or all of the
duration of the investigatory process. Table 10 below indicates that just over half of all
referrals are closed before reaching the final stage of the Conduct and Competence
Committee
Table 10: Stage of Case Closure
n=145 (4 missing records)
Case Closed Number %
Case examiners 17 12%
At first response 42 29%
At second response 16 11%
At CCC 66 45%
At health committee 4 3%
Table 11 below illustrates how the majority of cases referred to the NMC result in a finding
of no case to answer and less than a quarter attract the ultimate sanction of removal from
the register. Furthermore, table xx demonstrates how even looking only at those cases
that make it all the way through to the Conduct and Competence Committee, only just over
half result in removal from the register, with almost 20% of these cases being found no
case to answer. This would suggest that the NMC still has some way to go in earlier
screening and resolution of cases.
Table 11: Outcomes for all cases
N= 149
Outcome Count %
Caution 9 6.0%
Conditions of Practice 5 3.4%
No Case To Answer 90 60.4%
Removal From Register 37 24.8%
Suspension Order 5 3.4%
(not recorded) 3 2.0%
Total 149 100.0%
18
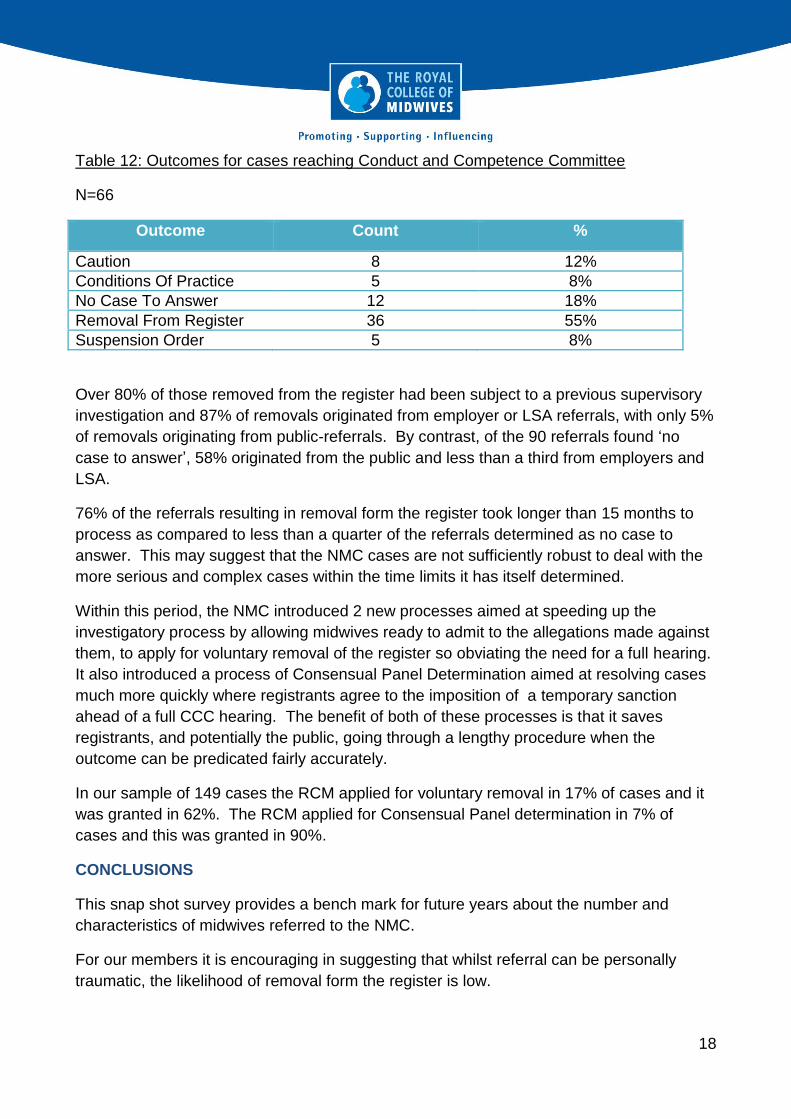
Table 12: Outcomes for cases reaching Conduct and Competence Committee
N=66
Outcome Count %
Caution 8 12%
Conditions Of Practice 5 8%
No Case To Answer 12 18%
Removal From Register 36 55%
Suspension Order 5 8%
Over 80% of those removed from the register had been subject to a previous supervisory
investigation and 87% of removals originated from employer or LSA referrals, with only 5%
of removals originating from public-referrals. By contrast, of the 90 referrals found ‘no
case to answer’, 58% originated from the public and less than a third from employers and
LSA.
76% of the referrals resulting in removal form the register took longer than 15 months to
process as compared to less than a quarter of the referrals determined as no case to
answer. This may suggest that the NMC cases are not sufficiently robust to deal with the
more serious and complex cases within the time limits it has itself determined.
Within this period, the NMC introduced 2 new processes aimed at speeding up the
investigatory process by allowing midwives ready to admit to the allegations made against
them, to apply for voluntary removal of the register so obviating the need for a full hearing.
It also introduced a process of Consensual Panel Determination aimed at resolving cases
much more quickly where registrants agree to the imposition of a temporary sanction
ahead of a full CCC hearing. The benefit of both of these processes is that it saves
registrants, and potentially the public, going through a lengthy procedure when the
outcome can be predicated fairly accurately.
In our sample of 149 cases the RCM applied for voluntary removal in 17% of cases and it
was granted in 62%. The RCM applied for Consensual Panel determination in 7% of
cases and this was granted in 90%.
CONCLUSIONS
This snap shot survey provides a bench mark for future years about the number and
characteristics of midwives referred to the NMC.
For our members it is encouraging in suggesting that whilst referral can be personally
traumatic, the likelihood of removal form the register is low.

19
For our workplace representatives and colleagues it confirms that it is issues relating to
midwives competence, not their personal conduct that are most likely to trigger a referral
and suggests that more needs to be done to support midwives struggling in their practice,
through CPD, mentoring and local remedial action. Given the over representation of
midwives in their 50s, there is much here for employers to consider in terms of supporting
midwives, for example the impact of working longer, the support given through the
menopause and continuing professional development.
The findings relating to our BME members are ambiguous given the paucity of our
comparable data on BME membership generally. However there is enough here to raise
alarm bells that would suggest BME midwives are more likely to be referred by their
employers and more likely to be referred for issues relating to attitudes and behaviours.
In our relations with the NMC we will continue to highlight that more needs to be done to
reduce the length of NMC proceedings and with so many findings of ‘no case to answer’
more work early on to determine whether or not to close a case.
The RCM will repeat this exercise in 3 years.
August 2016