analysis of lignin by surface enhanced raman spectroscopy
TRANSCRIPT

Presented by: Umesh AgarwalInstitution: USFS FPL
Analysis of Lignin by Surface Enhanced Raman Spectroscopy

Micro-Raman
SERS UVRR
FT-Raman
ConventionalRaman
Lignin

Outline
• What is SERS• Mechanisms – surface plasmon and CT• Near-IR lignin SERS• Spectral characteristics• Carbohydrate contribution• CT mechanism - XPS analysis• Lignin models• Applications• Conclusions
What is surface enhanced Raman scattering or SERS
Raman effect is greatly enhanced when a molecule is close to a
rough metal surface.
(Nano- and micro-particles)
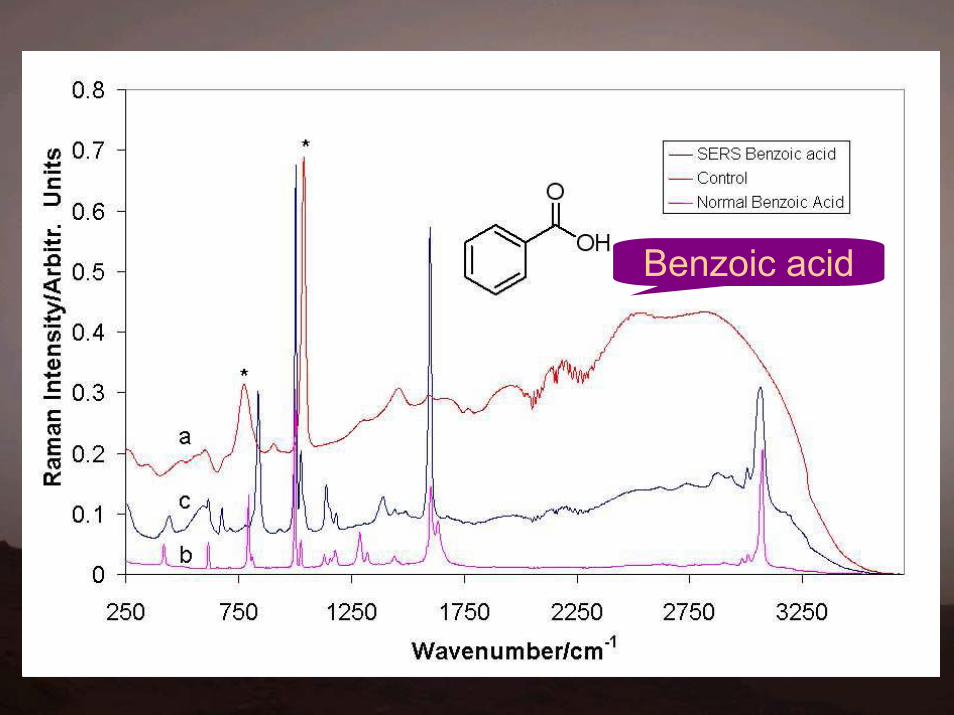
Benzoic acid
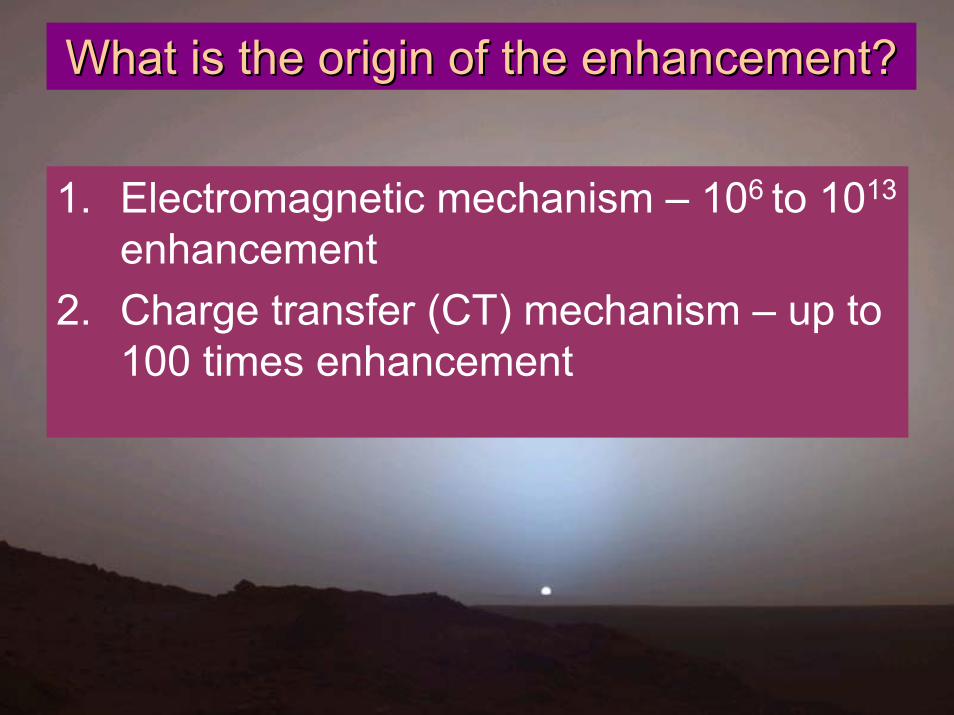
What is the origin of the enhancement?What is the origin of the enhancement?
1. Electromagnetic mechanism – 106 to 1013
enhancement2. Charge transfer (CT) mechanism – up to
100 times enhancement
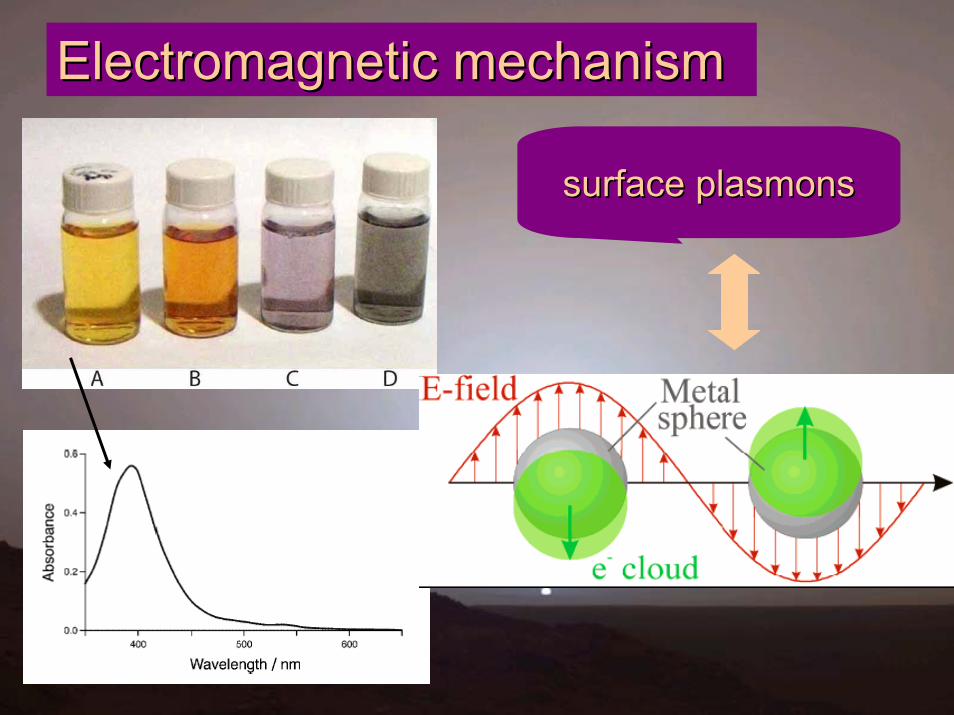
surface plasmonssurface plasmons
Electromagnetic mechanismElectromagnetic mechanism
Second mechanism Second mechanism is charge transferis charge transfer
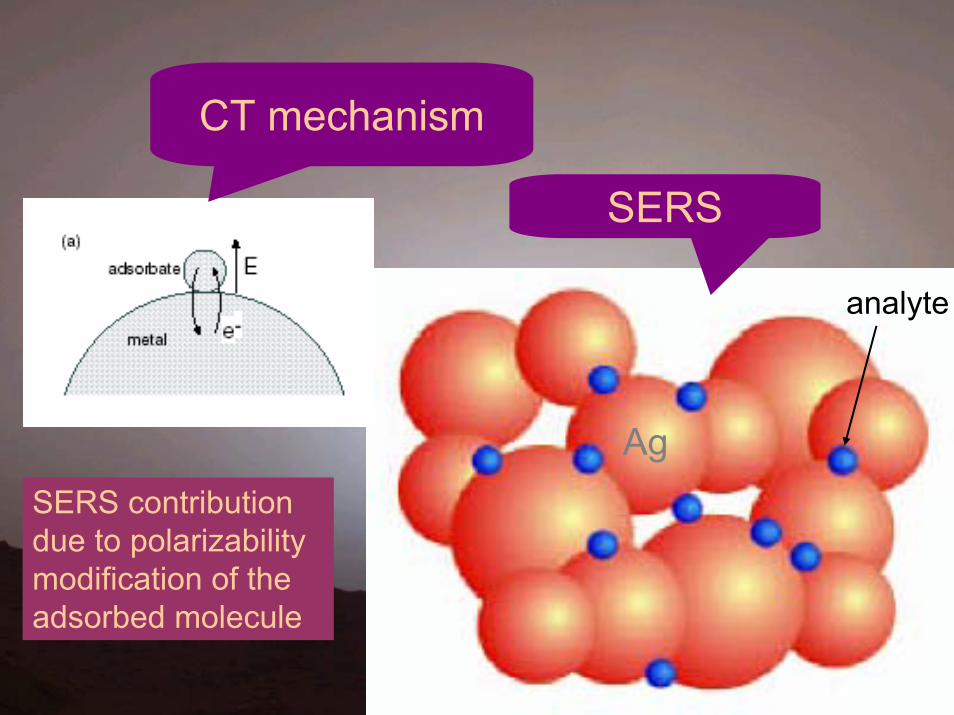
Ag
analyte
SERS
CT mechanism
SERS contribution due to polarizability modification of the adsorbed molecule

• Ag, Au, Cu, Li, K, and Na have shown SERS effect
• Dielectric properties of the noble metals most suited to plasmon resonance
• Light scattering efficiencyElocal = E0/[ε(ω) + 2]
Why only particles of certain metals
Electromagnetic mechanismElectromagnetic mechanism……

Shape dependence of the surface plasma excitations
shape
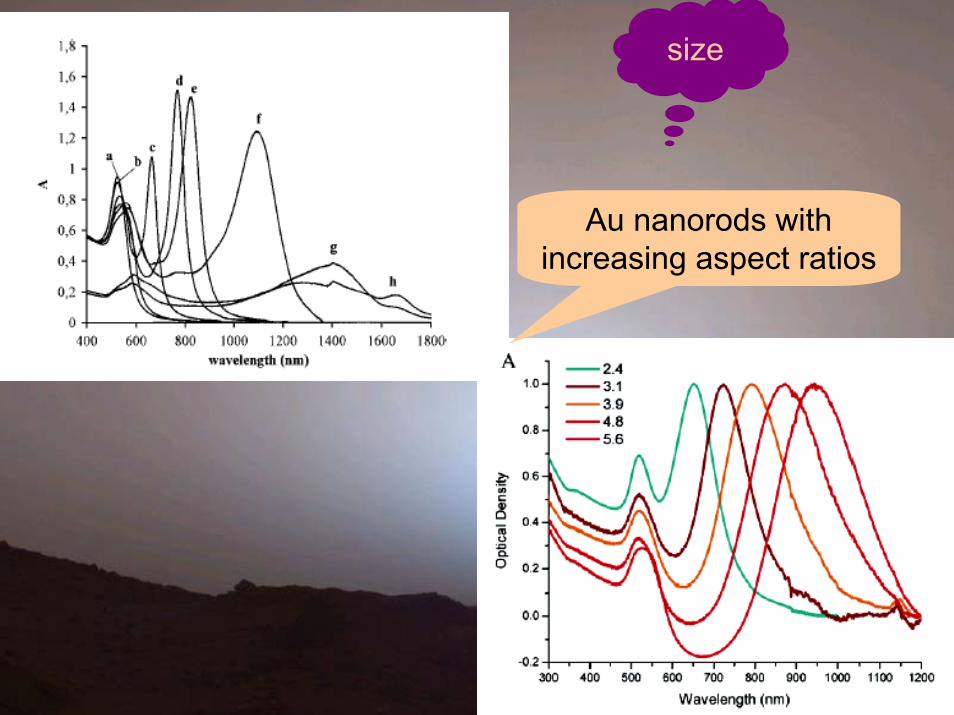
Au nanorods with increasing aspect ratios
size

aggregated vs.
unaggregated
aggregation
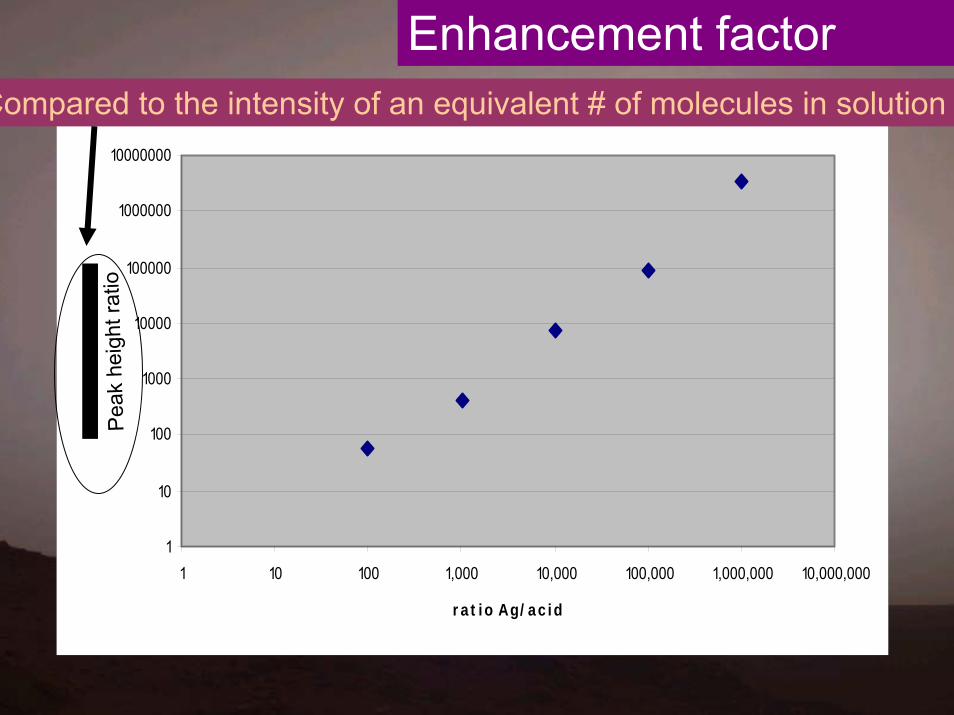
Another example and enhancement factor
calculation

Muconic acid
1
10
100
1000
10000
100000
1000000
10000000
1 10 100 1,000 10,000 100,000 1,000,000 10,000,000
r a t io Ag/ a c i d
Enhancement factorP
eak
heig
ht ra
tioCompared to the intensity of an equivalent # of molecules in solution

SERS of lignin

Spruce MWL -Normal vs. SERS

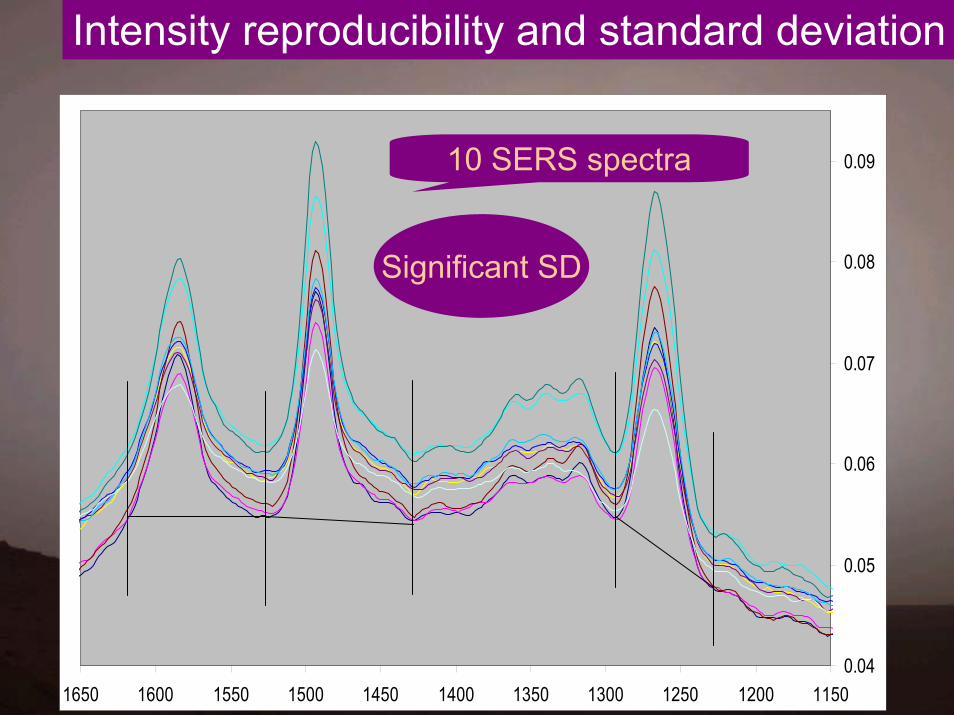
reproducibility
same spot
0.04
0.05
0.06
0.07
0.08
0.09
11501200125013001350140014501500155016001650
Intensity reproducibility and standard deviation
10 SERS spectra
Significant SD

as little as 10 μ gram of ligninby SERS
Sensitivity

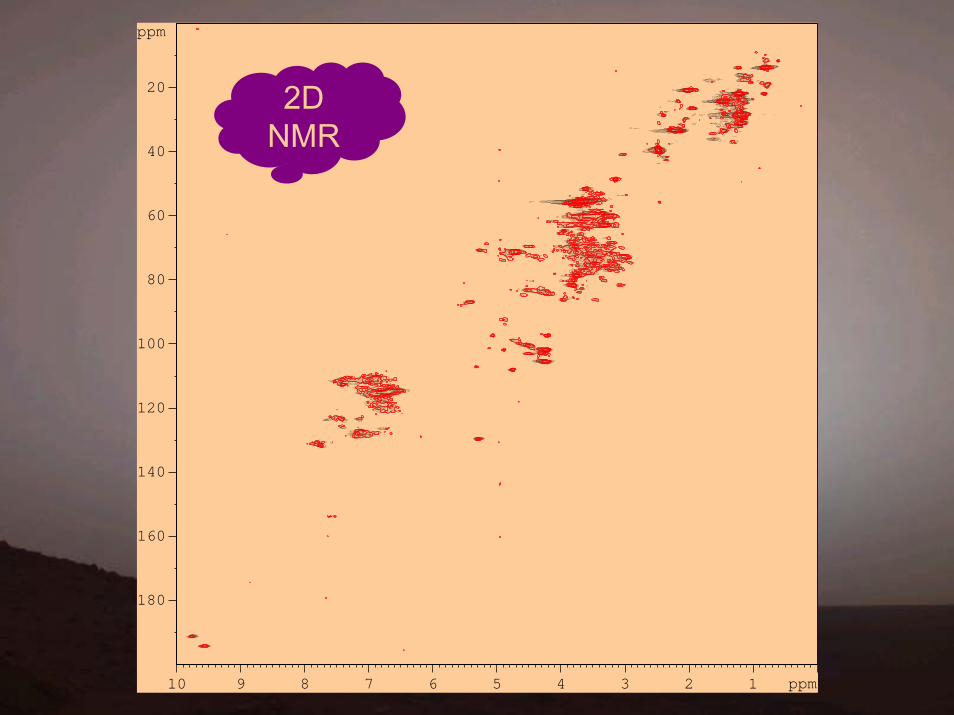
Chemical modification due to adsorption on Ag ?

190 180 170 160 150 140 130 120 110 100 90 80 70 60 50 40 30 20 10 ppm
1D 13C NMR
post adsorption
ppm
10 9 8 7 6 5 4 3 2 1 ppm
180
160
140
120
100
80
60
40
20 2D NMR

Lignin SERS - dilution effects

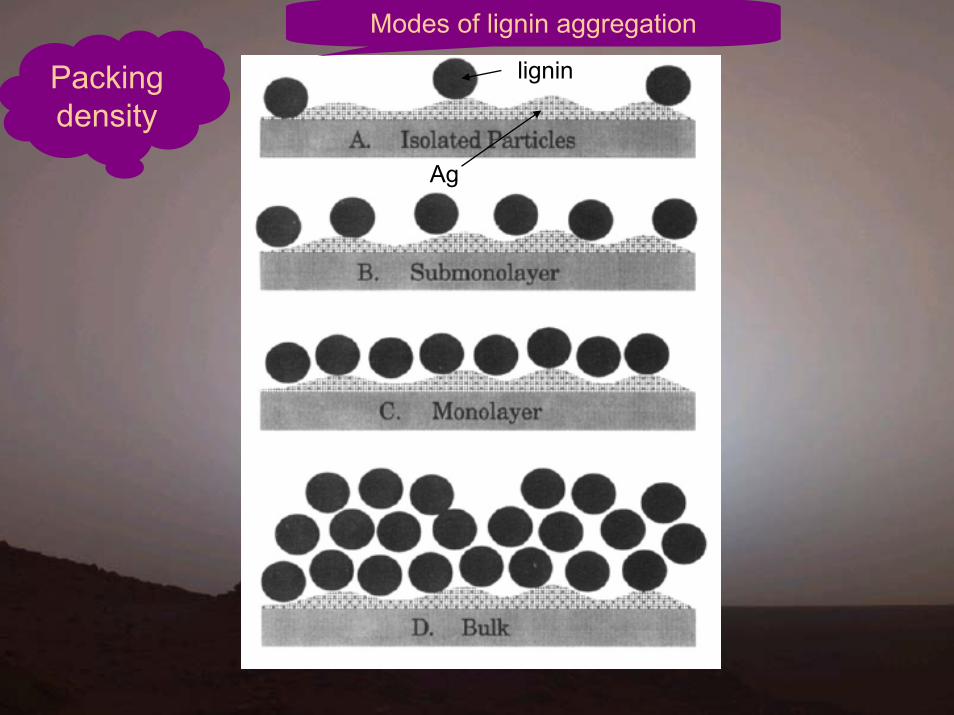
lignin
Ag
Modes of lignin aggregation
Packing density

Spectral characteristics
• Shifted band frequencies• Altered band intensities• Appearance of new bands• Most bands belong to the aromatic unit• Bands enhanced only in the region 250-
1750 cm-1 region• Relaxation of selection rules

Lignin in Wiley-milled wood

Aggregates of silver (a) and wood (b) particles (SEM)

WMW
MWL
Normal WMW

No carbohydrate contribution

Lignin in unbleached KP
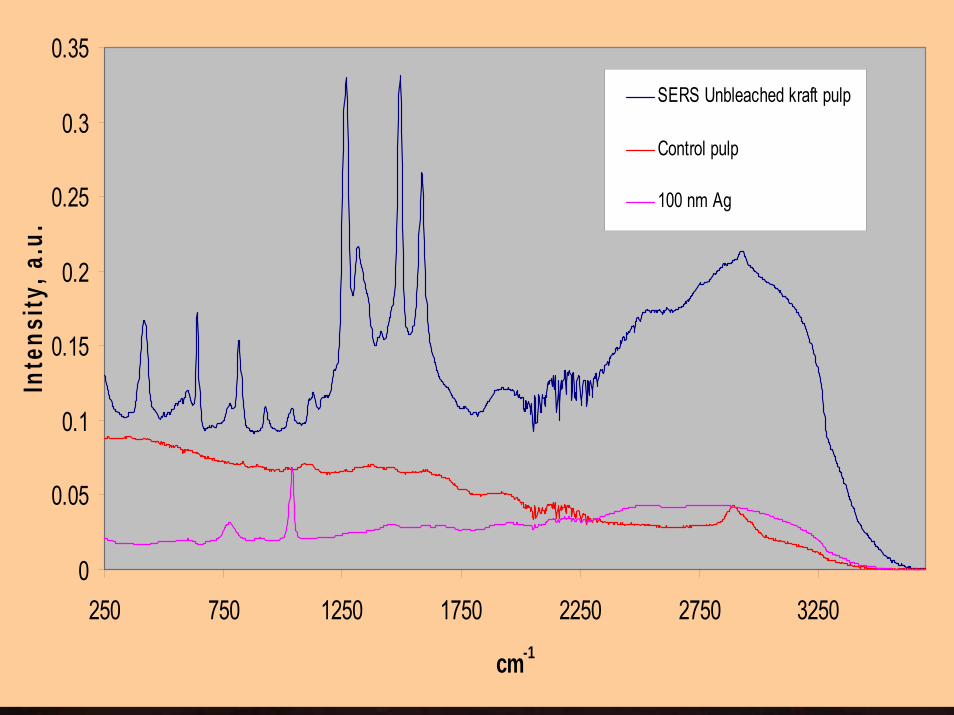
0
0.05
0.1
0.15
0.2
0.25
0.3
0.35
250 750 1250 1750 2250 2750 3250
cm-1
Inte
nsity
, a.u
.
SERS Unbleached kraft pulp
Control pulp
100 nm Ag

Mechanisms operating in lignin SERS

Diffuse reflectance excitation spectra (near-IR)
0.39
0.395
0.4
0.405
0.41
0.415
0.42
0.425
40005000600070008000900010000
cm-1
KM
Uni
ts
2- 3.5 μ Ag particles
1. EM mechanism
9398 cm-1 or 1064 nm

Evidence of CT complex
2. Charge Transfer2. Charge Transfer
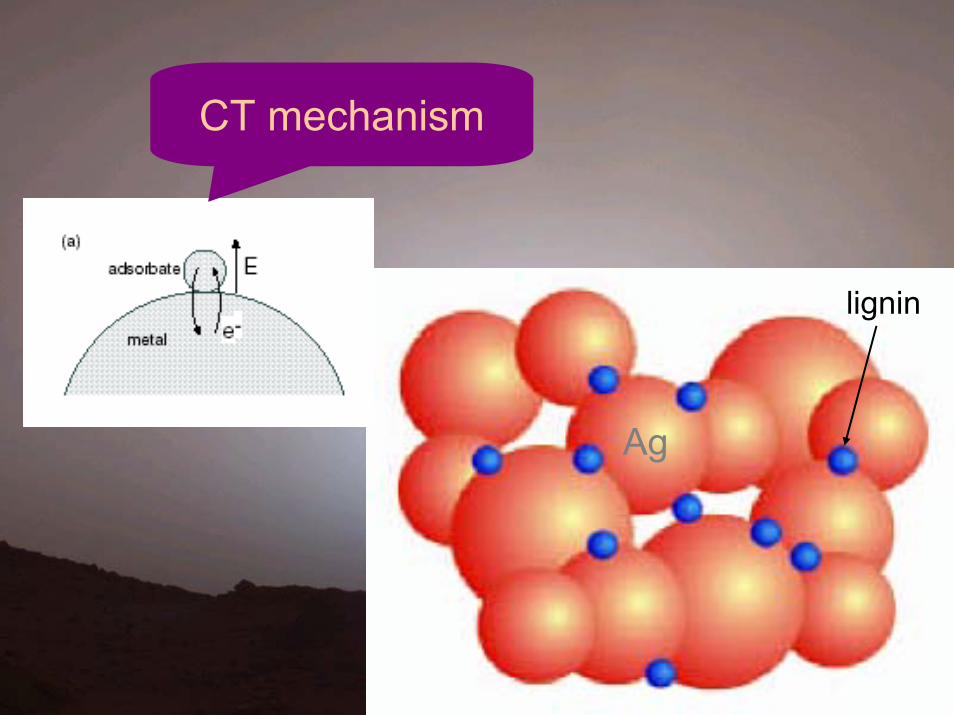
Ag
lignin
CT mechanism
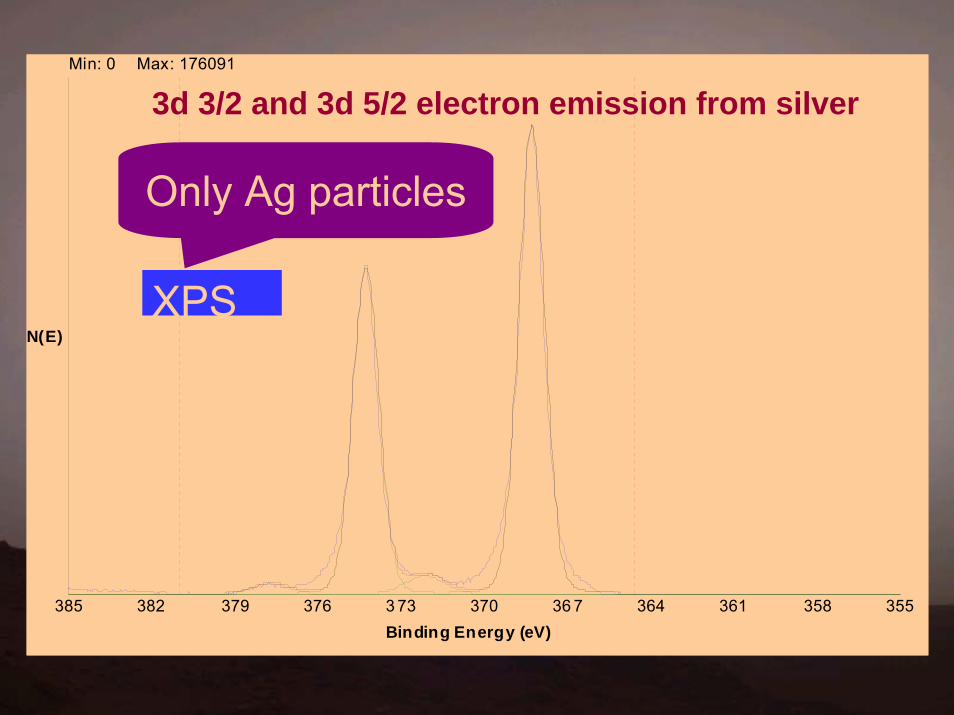
Binding Energy (eV)
N(E)
Min: 0 Max: 176091
385 382 379 376 3 73 370 36 7 364 361 358 355
Only Ag particles
XPS
3d 3/2 and 3d 5/2 electron emission from silver
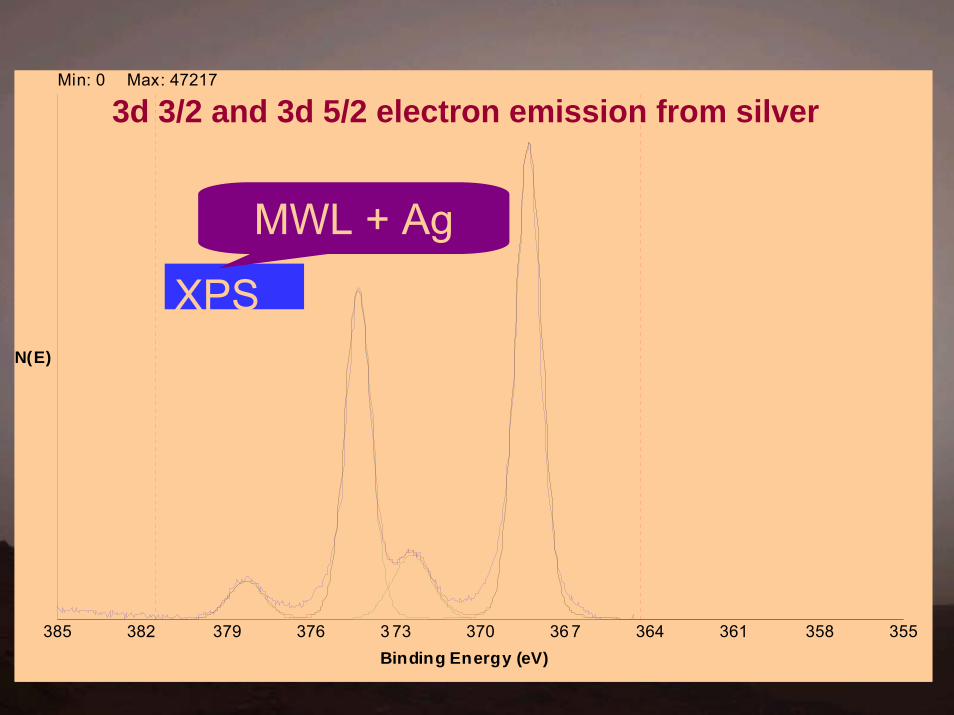
Binding Energy (eV)
N(E)
Min: 0 Max: 47217
385 382 379 376 3 73 370 36 7 364 361 358 355
XPS
MWL + Ag
3d 3/2 and 3d 5/2 electron emission from silver

R1
R2
R3
R4
SERS of lignin models
40 lignin models studied
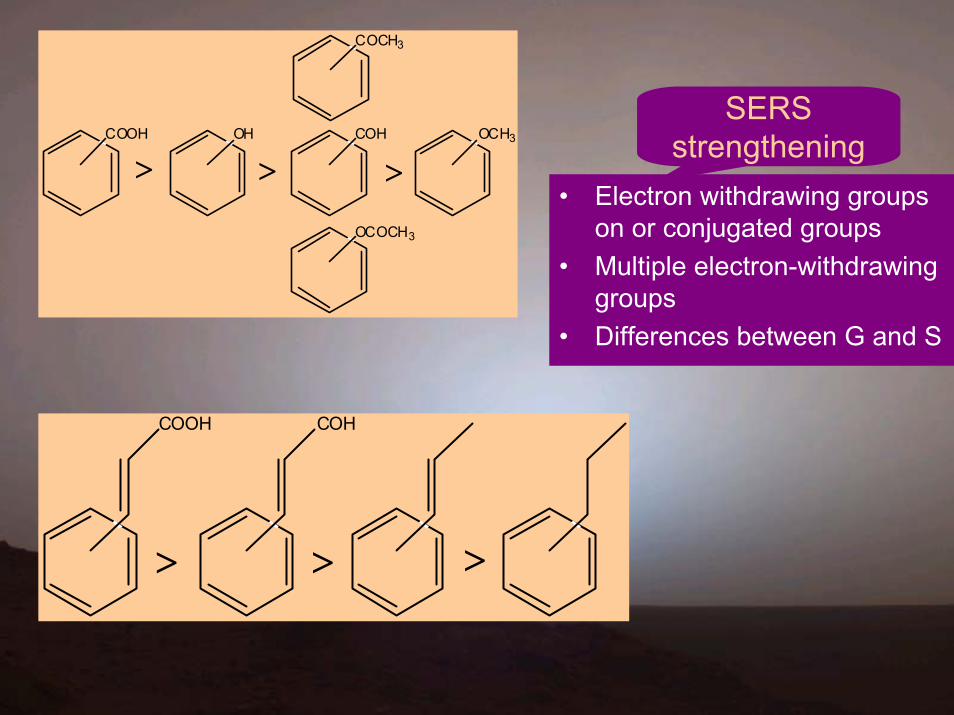
COCH3
OCOCH3
COOH OCH3OH COH
> >>
COOH COH
> > >
• Electron withdrawing groups on or conjugated groups
• Multiple electron-withdrawing groups
• Differences between G and S
SERS strengthening

Applications

1Sensor – lignin detection in cotton linters
0.025
0.035
0.045
250 750 1250 1750
Wavenumber/cm-1
Ram
an In
tens
ity/A
rbitr
. Uni
ts
420 641
780928
1265 1493 1582
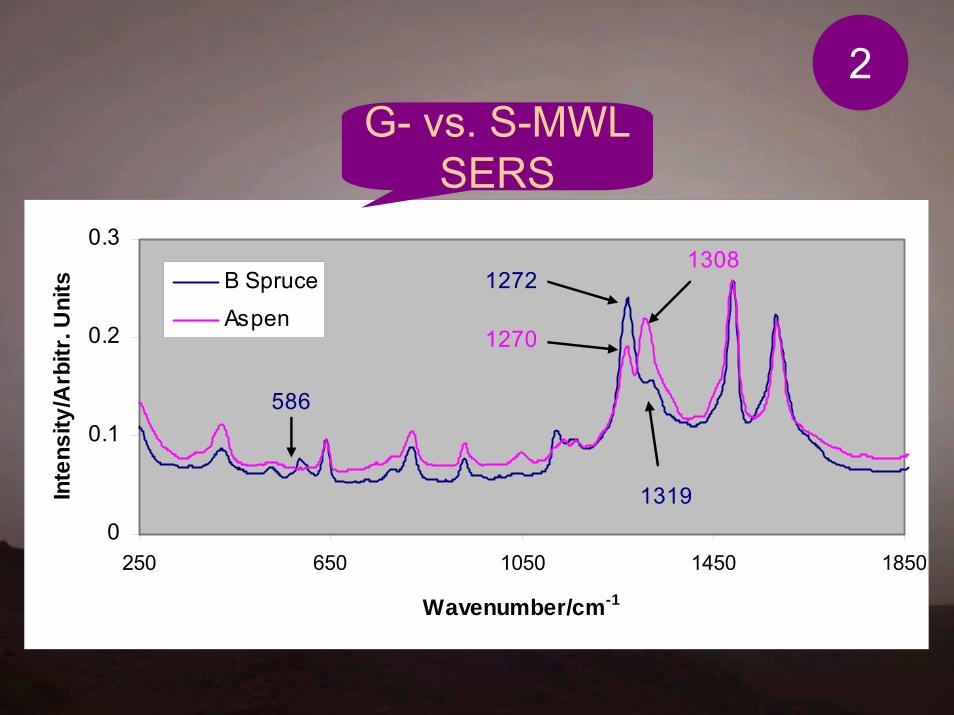
0
0.1
0.2
0.3
250 650 1050 1450 1850
Wavenumber/cm-1
Inte
nsity
/Arb
itr. U
nits B Spruce
Aspen
1272
1319
586
1308
1270
G- vs. S-MWL SERS
2

0
0.1
0.2
0.3
0.4
0.5
0.6
250 450 650 850 1050 1250 1450 1650 1850
Wavenumber/cm-1
Inte
nsity
/Arb
itr. U
nits
WMW 40 meshMWLKraft pulp
3Differences in lignin SERS of wood, MWL and Unbl. KP
Conclusions
• SERS of MWL, WMW and Unbl. KP were obtained
• Lignin can be selectively detected without separation
• As little as 10 μ gram of lignin can be detected• Lignin is chemisorbed on Ag• G- and S-lignins were easily distinguished• Models work - insights on structural attributes
important in SERS

Rick ReinerJim BeecherSally RalphTom Kuster
Published Online: May 6, 2009 J. Raman SpectroscopyDOI: 10.1002/jrs.2294