raman spectroscopy · 1 raman spectroscopy is a popular technique for the analysis of molecular...
TRANSCRIPT
RAMAN SPECTROSCOPY
JASCO: The Japan Spectroscopic Company –
advancing science with innovation in optical spectroscopy.
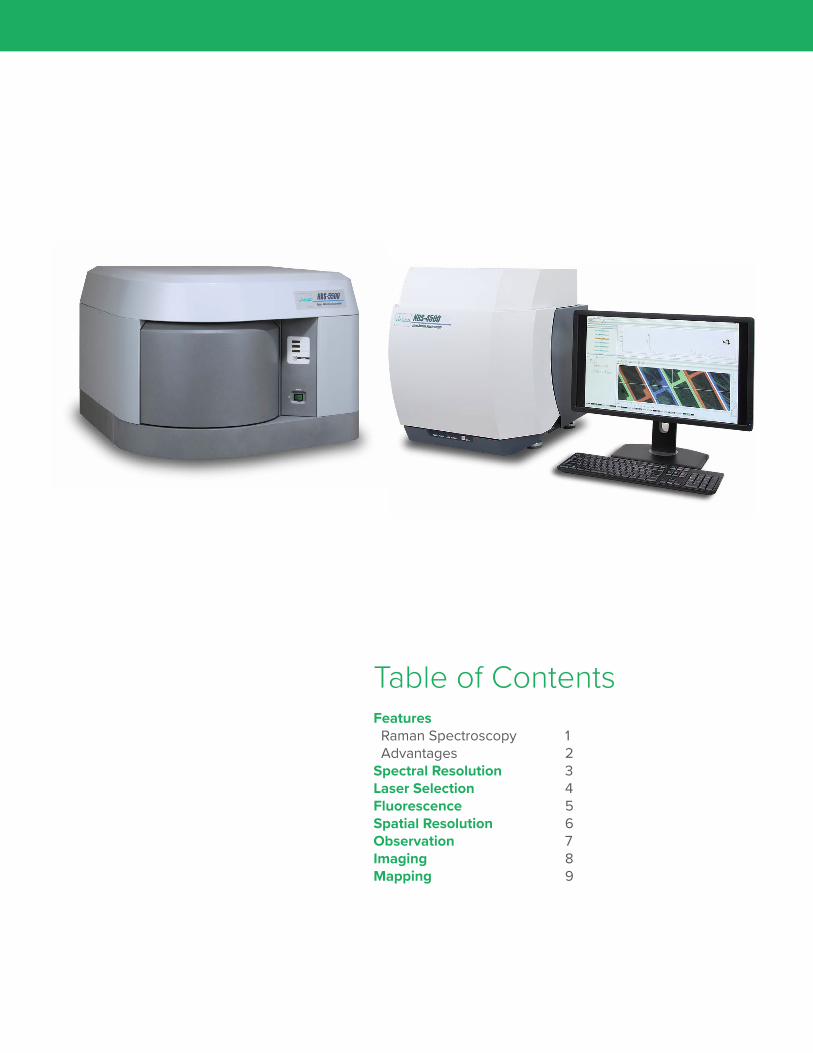
Table of ContentsFeatures Raman Spectroscopy 1 Advantages 2Spectral Resolution 3Laser Selection 4Fluorescence 5Spatial Resolution 6Observation 7Imaging 8Mapping 9

1
Raman spectroscopy is a popular technique for the analysis of molecular structure and is considered complementary to infrared spectroscopy. Raman spectroscopy is based on the Raman effect which was first identified by physicist Chandrasekhara Venkata Raman in 1928. The Raman effect is based on the scattering of light, which includes both elastic scatter (Rayleigh) that occurs at the same wavelength as the incident light and inelastic scatter (Raman) at different wavelengths, due to molecular bond vibration. Raman scatter is about a million times less intense than Rayleigh scatter. Therefore, to obtain Raman spectra, it is necessary to prevent the Rayleigh scatter overpowering the weaker Raman scatter.
In a typical Raman spectrometer, spectra are measured by exciting the sample by a high intensity laser, with the resulting scattered light being passed to a spectrograph. The Raman shift is the energy difference between the incident light and scattered light. In the resulting spectrum the vertical axis is the intensity of the scattered light and the horizontal axis is the frequency of the Raman shift (cm-1) in the spectrum.
The Raman shift includes two types of energy bands.The wavelengths observed in a frequency region lower than the incident light is described as Stokes scattering. The wavelengths observed in the higher frequency region is anti-Stokes scattering. As an example, the Raman spectrum of sulfur measured with an excitation wavelength of 532 nm (green laser) is shown. Centering on the high intensity Rayleigh scattering, Stokes scatter is observed in the lower wavenumber region and the anti-Stokes in the higher wavenumber region. In Raman spectroscopy, typically the Stokes scattering with greater intensity is used for analysis, but anti Stokes can also be used.
Figure 1. Molecular vibration
Figure 2. Raman spectrum of sulfur
2
Advantages of Raman Sampling There are a number of significant advantages in Raman measurement (compared with other spectroscopic or optical microscopy techniques). It can be used for depth profiling and microscopic area mapping of samples with spatial resolution around 1 micron. Optical fibers with remote probes can be used for sensitive in-situ analysis. With no combinations or overtones, there is less ‘clutter’ in Raman spectra. Measurement is not sensitive to the presence of water or environmental vapor or gases. The measurement range is not limited by optical components, cells or accessories. An entire spectrum can be measured simultaneously in a wide range from 4,000 to 50 cm-1 (or even less) using a spectrograph with CCD detector. Measurement can be made for opaque or cloudy samples, and directly through glass or plastic containers making sample preparation much simpler.
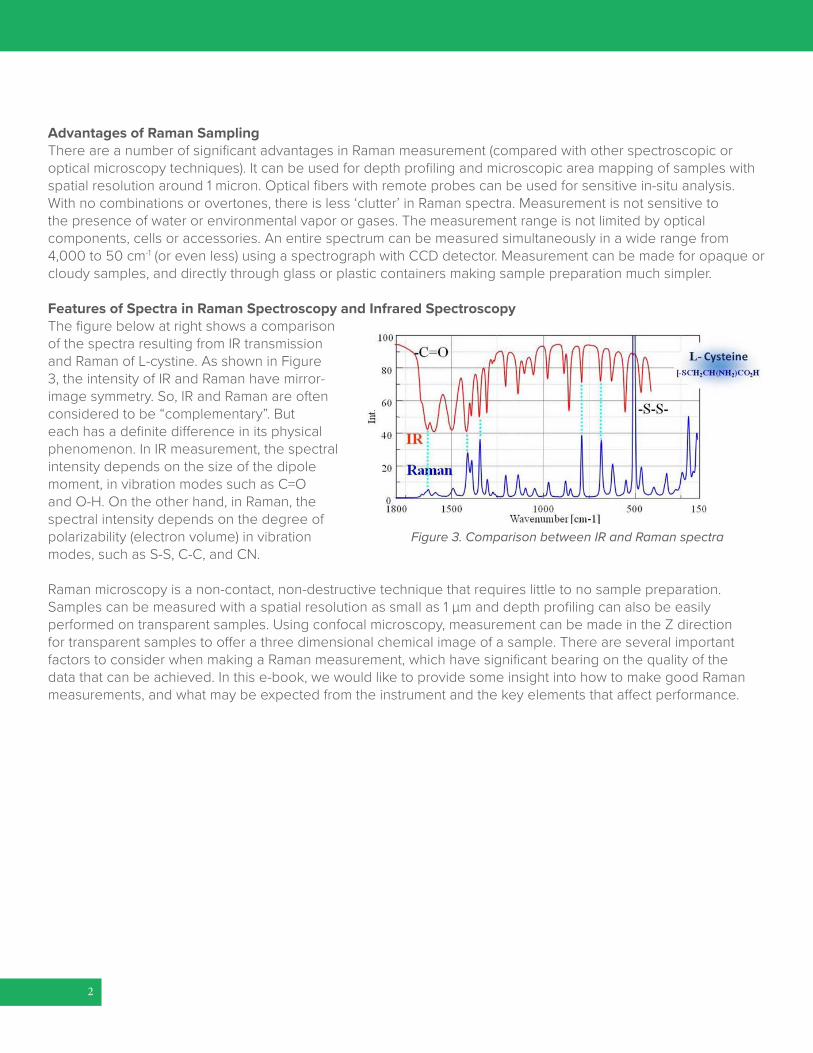
Features of Spectra in Raman Spectroscopy and Infrared SpectroscopyThe figure below at right shows a comparison of the spectra resulting from IR transmission and Raman of L-cystine. As shown in Figure 3, the intensity of IR and Raman have mirror-image symmetry. So, IR and Raman are often considered to be “complementary”. But each has a definite difference in its physical phenomenon. In IR measurement, the spectral intensity depends on the size of the dipole moment, in vibration modes such as C=O and O-H. On the other hand, in Raman, the spectral intensity depends on the degree of polarizability (electron volume) in vibration modes, such as S-S, C-C, and CN.
Raman microscopy is a non-contact, non-destructive technique that requires little to no sample preparation. Samples can be measured with a spatial resolution as small as 1 µm and depth profiling can also be easily performed on transparent samples. Using confocal microscopy, measurement can be made in the Z direction for transparent samples to offer a three dimensional chemical image of a sample. There are several important factors to consider when making a Raman measurement, which have significant bearing on the quality of the data that can be achieved. In this e-book, we would like to provide some insight into how to make good Raman measurements, and what may be expected from the instrument and the key elements that affect performance.
Figure 3. Comparison between IR and Raman spectra

3
Spectral ResolutionSpectral resolution in a Raman microscope system is defined by several factors - focal length of the spectrograph, number of lines on the grating and resolution of the elements in the detector. Focal length is the distance between the focusing mirror and the detector, longer focal length provides greater resolution. The grating is an optical component that consists of periodic grooves at a specific angle (blaze angle) to match the wavelength of the excitation laser. Resolution increases with a greater numbers of lines. The specification is typically described by the lines or groove per millimeter on the surface (a common grating is 900 gr/mm) and the blaze wavelength. It is not possible to keep increasing the number of grooves to increase the spectral resolution, there is a physical limitation. Light striking the grating surface is dispersed following the Huygens–Fresnel principle.
The last factor that influences spectral resolution is the pixel dimension in the CCD detector, the smaller the pixel size, the greater the spectral resolution.
Sensitivity and Detection (EMCCD)A charge coupled device (CCD) is the most commonly used detector in Raman microscopy. It is a highly sensitive photon detector, an image is constructed from the signal collected from the pixels, which are discrete small sensitive regions on the detector surface. Smaller pixel dimensions offer higher spectral resolution, but this has to be weighed against slightly reduced sensitivity. Electron multiplied detectors (EMCCD) are also used and offer sensitivity at up to 50 times that of conventional CCD detectors. For measurement in the near IR, CCD detectors are not sufficiently sensitive, so that InGaAs array detectors are use instead.
Figure 4. Schematic of dispersion with focal length Figure 5. Angular dispersion
+
Detector option
EMCCD exposure < 50msFigure 6. CCD Detector
4
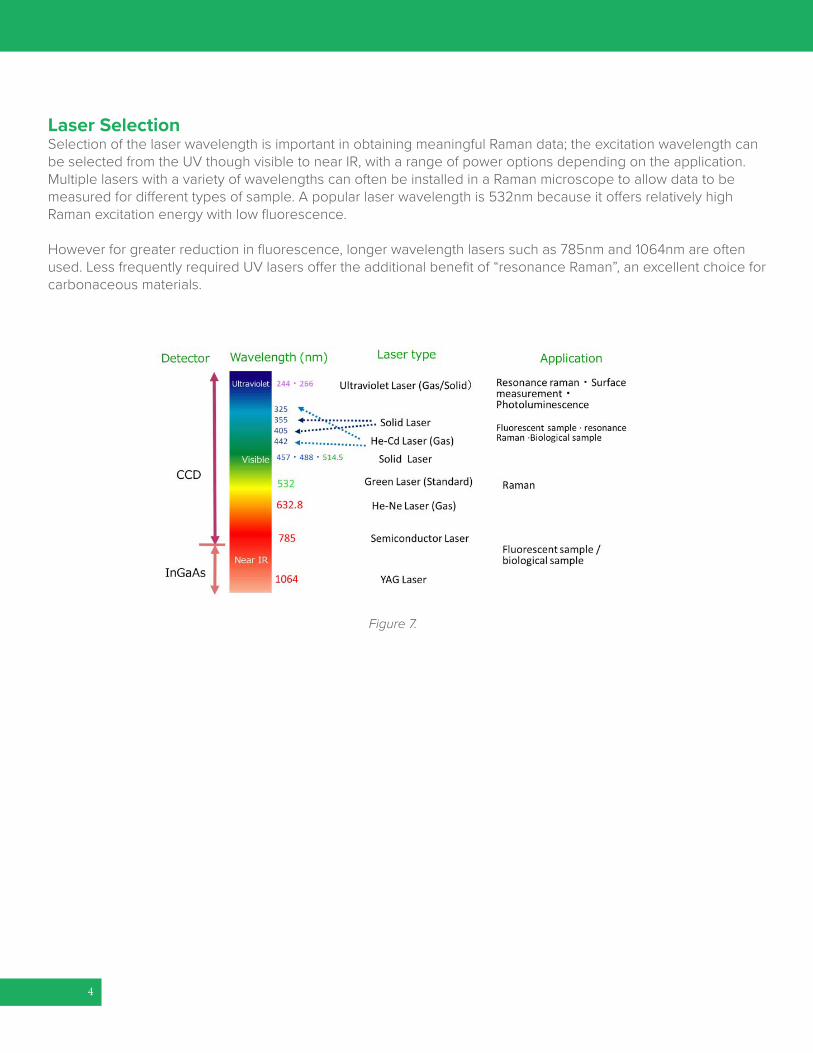
Laser SelectionSelection of the laser wavelength is important in obtaining meaningful Raman data; the excitation wavelength can be selected from the UV though visible to near IR, with a range of power options depending on the application. Multiple lasers with a variety of wavelengths can often be installed in a Raman microscope to allow data to be measured for different types of sample. A popular laser wavelength is 532nm because it offers relatively high Raman excitation energy with low fluorescence.
However for greater reduction in fluorescence, longer wavelength lasers such as 785nm and 1064nm are often used. Less frequently required UV lasers offer the additional benefit of “resonance Raman”, an excellent choice for carbonaceous materials.
Figure 7.
5
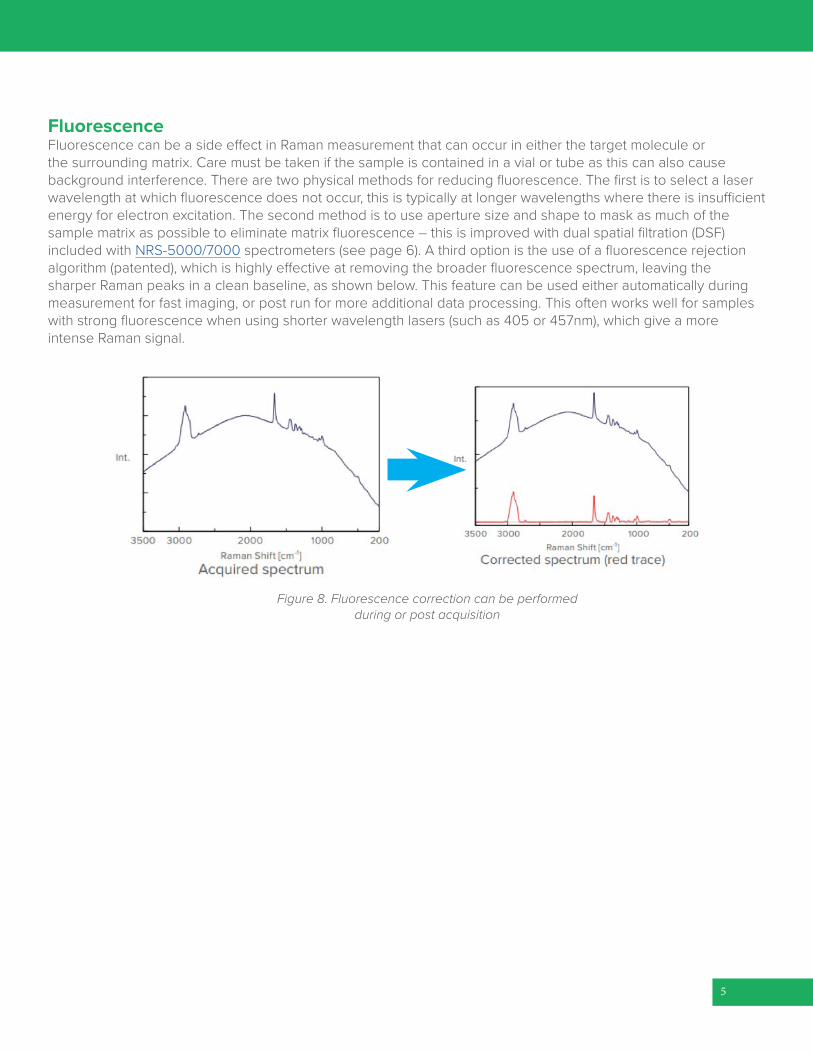
FluorescenceFluorescence can be a side effect in Raman measurement that can occur in either the target molecule or the surrounding matrix. Care must be taken if the sample is contained in a vial or tube as this can also cause background interference. There are two physical methods for reducing fluorescence. The first is to select a laser wavelength at which fluorescence does not occur, this is typically at longer wavelengths where there is insufficient energy for electron excitation. The second method is to use aperture size and shape to mask as much of the sample matrix as possible to eliminate matrix fluorescence – this is improved with dual spatial filtration (DSF) included with NRS-5000/7000 spectrometers (see page 6). A third option is the use of a fluorescence rejection algorithm (patented), which is highly effective at removing the broader fluorescence spectrum, leaving the sharper Raman peaks in a clean baseline, as shown below. This feature can be used either automatically during measurement for fast imaging, or post run for more additional data processing. This often works well for samples with strong fluorescence when using shorter wavelength lasers (such as 405 or 457nm), which give a more intense Raman signal.
Figure 8. Fluorescence correction can be performed during or post acquisition
6
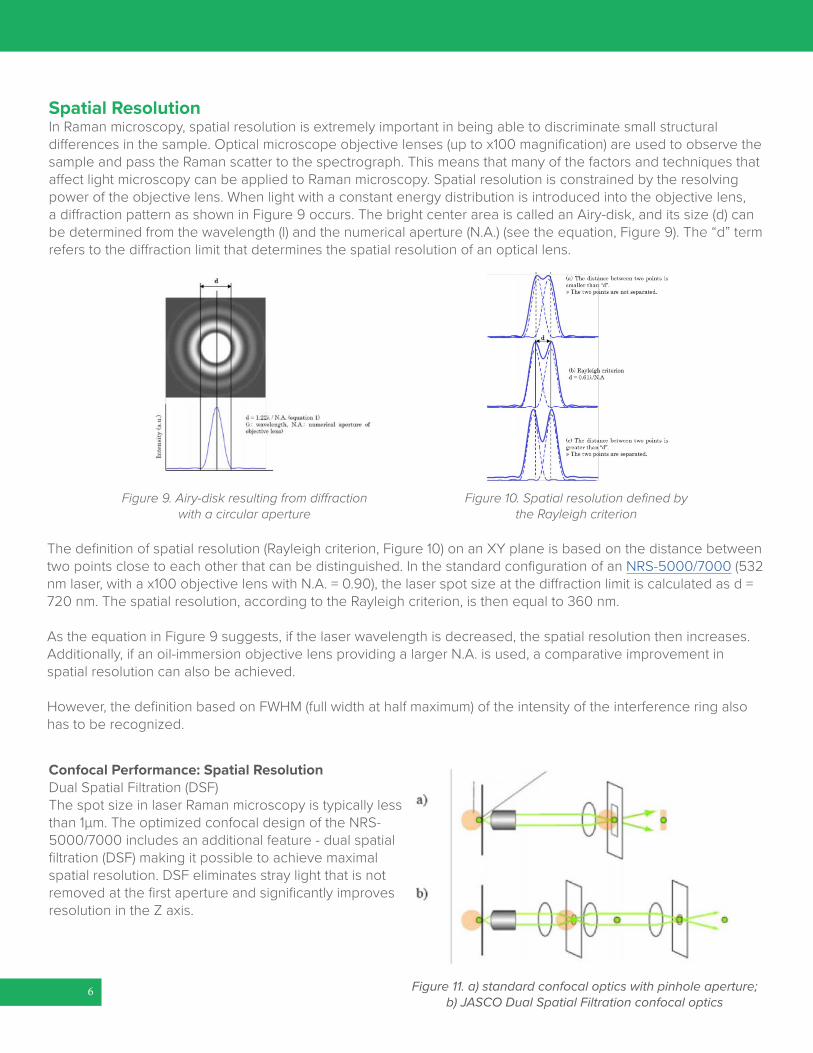
Spatial ResolutionIn Raman microscopy, spatial resolution is extremely important in being able to discriminate small structural differences in the sample. Optical microscope objective lenses (up to x100 magnification) are used to observe the sample and pass the Raman scatter to the spectrograph. This means that many of the factors and techniques that affect light microscopy can be applied to Raman microscopy. Spatial resolution is constrained by the resolving power of the objective lens. When light with a constant energy distribution is introduced into the objective lens, a diffraction pattern as shown in Figure 9 occurs. The bright center area is called an Airy-disk, and its size (d) can be determined from the wavelength (l) and the numerical aperture (N.A.) (see the equation, Figure 9). The “d” term refers to the diffraction limit that determines the spatial resolution of an optical lens.
The definition of spatial resolution (Rayleigh criterion, Figure 10) on an XY plane is based on the distance between two points close to each other that can be distinguished. In the standard configuration of an NRS-5000/7000 (532 nm laser, with a x100 objective lens with N.A. = 0.90), the laser spot size at the diffraction limit is calculated as d = 720 nm. The spatial resolution, according to the Rayleigh criterion, is then equal to 360 nm.
As the equation in Figure 9 suggests, if the laser wavelength is decreased, the spatial resolution then increases. Additionally, if an oil-immersion objective lens providing a larger N.A. is used, a comparative improvement in spatial resolution can also be achieved.
However, the definition based on FWHM (full width at half maximum) of the intensity of the interference ring also has to be recognized.
Figure 10. Spatial resolution defined by the Rayleigh criterion
Figure 9. Airy-disk resulting from diffraction with a circular aperture
Figure 11. a) standard confocal optics with pinhole aperture; b) JASCO Dual Spatial Filtration confocal optics
Confocal Performance: Spatial ResolutionDual Spatial Filtration (DSF)The spot size in laser Raman microscopy is typically less than 1µm. The optimized confocal design of the NRS-5000/7000 includes an additional feature - dual spatial filtration (DSF) making it possible to achieve maximal spatial resolution. DSF eliminates stray light that is not removed at the first aperture and significantly improves resolution in the Z axis.
7
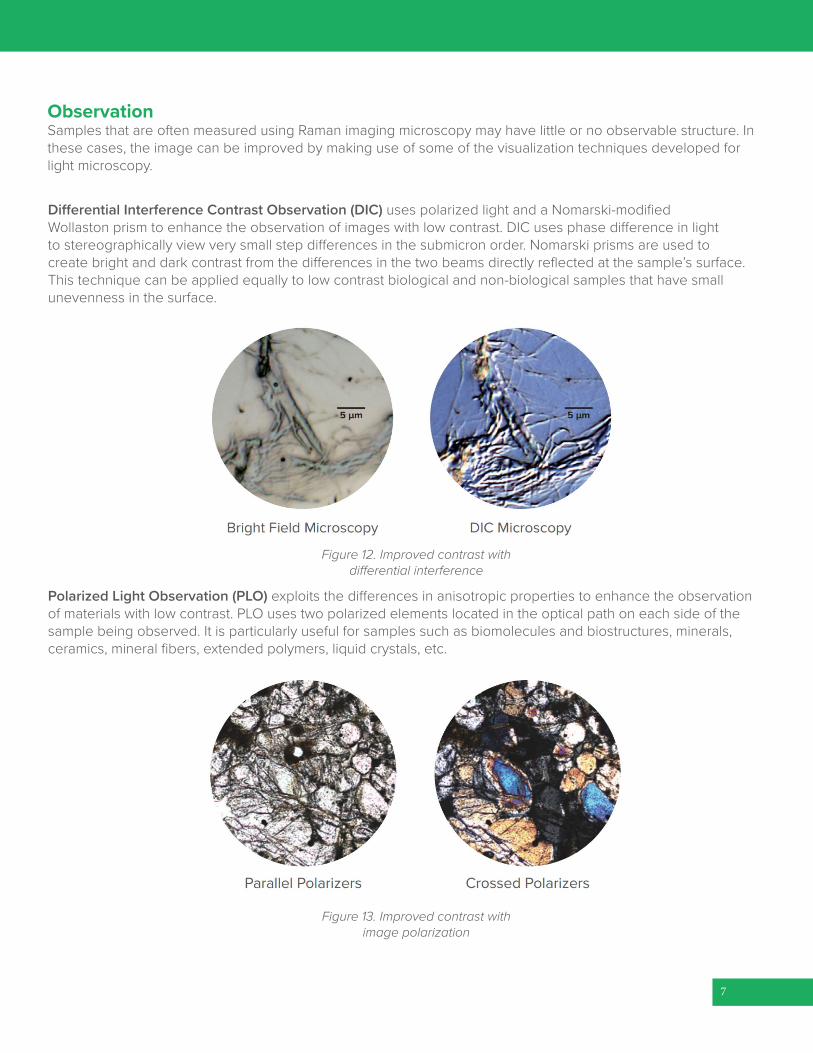
Differential Interference Contrast Observation (DIC) uses polarized light and a Nomarski-modified Wollaston prism to enhance the observation of images with low contrast. DIC uses phase difference in light to stereographically view very small step differences in the submicron order. Nomarski prisms are used to create bright and dark contrast from the differences in the two beams directly reflected at the sample’s surface. This technique can be applied equally to low contrast biological and non-biological samples that have small unevenness in the surface.
Polarized Light Observation (PLO) exploits the differences in anisotropic properties to enhance the observation of materials with low contrast. PLO uses two polarized elements located in the optical path on each side of the sample being observed. It is particularly useful for samples such as biomolecules and biostructures, minerals, ceramics, mineral fibers, extended polymers, liquid crystals, etc.
ObservationSamples that are often measured using Raman imaging microscopy may have little or no observable structure. In these cases, the image can be improved by making use of some of the visualization techniques developed for light microscopy.
Figure 12. Improved contrast with differential interference
Figure 13. Improved contrast with image polarization

8
Raman Imaging Raman imaging is a powerful technique that provides information about spatial distribution in 3D as well as chemical identification. Small or large sample areas in the order of micrometers to millimeters can be measured and imaged in times as short as a few minutes. JASCO developed QRI, a technology that increases the data acquisition speed by up to 50 times compared with conventional mapping and also offers a dramatic improvement in sensitivity.
Speed and sensitivity of QRi Raman imaging are achieved with:• A high-speed XYZ automated stage with step resolution OF ONLY 0.1 μm• A high sensitivity electron multiplied EMCCD in place of the conventional CCD
Figure 14. Examples of small and large mapping areas

9
Creation of Raman Mapping ImagesUsing conventional software, experience is required to create a good color distribution map, but using Spectra Manager™ analysis wizard it is possible to create clear and informative distribution images. The wizard provides recommendations at each step in the data processing to completely automate the process. The Raman spectral data is truncated to a range of interest, noise reduction and baseline correction applied, with multivariate curve reduction (MCR) chemometric modeling used to create the mapped image. Enhanced post processing algorithms for faster noise reduced data analysis includes digital filtration and spectral averaging.
Figure 15. Depth profile of a packaging laminate with microscopic image and chemical distribution
Polypropylene (PP)
Polyethylene (PE)
Cellulose (CEL)
Polyamide (PA)
Polyurethane (PUR)
3700 200Raman Shift [cm-1]
Layer 1 (28.8μm)Layer 2 (3.0μm)Layer 3 (23.7μm)Layer 4 (2.4μm)
Layer 7 (30.0μm)
Layer 6 (44.2μm)
Layer 5 (23.4μm)
Layer 8 (30.9μm)
Distribution
PP PE PAPURCEL
Cross-section image

10
Automated Sample Search for Particles and Powder Samples One of the most time consuming aspects of Raman microscopy is identifying the measurement location in the sample. This can be done quickly for samples that require distribution analysis by using 2D or 3D matrices, with measurement made at repeating intervals. However, for randomly arranged samples the user has to select each position by searching the microscopic image and individually selecting the point of interest. The Sample Search function in Spectra Manager™ is used for particulate or powder samples to automatically analyze the microscopic image and identify the position based on size, contrast and/or color of the target defined by the user. Simply click the start button to execute spectral acquisition and the stage is automatically positioned for optimized spectral measurement of all identified sample points. Measurement points can be recognized in real time, allowing simul-taneous spectral acquisition with qualitative analysis. This function is recommended for foreign materials contami-nating Si wafers or polymer films, powder components of pharmaceutical samples and micro-plastics.
Locating and Measuring the Same Microscopic Region IQ Frame™Obtaining structural and spectral information from the same location on a sample of interest can be challenging, especially when trying to find it microscopically. A unique feature that can be added to any JASCO microscopy system (IR and Raman) is IQ Frame™ – this is used to find exactly the same location on the sample even when it is removed and replaced, or transferred to a different instrument. Origin coordinates are registered for the sample holder and imaging analysis is used to exactly position the sample for additional measurement.
Figure 16. Identification of random sample locations using Sample Search
Figure 17. Transfer a sample between IR to Raman microscopes Figure 18. Loading IQ Frame™

11
Correcting for Uneven and Tilted Samples High resolution measurement requires the use of high magnification objective lenses (typically 100x), these have a very short working distance and a narrow depth of field. Good spectral measurement requires the surface to be in focus to acquire the Raman scatter. In area mapping it is important to maintain good Raman efficiency across the entire region. This can be challenging and requires refocusing as the topography changes.
JASCO developed Surface Scanning Imaging (SSI) to acquire image information at various stage heights to synthesize a three-dimensional ‘in-focus’ image of the entire surface topography in advance. Raman measurement is made by adjusting the stage height based on this topographical image to quickly change focus rather than resolving the focus at each measurement position. This method enables very fast mapping of uneven or tilted surfaces. In the images below the benefit of this technology can be seen when applied to samples such as pharmaceutical tablets that have uneven or rough surfaces.
Figure 19. SSI in-focus imaging
Figure 20. 3D image with chemical distribution

JASCO INTERNATIONAL CO., LTD. 11-10, Myojin-cho 1-chome, Hachioji, Tokyo 192-0046, Japan Tel: +81-42-649-3247 Fax: +81-42-649-3518 http://www.jascoint.co.jp/english/ Australia, China, Hong Kong, India, Indonesia, Japan, Korea, Malaysia, New Zealand, Pakistan, Philippines, Russia, Singapore, Taiwan, ThailandJASCO, INCORPORATED 28600 Mary’s Court, Easton, Maryland 21601, U.S.A. Tel: +1-410-822-1220 Fax: +1-410-822-7526 Web: www.jascoinc.com Argentina, Bolivia, Brazil, Canada, Chile, Colombia, Costa Rica, Guatemala, Mexico, Paraguay, Peru, Puerto Rico, United States of America, Uruguay, VenezuelaJASCO EUROPE S.R.L. Via Luigi Cadorna 1, 23894 Cremella (LC), Italy Tel: +39-039-9215811 Fax: +39-039-9215835 Web: www.jascoeurope.com JASCO Deutschland www.jasco.de | JASCO UK www.jasco.co.uk | JASCO France www.jasco.fr JASCO Benelux www.jasco.nl | JASCO Spain www.jasco-spain.com Algeria, Austria, Belgium, Cyprus, Denmark, Egypt, Finland, France, Germany, Greece, Hungary, Iran, Iraq, Israel, Italy, Jor-dan, Kuwait, Lebanon, Luxembourg, Morocco, Netherlands, Norway, Poland, Portugal, Romania, Saudi Arabia, South Africa, Spain, Sweden Switzerland, Tunisia, Turkey, United Arab Emirates, United Kingdom, Yemen BFP-1808 Printed in Japan
ISO 9001 Certified
Products described herein are designed and manufactured by ISO-
9001- and ISO-14001-certified JASCO Corporation
ISO 14001 Certified