analysis of fund flow -...
TRANSCRIPT
193
CHAPTER 6
ANALYSIS OF FUND FLOW
AND CASH FLOW
ANALYSIS OF FUND FLOW
6.1 INTRODUCTION:
One of the most fundamental objectives of business is to make a profit. Long run
survival requires that the business must be able to deal with any liquidity
problems which arise in the short term. Basically any business must be
concerned with making a profit and marinating a solvent financial position. The
financial statement of the business indicates assets, liabilities and capital on
a particular date and also the profit or loss during a period. But it is possible that
there is enough profit in the business and the financial position is also good and
still there may be deficiency of cash or of working capital in business. If the
management wants to find out as to where the cash is being utilized, financial
statement cannot help.
In the other words, the profit and loss account and balance sheet statements are
the common important accounting statements of a business organization. The
profit and loss account provides the financial information relating to only a
limited range of financial transactions entered into during an accounting period
and which have impact on the profits to be reported. The balance sheet contains
information relating to capital debt raised or assets purchased. Along with the
information about the assets and liabilities as well as the profit and loss, it is
equally important to know what funds became available during the accounting
year and how such funds were applied. This information may be obtained by
preparing a statement of source and application of funds. This statement
demonstrates the movement of funds into and out of the business during the
course during the accounting period.
194
6.2 CONCEPT OF “FUND’’:
The term ‘fund’ has been defined and interpreted differently by different experts.
Broadly the term ‘fund’ refers to all the financial resources of the company. On
the other extreme, fund has been understood as ‘cash’ only. According to the
International Accounting Standard No. 7, the term generally refers to cash, to
working capital and to cash and cash equivalents (long term financial sources).
A) Fund means cash: Under this concept, the term “funds” is used only in
the sense of cash and bank balance. Here, only the changes in cash and
bank are considered. Hence, the statement is called “Cash Flow statement.
This statement aims at listing the various items which bring about
changes in the cash balance between two balance sheet dates. Cash
planning becomes useful for control purposes. Since cash is considered as
short term assets, they are subjected to short term fluctuations. A delay in
making payment to suppliers and a provision of one month’s credit for
making a payment of land purchases may show sufficient cash flow. They
may reflect a satisfactory position, but it is not a reality. Therefore, cash
equivalent concept of fund is useful only for short term financial planning
and not for long term. Thus cash and bank is one part of fund.
B) Fund means Working Capital: Working capital is the excess of current
assets over current liabilities. It means working capital = Current asserts -
current liabilities. It is an alternative measure of the changes in the
financial position. All those transactions which increase or decrease
working capital are included in this statement. It excludes all such items
which do not affect the working capital. The working capital concept of
funds is in conformity with normal accounting procedures. Hence, a funds
flow statement based on this concept fits well with the other statements.
Moreover, working capital is also a measure of short term liquidity of the
firm. Therefore, an analysis of factors bringing about a change in the
amount of net working capital is useful for decision making by
shareholders, creditors and management. Due to these reasons, the
working capital approach to funds is more useful than the cash approach.
195
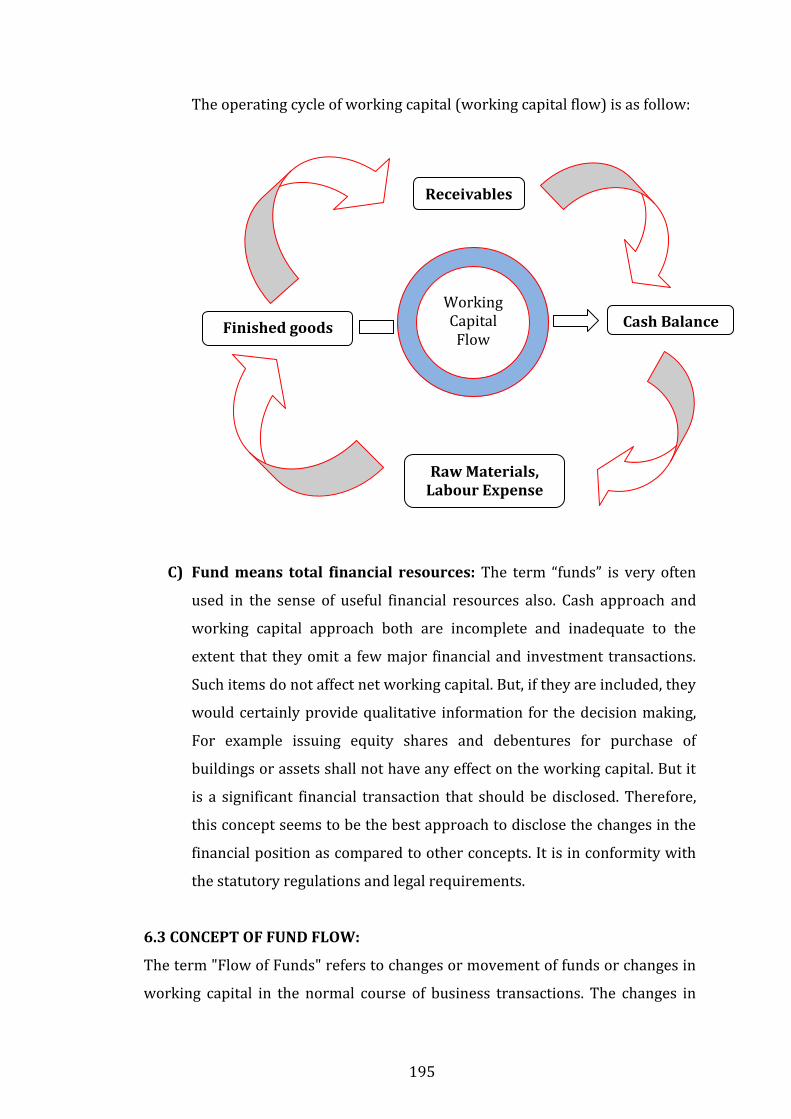
The operating cycle of working capital (working capital flow) is as follow:
C) Fund means total financial resources: The term “funds” is very often
used in the sense of useful financial resources also. Cash approach and
working capital approach both are incomplete and inadequate to the
extent that they omit a few major financial and investment transactions.
Such items do not affect net working capital. But, if they are included, they
would certainly provide qualitative information for the decision making,
For example issuing equity shares and debentures for purchase of
buildings or assets shall not have any effect on the working capital. But it
is a significant financial transaction that should be disclosed. Therefore,
this concept seems to be the best approach to disclose the changes in the
financial position as compared to other concepts. It is in conformity with
the statutory regulations and legal requirements.
6.3 CONCEPT OF FUND FLOW:
The term "Flow of Funds" refers to changes or movement of funds or changes in
working capital in the normal course of business transactions. The changes in
Receivables
Finished goods Cash Balance
Raw Materials, Labour Expense
Working Capital Flow
196
working capital may be in the form of inflow of working capital or outflow of
working capital. In other words, any increase or decrease in working capital
when the transactions take place is called as "Flow of Funds." If the components
of working capital results in increase of the fund, it is known as Inflow of Fund or
Sources of Fund. Similarly, if the components of working capital effects in
decreasing the financial position it is treated as Outflow of Fund. For example, if
the fund raised by way of issue of shares will be taken as a source of fund or
inflow of fund. This transaction results in increase of the financial position. Like
this, the fund used for the purchase of machinery will be taken as application or
use of fund or outflow of fund, because it stands to reduce the fund position.
Increase the funds while others decrease the funds. Some may not make any
change in the funds position. In case a transaction results in increase of funds, it
will be termed as a “sources of funds”. In case a transaction results in decrease of
funds it will be taken as an application or use of funds. In case a transaction does
not make any change in the funds position, it is said that it is a non-fund
transaction.
According to R.N. Anthony, “Fund Flow is a statement prepared to indicate the
increase in cash resources and the utilization of such resources of a business
during the accounting period.”
According to Smith Brown, “Fund Flow is prepared in summary form to
indicate changes occurring in items of financial condition between two different
balance sheet dates.”
No Flow of Funds:
Some transactions may not make any movement or changes in the fund position.
Such transactions are involved within the business concern. Like the transaction
which involves both between current assets and current liabilities and between
non-current assets and non-current liabilities and hence do not result in the flow
of funds. For example, conversion of shares in to debenture. Such transaction
197
involves between non-current accounts only and this activity does not effect in
increase or decrease of the working capital position.
6.4 CONCEPT OF FUND FLOW STATEMENT:
It is a statement showing the movement of funds into and out of business. In
other words it is a statement showing sources and application of fund. A fund
flow statement deals with the financial resources required for running the
business activities. It explains how were the funds obtained and how were they
used.
A fund flow statement matches the funds raised and funds applied during a
particular period. The sources and applications of fund may be of capital as well
as of revenue nature. A fund flow statements provide a meaningful link between
the balance sheets at the beginning and at the end of the period and profit and
loss account of the period. In view of recognized importance of capital inflows
and outflows which often involve large amount of money should be reported to
stake holders, the fund flow statement is devised.
In the words of Dr. Shailesh Ransariya, “Funds flow statement is a modern
technique of analyzing financial statement. Fund flow statement shows as to where
have the funds come from and where have they been used during the accounting
period. It helps in analyzing the movement of funds of a firm between the two
balance sheet dates.”
As per Foulk point of view “A statement of sources and applications of fund is a
technical device deigned to analyze the changes in the financial condition of a
business enterprise between two dates.”
In the words of Anthony, “The fund flow statement describes the sources from
which additional funds were derived and the uses to which these sources were
put.”
198
The I.C.W.A. in glossary of management accounting terms defines fund flow
statement as “a statement prospective or retrospective, setting out the sources
and applications of the funds of an enterprise. The purpose of this statement is to
indicate clearly the requirement of funds and how they are proposed to be raised
and the efficient utilization and application of the same.”
6.5 OBJECTIVES OF FUNDS FLOW STATEMENT:
The main objectives of the fund flow statement are:
(1) Helpful in finding the answer to some important financial question:-
A fund flow statement is prepared to give satisfactory answer to the
following question:-
(a) What have been the main source and application of funds during
the period?
(b) How much funds have been generated from business operations?
(c) Where did the profits go?
(d) Why where dividends not larger?
(e) How was it possible to distribute dividends in excess of current
earning or in the presence of net loss for the period?
(f) Why the net current assets are up even though there is a net loss
for the period?
(g) How was the expansion in plant and equipment financed?
(h) How was the repayment of long term debt accomplished?
(i) How was the increase in working capital financed?
(2) Helpful in financial analysis:- A fund flow statement provides a complete
analysis of the financial position of a firm.
(3) It provides more reliable figures of profit and loss of the business:- It
gives much more reliable figure of the profits of the business than the figures
shown by P/L account because the figure of profit shown by P/L account is
affected by the personal decision of management in deciding the amount of
depreciation and other adjustments regarding the writing off preliminary
expanses etc.
199
(4) It enables to know whether the funds have been properly used:- The
funds flow statement enables the management to know whether the funds
have been properly used in purchasing various assets or repaying loans etc.
(5) Helpful in proper management of working capital:- While managing
working capital in a business, it becomes essential to ensure that it should
neither be excessive nor inadequate. A fund flow statement indicates the
excessiveness or inadequacy in working capital.
(6) Helps in preparation of budget for the next period:- A fund flow
statement is prepared for next year, it will enable the management to plan
its financial resources properly. The firm will know how much funds it
requires, how much the firm can manage internally and how much it should
arrange from outside source. This is helpful in preparing the budgets for the
future period.
(7) It helps a firm in borrowing operations:- A fund flow statement prepared
for the future period indicates whether the company will have sufficient
funds to repay the interest & loans in time.
(8) Helpful in determining dividend policy: - Sometimes, there may be
sufficient profit but the distribution of dividend may not be possible due to
its adverse effect on the liquidity and working capital of the business. in such
cases a funds flow statement help in leading whether to distribute the
dividend or not because a funds flow statement will reveal from where and
how much funds can be managed for distributing the dividends.
(9) Useful to shareholders:- Shareholders also get information about the
financial policies of the enterprise with the help of fund flow statement.
6.6 SOURCES AND USES (APPLICATIONS) OF FUNDS:
Since a fund flow statement describes the varies sources and uses of funds, it is
imperative that one should know the varies sources and uses of funds:
Sources of funds:
Generally funds are derived from:
1. Operating of business i.e. operating income
2. Income from investment
200
3. Sale of assets
4. Sale of long term investments
5. Contribution of share holders
6. Increase in long term liabilities, e.g., issue of debentures
7. Gifts, damages awarded in legal action etc.
Uses (Applications) of funds:
Generally funds are utilized to:
8. Operating loses
9. Repayment of long term loan and debentures
10. Redemption of preference share capital
11. Payment of cash dividends
12. Purchase of fixed assets
13. Purchase of long term investments
Loss of cash by embezzlement costs in legal action etc.
6.7 IMPORTANCE/SIGNIFICANCE OF FUND FLOW STATEMENT:
Fund flow statement is a useful tool in the financial managers’ analytical kit. The
basic propose of this statement is to indicate where funds came from and where
it was used during certain period. Following are the uses of this which show its
importance:
[1] Fund flow statement determines the financial consequences of
business operations. It shows how the funds were obtained and
used in the past. Financial manager can take corrective actions.
[2] The management can formulate its financial policies – dividend,
reserve etc. on the basis of the statement.
[3] It serves as a control device, when comparing with budgeted
figures. The financial manager can take remedial steps, if there is
any deviation.
[4]Other points:
1. It points out the sound and weak financial position of the
enterprise.
2. It points out the causes for changes in working capital.
201
3. It enables the Bankers, creditors or financial institutions in
assessing the degree of risk involved in granting credit to the
business.
4. The management can rearrange the firm’s financing more
effectively on the basis of the statement.
5. Various uses of funds can be known and after comparing them
with the uses of previous years, improvement or downfall in
the firm can be assessed.
6. It provides a basis for preparation budgets for the future.
7. The statement compared with the budget concerned will show
to what extent the resources of the firm were used according
to plan and what extent the utilization was unplanned.
8. It tells whether sources of funds are increasing or decreasing
or constant.
9. It points out the financial strengths and weaknesses of the
business.
10. It helps in working capital management of the company.
11. It appraises the shareholders regarding the uses of funds in
the business.
6.8 LIMITATION OF FUND FLOW STATEMENT:
The main limitations of fund flow statement are as under:
(1) The statement lacks originality because it is only rearrangement of
data appearing in account books
(2) It indicates only the past position and not future.
(3) It indicates Fund flow a summary form and it does not show
various changes which take place continuously.
(4) When both the aspects of a transaction are current, they are not
considered.
(6) When both the aspects of a transaction are non- current, even then
they are not included in this statement.
(6) It is not an ideal tool for financial analysis.
202
(7) It is not an original statement but simply a rearrangement of two
statements or financial data.
(8) It is not a substitute of income statement or a balance sheet. It is
only a supplement to them.
6.9 COMPONENTS OF FLOW OF FUNDS:
In order to analyze the sources and application of funds, it is essential to know
the meaning and components of flow of funds given below:
(l) Current Assets
(2) Non-Current Assets (Fixed or Permanent Assets)
(3) Current Liabilities
(4) Non-Current Liabilities (Capital & Long-Term Liabilities)
(5) Provision for Tax
(6) Proposed Dividend
1. Current Assets: The term "Current Assets" refer to the assets of a
business of a transitory nature which are intended for resale or
conversion into different form during the course of business operations.
For example, raw materials are purchased and the amount unused at the
end of the trading period forms part of the current as stock on hand.
Materials· in process at the end of the trading period and the labour
incurred in processing them also form part of current assets.
2. Non-Current Assets (Permanent Assets): Non-Current Assets also refer
to as Permanent Assets or Fixed Assets. These classes of asset include
those of tangible and intangible nature having a specific value and which
are not consumed during the course of business and trade but provide the
means for producing saleable goods or providing services. Land and
Building, Plant and Machinery, Goodwill and Patents etc. are the few
examples of Non-Current assets.
3. Current Liabilities: The term Current Liabilities refer to amount owing
by the business which are currently due for payment. They consist of
203
amount owing to creditors, bank loans due for repayment, proposed
dividend and proposed tax for payment and expenses accrued due.
4. Non-Current Liabilities: The term Non-Current Liabilities refer to
Capital and Long-Term Debts. It is also called as Permanent Liabilities.
Any amount owing by the business which are payable over a longer
period time, i.e., after a year are referred as Non-Current Liabilities.
Debenture, long-term loans and loans on mortgage etc., are the few
examples of non-current liabilities.
5. Provision for Taxation: Provision for taxation may be treated as a
current liability or an appropriation of profit. When it is made during the
year it is not used for adjusting the net profit, it is advisable to treat the
same as current liability. Any amount of tax paid during the year is to be
treated as application of funds or non-current liability. Because it is used
for adjusting the net profit made during the year.
6. Proposed Dividend: Like provision for taxation, it is also treated as a
current liability and noncurrent liability, when dividend may be
considered as being declared. And thus, it will not be used for adjusting
the net profit made during the year. If it is treated as an appropriation, i.e.,
an non-current liability when the dividend paid during the year.
7. Provisions Against Current Assets and Current Liabilities: Provision
for bad and doubtful debts, provision for loss on inventories, provision for
discount on creditors and provision made against investment etc. are
made during the year, they may be treated separately as current assets or
current liabilities or reduce the same from the respective gross value of
the assets or liabilities.
6.10 ANALYSIS OF FUND FLOW:
204
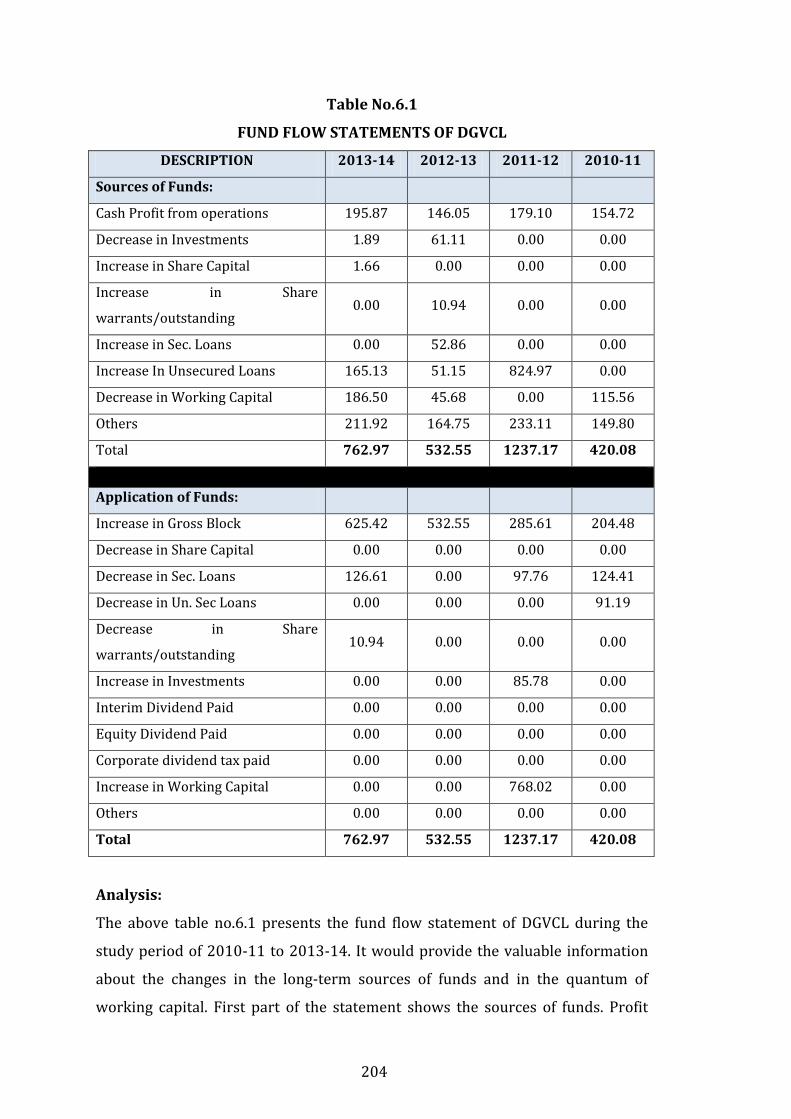
Table No.6.1
FUND FLOW STATEMENTS OF DGVCL
DESCRIPTION 2013-14 2012-13 2011-12 2010-11
Sources of Funds:
Cash Profit from operations 195.87 146.05 179.10 154.72
Decrease in Investments 1.89 61.11 0.00 0.00
Increase in Share Capital 1.66 0.00 0.00 0.00
Increase in Share
warrants/outstanding 0.00 10.94 0.00 0.00
Increase in Sec. Loans 0.00 52.86 0.00 0.00
Increase In Unsecured Loans 165.13 51.15 824.97 0.00
Decrease in Working Capital 186.50 45.68 0.00 115.56
Others 211.92 164.75 233.11 149.80
Total 762.97 532.55 1237.17 420.08
Application of Funds:
Increase in Gross Block 625.42 532.55 285.61 204.48
Decrease in Share Capital 0.00 0.00 0.00 0.00
Decrease in Sec. Loans 126.61 0.00 97.76 124.41
Decrease in Un. Sec Loans 0.00 0.00 0.00 91.19
Decrease in Share
warrants/outstanding 10.94 0.00 0.00 0.00
Increase in Investments 0.00 0.00 85.78 0.00
Interim Dividend Paid 0.00 0.00 0.00 0.00
Equity Dividend Paid 0.00 0.00 0.00 0.00
Corporate dividend tax paid 0.00 0.00 0.00 0.00
Increase in Working Capital 0.00 0.00 768.02 0.00
Others 0.00 0.00 0.00 0.00
Total 762.97 532.55 1237.17 420.08
Analysis:
The above table no.6.1 presents the fund flow statement of DGVCL during the
study period of 2010-11 to 2013-14. It would provide the valuable information
about the changes in the long-term sources of funds and in the quantum of
working capital. First part of the statement shows the sources of funds. Profit
205
from operations shows the mixed trend during the study period. It is ranged
between 146.05 in 2012-13 and 195.87 in 2013-14. The company has sold the
investments during last two years of the study period. Company has issued
additional share capital 1.66 crore in 2013-14. Again it shows that company has
taken a secured loan of 52.86 in the year 2012-13. Company has borrowed huge
amount in form unsecured loan in the year 2011-12, 2012-13 and 2013-14.
824.97% increase in unsecured loan in 2011-12 as compare to 2010-11. Amount
in working capital was also decreased in the year 2010-11, 2012-13 and 2013-
14.
Second part of the statement shows the application of funds. Company has
purchased the fixed assets of Rs.204.48 crore, Rs.285.61 crore, Rs.532.55 crore
and Rs.625.42 crore in the year 2010-11, 2011-12, 2012-13 and 2013-14
respectively. It shows the progressive trends during the study period. 86.46%
increase in fixed assets in 2012-13 as compare to the year 2011-12. Company
has repaid the secured loans in the year 2010-11, 2011-12 and 2013-14.
Company’s working capital was increased of Rs.768.02 crore in the year 2011-
12. Company has invested Rs.85.78 crore in investments in the year 2011-12.
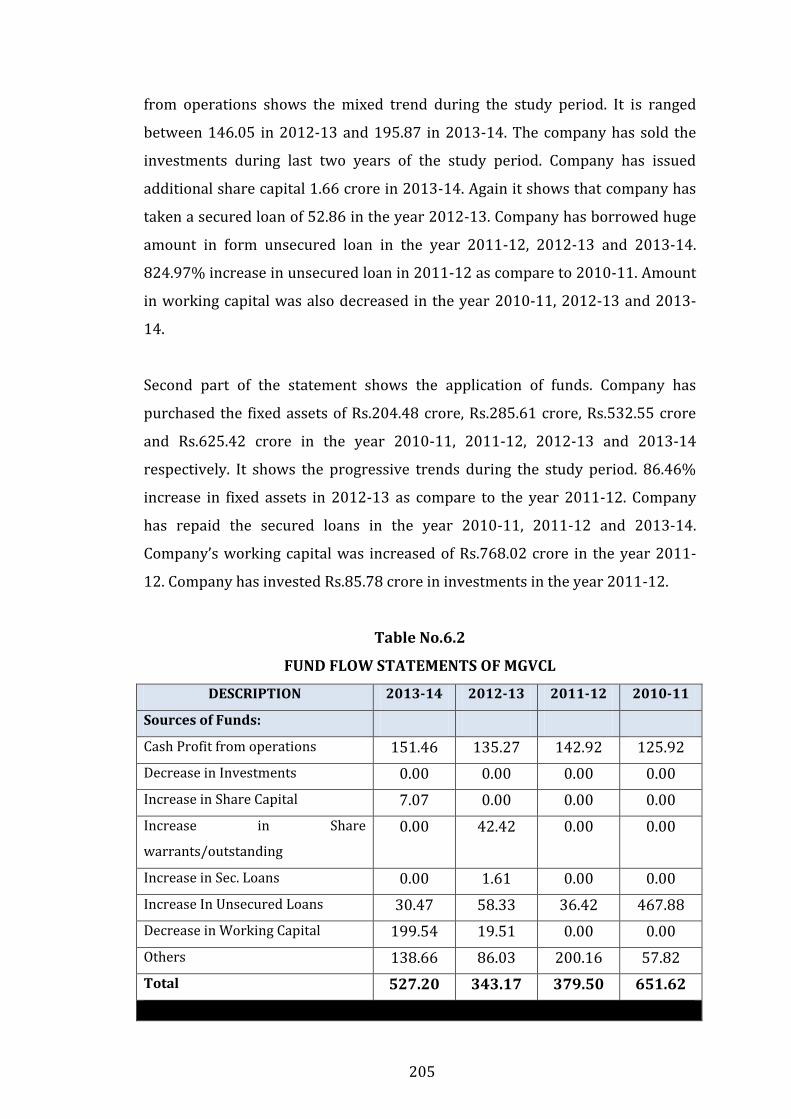
Table No.6.2
FUND FLOW STATEMENTS OF MGVCL
DESCRIPTION 2013-14 2012-13 2011-12 2010-11
Sources of Funds:
Cash Profit from operations 151.46 135.27 142.92 125.92
Decrease in Investments 0.00 0.00 0.00 0.00
Increase in Share Capital 7.07 0.00 0.00 0.00
Increase in Share
warrants/outstanding
0.00 42.42 0.00 0.00
Increase in Sec. Loans 0.00 1.61 0.00 0.00
Increase In Unsecured Loans 30.47 58.33 36.42 467.88
Decrease in Working Capital 199.54 19.51 0.00 0.00
Others 138.66 86.03 200.16 57.82
Total 527.20 343.17 379.50 651.62
206
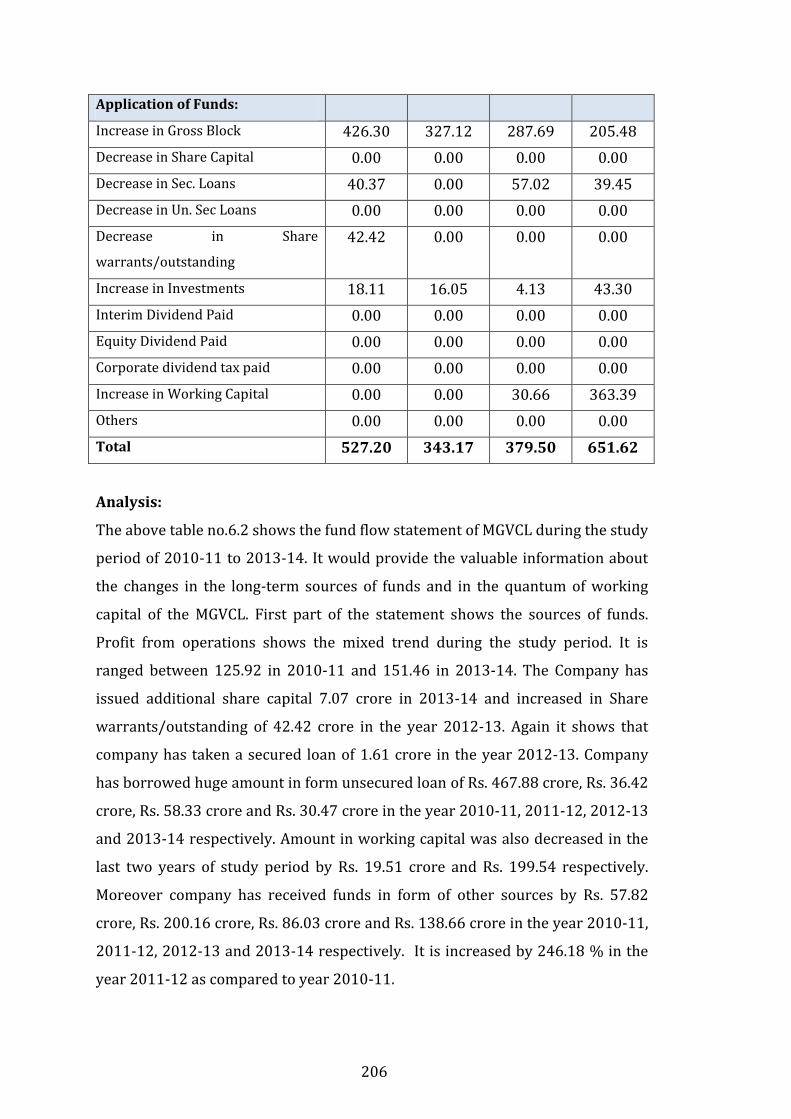
Application of Funds:
Increase in Gross Block 426.30 327.12 287.69 205.48
Decrease in Share Capital 0.00 0.00 0.00 0.00
Decrease in Sec. Loans 40.37 0.00 57.02 39.45
Decrease in Un. Sec Loans 0.00 0.00 0.00 0.00
Decrease in Share
warrants/outstanding
42.42 0.00 0.00 0.00
Increase in Investments 18.11 16.05 4.13 43.30
Interim Dividend Paid 0.00 0.00 0.00 0.00
Equity Dividend Paid 0.00 0.00 0.00 0.00
Corporate dividend tax paid 0.00 0.00 0.00 0.00
Increase in Working Capital 0.00 0.00 30.66 363.39
Others 0.00 0.00 0.00 0.00
Total 527.20 343.17 379.50 651.62
Analysis:
The above table no.6.2 shows the fund flow statement of MGVCL during the study
period of 2010-11 to 2013-14. It would provide the valuable information about
the changes in the long-term sources of funds and in the quantum of working
capital of the MGVCL. First part of the statement shows the sources of funds.
Profit from operations shows the mixed trend during the study period. It is
ranged between 125.92 in 2010-11 and 151.46 in 2013-14. The Company has
issued additional share capital 7.07 crore in 2013-14 and increased in Share
warrants/outstanding of 42.42 crore in the year 2012-13. Again it shows that
company has taken a secured loan of 1.61 crore in the year 2012-13. Company
has borrowed huge amount in form unsecured loan of Rs. 467.88 crore, Rs. 36.42
crore, Rs. 58.33 crore and Rs. 30.47 crore in the year 2010-11, 2011-12, 2012-13
and 2013-14 respectively. Amount in working capital was also decreased in the
last two years of study period by Rs. 19.51 crore and Rs. 199.54 respectively.
Moreover company has received funds in form of other sources by Rs. 57.82
crore, Rs. 200.16 crore, Rs. 86.03 crore and Rs. 138.66 crore in the year 2010-11,
2011-12, 2012-13 and 2013-14 respectively. It is increased by 246.18 % in the
year 2011-12 as compared to year 2010-11.
207
Second part of the statement shows the application of funds. Company has
purchased the fixed assets of Rs.20548 crore, Rs.287.69 crore, Rs. 327.12 crore
and Rs. 426.30 crore in the year 2010-11, 2011-12, 2012-13 and 2013-14
respectively. It shows the continuously progressive trends during the study
period of 2010-11 to 2013-14. 30.32% increase in fixed assets in 2013-14 as
compare to the year 2012-13. Company has repaid the secured loans in the year
2010-11, 2011-12 and 2013-14. Company’s working capital was increased of Rs.
363.39 crore and Rs. 30.66 in the year 2010-11 and 2011-12 respectively.
Company has purchased investment of Rs. 43.30, Rs.4.13, Rs.16.05 and Rs.18.11
crore in the year 2010-11, 2011-12, 2012-13 and 2013-14 respectively.
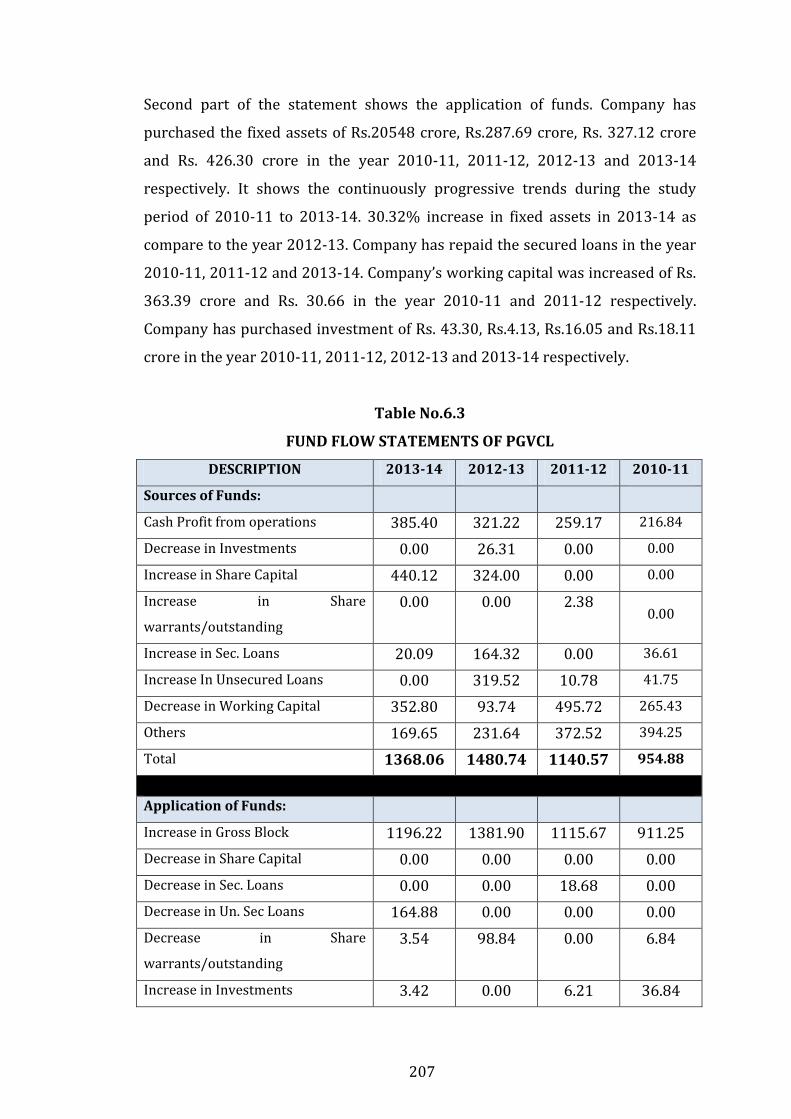
Table No.6.3
FUND FLOW STATEMENTS OF PGVCL
DESCRIPTION 2013-14 2012-13 2011-12 2010-11
Sources of Funds:
Cash Profit from operations 385.40 321.22 259.17 216.84
Decrease in Investments 0.00 26.31 0.00 0.00
Increase in Share Capital 440.12 324.00 0.00 0.00
Increase in Share
warrants/outstanding
0.00 0.00 2.38 0.00
Increase in Sec. Loans 20.09 164.32 0.00 36.61
Increase In Unsecured Loans 0.00 319.52 10.78 41.75
Decrease in Working Capital 352.80 93.74 495.72 265.43
Others 169.65 231.64 372.52 394.25
Total 1368.06 1480.74 1140.57 954.88
Application of Funds:
Increase in Gross Block 1196.22 1381.90 1115.67 911.25
Decrease in Share Capital 0.00 0.00 0.00 0.00
Decrease in Sec. Loans 0.00 0.00 18.68 0.00
Decrease in Un. Sec Loans 164.88 0.00 0.00 0.00
Decrease in Share
warrants/outstanding
3.54 98.84 0.00 6.84
Increase in Investments 3.42 0.00 6.21 36.84
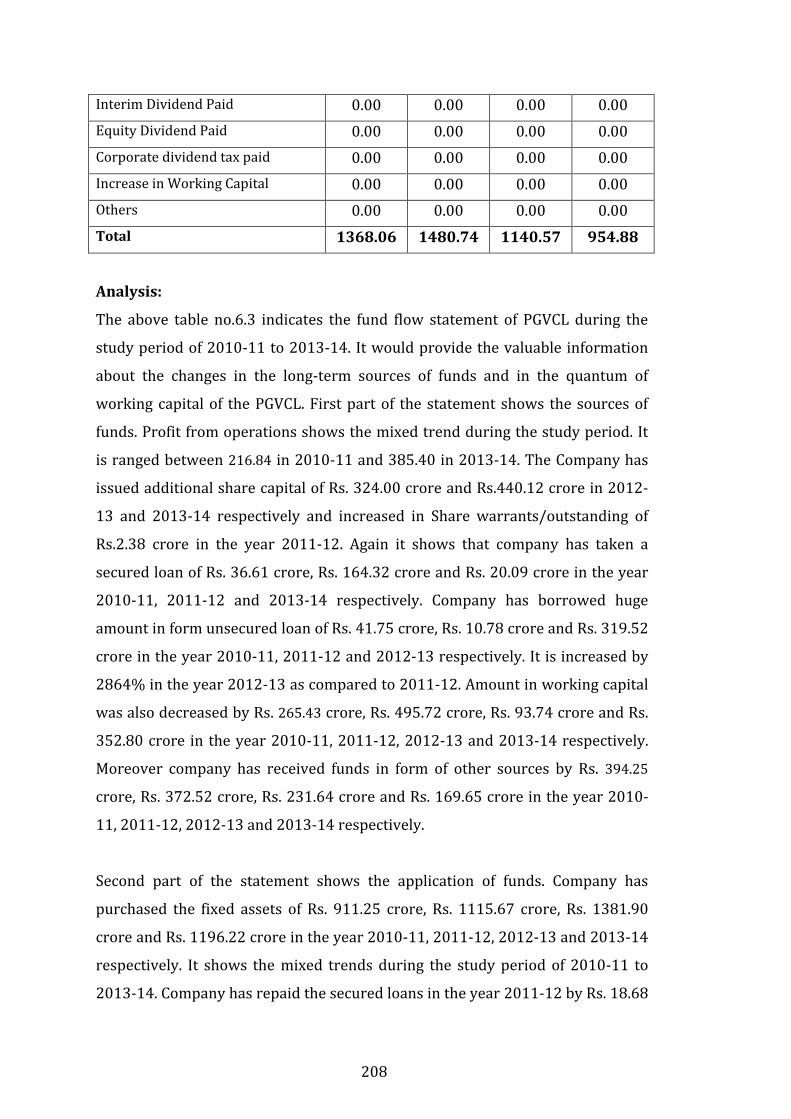
208
Interim Dividend Paid 0.00 0.00 0.00 0.00
Equity Dividend Paid 0.00 0.00 0.00 0.00
Corporate dividend tax paid 0.00 0.00 0.00 0.00
Increase in Working Capital 0.00 0.00 0.00 0.00
Others 0.00 0.00 0.00 0.00
Total 1368.06 1480.74 1140.57 954.88
Analysis:
The above table no.6.3 indicates the fund flow statement of PGVCL during the
study period of 2010-11 to 2013-14. It would provide the valuable information
about the changes in the long-term sources of funds and in the quantum of
working capital of the PGVCL. First part of the statement shows the sources of
funds. Profit from operations shows the mixed trend during the study period. It
is ranged between 216.84 in 2010-11 and 385.40 in 2013-14. The Company has
issued additional share capital of Rs. 324.00 crore and Rs.440.12 crore in 2012-
13 and 2013-14 respectively and increased in Share warrants/outstanding of
Rs.2.38 crore in the year 2011-12. Again it shows that company has taken a
secured loan of Rs. 36.61 crore, Rs. 164.32 crore and Rs. 20.09 crore in the year
2010-11, 2011-12 and 2013-14 respectively. Company has borrowed huge
amount in form unsecured loan of Rs. 41.75 crore, Rs. 10.78 crore and Rs. 319.52
crore in the year 2010-11, 2011-12 and 2012-13 respectively. It is increased by
2864% in the year 2012-13 as compared to 2011-12. Amount in working capital
was also decreased by Rs. 265.43 crore, Rs. 495.72 crore, Rs. 93.74 crore and Rs.
352.80 crore in the year 2010-11, 2011-12, 2012-13 and 2013-14 respectively.
Moreover company has received funds in form of other sources by Rs. 394.25
crore, Rs. 372.52 crore, Rs. 231.64 crore and Rs. 169.65 crore in the year 2010-
11, 2011-12, 2012-13 and 2013-14 respectively.
Second part of the statement shows the application of funds. Company has
purchased the fixed assets of Rs. 911.25 crore, Rs. 1115.67 crore, Rs. 1381.90
crore and Rs. 1196.22 crore in the year 2010-11, 2011-12, 2012-13 and 2013-14
respectively. It shows the mixed trends during the study period of 2010-11 to
2013-14. Company has repaid the secured loans in the year 2011-12 by Rs. 18.68
209
crore. Company has purchased investment of Rs. 36.84, Rs. 6.21 and Rs. 3.42
crore in the year 2010-11, 2011-12 and 2013-14 respectively.
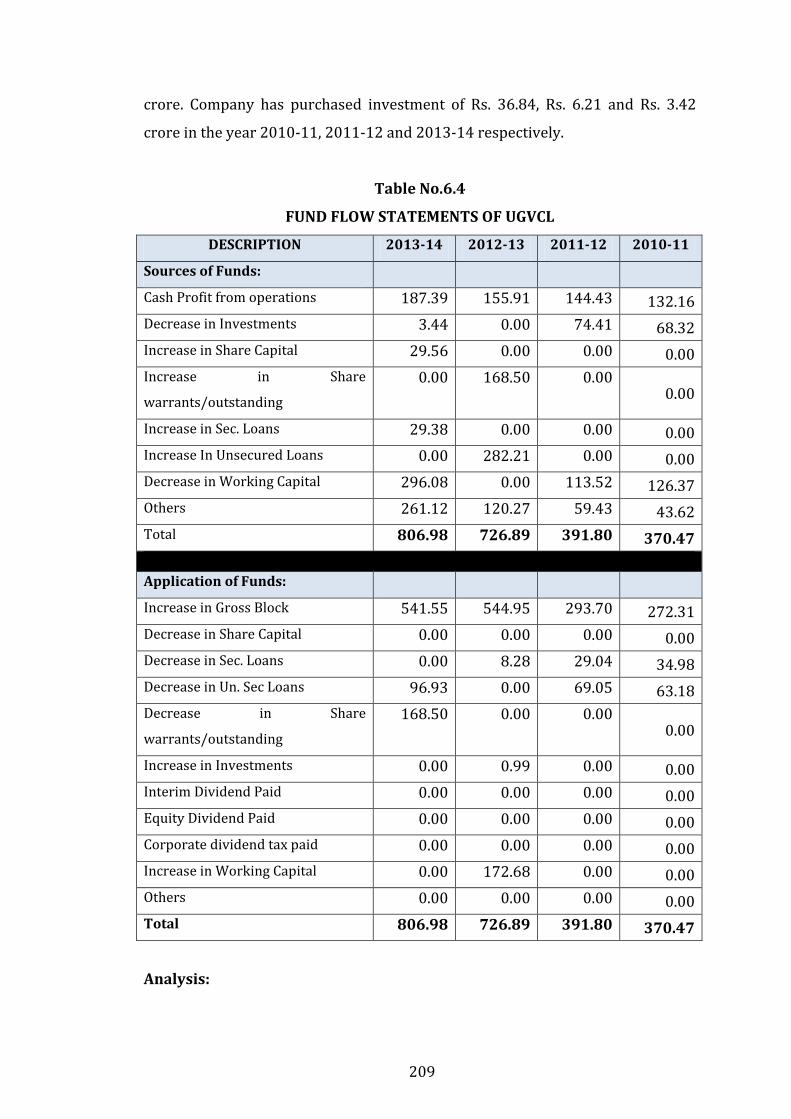
Table No.6.4
FUND FLOW STATEMENTS OF UGVCL
DESCRIPTION 2013-14 2012-13 2011-12 2010-11
Sources of Funds:
Cash Profit from operations 187.39 155.91 144.43 132.16
Decrease in Investments 3.44 0.00 74.41 68.32
Increase in Share Capital 29.56 0.00 0.00 0.00
Increase in Share
warrants/outstanding
0.00 168.50 0.00 0.00
Increase in Sec. Loans 29.38 0.00 0.00 0.00
Increase In Unsecured Loans 0.00 282.21 0.00 0.00
Decrease in Working Capital 296.08 0.00 113.52 126.37
Others 261.12 120.27 59.43 43.62
Total 806.98 726.89 391.80 370.47
Application of Funds:
Increase in Gross Block 541.55 544.95 293.70 272.31
Decrease in Share Capital 0.00 0.00 0.00 0.00
Decrease in Sec. Loans 0.00 8.28 29.04 34.98
Decrease in Un. Sec Loans 96.93 0.00 69.05 63.18
Decrease in Share
warrants/outstanding
168.50 0.00 0.00 0.00
Increase in Investments 0.00 0.99 0.00 0.00
Interim Dividend Paid 0.00 0.00 0.00 0.00
Equity Dividend Paid 0.00 0.00 0.00 0.00
Corporate dividend tax paid 0.00 0.00 0.00 0.00
Increase in Working Capital 0.00 172.68 0.00 0.00
Others 0.00 0.00 0.00 0.00
Total 806.98 726.89 391.80 370.47
Analysis:
210
The above table no.6.4 indicates the fund flow statement of UGVCL during the
study period of 2010-11 to 2013-14. It would provide the valuable information
about the changes in the long-term sources of funds and in the quantum of
working capital of the UGVCL. First part of the statement shows the sources of
funds. Profit from operations shows the progressive trend during the study
period. It is ranged between 132.16 crore in 2010-11 and 187.39 crore in 2013-
14. The Company has issued additional share capital of Rs. 29.56 crore in the
year 2013-14. It shows that the amount increased in Share
warrants/outstanding of Rs. 168.50 crore in the year 2012-13. Again it shows
that company has taken a secured loan of Rs. 29.38 crore in the year 2013-14.
Company has borrowed huge amount in form unsecured loan of Rs. 282.21 crore
in the year 2012-13. Amount in working capital was also decreased by Rs. 126.37
crore, Rs. 113.52 crore and Rs. 296.08 crore in the year 2010-11, 2011-12 and
2013-14 respectively. Moreover company has received funds in form of other
sources by Rs. 43.62 crore, Rs. 59.43 crore, Rs. 120.27 crore and Rs. 261.12 crore
in the year 2010-11, 2011-12, 2012-13 and 2013-14 respectively.
Second part of the statement shows the application of funds. Company has
purchased the fixed assets of Rs. 272.31 crore, Rs. 293.70 crore, Rs. 544.95 crore
and Rs. 541.55 crore in the year 2010-11, 2011-12, 2012-13 and 2013-14
respectively. It shows the fluctuated progressive trends during the study period
of 2010-11 to 2013-14. Company has repaid the secured loans of Rs. 34.98 crore,
29.04 crore and Rs. 8.28 in the year 2010-11, 2011-12 and 2012-13. Company
has purchased investment of Rs. 0.99 crore in the year 2012-13.
ANALYSIS OF CASH FLOW
6.11 INTRODUCTION:
The separation of management from ownership in modern business calls for the
use of some form of connection between the managers and the owners and other
interested parties. Financial reporting is the most efficient and extensively used
medium of communicating the operating results as well as latest financial
position of a concern for the management. Constancy and achievement of any
211
business largely depend on its capacity to generate enough cash. As part of
conveying an end result of companies operation managements use financial
statement as an important vehicles through which financial information is
furnished to the stakeholders. But the three basic financial statements present
only fragmentary information about a company’s cash flows (cash receipt and
cash payments).
The balance sheet is a snapshot of a firm's financial resources and obligations at
a single point in time, and the income statement summarizes a firm's financial
transactions over an interval of time. These two financial statements reflect the
accrual basis accounting used by firms to match revenues with the expenses
associated with generating those revenues.
6.12 CONCEPT OF CASH FLOW:
A cash flow statement is a financial report that describes the sources of a
company's cash and how that cash was spent over a specified time period. It does
not include non-cash items. The cash flow statement is a cash basis report on
three types of financial activities: operating activities, investing activities, and
financing activities. Non-cash activities are usually reported in footnotes. This
makes it useful for determining the short-term viability of a company,
particularly its ability to pay bills. Because the management of cash flow is so
crucial for businesses and small businesses in particular, most analysts
recommend that an entrepreneur should study a cash flow statement at least
every quarter. The cash flow statement is similar to the income statement in that
it records a company's performance over a specified period of time. The
difference between the two is that the income statement also takes into account
some non-cash accounting items such as depreciation. The cash flow statement
strips away all of this and shows exactly how much actual money the company
has generated. Cash flow statements show how companies have performed in
managing inflows and outflows of cash. It provides a sharper picture of a
company's ability to pay creditors, and finance growth.
212
The Cash Flow Statement (CFS) provides relevant financial information about the
cash receipts and cash disbursements of a firm during a fiscal year. This
information is especially important to shareholders and creditors. As part of
their investment return, shareholders often expect to receive dividends, and the
ability to pay cash dividends depends on the availability of cash flows. Creditors
are concerned about a firm’s ability to make interest and principal payments on
loans they have made to the firm. Other stakeholders such as employees and
suppliers are also concerned about a firm’s ability to meet its financial
obligations.
It is perfectly possible for a company that is shown to be profitable according to
accounting standards to go under if there isn't enough cash on hand to pay bills.
Comparing amount of cash generated to outstanding debt, known as the
"operating cash flow ratio," illustrates the company's ability to service its loans
and interest payments. If a slight drop in a company's quarterly cash flow would
jeopardize its ability to make loan payments that company is in a riskier position
than one with less net income but a stronger cash flow level.
Unlike the many ways in which reported earnings can be presented, there is little
a company can do to manipulate its cash situation. Barring any outright fraud,
the cash flow statement tells the whole story. The company either has cash or it
does not. Analysts will look closely at the cash flow statement of any company in
order to understand its overall health. Statement of cash flows provides the
answer to the following simple but important question about an enterprise.
(Keiso and Weygand, 1998: 1275-76)
i. Where did cash come from during the period?
ii. What was the cash used for during the period?
iii. What was the change in the cash balance during the period?
The use of cash flow information is gaining value in the analysis of financial
statements. Cash flow information is measured less open to manipulation than
information on earnings, because it is based on the actual receipt and payment of
213
cash only and not on the accrual and other accounting principles. However, the
literature on the cash flow statement indicates that there are grey areas in cash
flow reporting that are open to various interpretations. The perceived simplicity
of the cash flow statement may therefore create synthetic confidence in the
reliability of companies‟ cash flow reporting and the comparability of various
companies’ cash flow information. The acceptance of AS-3: The Cash Flow
Statement has added a new dimension to the preparation and presentation of
financial statements in Bangladesh. This paper is an effort to investigate into the
state of cash flow reporting by the listed Bangladeshi non-banking financial
companies in general. The focal point is not on the quality of the reporting of the
companies but rather on what the reporting levels are in general.
6.13 IMPORTANCE OF CASH FLOWS
Investors, creditors, and managers use cash flow information to make decisions
about a company’s ability to meet obligations, or to take advantage of business
opportunities. Information about a current period’s cash flows provides a basis
for predicting the amount, timing, and certainty of future cash flows. Cash flow
information is also useful in evaluating the liquidity, solvency, and financial
flexibility of a company. Liquidity refers to the ability of a company to pay its
current liabilities with existing liquid assets. Solvency is the ability to pay all
debts as they come due. A company may wish to raise money by issuing shares,
for instance. Financial flexibility relates to the ability of a company to use its
resources to adapt to change and take advantage of business opportunities as
they arise.
A cash flow statement (formerly known as a statement of changes in financial
position) is designed to help a user make these evaluations and to answer
specific questions such as
What accounts for the difference between cash and cash equivalents at
the beginning of the year and at the end of the year?
What was done with the cash raised from the sale of bonds or shares?
How did the business finance its purchases of machinery or other capital
assets?
214
How was it possible to pay dividends when the business reported a net
loss on its income statement?
Does the firm have the ability to pay off the mortgage on its office
building?
6.14 CASH FLOW STATEMENT:
In 1998, the CICA revised section 1540 of the CICA Handbook, changing the
“statement of changes in financial position” to “cash flow statement.” This does
not affect the preparation of the cash flow statement, which is still based on cash
and cash equivalents. This applies to all businesses unless a business has
relatively simple operations, with few or no significant financing and investing
activities, and their effects on cash flows are apparent from the other financial
statements or are adequately disclosed in the notes to the financial statements
. For example, the cash flow statement does not apply to pension plans or not-
for-profit organizations.
The CFS is similar to an income statement in that it summarizes the activities of a
company during a given period. An income statement, however, only reports on
operating activities. The CFS not only reports on operating activities, but also on
investing and financing activities. Another key difference between the income
statement and the CFS is that the income statement is prepared using the accrual
basis of accounting, but the CFS includes inflows and outflows of cash or cash
equivalents, thus it is prepared on a cash basis.
6.15 CLASSIFICATION OF CASH FLOW TRANSACTIONS:
Cash flows result from operating, financing, and investing activities. You must be
able to distinguish among these types of cash flows. These activities are
explained as follows.
1. Operating activities: Cash flows from operating activities include all cash
flow transactions that are not classified as investing or financing
activities. Operating activities are related to the primary operations of
the company in generating revenues and incurring related expenses.
Companies expect to generate more cash inflows from selling goods and
215
services than they spend in doing so. As you know, revenues are recorded
when they are earned and expenses are recorded when incurred.
Revenues and expenses therefore seldom match perfectly with their
corresponding cash flows. For example, of $20,000 sales during the
current fiscal period, perhaps only $10,000 are collected in the same
period as the sales. The income statement also includes noncash expenses
such as amortization. Amortization expense reduces income without a
corresponding reduction in cash. You should think of operating cash flow
activities as those that affect net income as well as current assets and
current liabilities (the working capital accounts or operating accounts).
Changes in working capital accounts are very much affected by a
company’s rate of growth. Expanding businesses will usually report
significant increases in accounts receivable and inventories. If a business
uses suppliers to finance these increases, you will see an upward change
in accounts payable. Some changes in current liabilities, however, are not
usually classified as operating activities. For instance, changes in
dividends payable and interest charged to retained earnings are classified
as financing activities. In the previous example, a business may finance
increases in accounts receivable and inventory with borrowing or equity
financing. However, borrowing and equity financing are not considered to
be operating activities.
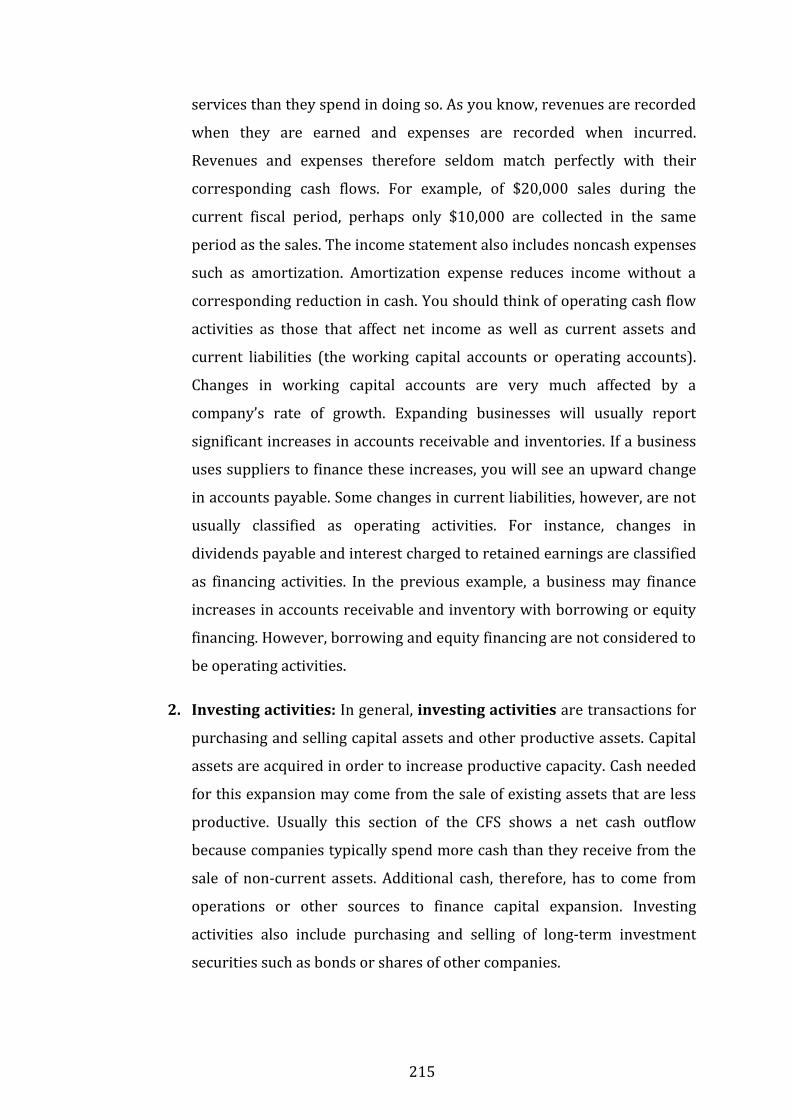
2. Investing activities: In general, investing activities are transactions for
purchasing and selling capital assets and other productive assets. Capital
assets are acquired in order to increase productive capacity. Cash needed
for this expansion may come from the sale of existing assets that are less
productive. Usually this section of the CFS shows a net cash outflow
because companies typically spend more cash than they receive from the
sale of non-current assets. Additional cash, therefore, has to come from
operations or other sources to finance capital expansion. Investing
activities also include purchasing and selling of long-term investment
securities such as bonds or shares of other companies.
216
3. Financing activities: Financing activities affect a business’ capital
structure, its debt and equity. This includes a company’s transactions with
its owners and creditors but does not include cash payments to settle
credit purchases of merchandise, which are operating activities. Financing
activities include the use of cash to pay dividends to shareholders, the
borrowing or payment of debt, and the issue or repurchase of shares. Do
not confuse dividends declared and paid with dividends received from
investments. Dividends paid are a cash outflow that is a financing activity,
but dividends received are a cash inflow reported on the income
statement. Dividends received are therefore classified as an operating
activity.
6.15 COMPARISION OF FUND FLOW STATEMENT & CASH FLOW
STATEMENT
FUND FLOW STATEMENT CASH FLOW STATEMENT
1. This analysis shows the
changes in working capital
fixed assets etc. between two
periods
1. This analysis shows the
changes in cash position
between two periods.
2. Increase in funds does not
always means increase in
cash.
2. Increase in cash does always
mean increase in fund.
3. Fund flow analysis notes the
overall changes in funds of the
company and we can decide
overall stability of business
unit.
3. Cash flow analysis notes the
changes in cash position only
and one can’t know the
stability of Co. by this analysis
4. It reveals the long term
stability of business.
4. It reveals the short term cash
position of the business.
5. Management can take long
term major decisions with the
help of this statement.
5. Management can take short
term decisions regarding cash
only.
217
6. This analysis includes cash
flow analysis because cash is a
part of working capital.
6. This analysis does not include
fund flow analysis because this
covers only cash transactions.
7. While preparing statement of
changes in working capital if
current assets increase or
current debts decrease,
working capital increases.
7. In cash flow analysis increase
in current assets or decrease
In current debts means
reduction in cash.
6.17 ANALYSIS OF CASH FLOW:
Cash flow analysis is primarily used as a tool to evaluate the sources and uses of
funds. Cash flow analysis provides insights into how a company is obtaining its
financing and deploying its resources. It also is used in cash flow forecasting and
as part of liquidity analysis. The cash flow statement was previously known as
the flow of Cash statement. The cash flow statement reflects a firm's liquidity.
The balance sheet is a snapshot of a firm's financial resources and obligations at
a single point in time, and the income statement summarizes a firm's financial
transactions over an interval of time. These two financial statements reflect the
accrual basis accounting used by firms to match revenues with the expenses
associated with generating those revenues. The cash flow statement includes
only inflows and outflows of cash and cash equivalents; it excludes transactions
that do not directly affect cash receipts and payments. These non-cash
transactions include depreciation or write-offs on bad debts or credit losses to
name a few. The cash flow statement is a cash basis report on three types of
financial activities: operating activities, investing activities, and financing
activities. Noncash activities are usually reported in footnotes. The cash flow
statement is intended to
1. Provide information on a firm's liquidity and solvency and its ability to
change cash flows in future circumstances
2. Provide additional information for evaluating changes in assets, liabilities
and equity
3. Improve the comparability of different firms' operating performance by
eliminating the effects of different accounting methods
218
4. Indicate the amount, timing and probability of future cash flows.
The cash flow statement has been adopted as a standard financial statement
because it eliminates allocations, which might be derived from different
accounting methods, such as various timeframes for depreciating fixed assets.
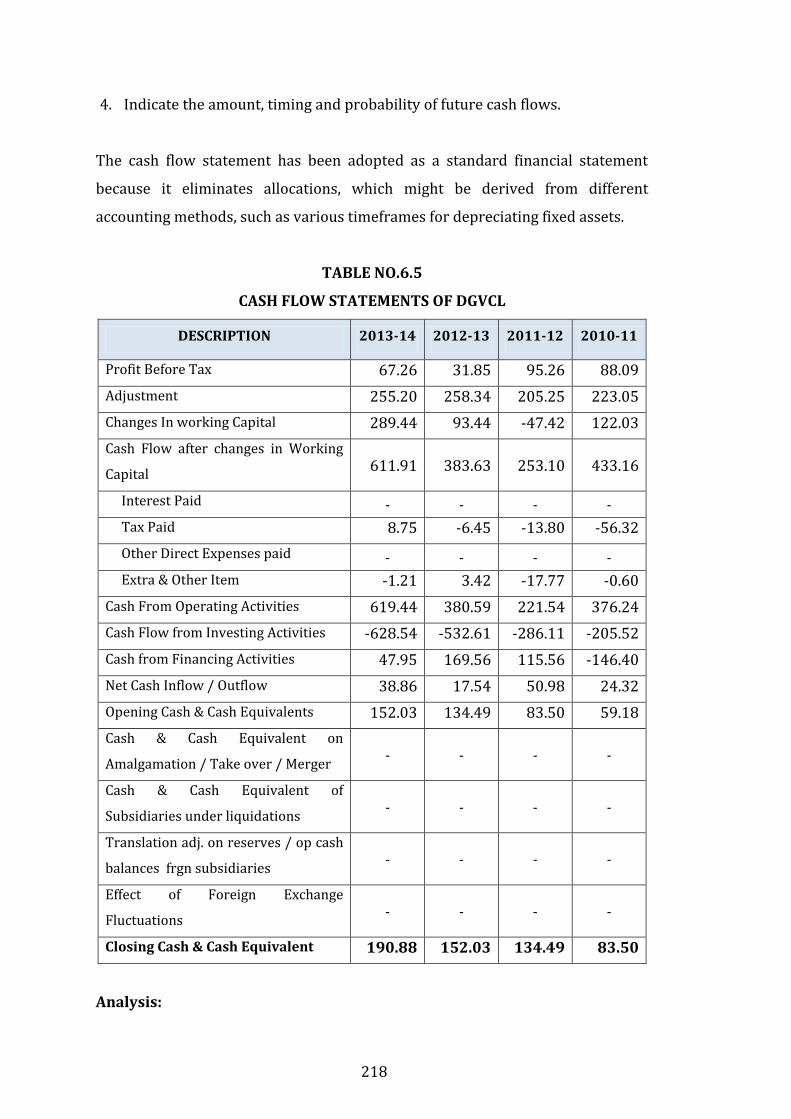
TABLE NO.6.5
CASH FLOW STATEMENTS OF DGVCL
DESCRIPTION 2013-14 2012-13 2011-12 2010-11
Profit Before Tax 67.26 31.85 95.26 88.09
Adjustment 255.20 258.34 205.25 223.05
Changes In working Capital 289.44 93.44 -47.42 122.03
Cash Flow after changes in Working
Capital 611.91 383.63 253.10 433.16
Interest Paid - - - -
Tax Paid 8.75 -6.45 -13.80 -56.32
Other Direct Expenses paid - - - -
Extra & Other Item -1.21 3.42 -17.77 -0.60
Cash From Operating Activities 619.44 380.59 221.54 376.24
Cash Flow from Investing Activities -628.54 -532.61 -286.11 -205.52
Cash from Financing Activities 47.95 169.56 115.56 -146.40
Net Cash Inflow / Outflow 38.86 17.54 50.98 24.32
Opening Cash & Cash Equivalents 152.03 134.49 83.50 59.18
Cash & Cash Equivalent on
Amalgamation / Take over / Merger - - - -
Cash & Cash Equivalent of
Subsidiaries under liquidations - - - -
Translation adj. on reserves / op cash
balances frgn subsidiaries - - - -
Effect of Foreign Exchange
Fluctuations - - - -
Closing Cash & Cash Equivalent 190.88 152.03 134.49 83.50
Analysis:
219
The above table no.6.5 shows the cash flow statement of DGVCL during the study
period 2010-11 to 2013-14. Cash flow after changes in working capital was Rs.
433.16 crore, Rs.253.10 crore, Rs.383.63 crore and Rs.611.91 crore in the year
2010-11, 2011-12, 2012-13 and 2013-14 respectively. It shows progressive
trend during the year 2011-12 to 2013-14. It was increased by 85.57 % in 2013-
14 as compare to 2012-13. Cash flow from operating activities was Rs. 376.24
crore, Rs.221.54 crore, Rs.380.59 crore and Rs.619.44 crore in the year 2010-11,
2011-12, 2012-13 and 2013-14 respectively. It shows fluctuated and progressive
trend during the study period. It was increased by 62.76 % in 2013-14 as
compare to 2012-13. Cash flow from investing activities was Rs. -205.52 crore,
Rs.-286.11 crore, Rs.-532.61 crore and Rs.-628.54 crore in the year 2010-11,
2011-12, 2012-13 and 2013-14 respectively. It shows progressive trend during
the study period. It was increased by 86.16 % in 2012-13 as compare to 2011-12.
Cash flow from financing activities was Rs. -146.40 crore, Rs.115.56 crore,
Rs.169.56 crore and Rs.47.95 crore in the year 2010-11, 2011-12, 2012-13 and
2013-14 respectively. It shows fluctuated trend during the study period. Closing
balance of cash and equivalent was Rs.83.50 crore, Rs.134.59 crore, Rs.152.03
crore and Rs.190.88 crore during the year 2010-11, 2011-12, 2012-13 and 2013-
14 respectively. It shows the progressive trend during the study period.
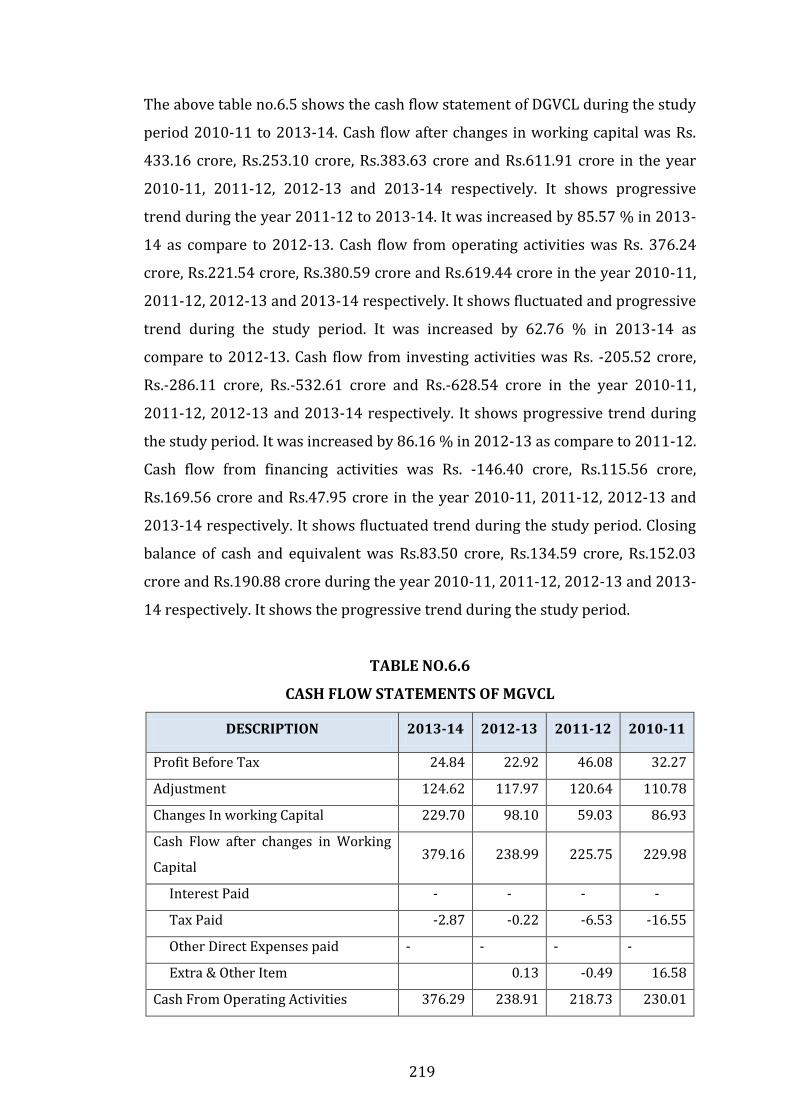
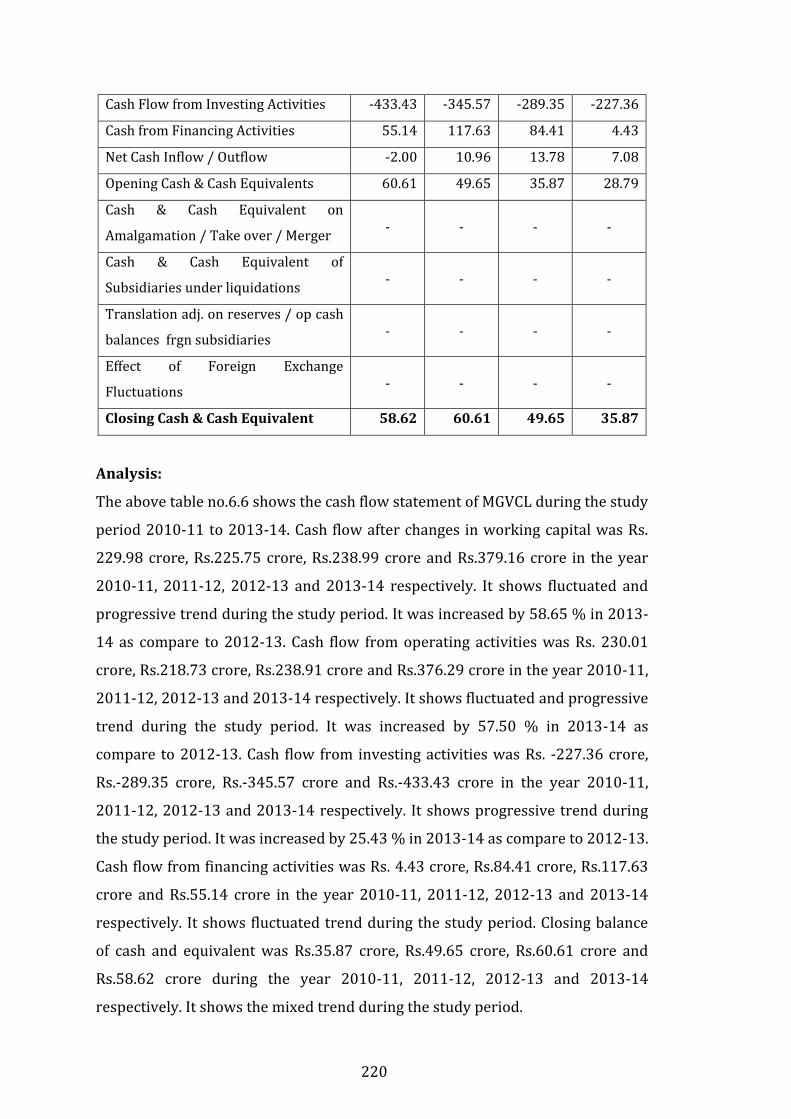
TABLE NO.6.6
CASH FLOW STATEMENTS OF MGVCL
DESCRIPTION 2013-14 2012-13 2011-12 2010-11
Profit Before Tax 24.84 22.92 46.08 32.27
Adjustment 124.62 117.97 120.64 110.78
Changes In working Capital 229.70 98.10 59.03 86.93
Cash Flow after changes in Working
Capital 379.16 238.99 225.75 229.98
Interest Paid - - - -
Tax Paid -2.87 -0.22 -6.53 -16.55
Other Direct Expenses paid - - - -
Extra & Other Item 0.13 -0.49 16.58
Cash From Operating Activities 376.29 238.91 218.73 230.01
220
Cash Flow from Investing Activities -433.43 -345.57 -289.35 -227.36
Cash from Financing Activities 55.14 117.63 84.41 4.43
Net Cash Inflow / Outflow -2.00 10.96 13.78 7.08
Opening Cash & Cash Equivalents 60.61 49.65 35.87 28.79
Cash & Cash Equivalent on
Amalgamation / Take over / Merger - - - -
Cash & Cash Equivalent of
Subsidiaries under liquidations - - - -
Translation adj. on reserves / op cash
balances frgn subsidiaries - - - -
Effect of Foreign Exchange
Fluctuations - - - -
Closing Cash & Cash Equivalent 58.62 60.61 49.65 35.87
Analysis:
The above table no.6.6 shows the cash flow statement of MGVCL during the study
period 2010-11 to 2013-14. Cash flow after changes in working capital was Rs.
229.98 crore, Rs.225.75 crore, Rs.238.99 crore and Rs.379.16 crore in the year
2010-11, 2011-12, 2012-13 and 2013-14 respectively. It shows fluctuated and
progressive trend during the study period. It was increased by 58.65 % in 2013-
14 as compare to 2012-13. Cash flow from operating activities was Rs. 230.01
crore, Rs.218.73 crore, Rs.238.91 crore and Rs.376.29 crore in the year 2010-11,
2011-12, 2012-13 and 2013-14 respectively. It shows fluctuated and progressive
trend during the study period. It was increased by 57.50 % in 2013-14 as
compare to 2012-13. Cash flow from investing activities was Rs. -227.36 crore,
Rs.-289.35 crore, Rs.-345.57 crore and Rs.-433.43 crore in the year 2010-11,
2011-12, 2012-13 and 2013-14 respectively. It shows progressive trend during
the study period. It was increased by 25.43 % in 2013-14 as compare to 2012-13.
Cash flow from financing activities was Rs. 4.43 crore, Rs.84.41 crore, Rs.117.63
crore and Rs.55.14 crore in the year 2010-11, 2011-12, 2012-13 and 2013-14
respectively. It shows fluctuated trend during the study period. Closing balance
of cash and equivalent was Rs.35.87 crore, Rs.49.65 crore, Rs.60.61 crore and
Rs.58.62 crore during the year 2010-11, 2011-12, 2012-13 and 2013-14
respectively. It shows the mixed trend during the study period.
221
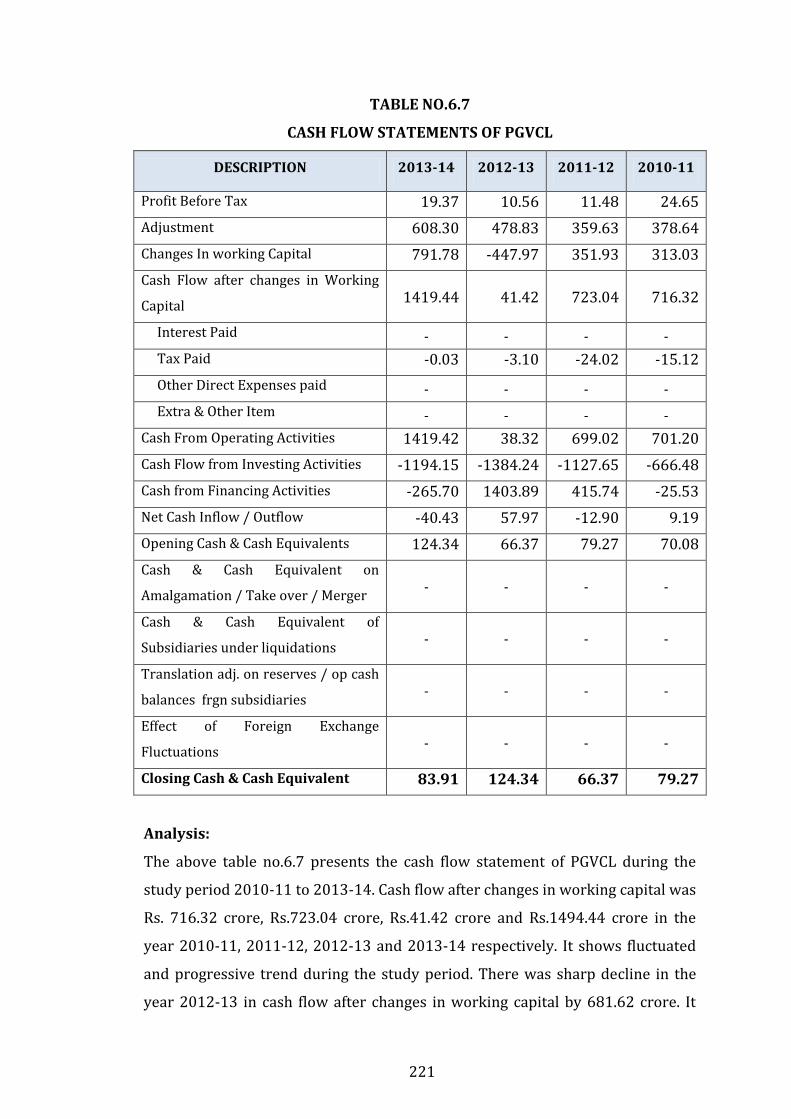
TABLE NO.6.7
CASH FLOW STATEMENTS OF PGVCL
DESCRIPTION 2013-14 2012-13 2011-12 2010-11
Profit Before Tax 19.37 10.56 11.48 24.65
Adjustment 608.30 478.83 359.63 378.64
Changes In working Capital 791.78 -447.97 351.93 313.03
Cash Flow after changes in Working
Capital 1419.44 41.42 723.04 716.32
Interest Paid - - - -
Tax Paid -0.03 -3.10 -24.02 -15.12
Other Direct Expenses paid - - - -
Extra & Other Item - - - -
Cash From Operating Activities 1419.42 38.32 699.02 701.20
Cash Flow from Investing Activities -1194.15 -1384.24 -1127.65 -666.48
Cash from Financing Activities -265.70 1403.89 415.74 -25.53
Net Cash Inflow / Outflow -40.43 57.97 -12.90 9.19
Opening Cash & Cash Equivalents 124.34 66.37 79.27 70.08
Cash & Cash Equivalent on
Amalgamation / Take over / Merger - - - -
Cash & Cash Equivalent of
Subsidiaries under liquidations - - - -
Translation adj. on reserves / op cash
balances frgn subsidiaries - - - -
Effect of Foreign Exchange
Fluctuations - - - -
Closing Cash & Cash Equivalent 83.91 124.34 66.37 79.27
Analysis:
The above table no.6.7 presents the cash flow statement of PGVCL during the
study period 2010-11 to 2013-14. Cash flow after changes in working capital was
Rs. 716.32 crore, Rs.723.04 crore, Rs.41.42 crore and Rs.1494.44 crore in the
year 2010-11, 2011-12, 2012-13 and 2013-14 respectively. It shows fluctuated
and progressive trend during the study period. There was sharp decline in the
year 2012-13 in cash flow after changes in working capital by 681.62 crore. It
222
was increased by 3508 % in 2013-14 as compare to 2012-13. Cash flow from
operating activities was Rs. 701.20 crore, Rs.699.02 crore, Rs.38.32 crore and
Rs.1419.42 crore in the year 2010-11, 2011-12, 2012-13 and 2013-14
respectively. It shows fluctuated trend during the study period. It was increased
by 3604 % in 2013-14 as compare to 2012-13. Cash flow from investing
activities was Rs. -666.48 crore, Rs.-1127.65 crore, Rs.-1384.24 crore and Rs.-
1194.15 crore in the year 2010-11, 2011-12, 2012-13 and 2013-14 respectively.
It shows progressive trend during the year 2010-11 to 2012-13. Cash flow from
financing activities was Rs. -25.53 crore, Rs.415.14 crore, Rs.1403.89 crore and
Rs.-265.70 crore in the year 2010-11, 2011-12, 2012-13 and 2013-14
respectively. It shows fluctuated trend during the study period. Closing balance
of cash and equivalent was Rs.79.27 crore, Rs.66.37 crore, Rs.124.34 crore and
Rs.83.91 crore during the year 2010-11, 2011-12, 2012-13 and 2013-14
respectively. It shows the fluctuated trend during the study period.
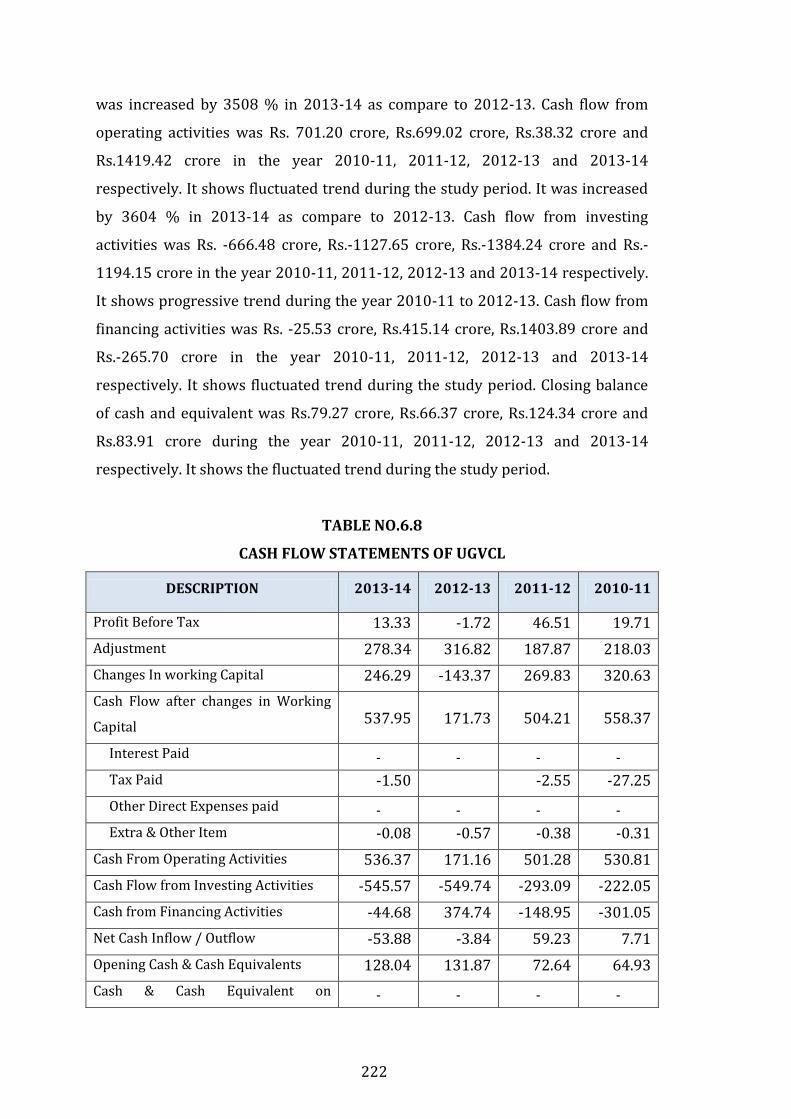
TABLE NO.6.8
CASH FLOW STATEMENTS OF UGVCL
DESCRIPTION 2013-14 2012-13 2011-12 2010-11
Profit Before Tax 13.33 -1.72 46.51 19.71
Adjustment 278.34 316.82 187.87 218.03
Changes In working Capital 246.29 -143.37 269.83 320.63
Cash Flow after changes in Working
Capital 537.95 171.73 504.21 558.37
Interest Paid - - - -
Tax Paid -1.50 -2.55 -27.25
Other Direct Expenses paid - - - -
Extra & Other Item -0.08 -0.57 -0.38 -0.31
Cash From Operating Activities 536.37 171.16 501.28 530.81
Cash Flow from Investing Activities -545.57 -549.74 -293.09 -222.05
Cash from Financing Activities -44.68 374.74 -148.95 -301.05
Net Cash Inflow / Outflow -53.88 -3.84 59.23 7.71
Opening Cash & Cash Equivalents 128.04 131.87 72.64 64.93
Cash & Cash Equivalent on - - - -
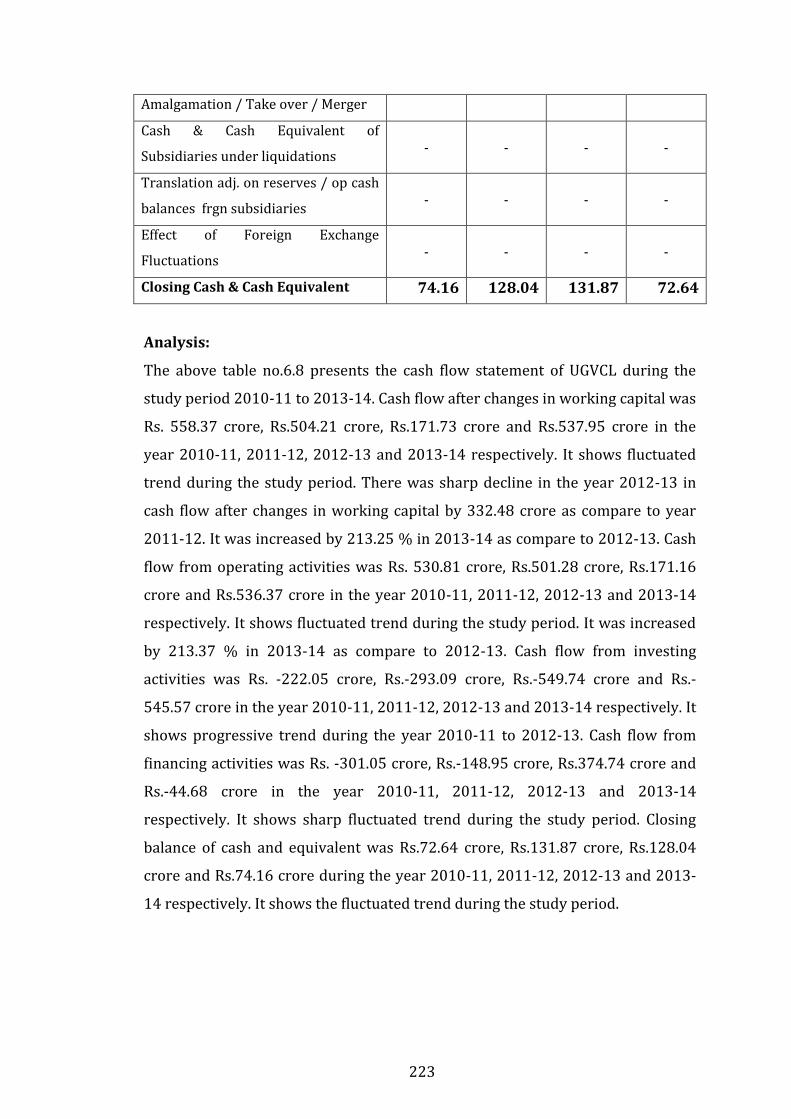
223
Amalgamation / Take over / Merger
Cash & Cash Equivalent of
Subsidiaries under liquidations - - - -
Translation adj. on reserves / op cash
balances frgn subsidiaries - - - -
Effect of Foreign Exchange
Fluctuations - - - -
Closing Cash & Cash Equivalent 74.16 128.04 131.87 72.64
Analysis:
The above table no.6.8 presents the cash flow statement of UGVCL during the
study period 2010-11 to 2013-14. Cash flow after changes in working capital was
Rs. 558.37 crore, Rs.504.21 crore, Rs.171.73 crore and Rs.537.95 crore in the
year 2010-11, 2011-12, 2012-13 and 2013-14 respectively. It shows fluctuated
trend during the study period. There was sharp decline in the year 2012-13 in
cash flow after changes in working capital by 332.48 crore as compare to year
2011-12. It was increased by 213.25 % in 2013-14 as compare to 2012-13. Cash
flow from operating activities was Rs. 530.81 crore, Rs.501.28 crore, Rs.171.16
crore and Rs.536.37 crore in the year 2010-11, 2011-12, 2012-13 and 2013-14
respectively. It shows fluctuated trend during the study period. It was increased
by 213.37 % in 2013-14 as compare to 2012-13. Cash flow from investing
activities was Rs. -222.05 crore, Rs.-293.09 crore, Rs.-549.74 crore and Rs.-
545.57 crore in the year 2010-11, 2011-12, 2012-13 and 2013-14 respectively. It
shows progressive trend during the year 2010-11 to 2012-13. Cash flow from
financing activities was Rs. -301.05 crore, Rs.-148.95 crore, Rs.374.74 crore and
Rs.-44.68 crore in the year 2010-11, 2011-12, 2012-13 and 2013-14
respectively. It shows sharp fluctuated trend during the study period. Closing
balance of cash and equivalent was Rs.72.64 crore, Rs.131.87 crore, Rs.128.04
crore and Rs.74.16 crore during the year 2010-11, 2011-12, 2012-13 and 2013-
14 respectively. It shows the fluctuated trend during the study period.
224
:: REFERENCES ::
1. Agarwal N.P., 'Financial Appraisal of State Ware-housing Corporation:
A Case Study of Rajasthan State Ware-housing Corporation. A
Dissertation submitted for the degree of M. Phil, Department of E. A. F.
M., University of Rajasthan, Jaipur, July 1979, pp. 3-4.
2. Charles W.Gresternberg, “Financial organization and management of
Busiones”4th end. Asia publishing House, New Delhi, 1960, P.365.
3. Dr. Ashok Sehgal and Dr. Deepak sehgal, Accounting for Management ,
Taxmann Publication , New Delhi P. 316-367.
4. Dr. R.P Rustagi , Principles of Financial Management Problems and
Soluations , Taxmann Publication , New Delhi P. 61-67.
5. Element of book keeping and accountancy (2009), Gujarat state board
of school textbooks 125.
6. Element of book keeping and accountancy (2009), Gujarat state board
of school textbooks 128.
7. Element of book keeping and accountancy (2009), Gujarat state board
of school textbooks 132.
8. Element of book keeping and accountancy (2009), Gujarat state board
of school textbooks 135.
9. http://sol.du.ac.in/Courses/UG/bcompass.pdf
10. http://webapps.seattleu.edu/albers/syllabi/09SQ_ACCT311_Ko
ch.pdf
11. http://www.romtech.info/PDF/Financialandoperating Leverages.pdf
12. http://www.satyawatievedu.ac.in/bcompass.pdf
13. http://www.tce.edu/course_information/B.E. Mechatronics.pdf
14. James C. Van Horne & John M. Wachowicz, Jr. – “Fundamentals of
Financial Management”
15. M. Y. Khan & P K Jain, - “Financial Management – Text and Problems”
16. N.K Kulshreshtha; Analysis of Financial Statements of Indian Paper
Industry, Aligarh, Navman Prakashan, 1972, p. 26.
17. Pandey I M (2005) Ninth Edition Financial Management PP 517 – 544.
18. Prasanna Chandra – “Financial Management – Theory and Practice”
225
19. Ravi M. Kishor, Financial Management Problems and Solution, Taxman
Publication, New Delhi P. 61-136.
20. S. P. Vijaysarcadhi, Working Capital Management, A Conceptual
overview June-1981.
21. Singh and Kumar, Financial Analysis for Business Decisions, N. Delhi,
Allied Publishers, 1970.
22. Webster’s New Collegiate Dictionary, 8th Ed., Springfield, Mass: G & C,
Merriam, 1975, p.958.
23. Zannetos, Zenon S., ."Depreciation and Fund Statements", The
Accounting Review, April 1962, pp. 300-307.