analysis of factors u.s. cotton exports
TRANSCRIPT

fia?/'?
Analysis of Factors
U.S. Cotton Exports
U.S. DEPARTMENT OF AGRICULTURE ^ Economic Research Service'* Agriculturoj[.Economic Report No.90

PREFACE
This cotton study is part of a continuing program of economic research designed to provide infornaation on factors influencing supply, utilization, and price of important agricultural commodities« The study has special interest at this tinae because of the decline in U.S. exports inrecent years and the sharp build up in U.S. cotton stocks.
This b\i£lètin describes economic trends and measures the effect of principal Wcono^DCiic favors tiMt affect U.S. cotton exports. Information and results developed iir th^ study are expected to be of special value to those involved in fornciulating policies and program.s affecting the cotton industry. It should be of value also to producer groups, ginners, warehousemen,merchants, shippers, textile manufacturers, and other segncients of the textile industry.
Xhe ^l^ii^^cknowledge assistance from, many of their colleagues in the U,S. Dep^akent of Agriculture: Frank Lowenstein, Staff Econonaist Group; James P. Cavin, Director, Economic and Statistical Analysis Division; and Will M, Simm.ons, Chief of the Commodity Analysis Branch of that Division, Economic Research Service, col- laborated in preparing the manuscript for publication. Anthony S. Rojko, Alvin C. Egbert, and C. Curtis Cable, Jr., Economic Research Service; Charles H. Barber, Foreign Agricultural Service; and John F. Cooke, Agricultural Stabilization and Conservation Service, made valuable suggestions that were included in the naanuscript.
For sale by the Sijperintendent of Documents, U.S.Government Printing Office Washington, D.C. 20^Q2
CONTENTS
Page
Highlights. • . . . . 1 Part I. Background and economic trends ..»•.•••.. 2
Introduction «••.•...••••..•..•••.«««•.••••••••* 2 World cotton situation . ••«••«•••••• •••••..«o«*....*. 3
Trends in production ..»•.«•••••.•..••.•• 5 Trends in consum.pt ion ...•••..•.»••...••••«•••«•o. 10 Competition with naan-nciade fibers .•••.•...•.••••■•...•. 13
Changes in carryover stocks •••.••.•••....••••.••••«•« 17 World exports and the U.S. share . ,••.•••.•»••«•••.««•••• 19 Prices of U.S. and foreign-grown cotton in import markets .•«.•••... 23
Part II. Evaluation of factors affecting U.S. cotton exports . . ........ 24 World trade and U.S. exports •.••••... •.•..•••..•• 24 Factors affecting world cotton consumption. •...«..•..«• •••••. 25 Results of statistical analyses of world demand for cotton. •••••••••• 26 Analysis of world production .••....«.•..••..••••o..... 28 Analyses of factors affecting U.S. exports of cotton to
Free-World countries ••.••....«... 28 Factors affecting foreign Free-World cotton consumption. 28 Results of statistical analysis. .«•«••.••• •.••...•• 29 Elasticity of demand for cotton •.•....•.•.«• ••>.o ...... • 30 Factors used in statistical analysis of foreign Free-World cotton acreage 31
Results of statistical analysis • .....•.•••••. 32 Elasticity of acreage in foreign Free-World. 34 Combined effects of price change on foreign Free-World production and consumption •..«..•«..••. .•««...•..••* 35
Relative prices and U.S. cotton exports • •••••.*..•«• • 36 Other factors affecting U.S. exports of cotton. ••••••».••••••#•. 37 U.S. trading practices ..••..«.••.•••••.•.•••..•*.••• 37 Cotton policies of foreign governments •.•.«•.•..••.••.••••. 3g
Literature cited *•.•••«••..•...•••.»..• 33 Appendix A: Tables 10 to 19 •«••••••••••••••«••••>•••«« • 40 Appendix B: Data used in statistical analysis •»-table s 20-24 • •••.•«••«.^9
11
May 1966^

ANALYSIS OF FACTORS AFFECTING U.S. COTTON EXPORTS
By William E, Cathcart and James R, DonaldJ./
HIGHLIGHTS
The economiic welfare of the domestic cotton industry and of the many small communities of the Cotton Belt depends on U.S. exports of cotton. During 1955-64, U.S. exports of cotton averaged 5,2 million bales --37 percent of donciestic production during that period.
Part I of the study indicates that world production and consumption of cotton have trended upward during this period« Production has increased because more countries are engaged in producing cotton and yields have been rising. Consumption also has been rising, particularly in some cotton-producing countries where textile industries have been developed and expanded in recent years. World cotton trade has not increased as muchas consumption, reflecting greater consumption from donaestic production in many countries.
The trend and pattern in world consumption of cotton has been significantly in- fluenced by the use of man-made fibers. World consumption of these fibers rose frona 2.1 billion pounds in 1947 to 10.9 billion pounds in 1964. The use of cotton has not kept pace with the increased use of other fibers. As a result, cotton's share of total fiber consumption dropped from 73 percent in 1949 to about 62 percent in 1964.
Changes in the size of world cotton production in relation to consunaption are reflected in changes in world cotton stocks. Since 1947, world stocks have varied widely, with most of the change occurring in U.S. stocks.
World cotton exports in the postwar period have ranged from a low of 8.6 million bales in 1947-48 to a record 17.9 naillion in 1963-64, The U.S. share of world exports has trended downward for many years. Before the middle 1930*s, U.S. cotton exports accounted for more than half of world trade in cotton. For 1961-64, the U;S. share averaged about 28 percent.
Cotton prices in foreign inaport markets have fluctuated widely in the postwar period« Early in the Korean conflict, world prices advanced sharply, then declined sharply in 1951-52 as world production increased. During the 1950*s, increased supplies of cotton continued to exert pressure on world markets, and by mid-1959 prices were at their lowest levels in many years. Prices strengthened over the next two seasons, then weakened in 1963 following record foreign crops and a slowdown in textile activity.
Part II of the study examines major economic factors affecting world cotton consumption, including population, the level of economic activity, prices of cotton, and prices of competing fibers. During 1948-62, cotton price, world index of industrial production, and non-cellulosic fiber consumption explained 92 percent of the year-to- year variation in world cotton consunaption. The demand elasticity for cotton with respect to price was -0,25, which nrieans that on the average a 1-percent increase in
J./ Mr, Cathcart is an Agricultural Economist in the Cotton and Other Fibers Section and Mr, Donald is Head of the Cotton and Other Fibers Section, Comnaodity Analysis Branch, Economic and Statistical Analysis Division, Econonaic Research Service,

the world price of cotton was associated with a 0,25-percent decline in cotton con-* sumption. The index of industrial production and non-ceUulosic fiber consumption also were inaportant determinants of world cotton consumption.
In an analysis of foreign Free-World (FFW) mill consuinption, per capita income, cotton prices, and consumption of non-cellulosic fibers explained 85 percent of the variation in consumption of cotton. The elasticity of FFW demand for cotton with respect to price was -0,27# Converted to bales of cotton, using 1963 price levels, this would mean that a 1-cent-per-pound decrease in the price of cotton would result in a 135,000«bale increase in FFW consumption at 1963 population levels. Per capita income also was an important determinant of foreign Free-World consumption, with non-cellulosic fiber consiimption having less influence.
In an analysis of foreign Free-World cotton acreage, world prices and trend factors explained 97 percent of the variation in acreage, Al-cent change in the world price of cotton was associated with a change in the sanae direction of 228,000 acres of cotton in the following year. Using average 19^3 yields, this wo\üd represent about 100,000 bales of cotton.
The combined effect on the demand for U,S, cotton exports of a 1-cent-per-pound change in price of cotton, other factors unchanged, would therefore be the total of the change in FFW consumption and production. Assuming no stock changes, FFW dem^and for U.S. cotton exports would be increased by 235,000 bales--the combined total of the increase in FFW consumption and the decrease in FFW production. The total consumption and production response to a price change for cotton does not occur during the first year; thus the results of a given price change, if maintained, could mean a somewhat greater effect after a few years,
A comparison of prices of U,S, and Mexican-grown cotton showed that there was little shift in foreign buying from U.S. cotton to foreign growths in years when U,S, prices were only slightly higher. However, when the differential widened, as in 1955- 56 and 1958-59, there was a sharp shift to foreign growths and U.S. cotton exports dropped sharply,
PART I. BACKGROUND AND ECONOMIC TRENDS
Introduction
The econondic welfare of the U.S. cotton industry is directly related to the U,S, share of world cotton trade, U.S. cotton exports are vital in maintaining farm income and are inaportant to the overall level of econonaia activity in cotton-producing States, The profits and employncient level of ginners, warehousenaen, naerchants, farm.-supply firm.s, and other businesses are affected by the volume of cotton exports. Despite current pro granas of acreage allotnaents and reduced costs to donaestic users, recent crops have been greatly in excess of current and prospective naill consumption.
Cotton is the largest cash crop grown in the united States, accounting for about 7 percent of total cash receipts received by farmers during 1964, In many of the major cotton-producing States, cotton accounts for a much larger share of farm cash receipts. For example, Mississippi cotton comprised about 48 percent of the that State's total farna cash receipts in 1964,
In 1959-63, U,S. naills consumed only 59 percent of yearly production, leaving 41 percent of the crop to be exported or added to Conamodity Credit Corporation stocks.

Until sometime after the end of World War Ig the United States was the world's largest exporter of cotton; since then, however^ both the level of U.S. exports and this country's share of world exports have been declining. The downward trend in exports, in both absolute and relative terms, started in the 1920's and continued into the early 1940*s. World War II disrupted world markets, with U.S. cotton exports falling to about U2 million bales in 1940-41. After the war, world cotton trade trended sharply upward. U.S. exports did not share in the increased trade, however, and in the early 1950*s fell to low levels. Following the establishment of U.S. export programs in the mid-1950*s, exports and the U.S. share of the world market both increased. But in the late 1950*s and early 1960's, U.S. exports did not rise proportionately with in- creasing world trade, although the United States remains the largest cotton exporter.
Distinct changes have taken place in the volume and sources of the world's cotton supply in the postwar years. Much m.ore cotton is being produced in foreign countries, with more countries engaged in production. Many of these new producing countries have become net exporters of cotton, where previously they were net importers.
A great nnany factors influencing U.S. cotton exports have only nvinor significance when considered alone, but assume greater importance when considered together (fig. 1). These factors are both short-term and long-term. For exainple, year-to- year changes in cariyover stocks, which reflect cyclical changes in economic activity of foreign countries and expected price changes, are important during a given season in explaining the level of U.S. exports. Longer-run factors--including economic and population growth, foreign cotton production and consumption, relative cotton prices, and competition from m.an-made fibers--are of vital importance in determining the levels of both U.S. exports and world cotton trade. To illustrate, when reso^lrces are committed to the production of man-made fibers or the production of cotton in foreign countries, the trend thereby established is difficxilt to reverse. As a result, potential m.arkets for U.S. cotton are reduced.
Of the many factors that influence U.S. exports, the economic ones predominate. The prim.ary purpose of this study is to investigate the economic relationships that influence both the volume of world trade in cotton and the U.S. share of this trade. As far as possible, the study attempts to obtain quantitative approximations of these relationships. The naain emphasis is placed on the analysis of factors affecting foreign consumption and production of cotton, since the past and future levels of U.S. exports are largely determined by these two factors. The analyses are limited to the post-World War II period and to the FFW because of lack of reliable data for many countries.
The foreign world is divided into the foreign Free World (FFW) and Comjnciunist countries. For all years throughout the report, FFW and Comtmunist countries* booindaries are assumed to be the sam.e as those existing in 1965. Communist co\intries include the U.S.S.R., Mainland China, and Eastern European coiintries. Names of countries are those used in 1965. Except where otherwise indicated, years are crop years beginning August 1.
World Cotton Situation
Striking changes have occurred in the volume and source of world cotton pro- duction, consumption, and trade during the past 15 years. The ntimber of countries growing cotton and the volume of production have increased sharply. During 1947, only 16 foreign countries produced 100,000 bales or more of cotton annually; by 1964^ 25 couiitries were producing over 100,000 bales annxially.
- 3 -

FACTORS INFLUENCING UNITED STATES RAW COTTON EXPORTS
PER CAPITA INCOME
PRICES OF COMPETING
FIBERS
I
I
EXPECTED PRICE
FOLLOWING YEAR
U.S. GOV'T POLICIES AND REGULATIONS
CHANGE IN FOREIGN STOCKS OF
RAW COTTON
PRICE UNITED STATES RELATIVE TO
FOREIGN GROWTHS
I T
POPULATION
FOREIGN MILL CONSUMPTION
OF COTTON
I
UNITED STATES RAW COTTON
EXPORTS
FOREIGN COTTON
PRODUCTION
£ WEATHER, CULTURAL
PRACTICES, INSECTS a DISEASES
PRICES PRECEDING
YEAR
I PRICES OF
COMPETING CROPS
I
FOREIGN ACREAGE
YIELD PER ACRE
GOVERNMENT POLICIES AND REGULATIONS
U.S. DEPARTMENT OF AGRICULTURE NEC. ERS 4470-66(4)
Figure 1
ECONOMIC RESEARCH SERVICE

Trends in Production
World cotton production exceeded world consumption for each of the 3 years^ 1962-64, by am average of 2,5 million bales« Most of the excess world production was reflected in a buildup of Ü.S. stocks« FFW cotton stocks during that period rem.ained relatively stable at around 10 million bales.
World cotton production reached a pre-World War II high of 39.0 m.illion bales in 1937, Production dropped sharply during the war, declining to 2L1 million bales in 1945« Following the war, world production increased sharply and in 1953 reached the postwar high of 42.2 million bales« Production continued to trend upward and in 1964 totaled 5L9 m.illion bales, an all-time high (appendix table 10 and fig« 2)« Average production for 1959-63 was 47«3 million bales--55 percent larger than the 30«5 average for 1934-38« During this period, there were substantial changes in the geographic pattern of world production (table 1)« The m.ost notable change outside the United States was the percentage increase in production in Communist countries«
Table 1.—Cotton prociuction: Foreign Free Worlci, United States, Communist countries, anci worlci—annual average for 193^-38 anci 1959-63 anci percentage increase
Region or country [ Average 193^-38 1/ [ Average 1959-63 1/ : Increase in
[ Quantity : Share of , : world total
; Quantity : Share of : world total
Î production
Foreign Free World.... United States••.••.••
; 1,000 ! bales
Î 11,687 : 12,712 Î 6,129
Percent
38 te 20
1,000 bales
19,776 14,670 12.805
Percent
42 31 27
Percent
69 12
Communist countries.. 109 World : 30,528 100 47,251 100 55
l/ Crop year beginning August 1.
FFW countries produced 8«9 m.illion bales of cotton in the 1947-48 crop year-- about 35 percent of the world's crop of 25«5 m^illion« During the Korean conflict, with short supplies and sharply rising world prices for cotton, production increased over 50 percent to 13.8 million bales in 1952« FFW acreage and production continued to set new highs every year, except in 1956 and 1959« Production totaled 22«9 m.illion bales in 1964, a 157 percent increase from. 1947. This contrasts with the United States where acreage controls were instituted in 1954 and acreage has been at lower levels since then; planted acreage in the United States declined from about 19#3 million acres in 1954 to 14«1 million in 1964« In FFW countries, cotton beeancie increasingly important as a cash crop, an earner of foreign exchange, and a raw material for textiles for both domestic use and export«
During 1947-64, FFW cotton production increased at an average anniial rate 2/ of 4«9 percent, or the equivalent of 764,000 bales a year. Growth was much slower in
2/ The methodology used in this study for computing the average annual rate of change consists of fitting a trend line of the exponential type directly to the natural nunabers, rather than to their logarithms, as in least squares« See Glover (9^)^ Mills (16), and Burns (2^). Underscored figures in parentheses refer to Literature Cited p. 38 .
- 5 -

COTTON PRODUCTION MIL. BALES*
1947 1950 1953 1956 1959 1962 1965 YEAR BEGINNING AUGUST 1. * 500 POUND GROSS WEIGHT BALES.
U.S. DEPARTMENT OF AGRICULTURE NEG. ERS 4456-66(4) ECONOMIC RESEARCH SERVICE
Figure 2
the last part of this period. During 1955-64, the average annual rate of increase was 4.3 percent, or the equivalent of 792,000 bales (fig. 3).
Production increases have been accomplished through both increased acreage and higher yields per acre. Acreage expansion in foreign countries has responded to the profitability of cotton as a cash crop and earner of foreign exchange. Higher yields have been obtained by the increased use of irrigation and fertilizers, better insect and disease control, and more widespread use of other improved ciütural practices. Government action by the various foreign countries is also important in determining how much land and other physical resources are devoted to the pro- duction of cotton.
World acreage of cotton averaged 80.1 million acres annually during 1959-63'-*-about 2 percent below the 81.6 m.illion average for 1934-38 (table 2^ appendix table 11, and fig« 4). Although world acreage declined slightly, foreign acreage increased 22 percent. The small decrease in world cotton acreage resiilted from a decline of 13.2 million acres in U.S. acreage, which fell to 19 percent of world acreage in 1959-63.
Since the m.id-1950's, the rate of increase in cotton acreage in FFW coxintries slowed, partly because of lower world prices than in the early 1950*s. The rate of increase in production also slowed, although yields continued to rise at an increased rate (table 3 and fig. 5)*
FFW cotton acreage in 1955-64 increased at an average annual rate of 0.9 percent compared with 2,8 percent for 1947-64, while yields increased at an increased rate of 3.4 percent compared with 2.1 percent for 1947-64 (fig. 5). The decline in the rate of increase in acreage more than offset the increased yield, slowing the rate of expansion in production. Output in FFW countries increased at a rate of 4.3 percent for 1955-64, which is somewhat less than the 4.9 percent for 1947-'64.
- 6 -

FOREIGN FREE WORLD COTTON PRODUCTION AND CONSUMPTION
MIL.
20
15
10 1950-51 '55-56 '60-61 '65-66
CROP YEAR BEGINNING AUGUST 1. 1964-65 ESTIMATED. 4e PLOTTED ON RATIO SCALE WHERE EQUAL VERTICAL DISTANCES REPRESENT EQUAL PERCENTAGE CHANGES.
U. S. DEPARTMENT OF AGRICULTURE NEC. ERS 3681-65(5) ECONOMIC RESEARCH SERVICE
Figure 3
COTTON ACREAGE MIL ACRES
World Total
1947 1950 1953 1956 1959 1962 1965 YEAR BEGINNING AUGUST 1.
U.S. DEPARTMENT OF AGRICULTURE NEC. ERS 4457-66(4) ECONOMIC RESEARCH SERVICE
Figure 4
- 7 -

Table 2.—Cotton acreage: Foreign Free World, United States, Communist countries, and -world—annual average for 193^-38 and 1959-63 and percentage change
Region or country [ Average 193^-38 Average ̂ 1959-63 ;
, Change in
[ Quantity [ Share of ! •world total .
« [ Quantity '
• Share of ;
world total ; acreage
Foreign Free World.... United States
; 1,000 acres
5 ¿^0,761 : 28,400 : 12,427
Percent
50 35 15
1,000 acres
47,566 15,168 17,404
Percent
59 19 22
Percent
17 -47 40 Communist countries...
World 1 81,588 100 80,138 100 9
Table 3.—Cotton acreage, yield, and production--average annual rates of change, 1947-64 and 1955-64
Area Average 1947-64
Acreage * Yield * Production
Average 1955-64
Acreage ' Yield * Production
Percent Percent
Mexico : 2.4 Central America : 12.0 Argentina : 0.9 Brazil : 1.4 Peru : 3-9 South America Íexcept : 2.6
Brazil) : Spain : 13.0 Greece : 8.1 Western Europe : 3-8 India : 2.9 Iran : 8,6 Pakistan : 1.2 Syria : 8.7 Turkey : 3.6 Asia (except India, : 4.9
Pakistan, and ; Mainland China) :
Egypt : 0.6 Sudan c, •. : 6.6 Africa (except Egypt : 2.6
and Sudan) : Forei gn Free World : 2.8
Percent Percent Percent Percent
4.7 6.5 -2.8 3.8 1.0 6.7 18.6 10.6 3.2 17.0
-0.8 0.0 0.0 -0.9 -1.2 1.0 3.2 4.2 2.8 7.0 0.6 k.6 2.3 1.3 3.9 1.2 3.7 2.6 1.0 3.5
7.3 16.8 5.9 6.5 12.0 3.3 10.9 2.5 3.3 5.6 6.8 10.0 -1.6 7.3 5.9 1.5 k.k -0.4 3.2 2.8 2.5 11.0 6.7 2.0 8.6 2.2 3.4 0.2 3.7 4.0 2.9 12.8 1.7 5.6 7.6 3.0 6.9 0.5 6.6 7.3 3.6 8.4 2.4 4.4 7.1
1.1 1.7 -0.8 4.4 3.3 -0.6 6.1 6.5 -1.9 5.0 0.8 3.4 0.7 0.9 1.6
2.1 4.9 0.9 3.4 ^.3
World average per-acre yields of cotton have trended upward at much faster rates than cotton acreage in recent years. World cotton yields averaged 283 pounds per acre during 195^-63, about 57 percent above the 180-pound average for 1934-38 (appendix table 12). During this period, U.S. cotton yields increased by 119 percent, compared with 49 percent in the Comnaunist coiintries and 45 percent in foreign Free-World countries (table 4).
- 8 -

I
NO
I
FOREIGN FREE WORLD COTTON ACREAGE AND YIELD
MIL ACRES
50
40
30
I Acreage^ AV. ANN. RATE OF CHANGE
LB. PER ACRE
250
J L
Yield* AV. ANN. RATE OF CHANGE
1947-64 trend •• 1955-64 trend
J I I I I I I L 1
200
150
1950-51 '55-56 00-61 '65-66 CROP YEAR BEGINNING AUGUST 1. 500 POUND GROSS WEIGHT BALES. 1964-65 ESTIMATED.
4C PLOTTED ON RATIO SCALE WHERE EQUAL VERTICAL DISTANCES REPRESENT EQUAL PERCENTAGE CHANGES.
U.S. DEPARTMENT OF AGRICULTURE NEG. ERS 3682-65(5) ECONOMIC RESEARCH SERVICE
Figure 5
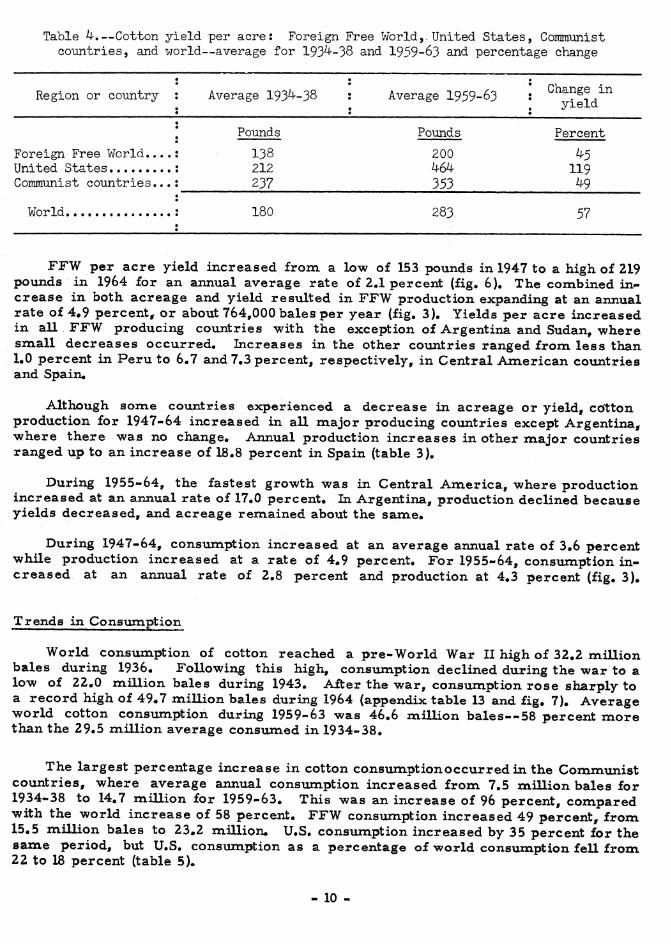
Table ¿I-.—Cotton yield per acre: Foreign Free World,. United States, Coinmimist countries, and world—average for 193^-38 and 1959-63 and percentage change
Region or country ; Average 193'^-38 : Average 1959-63 1 Change in : yield
Foreign Free World.... United States
! Pounds
: 138 ! ?1? ! 237
Pounds
200
353
Percent
119 1^9 Communist countries,..:
World 180 283 51
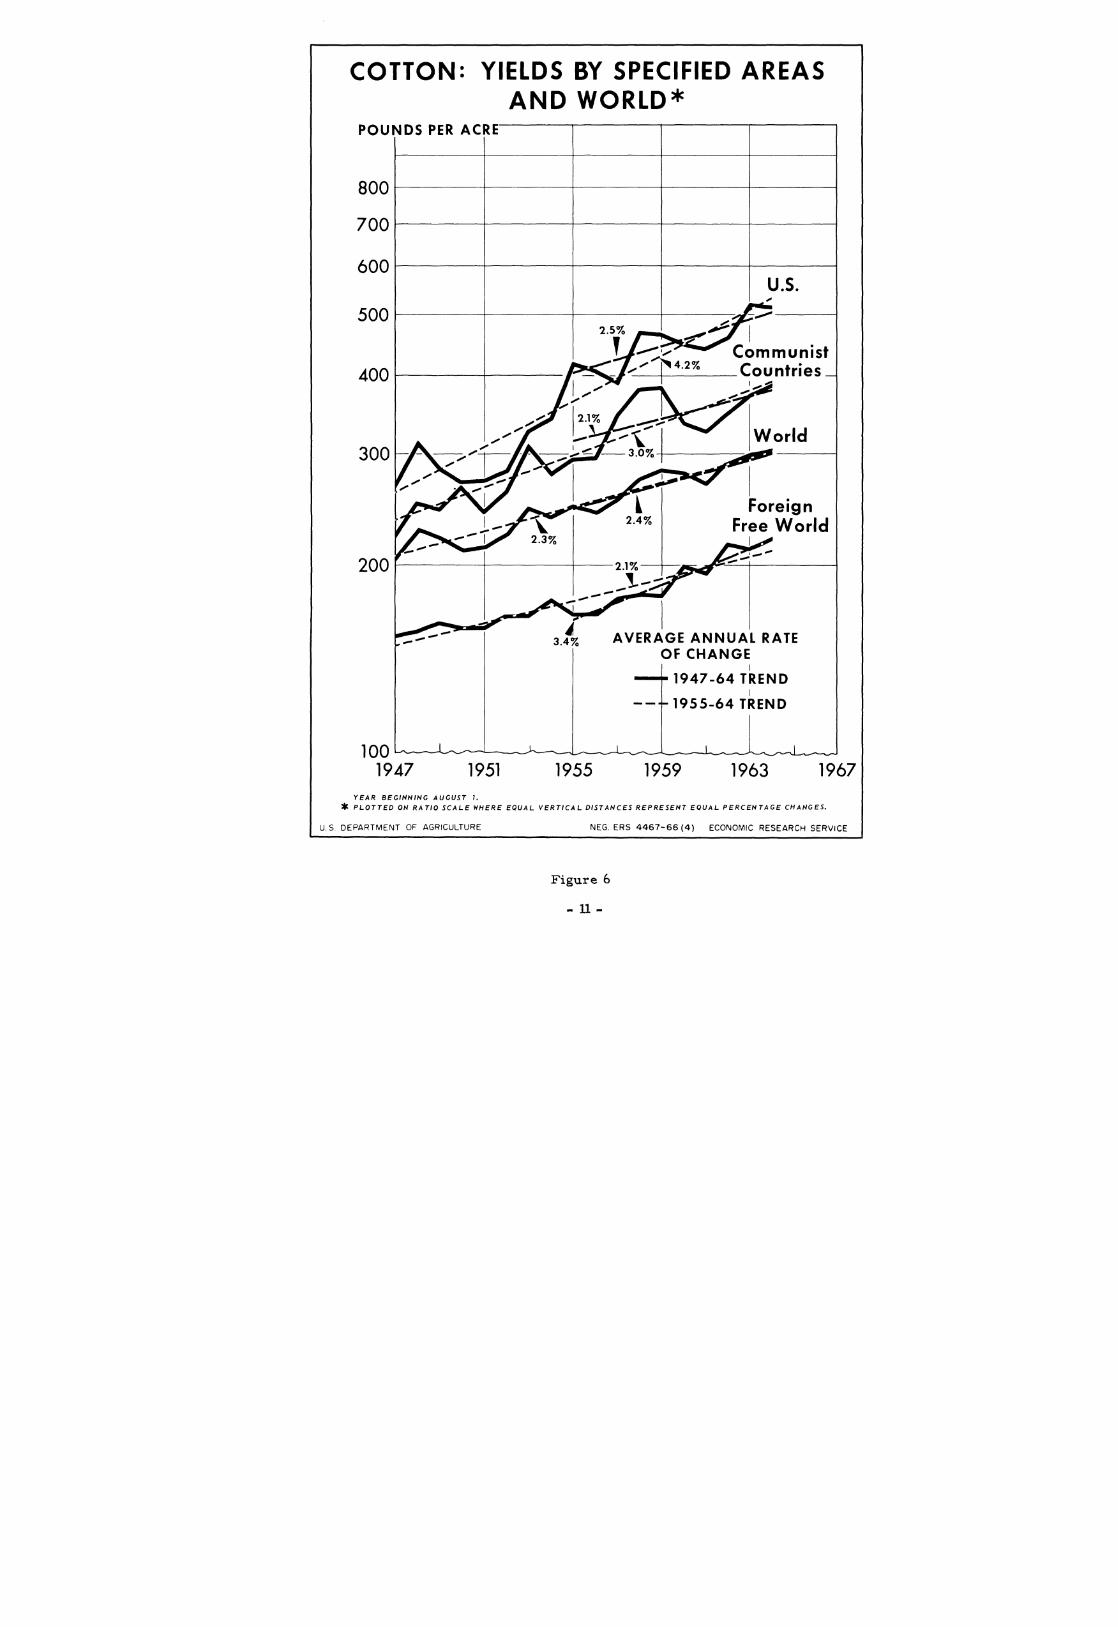
FFW per acre yield increased from a low of 153 pounds in 1947 to a high of 219 pounds in 1964 for an annual average rate of 2.1 percent (fig, 6), The combined in- crease in both acreage and yield resulted in FFW production expanding at an annual rate of 4^9 percent, or about 764,000 bales per year (fig. 3). Yields per acre increased in all FFW producing countries with the exception of Argentina and Sudan, where snaall decreases occurred. Increases in the other coTontries ranged from less than 1.0 percent in Peru to 6.7 and 7.3 percent, respectively, in Central American countries and Spain.
Although some coirntries experienced a decrease in acreage or yield, cotton production for 1947-64 increased in aU m.ajor producing countries except Argentina, where there was no change. Annual production increases in other naajor countries ranged up to an increase of 18.8 percent in Spain (table 3).
During 1955-64, the fastest growth was in Central America, where production increased at an annual rate of 17.0 percent« In Argentina, production declined because yields decreased, and acreage rem.ained about the sancie.
During 1947-64, consunfiption increased at an average annual rate of 3.6 percent while production increased at a rate of 4.9 percent. For 1955-64, consumption in- creased at an annual rate of 2.8 percent and production at 4.3 percent (fig. 3).
Trends in Consumption
World consumption of cotton reached a pre-World War II high of 32.2 million bales during 1936. Following this high, consumption declined during the war to a low of 22.0 million bales during 1943. After the war, consumption rose sharply to a record high of 49.7 million bales during 1964 (appendix table 13 and fig. 7). Average world cotton consumption during 1959-63 was 46.6 m^illion bales--58 percent more than the 29.5 million average consximed in 1934-38.
The largest percentage increase in cotton consunaptionoccurredin the Concimiunist countries, where average annual consumption increased from 7.5 m^illion bales for 1934-38 to 14.7 million for 1959-63. This was an increase of 96 percent, compared with the world increase of 58 percent. FFW consumption increased 49 percent, from 15.5 naillion bales to 23.2 nciillion. U.S. consumption increased by 35 percent for the sanae period, but U.S. consumption as a percentage of world consumption fell from 22 to 18 percent (table 5).
10
COTTON: YIELDS BY SPECIFIED AREAS AND WORLD*
POUNDS PER ACRE
800
700
600
500
400
300
200
Communist Countries-
World
foreign Free World
100 1947
3.4% AVERAGE ANNUAL RATE OF CHANGE
1947-64 TREND
1955-64 TREND
1951 1955 1959 1963 1967 YEAR BEGINNING AUGUST 1.
* PLOTTED ON RATIO SCALE WHERE EQUAL VERTICAL DISTANCES REPRESENT EQUAL PERCENTAGE CHANGES.
U.S. DEPARTMENT OF AGRICULTURE NEC. ERS 4467-66(4) ECONOMIC RESEARCH SERVICE
Figure 6
- U -

COTTON GONSUMPTION MIL BALES*-
1947 1950 1953 1956 1959 1962 1965 YEAR BEGINNING AUGUST 1.
US. DEPARTMENT OF AGRICULTURE
^500 POUND GROSS WEIGHT BALES,
MEG. EPS 4455-66(4) ECONOMIC RESEARCH SERVICE
Figure 7
Table 5.--Cotton consuinption: Foreign Free World, United States, Communist countries, and ^orId-annual average for 193¿^-38 and 1959-63 and percentage increase
Region or country Average 1934-38
Share of
Average 1959-63
Share of
; 1,000 I bales • ———«—
Foreign Free World....: 15,533 United States : 6,1^27 Communist countries... : 7,523
•Quantitv' "^'^^^^^ "i • A.,=V.+ -4. * Share of : . quantity. ^^^.^^ ^^^^ . Qoantity. ^^^^^ ^^^^^ ^
World ,. ; 29,483
Percent
53 22 25
100
1,000 bales
23,215 8,657
14,734 46,606
Percent
50 18
100
Increase in consumption
Percent
49 35 96 58
cott«n^r.t. . accounted for about half of the total world mill consumption of cotton in recent years. Consumption in these countries increased sharply from 13 5 mOlxon bales in 1947 to a record 24.9 miUion bales in 1964/During t^%7odmm of ^ro?o°h /""'"'Í ^* "" ^""^«" ^nual rate of S.épercenîforthrequfvaUn^ or 6ol'ûOO 11^' ^^^^"^y- ^i>^-^g 1955-64, the annual rate of increase was 2.8 percen or 608,000 bales per year (fig. 3). y^-L^^i^i.
irr.J¡^i^ consumption trended upward during the postwar period in aU major importing^and exporting countries, with the exception of the United Kingdom, Belgian and Canada, where mill consumption of cotton either showed no signScaS cSngH;
- 12 -

declined» The sharpest decrease occurred in the United Kingdom, where consumption declined at an average annual rate of 4.4 percent. The largest increase in con- sumption occurred in such textile exporters as Japan and Hong Kong.
During 1955-64, consumption continued to rise in all naajor countries except Argentina, the United Kingdom, France, West Germany, and Belgium. The rates of increase in consumption were generally less than for the longer period. However, in a few countries-^those in Central America, for example--the rate was greater for the shorter period (table 6). Much of the increase in world consunaption can be accounted for by increased consumption in foreign producing coxintries.
During 1947-64, world cotton consumption increased by 71 percent as world population increased by about 38 percent. On a percentage basis, world population has increased at a relatively constant average annual rate of about 2 percent during this period, while world cotton consumption increased at an average annual rate of 3 percent.
Although U.S. per capita domestic cotton consumption has trended downward in recent years, it is still the highest of any country in the world« 3/ It was 22.6 pounds per person in 1964. Per capita cotton consumption varies widely from region to region and from country to country within a geographical region. For example, per capita dom.estic cotton consumption averaged 2,6 pounds in Africa during 1960-62. 4/ This compares with average per capita cotton consumption of 10,8 pounds for Western Europe during the same period. In the Far East, Japan has been the leading consunaer of cotton, in terms of both m.ill consumption and actual dom.estic consirmption. Per capita domestic consumption in Japan averaged 11.9 pounds for 1960-62, com.pared with 4,6 pounds in India and about 1.5 pounds in Cambodia. Japan's per capita mill consumption of cotton for the same period averaged 16.5 pounds. This indicates the importance of Japan's textile trade in its overall denaand for raw cotton.
Competition With Man-Made Fibers
World consTinaption of cotton has been adversely affected by the increase pro- duction and use of m.an**m.ade fibers. World consximption of man-nciade fibers rose from 2.1 billion pounds in 1947, or 12 percent of total fiber consumption, to 10.9 billion pounds, or 29 percent of the total in 1964,
This has m.eant that, while the absolute level of world cotton consumption has been increasing, consumption of cotton has not increased as fast as the use of man- m.ade fibers. The resixlt has been a declining share of the textile nrtarket for cotton. In 1964, cotton's share of world consumption of textile fibers was about 62 perceiît, down from 73 percent in 1949 (appendix table 14 and fig. 8). l^ian-made fiber con- sumption has increased sharply in the FFW since the early 1950's. While the market share for wool has declined and rayon fiber has remained about the same, the use of non-cellulosic fibers (soncietimes called synthetic fibers) has increased sharply»
3/ U.S. domestic cotton consumption is mill consum.ption plus the raw cotton equivalent of U.S. textile im^ports minus the equivalent of textile exports. Donciestic consum^ption was slightly larger than m.ill consxamption in naost years in the early 1960's.
4/ The Food and Agriculture Organization of the United Nations compiles per capita fiber consumption for most countries, based on mill consumption and balance of foreign trade (6^).
- 13 -

Table 6.—Cotton consumption: Average annual rates of change, 19^7-6^ and 1955-64
Area or country ] 19^7-64 [ 1955-6^4-
: Percent Percent
Canada : — 2.8 Mexico., • : 3.9 2.4 Central America : 7.8 10.4 Argentina : 0.9 -2.7 Brazil : 3.4 2.9 South America (less Argentina : and Brazil) : 4.9 5.2
Belgium : -0.4 -1.2 France : 0.9 -0.2 West Germany : 1.0 -0.8 Italy : 1.0 3.I Netherlands : 2.3 .9 Spain : 4.4 2.9 Greece : 3.6 4.8 United Kingdom : -4.4 -5,2 Western Europe (total) : 0.9 0.3 Hong Kong : 14.5 12.2 India : 2.8 2.7 Japan : 4.2 3,6 Pakistan : 13.5 ¿^,,5 Turkey , : 6.3 1.2 Asia (less India, Mainland China, : Japan, and Pakistan) : 10.7 5,3
U.A.R. (Egypt) : 6.9 5.9 Africa (less U.A.R.) : 10.4 11.3 Foreign Free World .....: 3.6 2.8
The increased market share for non-cell\ilosic fibers has been the primary cause of the declining share for cotton. Cox (4) and Home (U) indicated that the competition between cotton and man-made fibers was on the bas is of price, of quality and promotion, or a comtbination of these and others. Donald^ Lowenstein, and Simon (5) pointed out that the non-cell\ilosic fibers have had a significant effect on cotton consumption in the United States, because of their wide range of uses and high rates of substitution for cotton«
The non-cellulosic fibers are generally priced higher than cotton. However, with the economies of large-scale production, prices of these fibers may decline relative to cotton prices. Also, they have less processing waste than cotton, and nao re yarn can be spxin from a given unit of non-cell\ilosic fiber than from a similar unit of cotton.
Donald, Lowenstein and Simion (5) developed fiber conversion factors that convert data onm.an-m.ade fibers to a cotton equivalent basis. These factors adjust man-made fiber statistics to allow for differences in fiber utility, or for differences in the amount of usable fiber and yards of comiparable fabric obtainable from a pound of fiber (appendix table 15). These conversion factors show the amount of cotton that would be required to replace each of the other fibers. In appendix table 15, these factors were applied to m.an-m.ade fiber production figures. On this basis, 1964
- 14 -
COTTON CONSUMPTION As Percent of Ail Fibers
PERCENT
90
80
70
60
Communist Countries .^L ^ .
United States
Foreign Free World
-~J L- 50 1949 1952 1955 1958
J L
1961
YEAR BEGINNING JANUARY 7.
U.S. DEPARTMENT OF AGRICULTURE NE6. ERS 4460-66 (4)
1964 1967
ECONOMIC RESEARCH SERVICE
Figure 8
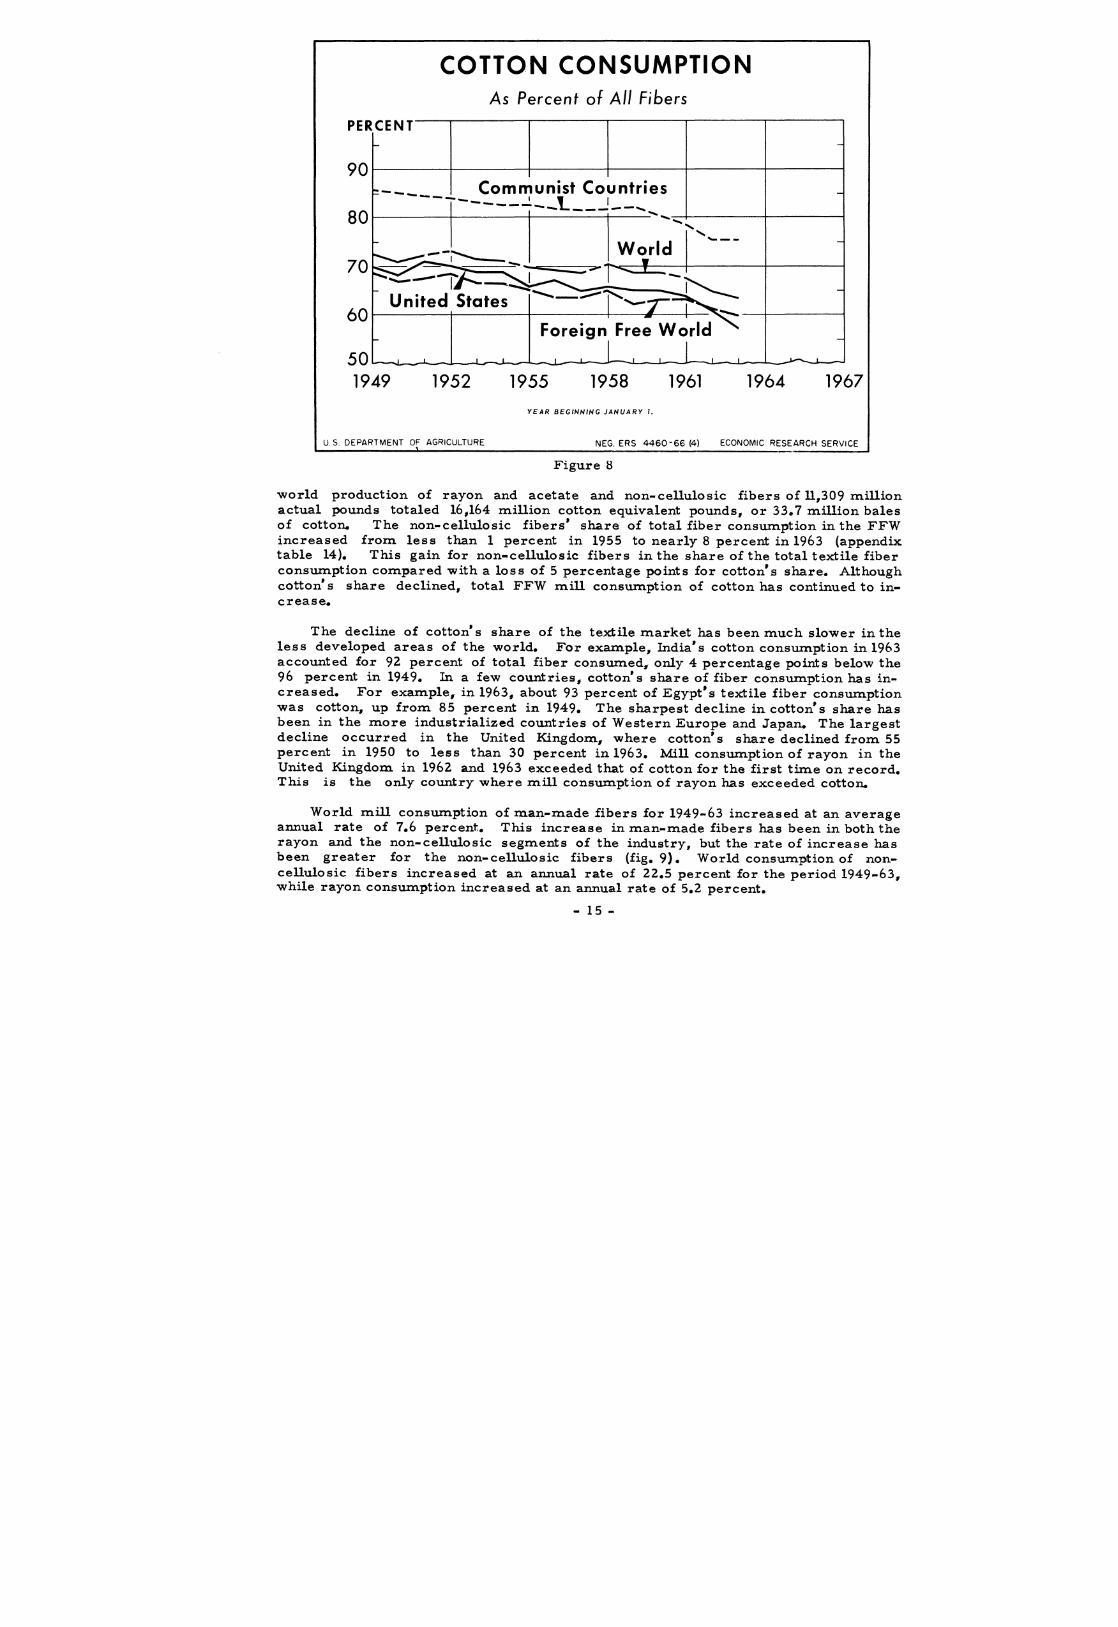
world production of rayon and acetate and non-cellulosic fibers of 11,309 rnillion actual pounds totaled 16,164 million cotton equivalent pounds, or 33.7 million bales of cotton. The non-cellulosic fibers' share of total fiber consumption in the FFW increased from less than 1 percent in 1955 to nearly 8 percent in 1963 (appendix table 14). This gain for non-cellulosic fibers in the share of the total textile fiber consiinaption conapared with a loss of 5 percentage points for cotton's share. Although cotton's share declined, total FFW m.ill consumption of cotton has continued to in- crease.
The decline of cotton's share of the textile nciarket has been m.uch slower in the less developed areas of the world. For example, India's cotton consum.ption in 1963 accounted for 92 percent of total fiber consumed, only 4 percentage points below the 96 percent in 1949. In a few countries, cotton's share of fiber consiimption has in- creased. For example, in 1963, about 93 percent of Egypt's textile fiber consumption was cotton, up from 85 percent in 1949. The sharpest decline in cotton's share has been in the m.ore industrialized coxintries of Western Europe and Japan. The largest decline occurred in the United Kingdom, where cotton's share declined from. 55 percent in 1950 to less than 30 percent in 1963. Mill consum.ption of rayon in the United Kingdom, in 1962 and 1963 exceeded that of cotton for the first time on record. This is the only country where mill consumption of rayon has exceeded cotton.
World mill consunaption of man-naade fibers for 1949"63 increased at an average annual rate of 7.6 percent. This increase in m.an-made fibers has been in both the rayon and the non-cellulosic segments of the industry, but the rate of increase has been greater for the non-cellulosic fibers (fig. 9). World consum.ption of non- cellulosic fibers increased at an annual rate of 22.5 percent for the period 1949-63, while rayon consTinaption increased at an annual rate of 5.2 percent.
- 15 -

WORLD MILL CONSUMPTION OF TEXTILE FIBERS*
MIL LBS. 80,000
60,000
40,000
20,000
10,000 8,000
6,000
Total Fiber 4.0%
Ota I Man-made 7.6%
1949 1951 1953 1955 1957 1959 1961 1963 YEAR BEGINNING JANUARY U
* PLOTTED ON RATIO SCALE WHERE EQUAL VERTICAL DISTANCES REPRESENT EQUAL PERCENTAGE CHANGES.
U.S. DEPARTMENT OF AGRICULTURE NEC. ERS 4468-66(4) ECONOMIC RESEARCH SERVICE
Figure 9
- 16 -

Mill consumption of man-made fibers in 1963 was largely concentrated in the more industrialized countries of the world, with the United States, Western Europe^ and Japan accounting for about 72 percent of world consiimption of these fibers (table ?)• Of the 1963 total, the United States accounted for 27 percent; Western Europe, 31 percent; Japan, 14 percent; and the Communist countries, 16 percent« Man-made fiber consumption has remained relatively snaall in all of the major cotton producing countries of the FFW. For exanaple, in 1963, man-m.ade fiber consunaption in Egypt and India accoiinted for only 6 and 7 percent, respectively, of total m.ill consumption of te^dile fibers.
Changes in Carryover Stocks
Changes in the size of world cotton stocks reflect the changes in world pro- duction and consumption in relation to each other. The size of the carryover has varied widely, generally varying with U.S. stocks. For exam.ple, world carryover increased to a record high of 29.8 million bales on August 1, 1945, but by August 1, 1948, had declined to 14.6 million bales. After increasing in 1949 and 1950, stocks declined to 12.1 miillion bales on August 1, 1951, the lowest since 1930. During the next 5 years, stocks increased sharply and in 1956 totaled 25.2million bales. During the next 6 years, world consumption exceeded production, and stocks declined. During 1962-64, stocks again increased sharply (appendix table 16 and fig. 10).
Following World War II, world cotton consunaption was larger than world pro- duction until 1948. The sharp postwar increase in output boosted production above consumption. The outbreak of the Korean conflict in 1950 and the sharp increase in consumption, together with a reduced world crop, resulted in world consumption exceeding production for that season. World market prices increased sharply. This increase in prices stimulated cotton production. Even though consumption was in- creasing rapidly, production increased faster and exceeded world consumption until 1956.
During this period of excess world production, U.S. exports of cotton declined and carryover of cotton in the United States increased to a high of 14.5 million bales on August 1, 1956. During 1956, the United States institiited cotton export programs. With lower world prices, the expansion in acreage abroad was slowed; world pro- duction declined, and again world consumption exceeded production through the 1961 season. World cotton consumption, after reaching another high in 1959, trended downward through the 1962 season when it fell below production. World consumption increased sharply during the 1963 and 1964 seasons; however, production also in- creased and exceeded consumption.
Most foreign producing countries.do not have the physical or economic facilities to carry substaiitial quantities of cotton for extended periods; therefore, they dispose of their crops shortly after harvest. Foreign inaporting countries vary their stock positions, depending upon the present and prospective price and supply situation for textiles and raw cotton. U.S. exports of cotton vary directly with the difference between foreign production and consumption and changes in stocks.
Changes in foreign cotton stocks during any one year may greatly affect the size of U.S. exports for that year. However, over an extended time, stock changes would be expected to even out. Changes in raw cotton stocks during any one year are usually the result of speculative or precautionary factors, which are generally difficult or impossible to quantify.
- 17 -

Table 7,—Man-madè fiber: Consumption in 1963 and percentage each area and country is of world total
00
I
Fiber Unit Japan Î U.K. .Fed. Rep.
of Germany
Italy France Western
[ Europe Total
• U.S. FFW Communist countries World
Rayon and acetate Mil. lb. 833 594 417 321 255 2,120 1,338 4,070 1,342 6,749
Share of world total . .. Pet. : 12.3 8.8 6.2 4.8 3.8 31.4 19.8 60.3 19.9 100
Share of foreign Free- World total : Pet.
. Mil. lb.
• Pet.
• 20.5
498
17.0
14,6
205
7.0
10,2
205
7.0
7.9
113
3.9
6,3
174
5.9
5.21
875
29.8
1,294
44.1
1,466
49.9
176
6.0
Non-cellulosic 2,935
Share of world total ... 100
Share of foreign Free- World total Pet.
Mil. lb..
34.0
1,331
14.0
799
14.0
622
7.7
434
11.9
429
59.7
2,995 2,632 5,536 1,518 Total man-made fibers ... 9,624
Share of world total .... Pet. 13.7 8.3 6.4 4.5 4.4 30.9 27.2 57.2 15.7 100
Share of foreign Free- World total Pet. : 24.0 14.4 11.2 7.8 7.7 54.1
Compiled from International Cotton Advisory Committee data.

COTTON STOCKS MIL. BALES'"
1947 1950 1953 1956 1959 1962 1965
STOCKS AS OF AUGUST 1. * 500 POUND GROSS WEÍGH7 BALES.
US. DEPARTMENT OF AGRICULTURE NEC. ERS 4461-66(4) ECONOMIC RESEARCH SERVICE
Figure 10
There were marked changes in the volume and location of cotton stocks in the postwar period« Over the five seasons ending with 1955, world production exceeded world consumption by over 15.0 million bales, and the excess accunaulated in the United States, During this period, production outside the United States increased to an annual average of 26,4 million bales, compared with 16.0 miillion in the preceding 5 years; nevertheless, these other producing coxintries disposed of their production and reduced their stocks to minimum levels by the end of the 1955 season. Although U.S. production increased only slightly, from an annual average of 12.3 million bales for 1946-50 to 15.0 million for 1951-55^ stocks in the United States rose from. 2.3 million bales on August 1, 1951, to 14.5 million on August 1, 1956. Production increases in other countries were largely responsible for the buildup in world stocks between 1951 and 1955, with the greatest part of the surplus held by the United States.
During 1955, prices of foreign-grown cotton had declined below U.S. prices, and U.S. exports declined to 2.3 m.illion bales. With the initiation of a U.S. cotton export sales program in 1956, U.S. and world cotton stocks were gradually reduced until 1961. During 1961, world carryover decreased 500,000 bales; however, U.S. carryover increased by 600,000 bales. The increased U.S. carryover resulted from, reduced U.S, exports and from FFW stocks being reduced by 0.6 nciiUion bales. Following the decline in world stocks through 1962, world carryover Increased 5.6 million bales by August 1, 1964, with 4.5 million bales of the increase being in the United States.
World Exports and the U.S. Share
World exports of cotton reached a high of 16^7 million bales during 1926, then
- 19 -

trended downward. With the outbreak of World War II, world exports dropped off sharply, declining from 13.2 million bales in 1939 to 3.8 million in 1942. After 1942, world exports trended to a new high of 18.0 naiUion bales in 1963 (table 8 and fig. 11).
The U.S. share of world exports has trended downward for m.any years. Before 1934, U.S. cotton exports accoxmted for over half of world trade in cotton. For the 1925-29 crop years, U.S. exports averaged almost 60 percent of world exports; during the war years 1940-44, they dropped to about 27 percent. The U.S. share increased to nearly 40 percent for the 5 years after the war (appendix table 12 and fig. 12). In the postwar period, world trade in cotton ranged from a low of 8.6 naillion bales in 1947 to a high of 18.0 nciillion in 1963, averaging about 13.8 million bales for the period. However, world trade has not increased as much as cotton consumption. World consxuiiaption increased from 29.7 naillion bales in 1947 to a high of 47.4 million bales in 1963, a rise of 17.7 million bales. By comparison, world cotton exports increased only 9.2 million bales, from. 8.7 to 17.9«
World cotton exports for 1947-64 increased at an average annual rate of 3.1 percent, or about 424,000 bales annually. For this same period, world consumption of cotton increased at an annual rate of 3.0 percent, or 1.2 million bales (fig. 13).
The prinaary reason for the lag in world trade has been that exporting countries, such as Brazil and Egypt, are consximing a greater part of their own cotton production. Also, sonne former importing countries, such as Spain and Colombia, have increased their production to naeet m.ore of their domestic cotton needs. These developments have naturally tended to limit the expansion in world trade. During 1959-63, there
TalDle 8.—Cotton exports: Worlds foreign Free World, and United States, and U.S. share of world toteuL
Year beginning August 1
World Foreign
Free World
United States U.S. share of world exports
19^7 : 8,6^1-6 1948 : 10,987 19i^9 : 12,522 1950 ...: 11,885 1951 : 12,181 1952 .• ..: 11,999 1953 : 13,423 1954 •... : 12,385 1955 : 13,131 1956 : 16,097 1957 : 14,303 1958 : 13,534 1959 : 17,472 i960 : 17,058 1961 ............: 15,567 1962 .....; 15,900 1963 2/ ..: 17,977 1964 2/ : 16,686
1,000 bales 1/ 1,000 bales l/ Percent
5,851 2,065 23.88 5,176 1^,961 ^5.15 5,568 6,001+ 1+7.95 6,555 i+,280 36.01 5,270 5,711 46.88 7,568 3,181 26.51 7,95^ 3,91^^ 29.16 7,230 3,585 28.95 9,235 2,320 17.67 6,61^5 7,917 Í+9.18 6,S2k 5,959 i+1.66 8,588 2,895 21.39 7,978 7,392 1+2.31 8,21^9 6,858 1+0.22 8,836 5,056 32.1+8
10,962 3,i^29 21.57 I0,ii-51 5,775 32.12 10,6kO ^,195 25.11+
1/ Bales of 5OO pounds gross weight, 2/ Preliminary.
20

COTTON EXPORTS Actual and United States as Percent of World
PERCENT
50 Percent U.S. of World — ^:r—^
1947 1950 1953 1956 1959 1962 1965 YEAR BEGINNING AUGUST 1. ^500 POUND GROSS WEIGHT BALES.
U.S. DEPARTMENT OF AGRICULTURE MEG. ERS 4462-66(4) ECONOMIC RESEARCH SERVICE
Figure 11
COTTON EXPORTS United States as Percent of World
PERCENT-
60
40
20
0
"i I I 1 1-
i_i 1 H m 1925-29 '30-34 '35-39 '40-44 '45-49 '50-54 '55-59 '60-64
YEAR BEGINNING AUGUST I.
U.S. DEPARTMENT OF AGRICULTURE NEG. ERS 4463-66(4) ECONOMIC RESEARCH SERVICE
Figure 12
- 21

COTTON: WORLD PRODUCTION, CONSUMPTION, EXPORTS*
MIL BALES-
IS
16
14
12
10
MIL BALES
Exports
Consumption
2.2%
Production
20 1947
AVERAGE ANNUAL RATE OF CHANGE»
-1947-64 TREND 1955. 64 TREND
—L
60
50
40
30
1951 1955 1959 1963 1967 YEAR BEGINNING AUGUST 1.
* PLOTTED ON RATIO SCALE WHERE EQUAL VERTICAL DISTANCES REPRESENT EQUAL PERCENTAGE CHANGE.
U.S. DEPARTMENT OF AGRICULTURE NEC. ERS 4469-66(4) ECONOMIC RESEARCH SERVICE
Figure 13
- 22 -

was a world market for am average of about 16,8 million bales, compared with 11.2 million in 1947-51« Exports from FFW countries increased from an annual average of 5»7 million to 9.3 million bales during this period, accounting for about two-thirds of the increase in total world trade. However, U.S. exports rose from. 4,6 m.illion to 5,7 miillion bales--only 20 percent of the total increase. The Comnaunist countries increased exports frona 1.0 to 1«8 million bales--a larger percentage gain than the United States had.
Cotton exports from FFW countries increased sharply during the postwar period. Total exports from these countries were 10.5 miillion bales inl963--78 percent more than the 5.9 miillion exported in 1947. Nineteen FFW countries exported over 100,000 bales each in 1963, com.pared with 11 cotintries in 1947 (appendix table 17),
The sharp increase in cotton exports during this period occurred inmost of the cotton-producing countries, with Mexico having the largest increase--over 1.2 m.illion bales. The Central Annerican countries--El Salvador, Guatemala, and Nicaragua-- increased their exports from. 10,000 bales in 1947 to nearly 1.1 m.illion bales in 1964.
South America's exports increased by about 400,000 bales during 1947-63. Most of the increase was in Peru and Argentina. Brazil's cotton exports showed no marked upward trend but fluctuated widely from year to year, ranging from a low of 145,000 in 1952 to a high of 1,145,000 in 1962.
Cotton exports from Western Europe were negligible in 1947. In 1962, exports totaled 338,000 bales, over half being from. Greece. Spain exported 100,000 bales during 1962 and smaller quantities in recent years, but is still a net importer.
Most cotton-producing countries of Africa increased their cotton exports from 1947 to 1963. Total exports for this period increased by 700,000 bales. Sudan's exports increased by about 500,000 bales, bilt export s from Egypt, the largest exporter of this area, trended downward during the period.
Cotton exports frona Asia increased sharply froml947 to 1963. Most of the increase was iroTxi Turkey, Syria, and Iran. These three couiitries exported only small quantities of cotton in 1947, but in 1963 they exported over 1.5 million bales.
Cotton exports from the Communist areas of the world increased from 770,000 bales in 1947 to a high of 2.1 million"in 1959, and declined to about 1.7 million during 1963. Nearly all cotton exported from Communist countries is from, the U.S.S.R. Although cotton exports from the Connjnxinist countries averaged 1.8 million bales annually for 1959-63, their cotton imports averaged 3.6 million bales for the same period, leaving a net cotton inaport balance of 1.8 million bales.
Prices of U.S. and Foreign-Grown Cotton in Import Markets
Prices for m.ost types and qualities of cotton fluctuated widely in foreign import markets during the postwar period. After reaching record high levels during the early part of 1951, prices declined sharply through 1958, and since then have continued a slow downward trend (appendix table 18 and fig. 14).
Imnciediately preceding and in the early stages of the Korean conflict, prices in world import markets advanced to more than 60 cents per pound in the first half
- 23 -

COTTON PRICES
1950 1953 1956 1959 1962 1965 YEAR BEGINNING AUGUST 1. ^ AVERAGE PRICE STRICT MIDDLING 7 1/16 INCH.
C.I.F, LIVERPOOL, ENGLAND FOR U.S. AND MEXICAN GROWTHS.
* PRIOR TO 1951 ONLY ONE PRICE QUOTED FOR BOTH GROWTHS.
U. S, DEPARTMENT OF AGRICULTURE NEG. ERS 4464-66(4) ECONOMIC RESEARCH SERVICE
Figure 14
of 1951, for some types and qualities. The sharp rise was attributed chiefly to the threat of short supplies and the escpected increase in demand connected with-war needs. The 1950 crop in the United States was only 10 rrvillion bales, compared with over 16 million a year earlier. Prices declined during 1951 because of increased world production and the widely held opinion that the Korean conflict woixld not spread iiáo a general war.
During the 1950*s^ rising world supplies of cotton coiitinued to exert pressure on world prices, and by mid-1959, prices were at their lowest inmany years. Prices strengthened over the next two seasons, reflecting the record levels of world con- sumption and the substantial reduction in world stocks. Although foreign consumption of cotton was increasing rapidly, production, increased even more rapidly.
Price weakness since 1962 has accompanied record foreign crops and a slowdown in textile activity. Exportable supplies in foreign producing countries were offered at prices which have continued to exert pressure on world price levels.
PART n
EVALUATION OF FACTORS AFFECTING U.S. COTTON EXPORTS
World Trade and U.S. Exports
As shown in Part I, world trade in cotton and the demand for U.S. cotton exports are largely determined by the pattern of world consumption and production. This
- 24 -

part of the study is devoted to statistical analysis of the major economic variables that influence both world cotton trade and the demand for U.S. exports of cotton in the postwar period.
Factors Affecting World Cotton Consumption
Total world consumption of cotton is affected by many factors, only a few of which can be measured quantitatively. The major economic factors affecting the denn^nd for cotton are (1) population, (2) general economic conditions, (3) cotton prices, and (4) prices for mtan-made fibers.
(1) Populat io n- - Wo rid population during 1948-63 increased from 2.4 to 3.2 billion people, an average annual growth rate of 2 percent. Population growth increases the demand for cotton as well as for other products and services and, in turn, con- tributes to better general economic conditions.
(2) Measure of general economic conditions--Personal income is often used as the demand shifter for consumer goods. For industrial raw materials the index of industrial production is frequently used. 5/ Although cotton is both, it is more of a consiimer good than a raw materiaL However, the world index of industrial production is used in this analysis because of its availability. No measure of world income is available. The world index of industrial production (1953«100) increased from 72 in 1948 to 165 in 1962.
(3) Cotton prices-'-Qther conditions being constant, a decrease in the price of cotton fiber normally results in an increase in the consiimption of cotton, and an increase in the price results in a decrease in consunaption. The calendar-year price of U.S. cotton, SM (Strict Middling) 1 l/l6 inch^ c.i.f. Liverpool, averaged 39«80 cents per pound in 1948, rose to 53.72 cents in 1951, and declined to 29»54 cents in 1963. To allow for the influence of changes in the general price level, cotton prices were deflated by a wholesale price index. The index used was Comtel Reuters Conomodity Index, sometimes referred to as an international commodity index (3^). hj
(4) Prices for Man-naade Fibers--Man-made fibers are the closest competitors of cotton. Some of these fibers, particularly rayon and acetate staple fibers, compete with cotton primarily on the basis of relative prices. Absolute prices are of less importance in the substitution of non-cellulosic fibers for cotton.
Ordinarily in demand analysis, prices of substitutes are used as variables to measure the effect of substitution between products. However, there is no one price or price index available for raan-made fibers that représelas a suitable continuous series for statistical analyses. In addition, the limited price series available for man-made fibers in general are producer list prices that show small changes over time and do not represent actual prices to product manufactxirers. As mentioned above, the use of the non-cellulo sic fibers is related primarily to performance, quality, and market promotion. However, with large-scale production, reduced prices of these fibers are likely to further stirciulate their use. Even if non-cellulo sic fibers reiïiain higher in price than cotton, they have less processing waste than
5/ Variables that relate to the general level of demand were discussed by Foote (7, p. 27)^
6/ Reuters Con:imodity Index is a geometric average of 21 primary commodities, weighted by their relative importance in international trade.
- 25 -

r cotton, and more yarn can be spun from a given unit of fiber than from a similar qiiantity of cotton. Consumption rather than price of non-cellulosic fibers was used to represent the influence of conapeting products,
Lowenstein (15) in a statistical analysis covering the peacetime periods of 1928- 38 and 1947-60 found that most of the variation in world cotton consum^ption was explained statistically by the price for cotton in the United States, the world index of naanufacturing, and world synthetic fiber consumption. 7/ These three variables explained 98 percent of the variation in world cotton consumption.
Results of Statistical Analyses of World Demand for Cotton
A least-squares regression analysis was run for 1948-62 to measure the effect of certain factors on world consumption of cotton. The following variables were used: 8/
Xj^= World consmnption of cotton (calendar year) divided by m^idyear estimate of world population.
X2= Average annual price of united States cotton SM 1 l/l6 inch, c.i.f. Liverpool, deflated by Reuters Conunodity Index. ^J
X^= World index of industrial production, 1953=100.
X^= World consumption of non-cellulosic fiber divided bymid-year estimate of population.
The data for Xi^ X2^ and ^ were based on calendar years. A lead of 3 months was used for -^2 (cotton prices) because of the timelag between purchase of raw cotton by naills and actual consunaption.
The results of the analyses with the standard errors of estimate of the regression coefficient in parentheses, are given in the following equation.
X = 6.2878 - 0.0421 X + 0.0244 X^ - 1.5757 X. (0.0192) ^ (0.0055) ^ (0.5926) ^
All of the coefficients were statistically significant at the 5-percent probability level. They explained about 92 percent of the variation in world cotton consumption from 1948 through 1962. The signs of the coefficients were as expected. Increases in the index of industrial production were found to be associated with increased consiimption, while increases in cotton prices and in non-cellulosic fiber consumption were associated with decreases in cotton consumption. For the period of the analyses, a 1-cent change in price per pound was associated with a 0.04-pound change in the opposite direction in world per capita cotton constimption.
An increase of 1.0 in the index of industrial production was associated with a 0.02-pound increase in per capita cotton consumption. An increase of 1 pound in per capita consunaption of non-cellulosic fibers was associated with a decrease of about L6 pounds in per capita cotton consiimption.
IJ Non-celliilosic fibers are referred to as synthetic fibers inmost countries. 8/ Data used in this and other analyses are shown in appendix B, page 59. 9/ Prices for SM 1 l/l6 inch cotton were used because this was the only complete
series available on foreign prices for the period covered.
- 26 .

The analysis showed that, at the 1948-62 average levels, elasticity of consuniption was -0.25 with respect to price, 0,41 withrespect to the index of industrial production, and -0.07 with respect to non-cellulosic fiber consxunption. These elasticities represented the percentage change in the consumption of cotton that was associated with a 1 percent change in the variable under consideration, with other variables held constante Thus, the price elasticity of -0.25 indicated that a 0.25 percent change in world cotton consumption was associated with a change of 1 percent in cotton price in the opposite direction.
The small elasticity of substitution of non-cellulosic fibers for cotton probably reflected the small use ofthesefibers ona world basis during this period. There were many areas of the world where consum^ption of non-cellulösic fibers was very smaU or nonexistent^ lx)wenstein (15) pointed out that although.the elasticity of substitution of non-cellulo sic fibers for cotton was small, it was a significant and much m.ore important than was indicated by the coefficient.
In figure 15, estim.ated values for world m.ill consunaption of cotton, calculated from regression equations, were plotted against actual values for the corresponding years. The estimated values were within 4 percent of the actual values for aU years. As there was about 8 percent of the variation in world mill consumption of cotton unexplained by the analysis, some deviations would be expected. The deviations for the early 1950's were probably a result of the partial disruption of the market structure by the Korean conflict.
Another possible source of unexplained variation in the analysis was fluctuation in inventory of cotton fabric. For exaniple, a buildup in inventories during a given year might lead to a decrease in excess inventories and reduced mill consumption the following year. Donald, Lowenstein^ and Simon (5) pointed out that a measure
COTTON CONSUMPTION, PER CAPITA WORLD
POUNDS
——Actual I
-- Calculated
u—-
1948 '50 '52 '54 '56 '58 '60 '62 YEAR BEGiNNING JANUARY 7.
U.S. DEPARTMENT OF AGRICULTURE NEC. ERS 4465-66(4) ECONOMIC RESEARCH SERVICE
Figure 15
- 27 -

of inventory imbalance was an important determinant of the variation in naill con- sunaption of cotton in the United States, Data for world inventories or stocks of cotton fabrics were not available for statistical analysis.
Analysis of World Production
No attempt was made to analyze statistically changes in world production of cotton. In the major producing country, the United States, the amount of land devoted to cotton during the period studied was largely deternciined by Government programs and not by economic forces. Walsh (IJ), in a study of U.S, production covering 1910-24 and 1925-33, found that the elasticity of cotton production with respect to price of cotton, coniputed at mean levels, was 0.22 and 0,25, respectively, for the two periods. In a later section, statistical analyses are made of acreage in the FFW where cotton acreage is more affected by economic factors.
Analyses of Factors Affecting U.S. Exports of Cotton to Free-World Countries
The analyses and discussions of factors affecting U.S. cotton exports were generally limited to FFW coxxntries. These countries were the naajor outlet for U.S. cotton because only small quantities of U.S. cotton were imported by Cominaunist countries. In addition, reliable data were not available for some countries. Therefore, the Communist countries were omitted from the analyses.
Foreign consumption and production have trended upward since World War II, with production increasing slightly faster than consumption. As a resiilt, the dif- ference between production and consumption has narrowed. During 1947-64, production increased from 8.9 nciillion bales to 22.9 million--an average annual rate of 4.9 percent or 764,000 bales. At the sam.e time, consunciption increased from. 13.5 million bales to 24.9 million--an average annual rate of 3.6 percent or 685,000 bales (fig. 3). This means that if the United States is to maintain or increase cotton exports, either foreign consumption must increase at a faster rate or the rate of increase in foreign production will have to decline, or some com.bination of these two naovements must occur.
Data for some FFW countries were not available, so 43 countries, for which m.ost of the necessary econonaic data were available, were selected to represent the FFW for the 1948-63 consumption analysis. These 43 countries accounted for 88 percent of the total mill consumption of cotton in the FFW during the 1963 calendar year. Earlier years were not included because data were not available for many of the countries, and World War II and the postwar recovery would have heavily influenced mill consunaption in those years.
Factors Affecting Foreign Free-World Cotton Consunaption
Variables used in the analysis of FFW naill consiinaption of cotton included (1) mill consumption of cotton, (2) cotton prices, (3) real inconae, and (4) con- sumption of naan-naade fibers.
(1) Mill consunaption of cotton--Consumption in 43 countries was totaled for each calendar year. Mill consunaption was then coverted to a per capita basis, using midyear estimates of population of the same 43 countries.
- 28 -

(2) Cotton price--The price of U.S. cotton Strict Middling 1 I/I6 inch, c.i.f. liiverpool, was used to represent the FFW price« To remove the influence of change in the general price level, cotton prices were deflated by a wholesale price index for the 43 countries. The wholesale price index used was conaputed for the 43 countries by weighting each country's wholesale price index by its mill consximption of cotton,
(3) Real income'"-National inconae of the 43 countries was converted to equiv- alent U.S. dollars through conversion factors published by the United Nations. Income, in U.S. dollars, was then converted to a per capita basis by the naidyear estinn.ate of population^ To derive a per capita real income figure, income in U.S. dollars was divided by the cost-of-living index for the 43 countries. The aggregate cost- of-living index was computed by weighting each country's cost-of-living index by its mill consumption for that year.
(4) Consumption of non-cellulesic fibers--Mill consumption for the 43 coiintries was totaled for each calendar year. Mill cons\imption was then converted to a per capita basis using the miidyear estimates of population for the 43 countries.
Results of Statistical Analysis
A least-squares regression was runfor 1948 through 1963. The following variables were included for the 43 countries representing the FFW:
X = Mill consunaptionof cotton, divided by themidyear estimate of population*
X^ = Average annual price of U.S. cotton, Strict Middling I-I/I6 inch, c.i.f. Liverpool, deflated by wholesale price index (1958=100).
X^ = National inconn.e converted to U.S. dollars, divided by popxilation, and deflated by cost-of-living index (1959=100).
X. = Mill consumption of non-ceUulosic fibers, divided by naidyear estimate of population.
The data for ^1, ^3, ^4 were based on calendar years. A lead of 3 mtonths was used for ^2 (price) variable to allow for the timelag between purchase of cotton and mill consunaption.
The following regression equation shows the effect of the three factors on mill consiinaption of cotton in the foreign Free World.
X =6.2375 - 0.0437 X + 0.0077 X - 0.4800 X ^ (0.0104) ^ (0.0026) ^ (0.2913) ^
All of the coefficients were statistically significant at the 5-percent probability level with the exception of 4, non-cellulosic fiber consumption. They explained about 85 percent of the variation in FFW mill consumption of cotton during 1948 through 1963. The resiilts of this analysis differed slightly from the world consumption analysis, because of both different consumption data and factors used in the analysis. The signs of the coefficients were as expected. Increases in income were found to be associated with increased consunaption, while increases in cotton prices and in non-cell\ilosic fiber constimption were associated with decreases in cotton con- suixiption.
- 29 -

Figure 16 shows the relationship between estimated values and actual values of the analysis* The relatively large deviations in the early 1950*s were probably associated with the increased demand resulting from the Korean conflict.
The analysis showed that a l-cent'-per-po\md change in the Liverpool price of cotton^ with other factors held constant^ was associated with a change in the opposite direction of 0»04 pound in FFW per capita mul consumption of cotton. Converting this to bales of cotton showed that a l-cent'-per-pound reduction in the deflated Liverpool price of cotton woxild result in a 178^000-bale increase in FFW consumption at 1963 population levels.
Per capita income was shown to be an inaportant deternainant of FFW cotton con- sumption. On the average^ a $10 increase in real per capita inconae was associated with an increase of 0*07 pound inper capita cotton consiimptione This would be equal to about a 300,000-bale increase inmiU consumption of cotton at 1963 population levels.
Although the coefficient for non-cellulosic fiber consixmption was not statistically significant at the 5-percent level, it gave some indication of substitution between cotton consumption and non-cellulosic fiber consumption. For the period of the study, per capita mill consumption of non-cellulosic fibers was sm.all (less than 1 poimd per year, except in 1962 and 1963); and in many FFW countries only small quantities were consumed. Prices for rayon and acetate fibers suitable for sta- tistical analysis were not available.
Elasticity of Demand for Cotton
The regression equation of the previous section showed the physical quantity change in cotton consumption with a change in one factor when the other factors were held constant. Often it is helpful to express these relationships in terms of elasticity, especially for use in conaparing different relationships. Elasticity is the ratio of the percentage change in consunaption of a commodity to the associated percentage change in another factor. The elasticity of demand, with respect to price, for cotton consunaption byforeignm.ills wasthe ratio of the percentage change in consumption of cotton to the associated change inthe price for cotton. The elasticity of denaand for cotton with respect to price, conaputedat the mean values for 1948-63, was -0,27, This showed that a 0.27 percent change in cotton consumption was associated with a corresponding changeofl percent inthe price of cotton inthe opposite direction.
This estimate of price elasticity was sonaewhat higher than was derived in earlier works for foreign naill consumption, Howell(12) estimated the price elasticity of denaand for foreign mill consiimption of cotton in the interwar period (1921-28) to be -0.17, Blakely (1), using the linaited-inforniation technique covering 1921- 40 and 1947-56, derived a short-r\in price elasticity of foreign mül consumption of -0.13, This compared with -0.07 for the sanae period when he used the Theil- Basm^an technique. Fowler stated that, for foreign countries during the interwar period, *'the estimate of the elasticity of miU demand with respect to price varied from about -0.10 to -0,31, although most of the estimates were of the general order of -0,10 to -0,14, One long-run elasticity estimate of-0,31 and one of-0,21 were obtained,** lO/ The International Cotton Advisory Comnaittee (13) estimated the price elasticity at about -0,2 for a group of 14 European countries inthe postwar period. The price elasticity obtained inthe present study also was somewhat higher
JJO/ Fowler, Mark L.: An Economic Statistical Analysis of the Foreign Demand for American Cotton. Unpublished Ph,D, dissertation, Univ. Calif,, Berkeley, 1961,
30

than that estimated for the United States in a recent study, Donald^ Lowenstein^ and Simon (5) estimated values for U.S. domestic consumption of cotton for a combined period of interwar and postwar years« They found that, for the United States^ demand elasticity with respect to price was -0.14, com.pared with the -0.27 derived for FFW countries in the postwar years, indicating that price changes in the FFW m.ay have a larger effect on cotton consumption than price changes have on U.S. consumption* This larger price coefficient for cotton consmnption in the FFW woiold seem, logical in view of differences in the level of income, level of cotton consumption, and the increasing availability of lower-priced man-made fiber substitutes inforelgn coiintries. The U.S. demand elasticity with respect to price was found to be somewhat higher when the analysis was based primarily on interwar years, before non-cellulosic fibers were important. In a study covering the years 1920-40 and 1947-52, Lowenstein (15) estimated that the price elasticity was 0.20 for the United States.
The elasticity of demand, with respect to incom.e, for FFW m.ill consumption computed at mean values was 0.35. This showed that a 0.35 percent change in mill consumption was associated with a change of 1 percent in FFW income in the same direction. This incom.e elasticity coefficient was below that obtained by others. The International Cotton Advisory Committee (13) estimated income elasticity for a group of 14 European coiintries in the postwar period at 0.5. Fowler (8), using various methods, obtained estimates of income elasticity ranging from. 0.52 to 0.59 for a group of about 50 FFW countries in the postwar periods 1948-50 and 1952-54.
Factors Used in Statistical Analysis of Foreign Free-World Cotton Acreage
Production of cotton was determined by the acres planted to cotton and the yield per acre. Each of these factors was affected by many complex and interrelated
COTTON CONSUMPTION PER CAPITA FOREIGN FREE WORLD
POUNDS"
8
4l~^ -i ^ J L.
Actual Esiimatec
1948 1951 1954 1957 1960 1963 1966
YEAR BEGINNING JANUARY T.
U.S. DEPARTMENT OF AGRICULTURE NEG. EPS 4459-66(4) ECONOMIC RESEARCH SERVtCE
Figure 16
- 31-

forces« Goering (10) pointed out that the cotton economies of nciost of these countries were isolated to various degrees from the free play of world prices and that individual donaestic econonaic goals were achieved by measures such as cotton-export taxes^ price-support programs^ and export and import restrictions.
World cotton prices, however, would be expected to have an important impact on cotton acreage and production in FFW coiintries. To determine this relationship, FFW acreage was correlated with cotton prices. Cotton acreage was used instead of production because acreage was more responsive to prices in that production was affected by yields, which in turn naay be dependent upon growing conditions, such as weather. Factors used in the analysis included (1) FFW cotton acreage, (2) cotton price, and (3) trend.
(1) Cotton acreage--Total foreign cotton acres planted to cotton minus cotton acres of the Communist countries.
(2) Cotton prices—The price of U.S, cotton, Strict Middling 1 l/l6 inch, c.i.f. Liverpool, was used to represent the FFW price of cotton. As there would be a timelag between changes in cotton prices and acreage response, a lead of 1 year was used for the price variable in the analysis.
(3) Trend--Trend factors were included in the analysis to account for factors mentioned earlier that cannot be isolated or quantified.
Results of Statistical Analysis
A least-squares regression was run for 1948-63. The following variables were included*
X- = FFW cotton acreage
X = Average annual price of United States cotton. Strict Middling 1 i/l6 inch, c.i.f. Liverpool.
X^ = TLme trend, 1949-55.
X = Time trend, 1956-63.
X = Zero-one variable
The data for the variables were based on a crop year beginning August 1. A lead of 1 year was used for 2 (price) in the analysis to allow for the timelag between changes in cotton prices and acreage response. Producers* decisions on how much cotton to plant were made on the basis of prices received for cotton the previous year. The trend factors, ^3 and 4, were used to accoiint for the various factors affecting cotton acreage that could not be quantified for inclusion in the analysis. The zero-one variable ( 5) was included to account for the change in the trend from 1948-55 to 1956-63 (fig. 17).
The sharp upward trend during the earlier years of the analysis resulted not only from restoration of prewar cotton acreage in producing co\intries, but also from initiation of cotton production in countries that had not produced it before the war. For example, in India (including present-day Pakistan), cotton acreage averaged about 24,0 million acres annually just before World War II. During the
- 32 -

COTTON ACREAGE: FOREIGN FREE WORLD L*
MILBALES-
Ó0
50
-Trend - —■ — 6.0%- — 1.2% — 2.7%
AVERAGE ANNUAL RATE OF CHANGE
---1948-63 TREND 1948-55 and 55-63 TRENDS
1948 1952 1956 1960 1964 YEAR BEGINNING AUGUST I.
* PLOTTED ON RATIO SCALE WHERE EQUAL VERTICAL DISTANCES REPRESENT EQUAL PERCENTAGE CHANGES,
U.S. DEPARTMENT OF AGRICULTURE NEC. ERS 4466-66(4) ECONOMIC RESEARCH SERVICE
Figure 17
war, acreage declined to a low of about 14.0 million acres in 1945; then it increased through 1955.
Total cotton acreage In Central America averaged about 50^000 acres annually before the War. By 1955^ cotton acreage there had increased to approximately 499,000 acres. FFW cotton acreage continued to increase after 1955 but at a slower rate.
The resiilts of the analyses were: 11/
1948-55 X =18.6992 + 0.2278 X + 2.2644 X
(0.0670) ^ (0.1783) "^
1956-63
1 = 29.5355 +0.2278 X + 0.8059X (0.0670) ^ (0.1936) ^
All of the coefficients were statistically significant at the 5-percent probability level. They explained 97 percent of the variation in FFW cotton acreage during 1948 through 1963. The figures in parentheses are the standard errors of estimate of the regression coefficients. The regression coefficients, for all variables, had the expected sign. Increases in cotton prices were associated with increases in FFW cotton acreage.
11/ The two equations were derived fronn. the following regression equation. Xjn8.6992 + 0.2278X2 + 2.2644X^ + 0.8059X^ + 10.8363X^.
- 33 -

Figure 18 shows the relationship between the estimated values and the actual values for cotton acreage used in the analysis* All estinaated values were within 4 percent of the actual values, except for the 1950 and 1953 seasons. The relatively large deviation, about 6 percent, for 1950 probably was associated with the anticipated increase in prices for cotton as a result of the Korean conflict. By 1952 world cotton prices had declined from the record-^high prices for the first half of 1951, The expectation of fuarther declines in cotton prices during 1953, together with rising carryover stocks of cotton, likely affected producers* decisions to plant less cotton for the 1953 crop. This would tend to explain the larger than average deviation, between the estimated and actual values of the 1953 crop.
The analysis shows that a 1-cent change in the Liverpool price of cotton was associated with a change in the same direction of 227,820 acres of cotton. This suggests that a reduction in price of 1 cent a pound would result in a reduction the following year of about 228,000 acres of cotton. At 1963 yields, this would represent about 100,000 bales of cotton. The trend factor for 1948-55 was associated with an increase of over 2.2 million acres annually. For 1956-63, the trend factor was associated with an increase of about 800,000 acres annually.
Elasticity of Acreage in Foreign Free World
The elasticity of acreage with respect to price for the FFW is the ratio of the perceiitage change in cotton acreage to the associated percentage change in the price for cotton in the preceding year. The elasticity of acreage, with respect to price, computed at the naean values for 1948-63 is 0,20, This shows that a 0,20 percent change in FFW acreage was associated with a change of 1 percent in cotton
COTTON ACREAGE Foreign Free World
MIL. ACRES'
10 1948
■Actual ■—-—Calcu lated
1951 1954 1957
YEAR BEGINNfNG AUGUST 7.
1960 1963 1966
U. S. DEPARTMENT OF AGRICULTURE NEC. ER$ 4458-66(4) ECONOMIC RESEARCH SERVICE
Figure 18
34

price in the same direction. This elasticity can be applied directly to production as -well as acreage by assuming that yield per acre will remain unchanged ^?vith a change in acreage. For example, assume that 100,000 acres of cotton, with a 240- pound-per-acre yield, would give a total production of 50,0.00 bales. A 10-percent increase in price would result in a 2.0 percent increase in acreage planted. This wo\ild increase acreage to 102,000 acres and, using the same 240-pound yield, would give a production of 51^000 bales. The elasticity coefficient applied to the original production of 50^000 bales also results in production of 51,000 bales.
Combined Effects of Price Change on Foreign Free^World Production and Consumption
The analyses presented in previous sections showed that a 1-cent change in deflated world cotton prices, with other factors unchanged, resulted in a 178,000- bale change in the opposite direction in cotton consunaption. However, this is on a deflated-price basis. The price deflator used was the weighted wholesale price index for 43 countries. This index was 132 for 1963. Thus a 1-cent price change in 1963 dollars would resiilt in a 135,000-bale change in cotton consumption in the opposite direction. The other analysis showed that a 1-cent change in cotton prices resulted in a 100,000-bale change in the sanae direction, in cotton production.
Assuming there were no foreign stock changes, U.S. cotton exports to the FFW would equal the anaount by which production was short of consunaption in the FFW countries plus FFW net exports to Communist countries. Thus, the combined effect of a 1-cent-per-poimd change in the Liverpool price of U.S. cotton would be expected to result in a 235,000-bale change in the opposite direction in the denciand for U.S. cotton exports by FFW coomtries (table 9). This does not include any change that might occur in net FFW exports to Conomunist countries.
Table 9-—Effect of a 1-cent reduction in world cotton prices on foreign Free-World production, consumption, and U.S. exports at I963 price and yield levels
Item ] Change
: Bales
Consumption. ....••• : +135,000 Production : -100,000 U.S. exports l/ : +235 j 000
» 1/ Assuming there would be no change in FFW stocks. U.S. exports to the FFW would
equal the combined change in production and consumption.
In a recent bulletin, Waugh (j^) discussed the relationship between short-run and long-run denaand in the domestic market. Using the price and consumption ratios between cotton and rayon, he foiind that changes in the price ratio did not have a large inanaediate effect upon the consixnaption ratio. He did find that there was a lag, and that the lag appeared to be spread over several years. In an analysis of the 1921-40 and 1947-56 periods, Blakley (1) derived long-run elasticities of foreign mill consumption of -0.66 by using the limited-information techniques, and -0.35 by using the Theil-Basman technique. Short-run elasticities were -0.13 and -0.07 in the sanae analysis. There is a need for additional work on the lag between price changes and changes in consumption,
- 35 -

The fact that the effects of changes in cotton prices are not immediate should be recognized» Thus, the response of consumption and production to a 1-cent price change m.ay be greater than 235,000 bales over a period of time« In the case of consum.ption, a lag in response to a price change reflects the time lag between marketing cotton and naanufacturing it, and the difficulty which cotton users have in shifting to other fibers after styles and production plans have been seto Both time and costs are involved in the adjusting of machines and crews when one fiber is substituted for another« Production for sinailar reasons, would also be slow to respond to a price change«
Relative Prices and U,S, Cotton Exports
In a particular year, the U.S. export price and the price of U.S. cotton relative to the price of foreign cotton are probably the most important factors in determining the U.S. share of the world trade in cotton. Prices for U.S. cotton in Liverpool markets have generally averaged higher than for connparable foreign cotton since 1951 (conaparable price quotations are not available prior to 1951). A com.parison of prices for U.S. and Mexican cotton of comparable staple and quality (SM 1 1/16- inch cotton, c.i.f. Liverpool) for the past 12 years show that U.S. prices have averaged about 4 percent higher (fig. 14)♦ There was little shift in foreign buying from U.S. to Mexican cotton in the years when the price differential was less than 2 or 3 percent. However, during the 1955-56 and 1958-59 fiscal years, when prices for U.S.-grown cotton were more than 10 percent above prices for Mexican cotton, there was a large shift to Mexican and other foreign cotton and U.S. commercial cotton exports dropped sharply. Conversely, when U.S. prices were closely conapetitive or below prices for conapetitive cotton, U.S. exports increased. This has been particularly true when foreign importers have anticipated future price advances for U.S. cotton and have built up inventories.
A statistical analysis was m.ade to show the effect of the relative prices of U.S. and foreign cotton on U.S. exports. Variables used in the analysis of U.S. commercial exports with respect to the relative price of U.S. and foreign cotton include:
X = U.S. comjmercial exports--Total U.S. cotton exports, year beginning July 1, m.inus those exports financed by the U.S. Government (appendix table 19).
X^ = Cotton price--The price of U.S. cotton Strict Middling 1 l/l6 inch, c.i.f. Liverpool, year beginning January 1, deflated by Reuters Com- modity Index (3), was used to represent the world price of cotton.
X^ ^ The price ratio of U.S. grown cotton. Strict Middling 1 l/l6 inch, c.i.f. Liverpool, year beginning January 1, to the price of Mexican grown cotton of comparable quality in the same import market.
A least-squares regression was run for 1948-63. A 6-m.onth lead was used for the price variable, because of the influence of price expectations and forward buying of new crop cotton. U.S. comm.ercial exports of cotton were correlated with the price of U.S. cotton, c.i.f. Liverpool, and the price ratio of U.S. cotton to Mexican cotton in the Liverpool market.
The results of the analysis; are given in the following equation:
X = 33.2183 - 0.2077 X - 0.2246 X (0.0624) ^ (0.0854) ^
- 36 -

The two variables explained about 54 percent of the variation in U.S. commercial exports of cotton during 1948-63. The regression coefficients for all variables had the expected sign and were significant at the 5-percent level. As expected, increases in cotton prices and in the price ratio were associated with a decrease in U.S. cotton exports.
The price level of U.S. cotton in the import n^arkets would be expected to have an effect on exports; likewise, the relationship between prices of U.S. and foreign- grown cotton in import markets would be expected to be an important factor.
A 1-cent change in the price of U.S. cotton in the Liverpool market was associated on the average with a 208,000-bale change in the opposite direction, in U.S. cotton exports. In terms of 1963 price, this would nciean that a 1-cent change in price would be expected to result in about a 190,000-bale change in the opposite direction in U.S. comnciercial exports. The price of U.S. cotton in impoirt naarkets was only one of several inaportant factors that determined U.S. exports; it only explained about 46 percent of the variation in U.S. cominercial exports.
The coefficient for the level of cotton prices was slightly smaller than the one derived indirectly in the previous section (page 35); there the impact of a change in price on both consumption and production in the FFW were combined. This difference probably resulted^ in part, because the fornaer coefficient represents naore of an expected longer-term, response in exports to a change in world prices. Also, the latter analysis was overly simplified and explained only about one-half of the variation in U.S. cotton exports.
A 1-percent change in the ratio of U.S. to Mexican price was associated, on the average, with a change in the opposite direction of about 225,000 bales in U.S. cotton exports. A reduction of 1 cent in the price of U.S. cotton relative to Mexican prices was found to be associated withanincrease in U.S. comjmercial exports of about 700,000 bales. However, only about 35 percent of the variation was explained by the price ratio. Also, it is unrealistic to expect that a reduction in the price of U.S. cotton would not be m.et by adjustments in the price for Mexican cotton. However, this does give som.e indication of what can be expected when U.S. cotton is priced higher than conciparabie foreign-grown cotton.
Other Factors Affecting U.S. Exports of Cotton
U.S.-grown cotton generally has enjoyed a preference over foreign-grown cotton in international cotton naarkets. Thispreferencereflects, in part, the trading facilities available (ample supply of aU qualities, quick delivery, etc.) from U.S. exporters and the U.S. Departnaent of Agriciilture's grades and standards program for cotton. While these facilities have contributed to the demand for U.S. cotton exports, the policies of foreign governments to increase production have worked to reduce U.S. cotton exports.
U.S. Trading Practices
U.S. cotton has held a slight preference over foreign cotton because the American cotton shipper is generally considered to have more business and financial respon- sibility; also, because of large U.S. stocks of cotton, U.S. shippers can supply a wider range of qualities throughout the year than shippers from any other country. Many American exporters have agents in overseas nnarkets to provide a personal business relationship between buyer and seller. Approved marketing practices
- 37 -

that encompass arbitration and trading rule s ^ supported amd adhered to by most U.S. shippers, facilitate trade; nevertheless, there are some trading practices that are detrimental to U.S. cotton exports. Some of these are unethical practices, such as including bales of cotton below contract specification in a shipment and occasionally refusing to pay arbitration awards for weight and quality claim.s«
Frequent complaints also are heard frorn foreign importers and nciills about the appearance and condition of U.S. cotton resxjlting fromi danaaged bale coverings» This condition results largely from, sanapling and handling after the cotton îtas been baled« The condition of bales for export could be improved by requiring that the covering be tucked over the bale heads and patches applied to cover holes in the bale sides where sanaples have been rem^oved.
Cotton Policies of Foreign Governments
The need for U.S. cotton by FFW countries has been substantially reduced by g"övernment policies toward cotton in these countries (14). Increased production has been encouraged in the postwar period by government program.s such as below- cost fertilizer distribution to producers, guaranteed cotton prices, direct producer subsidies, and credit arrangem^ents« A few countries, including Egypt and Syria, have lunited the total cultivated land area planted to cotton. India, with nearly 40 percent of the total FFW cotton acreage in 1964, provides the producers with a guaranteed price, subsidizes the cost of insect and disease control and of improved agricultural inaplem.ents, and provides special credit facilities for purchasing improved seed, and fertilizers« Greece provides a government subsidy for cotton producers based on planted acreage and makes government loans at favorable rates of interest for irrigation projects and machinery.
LITERATURE CITED
(1) Blakley, Leo V. 1962« Quantitative Relationships in the Cotton Economy With Implications
for Economic Policy. Okla. State Univ. Tec¿ B\U. T-95r 50 pp., illus.
(2) Burns, Arthur F. 1934. Production Trends in the United States Since 1870. Nat. Bur. Econ,
Res., New York, N.Y.
(3) Comtel-^Reuters -- Reuters Conemciodity Index, Conatelburo Limited, London. (Yearly.)
(4) Cox, Clifton B. and Pherson, Vernon W. 1959. The Competitive Potential Of The United States Cotton Industry
201 pp., illus. Harvard Univ. Press, Boston.
(5) Donald, James R., Lowenstein, Frank, and Sinaon, Martin S. 1963. The Demand for Textile Fibers hi The United States. U.S. Dept, Agr,
Tech. BuL 1301.
(6) Food and Agriciilture Organization of the United Nations. 1964, Monthly Bulletin of Agricultural Economics and Statistics. 4 Vol. 13,
April 1964, Rome, Italy»
- 38-

(7) Foote, Richard J. 1958, Analytical Tools for Studying Demand and Price Structures, U.S.
Dept. Agr., Agr« Handb. 146. 217 pp., illus.
(8) Fowler, Mark L». 1963, Export Demand for United States Cotton. Okla. State Univ. Bui.
B-616, pp. 39, illus.
(9) Glover^ James W. 1930. Tables of Applied Mathematics in Finance, Insurance, Statistics.
George Wahr, Publisher, Ann Arbor, Mich. 678 pp.
(10) Goering, T. J. 1963, Cotton Price Policy and Foreign Production. Univ. Calif.^ Berkeley,
Calif. 17(3): 10-11, illus. Mar.
(11) Home, M. K. Jr.; McCord, Frank A., and Townsend, George. 1955. Price and Future of United States Cotton. Amer. Nati. Cotton Council,
Mem.phis, Tenn. 58 pp., illus«
(12) Howell, U D. 1941« Cotton - Price Relationships and Outlets for Ancierican Cotton. U.S.
Dept. Agr. Tech. Bui. 755, 40 pp., illus.
(13) International Cotton Advisory Committee. 1962. Prospective Trends'in Consumption of Textile Fibers. Internatl.
Cotton Advisory Com. Doc. 10 B XXI, March 1962, Washington, D.C. 255 pp.
1964. Government Regiilations 'of Cotton, 1964. Internatl. Cotton Advisory Com. Doc. 17 XXIII, 46 pp. Washington, D.C.
(15) Lowenstein, Frank» 1964. Extra Long Staple Cotton, Denaand and Price Prospect Internatl.
Bank for Reconstruction and Development, Rpt. No. EC-125, Apr. 16.
(16) Mills, Frederick C. 1932. Economic Tendencies in the United States. The Nati. Bur. Econ.
Res., Inc., New York, N.Y. 639 ^-^^
(17) Walsh, Robert M. 1944. Response to Production of Cotton and Cottonseed. Jour. Farm.
Econ. XXVI (2): 359. May.
(18) Waugh, Frederick V. 1964. Demand and Price Analysis. U.S. Dept. Agr, Tech. Bui, 1316, 94
pp. illus.
- 39

APPEBDIX Ai OIABLES 10 TO 19
OíablelD.—Cotton: World production by regions and major countries, ISkj-Sk and average 193IÍ.-38 and 1959-63
Continent and
country
Year beginning August 1
. 19^7 ; 1948 ; 1949 ; 1950 : 1951 : 1952 : 1953 ; 1954 ; 1955 ; 1956
^ 1,000 1,000 1,000 1,000 1,000 1,000 1,000 1,000 1,000 1,000 bales bales bales bales bales bales bales bales bales bales £/ 2/ 2/ 2/ ^ £/ S/ 2/ i/ £/
United States 11,860 14,877 16,128 10,01if 15,11^9 15,139 16,465 13,696 14,721 13,310 Mexico 484 571 937 1,151 1,273 1,250 1,210 1,780 2,250 1,790
Central America El Salvador 21 22 30 27 42 hi 57 90 133 137 Guatemala 5 4 5 4 11 16 27 40 44 46 Nicaragua 4 6 21 22 47 57 109 205 160 193 Others 14 19 14 13 15 15 14 17 17 20
îTotal 44 51 70 66 115 135 207 352 354 396
South America Argentina, ■ 423 if53 652 471 575 567 635 524 563 481 Brazil 1,260 1,500 1,300 1,650 1,950 1,560 1,465 1,650 1,700 1,300 Columbia r 25 30 40 34 47 50 92 122 106 103 Peru ' 282 275 350 403 429 450 475 491 492 485 Others 3Ô 66 84 69 101 76 88 92 93 85
Total : 2,048 2,324 2,426 2,627 3,102 2,703 2,755 2,879 2,954 2,454
Eu3«ipe Greece 53 ^^ 72 117 130 111 139 190 279 234 Spain • 13 31 14 18 35 74 05 9Q 161 232 Others 69 68 80 115 224 147 290 288 213 142
Total • 135 153 166 250 389 332 514 576 653 608
U.S.S.R. 2,600 3,400 4,000 5,200 5,600 5,800 6,100 6,500 6,150 6,850
Africa 3/ Sudan 225 294 315 452 295 396 410 413 510 615 Congo (Leopoldville) • 184 220 220 197 240 208 240 225 246 239 Tanzania 42 42 40 41 39 65 42 90 100 111 Uganda . 141 327 283 289 316 267 332 250 300 310 U.A.S. (Egypt) 1,314 1,836 1,796 1,754 1,666 2,047 1,461 1,598 1,535 1,492 West Equate Africa k/ 114 101 126 101 151 136 146 171 165 155 West Africa : 14 16 22 12 33 20 21 28 20 24 Mozambique • 107 136 92 l4o 149 194 159 144 99 162 Nigeria ; 35 60 60 75 110 100 140 175 150 135 Others Í 30 32 50 62 104 101 106 122 137 130
Total ' 2,206 3,064 3,004 3,123 3,103 3,534 3,057 3,216 3,262 3,373
Asia and Oceania Iran 80 92 96 129 124 165 240 275 275 285 Syria 25 42 61 163 225 207 220 366 400 426 Turkey 218 308 445 542 600 690 638 650 720 700 Afghanistan 10 20 20 38 53 62 60 62 57 90 Bunaa 35 35 35 50 75 110 105 117 85 75 China (Mainland) 2,136 2,115 2,500 3,650 4,800 5,900 5,500 4,751 6,300 6,000 India 2,625 1,960 2,350 2,720 3,110 3,005 3,750 4,436 3,835 4,170 PaiEistan 925 826 1,035 1,225 1,340 1,552 1,179 1,304 1,444 1,410 Others 102 109 173 171 199 139 155 162 220 225
Total 6,156 5,507 6,715 8,688 10,526 11,830 11,847 12,123 13,336 13,381
World total ►25,533 29,947 33,446 31,U9 39,257 40,723 42,155 41,122 43,680 42,162
Foreign Free World 8,893 9,514 10,755 12,167 13,514 13,772 13,840 15,939 16,369 15,901
Conmiunist ôountries 6/ ' 1
4,780 5,556 6,563 8,938 10,594 U,812 11,850 11,487 12,590 12,951
l^e footnotes at end oí ̂ table. continued-
-40 -

Table 3Û.--Cotton: World production "by regions and major countries, 19^7-6i+ and averages 193^-30 and 1959-63^ continued-
Continent rear beginning August 1 and
country 1957 ; 1958 ; 1959 ; i960 ; 1961 ; 1962 ; 1963 ; 1964 : 1/ :
Average :Average 1934-38:1959-63
1,000 1,000 1,000 1,000 1,000 1,000 1,000 1,^0 1,000 1,000 bales bales ' bales 1 bales bales bales bales ' bales bales bales
2/ £/ £/ 2/ £/ 2/ 2/ 2/ 2/ £/
United States 10,96J^ 11,512 14,558 14,272 14,318 14,867 15,334 15,l8o 12,712 14,670 Mexico 2,085 2,345 1,690 2,100 1,995 2,425 2,109 2,395 317 2,064
Central America El Salvador 165 ld2 137 184 259 315 335 350 4 246 Guatemala 6k 75 6Ô 9^ 145 250 300 312 2 171 Nicaragua 219 218 128 146 255 34o 410 550 5 256 Others 3^ 35 25 39 44 49 61- 82 28 44
Total : i^82 510 358 464 703 954 1,106 1,294 39 717
South America Argentina i 783 460 409 568 496 612 450 625 275 507 Brazil : 1,350 l,4oo 1,700 1,950 2,525 2,300 2,300 2,100 1,793 2,155 Colombia : 128 150 305 307 360 375 335 300 23 336 Peru ' 505 541 566 555 655 675 625 625 376 615 Others : 99 68 70 77 87 97 111 155 63 88 Total 2,865 2,639 3,050 3,457 4,123 4,059 3,821 3,805 2,530 3,701
Europe Greece 290 286 262 288 448 410 430 310 70 368 Spain • 165 191 295 330 490 517 445 355 10 415 Others : 166 143 179 163 95 124 112 119 53 135 Total : 621 620 736 781 1,033 1,051 987 784 133 918
U.S.S.R. 6,600 6,850 7,300 6,800 7,050 6,700 8,100 8,200 2,967 7,190
Africa 3/ Sudan \ 215 575 58p 525 975 721 452 700 245 652 Congo (Leopoldville) . 205 250 275 125 75 75 60 30 153 122 Tanzania r 140 143 168 157 139 175 215 245 45 171 Uganda 292 334 300 309 151 297 315 360 273 274 U.A.R. (Egypt) 1,861 2,048 2,100 2,196 1,542 2,101 2,029 2,315 1,846 1,993 West Equat. Africa ij/ 185 175 130 50 45 50 45 50 34 64 West Africa 25 25 40 45 50 75 80 75 27 58 Mozambique lUo 200 220 164 190 135 170 150 29 176 Nigeria • 215 160 160 260 165 250 220 210 37 211 Others lUO 165 158 325 242 371 409 485 48 301
Total 3,418 4,075 4,136 4,156 3,574 4,250 3,995 4,620 2,737 4,022 Asia and Oceania
Iran 280 320 373 456 530 425 530 530 158 463 Syria 492 443 446 511 572 6^ 700 810 25 584 Turkey 600 800 850 775 950 1,080 1,150 1,500 240 961 Afghanistan 70 45 80 80 85 120 175 175 48 108 Buiraa .56 65 85 75 95 90 65 90 95 82 China (Mainland) 7,500 8,700 8,300 6,200 4,100 4,200 4,700 5,500 3,127 5,500 India 4,425 4,200 3,325 4,630 4,075 4,900 5,200 4,9005/5,168 4,426 Pakistan 1,405 1,265 1,355 1,398 1,505 1,690 1,940 1,747 5/ 1,577 Others 240 223 231 250 318 290 250 327 216 268
Total 15,070 16,061 15,045 14,375 12,230 13,484 14,710 15,579 9,077 13,969
World total 42,105 44,612 46,873 46,405 45,026 47,790 50,162 51,857 30,520 47,251
Foreign Free World 16,923 17,i^47 16,597 10,979 19,^^73 21,903 21,930 22,869 11,687 19>776
Communist countries 6/ 14,218 15,653 15,710 13,154 U,235 11,020 12,898 13,808 6,129 12,805
1/ Preliminary. 2/ 5ÓO pound gross vei¿ht bales. 3/ Modern names" and geographic regions used, 4/ Includes Central African Republic and Chad, 5/ Includes Pakistan for 1934-36 period. 6/ Data for CoBBrunist countries for all years include U.S.S.R, Mainland China, eastern European countries, and Cuba,
Compiled from Foreign Agricultioral Service data.
41

Table IL—Cotton: World acreage "by regions and major countries, 19U7-61^ and averages 193i*-38 and 1959-63
Continent . Year beginning August 1 and !
country . 19^1 \ 19^6 ! 191*9 ; 1950 i 1951 : 1952 5 1953 ¡ 19514 ; 1955 : 1956
1,000 1,000 1,000 1,000 1,000 1,000 - 1,000 1,000 1,000 1,000
acres acres acres acres acres acres acres acres acres acres
United States : 21,330 22,911 27,^39 17,81i3 26,9i*9 25,921 2l*,3l+l 19,251 16,928 15.615
Mexico : 927 1,050 l,liU6 1,880 2,183 1,937 1,860 1,820 2,700 2,095
Central America :
El Salvador : 38 32 I43 1*7 72 71 51* 73 113 95 Guatemala : 7 8 6 6 2C 22 27 39 52 32
Nicaragua : 5 8 37 1*1 86 61* 100 211* 257 182
Others ^9 56 60 1+8 ee 61 60 73 77 68
Total 99 lOU 1U8 IU2 21*1* 218 21*1 399 1*99 377
South America
Argentina 97Ö 1,169 1.131 1,11*0 1,385 1,317: 1,362 1,333 1,318 1,31*6
Brazil i|,Í400 i+,100 1*.500 5,300 5,100 U,500 1*,000 1* ,500 5,000 1*,300
ColoDibia 125 150 150 103 136 150 200 230 170 165 Peru 321 370 380 1*08 1*65 1*82 531 556 51+8 586
Others I5ÍÍ 221 21+1 221* 255 199 218 2i*7 21*1 216 Total 5,978 6,010 6,l402 7,175 7,31*1 6,61*8 6,311 6,866 7,277 6,615
Europe
Greece : 105 112 lUl 191 213 203 220 270 1*10 395 Spain 69 I2U 90 81* 110 167 218 267 1*06 1*91*
Others 285 355 U67 559 771* 1,018 1,111 961 958 708 Total : i^59 591 698 831* 1,097 1,368 1,51*9 l,k98 1,771+ 1,597
Ü.S,S.R. i 3,625 l+,100 i*,550 5,700 6,725 7,000 1»,600 5,1*00 5,1*30 5,100
Africa: k/
Sudan 363 U02 U30 539 571 620 652 685 598 761+
Congo (Leopoldville) 75U 71^1 750 815 850 900 900 850 850 850
Tanzania : 150 175 175 200 200 207 190 250 300 300 Uganda : 1,037 1,555 1,629 1,535 1,518 1,1*68. 1,611 1,739 1,585 1,569
U.A.R, (Egypt) : 1,302 1,1*96 ; 1,756 2,050 2,055 2,01*2 1,375 1,639 1,885 1,715
West Iquat. Africa 5/ : 600 600 600 715 750 890 900 935 925 910 West Africa 78 89 125 11*1* 188 171 122 121 85 102 Mozambique : 500 61;0 Gkh 700 680 700 660 710 725 71+3
Nigeria : 150 300 300 310 1*30 375 1*00 800 750 750 Others 163 180 271 271* 1*51 1*22 1*07 511* 61+1* 513
Total : 5,097 6,178 6,680 7,282 7,693 7,795 7,297 8,21*3 8.31+7 8,216
Asia and Oceania
Irani \ 205 259 2i+7 321 371 J*50 555 620 650 625 Syria : U8 59 63 193 537 1*57 370 1*63 600 673 Turkey : 502 731+ SOU 1,100 1.586 1,669 1,1*95 1,1+1+0 1,51*7 1,575
Afghanistan : 50 100 125 70 80 100 100 85 170 196 BuiTiia 192 153 183 225 300 1*50 UOO U50 1*05 351* China (Mainland) : 6,1*00 6,300 8,000 10,000 13,600 13,800 12,800 13,500 ll+,300 15,1*00
India : 10,932 11,055 12,173 ll*,556 16,198 15,693 17,182 18,681* 19,978 19,893
Pakistan : 3.122 2,800 2,862 3,011 3.21*1* 3,1*67 2,930 3,185 3,529 3,607 Others : i+97 i*15 1*87 585 633 582 535 580 610 696
Total : 21,9^8 21,875 2li,9l*lt 30,061 36,51*9 36,668 36,367 39,007 1+1,789 1+3,019
World total \ 59.1*63 62,819 72,307 70,917 88,781 87,575 82,566 82,1*81* 81* ,71+1+ 82,631+
Foreign Free World \ 27,89i+ 29,281 31 998 36,935 1*0,81*1* 39,970: 39,795 1*3,501 1+7,276 1*5,931+
Communist countries 7/ : 10,239 10,627 12,870 16,139 20.988 21,681* 16,1+30 19,732 20,51*0 21,085
See footnotes at end of table.
1^2 - continued-

Table 11.—Cottonî World acreage by regions and major countries, I9U7-6U and averages 193^38 and 1959-63, continued-
Continent ! and ;
country ;
Year beginning August 1
1957 ; 1958 ; 1959 ; i960 ; 1961 : 1962 ; 1963 ;■ L964 1/y i^verage! LQ?4-^8:
Average lQ5q-6^
1,000 1,000 1,000 1,000 1,000 1,000 1,000 1,000 1,000 1,000 acres acres acres acres acres acres acres acres acres acres
United States : 13,558 U,81+9 15,117 15,309 15,634 15,569 14,212 14,057 28,400 15,168 Mexico : 2,2U7 2,510 1,798 2,231+ 2,020 2,064 1,964 1,935 679 2,016
Central America :
El Salvador : 99 132 95 126 191 220 260 300 2/8 178 Guatemala : ^3 68 kk 6U 115 165 215 225 2/3 121 Nicaragua : 218 223 16k 151 185 230 285 330 2/8 203 Others : 82 82 80 122 117 12P 133 150 148 115
Total ! UU2 505 383 i+63 608 737 893 1,005 167 617
South America : •
Argentina ! 1,585 1,225 1,139 1,033 1,31+5 1,284 1,304 1,350 765 1,221 Brazil : 3,700 i+,000 i+,600 5,000 5,500 5,500 5,750 5,750 5,181 5,270
Colombia ; nk 235 377 359 398 449 400 375 86 397 Peru : 610 571 62U 618 610 680 680 650 415 642 Others : 2ii3 263 215 267 20k 367 362 360 186 299
Total : 6,312 6,29^1 6,955 7,277 8,137 8,280 8,496 8,485 6,633 7,829
Europe :
Greece ! 385 if02 325 li09 510 508 570 350 153 464 Spain ! 396 U17 557 618 788 855 650 490 43 694 Others : 503 385 iflO 3kk 299 272 263 250 130 318
Total ! 1,28J+ l,20it 1,292 1,371 1,597 1,635 1,483 1,090 326 1,476
U.S.S.R, : 5,170 5,310 5,320 5,1+15 5,760 5,900 6,100 6,100 5,008 5,699
Africa kj' ! !
Sudan ; 728 887 9I+2 9^0 1,176 1,106 1,100 1,110 427 1,053 Congo (Leopoldville) î Bko s^^ 8I15 Í150 250 300 300 200 814 429 Tanzania : Uoo Uoo U50 U50 475 475 475 500 2/244 465 Uganda : 1,617 2,0li+ 1,565 1,516 2,068 1,858 1,986 2,150 1,460 1,799 U.A.R. (Egj-pt) : 1,888 1,977 1,827 1,9^^ 2,062 1,720 1,689 1,672
"'^^ 1,848
West Equat. Africa 5/ ' 895 1,020 925 — — — 370 366 —
West Africa î 125 135 115 190 185 185 225 175 2/198 180 Mozambique î 7^+5 773 735 763 773 750 775 775 2/202 759 Nigeria 850 600 800 800 800 800 800 800 2/188 800 Others t 522 578 550 1,650 1,603 1,775 1,769 1,544 118 1,654
Total 8,610 9,^39 8,75^4 8,703 9,392 8,969 9,119 9,296 5.860 8,987
Asia and Oceania .
Iran : 625 61^0 7kO 800 985 1,000 988 940 402 902 Syria 638 6kk 561 525 616 747 721 708 74 634 Turkey î 1,5^^^ 1,559 1,5^^2 1,531+ 1,604 1,631 1,553 1,680 621 1,573 Afghanistan 175 160 160 200 190 225 300 350 188 215 Burma ! 295 299 328 379 468 475 500 600 461 430 China (Mainland) Ï 1^,200 ll+,100 14,100 13,100 10,500 9,000 10,300 11,000 7,334 11,400
India î 19,996 19,926 l8,8oi+ 18,971 19,074 19,385 19,600 20,1006/24,682 19,167 Pakistan r 3,6ifl 3,305 3,370 3,2if2 3,488 3,435 3,670 3,660- K 3,441
Others : 636 562 583 51+6 655 572 564 554 556 584 Total î iH,750 ^1,195 Ii0,l88 39,297 37,580 36,470 38,196 39,592 34,318 38,346
World otal ! 79,373 78,306 79,807 80,069 80,728 79,624 80,463 81,560 81,588 80,138
Foreign Free World : : i+6,052 U6,76l iti^,952 i+5,893 48,534 48,880 49,571 50,133 40,761 47,566
Communist countries 7/ \ 19,763 19,696 19,738 18,867 16,560 15,175 16,680 17,370 12,427 17,404
1/ Preliminary, 2/ 4-year average. 3/ 1 year, 4/ Modern names and geographic regions used, 5/ In- cludes Central African Republic and Chad; data for some years included in cSthers. 6/ India includes Pakis- tan for 1934-38 period. 7/ Data for Communist countries for all years include U.S.S.R., Mainland China, eastern European countries, and Cuba. Compiled from Foreign Agricultural Service
-U3 -

Table.la—Cotton: World yield by regions and major countries, igkl-Sk and averages 193^-38 and 1959-63
Continent j and *
covtntry ;
Year beginning August 1
19^7 ; 19^8 ; 1949 ; 1950 ; 1951 ; 1952 ; 1953 ; 1954 ; 1955 ; 1956
Lb. Lb. Lb. Lb. Lb, Lb. Lb. Lb. Lb. Lb. per per per per per per per per per per acre acre acre acre acre acre acre acre acre acre
United States : 267 312 282 269 270 280 325 341 417 409 Mexico : 251 261 311 294 280 310 312 469 400 410
Central America :
El Salvador : 265 330 335 276 280 318 507 592 565 692 Guatemala : 3^3 240 300 320 264 349 480 492 4o6 690 Nicaragua : 38^ 360 272 258 262 428 523 460 299 509 Others : 127 157 108 127 113 138 n? 110 110 142
Total : 213 235 227 223 226 297 412 423 341 504
South America
Argentina : 208 186 277 198 199 207 224 189 205 172 Brazil 137 176 139 149 184 166 176 176 163 145 Colombia 96 96 128 158 166 160 221 255 299 300 Peru U22 357 442 474 443 448 429 424 431 396 Others 163 155 167 146 190 182 193 179 185 189 Total l6i+ 186 182 176 203 195 210 201 195 178
Europe
Greece 2if2 231 245 294 293 262 303 338 327 284 Spain 90 120 75 103 153 213 187 176 190 225 Others 116 97 95 99 139 69 125 145 107 96
Total lUi 130 122 144 170 115 159 187 174 182
U.S.S.R. : 3^^»- 398 422 438 400 398 637 578 544 645
Africa k/
Sudan •. 298 351 352 403 248 307 302 289 409 386 Congo (Leopoldville)' : 117 143 l4l 116 136 111 128 127 139 135 Tanzania : 13U 115 110 98 94 151 106 173 160 178 Uganda : 65 101 83 90 100 87 99 69 91 95 U.A.R. (Egypt) : k&k 589 491 411 389 481 510 468 391 4l8 West, Equat, Africa 5/ : 91 81 101 68 97 73 78 88 86 82 West Africa : 86 86 84 40 84 56 83 111 113 113 Mozambique : 103 102 69 96 105 133 116 97 66 105 Nigeria ; 112 96 96 116 123 128 168 105 96 86 Others : 88 97 110 121 118 118 106 108 95 118 Total : 208 238 216 206 194 218 201 187 188 197
Asia and Oceania
Iran ; 187 171 187 193 160 176 208 213 203 219 Syria : 250 342 465 405 201 217 285 379 320 304 Turkey : 208 201 266 237 182 198 205 217 223 219 Afghanistan : 96 96 77 261 318 298 288 350 161 220 Burma : 88 110 92 107 120 117 126 125 101 102 China (Mainland) : 160 161 150 175 169 205 206 169 211 187 India : 115 85 93 90 92 92 105 114 92 101 Pakistan : lif2 142 174 195 198 215 193 196 196 188 Others : 100 134 173 141 150 113 138 136 175 162
Total : 135 121 129 139 138 155 156 149 153 149
World total : 205 227 2P1 210 212 223 245 239 247 243
Foreign Free World : 153 156 161 158 159 165 167 176 166 166
Communist countries 7/ : 224 251 245 266 242 261 309 279 294 295
See footnotes at end of table.
44 continued-
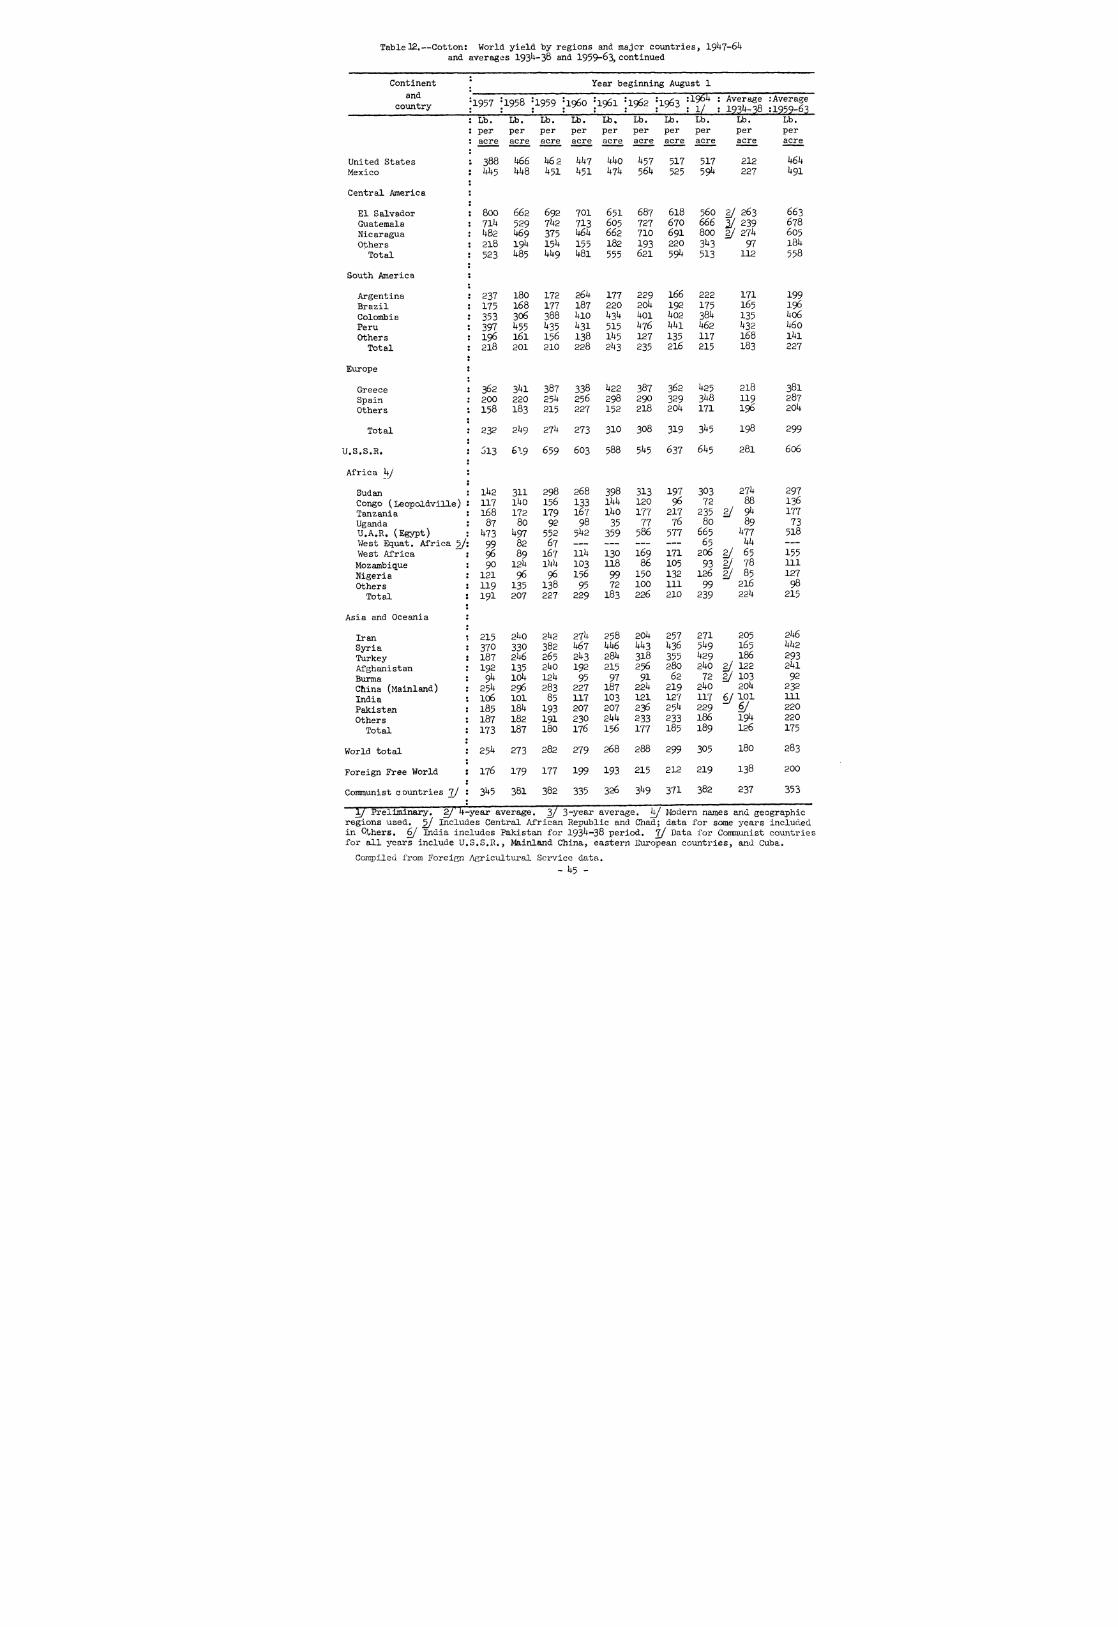
Table32,—Cotton: World yield by regions and major countries, 19h7-Sk and averages I93I+-38 and 1959-63, continued
Continent Year beginning August 1
and
country ;i957 ; 1958 ; 1959 : i960 : 1961 ; 1962 ; 1^3 ; I96Í+ ,
1/
Average
193^-38
.•Average
:1959-63 : Lb. Lb. Lb, Lb. Lb. Lb. Lb. Lb. Lb. Lb. : per per per per per per per per per per : acre acre acre acre acre acre acre acre acre acre
United States 1 388 k66 I462 kk7 kko ^57 517 517 212 k6k Mexico : hh3 Ul+8 k31 ^51 klk 56U 525 59^ 227 Í19I
Central America >
El Salvador
: : 800 662 692 701 651 687 618 560 2/ 263 663
Guatemala : 711+ 529 7U2 713 605 727 670 666 ¿/ 239 678 Nicaragua : U82 k69 375 kSk 662 710 691 800 2/ 21k 605 Others : 218 19U 151+ 155 182 193 220 3^+3 97 I8i+
Total : 523 i+85 kk9 U8l 555 621 59^+ 513 112 558
South America
Argentina : 237 180 172 26Í+ 177 229 166 222 171 199 Brazil : 175 168 177 187 220 20i+ 192 175 165 196 Colombia i 353 306 388 UlO k3k i+01 i+02 384 135 U06 Peru ! 397 ^55 h33 i^31 515 kie kkl k62 U32 1+60
Others : 196 161 156 138 1U5 127 135 117 168 lUl
Total 218 201 210 228 2U3 235 216 215 183 227
Europe
Greece 362 3Í+I 387 338 U22 387 362 Í425 218 381 Spain 200 220 25^ 256 298 290 329 3^8 119 287 Others 158 183 215 227 152 218 20i+ 171 196 20lf
Total 232 2^+9 27^ 273 310 308 319 3^5 198 299 !
U.S.S.R, Î 513 619 659 603 588 5Í+5 637 6k3 281 606
Africa kj :
Sudan : 1U2 311 298 268 398 313 197 303 27^ 297 Congo (Leopoldville) : 117 lUo 156 133 Ikk 120 96 72 88 136
Tanzania : 168 172 179 167 li|0 177 217 235 2/ 9^+ 177 Uganda : 87 80 92 98 35 77 76 80 89 73 U.A.R. (Egypt) : ^73 ^97 552 5U2 359 586 577 665 kll 518 Vfóst Equat. Africa 5/: 99 82 67 — — 65 kk —
West Africa : 96 89 167 Ilk 130 169 171 206 2/ 65 155 Mozambique : 90 12U Ikk 103 118 86 105 93 2/ 78 111
Nigeria : 121 96 96 156 99 150 132 126 2/ 85 127
Others : 119 135 138 95 72 100 111 99 216 98
Total Î 191 207 227 229 183 226 210 239 22^ 215
Asia and Oceania :
Iran î 215 2U0 2U2 27k 258 20U 257 271 205 2k6 Syria : 370 330 382 k6l kk6 kk3 U36 5^9 165 kk2 Turkey : 187 2U6 265 2U3 2&k 318 355 if29 186 293 Afghanistan : 192 135 2U0 192 215 256 280 2U0 2/ 122 2UI
Burma : 9k 10i+ I2U 95 97 91 62 72 2/ 103 92 China (Mainland) : 23k 296 283 227 187 22U 219 2^0 20i| 232
India 106 101 85 117 103 121 127 117 6/101 111
Pakistan : 185 Idk 193 207 207 236 25^ 229 ^. 220
Others : 187 182 191 230 2kk 233 233 186 194 220
Total : 173 187 180 176 156 177 185 189 126 175
World total : 23k 273 282 279 268 288 299 305 180 283
Foreign Free World : 176 179 177 199 193 215 212 219 138 200
Communist coiintries 7/ : :
3^5 381 382 335 326 3U9 371 382 237 353
1/ Preliminary. 2/' 4-year average. 3/ 3-year average. kJ Modern names and geographic regions used. 5/ Includes Central African Republic and Chad; data for some years included in Q'vhers. 6/ India includes Pakistan for 1934-38 period. 7/ Data for Communist countries for all years include U.S.S.R,, Mainland China, eastern European countries, and Cuba.
Compiled from Foreign Agricultural Service data.
- 45 -

Table 23. countries
-Cotton: World Consiimption by regions and major 19i^7-6i^ and averages 193^-38 and 1959-63
Continent and
Year beginning August 1
country . 19U7 ; 1948 ; 1949 : 1950 ; 1951 : 1952 ; 1953 ; 195^^ : 1955 ; 1956
. 1,000 1,000 1,000 1,000 1,000 1,000 1,000 1,000 1,000 1,000 • bales bales bales bales bales bales bales bales bales bales • 2/ 2/ 2/ 2/ 2/ 2/ 2/ 2/ 2/' 2/'
united States ' 9,35^^ 7,795 8,851 10,509 9,196 9,461 8,576 8,841 9,210 8,608 Canada 365 381 419 477 342 353 288 336 362 356 Mexico 3kk 31^ 309 334 314 330 329 383 443 468
Total Central America 65 53 55 62 60 55 71 67 70 81 South America
Argentina 370 370 388 460 495 373 422 489 523 543 Brazil 836 822 822 836 822 797 896 996 1,046 1,026 Chile ^9 67 83 66 66 90 90 90 95 90 Colombia 100 114 111 110 105 124 132 153 158 168 Others 149 137 120 136 131 139 153 175 170 179
Total l,50i+ 1,510 1,524 1,608 1,619 1,523 1,693 1,903 1,992 2,006 Western Europe
Austria 6k 80 93 95 95 77 94 107 104 108 Belgium i+03 369 4o4 474 405 369 427 423 413 449 France 1,113 1,060 1,155 1,250 1,221 1,1^5 1,330 1,263 1,213 1,369 West Germany i^32 583 869 1,046 961 1,069 1,217 1,246 1,313 1,425 Greece 86 84 95 114 110 106 118 116 105 120 Italy 829 951 932 983 888 860 872 801 762 879 Netherlands 221 245 279 298 266 294 321 E33 336 3^1 Portugal 149 150 164 160 177 173 193 213 202 198 Spain 3^3 4i8 269 244 314 3i^3 319 349 395 458 Sweden 113 116 127 129 124 119 13^ 135 13Í+ 139 Switzerland lUO 131 139 157 164 1^5 163 173 167 183 United Kingdom 1,926 2,012 2,083 2,126 1,752 1,557 1,826 1,754 1,539 1,589 Yugoslavia 139 154 162 144 129 119 121 154 174 194 Others lOU 88 117 127 132 134 140 138 135 155
Total 6,062 6,441 6,888 7,347 6,738 6,510 7,275 7,205 6,992 7,607 Eastern Europe Bulgaria 75 80 80 95 115 134 149 149 15^ 159 Czechoslovakia 246 299 31^ 304 284 269 299 329 349 368 East Germany 75 100 124 199 249 299 344 398 398 408 Hungary I2U 139 159 189 224 229 234 234 199 156 Poland 336 383 4o8 hl3 i^l3 418 423 433 438 423 Rumania 114 149 169 179 224 229 234 249 224 209 Others 0 0 1 3 10 20 18 14 18 24 Total 970 1,150 1,255 1,382 1,519 1,598 1,701 1,806 1,780 1,747
U.S.S.R. 2,888 3,087 3,336 3,93^ 4,182 ^,431 4,680 5,079 ^,979 5,377 Africa Republic of South Africa 22 23 25 30 35 35 40 42 47 60 U.A,R. (Egypt) 21U 232 238 280 311 313 337 359 400 ^13 Others 66 73 77 84 90 100 107 119 112 135 Total 302 328 340 394 436 448 484 520 559 608
Asia and Oceania China (Mainland) 5/ 3,037 2,788 2,689 3,236 4,182 ^,979 5,477 5,328 5,875 6,174 China (Taiwan) - 2 15 26 49 90 119 124 124 129 Hong Kong 1 18 75 126 161 156 203 217 222 231 India 6/ 3,585 3,73^ 3,256 3,137 3,505 3,859 3,973 ^,103 4,262 4,511 Iran 88 65 60 45 70 70 70 70 78 90 Japan 7/ 589 73^^ 1,028 1,592 1,808 2,056 2,431 2,133 2,312 2,834 South Korea 87 136 199 115 129 110 149 209 219 264 Pakistan 6/ 75 90 144 149 179 229 448 657 817 856 Philippines : 7 4 7 10 9 10 10 8 •10 29 Turkey 184 184 204 229 274 289 358 438 463 498 Others : 200 222 222 268 287 274 318 302 308 344 Total 7,853 7,977 7,899 8,933 10,653 12,122 13,556 13,589 14,690 15,960
World total : 29,707 29,036 30,876 34,980 35,059 36,831 38,653 39,729 41,077 42,818
Foreign Free World : 13,457 1^,215 1^,745 15,919 15,979 16,360 18,214 18,665 19,192 20,855
Communist countries 8/ 6,896 7,026 7,280 8,552 9,884 11,010 11,863 12,223 12,675 13,355
See footnotes at end of t .able. r^rtM-K-î n ̂^e»Am.
- 46

Table 13.—Cotton: World Consumption "by regions and major countries, 19k7'6k and averages 193^-38 and 1959-63^ continued-
Continent and country
Year beginning August 1
1957 : 1958 1959 ; i960 1961 ; 1962 ; 1963 ;i964 1/ Average-Average iQ'^li.-3finQ£;Q-63
1,000 1,000 1,000 1,000 1,000 1,000 1,000 1,000 1,000 1,000 bales bales bales bales bales bales bales bales bales bales
2/ 2/ 2/ "IT 2/ 2/ 2/ 2/ 2/ 2/'
United States 7,999 8,703 9,025 8,279 8,954 8,419 8,609 9,171 6,427 8,657 Canada 325 331 319 334 383 373 h33 448 267 368 Mexico klQ 1+78 483 498 508 508 558 598 226 511
Total Central America 88 86 104 128 144 155 160 189 14 138 South America
Argentina 519 51+8 483 498 483 3^+9 ^13 508 113 445 Brazil l,0k6 l,li+5 1,180 1,245 1,295 1,245 1,245 1,195 510 1,242 Chile 80 60 82 105 110 115 119 119 14 106 Colombia l8l 191 215 235 244 259 264 274 35 244 Others 178 181 209 198 202 206 231 251 47 209 Total 2,00if 2,125 2,169 2,281 2,334 2,174 2,272 2,347 719 2,246
Western Europe Austria 119 113 119 126 127 115 117 120 178 121 Belgium 372 375 411 425 394 395 383 368 355 402 France 1,401 1,166 1,367 1,391 1,307 1,275 1,301 1,184 1,176 1,320 West Germany 1^27 1,3^9 1,466 1,494 1,389 1,301 1,306 1,313 3/1,187 1,391 Greece 130 128 120 137 144 154 162 176 96 •143 Italy 860 868 1,019 1,036 1,043 1,060 1,045 876 681 l,04l Netherlands 331 328 355 375 355 357 350 354 234 358 Portugal 206 209 252 302 302 319 341 368 90 303 Spain ^73 i+73 558 578 637 548 548 498 233 574 Sveden 139 126 128 130 122 106 98 97 133 117 Switzerland 193 154 179 194 194 189 189 199 125 189 United Kingdom 1^3 1,275 1,305 1,227 1,052 1,021 1,060 1,071 2,730 1,133 Y\]goslavia 19^^ 199 219 239 249 329 329 373 89 273 Others li^3 11+2 166 169 168 158 170 169 106 166
Total iM:^ 6,905 7,664 7,823 7,483 7,327 7,399 7,166 7,413 7,539 Eastern Europe Bulgaria 161+ 189 219 214 229 239 249 254 74 230 Czechoslovakia kod 1+23 448 468 488 483 473 473 337 472 East Germany 1+23 1+1+8 458 468 478 458 468 428 4/— 466 Hungary 203 199 234 254 269 284 299 314 5/.- 268 Poland 1+63 497 533 573 588 573 597 667 314 573 Rumania 229 23I+ 239 259 299 309 319 324 61 285 Others 2i+ 23 25 27 26 26 30 30 32 27
Total 1,91^ 2,013 2,156 2,263 2,377 2,372 2,435 2,490 1/818 2,321
U.S.S.R. : 5,676 5,975 6,174 6,174 6,224 6,274 6,572 6,821 3,007 6,284 Africa Republic of South Africa : 70 75 90 110 129 139 139 169 1 121 U.A.R. (Egypt) 1+1+5 514 517 546 59^ 632 607 657 73 579 Others 155 169 177 166 214 247 274 343 32 216
Total 670 758 784 822 937 1,018 1,020 1,169 106 916 Asia and Oceania China (Mainland) ¿/ • 6,771 8,1+65 8,664 6,772 ^,581 ^,581 5,477 6, m 3,584 6,015 China (Taiwan) : 129 1I+I+ 184 209 249 249 274 283 2 233 Hong Kong : 269 319 4o8 478 508 518 573 568 4/~ 497 India 6/ l+,342 4,397 h Ml 4,601 4,919 4,899 5,228 5,502 3,083 4,816 Iran • 100 134 179 199 249 224 179 209 78 206 Japan jj 2,1+1+3 2,380 2,927 3,427 3,272 3,001 3,151 3,387 3,301 3,156 South Korea : 239 269 299 269 249 319 329 309 225 293 Pakistan 6/ • 921 1,016 1,095 1,120 1,125 1,175 1,235 1,304 V— 1,150 Philippines k5 75 124 1^ 179 159 159 134 2 151 Turkey : 518 528 498 498 508 498 558 622 97 512 Others : 380 412 487 531 589 638 741 806 114 597
Total :16,157 18,139 19,296 18,238 16,428 16,261 17,904 19,298 10,486 17,626
World total : 1+2,752 45,513 48,174 46,840 45,772 44,881 47,362 49,697 29,i+83 46,606
Foreign Free World i20,323 20,290 22,065 23,238 23,518 23,113 24,139 24,894 15,533 23,215
Communist countries 8/ .ll+,l+30 16,520 17,084 15,323 13,300 13,349 I4,6l4 15,632 7,523 14,734
1/ Preliminary, 2/ Bales of 500 pound gross weight except for United States which are running bales. 3/AII Germany. 4/^Not available. 5/ Includes Manchuria. 6/ Psücistan included in India for 1934-38 period. 7/ Mill consunrption only through 1934-48 period. 87 Data for Communist countries for all years include U.S.S.R,, Mainland China, eastern European countries and Cuba.
Compiled from International Cotton Advisory Committee and Foreign Agricultural Service data,
- 47 -

Table lU.—Mill consumption of cotton, wool and m-.n-made fibers: Total and percent of total by fiber, by country and regions, I9U9-63
: Cotton Wool : Man- -made :
Total Cotton : Wool : Man -made :
Calendar . Non- * • Non- * Total Year j Rayon cellulosic: Rayon :cellulosic:
: Million Million Million Million Million : pounds pounds pounds pounds pounds Percent Percent Percent Percent Percent
United States
I9Í+9 : 3,763.3 511.0 993.3 92.7 5,360.3 70.2 9.5 18.6 1.7 100.0
1950 : U,612.7 6U7.2 1,351.8 li+0.5 6,752.2 68.3 9.6 20.0 2.1 100.0
1951 : l+,8lU.9 1+95.2 1,276.7 195.5 6,782.3 71.0 7.3 18.8 2.9 100.0
1952 : U,U29.3 i+29.2 1,189.i+ 251.3 6,299.2 70.2 6.8 19.0 U.O 100.0
1953 : U,U05.2 U53.0- 1,252.0 288.8 6,399.0 68.8 7.2 19.5 »+.5 100.0
I95I+ : U,076.3 370. U 1,129.6 336.2 5,912.5 68.9 6.3 19.1 5.7 100.0
1955 : U,333.6 398.6 lM^'7 Ul+0.9 6,587.8 65.8 6.0 21.5 6.7 100.0
1956 • 1+,298.1 U20.2 1,216.5 1+76,2 6,1+11.0 67.0 6.6 19.0 7.»+ 100.0
1957 • U,008.6 35»+. 9 1,191.1 601.9 6,156.5 65.0 5.8 19.3 9.9 100.0
1958 3,8U5.9 327.6 1,095.0 569.2 5,837.7 65.9 5.6 18.8 9.7 100.0
1959 : U,305.U 306.0 1,257.1 752.9 6,621.1+ 65.0 1+.6 19.0 11.1+ 100.0
i960 • U,l66.7 399.9 1,0U8.3 793.9 6,1+08.8 65.0 6.2 16.1+ 12.U 100.0
1961 : lv,062.6 378.1 1,078.0 8U1.I 6,359.8 63.9 5.9 17.0 13.2 100.0
1962 : 1+,168.5 379.0 1,205.0 1,112.7 6,865.2 60.7 5.5 17.6 16.2 100.0
1963 1/ : U,020.1 39^.0 1,337.5 1,293.9 7,01+5.5 57.1 5.6 18.9 18.1+ 100.0
Belgium
19^9 : 193.6 70.7 23,i+ 287.7 67.3 2I+.6 8.1 — 100.0
1950 192.2 79.8 30.6 1.0 303.6 63.3 26.3 10.1 .3 100.0
1951 22U.2 61.2 38.2 1.9 325.5 68.9 18.8 11.7 .6 100.0
1952 173.5 57.1 18.1 2.2 250.9 69.2 22.8 7.2 .8 100.0
1953 190.3 69.9 27.1 3.7 291.0 65.1+ 2I+.O 9.»+ 1.2 100.0
I95Í* 210.8 63.3 37.0 U.2 315.3 66.9 20.0 11.8 1.3 100.0
1955 196.U 6k.Q 36.U k.6 302.2 65.1 21.1+ 12.0 1.5 100.0
1956 202.2 78.0 39.0 6.2 325.1+ 62.1 2I+.O 12.0 1.9 100.0
1957 210.8 79.8 50.0 7.3 31+7.9 60.6 22.9 II+.3 2.2 100.0
1958 I6U.5 70.3 32.0 6.2 273.0 60.2 25.8 11.8 2.2 100.0
1959 190.7 80.0 t+3.7 9.0 323.»+ 59.0 2I+.7 13.5 2.8 100.0
i960 202.8 88.0 51.1 1I+.3 356.2 56.9 2U.7 1I+.I+ l+.O 100.0
1961 201.1 8U.U 61.7 20.1 367.3 5»+.7 23.0 16.8 5.5 100.0
1962 185.6 102.1 7U.I 27.1 388.9 1+7.7 26.2 19.1 7.0 100.0
1963 1/ 184.5 97.0 8U.2 38.1+ i+oi+.i 1+5.7 2I+.O 20.9 9.»+ 100.0
France
I9U9 508,1 262. U 11+8.7 l.U 920.6 55.2 28.5 16.. 1 .2 100.0
1950 558.8 25»+. 3 133.8 2.1+ 9»+9.3 58.9 26.8 ll+.l .2 100.0
1951 : 590.8 197. U 187. U 1+.8 980.1+ 60.3 20.1 19.1 .5 100.0
1952 : 5i^.3 213.8 llfO.9 6.6 909.6 60.3 23.5 15.5 .7 100.0
1953 582.2 250.2 177.0 12.1 1,021.5 57.0 2I+.5 17.3 1.2 100.0
I95I+ : 6U9.O 256. U 179.0 lU.l 1,098.5 59.1 23.3 16.3 1.3 100.0
1955 : 570.3 2Í+5.6 .187.8 21.8 1,025.5 55.6 2I+.O 18.3 2.1 100.0
1956 602.3 276.2 196.0 32.6 1,107.1 5I+.I+ 2U.9 17.7 3.0 100.0
1957 : 667.3 310.»+ 230.6 UO.l 1,21+8.1+ 53.»+ 2I+.9 18.5 3.2 100.0
1958 630.5 266.1 221.6 1+5.1+ 1,163.6 5I+.2 22.9 19.0 3.9 100.0
1959 : 589.3 28J+.O 192.7 65.7 1,131.7 52.1 25.1 17.0 5.8 100.0
i960 663.»^ 301.6 229.1 102.5 1,296.6 51.2 23.3 17.6 7.9 100.0
1961 : 661.8 301.1 231.9 10I+.7 1,299.5 50.9 23.2 17.8 8.1 100.0
1962 : 61U.O 290.8 236.6 13»+. 9 1,276.3 1+8.1 22.8 18.5 10.6 100.0
1963 1/ 616.6 296.3 255.1 173.7 1,3»+1.7 1+6.0 22.1 19.0 12.9 100.0
Federal Republic of Germany
I9U9 : 358.5 90.8 296.1+ 71+5.7 1+8.1 12.2 39.7 — 100.0
1950 : U52.2 127.6 31+0.8 1.1+ 922.0 1+9.0 13.8 37.0 .2 100.0
1951 : 511.5 117.1 365.7 1+.8 999.1 51.2 11.7 36.6 .5 100.0
1952 : U68.5 131.6 297.6 6.k 90I+.I 51.8 II+.6 32.9 .7 100.0
1953 : 5U8.7 153.7 31+2.2 7.7 1,052.3 52.2 II+.6 32.5 .7 100.0
195U : 596.1 151.7 370. U 13.0 1,131.2 52.7 13.1+ 32.7 1.2 100.0
1955 : 599.9 180.1 393.7 23.6 1,197.3 50.1 15.0 32.9 2.0 100.0
1956 : 6if9.0 191.»+ 381+.3 28.7 1,253.»+ 51.8 15.3 30.6 2.3 100.0
1957 : 696.9 192.2 388.5 37.0 l,31»+.6 53.0 1I+.6 29.6 2.8 100.0
1958 : 665.3 ll^U.8 31+3.3 1+6.1 1,199.5 55.5 12.1 28.6 3.8 100.0
1959 : 669.8 1U9.9 376.3 78.0 1,271+.0 52.6 11.8 29.5 6.1 100.0 i960 : 713.6 151.5 398.1+ 108.5 1,372.0 52.0 11.0 29.0 7.9 100.0
1961 : 689.6 li+9.7 399.0 129.2 1,367.5 50.1+ 11.0 29.2 9.»+ 100.0
1962 : 6U9.O 11+7.0 398.6 185.1+ 1,380.0 1+7.0 10.7 28.9 13.u 100.0 1963 1/ : 618.6 153.»+ U16.9 20I+.6 1,393.5 1+1+.1+ 11.0 29.9 1I+.7 100.0
continued-
- kQ
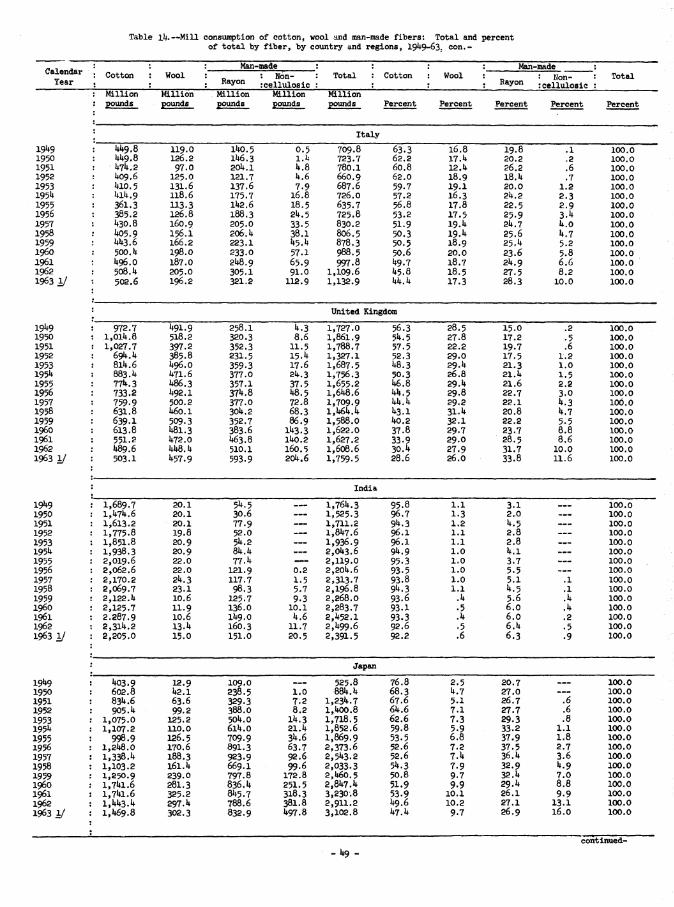
Table i^.—Mill consumption of cotton, wool and man-made fibers: Total and percent of total by fiber, by country and regions, 19IJ.9-63. con.-
Calendar Man-made : Maji-made :
: Cotton Wool : Non- Total : Cotton • Wool : Non- : Total Year Rayon tee Huíosle I Rayon Îeellulosic :
: Million Million Million Million Million : pounds pounds pounds pounds pounds Percent Percent Percent Percent Percent
: Italy
19^9 : kk9.Q 119.0 140.5 0.5 709.8 63.3 16.8 19.8 .1 100.0 1950 : kkS.b 126.2 146.3 1.4 723.7 62.2 17.4 20.2 .2 100.0 1951 U7U.2 97.0 204.1 4.8 780.1 60.8 12.4 26.2 .6 100.0 1952 : U09.6 125.0 121.7 4.6 660.9 62.0 18.9 18.4 .7 100.0 1953 : UlO.5 131.6 137.6 7.9 687.6 59.7 19.1 20.0 1.2 100.0 195U Ullt.9 118.6 175.7 16.8 726.0 57.2 16.3 24.2 2.3 100.0 1955 : 361.3 U3.3 142.6 18.5 635.7 56.8 17.8 22.5 2.9 100.0 1956 : 385.2 126.8 188.3 24.5 725.8 53.2 17.5 25.9 3.4 100.0 1957 U3O.8 160.9 205.0 33.5 830.2 51.9 19.4 24.7 4.0 100.0 1958 U05.9 156.1 206.4 38.1 806.5 50.3 19.4 25,6 4.7 100.0 1959 kks.e 166.2 223.1 45.4 878.3 50.5 18.9 25.4 5.2 100.0 i960 500.u 198.0 233.0 57.1 988.5 50.6 20.0 23.6 5.8 100.0 1961 U96.0 187.0 248.9 65.9 997.8 49.7 18.7 24.9 6,G 100.0 1962 508 A 205.0 305.1 91.0 1,109.6 45.8 18.5 27.5 8.2 100.0 19631/ 502.6
•
196.2 321.2 112.9 1,132.9 44.4 17.3 28.3 10.0 100.0
United Kingdom
19^9 972.7 491.9 258.1 4.3 1,727.0 56.3 28.5 15.0 .2 100.0 1950 1,01U.8 518.2 320.3 8.6 1,861.9 54.5 27.8 17.2 .5 100.0 1951 1,027.7 397.2 352.3 11.5 1,788.7 57.5 22.2 19.7 .6 100.0 1952 69^. U 385.8 231.5 15.4 1,327.1 52.3 29.0 17.5 1.2 100.0 1953 814.6 496.0 359.3 17.6 1,687.5 48.3 29.4 21.3 1.0 100.0 1954 883.i^ 471.6 377.0 24.3 1,756.3 50.3 26.8 21.4 1.5 100.0 1955 77i^.3 486.3 357.1 37.5 1,655.2 46.8 29.4 21.6 2.2 100.0 1956 733.2 492,1 374.8 48.5 1,648.6 44.5 29.8 22.7 3.0 100.0 1957 759.9 500.2 377.0 72.8 1,709.9 44.4 29.2 22.1 4.3 10Ó.0 1958 631.8 460.1 304.2 68.3 1,464.4 43.1 31.4 20.8 4.7 100.0 1959 639.1 509.3 352.7 86.9 1,588.0 40.2 32.1 22.2 5.5 100.0 i960 613.8 481.3 383.6 143.3 1,622.0 37.8 29.7 23.7 6.8 100.0 1961 551.2 472.0 463.8 140.2 1,627.2 33.9 29.0 28.5 8.6 100.0 1962 1^9.6 448.4 510.1 160,5 1,608.6 30.4 27.9 31.7 10.0 100.0 19631/ 503.1 457.9 593.9 204.6 1.759.5 28,6 26.0 33.8 11.6 100.0
India
19*^9 : 1,689.7 20.1 54.5 1,764.3 95.8 1.1 3.1 — 100.0 1950 : 1,U7U.6 20.1 30.6 — 1,525.3 96.7 1.3 2.0 _— 100.0 1951 : 1,613.2 20.1 77.9 ... 1,711.2 94.3 1.2 4.5 100.0 1952 ; 1,775.8 19.8 52.0 — 1,847.6 96.1 1.1 2.8 100.0 1953 : 1,851.8 20.9 54.2 — 1,936.9 96.1 1.1 2.8 100.0 195lt : 1,938.3 20.9 84.4 2,043.6 94.9 1.0 4.1 100.0 1955 : 2,019.6 22.0 77.4 .... 2,119.0 95.3 1.0 3.7 — 100.0 1956 : 2,062.6 22.0 121.9 0.2 2,204.6 93.5 1.0 5.5 — 100.0 1957 : 2,170.2 24.3 117.7 1.5 2,313.7 93.8 1.0 5.1 .1 100.0 1958 : 2,069.7 23.1 98.3 5-7 2,196.8 94.3 1.1 4.5 .1 100.0
1959 : 2,122.4 10.6 125.7 9.3 2,268.0 93.6 .4 5.6 .4 100.0 i960 : 2,125.7 11.9 136.0 10.1 2,283.7 93.1 .5 6.0 .4 100.0 1961 2.287.9 10.6 149.0 4.6 2,452.1 93.3 .4 6.0 .2 100.0 1962 : 2,314.2 13.4 160.3 11.7 2,499.6 92.6 .5 6.4 .5 100.0
19631/ :
:
2,205.0 15.0 151.0 20.5 2,391.5 92.2 .6 6.3 .9 100.0
: Japan
19t^9 : 403.9 12.9 109.0 525.8 76.8 2.5 20.7 100.0 1950 : 602.8 42.1 238.5 1,0 884.4 68.3 4.7 27,0 100.0
1951 : 834.6 63.6 329.3 7.2 1,234.7 67.6 5.1 26.7 .6 100.0 1952 : 905.4 99.2 388.0 8.2 1,400.8 64.6 7.1 27.7 .6 100.0
1953 : 1,075.0 125.2 504.0 14.3 1,718.5 62.6 7.3 29.3 .8 100.0
195Í* 1,107.2 110.0 614.0 21.4 1,852.6 59.8 5.9 33.2 1.1 100.0
1955 : 126.5 709.9 34.6 1,869.9 53.5 6,8 37.9 1.8 100,0 1956 : 1,248.*0 170.6 891.3 63.7 2,373.6 52.6 7.2 37.5 2.7 100.0
1957 : 1,338.4 188.3 923.9 92.6 2,543.2 52.6 7.4 36.4 3.6 100.0
1958 : 1,103.2 161.4 669.1 99.6 2,033.3 54.3 7.9 32.9 4.9 100.0
1959 : 1,250.9 239.0 797.8 172.8 2,460.5 50.8 9.7 32.4 7.0 100.0 i960 : 1,741.6 281.3 836.4 251.5 2,847.4 51.9 9.9 29.4 8.8 100,0 1961 1,741.6 325.2 845.7 318.3 3,230.8 53.9 10.1 26.1 9.9 100.0 1962 : 1,443.4 297.4 788.6 381.8 2,911.2 49.6 10.2 27.1 13.1 100.0
1963 1/ Î 1,469.8 302.3 832.9 497.8 3,102.8 47.4 9.7 26.9 16.0 100.0
continued-
h9

T^ble ik.--Mill consumption of cotton wool and man-made fibers : Total and percent of total by fiber, by country and regions, 19^9-63 5 con.
Cotton : Wool Man-made :
Total : Cotton : Wool Man-made :
Calendar ;
year : Rayon Won- :
cellulosic : ; Rayon : Non- :
: cellulosic : Total
Million Million îiillion Million Million '^ pomids pounds pounds I>ounds pounds Percent Percent Percent Percent Percent
U.A.R. (Egypt)
Í9Í+9 : 113.3 4.8 15.8 133.9 84.6 3.6 11.8 — 100.0 1950 : 118.5 3.8 25.8 _-_ 148.1 80.0 2.6 17.4 —_ 100.0 1951 Î lUif.lj. 3.8 21.5 >__ 169.7 85.1 2.2 12.7 — 100.0 1952 11^8.6 4.4 14.6 ___ 167.6 88.7 2.6 8.7 __- 100.0 1953 Ikl.l 3.3 17.4 — 168.4 88.7 2.0 10.3 100.0 195^ ; 171.5 3.7 19.4 __. 194.6 88.1 1.9 10.0 100.0 1955 : I8I4.5 2.9 22.3 __. 209.7 88.0 1.4 10.6 -_. 100.0 1956 : 19^^ A 2.9 23.6 — 220.9 88.0 1.3 10.7 100.0 1957 : 203.7 3.3 21.6 228.6 89.1 1.4 9.5 100.0 1958 : 238.1 3.7 22.3 0.2 264.3 90.1 1.4 8.4 .1 100.0 1959 : 235.7 3.7 25.4 0.4 265.2 88.9 1.4 9.6 .1 100.0 i960 : 253.7 3.7 35.7 0.4 293.7 86.4 1.3 12.2 .1 100.0 1961 270.9 3.7 25.1 0.4 300.3 90.2 1.2 8.4 .2 100.0 1962 281.1 3.7 22.3 0.7 307.8 91.3 1.2 7.3 .2 100.0 1963 1/ 299.6 3.8 18.7 0.9 323.0 92.7 1,2 5.8 .3 100.0
World total
19^9 1^053.2 2,422.0 0,745.6 111.9 19,332.7 72.7 12.5 14.2 .6 100.0 1950 15,582.8 2,641.0 3,542.9 175.9 21,942.6 71.0 12.0 16.2 .8 100.0 1951 17,088.5 2,298.2 3,991.8 261.9 23,640.4 72.3 9.7 16.9 1.1 100.0 1952 16,910. i^ 2,398.6 3,536.2 332.7 23,177.9 73.0 10.3 15.3 1.4 100.0 1953 l8,123.i+ 2,669.6 4,138.0 405.4 25,356.4 71.5 10.6 16.3 1.6 100.0 195i^ 18,811^.5 2,605.8 4,490.8 495.4 26,406.5 71.2 9.9 17.0 1.9 100.0 1955 19,2li0.9 2,702.8 5,031.3 582.0 27,557.0 69.8 9.8 18.3 2.1 100.0 1956 gQ,020.2 2,914.5 5,259.3 785.9 28,979.9 69.1 10.1 18.1 2.7 100.0 1957 20,71^.9 2,998.3 5,456.8 1,029.1 30,199.1 68.6 9.9 18.1 3.4 100.0 195Ô 20,905.6 2,813.1 5,027.4 1,052.9 29,799.0 70.2 9.4 16.9 3.5 100.0 1959 22,376.7 3,187.9 5,557.4 1,453.1 32,574.9 68.7 9.8 17.0 4.5 100.0 1960 23,01+9.8 3,296.1 5,719.8 1,562.8 33,628.5 68.5 9.8 17.0 4.7 100.0 1961 23,196.1 3,317.9 5,909.9 1,840,8 34,264.7 67.7 9.7 17.2 5.4 100.0 1962 22,096.5 3,310.0 6,300.3 2,383.4 34,090.2 64.8 9.7 18.5 7.0 100.0 1963 1/ 22,592.3 3,341.1 6,749.4 2,935.4 35,618.2 63.4 9.4 18.9 8.3 100.0
Coanaunist countries
1949 3,^41.6 2Ö6.Ö 277.2 2.4 4,008.0 85.8 7.2 6.9 .1 100.0 1950 3,728.U 286.8 358.5 4.8 4,378.5 85.2 6.6 8.1 .1 100,0 1951 1^,373.7 382.4 4o6.3 8.6 5,171.0 84.6 7.4 7.8 .2 100.0 1952 : k,960,h 385.8 537.9 15.4 5,899.5 84.1 6.5 9.1 .3 100.0 1953 5,i*57.5 429.9 634.9 19.8 6,541.0 83.4 6.6 9.7 .3 100.0 195i^ • 5,765.0 498.2 696.7 24.3 6,984.2 82.6 7.1 10.0 .3 100.0 1955 : 5,952.U 507.1 724.7 30.9 7,215.1 82.5 7.0 10.1 .4 100.0 1956 I 6,205.9 560.0 773.4 39.7 7,579.0 81.9 7.4 10.2 .5 100.0 1957 : 6,613.8 615.1 842.2 50.7 8,121.8 81.4 7.6 10.4 .6 100.0 1958 Î 7,330.3 659.2 913.4 59.5 8,962.4 81.8 7.3 10.2 .7 100.0 1959 : 8,02U.7 716.5 961.9 70.5 9,773.6 82.1 7.3 9.9 .7 100.0 i960 : 8,035.8 800.0 1,086,9 89.5 10,012.2 80.3 8.0 10.8 .9 100.0 1961 : 7,693.0 784.0 1,192.2 117.1 9,786.3 78.6 8.0 12.2 1.2 100.0 1962 : 6,780.5 791.0 1,271.6 144.6 8,987.7 75.4 8.8 14.2 1.6 100.0 19631/ : 7,109.2 800.0 1,342.4 175.9 9,427.5 75.4 8.5 14.2 1.9 100.0
] Foreign Free World countries
19U9 : 6,01+8.3 1,624.2 1,475.1 16.7 9,964.3 68.7 16.3 14.8 .2 100.0 1950 : 7,241.7 1,706.9 1,832.7 29.2 10,810.5 67.0 15.8 16.9 .3 100.0 1951 : 7,899.9 1,420.6 2,308.7 57.8 IL, 687.0 67.6 12.2 19.7 .5 100.0 1952 : 7,520.8 1,583.6 1,808.8 65.9 10,97^.1 68.5 14.4 16.5 .6 100.0 1953 : 8,261.7 1,806.7 2,251.1 96.8 12,416.3 66,5 14.6 18.1 .8 100.0 195J+ : 8,973.2 1,737.2 2,664.5 134.9 13,509.8 66.4 12.9 19.7 1.0 100.0 1955 : 8,95i*.9 1,797-2 2,892,0 110.2 13,754.3 65.1 13.1 21.0 .8 100.0
-1956 : 9,516.2 1,934.3 3,269.4 270.1 14,990.0 63.5 12.9 21.8 1.8 100.0 1957 : 10,092.4 2,028.2 3,423.5 376.5 15,920.6 63.4 35.7 21.5 2.4 100.0 1958 : 9,729.3 1,826.3 3,019.0 424.2 I4,998.B 64.9 12.2 20,1 2.8 100.0 1959 : 10,046.6 2,165.4 3,338.4 629.6 I6,i8o.o 62.1 1.3.4 20.6 3.9 100.0 i960 : 10,847.3 2,096.1 3,584.7 679.5 17,^7.6. 63.0 12.2 20.8 4.0 100.0 1961 : 11,440.6 2,155.9 3,639.6 882.7 I8^il8.a 63.1 11.9 20.1 4.9 100.0 1962 ; 11,14T.6 2,l40.O 3,823.7 1,126.1 18,237.4 61.1 11.7 21.0 6.2 100.0 19631/ : 11,463.0 2,147.1 4,069.5 1,465.6 19,145.2 59.5 11.2 21.2 7.7 100.0
1/ Prelijninary. 2/ Compiled from Cotton - World Statistics, Quarterly Bulletin of the International Cotton Advisory
Coomittee> October 1964 and previous issues. - 50 -

Table 15—Man-made fibers: Produetioa and cotton equivalent, Uhited States
: Rayon and acetate Non-celluloslc fibers Total
Year ; Production |
Cotton equivalent Production :
i/ : Cotton
equivalent
: Production ; Cotton
equivalent
Million 1,000 Million 1,000 Million 1,000 pounds bales 2/ pounds
UNITED
bales 2/
vS T A T E S
pounds bales 2/
L9to 1*71.2 1,1*11* i*.6 16 1*75.8 1,1*30 I9IVI 573.2 1,702 11.9 lv2 5Ö5.1 1,71*1* 191*2 632.6 1,866 21*. 5 86 657.1 1,952 19i*3 663.1 1,958 39.2 138 702.3 2,096 19^* 723.9 2,151* 1*8.0 169 771.9 2,323 19i*5 792.1 2,381 50.1 176 81*2.2 2,557 19U6 853.9 2,573 51*. 5 189 908.1* 2,762 19^*7 975.1 2,912 51.1* 181* 1,026.5 3,096 191*8 1,121*. 3 3,351 71*.5 265 1,198.6 3,616 19J+9 995.7 3,013 95.8 339 1.091.5 3,352
L950 1,259.1* 3,752 11*5.9 516 1,1*05.3 H,268 1951 l,29l*.2 3,81<0 205.1 72I* 1,1*99.3 k.^k 1952 1,135.8 3,380 255.7 901* 1,391.5 1*,283 1953 1,196.9 3,576 297.0 1,072 1,1*93.9 1*,61*8 1951* 1,085.7 3,181* 31*3.8 1,256 1,1*29.5 1*, 1*1*0 1955 1,260,7 3,808 1*55.1 1,661* 1,715.8 5,1*72 1956 1,11*7.9 3,1*1*8 1*96.8 1,826 1,6M*.7 5,271* 1957 1,139.1* 3,1*06 626.2 2,315 1,765.6 5,721 1958 l,03l*.9 3,0Ti^ 59I+.3 2,223 1,629.2 5,298 1959 1,166.8 3,505 792.7 2,956 1,959.5 6,U6l
I960 1,028.5 3,085 85l*.2 3,202 1,882.7 6,286 1961 1,095.2 3,210 Q00.2 3,384 1,995.1* 6,593
8,oH6 1962 1,272.1 3,700 1,163.2 i*,3l*6 2,1*35.3 1963 1,31*8.8 3,81*6 1,31*7.9 1*,972 2,696.7 8,816 1961* 1,1*31*8 1+,101 1,61*7.2 6,033 3,079.0 10,135
F 0 R E I G N C OUNTRIES
19i»6 : 875.3 2,382 2.1» 9 877.7 2,391 19^7 1.116.2 3,062 5.2 18 1.121.1* 3,080 19it8 : 1.1*16.9 3,857 9.1 31 1,1*26.0 3,888 19it9 : 1.751.1 l*.7l*5 16.9 57 1.768.0 1*,802
1950 : 2,293.1* 6,109 31.5 106 2.32U.9 6.215 1951 : 2,715.6 7.21*9 59.1* 193 2,775.0 7,1*1*2 1952 : 2.398.5 6.38U 77.6 251» 2.U76.I 6,638 1953 : 2,957.0 7.81*1 107.6 352 3,061*.6 8,191» 195Í* : 3,383.6 8.972 150.9 500 3.531».5 9.1*72
1955 : 3,762.6 9.999 2ll».9 719 3,977.5 10,718 1956 1*,10U.3 10.870 289.3 962 1*,393.6 11.832 1957 : 1*.308.3 11.1*86 1*02.8 1.331* U,711.1 12.821 1958 3,978.7 10,652 1»56.8 1.530 1*,1»35.5 12,182 1959 : 1*,370.2 11,751» 655.9 2.172 5,026.1 13,926
i960 1*,702.1 12,701 911*. 7 3,012 5,617.1» 15.713 1961 li,8l8.5 12,979 1,12U.Ö 3.700 5.91*2.5 16,678 1962 5,025.7 13,537 1,1»60.6 1*,806 6,1*86.3 I8,3l»l* 1963 5,379.2 ll*,i*28 1.81*5.1* 6,085 7,221».6 20.513 196U 5.823.6 15.601* 2.1*05.8
V7 0 R
7,936
L D
8,229.6 23,5l»0
191*6 191*7 191*8 191*9
: 1,729.2 1»,955 56.9 198 1,786.1 5.Í53 : 2.091.3 5.973 56.6 201 2,11*7.9 6.171* : 2.51*1.2 7.208 83.6 296 2,62U.8 7,501* : 2,71*6.8 7,758 112.7 396 2.859.5 8.151*
1950 1951 1952 1953 1951*
: 3,552.8 9.862 177,1* 622 3.730.2 io.i»eu : 1»,009.8 11,089 26U.5 918 l*.27l*.3 12,006 : 3,531*.3 9,763 333.3 1.157 3.867.6 10,920 : U,153.9 11,1*18 U0U.6 l,U2l* i»,558.5 12.81*1 : U,U69.3 12,156 U9U.7 1.756 l*,961».o 13.912
1955 1956 1957 1958 1959
• 5,023.3 13,807 670.0 2,363 5,693.3 16,190 5,252.2 11*, 318 786.1 2.788 6,038.3 17,106
■ 5,1*1*7.7 ll*,892 1,029.0 3.61*9 6,1*76.7 18,51*1 5,013.6 13,726 1,051.1 3.753 6.061*.7 17,1*79 5,537.0 15,259 1.UU8.6 5.129 6.985.6 20.3Ô8
i960 1961 1962 1963 I96k
5,731.2 15.785 1,768.9 6,211» 7,500.1 21,999 5.913.7 16.188 2,021*^2 7.083 7.937.9 23,271 6,297.8 17,237 2,623.8 9.151* 8,921.6 26.390 6,728.0 18.271* 3,193.3 11,058 9.921.3 29.332 7,255.6 19,705 1»,053.0 13.969 11.308.6 33.67U
IÍ Does not include glass fiber, prior to 1950, 500 pound gross weight bales.
- 51 -

Table 16.- -Cotton: World stocks by regions and major countries, Aiigust 1, 19^7-64 and average 1959-^3
Continent . and i 19^7 ; 19i^8 ; i9i^9 ; 1950 ; 1951 ; 1952 ; 1953 ; 1951+ ; 1955 ; 1956
country ! : : ,¡
1,000 1,000 1,000 1,000 1,000 1,000 1,000 1,000 1,000 1,000 bales bales bales bales bales bales bales bales bales bales
2/ £/ 2/ £/ i/ i/ i/ £/ £/ 2/
United States : 2,530 3,080 5,28r 6,81*6 2,278 2,789 5,605 9,728 11,205 ll+,529 90 72 51 50 62 52 1*8 2i+ 38 53
Mexico 279 120 170 161* 265 263 222 172 300 85
Central America : El Salvador : 3 k 1 7 1 22 12 13 55 35 Guatemala : 3 2 3 k 3 5 9 11 9 6 Nicaragua : 0 2 2 9 3 29 10 8 106 23 Others : 2k 17 7 10 7 7 7 9 8 9
Total : 30 25 13 30 It* 63 38 1*1 178 73
South America : Argentina : 1^28 tó5 501 693 1*1*8 551 1*82 51+7 1*80 520 Brazil ; 1,636 1,188 838 670 753 1,513 2,063 1,225 825 650 ColcHübia : 60 k9 59 67 1+7 1*1 57 55 k6 1*0 Baraguay : 21 19 2k 31* 25 32 30 20 20 15 Peru : 163 122 122 11*8 163 230 220 255 335 255 Others 28 27 36 1*2 52 53 53 55 53 60
Total 2,536 1,870 1,580 1,651^ 1,1*88 2,1*20 2,905 2,157 1,759 1,51+0
Western Europe Belgium 150 128 75 117 111* 118 105 126 130 102 France 586 292 306 1*95 313 263 339 335 390 365 Germany, Fed. Rep. of 1^ 135 116 282 212 156 219 328 330 290 Greece kk 20 12 32 1+3 1*2 22 16 31 26 Italy 556 359 317 ^^l 1*25 1*15 350 260 190 195 Netherlands 120 90 65 98 72 51 53 70 81 78 Spain 86 51 96 87 83 116 119 172 200 ll*0 United Kingdom 2,030 1,393 1,619 1,1+03 1,228 1,282 1,016 873 51*6 1*31* Others 281 278 268 256 258 303 329 337 352 352
Total • i^,038 2,7if6 2,87i|- 3,165 2,71+8 2,71*6 2,552 2,512 2,250 1,982
U.S.S.R and Eastern Europe 1^30 1,03^^ 910 958 1,271+ 1,61*1* 1,731 1,721 1,686 1,1+89
Africa Congo (Leopoldville) ! 137 107 3P1 116 a 112 85 102 120 115 U.A.R. (Egypt) : 1,351^ 890 800 700 620 1,025 985 595 720 390 MbZEOobique : 56 28 61 33 59 67 Til 85 80 1*1* Nigeria 30 22 31 19 7 60 1*8 38 60 30 Sudan : 126 106 85 « 176 83 218 213 325 270 Others : 116 65 228 166 158 255 11*9 220 211 216
Total : 1,819 1,218 1,326 1,119 1,101 1,602 1,596 1,253 1,516 1,065
Asia and Oceania China (Mainland) ': 1,230 1,015 i^l5 200 250 550 1,000 800 1*50 1,000 Hong Kong : 0 0 0 28 1*2 25 26 ^3 kh 50 India : 3,630 2,1^90 1,280 1,100 1,301* 1,775 1,155 1,371+ 2,1*00 1,935 Iran : 2k 13 2k 32 10 30 10 20 18 32 Japan : lÖL 235 k25 316 680 520 520 522 1*25 1*90 Pakistan : 250 178 190 251 lUO 1*00 1*50 300 310 225 Syria : k 3 5 5 23 35 17 12 10 7 Turkey Î 50 53 32 1+3 13 88 78 31+ 65 180 Others r 113 110 81* 81* 88 127 165 165 201 159
Total : 5,i^82 4,097 2,1*55 2,059 2,550 3,550 3,1+21 3,270 3,923 l+,078
Afloat ': 300 300 300 800 300 300 300 1*00 300 300
World total il8,53i^ lk,562 li*,966 16,81*5 12,080 15,1+29 18,1*18 21,278 23,155 25,191+
Foreign Free World a3,029 9,119 8,01*8 8,031+ 7,973 10,11*2 9,777 8,622 9,509 7,861*
Communist countries 3/ i 2,675 2,063 1,331 1,165 1,529 2,198 2,736 2,528 2,11*1 2,501
See footnotes at end of i bable
- 52 continued-
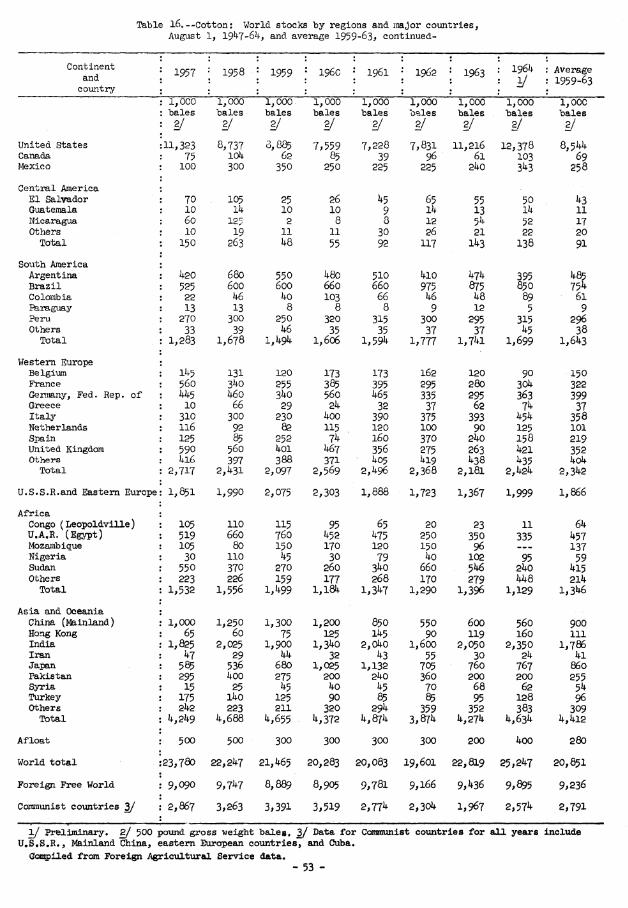
Table l6.--Cotton: V/orlà stocks by regions and inajor countries, August If 19^7-6^1-, and average 1959-63, continued-
Continent and ■ 1957 ; 1958 1959 ; i960 ; 1961 1962 1963 1964
1/ Average 1959-63
country
: 1,000 1,000 1,000 1,000 1,000 1,000 1,000 1,000 1,000 : bales bales bales bales bales bales bales bales bales
; ^/ 2/ 2/ £/ 2/ 2/ 2/ 2/ 1/ United States .11,323 8,737 3,885 7,559 7,228 7,831 11,216 12,378 8,544 Canada 75 lOil- 62 85 39 96 61 103 69 Mexico 100 300 350 250 225 225 240 343 258
Central America El Salvador 70 105 25 26 45 65 55 50 43 Guatemala 10 Ik 10 10 9 14 13 14 11 Nicaragua 60 125 2 8 8 12 54 52 17 Others 10 19 11 11 30 26 21 22 20 Total 150 263 48 55 92 117 143 138 91
South America Argentina i+20 680 550 480 510 410 474 395
754 Brazil 525 600 600 660 660 975 875 850 Colombia 22 k6 40 103 66 46 48 89 61 î^raguay 13 13 8 8 8 9 12 5 9 Peru 270 300 250 320 315 300 295 315 296 Others 33 39 46 35 35 37 37 45 38
Total 1,283 1,678 1,494 1,606 1,594 1,777 1,741 1,699 1,643
Western Europe Belgium 1^5 131 120 173 173 162 120 90 150 France 560 3^0 255 385 395 295 280 304 322 Gei^iany, Fed. Rep. of ' hk5 k6o 340 560 465 335 295 363 399 Greece 10 66 29 24 32 37 62 Ih 37 Italy 310 300 230 400 390 375 393 454 358 Netherlands 116 92 82 115 120 100 90 125 101 Spain 125 85 252 74 160 370 240 158 219 United Kingdom 590 560 401 467 356 275 263 421 352 Others hiG 397 388 371 405 419 438 435 4o4
Total 2,717 2,431 2,097 2,569 2,496 2,368 2,181 2,424 2,342
U.S.S.R.and Eastern Europe 1,051 1,990 2,075 2,303 1,888 1,723 1,367 1,999 1,866
Africa Congo (Leopoldville) 105 110 115 95 65 20 23 11 64 U.A.R. (Egypt) 519 660 760 452 475 250 350 335 457 Mozambique 105 80 150 170 120 150 96 137 Nigeria 30 110 h^ 30 79 40 102 95 59 Sudan 550 370 270 260 340 660 3h6 240 415 Others 223 226 159 177 268 170 279 448 214
Total 1,532 1,556 1,499 1,1a 1,347 1,290 1,396 1,129 1,3^6
Asia and Oceania China (Mainland) 1,000 1,250 1,300 1,200 850 550 600 560 900 Hong Kong 65 60 75 125 145 90 119 leo 111 India 1,025 2,025 1,900 1,340 2,040 1,600 2,050 2,350 1,786 Iran hi 29 44 32 43 55 30 24 41 Japan 585 536 680 1,025 1,132 705 760 767 860 Pakistan 295 400 275 200 240 360 200 200 255 Syria 15 25 45 40 45 70 68 62 54 Turkey : 175 140 125 90 85 85 95 128 96 Others 2^2 223 211 320 294 359 352 383 309 Total i^,2i^9 4,688 ^,655 4,372 4,874 3,874 4,274 4,634 4,412
Afloat 500 500 300 300 300 300 200 400 280
World total 23,700 22,247 21,465 20,283 20,083 19,601 22,819 25,247 20,851
Foreign Free World 9,090 9,747 8,889 8,905 9,781 9,166 9,436 9,895 9,236
Comraunist countries 3/ 2,867 3,263 3,391 3,519 2,77^ 2,304 1,967 2,574 2,791
1/ Preliminary« 2/ 500 poiind gross weight bales, 3/ Data for Comniunist countries for all years include U.S.S.R., Mainland China, eastern European countries, and Cuba,
Öcattpiled from Foreign Agricultural Service data. - 53 -

Tablel?.—Cotton: World exports "by country of origin^ I9UT-61I-^ and averages 193^*^-38 and 1959-^3
Continent \ and •
country |
Year beginning A\2gust 1
19i^T ; 19^*8 ; 1949 ; 1950 ; 1951 ; 1952 : 1953 ; 1954 ; 1955 ; 1956
1,000 1,000 1,000 1,000 1,000 1,000 1,000 1,000 1,000 1,000
hales hales hales hales hales hales haies haies haies haies
2/ i/ 2/ 2/ 2/ 2/ 2/ 2/ 2/ 2/
United States : 2,025 h,96l 6,004 if,280 5,711 3,181 3,914 3,585 2,320 7,917
Mexico : 359 232 655 7i^2 972 9Çe 951 1,253 2,027 1,310
Central America : El Salvador : 10 15 Ik 22 10 k6 42 35 140 96 Guatemala : 0 0 0 0 0 0 13 30 35 30
Nicaragua : 0 3 10 2k 18 69 102 100 239 150
Others : 19 11 Ik 0 7 19 9 12 11 14
Total : 29 29 38 k6 35 134 166 177 425 290
South Aneri^a :
Argentina : 0 28 1^9 21k 5 ^1: 157 104 2 51 -
Brazil 1,01^9 955 598 697 m 145: 1,400 1,036 810 380
Colombia : 0 0 0 0 0 0^ 0 0 0 0
Paraguay : 33 27 if8 55 M M 57 ^5 45 35 Peru : 263 216 26k 321 307 398 361 330 487 390
Others : 0 0 0 2 0 5 k 0 0 0
Total : l,3i^5 1,226 959 1,3^9 708 852^ 1,979 1,515 1,344 85e
Western Europe :
Greece 0 0 0 7 21 26^ 29 68 180 IM Spain 0 0; 0 0 0 0 0 0 0 0 CJthers ... :—- _ — -« --- ----v- "- ~- —- -*— _
Total 0 0 0 7 21 26 29 68 180 148
U.SvS^R. 8^d Eastern Europe 675 600 650 807 ^1 1,200 1,500 1,556 1,455 1,455
Africa 3/
Angola 22 12 27 23 20 31^ 23 31 31 30 East A^ica : 235 336 3T2 333 ^ m 212^ 353 ^384 4i4 381 Congo (Äopoldville) : 200 192. 217 215 m m^ 199 177 209 207 i?,A.Ê. (E^îpt) : 1,5T8 1,692 l,6kO 1,532 : ^8 i,72r 1,485 1,081 1,433 924
Mozffliíbltiue : 130 103: 120 ri2 iiío 3Jrô^ 180 144 130 95 Nigeria : 29 36 60 75 M -W" 137 140 159 114
Sudan : 255 325 325 371 m 26t 413 298 559 333 Western Africa : 3 k 11 5 15 13^ 10 24 33 42 W, Equat.Africa : 127 110 108 120 108 141 122 158 160 207 0-üiers : 2 2 6 15 30 m 26 19 28 ^
Total : 2,581 2,812 2,886 2,801 2,191 3^121: 2,948 2,456 3,156 2,356
Asia
India : 7OÍ+ 25i^ 206 146 123 292 103 207 552 252
Iran 6 16 29 105 35 117 164 204 177 180
Iraq : 10 2 6 31 19 8 3 11 19 12
Pakistan : 875 677 851^ 1,039 903 1,273 893^ 634 723 506
Syria : 1 5 33 106 169 182 183 330 366 374
Turkey 5 129 209 349 261 433 377 233 142 224 Others : 31 kk 23 77 112 188 213 156 245 217 Total : 1,632 1,127 1,360 1,853 1,622 2,493 1,936 1,775 2,224 1,765
World total ': Q,6k6 10,987 12,552 11,885 12,181 11,999 13,423 12,385 13,131 16,097
Foreign Free World i 5,851 5,176 5,598 6,555 ' 5,270 7,568 7,954 7,230 9,235 6,645
Conanunist countries 5/ :* 770 850 950 1,050 1,200 1,250 1,555 1,570 1,576 1,535
See footnotes at end of tahle. Continued-
-5U

Talale 17.--Cotton: World exports by country of origin, 19^7-65, and averages 193^-38 and 1959-63, continued-
Continent ; and \
country ;
Year beginning August 1
1957 ; 1958 : 1959 ! i960 ; 1961 ; 1962 ; 1963 ; 1964 1/; Average 1934-38 Average 1959-63
1,000 1,000 1,000 1,000 1,000 1,000 1,000 1,000 1,000 1,000 bales bales bales bales bales bales bales bales bales bales a IT 2/ 2/ 2/ T i^ IT -^ 2/
United States 5,959 2,895 7,392 6,858 5,056 3,429 5,662 4,060 5,296 5,702 Mexico : iMl 1,809 1,304 1,610 1,482 1,897 1,426 1,616 105 1,544
Central America :
El Salvador : 127 247 112 138 208 292 304 255 0 211 Gxiatemala : i^5 65 55 80 115 PPl 269 283 3 148 Nicaragua : lk6 331 115 139 242 288 402 525 28 237 Others : 25 27 12 13 21 29 36 55 0 22
Total 3i^3 670 294 370 586 830 1,011 1,U8 31 618
South America
Argentina 0 47 31 66 141 216 100 1 133 111 Brazil 215 242 446 695 847 1,145 1,023 i,o4o 1,065 831 Columbia 0 0 30 119 143 115 ^^ 52 0 92 Paraguay 35 35 5 20 29 32 47 41 4i 27 Peru 402 512 417 478 576 590 510 468 337 514 Others 0 0 0 0 0 0 0 6 0 0
Total 652 836 929 1,378 1,736 2,098 1,734 1,608 1,576 1,575
Western Europe
Greece 124 194 153 150 302 238 263 167 0 221 Spain 0 0 0 0 8 100 60 20 0 34 Others p..« ... ... ... ... ... 99 106 ... ...
Total . 124 194 153 150 310 338 422 293 0 255
U.S.S.R. and Eastern Europe ! 1,455 1,605 1,757 1,755 1,608 1,504 1,711 1,811 53 1,666
Africa 3/
Angola : 27 30 35 29 17 28 22 16 ... 26 East Africa ! 451 563 420 428 358 390 520 595 ... 423 Congo (Leopoldville) Î 151 191 238 120 85 28 32 10 133 101 U.A.R. (Egypt) Î 1,256 1,380 1,838 1,582 1,1?1 ^'^} 1,372 ^'^ñ i,7^7 iM^ Mozambique . 160 125 195 210 15^^ 184 123 168 25 172 Nigeria ! Ill 198 147 181 168 l4l 145 120 40 Í5^
: 391 671 588 437 637 787 720 471 258 634 Western Africa : 45 45 49. 60 63 93 95 125 ... 76 W. Equat. Africa ! 169 167 152 151 171 161 216 200 ... 170 Others : 25 33 31 23 31 41 40 67 403 ?^
Total : 2,786 3,403 3,693 3,221 2,805 3,214 3,265 3,330 2,606 3,249
Asia :
India : 227 325 187 224 253 287 231 202 2,746 236 Iran : 198 190 190 245 266 220 326 320 80 249 Iraq : 32 44 19 2 T 9 1 5 8 8 Pakistan : 383 375 333 244 299 683 689 485 ... 449 Syria : 427 357 389 445 474 6l4 608 726 12 506 Turkey : 130 325 409 286 458 568 587 773 84 462 Others : 170 506 423 265 227 209 251 277 274 275 Total : 1,567 2,122 1,950 1,711 1,984 2,590 2,693 2,788 3,204 2,185
World total :14,303 13,53ii- 17,^72 17,053 15,567 15,900 17,9^ 16,624 12,871 16,79^
Foreign Free World i 6,824 8,588 7,978 8,249 8,836 10,962 10,531 10,713 y 9,295
Communist countries 5/ 1 1,520 ••
2,051 2,102 1,946 1,675 1,509 1,751 1,851 y 1,797
If Preliminary, 2/ Bales of 500 pounds gross weight, ^ 3/ Modern names and geographic regions used. 4/Breakdown not available for this period. 5/ Bata for Coraimmist countries for all years include U.S.S.R, Mainland China, eastern European countries, and Cuba.
Compiled from Foreign Agricultural Service data.

Table l8.—Cotton: Average prices of U.S» and Mexican Strict Middling 1 l/lé*^ inch^ c.i.f, Liverpool, England 1/
(U.S. cents per pound) Year beg.
Aug., 1 : Aug. • Sept.; •
Oct. ■ • Nov. * • • Dec. * • •
Jan. ' Feb.
United States 1951 '• 39.88 40.67 42.47 47.^7 49.45 49.14 48.12 1952 : 46.14 45.75 43.34 41.49 39.87 39.45 39.63 1953 39.10 39.04 39.05 39.14 39.16 39.59 40.36 1954 : 39.25 40.69 40.38 39.90 40.55 40.74 40.99 1955 : ■ 40.70 40.05 40.72 41.35 41.97 42.16 42.86 1956 ! : 31.46 31.14 31.85 33.19 33.87 33.32 33.26 1957 : 34.32 34.22 35.00 36.21 36.53 37.05 36.10 1958 : 34.63 33.72 33.97 33.95 33.33 33.22 32.61 1959 : • 28.54 28.64 28.64 29.17 29.88 29.70 29.61
i960 ■ " 29.68 29.89 30.05 29.90 30.24 30.29 30.96 1961 ; 30.23 30.48 30.68 30.73 30.87 31.04 31.25 1962 , 30.04 29.88 29.82 29.71 20.16 30.72 31.30 1963 28.75 28.69 28.68 28.74 28.90 29.11 29.32 1961; • 29.30 29.23 29.30 29.38 29.58 29.66 29.70
Mexican 1951 '. '. 38.85 40.02 42.47 47.35 49.16 47.79 46.11 1952 : ; 44.80 45.20 42.30 40.91 39.15 37.J+O 37.69 1953 : 37.84 37.75 37.73 37.97 38.29 39.01 37.60 195i^ : 38.93 40.51 40.37 39.86 40.39 4o.l6 40.04 1955 : 37.22 35.03 34.66 35.04 34.23 35.34 37.68 1956 : 31.40 31.55 32.06 33.01 33.59 34.18 34.04 1957 : 33.99 33.69 34.05 35.23 36.03 36.08 34.84 1958 : 31.16 30.35 31.16 30.40 20.16 29.01 29.05 1959 : 28.09 28.48 28.70 29.22 29.91 29.38 29.27
i960 ; : 29.64 30.01 30.16 30.20 30.12 30.12 30.12 1961 : 30.50 30.56 30.71 30.15 29.96 29.94 30.09 1962 • 28.93 28.42 28.41 28.78 29.63 29.85 29.70 1963 • 28.68 29.48 29.26 29.19 29.36 29.76 29.72 1964 : 29.19 29.39 29.30 29.09 29.14 29.14 29.35
See footnotes at end of table• continued-
-56 -

Table l8.—Cotton: Average-prices of U.S. and Mexican Strict Middling 1 I/16" inch, c.i.f, Liverpool, England 1/
continued- "" {U>g,^ cents per pound)
Year beg* Aug. 1
' Mar. • » • Apr. ; •
May ; •
Jvine * • • July ;
• Average
United States 1951 ! l^7•i^■3 1^8.3^ l^6.62 47.58 46.61 46.16 1952 : 39.8lf 39.39 39.91 39.44 39.48 41.14 1953 : i^0.30 ii-0.24 40.58 40.00 38.85 39.62 195it . ii-0.73 ko.^k 41.81 42.03 40.59 40.68 1955 : lt2.4l ^0.55 34.80 32.62 31.88 39.34 1956 : 33.86 34.41 34.42 34.08 33.9ÍV 33.23 1957 : 36.H 35.08 35.i^5 35.24 35.10 35.56 1958 : 32M 32.86 33.3!^ 28.27 28.47 32.57 1959 : • 29.63 30.03 30.00 29.78 29.45 29.41
i960 '■ 31.78 31.92 31.09 30.15 30.20 30.51 1961 : 31.11 31.95 31.57 30.08 30.00 30.83 1962 : 31.51 30.34 28.98 28.96 28.91 30.03 1963 : : 29.^'* 29.68 29.66 29.21 29.22 29.12 196k : 29.69 29.77 29.81 29.60 28.85 29.49
Mexican 1951 : 1^3.69 43.32 40.95 41.62 42.71 43.67 1952 ; 37.81^ 37.78 37.52 37-81 38.25 39-72 1953 : 38.91 38.80 38.71 38.22 37.97 38.23 1951^ ; 38.69 38.24 38.68 38.68 37.40 39.33 1955 ; 38.43 37.48 34.11 32.74 31.58 35.3c 1956 3^^.25 33.68 33.26 33.13 33.18 33.11 1957 3U.ll 34.23 34.11 32.94 31.40 34.22 195& : 28.1).3 29.01 29.39 28.43 27.88 29.45 1959 29.35 29.20 29.31 29.72 29.84 29-21
i960 : 30.60 30.52 30.74 30.66 30.60 30.34 1961 ; 30.10 0.93 29.82 29.68 29.43 30.07 1962 : 29.31 29.06 28.98 28.92 28.97 29.08 1963 29.70 29.5^9 29.76 29.89 29.42 29-48 1961^ ; 29.33 29.37 28.82 28.48 28.70 29-11
"Ï7 From August~1952 through December 1955^ prices are c.i.f. Liverpool (D. Windel) and the source is ICAC. Begin- ning with January I956,prices are c»i.f. Liverpool (D. Windel) and the source is FAS, Cotton Division. Monthly prices are averages of weekly quotations. Averages for some months include less than k weekly quotations--averages for some other months include 5 quotations. Foreign Agricultural Service.
- 57 -

Table 19-—U.S. cotton exports: Total exports, Government financed and commercial exports
: Total : U.S.
Grants, gifts, and sales for local currencies Year
Mutual ; Army Public Law U80
Total TI S begin- . • U * M •
ning July 1
: e:q)orts . Security ; Act
.Civilian ' Relief
■ Title ;
: I : Title II
: Barter ; Title ' Government
financed .commercial ' exports
: 1,000 1,000 1,000 1,000 1,000 1,000 1,000 1,000 1,000
• bales bales bales bales bales bales bales bales bales
I9U7 : 1,903 -p — 71 «*—— ,^^_ ^^M 71 1,832 I9I+8 : lv,6n 2,502 133 —— „— — 2,635 2,039 191+9 : 5,726 3,299 111; »». 3,1*13 2,313
, 1950 : 1^,21*6 1,806 Ikk M^.- « 1,950 2,296
vji 1951 : 5,600 791 52 ^^'- — *» _ 81*3 1*,757 00 3^552 ■ 2,982 1,056 33 —— — 1,089 1,893
' 1953 : 3,6U8 836 11 ^_. ^«._ — . 8U7 2,801
1951+ : 3,616 1,218 ._ 58 5 1 1,282 2,331*
1955 : 2,139 683 —— 1^68 27 51 1,229 910 1956 : 7,315 906 —— 1,381 2 970 3,259 1*,056
1957 : 5,666 670 _—_ 890 25 1+65 2,050 3,616 1958 : 3,129 798 __— 618 8 376 1,800 1,329
1959 : 6,636 lH7 —— t09 10 112 l,2li8 5,388
i960 : 7,003 316 _— 1,296 20 101+ 1,736 5,267 1961 : l+,753 59 —__ 1,058 .... 25 53 1,195 3,558 1962 : 3,632 13 ___ a,oUo *.«.« .-.« 185 1,238 2,391* 1963 : 5,lU7 lit —— 860 ___ 165 kk 1,083 U,06!+ 196U : l4,U91 Ik ——- ikk —- — 391 115 1,261* 3,227
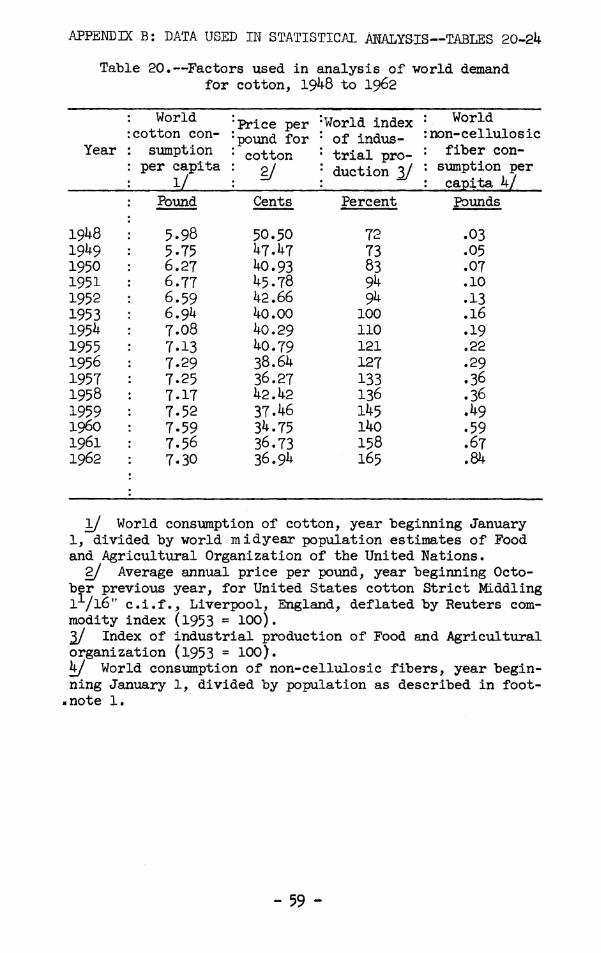
APPENDIX B: DATA USED IK STATISTICAl ÀNALYS-IS—TABLES 20-24
Table 20.—^Factors used in analysis of world demand for cotton, 19^8 to 1962
World 'Price per World index World cotton con- ■pound for of indus- •non-cellulosic
Year : sumption ' cotton trial pro- fiber con- per capita i 2/ , • duction 2/ : sumption per
1/ : capita 4/ Pound Cents Percent Poijnds
19i^8 5.98 50.50 72 .03 19U9 5.75 U7.U7 73 .05 1950 6.27 i^O.93 83 .07 1951 6.T7 U5.78 94 .10 1952 6.59 U2.66 94 .13 1953 6.9k 40.00 100 .16 195^^ 7.08 ifO.29 110 .19 1955 7.13 40.79 121 .22 1956 ; 7.29 38.64 127 .29 1957 : 7.25 36.27 133 .36 1958 : 7.17 42.42 136 .36 1959 7.52 37.46 145 .49 i960 : 7.59 34.75 140 .59 1961 : 7.56 36.73 158 .67 1962 : 7.30 36.94 165 .84
1/ World cons\jmiption of cotton, year beginning January 1, divided by world midyear population estimates of Food and Agricultural Organization of the United Nations.
2/ Average annual price per pound, year beginning Octo- ber previous year, for United States cotton Strict Middling 1/16" c.i.f., Liverpool, England, deflated by Reuters com- modity index (1953 = 100). 2/ Index of industrial production of Food and Agricultxiral organization (1953 = 100). kj World consumption of non-cellulosic fibers, year begin- ning January 1, divided by population as described in foot- -note 1.
- 59 -

Table 21.—Factors used in sunalysis of foreign Eree- World demand for cotton, 19^8-63
:Non-celltilosic : fiber cons\amp-
tion ;per capita hj
Year
Cotton :j^i^^ consmption :p^^¿ f^^ per ^ita :^^^t^^ ^
Income per capita
19*^6 1949
1950 1951 1952 1953 1951^
1955 1956 195T 1958 1959
i960 1961 1962 1963
Po^lnds
5.7*^ 5.71^
5.88 6.32 5.96 6.1fO 6.79
6.67 6.91^ 7.20 6.70 6.82
7.13 7.33 7.03 6.79
Cents
56.3!» 54.tó
52.i»0 57.81 51.20
H.69
tó.31 1^0.2l^ 3U.U2 35.55 29.28
26.00 25.68 23.1*9 22.59
Dollars
239 250
290 29^* 30li- 300 310
321 327 311* 30U 278
288 308 321 299
Povmds
.01
.01
.03
.01*
.05
.08
.11
.16
.21
.28
.30
.1*1*
.61
.89 1.18 1.30
1/ Cotton consumption for 1*3 countries, year beginning Jemviary 1, divided by midyear population estimates for these 1*3 covmtries. 2/ Average annual price per pound, year beginning October previous year, for United States cotton Strict Middling lVl6" c.i.f. Liverpool, England, deflated by Reuter's commodity index (1953 = 100). 2/ National income for 1*3 countries converted to united States dollars, divided by midyear population estimates of these covmtries and deflated by an average cost of living index for these coxmtries. This index was weighted by each country's cotton consumption. 1*/ Non-cellulosic fiber consumption for U3 covmtries, year beginning January 1, divided by mid-year population estimates for these lf3 countries.
- 60 -

Table 22.--Factors used in analysis of foreign Pree-lbrld cotton acreage, 19^8-^3
I 0^
Foreign : Price per Year : ft^e-Wbrld
: cotton acreage l/ : pound for : cotton 2/
! Time ; trend 3/
! Time : t3rend 3/
* Zero-one '. variable 4/
Million acres Cents
19*^8 i 29.1^ 39.22 1 0 0 191^9 : 32.0 40.10 2 0 0 1950 ! 37.0 40.80 3 0 0 1951 : ! 40.9 57.68 4 0 0 1952 : 40.0 46.16 5 0 0 1953 ! 39.8 41.14 6 0 0 195^ ¡ 1^3.5 39.62 7 0 0 1955 ! 47.2 40.68 8 0 0 1956 ! : 45.9 39.34 0 09 1 1957 ! : 46.0 33.23 0 10 1 1958 ! : 46.8 35.56 0 11 1 1959 : 45.0 32.57 0 12 1 i960 ! : 46.0 29.43 0 13 1 1961 : 48.3 30.73 0 14 1 1962 : 48.8 30.83 0 15 1 1963 : 49.7 30.03 0 16 1
1/ Total acres devoted to cotton in foreign Free World • 2/ Price for U.S. cotton S.M. 1 l/l6 inch c.i.f. Liverpool, England, year beginning Aiagust 1,
with a 1 year lead. 3/ Time trend to accoxmt for factors affecting cotton acreage that could not be qiaantified for
inclusion in the analysis. h/ The zero-one variable vas included to account for the change in the trend from 1948-55 to
1956-63.

Table 23* Factors used in analysis of U.S. comaercial cotton exports^ 19U8--63
U.S. commercial1 Price per * Year ' cotton exports po\jnd for * Price 2/
i/ : cotton 2/ ;
Million bales Gents Ratio
191^8 2,Ck lf2.75 100.0 19U9 2.31 39.^^0 100,0 1950 2.30 37.97 100.0 1951 k.76 36.7U 100. U 1952 1.89 3h.63 106.2
1953 2.80 33.02 lOlt.2 195»^ : 2.33 3U.0lf 102. V 1955 : .91 3k.kl 109.8 1956 : If.06 30.59 lOlf.8 1957 : 3.62 31.07 101.2
1958 : 1.33 35.01 107.7 1959 : 5.39 30.28 105.9 i960 : 5.27 29.35 100.7 1961 : 3.61 30i9»f 101.6 1962 : 2.59 30.76 103.8 1963 : k.08 26. Uo 101.1
1/ Total United States cotton exports, year beginning July 1, less those exports financed by thé united States Govemment,
2/ Price of United States cotton S.M. 1^16 inch, c.i.f. Liverpool> England, year beginning January 1, deflated by Reuters commodity index. ^
3/ Ratio of the price of U.S. growi-cotton, S.M. 1 /16 inch, c.i.f. Liverpool, England, year beginnii^ January 1, to the price of Mexican-grown cotton of coBjiparable quality in the same import market.
-62 -

Table 2h*—Population figures and indexes used in computing factors for analysis
ON
1/ Latest midyear population data available through 196^ United Nations Statistical Yearbook.
2/ Latest constjmption data available through April 19^3^ Cotton-World Statistics^ quarterly bulletin of the International Cotton Advisory Ccmnittee.
' Poini].ation 1/ " : World mili ! : Gonsxaaption 2/ ; \ Reuters
A* j j ^ _. „
! CostHof- • • ; Wholesale
Year : World • kS Covuitries * : Cotton
"Non-cellulosic ' ; fibers '
Coramodity Index
¡(1953=100)
!living index !43 countries ! (1958=100)
: Price Index : 43 Countries . Cl958«100)
Billion Billion : Billion Billion pounds pounds Peinent Percent Percent
1948 '. 2.4 1.1 Ik.k 0.1 78.1 67 70 19l^9 2.k 1.2 14.1 0.1 84.9 70 74 1950 : 2.5 1.2 15.6 0.2 , 103.7 71 81 1951 : 2.5 1.2 17.1 0.3 122.5 78 97 1952 : 2.6 1.2 16.9 0.3 110.4 82 92 1953 : 2.6 1.2 18.1 0.4 100.0 84 90 195i^ : 2.7 1.2 18.8 0.5 98.7 84 89 1955 : 2.7 1.3 19.2 0.6 99.9 85 88 1956 ; : 2.7 1.3 20.0 0.8 97.9 90 9k 1957 : 2.9 1.3 20.7 1.0 93.0 94 9& 1958 I • 2.9 1.3 20.9 1.1 83.8 100 100 1959 i : 3-0 l.k 22.4 1.5 84.4 108 108 i960 : ; 3.0 l.k 23.0 1.8 85.3 114 114 1961 : 3.1 l.k 23.2 2.1 83.9 122 120 1962 ! 3.1 l.k 22.9 2.6 83.3 134 131 1963 : 3.2 1.5 "••"• "- — — — ""■• 138 132