analysis of comparative phylogenetic story by using...
TRANSCRIPT

American Journal of Bioscience and Bioengineering 2018; 6(1): 5-12
http://www.sciencepublishinggroup.com/j/bio
doi: 10.11648/j.bio.20180601.12
ISSN: 2328-5885 (Print); ISSN: 2328-5893 (Online)
Analysis of Comparative Phylogenetic Story by Using Autosomal Markers and Mitochondrial Sequences
Ngo Thi Kim Cuc1, Nguyen Thanh Son
2
1Department of Animal Breeding and Genetics, National Institute of Animal Science, Hanoi, Vietnam 2Department of Science and International Cooperation, National Institute of Animal Science, Hanoi, Vietnam
Email address:
To cite this article: Ngo Thi Kim Cuc, Nguyen Thanh Son. Analysis of Comparative Phylogenetic Story by Using Autosomal Markers and Mitochondrial
Sequences. American Journal of Bioscience and Bioengineering. Vol. 6, No. 1, 2018, pp. 5-12. doi: 10.11648/j.bio.20180601.12
Received: November 21, 2017; Accepted: December 4, 2017; Published: January 25, 2018
Abstract: The current study aims at the molecular assessment of genetic diversity within and between Vietnamese local
chicken populations. On average, a total of 32 individuals per Vietnamese local chicken population was randomly sampled.
Nine Vietnamese chickens breeds and 2 The exotic chicken breeds originating from China were used. The DNA polymorphism
was assessed using a set of 29 microsatellite markers recommended by FAO. A fragment of 455 bp from the mtDNA D-loop
region was amplified. The results showed that at the autosomal level, the Vietnamese local chicken breeds from different agro-
ecological zones represent genetically distinct populations. The northern breeds are clearly separated from breed of the South
Central Coast and from breed of the Mekong Delta. The Vietnamese local chicken breeds are highly polymorphic and
originated from eight maternal lineages. These lineages are present across the country. Two chicken breeds of Chinese origin,
Tam Hoang and Luong Phuong, kept in the National Institute of Animal Sciences are genetically distinct from the Vietnamese
local breeds. The Vietnamese chicken breeds are genetically separated from the Chinese chicken gene pool.
Keywords: Vietnamese Chicken Breed, Genetic Diversity, Microsatellite, mtDNA
1. Introduction
Microsatellites and mitochondrial DNA (mtDNA)
sequences have already proved to be useful for assessing
genetic variability, while single nucleotide polymorphisms
(SNPs) are becoming more and more popular due to their
very high density and availability of high throughput
genotyping techniques. Microsatellites are tandem repeats in
the genomic DNA with very short (1-5bp) simple sequence
motifs, and hence they are autosomally inherited. They are
considered to be evenly distributed in the genome [30].
Unlike microsatellite markers, mtDNA is maternally
inherited. The mtDNA is a circular molecule of 16,785 bp in
size [5]. The displacement loop (D-loop) region of the
mtDNA contains elements that control the replication of the
molecule and is highly polymorphic.
A combination of these two markers is a complementary
approach that combines the highly polymorphic
microsatellites whose high mutation rates allow for small-
scale resolution of more recent demographic events with
mtDNA which shed light on phylogeographic events dating
further back in time [11]. An assessment of genetic structure
based on these two markers with different modes of
inheritance provides more insights into the evolutionary
forces shaping genetic diversity.
Eleven Vietnamese local chicken breeds have been
reported [17] but the definition of these breeds is not fully
standardized. It appears unlikely that comprehensive survey
based on large scale phenotypic characterisation can be
achieved considering the wide range of local chicken breeds
and the diversity of local production systems. Therefore, the
assessment of genetic relationships within and between
populations using different molecular markers is a useful
prerequisite for the development of effective conservation
programs. The current study aims at the molecular
assessment of genetic diversity within and between
Vietnamese local chicken populations.
2. Materials and Methods
This work was carried out in 11 villages of four agro

6 Ngo Thi Kim Cuc and Nguyen Thanh Son: Analysis of Comparative Phylogenetic Story by Using
Autosomal Markers and Mitochondrial Sequences
ecological zones located in both the northern and southern
part of Vietnam. In this study, a set of nine Vietnamese local
chicken breeds and two exotic breeds of Chinese origin kept
in Vietnam, were studied.
On average, a total of 32 individuals per Vietnamese
local chicken population was randomly sampled where on
average one male and one female per household were used
(Table 1).
Table 1. Information of blood samples.
Breed Agro-ecological zone Study area No of blood samples
Vietnamese H'Mong Northwest Mai Son, Son La 31
Mia Red River Delta Duong Lam, Son Tay 32
Ri Hoai Duc, Ha Tay 32
Ho Thuan Thanh, Bac Ninh 32
Dong Tao Khoai Chau, Hung Yen 32
Te Ba Vi, Ha Tay NIAS 32
Choi South Central Coast Ninh Hoa, Khanh Hoa 33
Ac Mekong Delta Tan An, Long An 32
Tau Vang 33
Chinese Luong Phuong NIAS 32
Tam Hoang 32
Key: NIAS = National Institute of Animal Sciences.
The exotic chicken breeds originating from China have
been kept as conservation flocks at the National Institute of
Animal Husbandry since 1995 and 2003, respectively. Here,
32 (16 males and 15 -17 females) per each breed were
selected. Altogether, a total of 353 individuals were sampled.
The DNA polymorphism was assessed using a set of 29
microsatellite markers recommended by [13].
2.1. Microsatellite Variability
Observed and expected heterozygosity and inbreeding
coefficients (FIS) for each population were calculated.
STRUCTURE analysis [26] was used to cluster individuals to 2
≤K≤9 assumed clusters with 100 runs for each K value. This K
values are used based on a assumption that each Vietnamese
chicken breed was genetically different from the others.
Comparisons of 100 runs were done by using SIMCOEFF [28].
Solutions with a similarity higher than 95% were considered as
identical. The most frequent solution was visualised using
DISTRUCT [29].
To determine the clustering that best classifies, the ∆K
statistics was applied as [7]. Phylogenetic network analysis was
done by transforming the kinship matrix [6] into a distance
matrix and used as input for the SPLITSTREE software [14].
2.2. Mitochondrial Variability
A fragment of 455 bp from the mtDNA D-loop region was
amplified using primers mtGlu-F (5'-
GGCTTGAAAAGCCATTGTTG-3') and mtGlu-R (5'-
CCCAAAAAGAGAAGGAACC-3'). Due to their circular
nature, these primers are positioned at bases 16739–16775
(forward primer) and 649–668 (reverse primer) of the
complete mtDNA sequence of domestic chickens (X52392,
Desjardins and Morais, 1990). PCR amplifications and
sequencing were done as described by [23]. To align DNA
sequences, Align IR software was used (LICOR Inc.
Nebraska, USA). The list of sequences used in this study and
the cosrresponding Gen Bank accession numbers are
provided in Table 2.
Table 2. Haplotype names and accession numbers of chicken mtDNA sequences used in this study.
Haplotype name Accession number Reference
A1 – A9 GU564361 - GU564369 This study
B1 – B8 GU564370 - GU564377 This study
C GU564378 This study
D1 – D5 GU564379- GU564383 This study
E1 – E9 GU564384- GU564392 This study
F GU564393 This study
G1 – G2 GU564394- GU564395 This study
I1 – I2 GU564396- GU564397 This study
Liu_A1 AB114069 Liu et al. (2006) haplotype A1
Liu_B1 AB007744 Liu et al. (2006) haplotype B1
Liu_C1 AB114070 Liu et al. (2006) haplotype C1
Liu_D1 AY588636 Liu et al. (2006) haplotype D1
Liu_E1 AB114076 Liu et al. (2006) haplotype E1
Liu_F1 AF512285 Liu et al. (2006) haplotype F1
Liu_G1 AF512288 Liu et al. (2006) haplotype G1
Liu_H1 D82904 Liu et al. (2006) haplotype H1
Liu_I1 AB009434 Liu et al. (2006) haplotype I1
Oka_D6 AB268535 Oka et al. (2007) haplotype D6
Oka_G1 AB268545 Oka et al. (2007) haplotype G1
Oka_F1 AB268543 Oka et al. (2007) haplotype F1

American Journal of Bioscience and Bioengineering 2018; 6(1): 5-12 7
The position and number of polymorphic sites as well as
corresponding haplotypes were calculated using MEGA v.
3.1 [16]. The distribution of haplotypes in the samples was
computed using TCS v. 1.21 [4]. Median joining networks of
haplotypes were constructed following the algorithm of [2]
and using NETWORK v. 4.5.1.0 (http://www.fluxus-
engineering.com/sharenet.htm). As reference, network
analysis was used first to create a skeleton which was based
on the most frequent haplotypes of the nine clades of Liu's
network [20] and the three additional clades (D, G and F) of
[25]. This skeleton assigns clades to suggested regions of
domestication in chickens, which were Yunnan and/or
surrounding areas (Liu’s clades A, B, F and G), South and
Southwest China and/or surrounding areas and Southeast
Asia (Liu’s clade C, D, H, I and Oka’s clade D, F, G), and the
Indian subcontinent (Liu’s clade E). Nomenclatures of the
nine clades reported by [20] were used as reference for the
clade notation in this study. The sequences used for
alignment consisted of 455 bp. Various networks were
constructed by using different epsilon (ε) values ranging
from zero to 20. There were no considerable differences
among the different networks except a slight increase in the
network connections where clades joined. The median
network presented used an epsilon value of 5. The haplotype
and nucleotide diversities of breeds were computed using
ARLEQUIN v. 3.1 [8].
To analyse if mtDNA clades also differed at the autosomal
level, the data obtained from genotyping 29 microsatellite
markers was used. These individuals were labelled according
to their clade affiliation based on mtDNA sequences. The
microsatellite genotyping data were used in the Bayesian
model-based clustering as implemented in STRUCTURE
v.2.3.1 to cluster individuals to a varying number of K
clusters (2 ≤ K ≤ 8) [26]. Runs within each K-value showing
a similarity coefficient of 0.95 and higher were considered as
identical.
3. Results and Discussions
3.1. Microsatellite Variability
3.1.1. Genetic Diversity
Expected heterozygosity of Vietnamese local chicken
breeds varied considerably ranging from 0.573 (± 0.035) in
Dong Tao chicken to 0.696 (± 0.021) in Tau Vang chicken
(Table 3).
Table 3. Expected, observed heterozygosity and Fis value for Vietnamese populations.
Breeds Abbreviation n HE ± SD Ho ± SD FIS
H’Mong HM2_VN 31 0.657 ± 0.028 0.633 ± 0.016 0.038
Mia DT_VN 32 0.646 ± 0.033 0.610 ± 0.016 0.058
Ri Ho_VN 32 0.648 ± 0.031 0.606 ± 0.016 0.065
Ho Mia_VN 32 0.618 ± 0.034 0.564 ± 0.016 0.088
Dong Tao Ri_VN 32 0.573 ± 0.035 0.548 ± 0.016 0.046
Te Te_VN 32 0.635 ± 0.029 0.595 ± 0.016 0.065
Choi Choi_VN 33 0.623 ± 0.035 0.645 ± 0.016 -0.027
AC TV_VN 32 0.610 ± 0.033 0.608 ± 0.016 0.003
Tau Vang Ac_VN 33 0.696 ± 0.021 0.563 ± 0.016 0.193
Luong Phuong TH_VN 32 0.680 ± 0.023 0.657 ± 0.017 0.034
Tam Hoang LP_VN 32 0.627 ± 0.023 0.606 ± 0.016 0.033
The observed heterozygosity of the Tau Vang chickens is
much lower than expected one (0.563 ± 0.016) resulting in
high Fis estimate in this population. This result indicates that
a level high of inbreeding occurred in this breed. Similar
observations were made in some other breeds as well (Ho, Te
and Ri), while in Choi chicken an excess of heterozygosity
was found indicating that mating between closely related
chicken has avoided in this breed.
Analysing a wide range of chicken populations originating
from various continents and management systems, [13] found
mean allele numbers and expected heterozygosity estimates
per population varying from 2.30 to 6.72 and 0.28 to 0.67,
respectively, with the Vietnamese H’mong breed being the
most variable one. [3] reported that the mean expected
heterozygosity of Vietnamese chickens in the Ha Giang
province was 0.62, while the corresponding values for Red
Jungle Fowl, Chinese and commercial breeds were 0.60, 0.47
and 0.40, respectively.
Compared to other breeds from other countries,
Vietnamese chickens represent higher expected
heterozygosity [18], [27], [1], [10]. [1] at investigating the
genetic diversity, relationship and population structure of 110
local Swedish chickens showed that expected heterozygosity
ranged from 0.231 to 0.515. [18] researched on South African
chicken and showed that the expected heterozygosity ranged
from 0.510.03 to 0.620. An assessment of genetic diversity of
six Egyptian local chicken strains indicated that expected
heterozygosity varied from 0,417to 0,660 [27].
3.1.2. Genetic Structure and Genetic Difference
Analyzing the rate of change in log likelihood of the
population structure from K = 2 to K= 9 suggested an
optimal clustering at K = 6. This result is in agreement with
the results from the pairwise comparison of runs for
individual values of K using SIMCOEFF. The results of the
STRUCTURE analysis are depicted in Figure 1.

8 Ngo Thi Kim Cuc and Nguyen Thanh Son: Analysis of Comparative Phylogenetic Story by Using
Autosomal Markers and Mitochondrial Sequences
Figure 1. Clustering of Vietnamese chicken populations (Number in parenthesis is the number of identical solution at 95% threshold).
Figure 2. Phylogenetic network of 11 studied populations.
At K = 6 the following pattern is found: There are four
clearly distinct clusters: the two exotic breeds of Chinese
origin form one cluster, and Ac, Choi, and Dong Tao breed
formed individual clusters, respectively. Less clearly distinct
are the clusters formed by the H’mong and the Te breeds. All
other breeds are mixtures of the basic clusters, where the red
river delta breeds (Mia, Ri and Ho) are mixtures of the
H’mong- and Dong Tao-type, while the Tau Vang breed in
American Journal of Bioscience and Bioengineering 2018; 6(1): 5-12 9
the Mekong delta has a strong influence both of local
Vietnamese breeds and of breeds with Chinese origin. This
structure is also reflected in the phylogenetic network (Figure
2), in which the distinct clusters found in the STRUCTURE
analysis also form clearly distinct branches, while the
‘mixed’ populations are positioned close to the central node,
indicating similar distances to the distinct clusters.
3.2. Mitochondrial Variability
3.2.1. Within-Population Diversity
Eight clades (A-G and I) were formed by 37 haplotypes.
Total of haplotypes per breed is shown in Table 4.
Table 4. Polymophic sites, haplotype and nucleotide diversity of chicken breeds under study.
Breed Agro ecological zone Study area n No. of Polymophic sites No. of
Haplotypes
Haplotype
diversity (±SD)
H’mong Northwest Mai Son, Son La 20 23 6 0.778 ± 0.055
Mia
Red River Delta
Duong Lam, Son Tay 20 10 7 0.737 ± 0.094
Ri Hoai Duc, Ha Tay 20 22 12 0.911 ± 0.045
Ho Thuan Thanh, Bac Ninh 20 8 4 0.615 ± 0.105
Dong Tao Khoai Chau, Hung Yen 20 20 7 0.768 ± 0.080
Te Ba Vi, Ha TayNIAS 20 14 5 0.716 ± 0.086
Choi South Central Coast Ninh Hoa, Khanh Hoa 19 15 4 0.754 ± 0.053
Ac Mekong Delta
Tan An, Long An 21 13 5 0.767 ± 0.053
Tau Vang 20 24 13 0.942 ± 0.034
Luong Phuong (imported from China)
NIAS 21 19 8 0.852 ± 0.053
Tam Hoang 21 11 7 0.705 ± 0.095
Total 222 43 37 0.849 ± 0.184
The lowest haplotype diversity (0.62 ± 0.105) was
estimated in the Ho breed, while the highest corresponding
value (0.942 ± 0.034) was observed in the Tau Vang breed.
Although the majority of the Vietnamese chicken breeds in
this study were assigned to clade A and B, the Vietnamese
breeds were found to be highly polymorphic in the mtDNA
D-loop region. Estimates of haplotype diversity ranged from
0.62 to 0.94 in this study and were higher than reported
previously. [23] found the haplotype diversity ranging from
0.61 to 0.73 and from 0.27 to 0.78 in Zimbabwean chickens
and purebred lines, respectively. [21] pointed out three of 12
Chinese breeds with only one haplotype. A recent studies on
4 Chinese native breeds and 7 Tibetan chicken breeds
showed that the haplotype diversity were 0.916 and 0.925,
respectively [12], [33]. The high degree of diversity of the
Vietnamese breeds is in agreement with previous reports
showing high diversity at the autosomal level analysing
microsatellites [13] [3].
To explore the genetic diversity of Chinese indigenous
chicken breeds, a 585 bp fragment of the mitochondrial DNA
(mtDNA) region was sequenced in 102 birds from the
Xichuan black-bone chicken, Yunyang black-bone chicken
and Lushi chicken. In addition, 30 mtDNA D-loop sequences
of Silkie fowls were downloaded from NCBI. The mtDNA
D-loop sequence polymorphism and maternal origin of 4
chicken breeds were analysed in this study. 2. The results
showed that a total of 33 mutation sites and 28 haplotypes
were detected in the 4 chicken breeds. Three clusters were
formed in 4 Chinese native chickens and 12 reference breeds.
Both the Xichuan black-bone chicken and Yunyang black-
bone chicken were grouped into one cluster. Four
haplogroups (A, B, C and E) emerged in the median-joining
network in these breeds. 3. It was concluded that these 4
Chinese chicken breeds had high genetic diversity. The
phylogenetic tree and median network profiles showed that
Chinese native chickens and its neighbouring countries had at
least two maternal origins, one from Yunnan, China and
another from Southeast Asia or its surrounding area.
3.2.2. Breed Distribution Within Clades
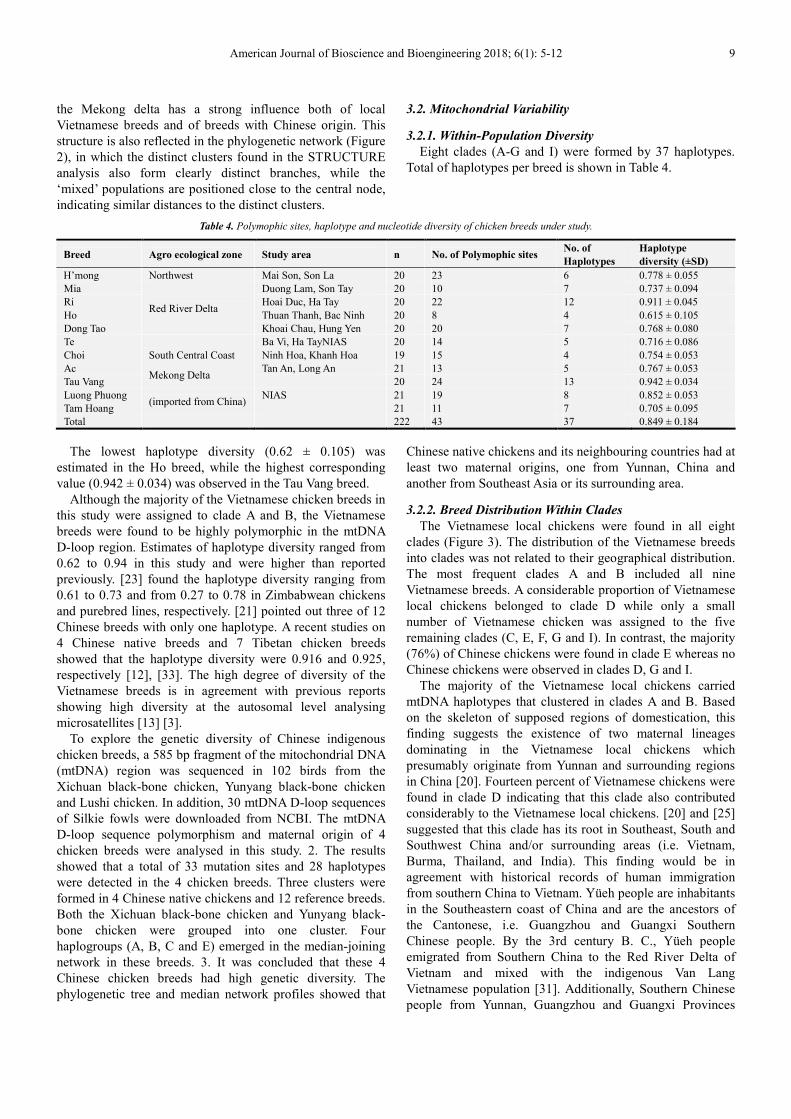
The Vietnamese local chickens were found in all eight
clades (Figure 3). The distribution of the Vietnamese breeds
into clades was not related to their geographical distribution.
The most frequent clades A and B included all nine
Vietnamese breeds. A considerable proportion of Vietnamese
local chickens belonged to clade D while only a small
number of Vietnamese chicken was assigned to the five
remaining clades (C, E, F, G and I). In contrast, the majority
(76%) of Chinese chickens were found in clade E whereas no
Chinese chickens were observed in clades D, G and I.
The majority of the Vietnamese local chickens carried
mtDNA haplotypes that clustered in clades A and B. Based
on the skeleton of supposed regions of domestication, this
finding suggests the existence of two maternal lineages
dominating in the Vietnamese local chickens which
presumably originate from Yunnan and surrounding regions
in China [20]. Fourteen percent of Vietnamese chickens were
found in clade D indicating that this clade also contributed
considerably to the Vietnamese local chickens. [20] and [25]
suggested that this clade has its root in Southeast, South and
Southwest China and/or surrounding areas (i.e. Vietnam,
Burma, Thailand, and India). This finding would be in
agreement with historical records of human immigration
from southern China to Vietnam. Yüeh people are inhabitants
in the Southeastern coast of China and are the ancestors of
the Cantonese, i.e. Guangzhou and Guangxi Southern
Chinese people. By the 3rd century B. C., Yüeh people
emigrated from Southern China to the Red River Delta of
Vietnam and mixed with the indigenous Van Lang
Vietnamese population [31]. Additionally, Southern Chinese
people from Yunnan, Guangzhou and Guangxi Provinces
10 Ngo Thi Kim Cuc and Nguyen Thanh Son: Analysis of Comparative Phylogenetic Story by Using
Autosomal Markers and Mitochondrial Sequences
arrived at the North of Vietnam and moved to the South from
the 17th
to the 19th century A. C. [24]. Descriptions of
immigration always state that people of a family moved
together with their animals which could result in the
introduction of chickens from Southern China into the North
and the South of Vietnam. While Yunnan, South and
Southwest China might be seen as region of origin of the
Vietnamese chicken breeds, the majority of individuals of
Chinese breeds in this study were not assigned to these
maternal lineages. This finding indicates that two Chinese
breeds kept at NIAS do not represent the breeds of Yunnan,
South and Southwest China.
Figure 3. Median network profile of the mtDNA D-loop haplotypes observed in the current study. Data merged with sequences of major haplotypes reported
by [20] and [25]. The circle size corresponds to haplotype frequency, and the numbers on the line correspond to mutational positions connecting haplotypes.
Empty circles are median vectors used in connecting indirectly related haplotypes.
The high proportion of haplotype D1 found in the Choi
chickens is in agreement with findings of [20], who reported that
clade D mainly consisted of game birds. On the other hand, the
clustering of the remaining Choi chickens in clades A and B is
consistent with the study of [25] who found game birds assigned
to their clades B and E. Consequently, our findings suggest that
the game breed Choi is a mixture of multiple maternal lineages.
A small number of Vietnamese chickens distributed in
clades C, F, G and I indicate that these clades have little
contribution to Vietnamese chickens. A small portion (2%) of
Vietnamese local chickens was observed in clade E,
originating from the Indian subcontinent [20], which
otherwise harboured mainly the Chinese chickens studied.
Vietnamese local chickens in this clade included the Ri and
Tau Vang breeds. This observation may indicate a possible
exchange of genetic material between the Ri and Chinese
chickens due to the wide distribution of the Ri chickens,
while the Chinese origin of the Tau Vang breed [19] is known
and explains the distribution of this breed in both Vietnamese
and Chinese clades. This finding is also in agreement with
the analysis at the autosomal level in which the Tau Vang
breed showed clear admixture between the Chinese and
Vietnamese gene pools.
3.3. Relationship Between mtDNA and Autosomal Genetic
Structure
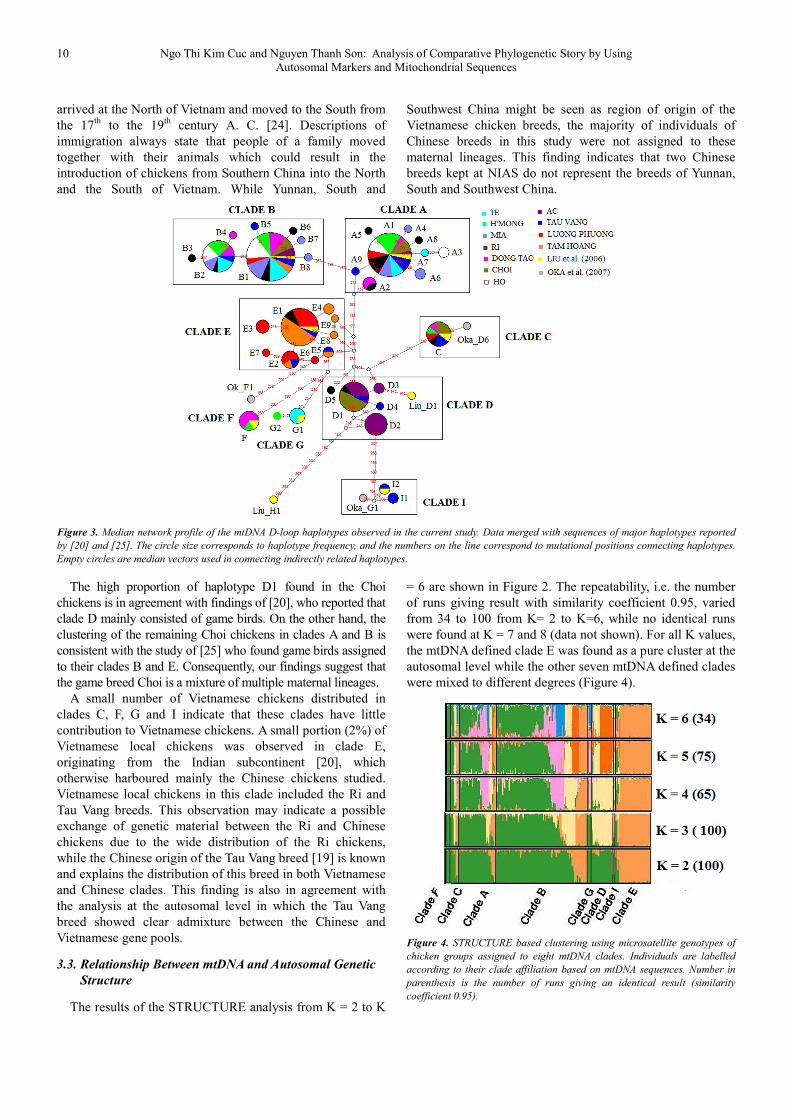
The results of the STRUCTURE analysis from K = 2 to K
= 6 are shown in Figure 2. The repeatability, i.e. the number
of runs giving result with similarity coefficient 0.95, varied
from 34 to 100 from K= 2 to K=6, while no identical runs
were found at K = 7 and 8 (data not shown). For all K values,
the mtDNA defined clade E was found as a pure cluster at the
autosomal level while the other seven mtDNA defined clades
were mixed to different degrees (Figure 4).
Figure 4. STRUCTURE based clustering using microsatellite genotypes of
chicken groups assigned to eight mtDNA clades. Individuals are labelled
according to their clade affiliation based on mtDNA sequences. Number in
parenthesis is the number of runs giving an identical result (similarity
coefficient 0.95).

American Journal of Bioscience and Bioengineering 2018; 6(1): 5-12 11
Comparing results of phylogenetic relationship using
mtDNA polymorphism and autosomal microsatellites it
becomes obvious, that the Chinese breeds cluster together
and are separated from the Vietnamese local breeds using
both genetic marker systems, indicating a clear genetic
differentiation between them and the Vietnamese breeds.
Although [32] assumed that the Chinese chickens from NIAS
have introgressed into local Vietnamese chickens, our results
do not support this hypothesis, except for the Ri and Tau
Vang chickens. In contrast to microsatellite analyses, which
found that clustering of Vietnamese local breeds using
microsatellites has a relationship to their geographical
distribution, no sub-structuring was found between the
Vietnamese local breeds at the mtDNA level.
In microsatellite analyses, clustering of Vietnamese local
breeds using microsatellites has a relationship to their
geographical distribution but there is no sub-structuring
found between the Vietnamese local breeds at the mtDNA
level. The different results obtained in both types of markers
could be due to the different mode of inheritance.
Microsatellites are highly polymorphic markers with their
locus specificity, abundance and random distribution over the
genome, co-dominant inheritance [34]. Unlike microsatellite
markers, mtDNA is maternally inherited. MtDNA is used to
infer regions of domestication and to identify the number of
maternal lineages and their geographic origins [9]. Unlike
autosomal genetic markers, mtDNA transferred from mother
to offspring is not rearranged due to recombination and less
affected by gene drift [15]. In addition, mtDNA has a lower
mutation rate than microsatellite as argued by [11].
4. Conclusion
At the autosomal level, the Vietnamese local chicken
breeds from different agro-ecological zones represent
genetically distinct populations. The northern breeds are
clearly separated from breed of the South Central Coast and
from breed of the Mekong Delta. The Vietnamese local
chicken breeds are highly polymorphic and originated from
eight maternal lineages. These lineages are present across the
country. Two chicken breeds of Chinese origin, Tam Hoang
and Luong Phuong, kept in the National Institute of Animal
Sciences are genetically distinct from the Vietnamese local
breeds. The Vietnamese chicken breeds are genetically
separated from the Chinese chicken gene pool.
In contrast to microsatellite analyses, which found that
clustering of Vietnamese local breeds using microsatellites
has a relationship to their geographical distribution, no sub-
structuring was found between the Vietnamese local breeds at
the mtDNA level.
Acknowledgements
I would like to greatly acknowledge: Prof. Dr. Henner
Simianer, Institute of Animal Breeding and Genetics, Georg-
August-Universität Göttingen, Germany for offering me the
opportunity to work on this interesting topic and providing me
fruitful ideas to develop the whole study. Dr. Steffen Weigend,
Friedrich Loeffler Institute, Institute of Farm Animal Genetics,
Germany for welcoming me to his laboratory and for valuable
discussion. He always brought the best solutions in difficult
situations during my time in the laboratory. Ms. Annet
Weigend and Ms. Anke Flörke for their technical assistance
with the laboratory works in Germany.
References
[1] Abebe, A. S., Mikko S. and Johansson A. M. (2015). Genetic diversity of five local Swedish chicken breeds detected by microsatellite markers. PloS One. 10:e0120580–e0120580. doi:10.1371/journal.pone.0120580.
[2] Bandelt H. J., Forster P., Sykes B. C. and Richards M. B (1995) Mitochondrial portraits of human populations using median networks. Genetics 141: 743-753.
[3] Berthouly C., Leroy G., Van T. N., Thanh H. H., Bed'Hom B., Nguyen B. T., Vu C. C., Monicat F., Tixier-Boichard M., Verrier E., Maillard J. and Rognon X. (2009) Genetic analysis of local Vietnamese chickens provides evidence of gene flow from wild to domestic populations. BMC Genetics: 10: 1.
[4] Clement M., Posada D. and Crandall K. A. (2000) tcs: a computer program to estimate gene genealogies. Molecular Ecology 9: 1657-1659.
[5] Desjardins P. and Morais R. (1990) Sequence and gene organization of the chicken mitochondrial genome. A novel gene order in higher vertebrates. J Mol Biol 212: 599-634.
[6] Eding H. and Meuwissen T. H. E. (2003) Linear methods to estimate kinships from genetic marker data for the construction of core sets in genetic conservation schemes. Journal of Animal Breeding and Genetics 120: 289–302.
[7] Evanno G., Regnaut, S. and J. Goudet. (2005) Detecting the number of clusters of individuals using the software STRUCTURE: a simulation study: Molecular Ecology 14: 2611-2620.
[8] Excoffier L., Laval G. and Schneider S. (2006) arlequin Version 3.01: An Integrated Software Package for Population Genetics Data Analysis.
[9] FAO (2007) Global Plan of Action for Animal Genetic Resources and the Interlaken Declaration. Rome. http://www.fao.org/ ag/againfo/ programmes/en/ genetics/documents/ Interlaken/GPA_en.pdf). Accessed on 22/08/2009.
[10] Fathi, M. M., I. Al-Homidan, M. I. Motawei, O. K. Abou-Emera, and Zarei, M. F. El-, 2017. Evaluation of genetic diversity of Saudi native chicken populations using microsatellite markers. Poult. Sci. 96: 530–536.
[11] Feulner, P. G. D., Bielfeldt, W., Zachos, F. E., Bradvarovic, J., Eckert, I. and Hartl, G. B. (2004) Mitochondrial DNA and microsatellite analyses of the genetic status of the presumed subspecies Cervus elaphus montanus (Carpathian red deer). Heredity 93: 299-306.
[12] Guo HW, Li C, Wang XN, Li ZJ, Sun GR, Li GX, Liu XJ, Kang XT and Han RL. 2017. Genetic diversity of mtDNA D-loop sequences in four native Chinese chicken breeds. Br Poult Sci. 2017 58: 490-497.

12 Ngo Thi Kim Cuc and Nguyen Thanh Son: Analysis of Comparative Phylogenetic Story by Using
Autosomal Markers and Mitochondrial Sequences
[13] Granevitze Z., Hillel J., Chen G. H., Cuc N. T. K., Feldman M., Eding H. and Weigend S. (2007) Genetic diversity within chicken populations from different continents and management histories. Animal Genetics 38: 576-583.
[14] Huson, D. H., and Bryant, D. (2006) Application of Phylogenetic Networks in Evolutionary Studies. Molecular Biology and Evolution 23 (2): 254-267.
[15] Johnson J. A., Toepfer J. F. and Dunn P. O. (2003) Contrasting patterns of mitochondrial and microsatellite population structure fragmented populations of greater prairie-chickens. Mol. Ecol. 12: 3335-3347.
[16] Kumar S., Tamura K. and Nei M. (2004) mega3: integrated software for molecular evolutionary genetics analysis and sequence alignment. Briefings in Bioinformatics 5: 150-163.
[17] MARD (Vietnam Ministry of Agriculture and Rural Development) (2004) Atlas of domestic animal breeds in Vietnam. Agricultural publishing house, Hanoi, Vietnam.
[18] Mtileni, B. J., F. C. Muchadeyi, A. Maiwashe, E. Groeneveld, L. F. Groeneveld, K. Dzama, and Weigend S. (2011) Genetic diversity and conservation of South African indigenous chicken populations: South African chicken genetic resources. J. Anim. Breed. Genet. 128: 209–218. doi:10.1111/j.1439-0388.2010.00891.
[19] Linh V. T. (2008) The world of rare chickens in Vietnam. Vietbao Newspaper (issued on February 11st), Vietnam.
[20] Liu Y. P., Wu G. S., Yao Y. G., Miao Y. W., Luikart G., Baig M., Beja-Pereira A., Ding Z. L., Palanichamy M. G. and Zhang Y. P. (2006) Multiple maternal origins of chickens: out of the Asian jungles. Molecular Phylogenetics and Evolution 38: 112-119.
[21] Liu Z. G., Lei C. Z., Luo J., Ding C., Chen G. H., Chang H., Wang K. H., Liu X. X., Zhang X. Y., Xiao X. J. and Wu S. L. (2004) Genetic variability of mtDNA sequences in Chinese native chicken breeds. Asian-Australasian Journal of Animal Sciences 17: 903-907.
[22] Lyimo, C. M., A. Weigend, P. L. Msoffe, H. Eding, H. Simianer, and Weigend S. (2014) Global diversity and genetic contributions of chicken populations from African, Asian and European regions. Anim. Genet. 45: 836–848.
[23] Muchadeyi F. C., Eding H., Simianer H., Wollny C. B. A., Groeneveld E. and Weigend S. (2008) Mitochondrial DNA D-loop sequences suggest a Southeast Asian and Indian origin of Zimbabwean village chickens. Animal Genetics 39: 615-622.
[24] Nyiri P. and Saveliev I. (2002) Globalizing Chinese Migration: Trends in Europe and Asia Research in Migration and Ethnic Relations Series. Ashgate Publisher, Aldershot, United Kingdom.
[25] Oka T., Ino Y., Nomura K., Kawashima S., Kuwayama T., Hanada H., Amano T., Takada M., Takahata N., Hayashi Y. and Akishinonomiya F. (2007) Analysis of mtDNA sequences shows Japanese native chickens have multiple origins. Animal Genetics 38: 287-293.
[26] Pritchard J. K., Stephens M. and Donnerly P. (2000) Inference of population structure using multicocus genotype data. Genetics 155: 945-959.
[27] Ramadan S. Kayang B. Inoue E. Nirasawa K. Hayakawa H. Ito S. Inoue-Murayama M. (2012). Evaluation of genetic diversity and conservation priorities for Egyptian chickens Open J. Anim. Sci. 2183 190.
[28] Rosenberg N. A., Pritchard, J. K., Weber, J. L., Cann, H. M. Kidd, K. K. Zhivotovsky, L. A. and Feldman, M. W. (2002) Genetic structure of human populations: Science 298: 2381-2385.
[29] Rosenberg. N. A. (2004) Distruct: a program for the graphical display of population structure. Molecular Ecology Notes 4: 137–138.
[30] Tautz D. (1989) Hypervariability of simple sequences as a general source for polymorphic DNA markers. Nucleic Acids Research 17: 6463-6471.
[31] Taylor K. W. (1983) The birth of Vietnam. Unverstity of California press, London, United Kingdom.
[32] Tieu H. V., Ly L. V., Sat L. V. and Su V. V. (2008) Vietnamese livestock genetic resources conservation & exploitation from 1990 to 2007. Vietnamese Journal of Animal Science and Technology, special volume: 1-10.
[33] Zhang L., Zhang, P., Li, Q., Gaur, U., Liu, Y., Zhu, Q., Zhao, X., Wang, Y., Yin, H., Hu, Y., Liu, A. and Li., D. (2017). Genetic evidence from mitochondrial DNA corroborates the origin of Tibetan chickens. https://doi.org/10.1371/journal.pone.0172945.
[34] Weigend S. and Romanov M. N. (2001) Current strategies for the assessment and evaluation of genetic diversity in chicken resources. World’s Poultry Science Journal 57: 257-288.