analysis and synthesis of lithuanian phoneme dynamic …old.mii.lt/files/mii_dis_2013_pyz.pdf ·...
TRANSCRIPT

i
VILNIUS UNIVERSITY
Gražina Pyž
ANALYSIS AND SYNTHESIS OF LITHUANIAN PHONEME
DYNAMIC SOUND MODELS
Doctoral Dissertation
Technological Sciences, Informatics Engineering (07T)
Vilnius, 2013

Doctoral dissertation was prepared at the Institute of Mathematics and
Informatics of Vilnius University in 2009–2013.
Scientific Supervisor
Assoc. Prof. Dr. Vytautas SLIVINSKAS (Lithuanian University of Educational
Sciences, Technological Sciences, Informatics Engineering – 07 T).
Academic Consultant
Assoc. Prof. Dr. Virginija ŠIMONYTĖ (Lithuanian University of Educational
Sciences, Technological Sciences, Informatics Engineering – 07 T).

VILNIAUS UNIVERSITETAS
Gražina Pyž
LIETUVIŠKŲ FONEMŲ DINAMINIŲ MODELIŲ
ANALIZĖ IR SINTEZĖ
Daktaro disertacija
Technologijos mokslai, informatikos inžinerija (07T)
Vilnius, 2013

Disertacija rengta 2009–2013 metais Vilniaus universiteto Matematikos ir
informatikos institute.
Mokslinis vadovas
doc. dr. Vytautas SLIVINSKAS (Lietuvos edukologijos universitetas,
technologijos mokslai, informatikos inžinerija – 07 T).
Mokslinė konsultantė
doc. dr. Virginija ŠIMONYTĖ (Lietuvos edukologijos universitetas, technologijos
mokslai, informatikos inžinerija – 07 T).
v
v
Acknowledgments
I would like to express my thanks to all the people who have been in one
way or another involved in the preparation of this thesis.
First of all, I would like to express my sincere gratitude to my scientific
supervisor Prof. Vitautas Slivinskas and academic consultant Dr. Virginija
Šimonytė for the continuous support of my research, for their patience,
motivation, enthusiasm, and immense knowledge. I could not have imagined
having better mentors for my doctoral study.
I want to express my big thanks to Vilnius University Institute of
Mathematics and Informatics director Prof. Gintautas Dzemyda for granted
conditions for doctoral studies. Special thanks to my thesis reviewers
Prof. Kazys Kazlauskas and Dr. Gintautas Tamulevičius who read and
provided constructive feedback regarding this dissertation. I would also like to
thank the Lithuanian State Studies Foundation and Lithuanian Academy of
Sciences for the financial support for doctoral studies.
Finally, I wish to thank all my relatives, friends and most of all for my
husband Viktor for all their support and patience during this challenging
period of my life.
Gražina Pyž


vii
vii
Abstract
Speech is the most natural way of human communication. Text-to-speech
(TTS) problem arises in various applications: services for the hearing impaired,
reading email aloud, reading text from e-book aloud, services for the people
with speech disorders. A TTS system – a system that takes a sequence of
words as input and converts it into speech.
In order to solve the problem of Lithuanian speech synthesis, it is
necessary to develop mathematical models for Lithuanian speech sounds. In
the dissertation proposed vowel and semivowel phoneme modelling framework
is a part of this problem.
An assumption is made that a phoneme consists of the sum of components
which could be generated by properly chosen formant synthesizer parameters.
The second order quasipolynomial is chosen as the component model in time
domain. Multiple input and single output systems (MISO), whose inputs are
sequences of amplitude modulated impulses, are used for sound modelling.
The frequencies, damping factors, amplitudes and phases are parameters of
these systems. The synthesizing consists of the following two stages:
1) phonemic synthesizer parameter estimation from the characteristic period
data, 2) determination of the exciting input impulse periods and amplitudes.
In order to estimate the synthesizer parameters, the real sound signals that
are expanded into components by the inverse fast Fourier transform method are
used. The new parameter estimation algorithm for convoluted data, based on
Levenberg-Marquardt approach, has been derived and its stepwise form
presented.
In order to obtain more natural sounding of the synthesized speech, it is
important to use not only high-order models, but complex input sequence
scenarios as well. The input sequence of each phoneme has been described by
three parabolas. The first parabola characterized the slowdown growth of the

viii
component, the second parabola described the main time region, and the third
one characterized the slowdown decreasing of the component. Transition from
one vowel to another vowel was achieved by changing excitation impulse
amplitudes by the arctangent law.
The synthesized sounds have been audio tested, and the Fourier transforms
of the real data and output of the MISO model have been compared. It was
impossible to distinguish between the real and simulated data. The magnitude
and phase responses have only shown small differences. The practical results
have shown that the synthesized sounds of this method are sufficiently natural,
pleasantly sounding.
ix
List of Figures
FIG. 1 THE TENDENCIES OF THE VOWEL PHONEME FUNDAMENTAL FREQUENCY CHANGING ....................................... 20
FIG. 2 THE TENDENCIES OF THE SEMIVOWEL PHONEME FUNDAMENTAL FREQUENCY CHANGING ................................ 21
FIG. 3 THE PERIODIC CHARACTER OF PHONEMES: A) THE PLOT OF THE VOWEL /A/, B) THE PLOT OF THE SEMIVOWEL /M/ 26
FIG. 4 THE MAGNITUDE RESPONSE OF A VOWEL AND ITS PARTITION INTO SUBBANDS .............................................. 27
FIG. 5 A BLOCK DIAGRAM OF THE FUNDAMENTAL FREQUENCY REFINING ALGORITHM .............................................. 29
FIG. 6 THE FIRST THREE HARMONICS OF THE PHONEME /A:˜/ ( ) ............................................ 30
FIG. 7 THE PLOTS OF THE SPECTRUM OF THE PHONEME /A:˜/ ........................................................................... 32
FIG. 8 THE FIRST THREE FORMANT COMPONENTS OF THE PHONEME /A:˜/ ........................................................... 32
FIG. 9 A MISO SYSTEM FOR VOWEL AND SEMIVOWEL PHONEMES MODELLING ..................................................... 33
FIG. 10 SELECTING OF THE VOWEL PHONEME PITCH WITH THE HIGHEST AMPLITUDE ............................................... 47
FIG. 11 SELECTING OF THE START AND END POINTS OF THE REPRESENTATIVE PITCH ................................................ 49
FIG. 12 A SISO SYSTEM WITH THE UNIT IMPULSE INPUTS................................................................................. 49
FIG. 13 A PART OF THE PHONEME /A/ SIGNAL DIVIDED INTO PERIODS ................................................................. 50
FIG. 14 THE INPUTS OF THE FIRST THREE CHANNELS OF A MISO SYSTEM ............................................................. 51
FIG. 15 THE TOTAL INPUT CURVE ............................................................................................................... 52
FIG. 16 SPECTRUM ESTIMATES FOR A LITHUANIAN FEMALE VOWEL /U/ FOR 80 SPEECH SIGNAL REALISATIONS.............. 56
FIG. 17 THE TRUE AND ESTIMATED SPEECH SIGNAL OF THE VOWEL /U/ (SOLID LINE – THE TRUE SPEECH SIGNAL, DOTTED
LINE – THE ESTIMATED SIGNAL (DFT METHOD), DASH-DOTTED LINE – THE ESTIMATED SIGNAL (MUSIC METHOD)) ................................................................................................................................................ 58
FIG. 18 THE SPECTRA OF THE TRUE PHONEME /A/ SIGNAL AND ITS MODELS.......................................................... 59
FIG. 19 THE AVERAGE RMSE FOR THE ESTIMATED SIGNAL SPECTRUM (FORMANT METHOD CASE): THE UPPER PLOT –
VOWEL PHONEMES, THE LOWER PLOT - SEMIVOWEL PHONEMES .............................................................. 61
FIG. 20 THE AVERAGE RMSE FOR THE ESTIMATED SIGNAL SPECTRUM (HARMONIC METHOD CASE): THE UPPER PLOT –
VOWEL PHONEMES, THE LOWER PLOT - SEMIVOWEL PHONEMES .............................................................. 61

x
FIG. 21 THE SAMPLES OF A DISCRETIZED VERSION OF THE DIPHTHONG “AI” OF THE LITHUANIAN WORD “L MĖ”........... 64
FIG. 22 THE PITCH CORRESPONDING A) TO THE VOWEL /A/ AND B) TO THE VOWEL /I/ ............................................ 65
FIG. 23 THE MAGNITUDE RESPONSE OF THE VOWELS “A” AND “I” ..................................................................... 65
FIG. 24 THE DATA AND ESTIMATED MODEL FOR THE 3-RD FORMANT INTERVAL ..................................................... 67
FIG. 25 THE VOWEL /A/ AND /I/ FORMANTS WITH FREQUENCIES FROM THE BANDWIDTH OF 30-1000 HZ (THE UPPER PLOT
– FORMANTS OF THE VOWEL /A/, THE LOWER PLOT - FORMANTS OF THE VOWEL /I/).................................... 69
FIG. 26 THE VOWEL /A/ AND /I/ FORMANTS WITH FREQUENCIES FROM THE BANDWIDTH OF 1001-2000 HZ (THE UPPER
PLOT – FORMANTS OF THE VOWEL /A/, THE LOWER PLOT - FORMANTS OF THE VOWEL /I/) ............................ 69
FIG. 27 THE TRUE AND ESTIMATED SIGNAL FOR THE 3-RD FORMANT INTERVAL ..................................................... 70
FIG. 28 THE INPUT IMPULSE AMPLITUDES (THE LEFT FIGURE – FOR THE VOWEL /A/, THE RIGHT FIGURE – FOR THE VOWEL
/I/) ........................................................................................................................................... 70
FIG. 29 THE VALUES OF THE ARCCOTANGENT FUNCTION ARCCOT(X) AND THOSE OF THE ARCTANGENT FUNCTION
USED TO DECREASE/INCREASE THE INPUT IMPULSE AMPLITUDES FOR THE VOWELS /A/ AND /I/ ................................................................................................................................................ 71
FIG. 30 INPUT AMPLITUDE DYNAMICS ......................................................................................................... 71
FIG. 31 THE FOURIER TRANSFORM OF THE OUTPUT PROCESS OF THE SYNTHESYZER “AI”: A) THE OUTPUT SIGNAL ; B) THE
MAGNITUDE RESPONSE IN THE RANGE 1-1200 HZ; C) THE MAGNITUDE RESPONSE IN THE RANGE 1200-2400 HZ
................................................................................................................................................ 72
FIG. 32 THE RECORDED LITHUANIAN WORD "L MĖ" ...................................................................................... 73
FIG. 33 THE SYNTHESIZER SCHEME OF THE WORD "L MĖ" ............................................................................... 74
FIG. 34 THE RECORDED UTTERED SEMIVOWEL /L/ .......................................................................................... 75
FIG. 35 THE MAGNITUDE RESPONSE OF THE SELECTED PITCH OF THE SEMIVOWEL /L/ (THE FREQUENCY BANDS: A) 0-922
HZ, B) 923-1950 HZ, C) 1951-2850 HZ) ........................................................................................ 75
FIG. 36 THE SIGNALS OF THE SELECTED PITCH CORRESPONDING TO THE FREQUENCY BANDS 1-6 ................................ 76
FIG. 37 THE TRUE AND ESTIMATED SIGNAL PITCHES ........................................................................................ 77
FIG. 38 THE SUMS OF FORMANTS OF THE ESTIMATED IMPULSE RESPONSES FOR EACH PHONEME ............................... 78
FIG. 39 THE TRAJECTORIES OF THE FUNDAMENTAL FREQUENCY OF THE WORD "L MĖ" AND ITS CASES ....................... 79
FIG. 40 THE TRAJECTORIES OF THE FUNDAMENTAL FREQUENCY OF THE WORD "L MĖ" SYNTHESIZER ......................... 80
FIG. 41 EXTRACTION OF THE 4TH FORMANT OF THE PHONEME /A/: A) THE WORD "L MĖ" AND THE 4TH FORMANT (DARK
PART), B) THE 4-TH FORMANT IN ENLARGED TIME SCALE ........................................................................ 81
FIG. 42 FILTERING RESULTS OF THE WORD "L MĖ" IN THE FREQUENCY BANDS CORRESPONDING TO THE PHONEME /A/
FORMANTS ................................................................................................................................. 81
FIG. 43 THE INPUT VALUES OF THE PHONEME /Ė/ .......................................................................................... 82
FIG. 44 THE TRENDS OF THE INPUT VALUES OF THE 1-4 FORMANT OF THE PHONEME /Ė/ ........................................ 82
FIG. 45 THE INPUTS OF THE WORD "L MĖ" SYNTHESIZER ................................................................................ 83
FIG. 46 THE WORD "L MĖ": A) TRUE, B) SYNTHESIZED ................................................................................... 83
FIG. 47 THE MAGNITUDE RESPONSE OF THE TRUE (THE UPPER PLOT) AND SYNTHESIZED (THE LOWER PLOT) WORD "L MĖ" ................................................................................................................................................ 84

xi
List of Tables
TABLE 1 THE VALUES OF THE FUNDAMENTAL FREQUENCIES OF UNSTRESSED AND STRESSED VOWEL PHONEMES (FEMALE
SPEAKER) ................................................................................................................................... 19
TABLE 2 THE VALUES OF THE FUNDAMENTAL FREQUENCIES OF UNSTRESSED AND STRESSED SEMIVOWEL PHONEMES (FEMALE
SPEAKER) ................................................................................................................................... 21
TABLE 3 THE COMPOUND DIPHTHONGS AND CORRESPONDING PHONEME COMBINATIONS ....................................... 22
TABLE 4 THE GLIDING DIPHTHONGS AND CORRESPONDING PHONEMES ................................................................ 23
TABLE 5 LITHUANIAN DIPHTHONGS MET IN INTERNATIONAL WORDS ONLY AND THE CORRESPONDING PHONEME
COMBINATIONS............................................................................................................................ 23
TABLE 6 THE FREQUENCY BAND PARTITION INTO SUBBANDS ............................................................................. 27
TABLE 7 THE MEAN AND STANDARD DEVIATION OF THE FUNDAMENTAL FREQUENCY ESTIMATES OBTAINED BY THE MUSIC
METHOD AND DFT METHOD ........................................................................................................... 56
TABLE 8 THE RELATIVE APPROXIMATION ERROR OF THE VOWEL SIGNALS BY THE SUM OF TEN HARMONICS USING THE
FUNDAMENTAL FREQUENCY ESTIMATES OBTAINED BY THE MUSIC METHOD AND DFT METHOD...................... 57
TABLE 9 THE AVERAGE RMSE AND ITS CONFIDENCE INTERVALS FOR THE ESTIMATED VOWEL PHONEME SIGNAL SPECTRUM
................................................................................................................................................ 59
TABLE 10 THE AVERAGE RMSE AND ITS CONFIDENCE INTERVALS FOR THE ESTIMATED SEMIVOWEL PHONEME SIGNAL
SPECTRUM .................................................................................................................................. 60
TABLE 11 THE AVERAGE TIME OF THE VOWEL PHONEME PARAMETERS ESTIMATION AND THE VOWEL PHONEME SYNTHESIS
(TIME MEASURED IN SECOND) ......................................................................................................... 62
TABLE 12 THE AVERAGE TIME OF THE SEMIVOWEL PHONEME PARAMETERS ESTIMATION AND THE SEMIVOWEL PHONEME
SYNTHESIS (TIME MEASURED IN MINUTES) .......................................................................................... 63
TABLE 13 FORMANT INTERVALS FOR THE VOWELS /A/ AND /I/.......................................................................... 66
TABLE 14 FORMANT PARAMETERS OF THE VOWELS /A/ ................................................................................... 67

xii
TABLE 15 FORMANT PARAMETERS OF THE VOWELS /I/ .................................................................................... 68
TABLE 16 THE SELECTED FREQUENCY BANDS OF THE SEMIVOWEL /L/ .................................................................. 76
TABLE 17 THE FORMANT PARAMETERS FOR THE SEMIVOWEL /L/ ....................................................................... 77
TABLE 18 THE FORMANT PARAMETER ESTIMATION ERROR ............................................................................... 77
TABLE 19 THE PARABOLA PARAMETERS OF THE 1-4 FORMANTS OF THE PHONEME /Ė/ ............................................ 82

xiii
Notations
Symbols
The phoneme signal
The fundamental frequency
The sampling frequency
R The covariance matrix
The eigenvalue of the covariance matrix
The MUSIC spectral function
The impulse response of the k-th SISO system
The input of the k-th SISO system
The output of the k-th SISO system
The quasipolynomial
The frequency
The angular frequency
The phase
The amplitude of continuous -time signal
The amplitude of a discrete-time signal
The damping factor of continuous -time signal
The damping factor of a discrete-time signal

xiv
The convoluted basis signal matrix
The standard basis signal matrix
The parameter vector
The period
Abbreviations and Acronyms
DFT Discrete Fourier transform
IPA International Phonetic Alphabet
LPC Linear Predictive Coding
MISO Multiple-Input and Single-Output
MUSIC MUltiple SIgnal Classification
RMSE Root-Mean-Square Error
SISO Single-Input and Single-Output
TTS Text-to-Speech
xv
Contents
1. INTRODUCTION .................................................................................................... 1
1.1. Research Context and Challenges ...................................................................... 1
1.2. Problem Statement ............................................................................................. 2
1.3. Object of Research ............................................................................................. 2
1.4. The Objective and Tasks of the Research .......................................................... 3
1.5. Methodology of Research .................................................................................. 3
1.6. Scientific Novelty .............................................................................................. 4
1.7. Practical Significance of the Results .................................................................. 4
1.8. Defended Propositions ....................................................................................... 4
1.9. Approbation and Publications of the Research .................................................. 5
1.10. Outline of the Dissertation ............................................................................... 7
2. FUNDAMENTALS OF SPEECH SYNTHESIS ..................................................... 9
2.1. Speech engineering in Lithuania ........................................................................ 9
2.2. Speech synthesis types ..................................................................................... 12
2.3. The signal fundamental frequency ................................................................... 14
2.4. Diphone an phone concepts ............................................................................. 17
2.5. Lithuanian speech sounds ................................................................................ 18
2.5.1. Lithuanian vowel sounds ........................................................................... 18
2.5.2. Lithuanian semivowel sounds ................................................................... 20
xvi
2.5.3. Lithuanian diphthong sounds .................................................................... 22
2.6. Conclusions of Section 2.................................................................................. 24
3. PHONEME MODELLING FRAMEWORK ......................................................... 25
3.1. Vowel and semivowel phoneme signals decomposition into harmonics ......... 25
3.2. Vowel and semivowel phoneme signals decomposition into formants ........... 31
3.3. The vowel and semivowel phoneme model ..................................................... 32
3.4. Parameter estimation of the model ................................................................... 40
3.5. The vowel and semivowel phoneme model in a state space form ................... 46
3.6. Selection of the phoneme representative period .............................................. 47
3.7. Determining of the inputs ................................................................................ 49
3.8. Conclusions of Section 3.................................................................................. 52
4. EXPERIMENTAL RESEARCH ............................................................................ 55
4.1. Fundamental frequency estimation using the MUSIC method ........................ 55
4.2. Vowels and semivowels modelling by formant and harmonic methods ......... 58
4.3. Diphthong modelling ....................................................................................... 64
4.4. Joining of vowel and semivowel models ......................................................... 72
4.5. Conclusions of Section 4.................................................................................. 84
5. CONCLUSIONS .................................................................................................... 87
REFERENCES ........................................................................................................... 91
LIST OF PUBLICATIONS ........................................................................................ 97
APPENDICES ............................................................................................................ 99
Appendix A. The Lithuanian phoneme list along with the examples ..................... 99
Appendix B. The vowel phoneme signals ............................................................ 102
Appendix C. The semivowel phoneme signals ..................................................... 107
1
1
1
1. Introduction
1.1. Research Context and Challenges
A Text-to-speech (TTS) system is defined as a system that takes a sequence of
words as input and converts it into speech (SIL, 2004). The speech synthesizer
can be useful in many cases. TSS system can read aloud any texts from web
pages, navigation, translation and other applications. It helps with
pronunciation and learning foreign languages, promoting listening skills. The
speech synthesizer allows multi-tasking so that attention can be given to
reading materials when time would otherwise not permit. It helps people with
reading challenges, or visual impairment.
Construction of speech synthesizer is a very complex task. Researchers are
trying to automate speech synthesis. Yet there is no automatic Lithuanian TTS
system equivalent to human speech. The commercial TTS systems have not yet
supported Lithuanian language. The problem of developing Lithuanian
synthesizer arises. There exists a Lithuanian synthesizer developed by
P. Kasparaitis (P. Kasparaitis, 2001). It is based on concatenation speech

1. Introduction
2
synthesis type. Concatenation synthesis relies on speech sounds recorded in
advanced database. One of the main drawbacks of concatenation synthesis is
that the database has to be sufficiently large. That, however, requires extensive
computer resources. If a word is not in the database, then it could not be
synthesized. The synthesized speech quality does not achieve the natural
speech quality since glitches occur on the concatenation boundaries. Formant
synthesis does not require a sound database. Formant synthesizers have
advantages against the concatenative ones. The speech produced by them can
be sufficiently intelligible even at high speed. They can control prosody
aspects of the synthesized speech (intonation, rhythm, stress). The main
drawback of formant synthesis is that the sounds obtained by this synthesis
type sound unnaturally, robot-like. In this work an assumption is made that the
models of formant synthesizer are too simple. In order to reduce synthetic
sounding, it is necessary to develop new mathematical models for speech
sounds. The vowel and semivowel phoneme models are a part of this problem.
1.2. Problem Statement
The sounds obtained by formant synthesis type sound unnaturally, robot-like.
In order to reduce synthetic sounding, it is necessary to develop new
mathematical models for speech sounds, which could be used as a base of
speech synthesizer.
1.3. Object of Research
The research object of the dissertation is Lithuanian vowel and semivowel
phoneme models.
1. Introduction
3
1.4. The Objective and Tasks of the Research
The objective of the thesis is to develop Lithuanian speech vowel and
semivowel phoneme dynamic models, and create transition between phonemes
in order to join these models.
In order to achieve the objective, the following tasks are stated:
• to acquaint with speech production apparatus, main speech synthesis
methods and the existing text-to-speech systems of Lithuanian and
other languages.
• to analyse main characteristics of Lithuanian speech vowel and
semivowel sounds.
• to ascertain what models are suited best for Lithuanian speech sound
description.
• to develop mathematical models of Lithuanian speech vowel and
semivowel phonemes.
• to create transitions between phonemes in order to join vowel and
semivowel models.
• to evaluate the proposed models accuracy experimentally.
1.5. Methodology of Research
• Digital signal processing,
• System theory,
• Optimization methods,
• Matrix algebra,
• Mathematical statistics,
• Programming in Matlab environment,
• Programming in C# language.
1. Introduction
4
1.6. Scientific Novelty
• For vowel and semivowel phonemes modelling MISO system whose
impulse response of each channel is described as a third order
quasipolynomial and input amplitude impulse vary in time is proposed.
• A new parameter estimation algorithm for convoluted data, based on
Levenberg-Marquardt approach, has been derived.
• A new fundamental frequency refining algorithm is proposed.
• A new method that allows one to select the representative period
automatically is given.
• The transitions between vowel and semivowel phoneme models have
been derived.
The advantage of my developed phoneme modelling framework is that anyone
can use it and it can synthesize any phoneme of vowel and semivowel for any
speaker.
1.7. Practical Significance of the Results
The proposed vowel and semivowel phoneme models can be used for
developing a TTS formant synthesizer. The phoneme models can also be
adapted to other similar problems, for example, treating language disorders,
helping with pronunciation and learning of foreign languages.
1.8. Defended Propositions
1) For vowel and semivowel phoneme modelling a discrete time linear
stationary system with multiple-input and single-output (MISO) is used.

1. Introduction
5
Impulse response of each MISO system channel is described as a third
order quasipolynomial.
2) In order to obtain more natural sounding of the synthesized speech, it is
important to use not only high-order models, but complex input
sequence scenarios as well.
3) The vowel and semivowel synthesis quality is sufficiently good.
4) The word consisting of vowels and semivowels obtained with the
proposed synthesis methods is enough and it is difficult to distinguish it
from the real one. The quality of the synthesized sound was
significantly improved due to input transitions.
1.9. Approbation and Publications of the Research
The main results of the dissertation were published in 6 articles in the
periodical scientific publications. The main results of the work have been
presented and discussed at 21 national and international conferences.
International conferences
1. The 5th International Conference Mechatronic Systems and Materials,
October 22 - 25, 2009, Vilnius, Lithuania.
2. International Conference of Young Scientists, April 29-30, 2010,
Šiauliai, Lithuania.
3. The 6th International Conference on Electrical and Control
Technologies ECT-2011, May 5-6, 2011, Kaunas, Lithuania.
4. The 2nd International Doctoral Consortium Informatics and
Informatics Engineering Education Research: Methodologies,
Methods, and Practice, November 30-December 4, 2011,
Druskininkai, Lithuania.

1. Introduction
6
5. The 7th International Conference on Electrical and Control
Technologies ECT-2012, May 3-4, 2012, Kaunas, Lithuania.
6. The 8th Joint European Summer School on Technology Enhanced
Learning, May 21-25, 2012, Estoril, Portugal.
7. The 13th International conference Teaching Mathematics:
Retrospective and Perspectives, 30 May – 1 June, 2012, Tartu,
Estonia.
8. The 16th International Conference ELECTRONICS'2012 18-20 June,
2012, Palanga, Lithuania.
9. The 2nd International Conference Music and Technologies, 8-10
November, 2012, Kaunas, Lithuania.
10. The 3rd International Doctoral Consortium Informatics and
Informatics Engineering Education Research: Methodologies,
Methods, and Practice, December 3-7, 2012, Druskininkai, Lithuania.
11. The 8th International Conference on Electrical and Control
Technologies ECT-2013, May 2-3, 2013, Kaunas, Lithuania.
12. The 14th International conference Teaching Mathematics:
Retrospective and Perspectives, May 9–11, 2013, Jelgava, Latvia.
Regional conferences
1. Lietuvos matematikų draugijos 50-oji konferencija, Vilnius: MII,
2009 m. birželio 18–19 d.
2. 1-oji jaunųjų mokslininkų konferencija „Fizinių ir technologijos
mokslų tarpdalykiniai tyrimai“, Vilnius: LMA, 2011 m. vasario 8 d.
3. Lietuvos matematikų draugijos 52-oji konferencija, Vilnius: LKA,
2011 m. birželio 16-17 d.

1. Introduction
7
4. 15-oji mokslinė kompiuterininkų konferencija „Kompiuterininkų
dienos 2011“, Klaipėda: KU, 2011 m. rugsėjo 22–24 d.
5. 2-oji jaunųjų mokslininkų konferencija Fizinių ir technologijos
mokslų tarpdalykiniai tyrimai, Vilnius: LMA, 2012 m. vasario 14 d.
6. Lietuvos matematikų draugijos 53-oji konferencija, Klaipėda: KU,
2012 m. birželio 11-12 d.
7. 3-oji jaunųjų mokslininkų konferencija Fizinių ir technologijos
mokslų tarpdalykiniai tyrimai, Vilnius: LMA, 2013 m. vasario 12 d.
8. Lietuvos matematikų draugijos 54-oji konferencija, Vilnius: LEU,
2013 m. birželio 19-20 d.
9. 16-oji mokslinė kompiuterininkų konferencija „Kompiuterininkų
dienos 2011“, Šiauliai: ŠU, 2013 m. rugsėjo 19–21 d.
1.10. Outline of the Dissertation
The dissertation consists of 5 chapters, references and appendices. The total
scope of the dissertation without appendices – 114 pages containing 78
formulas, 47 pictures and 19 tables.
The Introduction (Chapter 1) reveals research context and challenges,
describes the problem statement, the object of research, the tasks and objective
of the dissertation, methodology of research, presents scientific novelty,
practical significance of results, defends propositions and approbation of
obtained results.
In Chapter 2 an overview of Lithuanian speech engineering is given.
Detailed information about Lithuanian speech phonemes and diphthongs is
presented.
In Chapter 3 Lithuanian vowel and semivowel phoneme modelling
framework is submitted. Within this framework two synthesis methods are

1. Introduction
8
proposed: harmonic and formant.
Chapter 4 provides the results of experimental researches.
Conclusions (Chapter 5) present the main conclusions of the dissertation.
Appendices present a list of Lithuanian phonemes with the examples of
their usage, the plots of the vowel and semivowel phoneme signals.

9
9
2
2. Fundamentals of speech synthesis
This chapter provides an overview of Lithuanian speech engineering. Speech
synthesis is one of its parts. Two speech synthesis types are presented. Their
advantages and disadvantages are listed. The MUSIC method for the
estimation of the signal fundamental frequency is submitted. An overview of
Lithuanian speech phonemes and diphthongs is given. The differences between
the fundamental frequency values of unstressed and stressed vowel and
semivowel phonemes have been revealed.
2.1. Speech engineering in Lithuania
Speech engineering is a popular field of engineering in Lithuania. Much effort
is given by Lithuanian scientists and engineers for developing digital
technologies of Lithuanian speech processing. An overview of speech
engineering in Lithuania at the end of the twentieth century is given in
(Lipeikienė and Lipeika, 1998). The dominating field of Lithuanian speech

2. FUNDAMENTALS OF SPEECH SYNTHESIS
10
engineering is speech recognition. Speech recognition is a process that
converts spoken words and phrases to a computer-readable format. Speech
recognition is mostly developed for the languages of big countries especially
for English language. There exists a number of programs (Dragon Naturally
Speaking, Speech Recognition in Windows 7, Dragon Dictate for iPhone/iPad,
etc.) that are intended for the use with English language. The languages of
small countries cannot boast of such a great attention, nevertheless the local
researchers give much effort to developing recognizers of the local languages.
Lithuanian speech recognition is one of the Lithuanian speech processing
problems taking considerable attention of Lithuanian researchers. Research
groups work in Vilnius at the Institute of Mathematics and Informatics and the
Faculty of Mathematics and Informatics of Vilnius University, in Kaunas at
Vytautas Magnus University, Kaunas University of Technology and Vilnius
University Kaunas Faculty of Humanities. Some of the problems analysed by
researchers of the Institute of Mathematics and Informatics are as follows:
development of isolated word speech recognition system (Lipeika et al., 2002),
application of dynamic programming for word endpoint detection in isolated
word recognition (Lipeika and Lipeikienė, 2003), creating a framework for
choosing a set of syllables and phonemes for Lithuanian speech recognition
(Laurinčiukaitė and Lipeika, 2007), using the formant features in the dynamic
time warping based recognition of isolated Words (Lipeika and Lipeikienė,
2008; Lipeika, 2010), quality estimation of speech recognition features
(Lileikytė and Telksnys, 2011; Lileikytė and Telksnys, 2012), speaker
recognition by voice (Kamarauskas, 2009), development of isolated word
recognition systems (Tamulevičius, 2008). Scientists from Vilnius University
the Faculty of Mathematics and Informatics and Forensic Science Centre of
Lithuania investigate speaker recognition problems (Bastys et al., 2010),
evaluation of effectiveness of different methods in speaker recognition (Šalna
and Kamarauskas, 2010), Lithuanian speech recognition using the English

2. FUNDAMENTALS OF SPEECH SYNTHESIS
11
recognizer (Kasparaitis, 2008). Researchers from Vilnius Gediminas Technical
University deal with control of robots by voice (Navakauskas and Paulikas,
2006), development of biometric systems for person recognition (Ivanovas and
Navakauskas, 2010), development and implementation of means for word
duration signal processing (Ivanovas, 2012; Tamulevičius et al., 2010).
Scientists from Vytautas Magnus University deal with building medium-
vocabulary isolated-word Lithuanian HMM speech recognition system
(Raškinis and Raškinienė, 2003), modelling phone duration of Lithuanian by
classification and regression trees (Norkevičius and Raškinis, 2008),
investigating hidden Markov model modifications for large vocabulary
continuous speech recognition (Šilingas and Telksnys, 2004), analysis of
factors influencing accuracy of speech recognition (Čeidaitė and Telksnys,
2010). Researchers at Kaunas University of Technology and Vilnius University
Kaunas Faculty of Humanities investigate foreign languages models for
Lithuanian speech recognition (Maskeliūnas et al., 2009), the improvement of
voice command recognition accuracy (Maskeliūnas, et al., 2011), deal with
implementation of hierarchical phoneme classification approach on LTDIGITS
corpora (Driaunys et al., 2009), consider control of computer and electric
devices by voice (Rudžionis et al., 2008).
Lithuanian speech synthesis is a part of Lithuanian speech digital
processing area that attracts considerable attention. Significant results in
Lithuanian speech synthesis have been achieved by P. Kasparaitis in
collaboration with experts of Lithuanian language (The MBROLA Project). The
synthesizer developed by him is based on concatenation synthesis method.
This method exploits Lithuanian speech corpora developed in advance.
T. Anbinderis investigates one of the constituent parts of speech synthesis –
automatic stressing of a text (Anbinderis, 2010). What concerns Lithuanian
speech, formant synthesis has not yet attracted much attention of researchers.
Problems related to developing Lithuanian speech formant synthesizers are

2. FUNDAMENTALS OF SPEECH SYNTHESIS
12
considered in (Ringys and Slivinskas, 2009; Ringys and Slivinskas, 2010).
Speech animation problems also attract attention of Lithuanian researchers.
One of such problems is Lithuanian phoneme visualization. A methodology of
such visualization is proposed in (Mažonavičiūtė and Baušys, 2011).
Speech analysis is another large class of speech processing problems. The
paper (Balbonas and Daunys, 2007) can be mentioned as an example of such
analysis. Some researchers try to use Wienerclasssystems for speech signal
prediction (Ivanovas and Navakauskas, 2011).
Other fields (some of them are closely related with speech recognition) of
Lithuanian language and speech engineering are noisy speech intelligibility
enhancement (Kazlauskas, 1999), intelligent extraction of an internal signal in
a Wiener System (Kazlauskas and Pupeikis, 2013), transcribing of the
Lithuanian text (Kasparaitis, 1999; Skripkauskas and Telksnys, 2006),
automatic stressing of the Lithuanian text (Kasparaitis, 2000; Anbinderis,
2010), coding and transmission of voice signals (Kajackas and Anskaitis,
2009), the Lithuanian language machine translation (Šveikauskienė, 2005).
2.2. Speech synthesis types
Researchers have been showing interest in speech synthesis for a long time
(see, e. g., (Hopcroft and Ullman, 1979; Holmes and Holmes, 2001; Slivinskas
and Šimonytė, 2007)). The best known commercial TTS systems are Bell Labs
TTS and Festival developed at University of Edinburgh. The construction of a
model for segmental duration in German is considered in the paper (Mobius
and van Santen,1996). This model has been implemented in the German
version of the Bell Labs text-to-speech system. The goal of the paper (Mobius
and Von Santen,1996) was to analyse and model durational patterns of natural
speech in order to achieve an improved naturalness of synthetic speech.
Although many results have been achieved, this field still remains important.

2. FUNDAMENTALS OF SPEECH SYNTHESIS
13
There exist two main speech signal synthesis types: concatenative
synthesis and formant synthesis (Donovan, 1996; Frolov А. and Frolov G.,
2003). Synthesized speech sounds are created using concatenation of pieces of
recorded speech stored in a database in concatenative synthesis. Formant
synthesizers do not use any recorded sounds. A speech signal is modelled as an
output of a linear filter and is described by a mathematical model with a finite
number of parameters.
Both speech synthesis types attract the attention of researchers.
Concatenative synthesis of Lithuanian speech was studied in the P. Kasparaitis
papers (Kasparaitis, 1999; Kasparaitis, 2000; Kasparaitis, 2005). Methods of
quality improvement in concatenative speech synthesis for the Polish language
were considered in (Janicki, 2004). Formant Lithuanian vowel models have
been developed in (Ringys and Slivinskas, 2009; Ringys and Slivinskas, 2010).
A method for formant parameter extraction from a labelled single speaker
database for use in a synthesis system is examined in (Mannell, 1998). A
formant synthesis using rule-based and data-driven methods is presented in
(R. Carlson et al., 2002).
The main concatenation synthesis problem is the size of the memory for
storing the vocabulary. The synthesized speech quality does not achieve the
natural speech quality since glitches occur on the concatenation boundaries.
Many synthesizers that use formant synthesis produce artificial speech that
sound robot-like. Formant synthesizers, however, have advantages against the
concatenative ones. The speech produced by a formant synthesizer can be
sufficiently intelligible even at high speed. High speed speech synthesizing is
necessary for screen reading programs. Additional advantages of formant
synthesizers against the concatenative ones are the following: formant
synthesizers require less computer memory than concatenative ones as they
need no speech unit database. Formant synthesizers can control prosody
aspects of the synthesized speech (intonation, rhythm, stress).

2. FUNDAMENTALS OF SPEECH SYNTHESIS
14
The most known Lithuanian speech synthesizer is based on concatenative
synthesis (Balbonas, 2009). The practical implementation can be seen in
(Garsiai.lt).
2.3. The signal fundamental frequency
Estimation of a fundamental frequency is very important in many fields of
speech signal processing such as speech coding, speech synthesis, speech and
speaker recognition (Cheveigné and Kawahara, 2002; Milivojevic et al., 2006).
The speech signal fundamental frequency is an essential feature of human
voice (Hess, 1983). The fundamental frequency is denoted by . What we hear
as a single sound when someone is speaking (for example, pronouncing /a/) is
really the fundamental frequency plus a series of harmonics. The fundamental
frequency is determined by the number of times the vocal folds vibrate in one
second, and measured in cycles per second [cps], or Hertz [Hz]. The harmonics
are multiples of the fundamental frequency. Thus if the fundamental frequency
is 100 Hz, the harmonics are 200 Hz, 300 Hz, 400 Hz, etc. The fundamental
frequency is also called the first harmonic. We normally don't hear the
harmonics as separate tones, they, however, exist in the sound and add a lot of
richness to the sound. Often the sinusoid of the frequency 0kffk is itself
called the k-th harmonic of the signal.
In order to get good quality of a synthesised sound, one needs to estimate
this frequency as accurately as possible. The discrete Fourier transform (DFT)
method is usually used to estimate this frequency. This method gives good
results when the observed signal is sufficiently long. For shorter signals,
performance of this method is not satisfactory. Thus alternative methods have
to be used. One of such algorithms is the so-called MUSIC method. This
method is used widely in the mobile communications field. In (Murakami and
Ishida, 2001), T. Murakami and Y. Ishida applied the MUSIC method for the

2. FUNDAMENTALS OF SPEECH SYNTHESIS
15
analysis of speech signals. They used this method for the fundamental
frequency estimation of Japanese female and male vowels /a/, /e/, /i/, /o/, /u/,
and illustrated that their method based on the MUSIC method is superior to the
conventional cepstral method for estimating the fundamental frequency.
MUSIC method
Consider the following model:
),,1(,)exp(1
Nnenjwcyp
l
nlln
(1)
where Ccl , ne is white noise. Let be some integer greater than .
Define:
T
Mt
Ttjw
p
tjwT
Mtt
eet
ecectyyt p
],,[)(
,],,[)(,],,[)(
11
111
e
xy (2)
where 1,,1 MNt . Define also:
)].(,),([)(
,],,[,][)(
1
1
p
T
p
T1)wj(Mjw
wawa
wwe,,e1,w
A
θa (3)
We can now write (1) as
)()()()( ttt exAy )1,,2,1( MNKt (4)
The MUSIC method (Schmidt, 1986; Stoica and Moses, 1997; Therrien,
1992) was developed in 1979 by American scientist R. Schmidt. The acronym
MUSIC stands for MUltiple SIgnal Classification. This method deals with
estimation of parameters of (4) model.
The covariance matrix of the vector is given by

2. FUNDAMENTALS OF SPEECH SYNTHESIS
16
(Stoica and Nehorai, 1989)
MM
H
IPAAR2)()( (5)
where 2 is as in 2 MM , and .
Denote by the eigenvalues of the matrix . Since rank
pH )(APA (Stoica and Nehorai, 1989), then
. (6)
Let psss ,,, 21 be the unit-norm eigenvectors corresponding to the first
largest eigenvalues , and pMggg ,,, 21 - the unit-norm
eigenvectors corresponding to the last M-p smallest eigenvalues
. Denote by an matrix whose columns are the vectors
psss ,,, 21 , and by an matrix whose columns are the vectors
pMggg ,,, 21 , i. e.
],,[],,,[ 11 pMp ggss GS . (7)
It is shown in (Stoica and Nehorai, 1989) that the true parameter values
},,{ 1 pww are the only solutions of the following equation:
0)()( ww HHaGGa .
In practice, we use an estimate
M
t
H ttM
R1
)()(1ˆ yy (8)
of the true covariance matrix . Denote by pMp ggss ˆ,,ˆ,ˆ,,ˆ 11 the unit-
norm eigenvectors of arranged in the descending order of the corresponding
2. FUNDAMENTALS OF SPEECH SYNTHESIS
17
eigenvalues, and by and - the matrices made of }ˆ,,ˆ{ 1 pss and
}ˆ,,ˆ{ 1 pMgg . Define the MUSIC spectral function as follows:
)(ˆˆ)(
1)(ˆ
jwHjwH
jw
MUee
eaGGa
P . (9)
The estimates of },,{ 1 pww are obtained by maximizing )(ˆ jw
MU eP . This
procedure is done by evaluating it at the points of a fine grid.
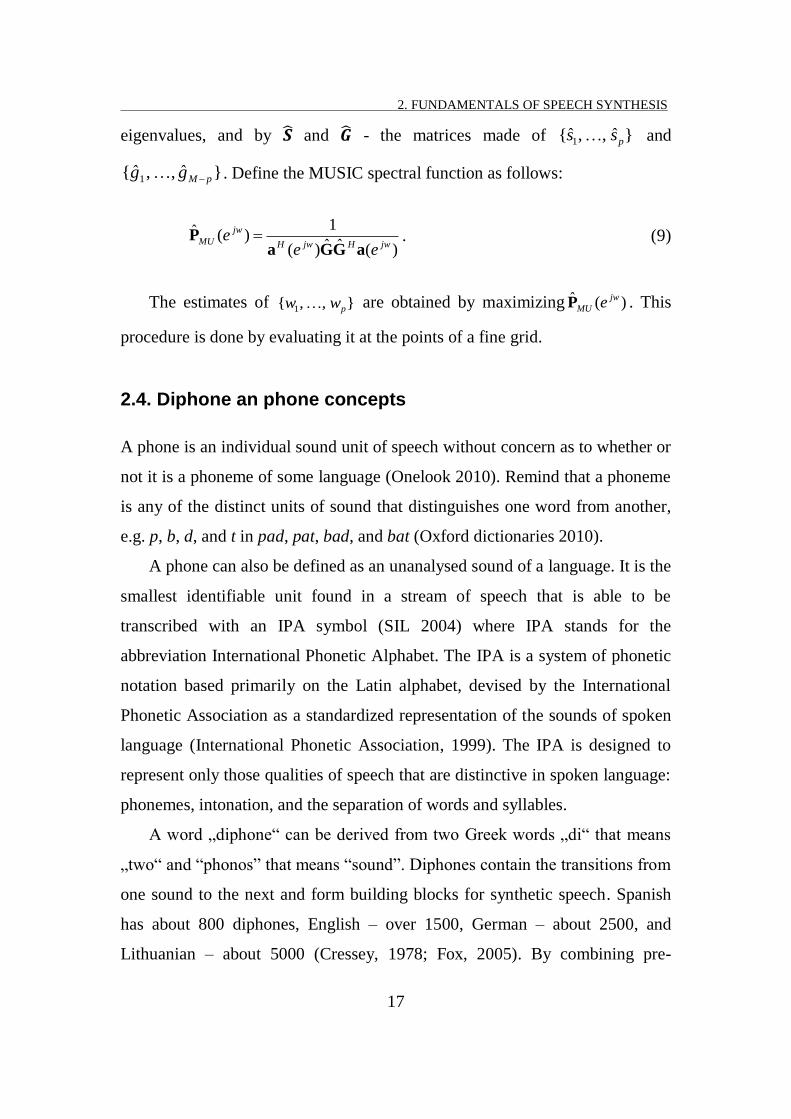
2.4. Diphone an phone concepts
A phone is an individual sound unit of speech without concern as to whether or
not it is a phoneme of some language (Onelook 2010). Remind that a phoneme
is any of the distinct units of sound that distinguishes one word from another,
e.g. p, b, d, and t in pad, pat, bad, and bat (Oxford dictionaries 2010).
A phone can also be defined as an unanalysed sound of a language. It is the
smallest identifiable unit found in a stream of speech that is able to be
transcribed with an IPA symbol (SIL 2004) where IPA stands for the
abbreviation International Phonetic Alphabet. The IPA is a system of phonetic
notation based primarily on the Latin alphabet, devised by the International
Phonetic Association as a standardized representation of the sounds of spoken
language (International Phonetic Association, 1999). The IPA is designed to
represent only those qualities of speech that are distinctive in spoken language:
phonemes, intonation, and the separation of words and syllables.
A word „diphone“ can be derived from two Greek words „di“ that means
„two“ and “phonos” that means “sound”. Diphones contain the transitions from
one sound to the next and form building blocks for synthetic speech. Spanish
has about 800 diphones, English – over 1500, German – about 2500, and
Lithuanian – about 5000 (Cressey, 1978; Fox, 2005). By combining pre-
2. FUNDAMENTALS OF SPEECH SYNTHESIS
18
recorded diphones, we can create much more natural synthesized speech
sounds than by combining just simple phones, because the pronunciation of
each phone varies depending on the surrounding phones.
2.5. Lithuanian speech sounds
Lithuanian language phonemes (sounds) were studied in (Girdenis, 1995). In
this work, A. Girdenis listed 58 phonemes. All these phonemes are unstressed.
In order to take stress into account, this list was appended by 29 stressed
phonemes (Kasparaitis, 2005). A study of Lithuanian compound diphthongs
suggested including 4 additional phonemes (Kasparaitis, 2005). All the
phonemes mentioned above along with a pause make a list of 92 units.
P. Kasparaitis has developed a system of coding of Lithuanian phonemes. The
Lithuanian phoneme list along with the examples is presented in Table 1 of the
Appendix A.
2.5.1. Lithuanian vowel sounds
Table 1 of the Appendix A shows that Lithuanian language has twenty eight
pure vowel phonemes. Five of them are marked with a letter ''a'', five - with a
letter ''e'', three - with a letter ''ė'', five - with a letter ''i'', five - with a letter ''o'',
and five - with a letter ''u''. The plots of the vowel phoneme signals are
presented in Fig. 1 – 6 of the Appendix B. These plots show that the periods of
the stressed vowels are longer than those of the unstressed vowels, i. e. the
fundamental frequencies – that are the period reciprocals – of the stressed
vowels are lower than those of the unstressed ones. The fundamental frequency
values of all unstressed and stressed vowels using 50 utterances by female have
been measured. The averages values of the fundamental frequencies and their
confidence intervals are shown in Table 1. The confidence intervals are stated
at the 95 % confidence level.

2. FUNDAMENTALS OF SPEECH SYNTHESIS
19
Table 1 The values of the fundamental frequencies of unstressed and stressed vowel
phonemes (female speaker)
No Phoneme Example Frequency [Hz] Confidence intervals
1 /a/ mam 'mother' 236 [234.5, 237.4]
2 /a`/ lazd 'stick' 152 [150.5, 153.4]
3 /a:/ drąs 'courage' 200 [198.3, 201.7] 4 /a:´/ k rdas 'sword' 169 [167.0, 171.0]
5 /a:˜/ čiū 'thank you' 162 [160.1, 163.8]
6 /e/ med lis 'medal' 238 [236.3, 239.7]
7 /e`/ sug sti 'turn bad' 156 [154.5, 157.5]
8 /e:/ gręžin s 'well' 270 [268.6, 271.4]
9 /e:´/ rkė 'mite' 177 [175.7, 178.3]
10 /e:˜/ gyv nimas 'life' 171 [169.8, 172.2]
11 /ė:/ kėdė 'chair' 240 [238.7, 241.3]
12 /ė:´/ upė takis 'trout' 175 [173.8, 176.2]
13 /ė:˜/ gėlė 'flower' 162 [160.9, 163.1]
14 /i/ lig 'disease' 219 [217.7, 220.3]
15 /i`/ k škis 'rabbit' 185 [183.7, 186.3]
16 /i:/ tyl 'silence' 278 [276.8, 279.2]
17 /i:´/ r tas 'morning' 179 [177.7, 180.3] 18 /i:˜/ arkl s 'horse' 174 [172.5, 175.5]
19 /o/ ožk 'she-goat' 273 [271.6, 274.4]
20 /o`/ ch ras 'choir' 166 [164.6, 167.4]
21 /o:/ kov tojas 'fighter' 228 [226.7, 229.3]
22 /o:´/ š nas 'side' 180 [178.6, 181.4]
23 /o:˜/ Ad mas 'Adam' 183 [181.8, 184.2]
24 /u/ kultūr 'culture' 231 [230.0, 232.0]
25 /u`/ pė 'river' 189 [187.8, 190.2]
26 /u:/ kūrin s 'work' 203 [201.7, 204.3]
27 /u:´/ lū pa 'lip' 183 [181.5, 184.5]
28 /u:˜/ mū šis 'battle' 180 [178.6, 181.4]
The bar plots of the vowel phoneme fundamental frequency values are
shown in Fig. 1.

2. FUNDAMENTALS OF SPEECH SYNTHESIS
20
Fig. 1 The tendencies of the vowel phoneme fundamental frequency changing
This figure shows that the unstressed vowels have longer bars in
comparison with the ones of the stressed vowels. Note that the vowel ''ė'' has
no short phonemes therefore it has only three bars.
2.5.2. Lithuanian semivowel sounds
The Lithuanian consonants ''j'', ''l'', ''m'', ''n'', ''r'', ''v'' are called semivowels as
they have both vowel and semivowel features. Lithuanian language has
nineteen pure semivowel phonemes (see Table 1 of the Appendix A). One of
them is marked with a letter ''j'', four - with a letter ''l'', four - with a letter ''m'',
four - with a letter ''n'', four - with a letter ''r'', and two - with a letter ''v''. The
plots of the semivowel phoneme signals are presented in Fig. 7 – 12 of the
Appendix C. These plots show that the periods of the stressed semivowels are
longer than those of the unstressed semivowels, i. e. the fundamental
frequencies – that are the period reciprocals – of the stressed semivowels are
lower than those of the unstressed ones. The fundamental frequency values of
all unstressed and stressed semivowels using 50 utterances by female have
been measured. The averages values of the fundamental frequencies and their
confidence intervals are shown in Table 2. The confidence intervals are stated
at the 95 % confidence level.

2. FUNDAMENTALS OF SPEECH SYNTHESIS
21
Table 2 The values of the fundamental frequencies of unstressed and stressed semivowel
phonemes (female speaker)
No Phoneme Example Frequency [Hz] Confidence intervals
1 /j"/ jū ra 'sea' 170 [168.6, 171.4]
2 /l/ v lsas 'waltz' 167 [165.5, 168.5]
3 /l˜/ vil kas 'wolf' 156 [154.6, 157.4]
4 /l"/ vali 'will' 183 [181.4, 184.5]
5 /l"˜/ gul ti 'to go to bed' 160 [158.4, 161.6]
6 /m/ matas 'handicraft' 173 [171.7, 174.3]
7 /m˜/ li palas 'adhesive' 167 [165.8, 168.2]
8 /m"/ sm genys 'brain' 182 [180.8, 183.2]
9 /m"˜/ ka štis 'cork' 169 [167.7, 170.3]
10 /n/ n mas 'house' 215 [213.5, 216.5]
11 /n˜/ i karas 'anchor' 185 [183.4, 186.6]
12 /n"/ n šti 'to carry along' 202 [200.6, 203.4]
13 /n"˜/ le ktis 'to bend' 181 [179.6, 182.4]
14 /r/ r tas 'wheel' 210 [208.4, 211.6]
15 /r˜/ ga sas 'sound' 178 [176.6, 179.5]
16 /r"/ kri ušė 'pear' 219 [217.6, 220.4]
17 /r"˜/ ki tis 'stress', 'blow' 182 [180.5, 183.5]
18 /v/ v ras 'spider' 185 [183.4, 186.6]
19 /v"/ vi uksėti 'to yelp' 156 [154.6, 157.4]
The bar plots of the semivowel phoneme fundamental frequency values are
shown in Fig. 2.
Fig. 2 The tendencies of the semivowel phoneme fundamental frequency changing
Fig. 2 shows that the unstressed vowels have longer bars in comparison
with the ones of the stressed vowels.

2. FUNDAMENTALS OF SPEECH SYNTHESIS
22
2.5.3. Lithuanian diphthong sounds
A diphthong is defined as a complex speech sound or glide that begins with
one vowel and gradually changes to another vowel within the same syllable, as
(oi) in boil or ( i ) in fine (Collins, 2009).
Lithuanian language has 6 pure diphthongs and 16 mixed diphthongs. The
pure diphthongs consist of two vowels and are the following: ai, au, ei, ie, ui,
uo. A mixed diphthong is a complex speech sound that begins with a short
vowel (i, e, u, a) and ends with a consonant (l, r, m, n) within the same syllable
(Garšva, 2001).
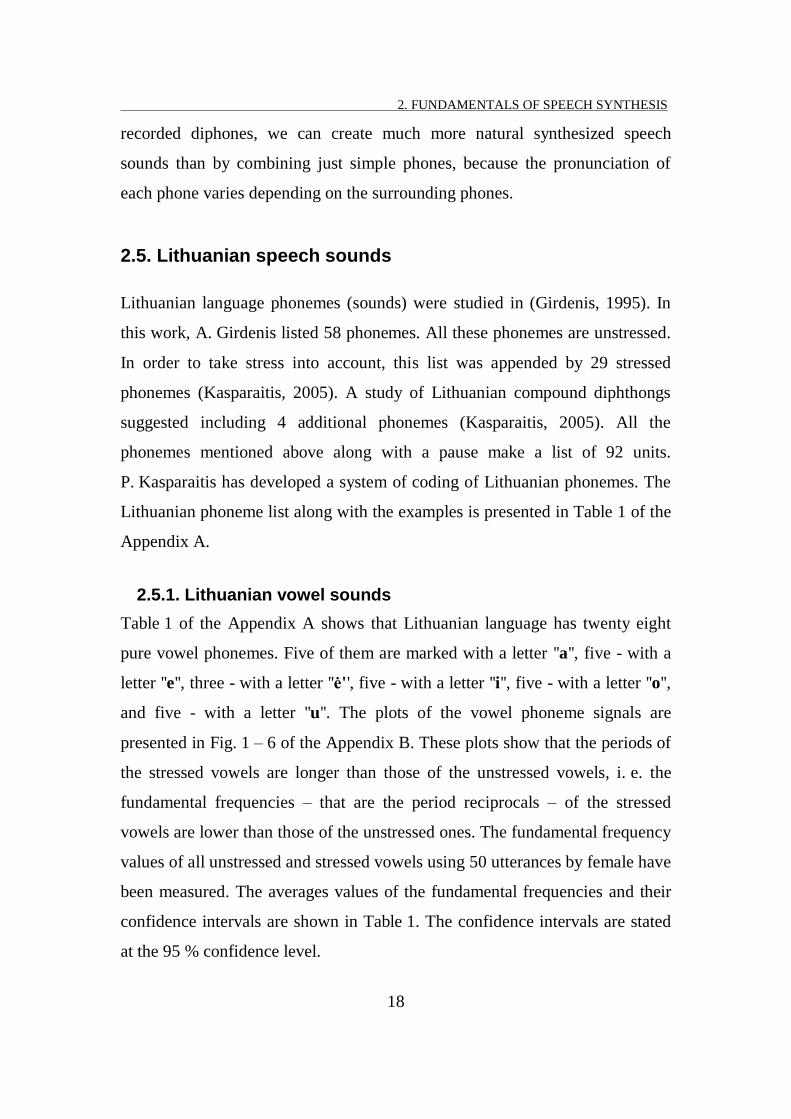
There are two types of pure diphthongs: gliding diphthongs (ie, uo) and
compound diphthongs (ai, au, ei, ui). We do not feel a phonetic boundary
between the first and the second element in pronouncing the gliding
diphthongs (LRC, 2013). The gliding diphthongs are sometimes called the
complex diphthongs (Garšva, 2001).
A list of compound diphthongs and corresponding phonemes or phoneme
combinations is presented in Table 3. Table 4 contains a list of gliding
diphthongs and corresponding phonemes or phoneme combinations. The
phoneme notation presented in Table 3 and Table 4 corresponds to the notation
used in (Kasparaitis, 2005).
Table 3 The compound diphthongs and corresponding phoneme combinations
ai au
l imė 'happiness'
la kas 'time'
vaika 'children'
/Aa/+/j/
/a/+/J/
/a/+/j/
k ukė 'mask'
ba bas 'bugaboo'
lauka 'fields'
/Aa/+/w/
/a/+/W/
/a/+/w/
ei ui
éižėti 'to crack'
pe lis 'knife'
eikl s 'nimble'
/Ea/+/j/
/e/+/J/
/e/+/j/
užg iti 'to oppress'
zu kis 'rabbit'
puik s 'excellent'
/U/+/j/
/u/+/J/
/u/+/j/
2. FUNDAMENTALS OF SPEECH SYNTHESIS
23
Table 4 The gliding diphthongs and corresponding phonemes
ie uo
s ela 'soul'
kri nas ' horseradish'
kiema 'yards'
/Ie/
/iE/
/ie/
p odas 'pot'
pietu s 'in the south '
puod lis 'cup'
/Uo/
/uO/
/uo/
In Lithuanian speech, a pure diphthong can be stressed or unstressed. If the
first vowel of the diphthong is stressed, then the syllable has the falling (acute
‚/‘) accent. If the second vowel of the diphthong is stressed, then the syllable
has the rising (circumflex ‚~‘) accent.
Three other diphthongs (eu, oi, ou) can be observed only in international
words, e.g., eukaliptas 'eucalyptus', sinusoidė 'sinusoid', šou 'show'.
Table 5 Lithuanian diphthongs met in international words only and the corresponding
phoneme combinations
Eu Oi ou
terap utas 'physician' /E/+/u/ b ileris 'boiler' /O/+/i/ kl unas 'clown' /O/+/u/
no menas
'noumenon'1
/o/+/U/
Europ 'Europe' /e/+/u/ boik tas 'boycott' /o/+/i/ dr dnoutas
'dreadnought'2
/o/+/u/
The number of vowels and compound/complex diphthongs or mixed
1 noumenon – (in the philosophy of Immanuel Kant) a thing as it is in itself, not perceived or
interpreted, incapable of being known, but only inferred from the nature of experience (Collins, 2009).
The term is used in contrast with, or in relation to what Kant called the phenomenon – the thing as it
appears to an observer (Encyclopedia Britannica, 2012).
2 dreadnought – 1) (historical) a type of battleship introduced in the early 20th century, larger and
faster than its predecessors and equipped entirely with large-calibre guns; 2) (archaic) a fearless
person; 3) (archaic) a heavy overcoat for stormy weather (Oxford, 2010).

2. FUNDAMENTALS OF SPEECH SYNTHESIS
24
diphthongs defines the number of syllables in a word. Compound/complex
diphthongs are important for Lithuanian language as they along with vowels
and mixed diphthongs make the basis of a Lithuanian language syllable.
Diphthong modelling is important for solving a text-to-speech (TTS) problem.
One can find research papers that investigate diphthongs of various
languages in the literature. Acoustic analysis of the Spanish diphthongs was
carried out in (Borzone De Manrique, 1979). The German diphthongs were
analysed in (Geumann, 1997). Acoustic analysis of diphthongs in Standard
South African English was carried out in (Martirosian and Davel, 2008).
2.6. Conclusions of Section 2
The dominating fields of Lithuanian speech engineering are speech recognition
and speech synthesis.
There exist two main speech synthesis methodologies: concatenation
synthesis and formant synthesis. Concatenation synthesis relies on a speech
sound recorded in advanced database, meanwhile formant synthesis – on
mathematical sound models.
Lithuanian language has ninety two phonemes. Twenty eight of them are
pure vowel phonemes, nineteen – semivowel phonemes.
The differences between the fundamental frequency values of unstressed
and stressed vowel and semivowel phonemes have been ascertained.
Investigations have shown that the fundamental frequencies of the stressed
vowels and semivowels are lower than those of the unstressed ones.
Lithuanian language has six pure diphthongs and sixteen mixed
diphthongs. The pure diphthong consist of two vowels, a mixed diphthong is a
complex speech sound that begins with a short vowel and ends with a
consonant within the same syllable.

25
25
3
3. Phoneme modelling framework
Lithuanian vowel and semivowel phoneme modelling framework based on a
vowel and semivowel phoneme mathematical model and an automatic
procedure of estimation of the vowel phoneme fundamental frequency and
input determining is proposed. Using this framework, the phoneme signal is
described as the output of a linear multiple-input and single-output (MISO)
system. The MISO system is a parallel connection of single-input and single-
output (SISO) systems whose input impulse amplitudes vary in time. Within
this framework two synthesis methods are proposed: harmonic and formant.
3.1. Vowel and semivowel phoneme signals
decomposition into harmonics
The goal is to get mathematical models of the analysed phoneme, which could
be used as a base of a phoneme synthesizer. In general case, the character of
vowel and semivowel signals is periodic (see Fig. 3).

3. PHONEME MODELLING FRAMEWORK
26
a)
b)
Fig. 3 The periodic character of phonemes: a) the plot of the vowel /a/, b) the plot
of the semivowel /m/
One can see from Fig. 3 that a phoneme signal has a rather complex form. It
is very difficult to find such a model that fits the phoneme signal well. The
approach of expanding a complex signal into the sum of simpler signals is
used. The signal can be expanded into the sum of a finite number of
components – the phoneme signal harmonics (similarly as harmonics of a
periodic signal in Fourier series theory).
Suppose the phoneme signal can be expanded into the sum of L
harmonics:
, (10)
where L is the number of harmonics, is the number of samples of the
phoneme.
In order to decompose the phoneme signal into harmonics, the fundamental
frequency of this signal has been estimated. The recurrent algorithm of
-10000
-5000
0
5000
10000
0.03 0.035 0.04 0.045 0.05
Am
pli
tude
[unit
s]
Time [s]
-10000
-5000
0
5000
10000
0.03 0.035 0.04 0.045 0.05
Am
pli
tude
[unit
s]
Time [s]
3. PHONEME MODELLING FRAMEWORK
27
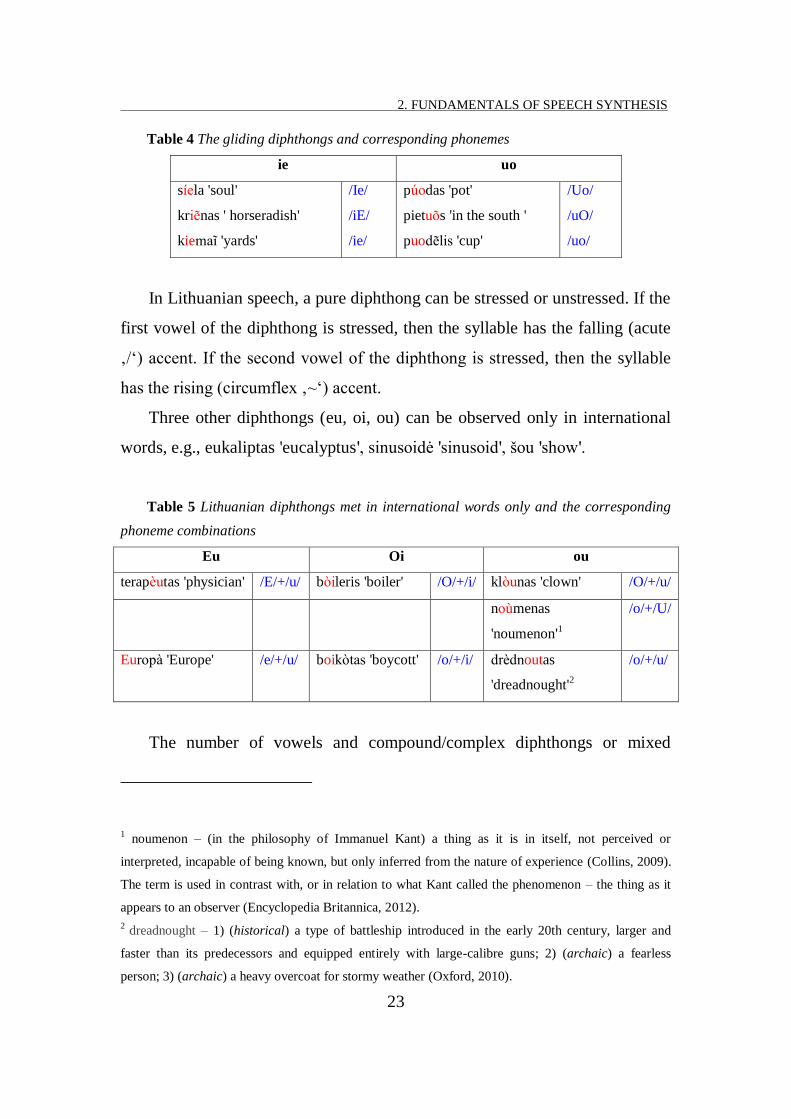
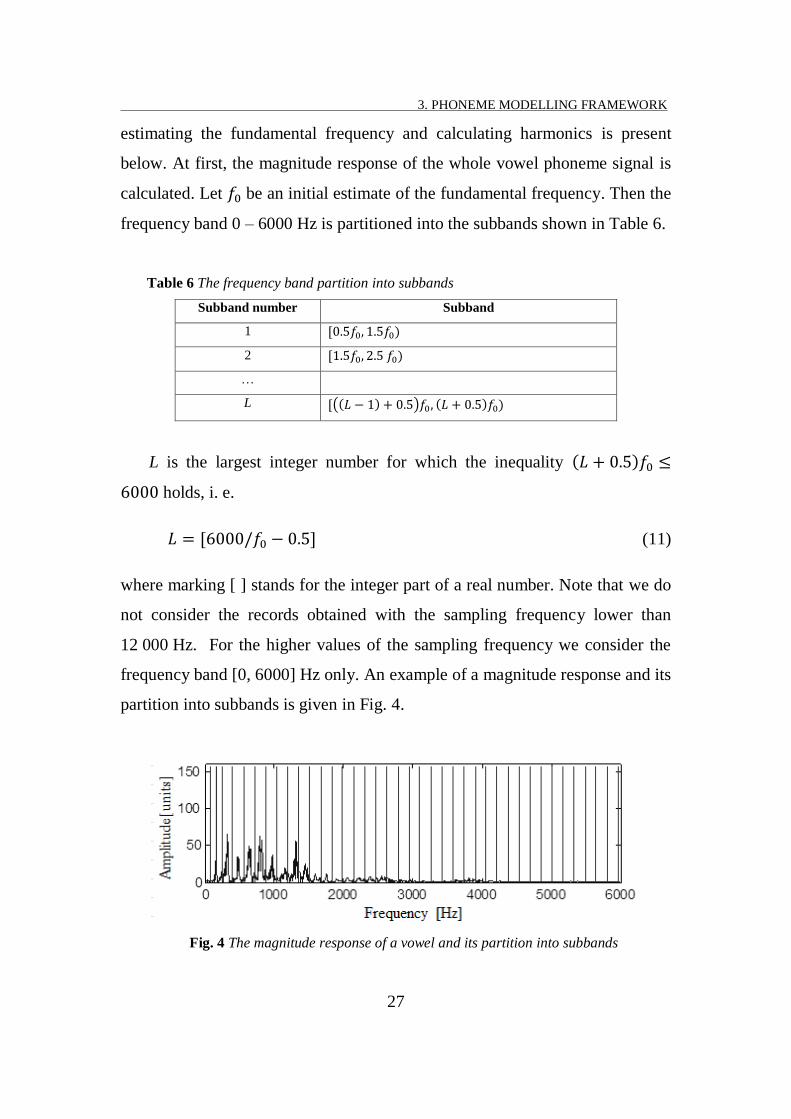
estimating the fundamental frequency and calculating harmonics is present
below. At first, the magnitude response of the whole vowel phoneme signal is
calculated. Let be an initial estimate of the fundamental frequency. Then the
frequency band 0 – 6000 Hz is partitioned into the subbands shown in Table 6.
Table 6 The frequency band partition into subbands
Subband number Subband
1
2
…
L ( )
L is the largest integer number for which the inequality
holds, i. e.
(11)
where marking [ ] stands for the integer part of a real number. Note that we do
not consider the records obtained with the sampling frequency lower than
12 000 Hz. For the higher values of the sampling frequency we consider the
frequency band [0, 6000] Hz only. An example of a magnitude response and its
partition into subbands is given in Fig. 4.
Fig. 4 The magnitude response of a vowel and its partition into subbands
3. PHONEME MODELLING FRAMEWORK
28
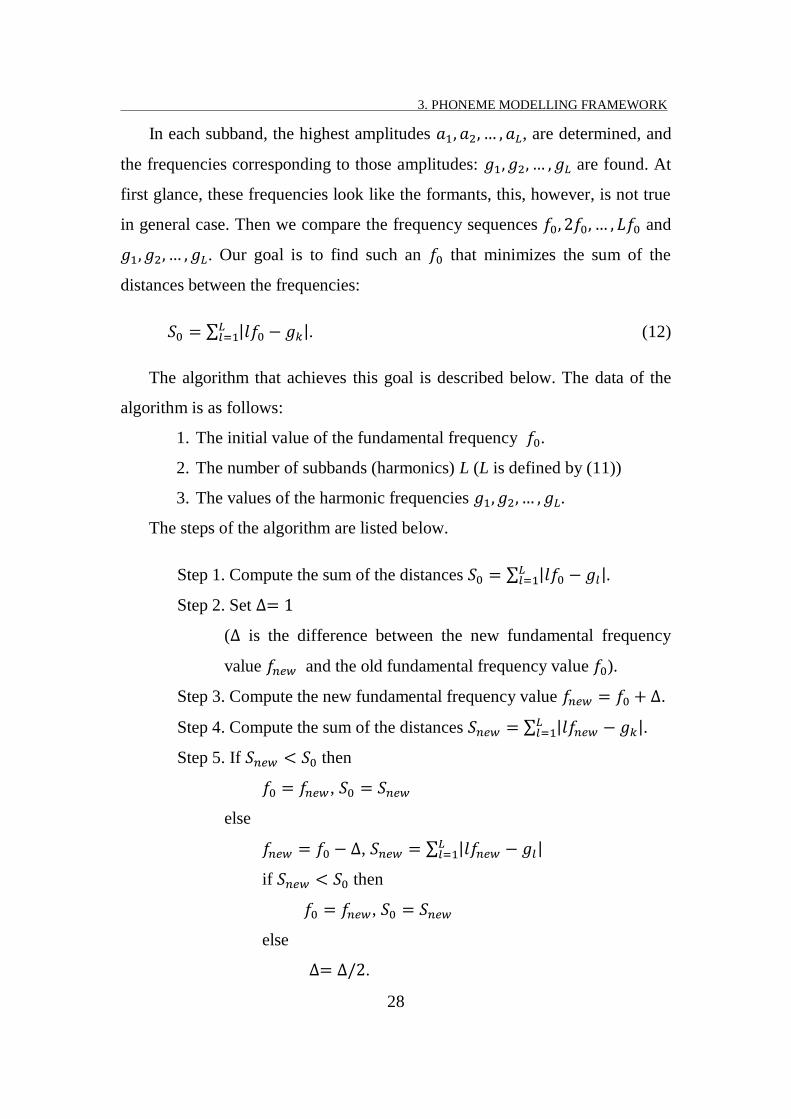
In each subband, the highest amplitudes , are determined, and
the frequencies corresponding to those amplitudes: are found. At
first glance, these frequencies look like the formants, this, however, is not true
in general case. Then we compare the frequency sequences and
. Our goal is to find such an that minimizes the sum of the
distances between the frequencies:
∑ | | . (12)
The algorithm that achieves this goal is described below. The data of the
algorithm is as follows:
1. The initial value of the fundamental frequency .
2. The number of subbands (harmonics) L (L is defined by (11))
3. The values of the harmonic frequencies .
The steps of the algorithm are listed below.
Step 1. Compute the sum of the distances ∑ | | .
Step 2. Set
( is the difference between the new fundamental frequency
value and the old fundamental frequency value ).
Step 3. Compute the new fundamental frequency value .
Step 4. Compute the sum of the distances ∑ | | .
Step 5. If then
,
else
, ∑ | |
if then
,
else
.
3. PHONEME MODELLING FRAMEWORK
29
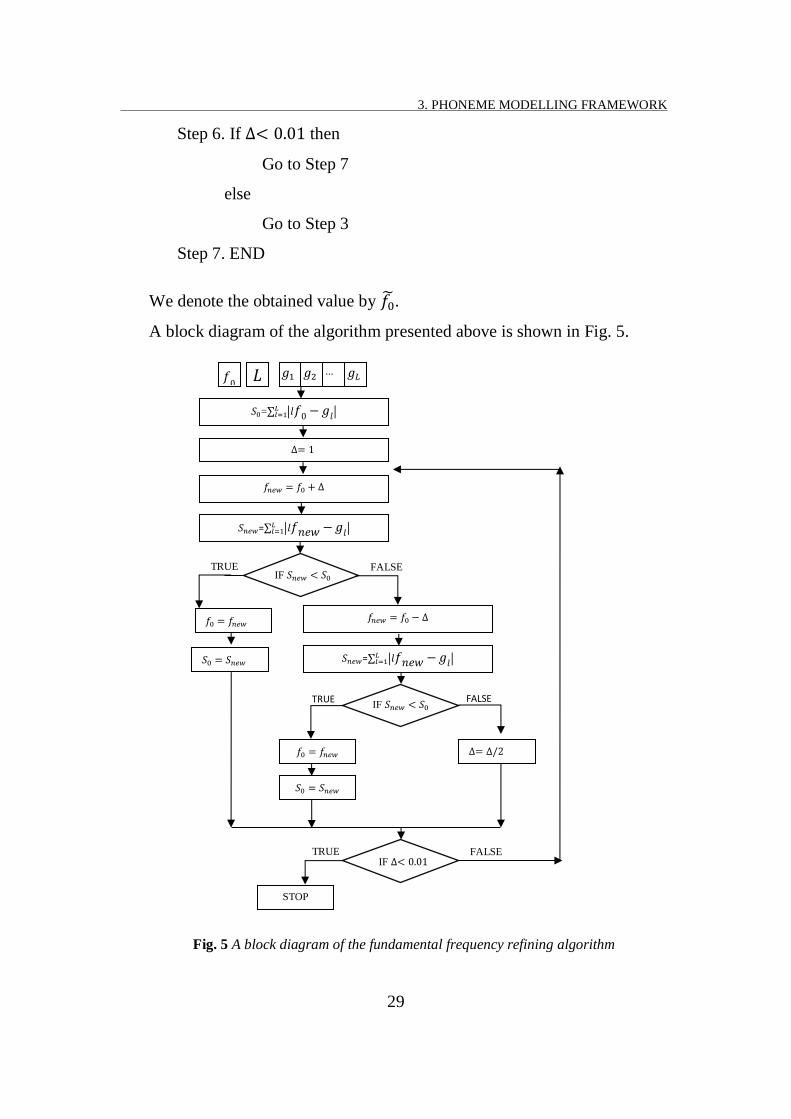
Step 6. If then
Go to Step 7
else
Go to Step 3
Step 7. END
We denote the obtained value by .
A block diagram of the algorithm presented above is shown in Fig. 5.
Fig. 5 A block diagram of the fundamental frequency refining algorithm
𝑔 𝑔 ... 𝑔𝐿
𝑆 =∑ 𝑙𝑓 𝑔𝑙 𝐿𝑙
𝑓𝑛𝑒𝑤 𝑓
𝑓 𝑓𝑛𝑒𝑤
TRUE
𝑆 𝑆𝑛𝑒𝑤
FALSE
STOP
TRUE FALSE
𝐿 𝑓
𝑆𝑛𝑒𝑤=∑ 𝑙𝑓𝑛𝑒𝑤 𝑔𝑙 𝐿𝑙
𝑓𝑛𝑒𝑤 𝑓
𝑆𝑛𝑒𝑤=∑ 𝑙𝑓𝑛𝑒𝑤 𝑔𝑙 𝐿𝑙
IF 𝑆𝑛𝑒𝑤 𝑆 TRUE FALSE
𝑓 𝑓𝑛𝑒𝑤
𝑆 𝑆𝑛𝑒𝑤
IF 𝑆𝑛𝑒𝑤 𝑆
IF

3. PHONEME MODELLING FRAMEWORK
30
At first glance it may seem that the cycle becomes infinite if the condition
is always true. In practice, when the changes, the distance
between the values and can not decrease all the time; at a certain time it
will start to increase.
After obtaining the optimal value , we can decompose the phoneme
signal s(n) into L harmonics (L is defined by (11)). For this purpose, a new
frequency band partition into subbands according to Table 6 (with ) is
made.
An auxiliary function is defined as follows:
{ [( ) ]
[( ) ] (13)
where , FFT – the fast Fourier transform, and compute its inverse
Fourier transform
(
) ∑
Nn ...,,1 , i – imaginary unit.
The obtained signal is the l-th harmonic of the phoneme signal. The first
three harmonics of the female vowel /a:˜/ are shown in Fig. 6.
Fig. 6 The first three harmonics of the phoneme a as in the word čiū)
3. PHONEME MODELLING FRAMEWORK
31
We see from Fig. 6 that the harmonic amplitudes are not constant. Note
that the harmonic periods are not constant, too. This changing over time of the
amplitudes and periods gives sounding naturalness.
3.2. Vowel and semivowel phoneme signals
decomposition into formants
A formant (formant frequency) is defined in a usual way as a maximum of the
phoneme spectrum envelope. In time-domain representation, a formant can be
described as the output signal of the filter whose impulse response is a damped
sinusoid (Fant, 1970; Cook, 2002). In the current work, the Linear Predictive
Coding (LPC) method (Markel and Gray, 1976) as a formant extraction tool is
used. We need to partition the frequency band 0-6000 Hz into the subbands
where each band corresponds to one formant. The partition is executed in the
following way. Using the LPC method, the signal envelope is obtained. The
frequency values corresponding to the envelope local minima are considered as
partition points. It is very important that the formant extraction coincide with
the harmonic extraction, i. e. a part of a harmonic cannot belong to one formant
and the other part belong to the other formant. Also, each harmonic should be
assigned to a certain formant. I propose to add the neighbouring harmonics
(calculated in Section 3.1) corresponding to a selected formant of spectrum.
The obtained signal will be call a formant. Joining of the harmonic frequencies
of the phoneme spectrum into groups corresponding to the particular formant
frequencies is shown in Fig. 7.

3. PHONEME MODELLING FRAMEWORK
32
Fig. 7 The plots of the spectrum of the phoneme a
The first three formant components of the female vowel /a:˜/ are shown in
Fig. 8.
Fig. 8 The first three formant components of the phoneme a
We see from Fig. 4 and Fig. 6 that in general case the form of a formant
signal is more complex than that of a harmonic signal. Harmonics are more
similar to sine waves, and the formants look like pulsating vibrations.
3.3. The vowel and semivowel phoneme model
We have to expand a phoneme signal into components. It is natural to choose a
parallel connection model where each component is modelled separately. For
modelling a discrete time linear stationary system with inputs and a single
output ( is the number of harmonics (in harmonic synthesis method) or
formants (in formant synthesis method)) is used. The system is stationary as its

3. PHONEME MODELLING FRAMEWORK
33
parameters are lumped, i. e. they do not vary in time for a selected phoneme.
The system is linear since the output is a linear combination of the present and
past values of the input signals.
A diagram of such a system is shown in Fig. 9.
Fig. 9 A MISO system for vowel and semivowel phonemes modelling
Let
...)),2(),1(),0((
...)),2(),1(),0(( 1111
KKKK hhh
hhh
h
h
(15)
denote the impulse responses, and
...)),1(),0(),1(,(
...)),1(),0(),1(,( 1111
KKKK uuu
uuu
u
u
(16)
– the inputs of the corresponding SISO systems. Denote by
...)),1(),0(),1(,( kkkk yyy y , Kk ,,1 (17)
the output of the k-th SISO system.
The impulse response H of the MISO system is the following vector of
sequences:
. . .
.
.
.
.
.
.

3. PHONEME MODELLING FRAMEWORK
34
Kh
h
H 1
, (18)
and the input of the MISO system is as follows: T
K ],,[ 1 uuU .
Such a MISO system whose output y is equal to the sum of the inputs of
the SISO systems is considered:
Kyyy 1 . (19)
Since
(20)
where denotes the convolution operation
0
)()(i
kkkk ihinuhu , (21)
we have
. (22)
Consider the vector delta sequence )(nδ defined as
0,]0,,0,0[
0,]1,,1,1[
)( n
n
n T
K
T
δ . (23)
Suppose that the system is excited by this sequence. In this case, the output
sequence values are as follows:
0,)()(1
nnnK
k
khy . (24)
3. PHONEME MODELLING FRAMEWORK
35
The chosen model allows exciting each channel with a separate input sequence.
This enables us to preserve harmonic amplitude variation.
If we take a single period of the phoneme component we get a signal of a
certain form. This signal is similar to a quasipolynomial that is the product of a
sinusoid and polynomial. It is assumed that all the kh can be represented by
second degree quasipolynomials. The mathematical description of a second
degree continuous-time quasipolynomial is given below:
))2sin()2sin()2sin(()( 3
2
32211 tftatftatfaetq t (25)
where is a nonnegative real number 0 Rt , 0 - the damping factor,
– the frequency, - amplitude, k ( k ) – phase. If the coefficients
032 aa , then we obtain the usual mathematical description of a formant.
First, consider a discrete time SISO system whose impulse response )(h nk
consists of a single component:
)()( tnqnhk , ...,2,1,0n (26)
where the component is defined by (25) with k , kff , 11 kaa , ,22 kaa
33 kaa , 11 k , 22 k , 33 k , sft 1 ( sf is the sampling frequency),
Kk ,,1 .
Let be a positive integer. Taking tNttt )1(...,,2,,0 , we get from
(25) and (26) that
3. PHONEME MODELLING FRAMEWORK
36
)).)1(2sin()1(
))1(2sin()1())1(2sin(())1((h
))22sin(2)22sin(2)22sin(()2(h
))2sin()2sin()2sin(()(h
)sin()0(h
3
22
3
2211
)1(
3
22
32211
2
3
2
32211
11
kkk
kkkkkk
tN
k
kkkkkkkkk
t
k
kkkkkkkkk
t
k
kkk
tNftNa
tNftNatNfaetN
tftatftatfaet
tftatftatfaet
a
k
k
k
(27)
Denote by N
kh the following vector :
T
kkkk
N
k tNhththh )])1((,),2(),(),0([ h . (28)
Let
....,,1,
,
,
,
,2
2
33
22
11
KktaA
taA
aA
t
tf
kk
kk
kk
kk
kk
(29)
Collect the first N values of the output sequence into a vector Ny :
TN Nyyyy )1(,),2(),1(),0( y . (30)
Define by ),( kkkk ΨΨ the following matrix:
][ 321 kkkk ΨΨΨΨ (31)
where
kiki
kisc
i 0)1(Ψ
0,0
0,1)(
i
ii (32)
with

3. PHONEME MODELLING FRAMEWORK
37
Tk
Ni
k
i
kki NeNeec kkk
)1cos()1(,,2cos2,cos)1(121 (33)
T
k
Ni
k
i
kki NeNees kkk
)1sin()1(,,2sin2,sin)1(121 (34)
and by ),,,,,( 321321 kkkkkkk AAA αα the following vector:
.)cos(),sin(),cos(),sin(),cos(),sin( 333322221111
T
kkkkkkkkkkkkk AAAAAA α
(35)
Collect all the matrices kΨ into an matrix Ψ :
][ 21 KΨΨΨΨ , (36)
and all the vectors kα into a vector α:
TT
K
TT ][ 21 αααα . (37)
One can readily check that the vector Ny can be expressed as the product
of the matrix Ψ and the vector α
αΨαΨαΨy KK
N ...11 . (38)
If we have the matrix Ψ , obtaining the α reduces to a simple least
squares fit:
NyΨα (39)
where Ψ denotes the pseudo-inverse of the matrix Ψ , i. e. a NK 6 matrix
ΨΨΨΨ1)( T .
Let z denote the common shift operator. Then from (18) we can write

3. PHONEME MODELLING FRAMEWORK
38
Kz
z
z
h
h
H 1
(40)
where
...)),3(),2(),1(( kkkk hhhz h , Kk ...,,1 (41)
is the shifted sequence.
Suppose now that the system is excited by a periodic sequence of the
vector delta sequences:
...),2(),(),( MnMnn δδδ (42)
where NM 0 is the period of this sequence such that
Kzk
...,0,0,0
...,0,0,0
H rows (43)
for all Mk 3 . One can readily check that the output sequence then satisfies
the following relationships:
0)(y n for 0n
K
k
k nn1
)(h)(y for Mn 0
))(h)(h()(y1
K
k
kk Mnnn for MnM 2 (44)
))2(h)(h)(h()(y1
K
k
kkk MnMnnn for
...,3,2,)1( lMlnMl .
Let KK ,,,, 11 θ . Introduce the following matrix

3. PHONEME MODELLING FRAMEWORK
39
)(θΦΦ (I call it the convoluted matrix):
(45)
where :),:( nmΨ denotes a submatrix of the matrix Ψ consisting of all the
columns and the rows starting from the m-th row and ending with the n-th row.
Note that the matrix Φ depends on the damping factors k and the angular
frequencies k (and does not depend on the amplitudes 321 ,, kkk AAA and phases
321 ,, kkk ).
Collect all the M values of the first period of the periodic output sequence
into a vector My :
TM Myyyy )1(,),2(),1(),0( y . (46)
Using (44), it is not difficult to check that
αΦy M . (47)
Usually we measure the output y(t) with errors. Therefore an error
component into (47) must be incorporated. This error is modelled by an
additive white Gaussian noise. Collect all the noise values into a vector e:
TMeeee )1(,),2(),1(),0( e . (48)
Then the vector y can be written in the following form:
eαΦy M . (49)
We have to minimize the following functional:
2
)(, αθΦyθa Mr (50)
3. PHONEME MODELLING FRAMEWORK
40
where is the Euclidian norm defined as xxx 2.
It is proved in the literature (Golub and Pereyra, 1973) that minimization
of the θa,r is equivalent to minimization of the following functional:
2
2
MyPr θΦθ (51)
where
ΦΦΦΦΦΦθΦ MM ΙP1
. (52)
is called the orthogonal projector onto the orthogonal complement of
the matrix Φ column space.
)(θΦP can be represented by an MM matrix.
Equivalence of minimization can be explained as follows: suppose we found
the value θ of the parameter θ that minimizes θ2r . Then the value θ,a ˆˆ
where
MyθΦa ˆˆ (53)
minimizes the functional θa,r . Levenberg-Marquardt approach to minimize
the functional (51) is used. In the next Section, a new algorithm applied to the
convoluted data is developed. The algorithm for nonconvoluted data was
developed in (Šimonytė and Slivinskas, 1997).
3.4. Parameter estimation of the model
Levenberg-Marquardt approach (Levenberg, 1944; Marquardt, 1963) is an
iterative procedure that corrects an initial parameter estimate according to the
following formula:
,1,0,1
2
1 lc llT
Kl
llTllθbθVIθVθVθθ (54)

3. PHONEME MODELLING FRAMEWORK
41
where
MyPθV θΦ
D (55)
is an KM 2 matrix (the symbol D stands for differentiation operation
θ
D , l
θ denotes the value of the parameter θ in the l-th iteration,
θΦP is
an orthogonal projector onto the orthogonal complement of the matrix
θΦ
column space),
M
yPθb θΦ
(56)
is an 1M vector, K2I is a KK 22 unit matrix, lc is the Levenberg-Marquardt
algorithm constant in the l-th iteration.
Levenberg-Marquardt equation (54) is not constructive, it is only a
guideline to obtaining iteratively the formant parameter estimates. One can not
use this equation directly. In each case of data model, it is necessary to develop
(54) computation algorithm in the explicit form using constructive matrix
operations (addition, subtraction, multiplication, pseudoinverse, QR
decomposition). Data model is described in Section 3.3. One of such
unconstructive operations in (54)-(55) is differentiation. In order to implement
(55), we need to calculate
θΦPD for our data model. This is a rather
difficult task. Luckily there exists a formula that simplifies calculation of
θΦPD . It is shown in (Golub and Pereyra, 1973) that
T)( BΦPBΦPP θΦθΦθΦ DDD (57)
where ΦD is a three-dimensional tensor formed of 2K KM 6 matrices
each containing the partial derivatives of the elements of Φ , and B is a special
generalized inverse of the basis signal matrix Φ .
3. PHONEME MODELLING FRAMEWORK
42
Denote by kG an KM 6 matrix which is equal to the derivative of Φ
with respect to the k-th component kθ of the parameter vector θ :
k
kθ
ΦG . (58)
Then
θΦPD is compounded of 2K MM matrices of the form
T
kkkGG )( BPBPP θΦθΦθΦ
D . (59)
Thus x
θΦPD is formed of 2K 1M vectors xk
θΦPD ( )6...,,1 Ki ,
and hence )(V is an KM 2 matrix.
The generalized inverse matrix B can be calculated by means of a standard
QR-decomposition of the matrix Φ . Let S stands for a KK 66 permutation
matrix, 1T – for a KK 66 upper triangular matrix with decreasing diagonal
elements, Q – for an MM orthogonal matrix. Then the matrix B is obtained
using the formula:
Q0SB )6(6
1
1 KMKT . (60)
The orthogonal projector
)(θΦP onto the orthogonal complement of the
matrix Φ column space can be calculated with a help of the orthogonal matrix
Q (Golub and Pereyra, 1973):
QI0
00QθΦ
KMKKM
KMKKKTP66)6(
)6(666
)( . (61)
The matrix kG is equal to the partial derivative of the elements of the
convoluted matrix Φ with respect to the damping factor k or angular
frequency k of the k-th output signal component. Its size is the same as that of

3. PHONEME MODELLING FRAMEWORK
43
the matrix Φ , i. e. KM 6 . Denote for Kk ...,,1 :
.
,
2
2
12
12
kk
k
kk
k
ΦΦG
ΦΦG
(62)
It is not difficult to check that:
,
0
0
,,
0
0
,)1sin()1(,)1cos()1(
),6(:,),16(:,),26(:,),36(:,,
0
0
,,
0
0
)(6
1
3
1
)1(
1
3
1
)1(
)1(6
12
kK
M
mi
k
tim
M
mi
k
tim
k
k
k
imeimimeim
kkkk
kk
ΦΦΦΦΦ
G
(63)
and
.
0
0
,,
0
0
,)1cos()1(,)1sin()1(
),16(:,),6(:,),36(:,),26(:,,
0
0
,,
0
0
)(6
1
3
1
)1(
1
3
1
)1(
)1(6
2
kK
M
mi
k
tim
M
mi
k
tim
k
k
k
imeimimeim
kkkk
kk
ΦΦΦΦΦ
G
(64)
Since the columns of the matrix Φ and their products with scalars belong
to its column space, the products of the projector matrix
)(θΦP and the
3. PHONEME MODELLING FRAMEWORK
44
)56( k -th, )46( k -th )36( k -rd, )26( k -nd columns of the matrices 12 kG
and k2G are equal to the null vector of length M. Thus kSP θΦ
)( is an KM 6
matrix whose all columns are zero except the two ones (the 16 k -st and
k6 -th columns).
Parameter estimation algorithm
All the formulas ((56)-(64)) are constructive. Using these formulas, a stepwise
algorithm for calculating formant parameter estimates from convoluted data
can be present.
Given:
1. The index k of the harmonics (in harmonic synthesis method) or
formants (in formant synthesis method) under investigation.
2. The sequence y obtained from the pitch samples (Selection of the
phoneme representative period procedure is presented in the
Section 3.6)
3. The initial parameter vector Tkk
000 θ .
4. The initial value of Levenberg-Marquardt constant 001.00 c .
5. The iteration number 0l .
6. The maximal iteration number maxl .
7. The signal estimation relative accuracy in percent min .
8. The initial signal estimation relative accuracy in percent 1 , for
example 1001 .
9. The allowed limit damping factor value lim , for example 006.0lim .
10. The allowed maximal Levenberg-Marquardt constant maxc , for example
10
max 10c .
11. Stop criterion is min l or maxll or maxccl or liml
k .
3. PHONEME MODELLING FRAMEWORK
45
Step 1. Compute the quasipolynomial matrix )( l
k θΨΨ using (31)-(34).
Step 2. Compute the convolution matrix )( l
k θΦΦ by equation (45).
Step 3. Using the standard QR decomposition of the matrix Φ , find the general
inverse matrix B according to formula (60).
Step 4. Compute the projector onto the noise subspace
)( lPθΦ
by formula (52).
Step 5. Find the projection of y onto the noise subspace by formula (56).
Step 6. Determine the error %100/2
2 yr l
l θ , where lr θ2 is defined by (51).
Step 7. If ( )1 ll then
10/1 ll cc
else
1
1 10
ll
ll cc
θθ
Go to Step 11.
Step 8. Compute the partial derivative of the elements of the matrix Φ with
respect to k and k using formulas (63)-(64).
Step 9. Find the derivative of the projector lθΦ
PD according to equation (59).
Step 10. Calculate the matrix )( lV θ by formula (55).
Step 11. Compute the parameter vector 1lθ by (54) and return to Step 1.
END
A comment on this algorithm:
The algorithm would be valid in the case when parameters were
estimated not for a single formant but for several ones. Practice,
however, shows that the results are unstable due to the ill-conditioned
matrix Ψ .

3. PHONEME MODELLING FRAMEWORK
46
3.5. The vowel and semivowel phoneme model in a state space form
In state space representation, the MISO system presented in Fig. 9 can be
described as follows (Slivinskas and Šimonytė, 1990):
(65)
where F is an block diagonal matrix made of K Jordan blocks
with
[
]
(66)
K is the total number of harmonics (in harmonic synthesis method) or
formants (in formant synthesis method),
(67)
(the subscript k in (66) is omitted for simplicity), G is an block diagonal
matrix made of K column vectors with
, (68)
H is an block diagonal matrix made of K row vectors
with
(69)
where

3. PHONEME MODELLING FRAMEWORK
47
(70)
.
3.6. Selection of the phoneme representative period
The vowel and semivowel phoneme signals are quasi-periodic, i. e. their
periods are not exactly the same. Therefore only a single period for each
phoneme is considered. Such a period is usually called a pitch.
Let
(71)
be a sequence of samples of the considered pitch of the analysed phoneme.
This sequence can be treated as the output of a MISO system (see Section 3.3).
In order to automate this selection procedure, the amplitude size as the
selection criteria, i. e. the pitch with the highest amplitude is selected as a
representative one, is chosen. We are looking for a representative period that is
within the 60% of the phoneme signal samples (i.e. 20% of the samples in the
signal start part and 20% in the signal end part are rejected). Fig. 10 shows a
vowel phoneme signal made of several pitches where the pitch with the highest
amplitude is marked with an arrow.
Fig. 10 Selecting of the vowel phoneme pitch with the highest amplitude
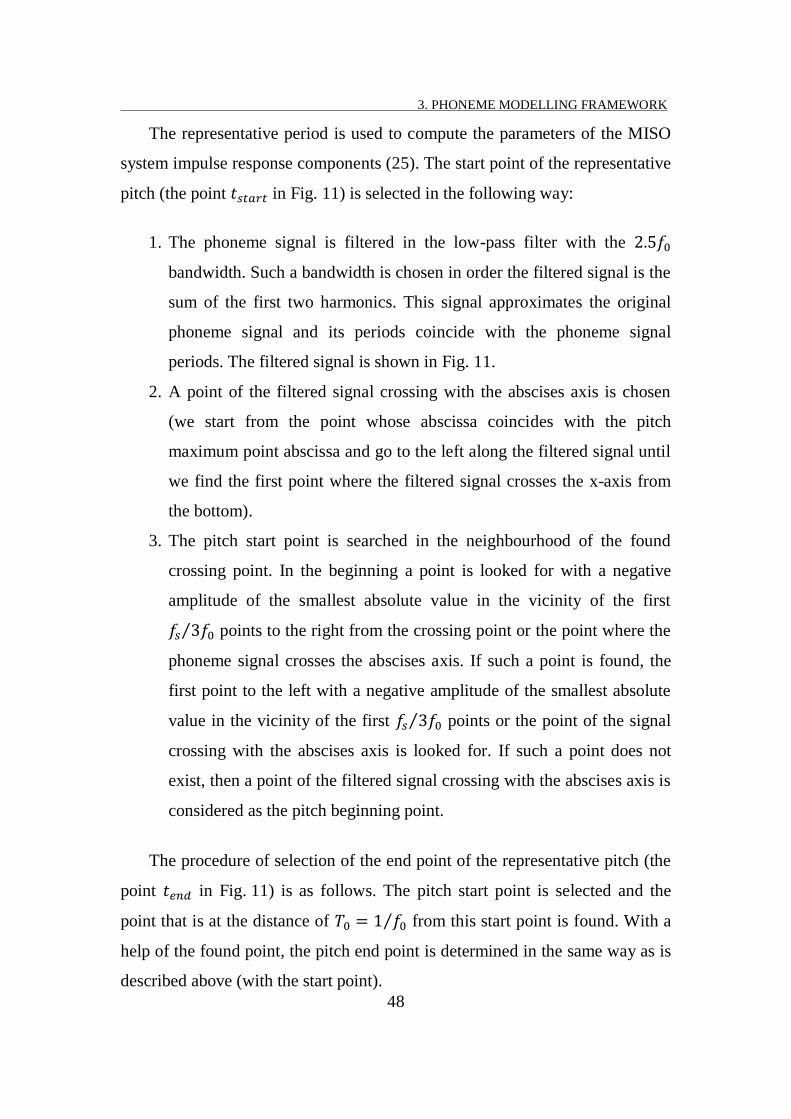
3. PHONEME MODELLING FRAMEWORK
48
The representative period is used to compute the parameters of the MISO
system impulse response components (25). The start point of the representative
pitch (the point in Fig. 11) is selected in the following way:
1. The phoneme signal is filtered in the low-pass filter with the
bandwidth. Such a bandwidth is chosen in order the filtered signal is the
sum of the first two harmonics. This signal approximates the original
phoneme signal and its periods coincide with the phoneme signal
periods. The filtered signal is shown in Fig. 11.
2. A point of the filtered signal crossing with the abscises axis is chosen
(we start from the point whose abscissa coincides with the pitch
maximum point abscissa and go to the left along the filtered signal until
we find the first point where the filtered signal crosses the x-axis from
the bottom).
3. The pitch start point is searched in the neighbourhood of the found
crossing point. In the beginning a point is looked for with a negative
amplitude of the smallest absolute value in the vicinity of the first
⁄ points to the right from the crossing point or the point where the
phoneme signal crosses the abscises axis. If such a point is found, the
first point to the left with a negative amplitude of the smallest absolute
value in the vicinity of the first ⁄ points or the point of the signal
crossing with the abscises axis is looked for. If such a point does not
exist, then a point of the filtered signal crossing with the abscises axis is
considered as the pitch beginning point.
The procedure of selection of the end point of the representative pitch (the
point in Fig. 11) is as follows. The pitch start point is selected and the
point that is at the distance of ⁄ from this start point is found. With a
help of the found point, the pitch end point is determined in the same way as is
described above (with the start point).
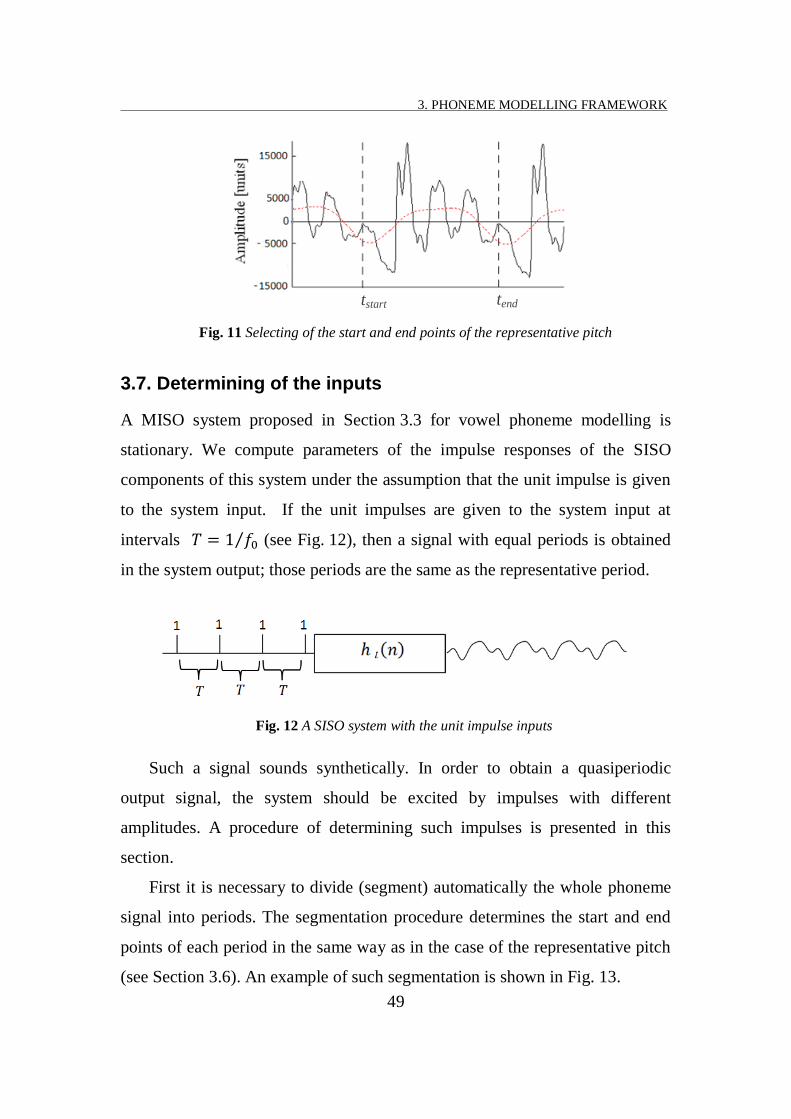
3. PHONEME MODELLING FRAMEWORK
49
Fig. 11 Selecting of the start and end points of the representative pitch
3.7. Determining of the inputs
A MISO system proposed in Section 3.3 for vowel phoneme modelling is
stationary. We compute parameters of the impulse responses of the SISO
components of this system under the assumption that the unit impulse is given
to the system input. If the unit impulses are given to the system input at
intervals ⁄ (see Fig. 12), then a signal with equal periods is obtained
in the system output; those periods are the same as the representative period.
Fig. 12 A SISO system with the unit impulse inputs
Such a signal sounds synthetically. In order to obtain a quasiperiodic
output signal, the system should be excited by impulses with different
amplitudes. A procedure of determining such impulses is presented in this
section.
First it is necessary to divide (segment) automatically the whole phoneme
signal into periods. The segmentation procedure determines the start and end
points of each period in the same way as in the case of the representative pitch
(see Section 3.6). An example of such segmentation is shown in Fig. 13.
tstart tend
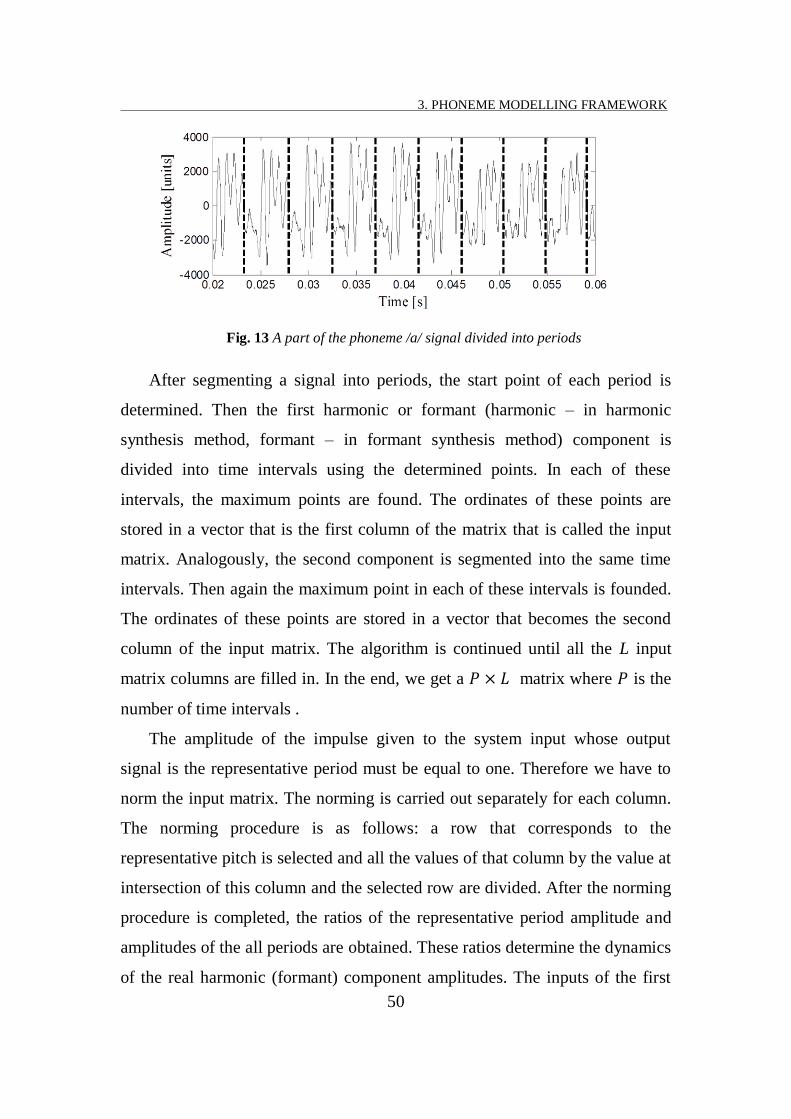
3. PHONEME MODELLING FRAMEWORK
50
Fig. 13 A part of the phoneme /a/ signal divided into periods
After segmenting a signal into periods, the start point of each period is
determined. Then the first harmonic or formant (harmonic – in harmonic
synthesis method, formant – in formant synthesis method) component is
divided into time intervals using the determined points. In each of these
intervals, the maximum points are found. The ordinates of these points are
stored in a vector that is the first column of the matrix that is called the input
matrix. Analogously, the second component is segmented into the same time
intervals. Then again the maximum point in each of these intervals is founded.
The ordinates of these points are stored in a vector that becomes the second
column of the input matrix. The algorithm is continued until all the L input
matrix columns are filled in. In the end, we get a matrix where is the
number of time intervals .
The amplitude of the impulse given to the system input whose output
signal is the representative period must be equal to one. Therefore we have to
norm the input matrix. The norming is carried out separately for each column.
The norming procedure is as follows: a row that corresponds to the
representative pitch is selected and all the values of that column by the value at
intersection of this column and the selected row are divided. After the norming
procedure is completed, the ratios of the representative period amplitude and
amplitudes of the all periods are obtained. These ratios determine the dynamics
of the real harmonic (formant) component amplitudes. The inputs of the first

3. PHONEME MODELLING FRAMEWORK
51
three channels of a MISO system are presented in Fig. 14 (the harmonic
synthesis method case).
Fig. 14 The inputs of the first three channels of a MISO system
From Fig. 14 we see that the system inputs are changing in time. For
example, in the second half of the inputs the 1st channel impulse amplitudes
increase, while the 3rd channel impulse amplitudes reduce significantly.
The input amplitudes are described by parabolas. Each parabola is
characterized by the following three parameters: , }, where
is the maximum input value, – the time instant of the maximum
input value, – the phoneme length.
The parabola describes the input amplitudes in time instants
.
To these inputs two additional input sequences are added. The argument of
the first sequence is [ , 0], and the argument of another is [ .
These sequences are also described by parabolas. The first parabola depicts the
input growth from zero to the initial value, while the latter – the input damping
until the zero value. Fig. 15 shows the total input curve.
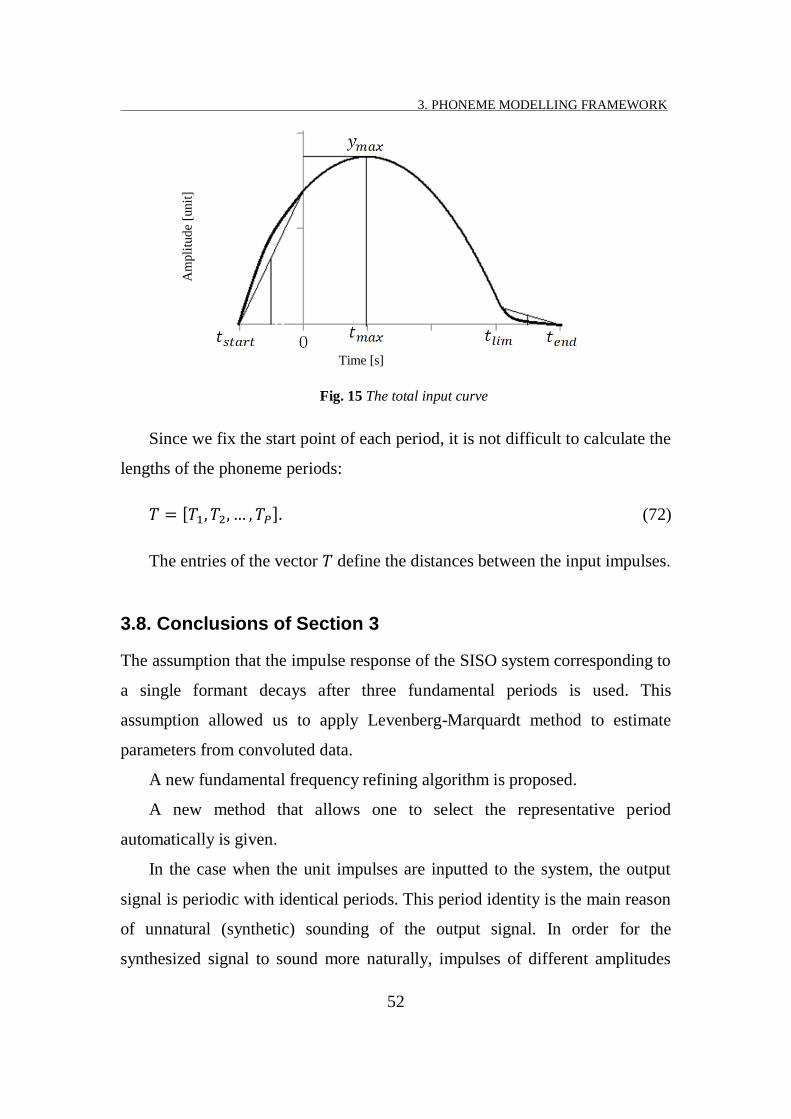
3. PHONEME MODELLING FRAMEWORK
52
Fig. 15 The total input curve
Since we fix the start point of each period, it is not difficult to calculate the
lengths of the phoneme periods:
(72)
The entries of the vector define the distances between the input impulses.
3.8. Conclusions of Section 3
The assumption that the impulse response of the SISO system corresponding to
a single formant decays after three fundamental periods is used. This
assumption allowed us to apply Levenberg-Marquardt method to estimate
parameters from convoluted data.
A new fundamental frequency refining algorithm is proposed.
A new method that allows one to select the representative period
automatically is given.
In the case when the unit impulses are inputted to the system, the output
signal is periodic with identical periods. This period identity is the main reason
of unnatural (synthetic) sounding of the output signal. In order for the
synthesized signal to sound more naturally, impulses of different amplitudes
Time [s]
Am
pli
tude
[unit
]
3. PHONEME MODELLING FRAMEWORK
53
and periods as inputs instead of the unit impulses with a constant period are
used.
The input sequence of each phoneme has been described by three
parabolas. The first parabola characterized the slowdown growth of the
formant, the second parabola described the main time region, and the third one
characterized the slowdown decreasing of the formant. The inputs for each
phoneme are arranged consequently with overlapping.


55
55
4
4. Experimental research
Real data in this section are consider. This data are samples of natural sounds.
The sounds were recorded using a microphone and the “Sound Record”
program to a .wav file of the audio format with the following parameters: PCM
48 kHz; 16 bit; stereo. This frequency corresponds to the sampling interval of
21 µs. The experiments were carried out using my programs developed in
MATLAB and C#.
4.1. Fundamental frequency estimation using the MUSIC method
The MUSIC method and DFT (Discrete Fourier Transform) method for
Lithuanian male vowels /a/, /i/, /o/, /u / were applied. The MUSIC spectrum
was calculated using the formula:
(73)
where )(ˆ 2 fj
MU eP is defined by (9).
For each of the vowels mentioned above, 80 records of length 1024 points
)(ˆlg10)MUSIC( 2 fj
MU ePf
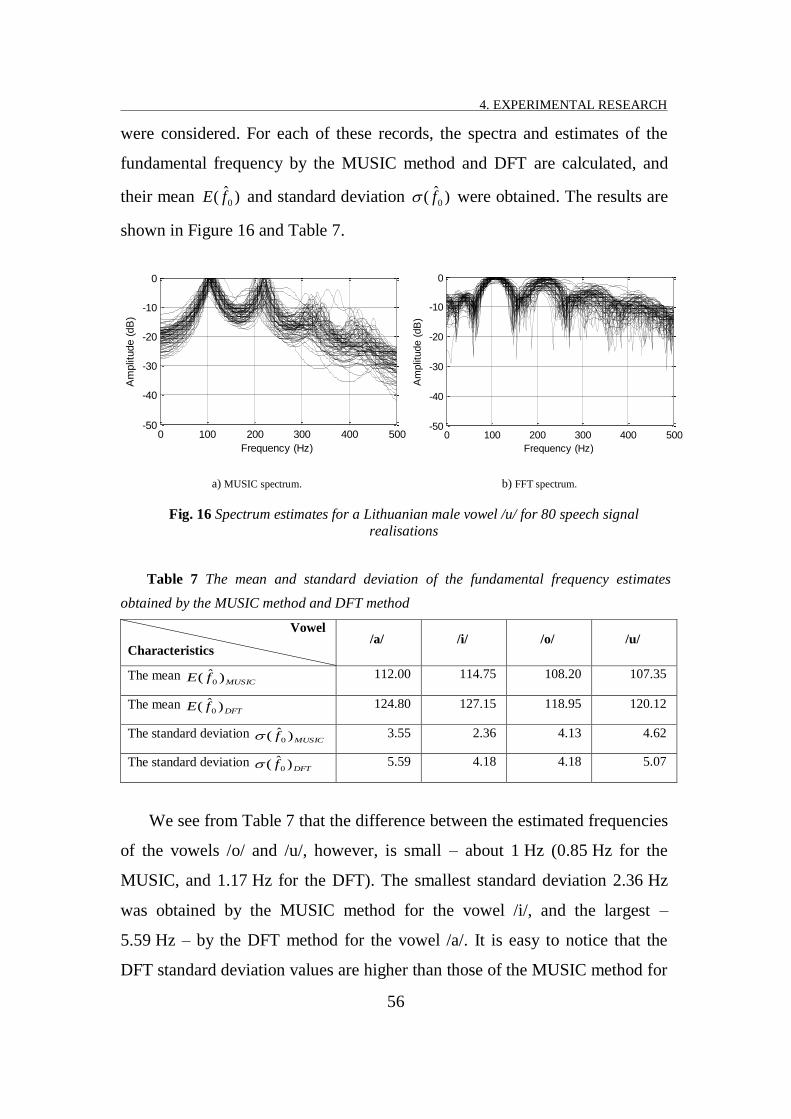
4. EXPERIMENTAL RESEARCH
56
were considered. For each of these records, the spectra and estimates of the
fundamental frequency by the MUSIC method and DFT are calculated, and
their mean )ˆ( 0fE and standard deviation )ˆ( 0f were obtained. The results are
shown in Figure 16 and Table 7.
a) MUSIC spectrum.
b) FFT spectrum.
Fig. 16 Spectrum estimates for a Lithuanian male vowel /u/ for 80 speech signal
realisations
Table 7 The mean and standard deviation of the fundamental frequency estimates
obtained by the MUSIC method and DFT method
Vowel
Characteristics /a/ /i/ /o/ /u/
The mean MUSICfE )ˆ( 0
112.00 114.75 108.20 107.35
The mean DFTfE )ˆ( 0
124.80 127.15 118.95 120.12
The standard deviation MUSICf )ˆ( 0 3.55 2.36 4.13 4.62
The standard deviation DFTf )ˆ( 0 5.59 4.18 4.18 5.07
We see from Table 7 that the difference between the estimated frequencies
of the vowels /o/ and /u/, however, is small – about 1 Hz (0.85 Hz for the
MUSIC, and 1.17 Hz for the DFT). The smallest standard deviation 2.36 Hz
was obtained by the MUSIC method for the vowel /i/, and the largest –
5.59 Hz – by the DFT method for the vowel /a/. It is easy to notice that the
DFT standard deviation values are higher than those of the MUSIC method for
0 100 200 300 400 500-50
-40
-30
-20
-10
0
Frequency (Hz)
Am
plit
ude (
dB
)
0 100 200 300 400 500-50
-40
-30
-20
-10
0
Frequency (Hz)
Am
plit
ude (
dB
)

4. EXPERIMENTAL RESEARCH
57
all vowels.
Since the DFT and MUSIC methods give different estimates of the
fundamental frequency, which estimate describes the real situation more
accurately have to be checked. For each vowel, a model of the sum of ten
harmonics where the first harmonic frequency was the fundamental frequency
estimate (the DFT or MUSIC) were used. The parameters of the harmonics
were estimated by a usual linear least squares method. The relative estimation
errors are shown in Table 8.
Table 8 The relative approximation error of the vowel signals by the sum of ten
harmonics using the fundamental frequency estimates obtained by the MUSIC method and
DFT method
Vowel
Error /a/ /i/ /o/ /u/
MUSICerr 37.32% 44.74 % 22.99% 8.86 %
DFTerr 78.75% 54.70% 68.33 % 37.94 %
We see from Table 8 that the errors obtained with the MUSIC
fundamental frequency estimate are smaller than those obtained with the DFT
fundamental frequency estimate. The fact that the errors are rather large can be
attributed to complexity of the real sound signals. Harmonics of such signals
are time variant, and it is very difficult to describe the signal with time
invariant frequency models.

4. EXPERIMENTAL RESEARCH
58
Fig. 17 The true and estimated speech signal of the vowel /u/ (solid line – the true
speech signal, dotted line – the estimated signal (DFT method), dash-dotted line
– the estimated signal (MUSIC method))
The true signal of the vowel /u/ and its estimates obtained by the DFT and
MUSIC methods are shown in Figure 17. The signal estimates are obtained
using a model of the sum of 10 harmonics. One can see that the MUSIC
estimate almost coincides with the true signal.
4.2. Vowels and semivowels modelling by formant and harmonic methods
The modelling for all the vowel and semivowel phonemes using 50 utterances
by female and 50 utterances by male are carried out. The synthesized sounds
obtained by the harmonic synthesis method are compared with those obtained
by the formant method. Lists of Lithuanian words used in the experiment are
presented in Table 1 of Section 2.5.1 and in Table 2 of Section 2.5.2. In order
to estimate the model quality, the average spectrum are calculated. The
comparison of the spectra of the true phoneme /a/ signal and its models is
shown in Fig. 18.
-15000
-10000-5000
05000
1000015000
20000
0 100 200 300 400 500 600 700 800 900 1000
Sample number

4. EXPERIMENTAL RESEARCH
59
Fig. 18 The spectra of the true phoneme /a/ signal and its models
Fig. 18 shows that the obtained spectra almost coincide. The audio test
revealed that the differences have no significant influence to the sound
intelligibility and quality.
The average RMSE of the estimated signal spectrum and its confidence
intervals for each of the 28 vowel and 19 semivowel phonemes are presented
in Table 9 and Table 10. The confidence intervals are stated at the 95 %
confidence level.
Table 9 The average RMSE and its confidence intervals for the estimated vowel
phoneme signal spectrum
Phoneme
Formant method case Harmonic method case
Female phoneme Male phoneme Female phoneme Male phoneme
RMSE Confidence
intervals RMSE
Confidence
intervals RMSE
Confidence
intervals RMSE
Confidence
intervals
/a/ 13.0 % [10.8, 14.8] 13.1 % [10.7, 14.9] 12.7 % [11.3, 14.6] 12.4 % [11.1, 14.5]
/a`/ 14.0 % [11.8, 15.8] 12.7 % [11.6, 14.2] 12.4 % [10.8, 13.5] 11.9 % [9.2, 13.1]
/a:/ 12.9 % [11.7, 14.1] 13.5 % [11.6, 15.6] 12.4 % [10.8, 12.9] 12.8 % [10.9, 14.1]
/a:´/ 12.9 % [10.8, 15.9] 11.6 % [10.2, 12.8] 10.4 % [9.4, 11.1] 11.3 % [10.1, 12.9]
/a:˜/ 13.7 % [12.0, 15.5] 14.9 % [11.4, 17.5] 13.5 % [11.6, 15.4] 13.8 % [11.9, 15.1]
/e/ 14.1 % [12.4, 15.7] 13.7 % [12.0, 15.5] 13.6 % [11.2, 14.9] 13.4 % [11.4, 15.1]
/e`/ 13.9 % [12.1, 15.8] 13.9 % [12.4, 15.2] 13.0 % [11.0, 14.8] 12.9 % [11.1, 14.8]
/e:/ 11.6 % [10.6, 12.7] 14.1 % [12.9, 15.8] 9.7 % [8.3, 10.8] 11.3 % [10.0, 12.5]
/e:´/ 11.3 % [10.0, 12.6] 14.8 % [14.0, 15.7] 8.5 % [7.3, 9.1] 10.9 % [9.1, 12.8]
/e:˜/ 14.2 % [12.6, 15.8] 13.8 % [12.4, 15.9] 12.1 % [11.5, 13.7] 13.1 % [11.4, 14.8]
/ė:/ 12.8 % [11.0, 14.3] 14.4 % [13.8, 15.5] 12.4 % [10.4, 14.4] 11.8 % [10.0, 13.2]
/ė:´/ 13.6 % [11.9, 15.5] 12.9 % [11.7, 14.2] 12.8 % [10.9, 14.0] 12.2 % [10.5, 13.7]
/ė:˜/ 16.8 % [16.0, 19.0] 13.5 % [12.3, 15.8] 12.5 % [10.9, 14.1] 13.0 % [11.4, 14.2]

4. EXPERIMENTAL RESEARCH
60
/i/ 13.1 % [10.7, 14.9] 14.6 % [13.8, 15.4] 13.3 % [11.5, 14.8] 12.9 % [10.8, 15.9]
/i`/ 12.8 % [11.1, 14.4] 13.2 % [10.8, 14.9] 12.4 % [10.8, 13.9] 12.1 % [9.9, 14.8]
/i:/ 13.6 % [11.9, 15.5] 12.8 % [10.7, 15.8] 12.3 % [10.8, 13.9] 12.9 % [11.3, 14.8]
/i:´/ 12.9 % [10.7, 15.9] 15.9 % [14.4, 16.5] 13.0 % [11.5, 14.2] 12.7 % [9.9, 14.3]
/i:˜/ 13.9 % [12.5, 15.2] 15.6 % [11.8, 19.3] 12.3 % [10.9, 13.8] 12.4 % [10.7, 14.8]
/o/ 11.8 % [10.8, 12.8] 14.9 % [14.1, 15.9] 11.1 % [9.7, 13.5] 10.9 % [8.9, 13.8]
/o`/ 11.7 % [10.2, 12.9] 12.8 % [10.9, 14.4] 9.2 % [8.0, 9.6] 9.9 % [8.6, 11.7]
/o:/ 14.1 % [11.8, 15.9] 13.1 % [12.7, 18.8] 12.4 % [10.4, 16.9] 12.1 % [9.8, 13.8]
/o:´/ 12.7 % [10.9, 14.2] 13.5 % [12.2, 15.7] 12.3 % [10.5, 15.9] 12.4 % [11.7, 13.7]
/o:˜/ 14.0 % [12.2, 15.3] 16.6 % [12.8, 20.3] 11.6 % [11.0, 12.4] 13.6 % [11.8, 15.0]
/u/ 13.4 % [11.6, 15.4] 14.5 % [13.7, 14.7] 13.2 % [11.3, 15.0] 14.3 % [13.8, 15.2]
/u`/ 13.5 % [11.8, 15.3] 12.9 % [12.5, 14.2] 12.5 % [10.9, 16.8] 10.3 % [9.0, 11.6]
/u:/ 14.6 % [11.2, 17.1] 14.7 % [14.0, 15.9] 13.3 % [11.9, 15.1] 14.4% [12.8, 16.2]
/u:´/ 13.5 % [11.8, 15.5] 18.1 % [17.0, 19.8] 13.2 % [12.1, 14.9] 13.7 % [11.8, 15.1]
/u:˜/ 16.4 % [14.4, 18.8] 19.6 % [18.3, 20.7] 15.4 % [12.8, 16.7] 15.8 % [14.0, 18.3]
Average 13.5 % 14.3 % 12.3 % 12.5 %
Table 10 The average RMSE and its confidence intervals for the estimated semivowel
phoneme signal spectrum
Phoneme
Formant method case Harmonic method case
Female phoneme Male phoneme Female phoneme Male phoneme
RMSE Confidence
intervals RMSE
Confidence
intervals RMSE
Confidence
intervals RMSE
Confidence
intervals
/j"/ 16.2 % [13.5, 17.4] 21.8 % [19.1, 23.2] 15.8 % [15.3 16.8] 15.9 % [14.8, 17.9]
/l/ 17.2 % [14.5, 18.4] 26.7 % [25.6, 27.6] 17.6 % [16.5, 19.6] 18.9 % [16.2, 21.2]
/l˜/ 18.5 % [17.6, 19.7] 22.6 % [20.4, 24.2] 22.4 % [21.5, 24.0] 20.5 % [19.5, 21.9]
/l"/ 25.9 % [25.5, 28.3] 27.5 % [25.7, 31.0] 24.3 % [23.1, 26.6] 25.4 % [23.6, 26.9]
/l"˜/ 25.7 % [24.6, 27.2] 17.7 % [17.0, 18.2] 23.4 % [22.4, 24.6] 19.1 % [16.9, 20.7]
/m/ 16.5 % [15.5, 18.0] 19.1 % [17.1, 20.8] 15.0 % [14.7, 15.5] 15.4 % [14.3, 17.9]
/m˜/ 17.7 % [16.0, 19.2] 18.7 % [17.6, 19.2] 11.8 % [10.3, 13.0] 12.2 % [10.5, 13.5]
/m"/ 10.9 % [7.9, 13.3] 17.9 % [16.8, 18.9] 9.1 % [7.2, 10.8] 12.1 % [9.9, 13.8]
/m"˜/ 19.7 % [17.8, 20.9] 14.4 % [11.0, 16.9] 15.7 % [14.6, 18.5] 12.9 % [10.9, 15.3]
/n/ 14.6 % [11.1, 17.1] 11.9 % [8.9, 13.9] 11.8 % [9.2, 14.0] 10.9 % [7.9, 13.4]
/n˜/ 19.1 % [16.0, 20.9] 17.6 % [16.9, 17.8] 15.5 % [12.2, 18.1] 14.8 % [11.3, 17.3]
/n"/ 23.2 % [20.6, 25.2] 16.7 % [14.7, 18.9] 16.3 % [15.0, 17.8] 14.7 % [13.6, 15.7]
/n"˜/ 25.9 % [25.2, 26.7] 22.6 % [20.8, 23.8] 21.7 % [21.1, 22.3] 18.9 % [17.7, 19.3]
/r/ 18.6 % [18.1, 18.9] 23.8 % [21.4, 26.4] 16.7 % [14.9, 17.9] 17,6 % [16.8, 18.2]
/r˜/ 22.8 % [20.1, 24.2] 25.1 % [24.7, 26.9] 18.0 % [16.9, 20.3] 19.1 % [16.9, 20.9]
/r"/ 18.7 % [18.2, 18.9] 23.3 % [21.7, 25.1] 15.1 % [12.5, 18.6] 17.2 % [15.1, 18.6]
/r"˜/ 23.0 % [21.6, 24.9] 24.1 % [23.6, 25.8] 21.1 % [18.6, 24.1] 20.9 % [19.5, 22.3]
/v/ 19.5 % [16.4, 21.2] 16.6 % [14.5, 18.9] 15.1 % [13.8, 16.4] 14.7 % [11.9, 17.0]
/v"/ 16.4 % [14.3, 18.9] 19.6 % [16.4, 21.4] 15.4 % [13.7, 16.9] 13.6 % [12.1, 15.6]
Average 19.5 % 20.4 % 16.9 % 16.5 %
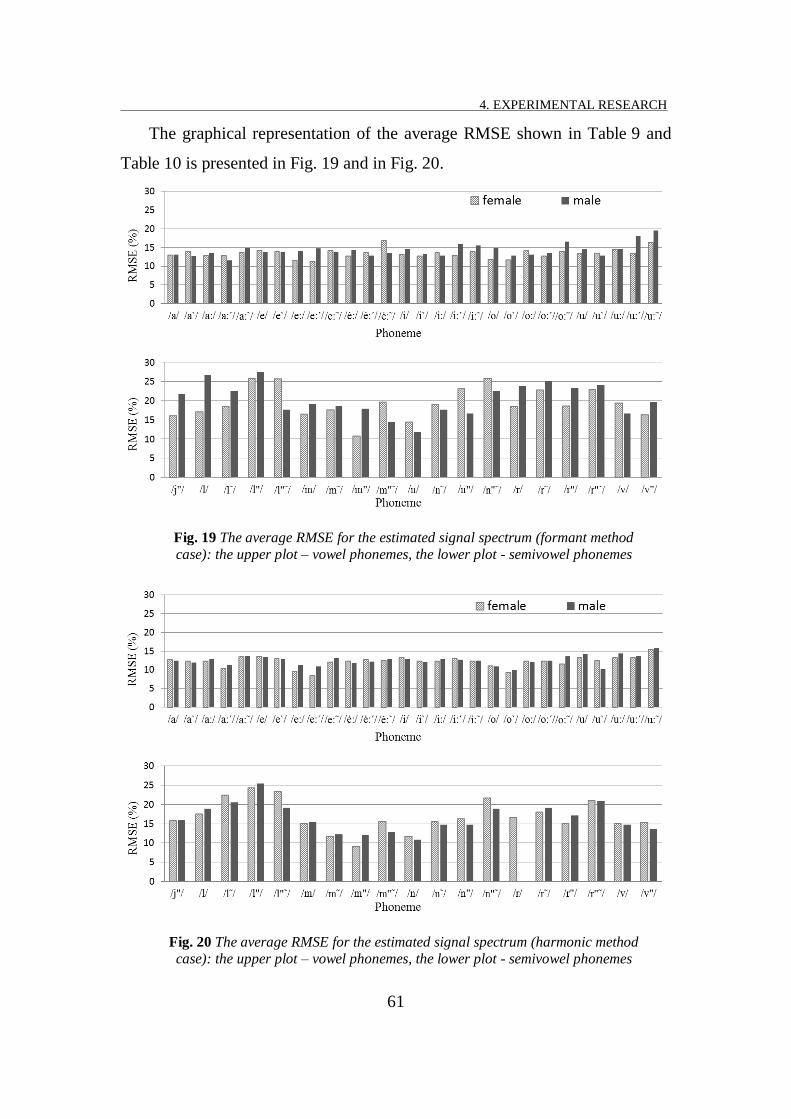
4. EXPERIMENTAL RESEARCH
61
The graphical representation of the average RMSE shown in Table 9 and
Table 10 is presented in Fig. 19 and in Fig. 20.
Fig. 19 The average RMSE for the estimated signal spectrum (formant method
case): the upper plot – vowel phonemes, the lower plot - semivowel phonemes
Fig. 20 The average RMSE for the estimated signal spectrum (harmonic method
case): the upper plot – vowel phonemes, the lower plot - semivowel phonemes

4. EXPERIMENTAL RESEARCH
62
The average RMSE for the estimated signal spectrum for all male and
female vowels is equal to 13.9 % in the formant method case and 12.4 % in the
harmonic method case. The average RMSE for the estimated signal spectrum
for all male and female semivowels is equal to 19.9 % in the formant method
case and 16.7 % in the harmonic method case.
Both the spectrum estimation errors and audio test revealed that the quality
difference between the sounds synthesized by the harmonic and formant
methods is small.
The computation complexity of the proposed algorithms has been
evaluated. The average time of the phoneme parameters estimation and
average time of the phoneme synthesis for each of the 28 vowel and 19
semivowel phonemes are presented in Table 11 and Table 12.
Table 11 The average time of the vowel phoneme parameters estimation and the vowel
phoneme synthesis (time measured in second)
Phoneme
Formant method case Harmonic method case
Female phoneme Male phoneme Female phoneme Male phoneme
Time of
parameter
estimation
Time of
synthesis
Time of
parameter
estimation
Time of
synthesis
Time of
parameter
estimation
Time of
synthesis
Time of
parameter
estimation
Time of
synthesis
/a/ 15 0.07 19 0.09 49 0.3 52 0.5
/a`/ 19 0.14 16 0.14 88 0.6 72 0.9
/a:/ 22 0.07 19 0.8 87 0.4 88 0.7
/a:´/ 32 0.08 33 0.09 72 0.3 69 0.5
/a:˜/ 19 0.16 15 0.17 64 0.5 65 0.9
/e/ 15 0.05 16 0.09 23 0.2 30 0.4
/e`/ 23 0.06 27 0.05 46 0.3 49 0.5
/e:/ 22 0.09 22 0.08 30 0.3 36 0.4
/e:´/ 25 0.12 23 0.13 45 0.6 45 0.8
/e:˜/ 30 0.08 31 0.11 46 0.4 47 0.6
/ė:/ 15 0.08 16 0.07 30 0.3 32 0.5
/ė:´/ 21 0.12 18 0.11 39 0.5 39 0.8
/ė:˜/ 19 0.11 20 0.12 51 0.5 51 0.9
/i/ 18 0.06 17 0.05 28 0.2 33 0.3
/i`/ 14 0.08 14 0.08 30 0.2 34 0.4
/i:/ 7 0.10 4 0.12 22 0.3 20 0.5

4. EXPERIMENTAL RESEARCH
63
/i:´/ 10 0.14 11 0.12 38 0.5 41 0.9
/i:˜/ 24 0.09 23 0.08 42 0.3 45 0.5
/o/ 19 0.12 21 0.11 30 0.4 32 0.6
/o`/ 20 0.13 18 0.12 56 0.5 54 0.8
/o:/ 16 0.07 18 0.07 28 0.3 28 0.5
/o:´/ 18 0.10 15 0.11 34 0.4 33 0.7
/o:˜/ 12 0.11 13 0.12 44 0.4 48 0.7
/u/ 15 0.04 17 0.08 32 0.2 35 0.4
/u`/ 25 0.06 27 0.07 31 0.3 30 0.5
/u:/ 11 0.07 9 0.06 27 0.2 26 0.3
/u:´/ 15 0.08 18 0.07 31 0.4 31 0.6
/u:˜/ 18 0.08 15 0.08 37 0.4 36 0.6
Table 12 The average time of the semivowel phoneme parameters estimation and the
semivowel phoneme synthesis (time measured in second)
Phoneme
Formant method case Harmonic method case
Female phoneme Male phoneme Female phoneme Male phoneme
Time of
parameter
estimation
Time of
synthesis
Time of
parameter
estimation
Time of
synthesis
Time of
parameter
estimation
Time of
synthesis
Time of
parameter
estimation
Time of
synthesis
/j"/ 9 0.10 8 0.11 20 0.3 21 0.5
/l/ 11 0.04 12 0.04 33 0.1 31 0.2
/l˜/ 8 0.05 9 0.06 25 0.1 24 0.2
/l"/ 12 0.02 12 0.04 37 0.1 24 0.2
/l"˜/ 13 0.03 15 0.04 29 0.2 31 0.3
/m/ 8 0.04 8 0.04 26 0.2 29 0.4
/m˜/ 11 0.11 8 0.12 29 0.6 30 0.8
/m"/ 8 0.06 12 0.06 21 0.3 19 0.5
/m"˜/ 16 0.12 14 0.11 39 0.6 43 0.8
/n/ 13 0.08 14 0.07 29 0.4 29 0.6
/n˜/ 17 0.14 22 0.13 47 0.7 30 1.1
/n"/ 8 0.07 14 0.06 22 0.4 36 0.7
/n"˜/ 10 0.03 14 0.05 33 0.2 22 0.3
/r/ 16 0.08 12 0.09 34 0.4 26 0.5
/r˜/ 14 0.06 14 0.06 29 0.3 30 0.5
/r"/ 15 0.04 14 0.04 29 0.1 31 0.1
/r"˜/ 18 0.05 22 0.06 31 0.2 30 0.2
/v/ 11 0.08 14 0.08 23 0.4 37 0.6
/v"/ 12 0.06 14 0.05 24 0.3 36 0.5
The average time of the phoneme parameter estimation for all the male and
female vowels and semivowels is equal to 16.1 s in the formant method case

4. EXPERIMENTAL RESEARCH
64
and 37.2 s in the harmonic method case. The average time of the phoneme
synthesis for all the male and female vowels and semivowels is equal to 0.09 s
in the formant method case and 0.44 s in the harmonic method case.
4.3. Diphthong modelling
A part of utterance of the Lithuanian word “laimė” („happiness“)
corresponding to the compound diphthong /ai/ is considered. The duration of
this part was 0.47 s. Let ),...,,( 21 Nyyyy be equidistant samples of the
diphthong /ai/ where N = 0.47 48 000 = 22 560 samples. These samples are
shown in Fig. 21. It is not difficult to see that this discrete signal exhibits a
relative periodicity. One can count 44 periods in total. The first periods belong
to the vowel /a/, the last – to the vowel /i/. The middle periods represent
transition from the first vowel to the second one.
Fig. 21 The samples of a discretized version of the diphthong “ai” of the
Lithuanian word “laimė”
Two periods corresponding to the vowel /a/ and the vowel /i/ are select. The
selected periods are called pitches. The pitch corresponding to the vowel /a/ is
the 10-th period of the diphthong /ai/, and the pitch corresponding to the vowel
/i/ is the 38-th period. These pitches are shown in Fig. 22.
Time [ms]
Am
pli
tude
[unit
s]

4. EXPERIMENTAL RESEARCH
65
a) b)
Fig. 22 The pitch corresponding a) to the vowel /a/ and b) to the vowel /i/
One can see that the pitch corresponding to the vowel /a/ has four “teeth”
while the pitch of the vowel /i/ has two shorter “teeth”.
The magnitude responses of the vowels /a/ and /i/ are presented in Fig. 23.
Fig. 23 The magnitude response of the vowels “a” and “i”
In the frequency range of 700-950 Hz, the magnitude of the vowel /i/
decreases almost ten times, i. e. by 20 dB. That is a distinctive feature of this
vowel. Another distinctive feature is a peak in the range of 950-1100 Hz.
After analysing the magnitude responses of the vowels /a/ and /i/, we
selected 19 formant intervals (regions) for the vowel /a/, and 21 intervals for
the vowel /i/. The procedure of selection of these intervals is as follows: first,
we choose a peak of the magnitude response and go down along this response
to the left from the peak until we reach the nearest local minimum. The
frequency corresponding to this minimum is the start point of the formant
Time [s]
Am
pli
tude
[unit
s]
0.1012 0.0907
Time [s]
Am
pli
tude
[unit
s]
0.4073 0.3962
Frequency [Hz]
Mag
nit
ud
e [d
B]

4. EXPERIMENTAL RESEARCH
66
interval. The end point is obtained analogously going down to the right from
the peak. The formant intervals for the vowels /a/ and /i/ are shown in
Table 13.
In each of these intervals we carried out the inverse Fourier transform. We
obtained 21 signals of length 504 points for the vowel /a/, and 19 signals of
length 532 points for the vowel /i/. For each of these signals, we estimated
parameters of the quasipolynomial model (25). Estimation was done using
parameter estimation algorithm described in Section 3.4.
Table 13 Formant intervals for the vowels /a/ and /i/
Interval
number
Formant intervals for the
vowel /a/
Formant intervals for the
vowel /i/
1
2
3
4
5
6
7
8
9
10
11
12
13
14
15
16
17
18
19
20
21
30 – 200 Hz
201 – 265 Hz
266 – 380 Hz
381– 600 Hz
601 – 740 Hz
741– 885 Hz
886 – 1000 Hz
1001–1105 Hz
1106 – 1220 Hz
1221– 1430 Hz
1431 – 1550 Hz
1551 – 1650 Hz
1651 – 1785 Hz
1786 – 1890 Hz
1891 – 2075 Hz
2076 – 2180 Hz
2181 – 2300 Hz
2301 – 2445 Hz
2446 – 2600 Hz
2601 – 2675 Hz
2676 – 2820 Hz
30 – 180 Hz
181 – 440 Hz
441 – 545 Hz
546 – 645 Hz
646 – 760 Hz
761– 870 Hz
871 – 990 Hz
991 – 1170 Hz
1171 – 1300 Hz
1301– 1475 Hz
1476 – 1650 Hz
1651 – 1770 Hz
1771 – 1885 Hz
1886 – 2020 Hz
2021 – 2190 Hz
2191 – 2285 Hz
2286 – 2410 Hz
2411 – 2590 Hz
2591 – 2810 Hz
The procedure of the quasipolynomial model obtaining from the data of a
single formant interval will be described in more detail. Consider the 3-rd

4. EXPERIMENTAL RESEARCH
67
formant interval of the vowel /a/. First, the initial estimates of the damping
factor and angular frequency: -0.020 , 0 0.046 [rad/sample] are selected.
These estimates in the iterative procedure described by (54) where T],[ θ
are used. This procedure is repeated until the number of iterations is less than
100 or the estimation error is less than 0.5. The following estimates
-0.0095 , 0.044 [rad/sample] are obtained.
The model and the data for the 3-rd formant interval are shown in Fig. 24.
Fig. 24 The data and estimated model for the 3-rd formant interval
The root-mean-square estimation error is equal to 3.93 %.
Quasipolynomial parameters of the vowels /a/ and /i/ for all the formant
intervals are presented in Table 14 and Table 15, respectively.
Table 14 Formant parameters of the vowels /a/
Formant
number
k
Frequency
[Hz]
kf
Damping
[unit]
k
Amplitude1
[unit]
kA1
Amplitude2
[unit/s]
kA2
Amplitude3
[unit/s2]
kA3
Phase1
[rad]
k1
Phase2
[rad]
k2
Phase3
[rad]
k3
1 73 -932 2481720 24388 77.88 -0.001 -1.784 2.572
2 235 -334 2184.06 9.29 0.09 1.229 2.001 1.027
3 339 -458 3460.81 17.09 0.36 0.213 0.946 -0.189
4 468 -572 3308.13 91.00 2.44 -3.001 0.324 -2.858
5 659 -491 1032.77 6.11 0.32 -0.386 -2.310 -0.346
6 786 -451 1053.00 9.85 0.15 2.365 1.927 -3.036
7 925 -365 294.06 1.87 0.02 0.818 0.367 0.664
8 1056 -335 50.62 0.51 0.01 -2.358 -1.926 -1.929
Am
pli
tude
[unit
s]
Index

4. EXPERIMENTAL RESEARCH
68
9 1195 -371 239.50 1.92 0.01 2.856 2.984 2.003
10 1381 -607 260.03 17.23 0.24 -0.830 0.689 -1.425
11 1466 -418 477.75 3.91 0.04 2.719 2.387 -2.824
12 1590 -382 190.98 1.16 0.01 1.223 0.902 1.131
13 1699 -434 62.46 0.42 0.01 -0.656 -1.854 -0.888
14 1845 -390 78.45 0.44 0.00 2.435 2.607 2.526
15 1983 -578 101.14 0.47 0.04 0.739 2.727 0.397
16 2115 -344 52.12 0.36 0.00 2.815 2.932 -2.553
17 2252 -443 70.47 0.46 0.01 1.788 1.928 1.335
18 2375 -508 45.18 0.14 0.02 -0.403 0.672 -0.724
19 2513 -578 82.48 0.44 0.02 2.466 1.294 2.802
20 2628 -960 48.34 1.69 0.04 0.822 -2.103 0.937
21 2752 -476 36.67 0.20 0.01 -0.548 -0.189 -1.058
Table 15 Formant parameters of the vowels /i/
Formant
number
k
Frequency
[Hz]
kf
Damping
[unit]
k
Amplitude1
[unit]
kA1
Amplitude2
[unit/s]
kA2
Amplitude3
[unit/s2]
kA3
Phase1
[rad]
k1
Phase2
[rad]
k2
Phase3
[rad]
k3
1 96 -753 293950 3968.39 16.29 -0.008 -1.927 2.323
2 258 -695 8874.42 268.77 3.40 0.188 -2.751 0.639
3 476 -430 357.74 2.55 0.03 1.716 1.302 2.474
4 580 -404 234.94 1.61 0.01 0.830 0.621 1.377
5 692 -394 135.78 0.68 0.01 0.012 -0.250 -0.115
6 817 -352 23.64 0.20 0.00 2.951 -2.872 -2.826
7 951 -397 199.66 1.38 0.01 1.605 1.896 1.152
8 1070 -546 204.68 2.30 0.10 -0.628 2.756 -0.891
9 1242 -502 171.85 0.73 0.03 2.011 2.354 1.646
10 1422 -628 182.92 6.47 0.11 -1.621 -0.215 -2.301
11 1529 -563 162.86 5.64 0.10 1.546 -0.042 2.061
12 1682 -423 84.11 0.75 0.01 -1.283 -1.955 -0.844
13 1836 -411 51.27 0.25 0.01 2.372 2.720 2.427
14 1955 -441 54.94 0.13 0.01 -0.129 0.654 -0.499
15 2092 -575 65.85 0.58 0.02 2.187 0.704 2.645
16 2237 -410 33.13 0.19 0.00 0.520 0.420 0.246
17 2350 -499 31.86 0.12 0.01 -1.543 -1.371 -1.560
18 2466 -627 40.69 0.95 0.02 2.087 0.763 2.789
19 2700 -514 10.69 0.57 0.02 -1.638 0.304 -2.517
With a help of the obtained parameters, we got 21 quasipolynomial models
for the vowel /a/, and 19 quasipolynomial models for the vowel /i/. The plots of
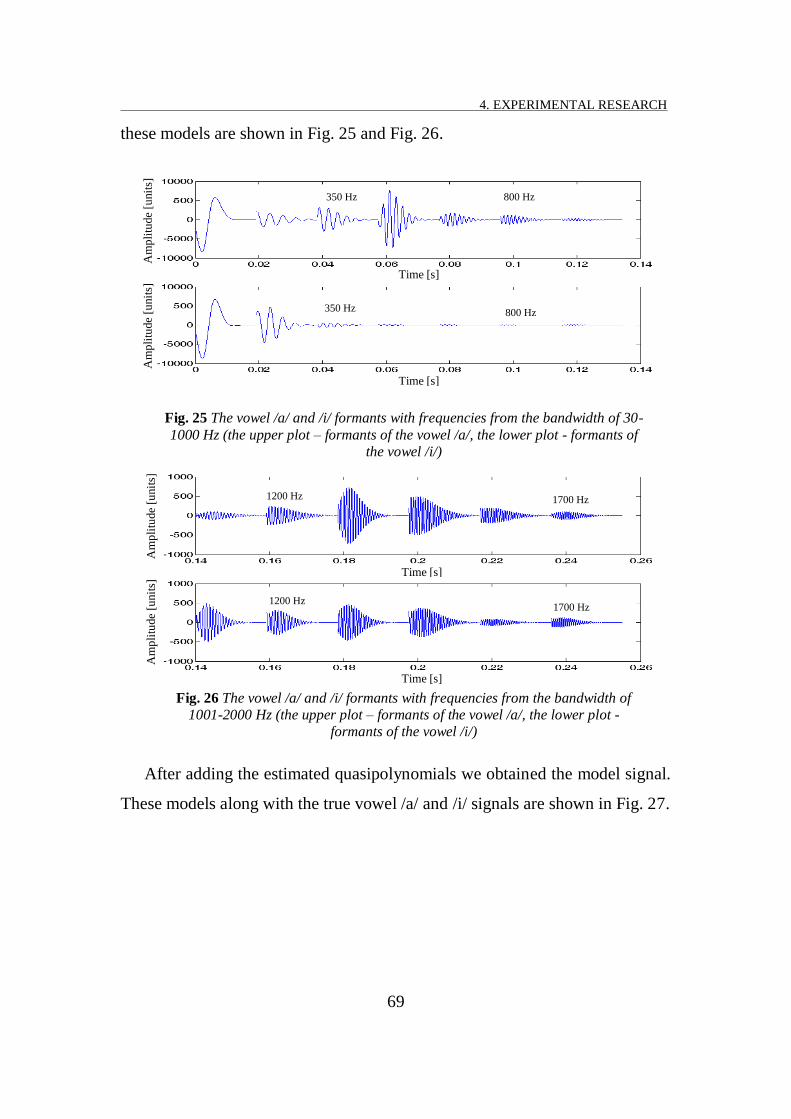
4. EXPERIMENTAL RESEARCH
69
these models are shown in Fig. 25 and Fig. 26.
Fig. 25 The vowel /a/ and /i/ formants with frequencies from the bandwidth of 30-
1000 Hz (the upper plot – formants of the vowel /a/, the lower plot - formants of
the vowel /i/)
Fig. 26 The vowel /a/ and /i/ formants with frequencies from the bandwidth of
1001-2000 Hz (the upper plot – formants of the vowel /a/, the lower plot -
formants of the vowel /i/)
After adding the estimated quasipolynomials we obtained the model signal.
These models along with the true vowel /a/ and /i/ signals are shown in Fig. 27.
350 Hz 800 Hz
350 Hz 800 Hz
Time [s]
Time [s]
Am
pli
tude
[unit
s]
Am
pli
tude
[unit
s]
Time [s]
Time [s]
Am
pli
tude
[unit
s]
Am
pli
tude
[unit
s]
1200 Hz 1700 Hz
1200 Hz 1700 Hz

4. EXPERIMENTAL RESEARCH
70
Fig. 27 The true and estimated signal for the 3-rd formant interval
The vowel /a/ root-mean-square estimation error is equal to 4.69 %, and
this error for the vowel /i/ is equal to 5.22 %.
In order to get the system input impulse amplitudes, the Fourier transform
of the diphthong /ai/ was calculated. This transform was then filtered in the
intervals shown in Table 13. After filtering, we obtained 21 signals for the
vowel /a/ and 19 signals for the vowel /i/ in these intervals. For each of the
obtained signals, the inverse Fourier transform is computed and signals in the
time domain whose length was 22 560 each is got. Then the local maxima of
each of these signals are searched and in columns of two matrices
corresponding to the vowels /a/ and /i/ are stored. The values of these columns
are shown in Fig. 28.
Fig. 28 The input impulse amplitudes (the left figure – for the vowel /a/, the right
figure – for the vowel /i/)
Am
pli
tude
[unit
s]
Index
Am
pli
tude
[unit
s]
Index
Am
pli
tude
[unit
s]
Time [s]
Am
pli
tude
[unit
s]
Time [s]
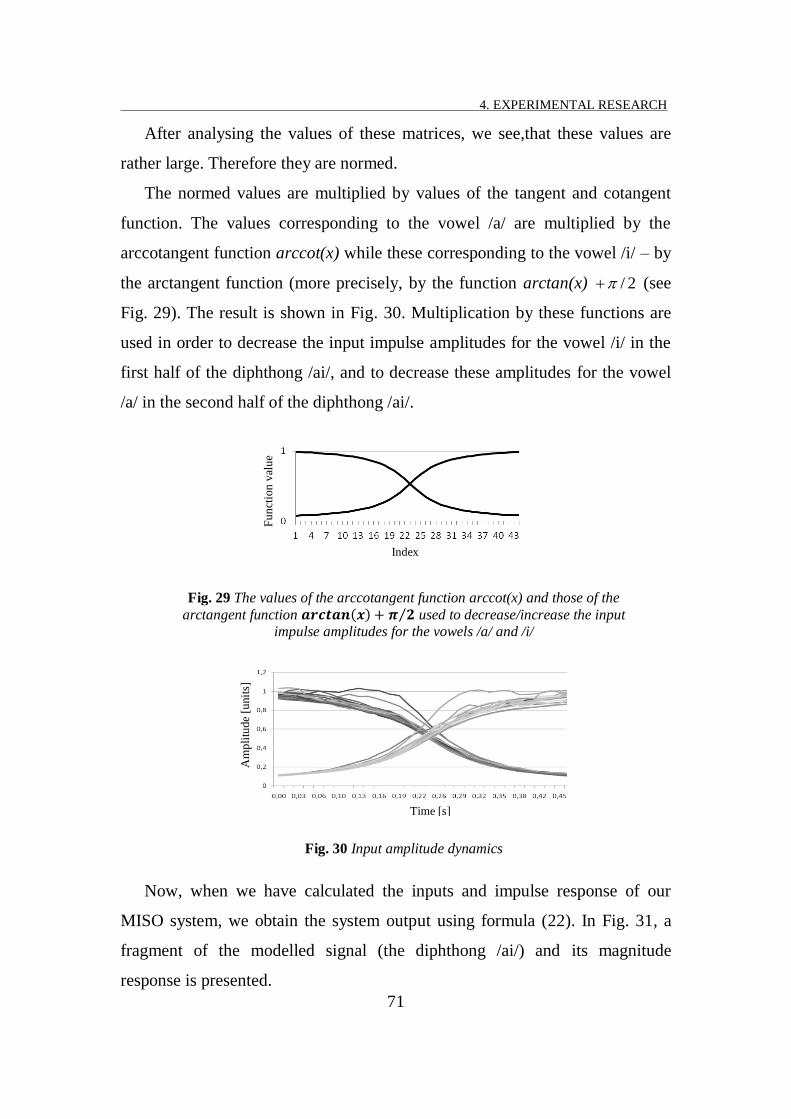
4. EXPERIMENTAL RESEARCH
71
After analysing the values of these matrices, we see,that these values are
rather large. Therefore they are normed.
The normed values are multiplied by values of the tangent and cotangent
function. The values corresponding to the vowel /a/ are multiplied by the
arccotangent function arccot(x) while these corresponding to the vowel /i/ – by
the arctangent function (more precisely, by the function arctan(x) 2/ (see
Fig. 29). The result is shown in Fig. 30. Multiplication by these functions are
used in order to decrease the input impulse amplitudes for the vowel /i/ in the
first half of the diphthong /ai/, and to decrease these amplitudes for the vowel
/a/ in the second half of the diphthong /ai/.
Fig. 29 The values of the arccotangent function arccot(x) and those of the
arctangent function ⁄ used to decrease/increase the input
impulse amplitudes for the vowels /a/ and /i/
Fig. 30 Input amplitude dynamics
Now, when we have calculated the inputs and impulse response of our
MISO system, we obtain the system output using formula (22). In Fig. 31, a
fragment of the modelled signal (the diphthong /ai/) and its magnitude
response is presented.
Fu
nct
ion
val
ue
Index
Time [s]
Am
pli
tude
[unit
s]
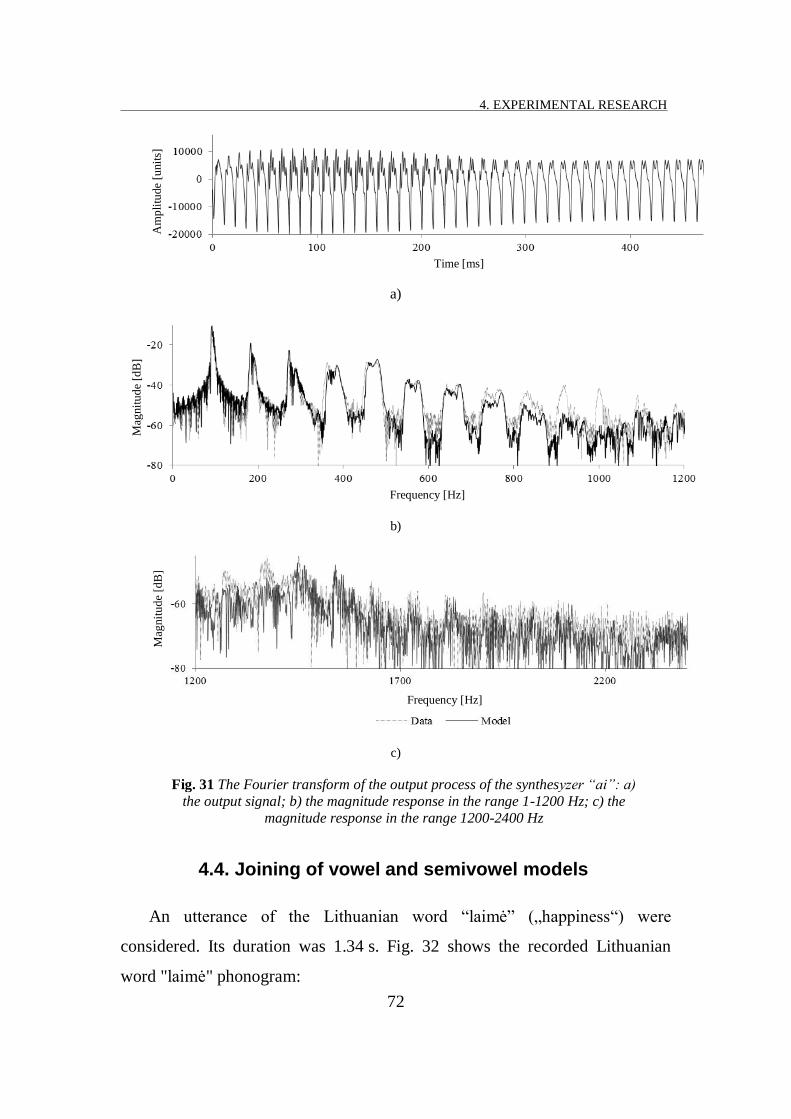
4. EXPERIMENTAL RESEARCH
72
a)
b)
c)
Fig. 31 The Fourier transform of the output process of the synthesyzer “ai” a)
the output signal; b) the magnitude response in the range 1-1200 Hz; c) the
magnitude response in the range 1200-2400 Hz
4.4. Joining of vowel and semivowel models
An utterance of the Lithuanian word “laimė” („happiness“) were
considered. Its duration was 1.34 s. Fig. 32 shows the recorded Lithuanian
word "laimė" phonogram:
Time [ms]
Am
pli
tude
[unit
s]
Mag
nit
ud
e [d
B]
Frequency [Hz]
Frequency [Hz]
Mag
nit
ud
e [d
B]

4. EXPERIMENTAL RESEARCH
73
Fig. 32 The recorded Lithuanian word "laimė"
A MISO system is used for this word modelling. The input number is
equal to the number of phonemes in a word multiplied by the number of
formants of the uttered letter. Denote by the number of phonemes of the
synthesized word, and by the number of formants of the uttered l-th letter.
Each channel is modelled by a single input and single output linear dynamic
system having a complex root of multiplicity 3 with an appropriate frequency
and damping factor. The impulse response of the channel with the index ,
, is modelled by a formant that is described by a second
degree quasipolynomial:
(74)
where kl is the damping factor, - the resonant frequency, , , -
amplitudes, , , - phases, - sampling frequency. In (1),
stands for continuous time. Introducing the repeated roots, corresponding to
formant quasipolynomials allows, us to get more natural sounds. Each formant
of the uttered letter corresponds to a resonance of its magnitude response.
A discrete-time synthesizer with the sampling interval dft 1 is used.
Denote by )()( tifih klkl , 1...,,2,1,0 Ni , the unit response of the kl -th
channel, by )(nukl the input sequence of the k-th channel of the l-th sound. Note
Am
pli
tude
[unit
]
Time [s]

4. EXPERIMENTAL RESEARCH
74
that
otherwisenx
MMMMMMnnu
kl
kl),(
,,,,0)(
321211
(75)
where 0)( nxkl are real bounded numbers, ,,
21MM is the number of
samples of the fundamental frequency periods. Then the output of the
synthesized system is represented by the convolution equation:
L
l
K
k
N
i
klkl
l
ihinuny
1 1 0
)()()( (76)
.
A synthesizer scheme is shown in Fig. 33.
Fig. 33 The synthesizer scheme of the word "laimė"
In fact, we use the parallel connection of both the phoneme level and
formant level. Excitation signals are inputted successively for each uttered
phoneme using overlapping in the transition regions.
Fig. 33 shows that, in order to make the synthesizer, we need to know the
formant parameters. Using them, we can get the unit responses of the channels
and determine the input sequences. For evaluation of these unknown values,
we use the uttered words recorded in computer (see Fig. 32).
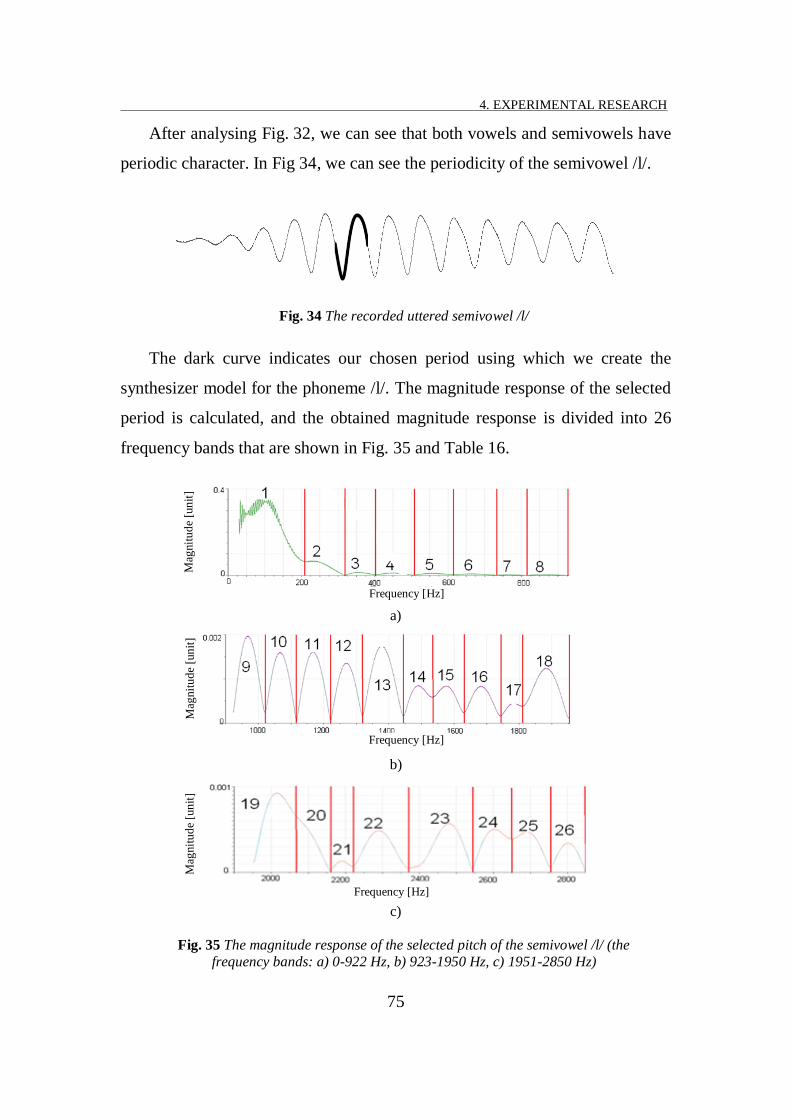
4. EXPERIMENTAL RESEARCH
75
After analysing Fig. 32, we can see that both vowels and semivowels have
periodic character. In Fig 34, we can see the periodicity of the semivowel /l/.
Fig. 34 The recorded uttered semivowel /l/
The dark curve indicates our chosen period using which we create the
synthesizer model for the phoneme /l/. The magnitude response of the selected
period is calculated, and the obtained magnitude response is divided into 26
frequency bands that are shown in Fig. 35 and Table 16.
a)
b)
c)
Fig. 35 The magnitude response of the selected pitch of the semivowel /l/ (the
frequency bands: a) 0-922 Hz, b) 923-1950 Hz, c) 1951-2850 Hz)
Mag
nit
ud
e [u
nit
] M
agnit
ud
e [u
nit
] M
agnit
ud
e [u
nit
]
Frequency [Hz]
Frequency [Hz]
Frequency [Hz]
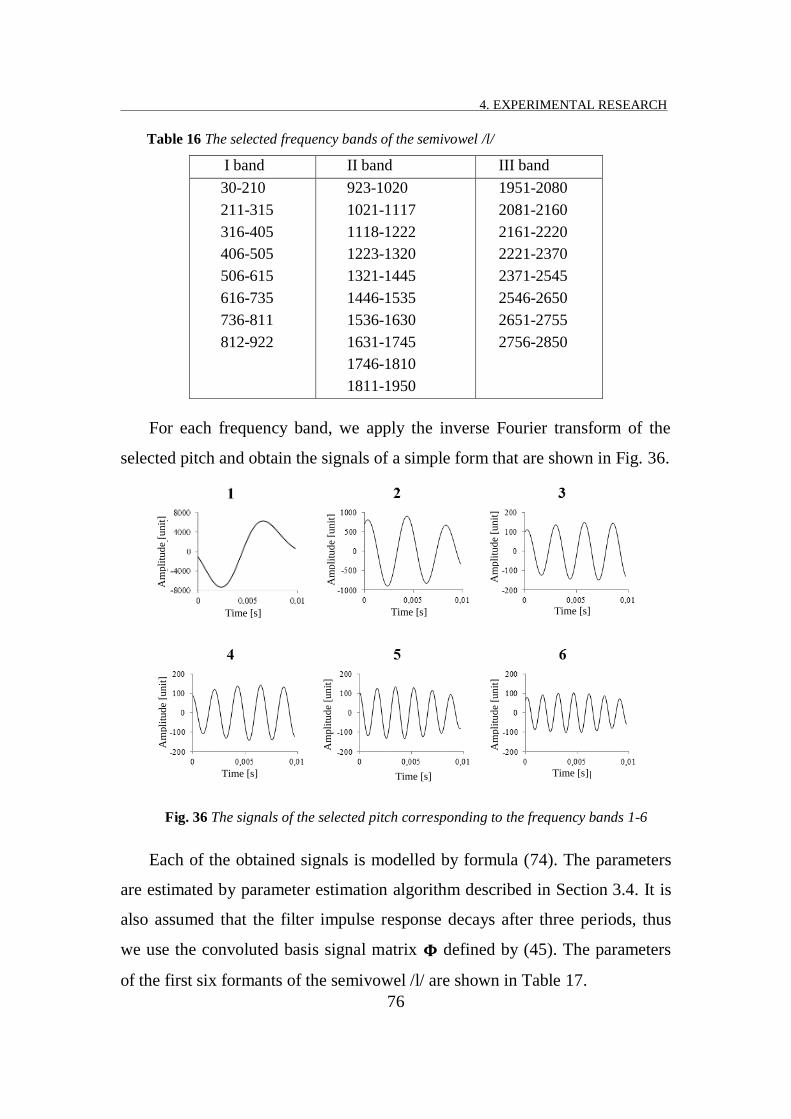
4. EXPERIMENTAL RESEARCH
76
Table 16 The selected frequency bands of the semivowel /l/
I band II band III band
30-210
211-315
316-405
406-505
506-615
616-735
736-811
812-922
923-1020
1021-1117
1118-1222
1223-1320
1321-1445
1446-1535
1536-1630
1631-1745
1746-1810
1811-1950
1951-2080
2081-2160
2161-2220
2221-2370
2371-2545
2546-2650
2651-2755
2756-2850
For each frequency band, we apply the inverse Fourier transform of the
selected pitch and obtain the signals of a simple form that are shown in Fig. 36.
Fig. 36 The signals of the selected pitch corresponding to the frequency bands 1-6
Each of the obtained signals is modelled by formula (74). The parameters
are estimated by parameter estimation algorithm described in Section 3.4. It is
also assumed that the filter impulse response decays after three periods, thus
we use the convoluted basis signal matrix defined by (45). The parameters
of the first six formants of the semivowel /l/ are shown in Table 17.
Time [s]
Am
pli
tude
[unit
]
Time [s]
Am
pli
tude
[unit
] A
mpli
tude [
unit
]
Time [s]
Am
pli
tude
[unit
]
Time [s]
Am
pli
tude
[unit
]
Time [s]
Am
pli
tude
[unit
]
Time [s]

4. EXPERIMENTAL RESEARCH
77
Table 17 The formant parameters for the semivowel /l/
104 -676 109266 1649 7,8 0 -1,9 2,3
249 -304 1329 7 0,04 0,9 0,9 1,1
362 -377 235 0,52 0,02 1,1 -3,0 0,9
451 -309 223 0,55 0,01 1,8 1,2 2,0
555 -307 196 1,07 0,01 1,9 1,9 2,3
674 -308 146 0,82 0,01 1,1 1,0 0,4
After calculating the parameters, the error is evaluated. Three unit
impulses are input and we get the pitch model that we compare with the real
signal pitch. The true and estimated signal pitches are shown in Fig. 37.
Fig. 37 The true and estimated signal pitches
The root-mean-square error (RMSE) for the semivowel /l/ is equal to
0.90 %. For every phoneme, its characteristic pitch is selected and its
parameters are calculated. The parameter estimation accuracy is shown in
Table 18.
Table 18 The formant parameter estimation error
Phone e RMSE
/l/ 0.90 %
/a/ 4.69 %
/i/ 3.84 %
/m/ 1.47 %
/ė/ 0.66 %
/e/ 2.00 %
/ę/ 2.98 %
/j/ 0.46 %
*real signal pitch
–the pitch model
Am
pli
tude
[unit
]
Time [index]
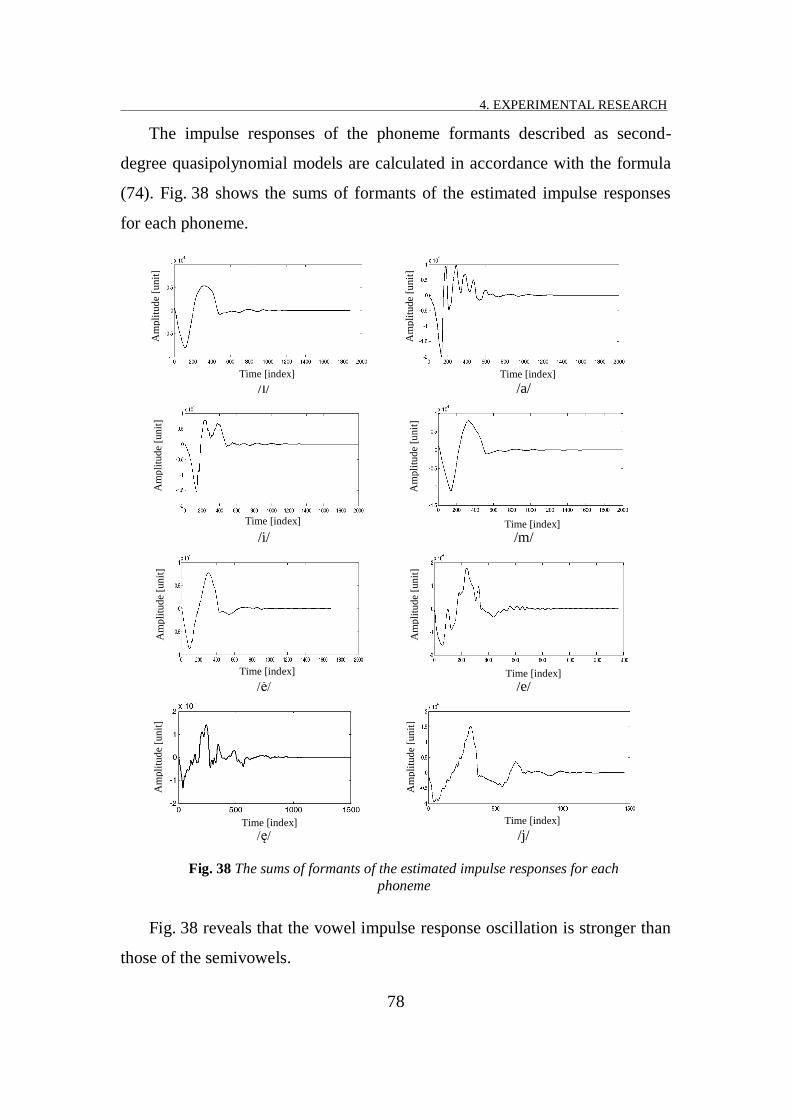
4. EXPERIMENTAL RESEARCH
78
The impulse responses of the phoneme formants described as second-
degree quasipolynomial models are calculated in accordance with the formula
(74). Fig. 38 shows the sums of formants of the estimated impulse responses
for each phoneme.
/l/ /a/
/i/ /m/
/ė/ /e/
/ę/ /j/
Fig. 38 The sums of formants of the estimated impulse responses for each
phoneme
Fig. 38 reveals that the vowel impulse response oscillation is stronger than
those of the semivowels.
Am
pli
tude
[unit
]
Time [index] Time [index]
Time [index]
Time [index]
Time [index]
Time [index]
Time [index]
Time [index]
Am
pli
tude
[unit
]
Am
pli
tude
[unit
]
Am
pli
tude
[unit
]
Am
pli
tude
[unit
]
Am
pli
tude
[unit
]
Am
pli
tude
[unit
]
Am
pli
tude
[unit
]

4. EXPERIMENTAL RESEARCH
79
Now a problem arises: what inputs have to be given. First of all, the
fundamental frequency of the word "laimė" is estimated. For this goal, the
signal of the word "laimė" is filtered using a rectangle narrowband filter (80-
140 Hz). The filtering is done with the help of the inverse Fourier transform.
After obtaining the signal zeroes, the durations of the fundamental frequency
periods are calculated. The fundamental frequency is calculated by the
following formula:
, (77)
where is the length of the i-th pitch.
The trajectories of the fundamental frequency of all the cases of the word
"laimė" are shown in Fig. 39.
Fig. 39 The trajectories of the fundamental frequency of the word "laimė" and its
cases
The trend formulas for the fundamental frequency of the word "laimė" and
its cases are presented below:
– (78)
where – the fundamental frequency (in our case );
; } – independent Gaussian random variables with zero
mean and variance .

4. EXPERIMENTAL RESEARCH
80
Fig. 40 The trajectories of the fundamental frequency of the word "laimė"
synthesizer
The simplest synthesizer excitation scenario is to give unit impulses into
all the inputs consequently, i. e. in the beginning, into the phoneme /l/
synthesizer, then into the phoneme /a/ synthesizer, and so on. Our
investigation, however, revealed that the phoneme pitches are of different
length and the pitch amplitudes differ. Moreover, there exist transitions
between phonemes.
The fundamental frequency can help to determine the time instants when it
is necessary to give inputs. We need to know what input must be given for
each formant of each phoneme.
For this purpose the recorded signal is filtered by rectangular filters whose
bands are specified by formants of the investigated phoneme. The output
signals of these filters are divided into periods.
An example of signal filtering with a narrowband filter is presented in
Fig. 41.
a)

4. EXPERIMENTAL RESEARCH
81
b)
Fig. 41 Extraction of the 4th formant of the phoneme a a) the word "laimė" and
the 4th formant (dark part), b) the 4-th formant in enlarged time scale
After filtering the whole sound in the frequency bands corresponding to
phonemes and calculating the maximums, we obtain the input signals. The
maximum values of the word "laimė" received when splitting the spectrum
according to the formants of the phoneme /a/ are shown in Fig.42.
Fig. 42 Filtering results of the word "laimė" in the frequency bands
corresponding to the phoneme /a/ formants
In the same way, the sound signal „laimė” using rectangular filters is
filtered in the bands corresponding to formants, and transitions are created
between sounds using the parabola curve. As an example, parabola curve for
input calculation of the phoneme /ė/ is applied. Fig. 43 shows in the sequence
of phonemes input.
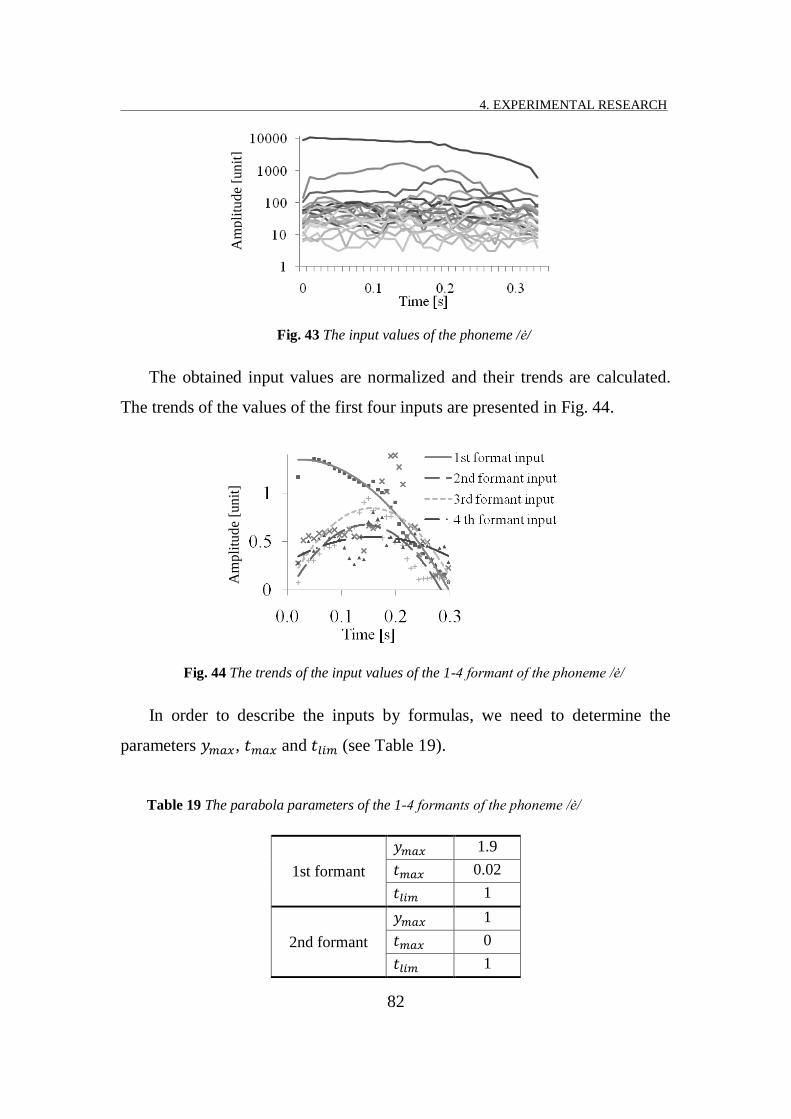
4. EXPERIMENTAL RESEARCH
82
Fig. 43 The input values of the phoneme /ė/
The obtained input values are normalized and their trends are calculated.
The trends of the values of the first four inputs are presented in Fig. 44.
Fig. 44 The trends of the input values of the 1-4 formant of the phoneme ė
In order to describe the inputs by formulas, we need to determine the
parameters , and (see Table 19).
Table 19 The parabola parameters of the 1-4 formants of the phoneme ė
1st formant
1.9
0.02
1
2nd formant
1
0
1
Am
pli
tud
e [u
nit
] A
mp
litu
de
[un
it]
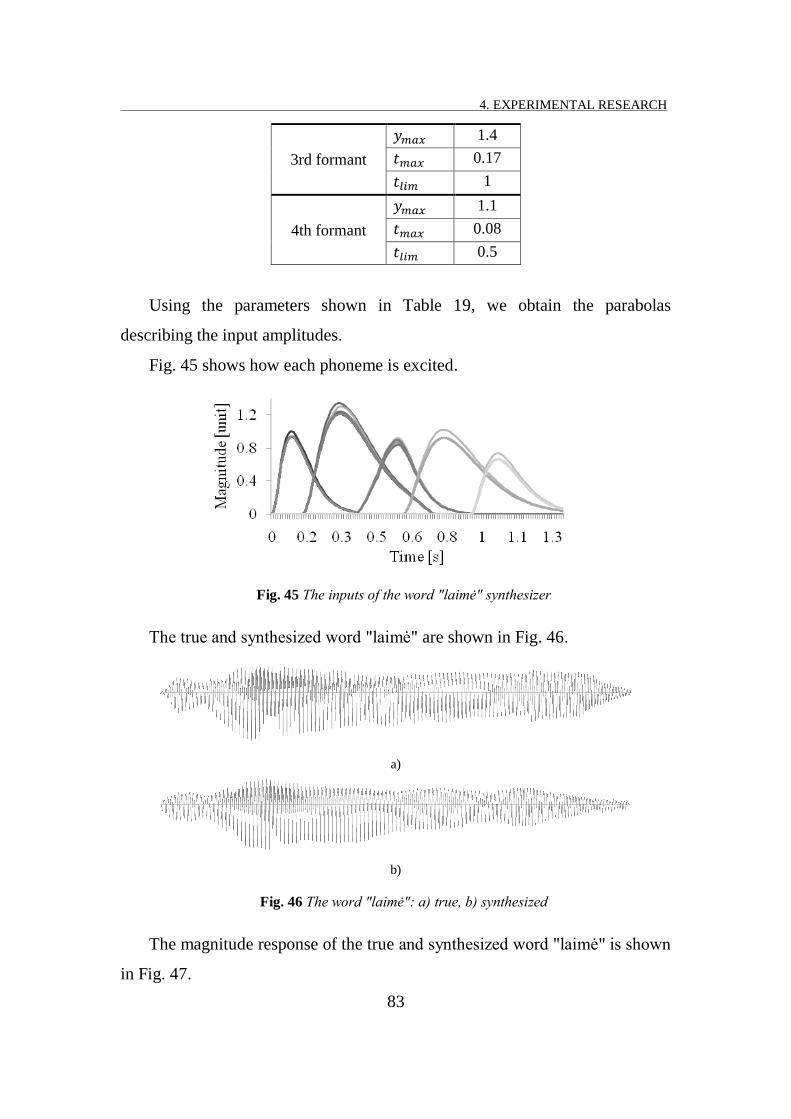
4. EXPERIMENTAL RESEARCH
83
3rd formant
1.4
0.17
1
4th formant
1.1
0.08
0.5
Using the parameters shown in Table 19, we obtain the parabolas
describing the input amplitudes.
Fig. 45 shows how each phoneme is excited.
Fig. 45 The inputs of the word "laimė" synthesizer
The true and synthesized word "laimė" are shown in Fig. 46.
a)
b)
Fig. 46 The word "laimė" a) true, b) synthesized
The magnitude response of the true and synthesized word "laimė" is shown
in Fig. 47.
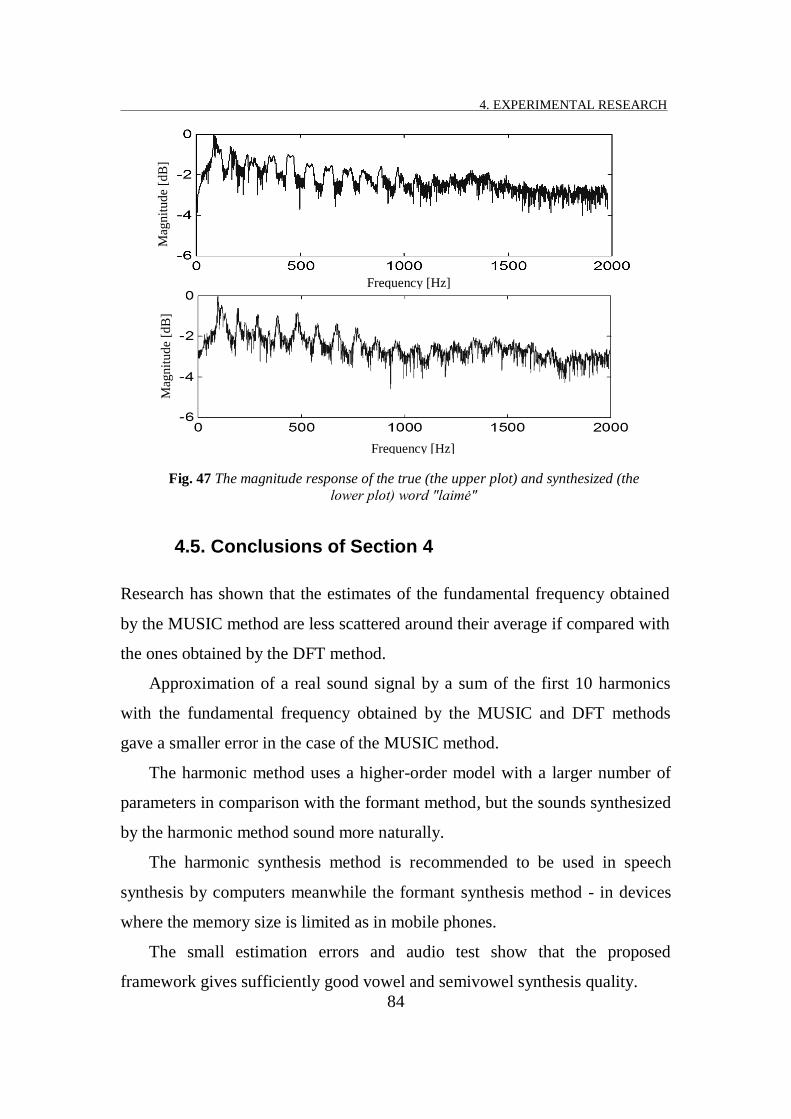
4. EXPERIMENTAL RESEARCH
84
Fig. 47 The magnitude response of the true (the upper plot) and synthesized (the
lower plot) word "laimė"
4.5. Conclusions of Section 4
Research has shown that the estimates of the fundamental frequency obtained
by the MUSIC method are less scattered around their average if compared with
the ones obtained by the DFT method.
Approximation of a real sound signal by a sum of the first 10 harmonics
with the fundamental frequency obtained by the MUSIC and DFT methods
gave a smaller error in the case of the MUSIC method.
The harmonic method uses a higher-order model with a larger number of
parameters in comparison with the formant method, but the sounds synthesized
by the harmonic method sound more naturally.
The harmonic synthesis method is recommended to be used in speech
synthesis by computers meanwhile the formant synthesis method - in devices
where the memory size is limited as in mobile phones.
The small estimation errors and audio test show that the proposed
framework gives sufficiently good vowel and semivowel synthesis quality.
Mag
nit
ude
[dB
]
Frequency [Hz]
Mag
nit
ude
[dB
]
Frequency [Hz]

4. EXPERIMENTAL RESEARCH
85
Calculations have shown that the parameter estimation method is stable for
all the considered sounds.
The accuracy of diphthong modelling was high. It was almost impossible
to distinguish between real and simulated diphthongs in various Lithuanian
words with a help of audiotesting. Only the magnitude response of the whole
signal of the simulated diphthong differed a little from the magnitude response
of the recorded data in some frequency regions.
During the simulation of input sequences, special attention was paid to the
transitions between phonemes. The input sequence of each phoneme has been
described by three parabolas.
Simulation has revealed that the word consisting of vowels and
semivowels obtained with the proposed synthesis method is good enough and
it is difficult to distinguish it from the real one. The quality of the synthesized
sound was significantly improved due to input transitions.
The method proposed can be applied to the words composed of vowels and
semivowels.


87
87
5
5. Conclusions
The research object of the dissertation is Lithuanian vowel and semivowel
phoneme models. In order to develop models for vowels and semivowels, the
main characteristics of these sounds have been identified. A phoneme synthesis
framework that is based on a vowel and semivowel phoneme mathematical
model and an automatic procedure of estimation of the phoneme fundamental
frequency and input determining has been proposed. Within this framework
two synthesis methods have been given: the harmonic method and formant
method.
The research completed in this thesis has led to the following conclusions:
1. Lithuanian language has ninety two phonemes. Twenty eight of them
are pure vowel phonemes, nineteen – semivowel phonemes. In general
case, the character of vowel and semivowel signals is periodic.
2. The fundamental frequencies of the stressed vowels and semivowels
are lower than those of the unstressed ones.

REFERENCES
88
3. The estimates of the fundamental frequency obtained by the MUSIC
method are less scattered around their average if compared with the
ones obtained by the DFT method. The methods for Lithuanian male
vowels /a/, /i/, /o/, /u / were applied. The smallest standard deviation
2.36 Hz was obtained by the MUSIC method for the vowel /i/, and the
largest – 5.59 Hz – by the DFT method for the vowel /a/.
4. The harmonic method uses a higher-order model with a larger number
of parameters in comparison with the formant method but the sounds
synthesized by the harmonic method sound more naturally. The
average RMSE for the estimated signal spectrum for all the male and
female vowels is equal to 13.9 % in the formant method case and
12.4 % in the harmonic method case. The average RMSE for the
estimated signal spectrum for all the male and female semivowels is
equal to 19.9 % in the formant method case and 16.7 % in the
harmonic method case.
5. The average time of the phoneme parameter estimation for all the male
and female vowels and semivowels is equal to 16.1 s in the formant
method case and 37.2 s in the harmonic method case. The average time
of the phoneme synthesis for all the male and female vowels and
semivowels is equal to 0.09 s in the formant method case and 0.44 s in
the harmonic method case.
6. The accuracy of diphthong modelling is high. It is almost impossible to
distinguish between the real and simulated diphthongs in various
Lithuanian words with a help of audiotesting. Only the magnitude
response of the whole signal of the simulated diphthong differs a little
from the magnitude response of the recorded data in some frequency
bands.

REFERENCES
89
7. Simulation has revealed that the word consisting of vowels and
semivowels obtained with the proposed synthesis method is good
enough and it is difficult to distinguish it from the real one. The quality
of the synthesized sound was significantly improved due to input
transitions.
8. The created automatic system will suit any speaker, any vowel and
semivowel phoneme.


91
91
References
Anbinderis, T. (2010). Mathematical modelling of some aspects of stressing a Lithuanian text. Doctoral dissertation, Vilnius University, Vilnius [in Lithuanian].
Balbonas, D., Daunys, G. (2007). Movement of Formants of Vowels in Lithuanian Language.
Electronics and Electrical Engineering, 7(79), 15–18.
Balbonas, D. (2009). Analysis of Vowels Spectrum. Doctoral dissertation. Kaunas University of
Technology, Kaunas.
Bastys, A., Kisel, A., Šalna, B. (2010). The Use of Group Delay Features of Linear Prediction Model for Speaker Recognition. Informatica, 1(21), 1–12.
Borzone De Manrique, A. M. (1979). Acoustic Analysis of the Spanish Diphthongs. Phonetica, 3(36), 194 – 206.
Burk, P. (2005). Music and Computers Course Guide: A Theoretical & Historical Approach, Key
College Publishing.
de Cheveigné, A., Kawahara. H. (2002). YIN, a fundamental frequency estimator for speech and music. The Journal of the Acoustical Society of America, 111(4), 1917-1930.
Carlson R., Sigvardson T., Sjölander A. (2002). Data-driven formant synthesis. Proceedings of Fonetik, TMH-QPSR, 44 (1), 121-124.
Collins Concise English Dictionary, 2009.
Accessed at: http://www.thefreedictionary.com/diphthong
Cook, P. R. (2002). Real Sound Synthesis for Interactive Application. A K Peters Ltd., 263 p.
Cressey, W. W. (1978). Spanish Phonology and Morphology. A Generative View. Georgetown
University Press, 169 p.
Čeidaitė, G., Telksnys, L. (2010).Analysis of Factors Influencing Accuracy of Speech
Recognition. Electronics and Electrical Engineering, 9(105), 69–72.

REFERENCES
92
Donovan, R. E. (1996). Trainable Speech Synthesis. Doctoral dissertation. Cambridge University,
Cambridge.
Driaunys, K., Rudžionis, V. E., Žvinys, P. (2009). Implementation of hierarchical phoneme classification approach on LTDIGITS corpora. Information technology and control,
4(38), 303-310.
Encyclopedia Britannica. Encyclopedia Britannica Online. Encyclopedia Britannica Inc., 2012
Fant, G. (1970). Acoustic Theory of Speech Production. Mouton & Co, 328 p.
Fox, A. (2005). The Structure of German. Oxford Linguistics, 334 p.
Frolov, А., Frolov, G. (2003). Speech Synthesis and Recognition. Modern Solutions
(eBook). Accessed at: http://www.frolov-lib.ru/books/hi/index.html
Golub, G., Pereyra, V. (1973). The differentiation of pseudo-inverses and nonlinear least squares problems whose variables separate. SIAM Journal or Numerical Analysis, 2(10), 413 – 432.
Garšva, K. (2001). Complex diphthongs ie, uo and their phonological interpretation. Žmogus ir žodis (A man and a word). Vilnius Pedagogical University. Didaktinė lingvistika
(Didactic linguistics). Mokslo darbai (Research works). Edited by V. Drotvinas, 3(1), 23–26 [in Lithuanian].
Geumann, A. (1997). Formant trajectory dynamics in Swabian diphthongs. Forschungsberichte
des Instituts für Phonetik und Sprachliche Kommunikation der Universität München, vol. 35, 35 – 38.
Girdenis, A. (1995). Teoriniai fonologijos pagrindai (Theoretical basics of phonology). Vilnius
University, Vilnius [in Lithuanian].
Handbook of the International Phonetic Association, Cambridge University Press, 1999.
Hess, W. (1983). Pitch Determination of Speech Signals, Springer-Verlag, New York.
Holmes J., Holmes W. (2001). Speech Synthesis and Recognition,. CRC Press, 298 p.
Hopcroft, J. E., Ullman J. D. (1979). Introduction to Automata Theory, Languages and
Computation, Addison-Wesley Publishing, Reading Massachusetts.
Ivanovas E., Navakauskas D. (2010). Development of biometric systems for person recognition: Biometric feature systems, traits and acquisition. Electronics and Electrical Engineering,
5(101), 87-90.
Ivanovas, E., Navakauskas, D. (2011). Peculiarities of Wiener Class Systems and their Exploitation for Speech Signal Prediction. Electronics and Electrical Engineering, 5(111),
107–110.
Ivanovas E., (2012). Development and implementation of means for word duration signal
processing (doctoral dissertation), Vilnius: Technika, 128 p. [in Lithuanian].
Janicki, A. (2004). Selected Methods of Quality Improvement in Concatenative Speech Synthesis for the Polish Language. Doctoral dissertation. Warsaw University of Technology,
Warsaw.
Kajackas, A., Anskaitis, A. (2009). An Investigation of the Perceptual Value of Voice Frames. Informatica, 4(20), 487–498.
Kamarauskas, J. (2009). Speaker recognition by voice (doctoral dissertation), Vilnius: Technika, 124 p. [in Lithuanian].
Kasparaitis, P. (1999). Transcribing of the Lithuanian text using formal rules. Informatica, 10(4),
367–376.

REFERENCES
93
Kasparaitis, P. (2000). Automatic stressing of the Lithuanian text on the basis of a dictionary.
Informatica, 11(1), 19–40.
Kasparaitis, P. (2001). Text-to-Speech Synthesis of Lithuanian Language. Doctoral dissertation, Vilnius University, Vilnius [in Lithuanian].
Kasparaitis, P. (2005). Diphone databases for Lithuanian text-to-speech synthesis. Informatica, 2(16), 193– 202.
Kasparaitis, P. (2008). Lithuanian Speech Recognition Using the English Recognizer.
Informatica, 4(19), 505–516.
Kazlauskas, K. (1999). Noisy Speech Intelligibility Enhancement. Informatica, 2(10), 171–188.
Kazlauskas, K., Pupeikis, R. (2013). On intelligent extraction of an internal signal in a Wiener System consisting of a linear block followed by hard-nonlinearity. 1(24), 35-58.
Laurinčiukaitė, S., Lipeika, A. (2007). Framework for Choosing a Set of Syllables and Phonemes
for Lithuanian Speech Recognition. Informatica, 3(18), 395–406.
Levenberg, K. (1944). A Method for the Solution of Certain Non-Linear Problems in Least Squares. The Quarterly of Applied Mathematics 2, pp. 164–168.
Lileikytė, R., Telksnys, L. (2011). Quality Estimation Methodology of Speech Recognition Features. Electronics and Electrical Engineering, 4(110), 113–116.
Lileikytė. R., Telksnys, L. (2012). Quality Measurement of Speech Recognition Features in Context of Nearest Neighbour Classifier. Electronics and Electrical Engineering. – Kaunas: Technologija, 2(118), 9–12.
Lipeikienė, J., Lipeika, A. (1998). Language engineering in Lithuania. Informatica, 9(4), 449–456.
Lipeika, A., Lipeikienė, J., Telksnys, L. (2002). Development of Isolated Word Speech
Recognition System. Informatica, 1(13), 37–46.
Lipeika, A., Lipeikienė, J. (2003). Word Endpoint Detection Using Dynamic Programming. Informatica, 4(14), 487–496.
Lipeika, A., Lipeikienė, J. ( 2008). On the Use of the Formant Features in the Dynamic Time Warping Based Recognition of Isolated Words. Informatica, 2(19), 213–226.
Lipeika, A. (2010). Optimization of Formant Feature Based Speech Recognition. Informatica, 3(21), 361–374.
Lithuanian speech synthesis web page (2010). Accessed at: http://www.garsiai.lt
Mannell, R. H. (1998). Formant diphone parameter extraction utilising a labelled single-speaker
database. Proceedings of the Fifth International Conference on Spoken Language Processing. Sydney, Australia, 30 November – 1 December, 1998.
Accessed at: http://clas.mq.edu.au/rmannell/research/icslp98/iclsp98_mannell.pdf
Marquardt, D. (1963). An algorithm for least-squares estimation of nonlinear parameters. SIAM Journal on Applied Mathematics 11, 431–441.
Markel, J. D., Gray, A. H. (1976). Linear Prediction of Speech. Springer Verlag, Berlin.
Martirosian, O., Davel, M. (2008). Acoustic analysis of diphthongs in Standard South African English. Nineteenth Annual Symposium of the Pattern Recognition Association of South Africa, Cape Town, South Africa, 27-28 November, 153-157

REFERENCES
94
Maskeliūnas, R., Rudžionis, A., Ratkevičius, K., Rudžionis, V. (2009). Investigation of foreign
languages models for Lithuanian speech recognition. Electronics and Electrical Engineering, No. 3, 15-20.
Maskeliūnas, R., Ratkevicius, K., Rudzionis, V. (2011). Voice-based Human-Machine Interaction
Modeling for Automated Information Services. Electronics and Electrical Engineering, 4(110), 109–112.
Mažonavičiūtė, I., Baušys, R. (2011). Translingual Visemes Mapping for Lithuanian Speech
Animation. Electronics and Electrical Engineering, 5(111), 95–98.
Milivojevic, Z., Mirkovic, M., Milivojevic, S. (2006). An estimate of fundamental frequency
using PCC interpolation – comparative analysis. Information Technology and Control, 35(2), 131-136.
Mobius, B., van Santen, J. (1996). Modeling segmental duration in German text-to-speech
synthesis. Proceedings of the Fourth International Conference on Spoken Language Processing. Philadelphia, USA, October 3-6, 1996, vol. 4, 2395-2398
Accessed at: http://www.asel.udel.edu/icslp/cdrom/vol4/652/a652.pdf
Murakami T., Ishida Y. (2001). Fundamental frequency estimation of speech signals using MUSIC algorithm. Acoust. Sci. Technol, 22(4), 293 – 297.
Norkevičius, G., Raškinis, G. (2008). Modeling Phone Duration of Lithuanian by Classification
and Regression Trees, using Very Large Speech Corpus. Informatica, 2(19), 271–284.
Navakauskas, D., Paulikas, Š. (2006). Autonomous robot in the adverse environment: Intelligent control by voice. Solid State Phenomena, vol. 113 Mechatronic Systems and Materials,
325-329.
Onelook, 2010. Accessed at: http://www.onelook.com/?w=phone&ls=a
Oxford dictionaries, 2010.
Accessed at: http://www.askoxford.com/concise_oed/phoneme?view=uk
Raškinis, G., Raškinienė, D. (2003). Building medium-vocabulary isolated-word Lithuanian HMM speech recognition system. Informatica, 14(1), 75–84.
Ringys, T., Slivinskas, V. (2009). Formant modelling of Lithuanian language vowel natural
sounding. The Materials of the 4th International Conference on Electrical and Control Technologies ECT-2009. Kaunas: Technologija, 5-8 [in Lithuanian].
Ringys, T., Slivinskas, V. (2010). Lithuanian language vowel formant modelling using multiple
input and single output linear dynamic system with multiple poles. Proceedings of the 5th International Conference on Electrical and Control Technologies ECT-2010. 6-7 May,
Kaunas, Lithuania, 117-120.
Rudžionis, A., Ratkevičius, K., Dumbliauskas, T., Rudžionis, V. (2008). Control of computer and electric devices by voice. Electronics and Electrical Engineering, No. 6, 11-16.
SIL International, 2004. Accessed at:
http://www.sil.org/linguistics/GlossaryOfLinguisticTerms/WhatIsAPhone.htm
Šilingas, D., Telksnys, L. (2004). Specifics of Hidden Markov Model Modifications for Large
Vocabulary Continuous Speech Recognition. Informatica, 1(15), 93–110.
Šimonytė, V., Slivinskas, V. (1997). Estimation of multiple exponential-sinusoidal models. Theory of Stochastic Processes, 3 – 4(19), 426 – 435.
Schmidt, R.O. (1986). Multiple Emitter Location and Signal Parameter Estimation, IEEE Trans. Antennas Propagation, 34(3), 276-280.

REFERENCES
95
Skripkauskas, M., Telksnys, L. (2006). Automatic Transcription of Lithuanian Text Using
Dictionary. Informatica, 4(17), 587–600.
Slivinskas, V., Šimonytė, V. (1990). Minimal realization and formant analysis of dynamic systems and signals. Mokslas. Vilnius 168 p. [in Russian] (republished by Booksurge,
USA, 2007).
Slivinskas, V., Šimonytė, V. (1997). Estimation of quasipolynomials in noise: theoretical, algorithmic and implementation aspects. Computer-Intensive Methods in Control and
Signal Processing: The Curse of Dimensionality. Birkhauser, Boston, 223 – 235.
Stoica, P., Moses, R. (1997). Introduction to Spectral Analysis. Englewood Cliffs, Prentice-Hall.
Stoica, P., Nehorai, A. (1989). MUSIC, Maximum Likelihood, and Cramer-Rao Bound, IEEE Trans. Acoustics, Speech, and Signal Processing, 37(5), 720-741.
Šalna, B., KamarauskasJ. (2010). Evaluation of Effectiveness of Different Methods in Speaker
Recognition. Electronics and Electrical Engineering, 2(98), 67–70.
Šveikauskienė, D. (2005). Graph Representation of the Syntactic Structure of the Lithuanian Sentence. Informatica, 3(16), 407–418.
Tamulevičius, G. (2008). Development of isolated word recognition systems (doctoral dissertation), Vilnius: Technika, 124 p. [in Lithuanian].
Tamulevičius, G., Arminas, V., Ivanovas, E., Navakauskas, D. (2010). Hardware accelerated FPGA implementation of Lithuanian isolated word recognition system. Electronics and Electrical Engineering, 3(99), 57-62.
The Linguistics Research Center (LRC), 2013
Accessed at: www.utexas.edu/cola/centers/lrc/eieol/litol-2-R.html
The MBROLA Project. [http://tcts.fpms.ac.be/synthesis]
Therrien, C. W. (1992). Discrete Random Signals and Statistical Signal Processing. Englewood
Cliffs, Prentice-Hall, 614–655.


97
97
List of Publications
Articles in the reviewed scientific periodical publications
A 1. G. Pyž, V. Šimonytė, V. Slivinskas (2011). Modelling of
Lithuanian Speech Diphthongs. Informatica, Vol. 22 (3), p. 411-
434. ISSN 0868-4952 [ISI Web of Science].
A 2. G. Pyž, V. Šimonytė, V. Slivinskas (2011). Joining of Vowel and
Semivowel Models in Lithuanian Speech Formant-based
Synthesizer. Proc. of the 6th International Conference on ECT-
2011, p. 114-119, ISSN 1822-5934 [ISI Proceedings].
A 3. G. Pyž, V. Šimonytė, V. Slivinskas (2012). Lithuanian Speech
Synthesizing by Computer Using Additive Synthesis. Elektronika
ir elektrotechnika, Vol. 18 (8), p. 77-80. ISSN 1392-1215 [ISI
Web of Science].
A 4. V. Šimonytė, G. Pyž, V. Slivinskas (2009). Application of the
MUSIC method for estimation of the signal fundamental
REFERENCES
98
frequency. Lietuvos matematikos rinkinys. LMD darbai, T. 50,
p. 391-396, ISSN 0132-2818.
A 5. G. Pyž, V. Šimonytė, V. Slivinskas (2012). An automatic system
of Lithuanian speech formant synthesizer parameter estimation.
Proc. of the 7th International Conference ECT-2012, p. 36-39,
ISSN 1822-5934.
A 6. V. Slivinskas, V. Šimonytė, G. Pyž (2013). Control of Computer
Programs by Voice Commands. Proc. of the 8th International
Conference ECT-2013, p. 37-40, ISSN 1822-5934.
Methodical work
V. Šimonytė, G. Pyž, V. Slivinskas (2010). Signals and their
parameter estimation, Vilnius: BMK, ISBN 978-9955-88-44-4
[in Lithuanian].
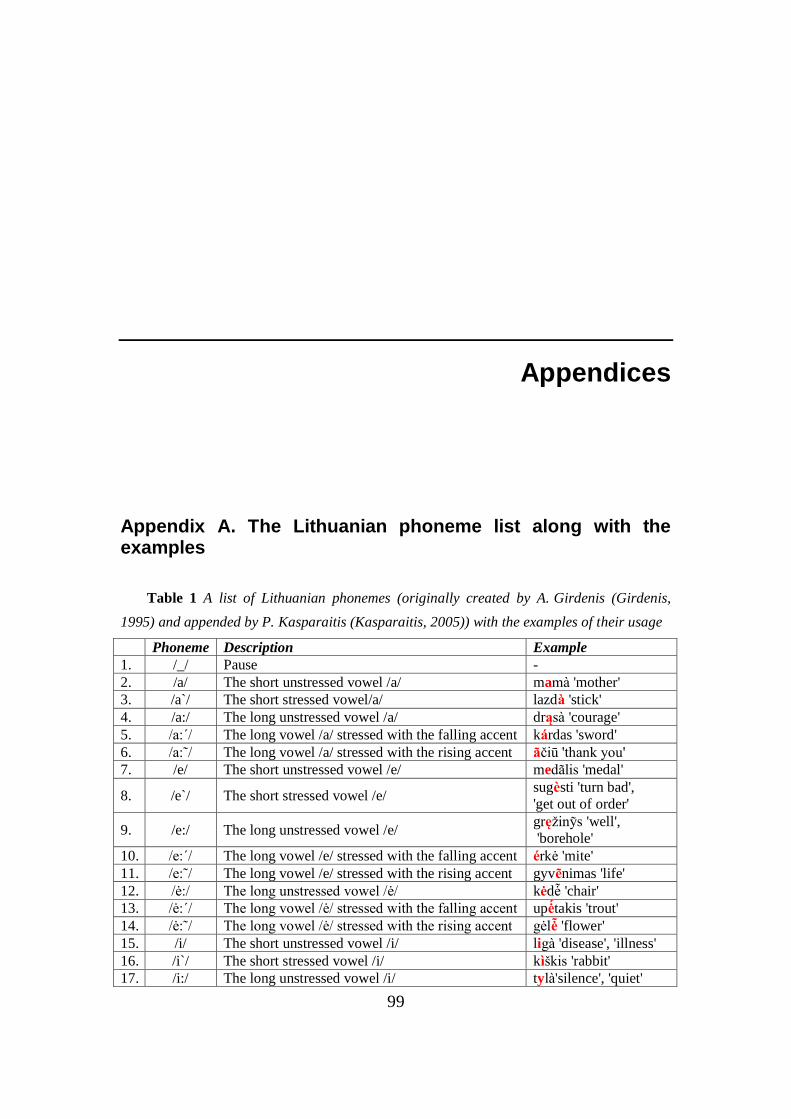
99
99
Appendices
Appendix A. The Lithuanian phoneme list along with the examples
Table 1 A list of Lithuanian phonemes (originally created by A. Girdenis (Girdenis,
1995) and appended by P. Kasparaitis (Kasparaitis, 2005)) with the examples of their usage
Phoneme Description Example
1. /_/ Pause -
2. /a/ The short unstressed vowel /a/ mam 'mother'
3. /a`/ The short stressed vowel/a/ lazd 'stick'
4. /a:/ The long unstressed vowel /a/ drąs 'courage'
5. /a:´/ The long vowel /a/ stressed with the falling accent k rdas 'sword'
6. /a:˜/ The long vowel /a/ stressed with the rising accent čiū 'thank you'
7. /e/ The short unstressed vowel /e/ med lis 'medal'
8. /e`/ The short stressed vowel /e/ sug sti 'turn bad',
'get out of order'
9. /e:/ The long unstressed vowel /e/ gręžin s 'well',
'borehole'
10. /e:´/ The long vowel /e/ stressed with the falling accent rkė 'mite'
11. /e:˜/ The long vowel /e/ stressed with the rising accent gyv nimas 'life'
12. /ė:/ The long unstressed vowel /ė/ kėdė 'chair'
13. /ė:´/ The long vowel /ė/ stressed with the falling accent upė takis 'trout'
14. /ė:˜/ The long vowel /ė/ stressed with the rising accent gėlė 'flower'
15. /i/ The short unstressed vowel /i/ lig 'disease', 'illness'
16. /i`/ The short stressed vowel /i/ k škis 'rabbit'
17. /i:/ The long unstressed vowel /i/ tyl 'silence', 'quiet'
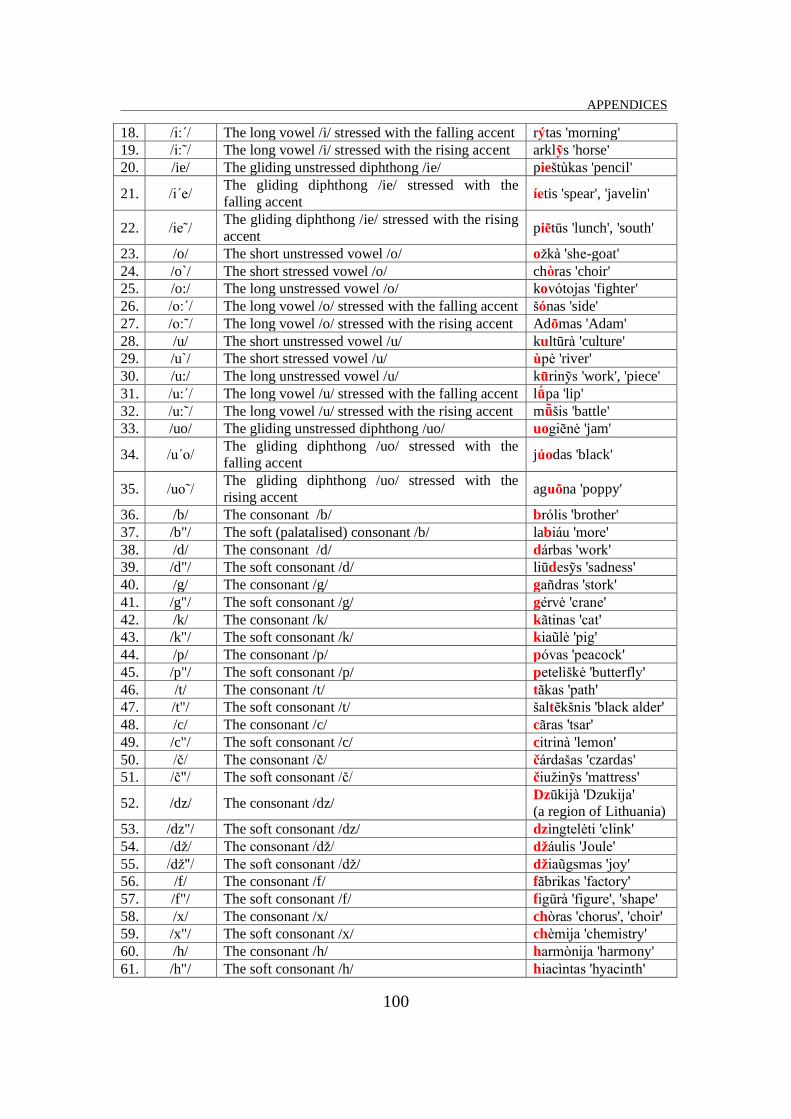
APPENDICES
100
18. /i:´/ The long vowel /i/ stressed with the falling accent r tas 'morning'
19. /i:˜/ The long vowel /i/ stressed with the rising accent arkl s 'horse'
20. /ie/ The gliding unstressed diphthong /ie/ piešt kas 'pencil'
21. /i´e/ The gliding diphthong /ie/ stressed with the
falling accent etis 'spear', 'javelin'
22. /ie˜/ The gliding diphthong /ie/ stressed with the rising
accent pi tūs 'lunch', 'south'
23. /o/ The short unstressed vowel /o/ ožk 'she-goat'
24. /o`/ The short stressed vowel /o/ ch ras 'choir'
25. /o:/ The long unstressed vowel /o/ kov tojas 'fighter'
26. /o:´/ The long vowel /o/ stressed with the falling accent š nas 'side'
27. /o:˜/ The long vowel /o/ stressed with the rising accent Ad mas 'Adam'
28. /u/ The short unstressed vowel /u/ kultūr 'culture'
29. /u`/ The short stressed vowel /u/ pė 'river'
30. /u:/ The long unstressed vowel /u/ kūrin s 'work', 'piece'
31. /u:´/ The long vowel /u/ stressed with the falling accent lū pa 'lip'
32. /u:˜/ The long vowel /u/ stressed with the rising accent mū šis 'battle'
33. /uo/ The gliding unstressed diphthong /uo/ uogi nė 'jam'
34. /u´o/ The gliding diphthong /uo/ stressed with the
falling accent j odas 'black'
35. /uo˜/ The gliding diphthong /uo/ stressed with the
rising accent agu na 'poppy'
36. /b/ The consonant /b/ br lis 'brother'
37. /b"/ The soft (palatalised) consonant /b/ labi u 'more'
38. /d/ The consonant /d/ d rbas 'work'
39. /d"/ The soft consonant /d/ liūdes s 'sadness'
40. /g/ The consonant /g/ ga dras 'stork'
41. /g"/ The soft consonant /g/ gérvė 'crane'
42. /k/ The consonant /k/ k tinas 'cat'
43. /k"/ The soft consonant /k/ kia lė 'pig'
44. /p/ The consonant /p/ p vas 'peacock'
45. /p"/ The soft consonant /p/ petel škė 'butterfly'
46. /t/ The consonant /t/ t kas 'path'
47. /t"/ The soft consonant /t/ šalt kšnis 'black alder'
48. /c/ The consonant /c/ c ras 'tsar'
49. /c"/ The soft consonant /c/ citrin 'lemon'
50. /č/ The consonant /č/ č rdašas 'czardas'
51. /č"/ The soft consonant /č/ čiužin s 'mattress'
52. /dz/ The consonant /dz/ Dzūkij 'Dzukija'
(a region of Lithuania)
53. /dz"/ The soft consonant /dz/ dz ngtelėti 'clink'
54. /dž/ The consonant /dž/ dž ulis 'Joule'
55. /dž"/ The soft consonant /dž/ džia gsmas 'joy'
56. /f/ The consonant /f/ f brikas 'factory'
57. /f"/ The soft consonant /f/ figūr 'figure', 'shape'
58. /x/ The consonant /x/ ch ras 'chorus', 'choir'
59. /x"/ The soft consonant /x/ ch mija 'chemistry'
60. /h/ The consonant /h/ harm nija 'harmony'
61. /h"/ The soft consonant /h/ hiac ntas 'hyacinth'

APPENDICES
101
62. /s/ The consonant /s/ s ulė 'sun'
63. /s"/ The soft consonant /s/ va sius 'fruit', 'fetus'
64. /š/ The consonant /š/ šak 'branch'
65. /š"/ The soft consonant /š/ ši udas 'straw'
66. /z/ The consonant /z/ z lė 'tit'
67. /z"/ The soft consonant /z/ zirzė ti 'to whine'
68. /ž/ The consonant /ž/ žv kė 'candle'
69. /ž"/ The soft consonant /ž/ ži gas 'grasshopper'
ž mė 'earth', 'soil'
70. /j"/ The soft consonant /j/ (in Lithuanian, 'j' is always
soft)
jū ra 'sea'
j s 'he'
71. /l/ The consonant /l/ v lsas 'waltz'
72. /l˜/ The stressed consonant /l/ vil kas 'wolf'
73. /l"/ The soft consonant /l/ vali 'will'
74. /l"˜/ The soft stressed consonant /l/ gul ti 'to go to bed', 'to
lie down'
75. /m/ The consonant /m/ matas 'handicraft'
76. /m˜/ The stressed consonant /m/ li palas 'adhesive '
77. /m"/ The soft consonant /m/ sm genys 'brain'
78. /m"˜/ The soft stressed consonant /m/ ka štis 'cork'
79. /n/ The consonant /n/ n mas 'house'
80. /n˜/ The stressed consonant /n/ i karas 'anchor'
81. /n"/ The soft consonant /n/ n šti 'to carry along'
82. /n"˜/ The soft stressed consonant /n/ le ktis 'to bend', ' to
bow'
83. /r/ The consonant /r/ r tas 'wheel'
beržas 'birch'
84. /r˜/ The stressed consonant /r/ ga sas 'sound'
85. /r"/ The soft consonant /r/ kri ušė 'pear'
86. /r"˜/ The soft stressed consonant /r/ ki tis 'stress', 'blow'
87. /v/ The consonant /v/ v ras 'spider'
88. /v"/ The soft consonant /v/ vi uksėti 'to yelp'
89. /j/ The consonant sound /j/ (appearing when
pronouncing the diphthongs 'ai', 'ei' and 'ui')
idas 'echo'
méilė 'love'
90. /j˜/ The stressed consonant sound /j/ (appearing when
pronouncing the diphthongs 'ai, 'ei' and 'ui')
e smas 'traffic'
zu kis 'rabbit'
91. /w/ The vowel sound /u/ (appearing when
pronouncing the diphthong 'au') k ulas 'bone'
92. /w˜/ The stressed vowel sound /u/ (appearing when
pronouncing the diphthong 'au') la kas 'field'

APPENDICES
102
Appendix B. The vowel phoneme signals
The plots of the vowel phoneme signals of duration 0.02 s are shown in
Fig. 1 – Fig. 6. The phonemes were obtained from female utterances. These
plots reveal the periodic character of the vowel phoneme signals.
1)
2)
3)
4)
5)
Fig. 1 The plots of the vowel ''a'' phonemes: 1) the short unstressed vowel /a/ as in
the word mam mother), 2) the short stressed vowel /a`/ as in the word lazd (stick),
3) the long unstressed vowel /a:/ as in the word drąs courage), 4) the long vowel
stressed with the falling accent a ´ as in the word k rdas (sword), 5) the long vowel
stressed with the rising accent a as in the word čiū thank you)
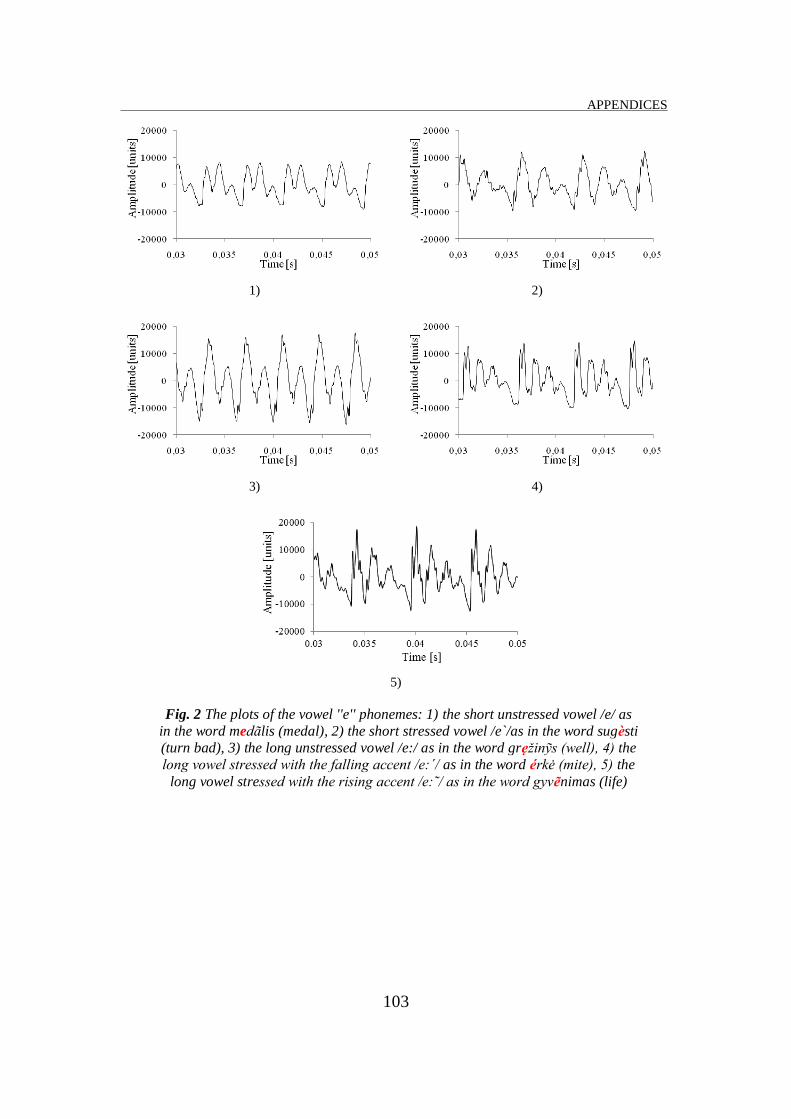
APPENDICES
103
1)
2)
3)
4)
5)
Fig. 2 The plots of the vowel ''e'' phonemes: 1) the short unstressed vowel /e/ as
in the word med lis (medal), 2) the short stressed vowel /e`/as in the word sug sti
(turn bad), 3) the long unstressed vowel /e:/ as in the word gręžin s well), 4) the
long vowel stressed with the falling accent e ´ as in the word rkė mite), 5) the
long vowel stressed with the rising accent e as in the word gyv nimas (life)
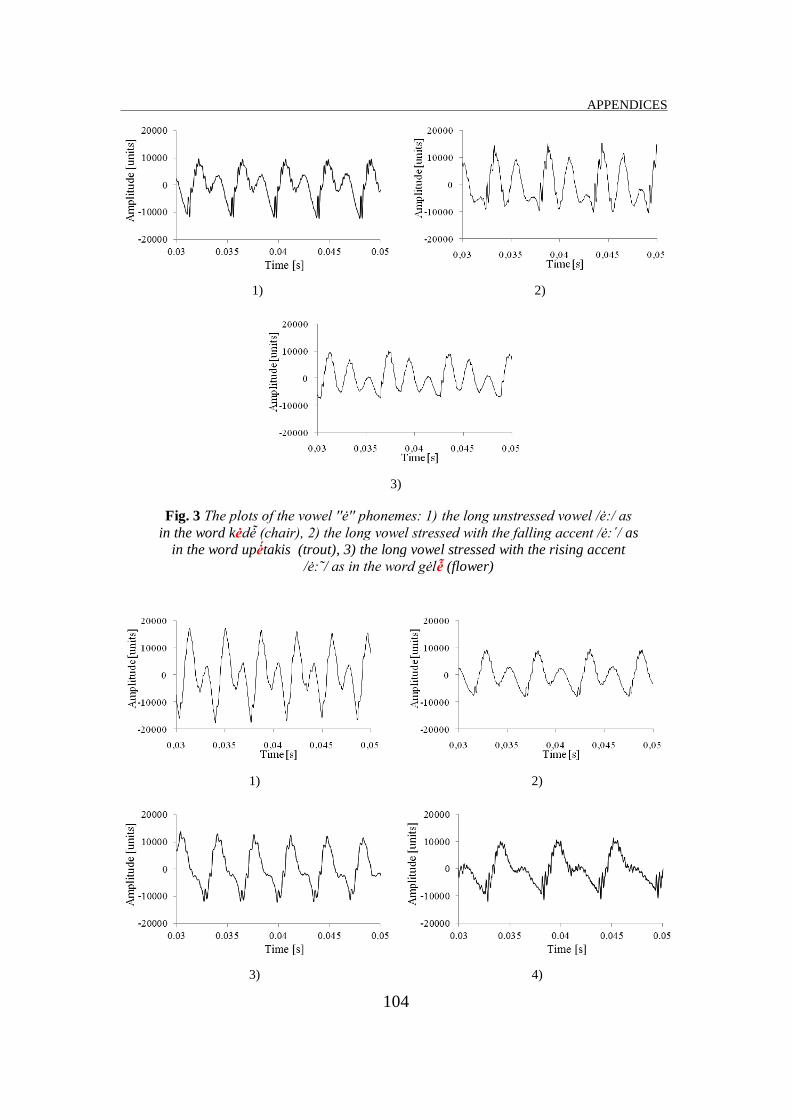
APPENDICES
104
1) 2)
3)
Fig. 3 The plots of the vowel ''ė'' phonemes 1) the long unstressed vowel ė as
in the word kėdė chair), ) the long vowel stressed with the falling accent ė ´ as
in the word upė takis (trout), 3) the long vowel stressed with the rising accent
ė as in the word gėlė (flower)
1) 2)
3) 4)

APPENDICES
105
5)
Fig. 4 The plots of the vowel ''i'' phonemes: 1) the short unstressed vowel /i/ as in
the word lig (disease), 2) the short stressed vowel /i`/ as in the word k škis
(rabbit), 3) the long unstressed vowel /i:/ as in the word tyl silence), 4) the long
vowel stressed with the falling accent i ´ as in the word r tas (morning), 5) the
long vowel stressed with the rising accent i as in the word arkl s (horse)
1)
2)
3)
4)

APPENDICES
106
5)
Fig. 5 The plots of the vowel ''o'' phonemes: 1) the short unstressed vowel /o/ as
in the word ožk she-goat), 2) the short stressed vowel /o`/ as in the word ch ras
(choir), 3) the long unstressed vowel /o:/ as in the word kov tojas fighter), 4) the
long vowel stressed with the falling accent o ´ as in the š nas (side), 5) the long
vowel stressed with the rising accent o as in the word Ad mas (Adam)
1) 2)
3)
4)
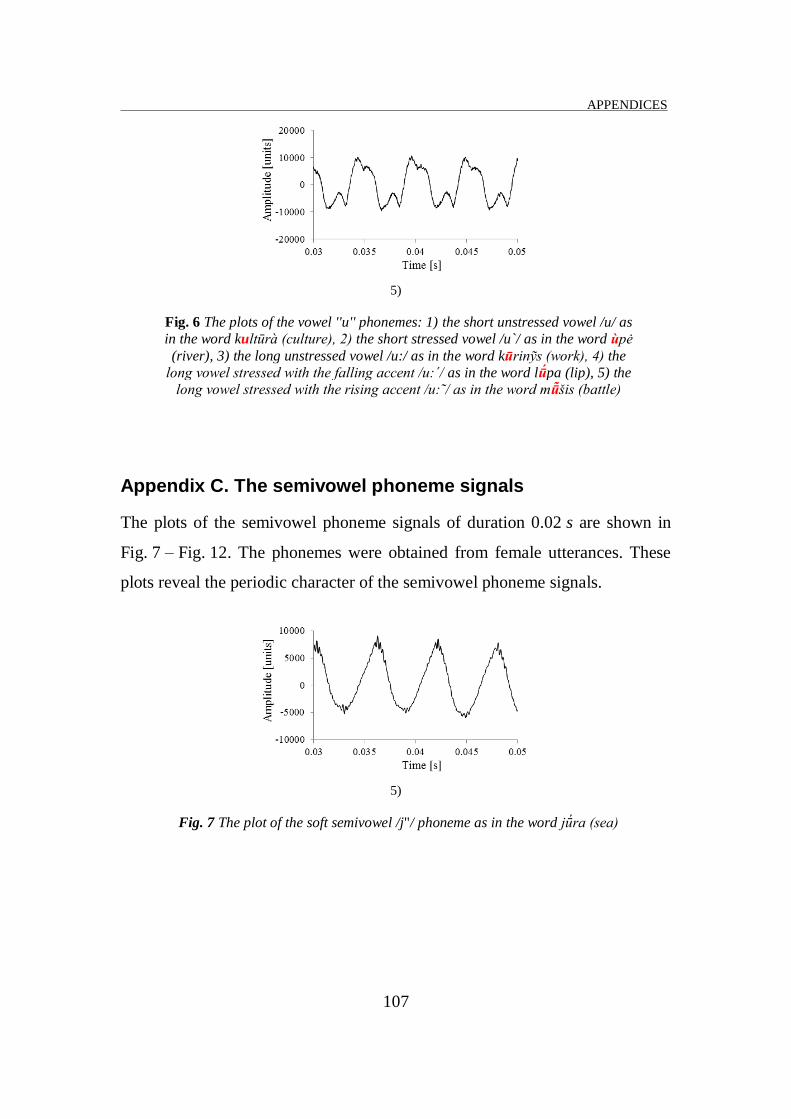
APPENDICES
107
5)
Fig. 6 The plots of the vowel ''u'' phonemes: 1) the short unstressed vowel /u/ as
in the word kultūr culture), ) the short stressed vowel /u`/ as in the word pė
(river), 3) the long unstressed vowel /u:/ as in the word kūrin s work), 4) the
long vowel stressed with the falling accent u ´ as in the word lū pa (lip), 5) the
long vowel stressed with the rising accent u as in the word mū šis battle)
Appendix C. The semivowel phoneme signals
The plots of the semivowel phoneme signals of duration 0.02 s are shown in
Fig. 7 – Fig. 12. The phonemes were obtained from female utterances. These
plots reveal the periodic character of the semivowel phoneme signals.
5)
Fig. 7 The plot of the soft semivowel /j"/ phoneme as in the word jū ra sea)

APPENDICES
108
1)
2)
3) 4)
Fig. 8 The plots of the semivowel ''l'' phonemes: 1) the unstressed semivowel /l/ as in
the word v lsas (waltz), 2) the stressed semivowel /l / as in the word vi kas (wolf),
3) the soft unstressed semivowel /l"/ as in the word vali will), 4) the soft stressed
semivowel /l" as in the word gu ti (to go to bed)
1) 2)
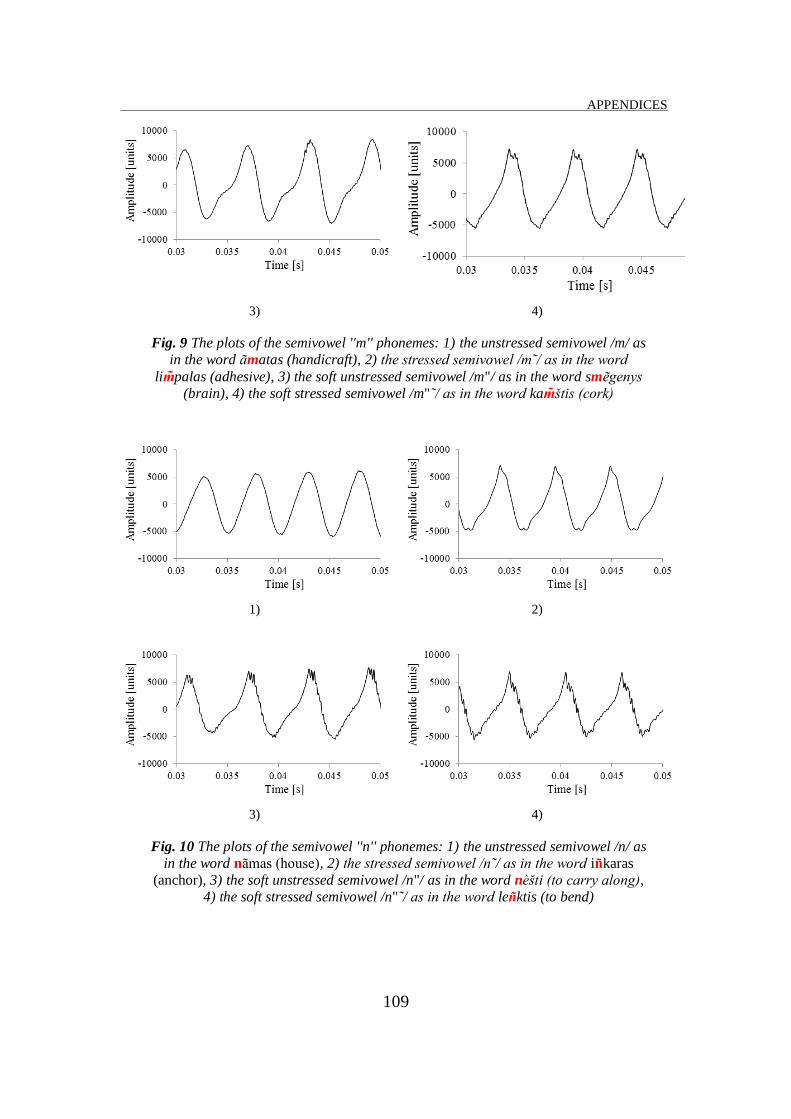
APPENDICES
109
3) 4)
Fig. 9 The plots of the semivowel ''m'' phonemes: 1) the unstressed semivowel /m/ as
in the word matas (handicraft), 2) the stressed semivowel m as in the word
li palas (adhesive), 3) the soft unstressed semivowel /m"/ as in the word sm genys
(brain), 4) the soft stressed semivowel /m" as in the word ka štis cork)
1) 2)
3) 4)
Fig. 10 The plots of the semivowel ''n'' phonemes: 1) the unstressed semivowel /n/ as
in the word n mas (house), 2) the stressed semivowel n as in the word i karas
(anchor), 3) the soft unstressed semivowel /n"/ as in the word n šti to carry along),
4) the soft stressed semivowel /n" as in the word le ktis (to bend)
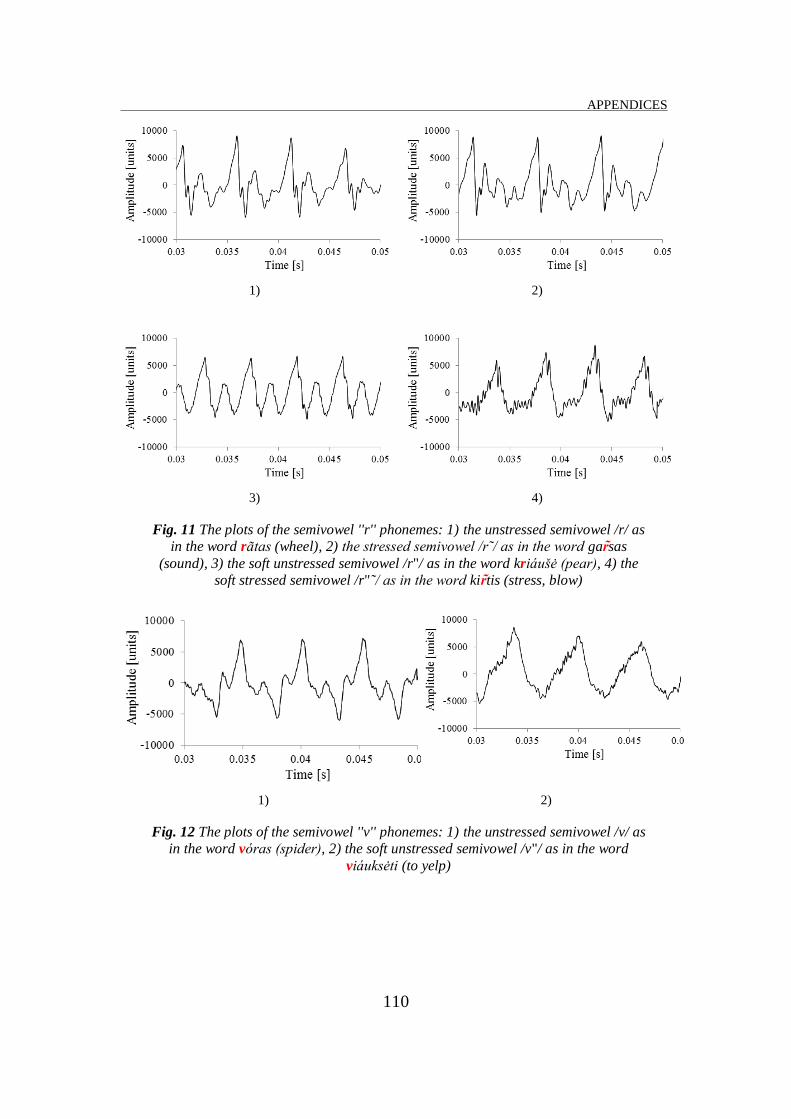
APPENDICES
110
1) 2)
3) 4)
Fig. 11 The plots of the semivowel ''r'' phonemes: 1) the unstressed semivowel /r/ as
in the word r tas (wheel), 2) the stressed semivowel r as in the word ga sas
(sound), 3) the soft unstressed semivowel /r"/ as in the word kri ušė pear), 4) the
soft stressed semivowel /r" as in the word ki tis (stress, blow)
1) 2)
Fig. 12 The plots of the semivowel ''v'' phonemes: 1) the unstressed semivowel /v/ as
in the word v ras spider), 2) the soft unstressed semivowel /v"/ as in the word
vi uksėti (to yelp)
111
Gražina Pyž
ANALYSIS AND SYNTHESIS OF LITHUANIAN
PHONEME DYNAMIC SOUND MODELS
Doctoral Dissertation
Technological Sciences,
Informatics Engineering (07T)
Gražina Pyž
LIETUVIŠKŲ FONEMŲ DINAMINIŲ MODELIŲ
ANALIZĖ IR SINTEZĖ
Daktaro disertacija
Technologijos mokslai,
Informatikos inžinerija (07T)