analysing and visualizing a human body cartographically
TRANSCRIPT

Analysing and Visualizing a Human Body Cartographically
Elizabeth S. Carvalho Universidade do Minho, Escola de Engenharia,
DSI - Departamento de Sistemas de Informação ecarvalho@dsi . uminho . p t
Adérito Fernandes Marcos Universidade do Minho, Escola de Engenharia,
DSI - Departamento de Sistemas de Informação marcos@dsi . uminho . pt
Abstract
Maribel Y asmina Santos Universidade do Minho, Escola de Engenharia,
DSI - Departamento de Sistemas de Informação maribel@dsi . uminho . pt
Paulo Miguel C. Brito Universidade do Minho, Escola de Engenharia,
DSI - Departamento de Sistemas de Informação pbrito@dsi . uminho . pt
Doctors usual/y execute a spatial analysis when diagnosing a disease in a patient. This happens, because the human body is composed of severa/ spatial interdependent layers of information, that describe its functioning and behaviour. The human body organs and systems are described by morphological and physiological data that should be spatially combined by the doctor in arder to evaluate the global patient health condition. On the other hand, most of the models, used to analyze, to process and to visualize these data, do not take into account this strong spatial interdependency inherent to human body 's functioning. These models usually treat morphological and physiological data in a full independent and isolated way. This happens because they are not "spatially " oriented, and do not interpret the human body as a 3D map, being composed by different parts and layers of information. The possibility of combining these layers using spatial algebraic operations, introduces a new degree of information insight. Because of these characteristics, it is important to consider and evaluate the development and usage of a cartographic based model to analyze, represent and visualize human body's data. This is the main goal of the CHUB (Cartographic Human Body) model, which will be introduced in this paper.
Keywords Visualization, Cartographic Model, Hydrokinetic Therapy.
1. INTRODUCTION The hurnan body has been always analysed under a cornpartmented perspective. The rnodels used in general to analyse and visualize its biological, rnorphological and/or biornedical data do not deal or represent in a suitable way their spatia l interdependency. These rnodels treat data in a alrnost total focused and independent way. The hurnan body systerns and organs work as a cornplex rnachine, where each part depends strongly on others. This dependency rnight be stronger or weaker to the systern or organ irnportance on overall patient condition. The doctor diagnoses an illness by cornparing and analyzing inforrnation not only directly related to the rnostly affected organ, but also to the body as a whole . He/she perforrns a subtle spatia l analysis, and therefore, executes a typical algebraic rnap operation in his/her rnind, when diagnosing a patient. An illness rnight arouse different syrnptorns and physiological changes in systerns/organs that are not directly related to the spatia l location of it.
On thc other hand, cartographic rnodels are widely used to ana lysc data that is spatia lly interdependent. They
have been used for already a long time in earth science, with great success. Taking this into account, it is reasonable to say that a cartographic based rnodel, rnight also help to solve the existing lirnitations usually present in hurnan body data rnodels [SatoO 1]. The purpose of this paper is to introduce CHUB, a Cartographic Human Body rnodel, which was totally developed taking into account both the rnain aspects that a cartographic rnodel should satisfy and the special characteristics that hurnan 's body analysis dernands. ln order to assess the proposed rnodel, the hydrokinetics therapy field was considered as a case study. The rnain goal of this work is to evaluate the benefits that rnight be introduced with the use of a cartographic oriented rnodel to analyze and visualize hurnan 's body data.
This paper is divided in five sections. ln the first section we give an overall introduction and rnotivation for the creation of a hurnan body cartographic rnodel. ln section two it is discussed the use of a cartographic rnodel and rnetaphors for the hurnan body visualization and analysis, besides sorne relevant aspects of algebraic rnaps operations. ln section three it is introduced the CHUB rnodel
9

architecture and its principal components. ln section four it is presented the case study used to evaluate and validate the model and the first version of the prototype. Finally, section five concludes with some remarks about the work undertaken and tasks for future work.
2. HUMAN BODY ANO CARTOGRAPHY A cartographic model is defined as a simplified representation of the Earth' s surface or any celestial body that can be expressed in an analytical form. For many years, the cartography was only associated to the production of analogical maps. Nowadays, however, its domain grew and other fields of knowledge start to use it as a way to express information. Ali the procedures associated to the cartographic modelling are based on data belonging to two or more maps [Druck04]. These maps are treated as geo-referenced information layers. Each layer must be spatially referenced. The way that they can be combined and analysed is vast and varied. Normally, any combinations of these layers generate a new geo-referenced information layer. Another important aspect is the analytical operation that is performed on a layer or layers [MacEahren05]. The kind of algebraic operation of maps and the order that it is applied to layers creates different final results and as consequence, different cartographic models. Analytical operations can be divided into three main categories: local , neighbourhood and region. Local operations include reclassification and overlapping of layers using different logical operators (if, and, or, etc.). Neighbourhood operations include filtering, buffering, proximity and connectivity analysis of areas in a map. Region operations determine areas and perimeters of areas of interest. Human body is composed of different systems - nervous, muscular, digestive, respiratory, skeleton, cardiac, among others. Each system corresponds to a specific information layer. On the other hand, each system is composed of different organs and is associated to a set of varied physiological information. For instance, the renal system is composed of the kidneys, bladder and urethra and is associated to urine PH, acid and urea leveis. Each existing information layer in human body is composed either by spatial entities (spatial information) and a set of associated attributes . Spatial entities (spatial information layers) can be interpreted as the spatial area occupied by different human body systems and organs. The attributes are physiological parameters related to systems and organs, which can be measured and evaluated. Each physiological parameter set is an information layer too . These attributes are "human-referenced", because they are spatially referenced to the centre of a human body. Layers can be combined in different forms through algebraic maps operations. Figure 1 illustrates thi s scenario.
10
Body
Physiology ....-----'"------. +1. .nt-------------;
System
+Name: +r
string
+l
+1. .n
+Name: string +Type: string +
Organs t------=-----; +l +Name: string
Figure 1: Relationship between different layers of human body information
The "human-referenced" physiological layers can contain data ofvaried type and nature - scalars, vectors, uniform, non-uniform, time-dependent, etc., depending on what organ or system it is related to. The nature and type of a specific layer changes accordingly to the human body system and organ to which it is related to.
Any analytical combination performed between different "human-referenced" information layers can produce valuable results to help the diagnosis of human diseases . For example, to diagnose a hepatic disease it is necessary to combine, at least, information present in two layers -circulatory system (existing levei of bilirubin in blood) and digestive system (liver shape and size, for instance). Each system and organ has a specific spatial position inside human body. A spatial thinking and reasoning is always indirectly present when analysing and evaluating patient's physiological health condition. Because of this, any model dedicated/oriented to the human body study and/or visualization should attend this spatial thinking need.
ln this context we verify that there is a direct association between the idea of a map and a human body. This abstraction is clearer if we considera progressive visualization of the human body from its outside to its inside -through different information layers, or as proposed by Vesalius in its atlas "Humani Corporis Fabrica" [Richardson98]. Figure 2 shows the correspondence that can be established between a human body and a cartographic map.
Many of the cartographic concepts have been for a while around the human body visualization in an implicit way [SkupinOO] . There is also an evident need to define a spatial reference to human body data. The great difference is the nature of the reference. ln traditional cartography, data is always considered as geo-referenced, because the reference is the Earth globe. ln the case of the human body, in terms of the spatial human body representation, it scales the human body. So, it can be referred as "human-referenced", in place of geo-referenced.

Figure 2: Relationship between different layers of human body information
Another important issue is the use of a cartographic metaphor [Skupin02] in the visualization of the human's body data. A cartographic approach to mapping nongeographic information helps to manage graphic complexity in visualizations. It aids domain comprehension by forcing us to use the sarne cognitive skills that we use when viewing geographic maps. On the other hand, severa! studies show that maps can be used and understood by 4 year children, with no need of previous training or experience. The use of cartographic metaphors can be a huge benefit in terms of information understanding and human cognition.
An interesting aspect is the direct relationship between cartographic visualization and human being spatial think-
tic, etc. They can be distinguished in terms of system representation or thinking. The spatial thinking is composed of cognitive capabilities (that are in fact a group of declarative and perceptive forms of knowledge) and some analytic operations that can be performed on them - transformations, combinations, etc. If we understand the meaning of the space, we can use its properties to properly structure problems, find answers and express solutions. Nevertheless, cartographic visualization helps to achieve this kind of thinking and reasoning [FabrikantO l].
3. CHUB MODEL CHUB is a model that was developed taking into consideration the main principies of cartographic modelling. It structures data according to different layers of information. Each layer is associated to a specific organ and/or system, and might contain geometric data or attributes that are "human-referenced". CHUB has not been developed as a dynamic model. lt is considered that dynamic issues related to human's body data, such as body movement, blood flow or heartbeat (besides others) will be accomplished by other models that should be used as a specialized extension to CHUB.
3.1 CHUB's Architecture The architecture includes three main components: i) Data repository; ii) Data analysis, and iii) Data Visualization. Figure 3 shows the general model design.
Data Visualization
Resu l t s Visualizat i o n
Resules Managemene
Oa. t:.a. Reposieory Management
ing [Peuquet02]. There are severa! different ways of thinking: verbal , logic, hypothetical , mathematics, statis-
• Figure 3. CHUB's architecture
li
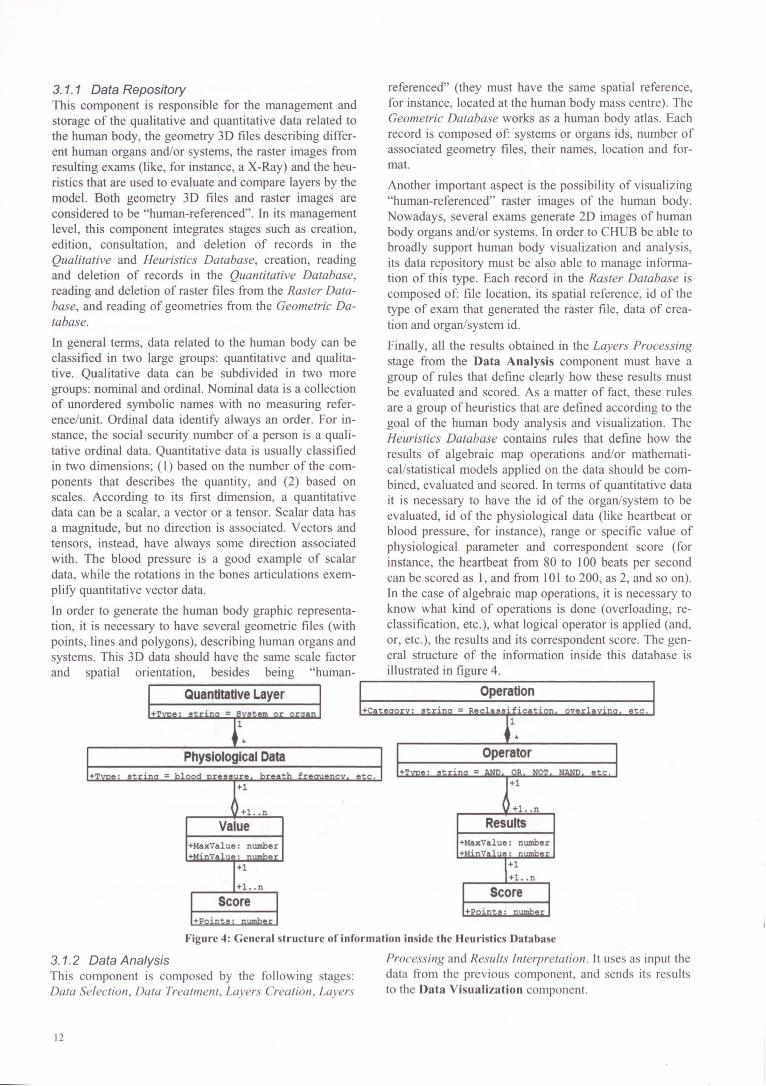
3. 1. 1 Data Repository referenced" (they must have the sarne spatial reference, This component is responsible for the management and for instance, located at the human body mass centre). The storage of the qualitative and quantitative data related to Geometric Database works as a human body atlas. Each the human body, the geometry 3D files describing differ- record is composed of: systems or organs ids, number of ent human organs and/or systems, the raster images from associated geometry files, their names, location and for-resulting exams (like, for instance, a X-Ray) and the heu- mat. ristics that are used to evaluate and compare layers by the Another important aspect is the possibility of visualizing model. Both geometry 3D files and raster images are "human-referenced" raster images of the human body. considered to be "human-referenced". ln its management Nowadays, severa! exams generate 2D images of human levei, this component integrates stages such as creation, body organs and/or systems. ln order to CHUB be able to edition, consultation, and deletion of records in the broadly support human body visualization and analysis, Qualitative and Heuristics Database, creation, reading its data repository must be also able to manage informa-and deletion of records in the Quantitative Database, tion of this type. Each record in the Raster Database is reading and deletion of raster files from the Raster Data- composed of: file location, its spatial reference, id of the base, and reading of geometries from the Geometric Da- type of exam that generated the raster file, data of crea-tabase. tion and organ/system id.
ln general terms, data related to the human body can be Finally, ali the results obtained in the layers Processing classified in two large groups: quantitative and qualita- stage from the Data Analysis component must have a tive. Qualitative data can be subdivided in two more group of rules that define clearly how these results must groups: nominal and ordinal. Nominal data is a collection be evaluated and scored. As a matter of fact, these rules of unordered symbolic names with no measuring refer- are a group of heuristics that are defined according to the ence/unit. Ordinal data identify always an order. For in- goal of the human body analysis and visualization. The stance, the social security number of a person is a quali- Heuristics Database contains rules that define how the tative ordinal data. Quantitative data is usually classified results of algebraic map operations and/or mathemati-in two dimensions; (1) based on the number of the com- cal/statistical models applied on the data should be com-ponents that describes the quantity, and (2) based on bined, evaluated and scored. ln terms of quantitative data scales. According to its first dimension, a quantitative it is necessary to have the id of the organ/system to be data can be a scalar, a vector or a tensor. Scalar data has evaluated, id of the physiological data (like heartbeat or a magnitude, but no direction is associated. Vectors and blood pressure, for instance), range or specific value of tensors, instead, have always some direction associated physiological parameter and correspondent score (for with. The blood pressure is a good example of scalar instance, the heartbeat from 80 to 100 beats per second data, while the rotations in the bones articulations exem- can be scored as 1, and from 101to200, as 2, and so on). plify quantitative vector data. ln the case of algebraic map operations, it is necessary to
ln order to generate the human body graphic representa- know what kind of operations is done (overloading, re-tion, it is necessary to have severa! geometric files (with classification, etc.), what logical operator is applied (and, points, Iines and polygons), describing human organs and or, etc.), the results and its correspondent score. The gen-systems. This 3D data should have the sarne scale factor eral structure of the information inside this database is and spatial orientation, besides being "human- ___ il_Iu_s_tr_a_te_d_in_fi_i_gu_r_e_4_. __________ __,
Operatlon +
+1
+1. .n +l .. n
Vatue Resutts
+MaxValue: nwnber +MaxValue: numher
+ + .
+1 +1
Figure 4: General structure of information inside the Heuristics Database
3. 1. 2 Data Analysis This component is composed by the following stages: Data Selection, Data Treatment, Layers Creation , Layers
12
Processing and Results lnterpretation. lt uses as input the data from the previous component, and sends its results to the Data Visualization component.

ln the Data Selection stage, both the quantitative and the qualitative data that will be used to execute analysis and create inforrnation layers with attributes are identified, as well the 20 raster images that will be considered to compose the raster inforrnation layers. Besides this, the time range for data should be also indicated. This happens, because both quantitative data and raster images might be related to different time moments (dates, for instance). ln the case of quantitative data, a time moment might also be divided into severa! time intervals (hours, minutes or seconds, for instance). The quantitative data is sent to the Data Treatment stage, while the qualitative data and raster images to the layers Creation stage.
ln the Data Treatment stage, the selected quantitative data is initially evaluated in terrns of noise and possible errors are eliminated. Data can be clustered according to different granularities. This granularity can be defined in terrns of the number of the elements in the cluster (number of records in the quantitative data) or in terrns of time range. ln this stage, it is also identified and applied statistical or mathematical models to quantitative data. These models evaluate data according to different scientific perspectives and goals.
Depending on what organ or system the resulting output data from the previous stage are related to, it might be assumed that data is spatially "human-referenced", beca use each organ or system has a well defined spatial position within human body. Besides this, the data can be related to different time moments and/or clusters. On the other hand, geometry data (stored in the Geometric Database) that describe different parts of the human body have a common spatial reference, to the scale of the human body. The sarne is valid to the 2D raster images (stored in the Raster Database). lt is necessary that treated quantitative data from previous stage be also "human-referenced", so that it can be properly matched with other data. At this stage, this match is perforrned, and quantitative " human-referenced" inforrnation layers created. These layers are sent to the Data Visualization component and stored in the Statistics Database, being available for reuse by the system.
Body
30 coordinates = Body center mass position
Figure 5: Body's Iogic structure Besides this, in this stage di fferent "human-referenced" information layers are aggregated (and spatially interre-
lated between each other) in an inforrnation structure designated "Body". This structure is internai to the model and is composed basically by pointers to different addresses inside Geometric, Qualitative, Raster and Statistics Databases. 1t also contains an explicit reference to the average mass centre of the human body that serves as a spatial reference to the images, geometries and treated quantitative data. Each inforrnation layer inside "Body" can contain 3D geometric descriptions of organs/systems, treated quantitative data, qualitative data and/or 2D raster images. This structure is sent to the layer Processing stage. The logic structure of "Body" is completely inspired on hurnan 's body natural anatomic and physiological interrelationship. The body is composed of severa! systems. Each system might be composed by one or various organs. Systems and organs are described by physiologic data, which describes its general and/or specific working condition. The attributes CI_Vectorial, CI_Raster, CI_Quantitative and CI_Qualitative are lists of pointers to the 30 geometries, the 20 raster images, the treated quantitative data and the qualitative data, respectively. Figure 5 shows the logic structure of"Body".
The stage layers Processing is directly related to the application of algebraic maps operations to the " Body" inforrnation layers (created in the previous stage) and the evaluation of the obtained results. The user might be able to apply different spatial operations on treated data in order to extract more valuable inforrnation. The spatial combination of inforrnation layers can reveal and enhance important aspects of data correlation and interdependency. lt is considered that the overlaying and reclassification spatial operations might be of special interest to the model. This happens because physiological parameters present in different "Physiology" layers (inside "Body" structure) are norrnally analysed by doctors by the appliance of these spatial operations. When a doctor is diagnosing a disease, she/he combines (mentally) inforrnation from different physiological inforrnation layers, using several "and", "or", "if', or any other kind of logical operator, usually considering a certain order of layers to perforrn this evaluation. The overlaying operation is habitually performed on layers that are derived or not from the sarne layer "System''. ln the case of belonging to different layers "System", an aggregation operation should be performed before. The reclassification operation should be applied only on layers that derive from the sarne "System" layer. ln order to be possible the execution of algebraic map operations, the quantitative data have to be scored according to different rules. The Heuristics Database holds these rules. Depending of the id of the quantitative treated data (pointed by the attribute CI_Qua11titative in the " Physiology" layer derived from the "Body" layer), the type/nature of the data and the goal/type of mathematical/statistical method to be used, the Heuristics Database is consulted and an evaluation (score) produced. After this, according this score and the kind of algebraic map operation to perform, the Heuristics Database is once again consulted and a final evaluation produced. The results of this stage (specially the
13

resulting evaluations of the information layers of the " Body" structure) are sent to the Results Jnterpretation stage.
The Results Jnterpretation stage allows the evaluation of ali the options/decisions taken in the prior stages, integrating the results of the stage before. This evaluation generates results that might help doctors to diagnosis or to monitor patient's health conditions. ln this stage is generated the structure "Result". As a matter of fact, this structure is composed by the "Body" structure from the former stage (with severa) information layers) plus some other attributes - Date, Op_Results and Results. Date attribute holds the date ofthe "Result" structure creation, Op_Results holds the results of the algebraic map operations, and finally, the Results attribute keeps the evaluations of the quantitative treated data. This structure is sent to the Cartographic Database from the Data Visualization component, for latter reuse by the model.
3.1.3 Data Visualization This component is composed by two stages: Results Management and Results Visualization. The first stage is related to the management of the results that are sent by the previous component. It is composed of typical database management tasks, such as reading, deleting or querying, for instance. Two databases are used for information storage inside this component: the Cartographic and the Statistics Databases. The stage Results Visualization models visually the results, allowing an easy and straightforward understanding of their rneaning.
ln terms of visualization, it is important to consider the following aspects: the nature or/and type/dimension of the data to be visually represented, the goal of the final visualization, and the cognitive characteristics of the potential end-user. The stage Results Visualization has as basics premises these aspects. It uses as input the information present in the Cartographic Database. Because this inforrnation is composed also by a list of pointers to other existing databases in the model, Geometric, Raster, Qualitative and/or Statistics databases, they are therefore also consulted. The geometry data (read frorn the Geometric Database) is used to create a representation of a 3D pseudo coloured human body. Besides this, this data can be mapped with different visual techniques, according to the results of algebraic map operations and/or evaluations of quantitative treated data. The 2D raster images (from the Raster Database) can be overlaid over the 3D human body representation with different degrees of transparency. The qualitative information is basically represented by icons or text.
Goa! Data Technique Pseudo-coloured 3D human
Distribution Scalars body, 20 Line chart, Histo-gram, Treemap
Vectors 3D Hedgehogs, arrows
Scalars 20 Bars chart 3D contour
Oifference, tines over the human bodv Amplitude Vectors,
Gtyphs Tensors
Table 1: Techniques, data and goals of visualization
14
The existing data in the Statistics Database are typically quantitative. This means that they can be scalars, vector or tensors. Besides this, they are "human-referenced", and resulting from some mathematical or statistical model applied to the original quantitative data. Accordingly to the goals of these models and the nature/dimension of data, typical cartographic, scientific or/and information visualization techniques should be used conveniently. Table 1 shows some possible combinations between methods, data and techniques.
The results of algebraic map operations (present in the Cartographic Database) have a strong spatial connotation. Because of this, cartographic oriented visual techniques should be applied in order to create a "mapmetaphor" visualization of the human body. Table 2 relates some visual techniques and possible situations. It is assumed that these techniques are applied to the 3D visual representation ofthe human body.
Situation Technique
Results of the overlay- Texture, pseudo-colour, ing ooeration zoom, segmentation, trans-Results of the reclassifi- parency cation operation Variation of x, y and z Contour Jines, pseudo-colour, coord inates transoarencv
Table 2: Visual cartographic oriented techniques Finally, the stage Results Visualization is composed of three typical render pipeline stages: filtering, mapping techniques and render. The Filtering stage allows the end- user to choose portions of data to be visualized. The Mapping stage associates geometry data with visual attributes, according to the chosen visual technique. The Render stage turns geometry data into image.
4. CASE STUDY: HYDROKINETIC THERAPHY A case study to validate our model is required. We have
adopted a case study based on hydrokinetic therapy within a collaboration scenario with doctors and therapist of a local county hospital. ln this section we present the case study scenario, the adapted CHUB architecture, as also we present the prototype implemented and draw out a final analysis of results.
4.1 Hydrokinetic Therapy Scenario Hydrokinetic therapy is composed of severa! and different techniques that are applied and based on submersed human body movement. As a matter of fact, it is a kind of hydro physiotherapy. Patients should perform severa) different therapeutic exercises and movements under water, according to their health needs and handicaps. Patients suffering from rheumatic, orthopedic, psychological, neurological or cardiac diseases might have their life quality improved if hydrokinetic therapy is applied to them on a regular basis [Fiorelli02].
A special suit provided with electronic sensors is being developed to maximize session performance and allow an accurate monitoring and eva luation of patient's treatment response. It is clear the need of a well tailored computer app lication that process and records properly ali

data sent by sensors in real time. This computer application should also be able to offer effective and straightforward different data visualizations, which help therapists and doctors to have information insight, and easily evaluate patient's condition during a session and/or between sessions, working as a tool for diagnosis and decision support.
Ali captured data during a session will be sent to a computer in order to be properly processed. It is of great importance the creation of a suitable computer application that guarantees accurate and reliable data treatment. Besides that, the huge amount of information demands powerful and comprehensive data visualization. The main goals for an application to this field of knowledge, and therefore for the considered reference model, include:
Record sessions, creating a patient's hydrokinetic therapy sessions database;
Analyze patient's performance dynamically in a session, considering his/her heartbeat, breath frequency and articulations (hips, shoulders and vertebral spine) amplitude movements and rotations;
Execute historical evaluation of data along patient's sessions, through different comparisons between them - evaluate the evolution of patient's treatment response;
Reduce risks during a session (alarms) and evaluation of errors;
Help medical diagnosis and improve patients monitoring;
Process in real time data sent up to 1 O suits simultaneously;
Visualize evaluation and analysis results, making easy information aware and insight;
Review sessions;
Promete an easy and straightforward interface to doctors and therapists ;
Patient's database management.
4.2 Adapted CHUB Architecture The reading databases hold patient's records (name, address, age, etc - Qualitative Database), hydrokinetic session ' s recordings (Quantitative Database), geometry (body systems and organs - Geometric Database) and logic for illness diagnosis (Heuristics Database). Writing databases hold results of statistical evaluation of the hydrokinetic sessions (Statistic Database) and algebraic maps operations (Cartographic Database) performed on human-referenced information layers.
ln the Data Analysis component is executed the statistical processing of data gathered along one and/or several hydrokinetic sessions and algebraic maps operations on information layers. Because a hydrokinetic session should also be analysed and visualized in real time, data processing must attend the synchronism characteristics of a communication port reading. These aspects must be
considered in both the Data Analysis and Results Visualization components.
4.2.1 Data Repository component This component is responsible for the management ofthe patient's database (Qualitative Database), hydrokinetic sessions recording files (Quantitative Database), the geometry files containing human-referenced 3D descriptions of different parts of the human body (Geometric Database) and the description of the logical decision tree performed by the doctor when he/she diagnosis an arthrosis in the knee (Heuristics Database).
Patient's records are stored into a relational database with four tables. Patient's data include general information about the patient, such as his/her therapist, disease or age, and personalized physiological parameters such as his/her maximum permitted heartbeat value. These parameters are used for alarmist purposes. Hydrokinetic session recordings include patient's heartbeat, breathing frequency, hips, shoulders and spine rotations (in terms of pitch, yaw and roll) at each rnillisecond, besides suit identification number, patient's name and date and time. Each session might last 30 minutes. Figure 6 illustrates the structure of a recordin file.
<<! nt i ty>> Lef! Hlp Sensor +Pitch : float +Yaw : f lo.t +Roll : float
<<Enti t y>> Sesslon Recordlng
<<Entity>> Rlght Hlp Sensor +Pi t ch: float +Yaw: floa t +Roll: float
l. ... 1. . ..
<<Ent i ty>>
+Yaw : tloa 't +Roll : f l oa t. + .
Rlght Shoulder Sensor <<Ent i ty>> Lef! Shoulder Sensor +Pi tch : flo.t. t +Yaw : flo at +Ro ll : f loat
+Pi tch: fl o.t. 't.
+Yaw: f l oat +Roll : floa t
Figure 6: Hydrokinetic session recording file
4.2.2 Data Ana/ysis component ln the Data Selection stage the patient and his/her related recording session files are chosen in order to be analyzed. Several sessions recordings and periods of time are available. If more than one session file is chosen, a historical evaluation of patient's data is performed; otherwise, a unique session is analyzed. ln Data Treatment stage, the noise is being deleted and data clustered according the chosen granularity in previous stage.
ln the Layer Creation stage data is arranged into layers. Figure 7 shows severa( layers of information and their interdependency. These layers are being processed in the Layer Processing stage. Maximum, minimum, medium, standard deviation and linear regression values both for clustered and global data are being evaluated. The doctor or therapist might extract valuable information both from the treated data and the results obtained from this phase. He/She can also perform overlapping and reclassification spatial operations (algebraic maps operation) on data in
15

order to ach ieve different insights and help knee arthrosis diagnosis eva luation. Finally, in Results Jnterpretation stage, all the results from previous stages are being consolidated and data sent to the Statistical Database. For simplification purposes at this implementation sta e, the
<<Syste.m>>
Resplratory +CI Vectorial: 3D coordinates = poliqon.s + - . = .
<<Orqan.s>>
Lungs
+l
<<Orga.n>>
Heart
<<Patient>> Body
+Patient: string +!irthDate: data +Address: string +Phone: numérico +Diseu~: n.rin?
<<Sy:it.ea>>
Cardlac
+l .. n
<<Organ>>
Artertes
Cartographic Database has not yet been created, and the structure "Result" recorded for further reuse.
«Syat.em>> Skeleton
<<Orqan>>
Hlp
<<Orqan>>
Shoulder
+l «Physioloqy»
Artlculatlon
Figure 7: lnformation layers
4.2.3 Data Visualization component Table 3 shows the correspondence between the situation/data in analysis and the proposed visualization technique. These visualizations are automatic generated.
Situation Visualization technique Heartbeat Line graph Breathing freauencv Line graph Rotations in articulations 30 hedgehogs, 30 stereoscopic hu-
man body with animation and sen-sors tagged as symbols.
Oistribution of freauencies Histogram Oistribution of rotations 30 Human Body, hedgehogs Overlapping operation Texture, pseudo colour, segmenta-
tion, transparency and zooming of a 30 stereoscopic human body
Reclassification operation Texture, pseudo colour, segmenta-tion, transparency and zooming of a 30 stercoscopic human body
Locations (x, y, z) m the Contour lines, pseudo color, rotation human body model and transparency of a 30 stereoscop-
ic human body Alarms of danger si tuations Sound, text and blinking effect
Table 3: Situation versus visualization techniques
16
4.3 Prototype ln order to evaluate and validate the model , a prototype is being developed. YTK 5.0 (Visualization Toolkit) from Kitware Inc. [Kitware06] is being used to implement ali graphical 2D and 3D visualization routines. It is a free open source for three-dimensional (3D) computer graphics, image processing and visualization. This library is object oriented. KWWidgets, also from Kitware Inc., is being used to implement the application interface. It is also a free open source for graphical interfaces development, and can be installed on different platforms, such as Windows, Mac and various types ofUnix/Linux.
At this moment, a second version of the prototype has been deployed and is being used and experimented by doctors and therapists of the hospital.
This version of the prototype is nearly at its final stage, and the next step is to build a solution that can be tested with a sensor suit. This suit wi ll give the application a real environment and therefore the final test to the model.
4.4 Principal Results Our CHUB model and architecture ha the advantage of supporting a fairly imple data processing and intuitive information visua li zation. The integration of different

layers enables an effective data combination and therefore insight on data. Also, it is easy to establish the correspondence between body 's quantitative data and the visualization results, because of the cartographic ap-
.<"Y,,"'5o 8YA<t)!o[l.).»S ~.,5o ..-A(.~ f.o•.JO~ ,Wlct, ~)
•-•-l •~l•-1 Ytlt4et~
v._._, V .... M ...........
o.~,---r-a c-.w 19' a ... o.Pnti- 'º a..c..w to Orc.oDtY.,. 'IO Ortwii>l:0Pt:t1 IO O'lboC-o Aol 90 0 .... 1 .. 'r'- !D J.-.Ot~ 90 .--.,(..,:-. 10 ~o,v.,. 10 ~<J[t4~ u o oU<•t ... i•t;Jt ~o
Jirc.tl•'t- 'º C.-Ptsh 90 C....Aiil iO e~..-..-: 10 ~D•flilch 'º '~C-Aol U ..._,.,,.,. 10 ...._[~ H ,_..E .. fW 10
~(;<&Y.,.. 10
·'º
proach. Nevertheless, it has the disadvantages common to cartographic models - it is a static model. This can be overcome by the addition of an extension of a dynamic human's body model.
•- ~j"X I
o
Figure 8: Hydrokinetic session analysis
The prototype has some problems conceming fault tolerance and global delays (in real time sessions). During the first experiments in context of the case study scenario we notice a ood acce tance and overall ositive res onse.
Fchso ~ ~deOados Sessio H5tóric:o Conl\rpaçio Jande Apja;
e ... o...,.ls~l"""""'lc...g."'I
1 queleto
1eço Direito v ..... Tmd:ura 1aoçoE1quenlo v ....
'"""• ent.aDÍ'eita v,;,,i
_J
r Adçlo
r.' DWeiença
c"' MetaO~
r P'loi-Diai,Ylóllico
'~"
_J
EilloY J
Oefne a COI da camada
Some essential characteristics of the prototype such as the support for generation of views and diagnosis evaluation/maintenance were fully approved.
c=----c
Figure 9: Cartographic visualization and analysis
17

The figure 8 shows the main visualization windows to analyse and view the treated data from hydrokinetics therapy recording sessions. The upper window allows doctors/therapists to have different zooms and points of view of the rotations of patient's articulations, while the lower window works mainly as a heartbeat and movement monitor. Histograms, maximum, minimum, average, standard deviation and linear regression values, besides these views, work as a support too! for doctors/therapists to diagnose patient's overall condition.
The figure 9 shows the cartographic visualization of the human body. According to the selected organs and type of algebraic map operation, severa! views of the human body are generated. These views are mapped with differcnt textures and degrees oftransparency.
5. CONCLUSIONS ANO FUTURE WORK Nowadays, severa! applications are being developed taking into account our natural ability to think spatially. Cartographic models are a significant pillar of spatial analysis, and should not be underestimated. Therefore, the importance of these models is being spread to other knowledge fields, such as medicine or biology. The sarne is happening with the usage of cartographic visual metaphors. They are being applied also on non-typical cartographic data.
Human's body data has a strong spatial interdependency. A doctor ' s diagnostic is always implicitly based on his/her spatial thinking ability. He/she should always combine information from different systems and/or organs in order to achieve a reasonable diagnostic about an illness. Any model that intends to properly give support to human's body data analysis and visualization should take into account this. Besides that, it also should attend the aspects of a decision and diagnosis support tool. Visual results must allow a good information insight besides a better knowledge of patient' s condition and handicaps. lt is of great importance its accuracy and reliability. The usage of a cartographic based model may help to achieve this, allowing a proper combination and balance between tasks goals, data and visualization model.
CHUB is a model that takes into account ali these considerations. lt might be used as a reference model to any application that intends not only to analyze and visualize human's body data, but with the proper adaptations, any
18
organic data (which has the sarne spatial interdependency demands).
Future work involves the continuity of the prototype implementation and evaluation.
6. ACKNOWLEDGES We would like to thank the hydrokinetics therapy staff from Prelada Hospital for ali their support.
7. REFERENCES [Druck04] Druck, S. et ai. , 2004. Análise Espacial de
Dados Geográficos. A. V. M. Ed., EMBRAPA, Brasília, Brazil.
[FabrikantO !] Fabrikant, S. and Buttenfield, B. , 200 l. Formalizing Semantic Spaces for lnformation Access . ln Annals of the Association of American Geographers, Oxford, UK, pp. 263-280.
[Fiorelli02] Fiorelli, A., 2002. Hidrocinesioterapia: Princípios e Técnicas Terapêuticas. Colecções Plural , EDUSC, Santa Catarina, Brazil.
[MacEahren05] MacEahren, Alan et ai. , 2005. Exploring Geovisualization. Elsevier Editions, USA.
[Peuquet02] Peuquet, D. and Kraak, M. 2002, Geobrowsing: Creative Thinking and Knowledge using Geographic Visualization. ln lnformation Visualization, Volume 1, Nº l, pp. 80-91.
[Richardson98] Richardson, W ., 1998. On the Fabric of the Human Body: A translation of de Corporis Humani Fabrica. Norman Publishing, S. Francisco USA.
[SatoO 1] Sato, Mitsuru, 2001. Making a Human Body Map. ln Naturelnterface, nº 4,pp. 56-59.
[SkupinOO] Skupin, A., 2000. From Metaphor to Method: Cartographic Perspectives on Information Visualization. Proceedings IEEE InfoVis 2000, Utah, EUA, pp. 91-97.
[Skupin02] Skupin, A., 2002. A Cartographic Approach to Visualizing Conference Abstracts. ln IEEE CG&A, Volume 22, Nº 1, pp. 50-58 .
[Kitware06] Kitware, Inc., 2006, The VTK User's Guide. Kitware, Inc. Publishers, Colombia.