analysing and quantifying visual experience in medical imaging
TRANSCRIPT
Analysing and quantifying
visual experience in medical imaging
A thesis submitted in partial fulfilment of the requirement for the degree
of
Doctor of Philosophy
Lucie Lévêque
March 2019
Cardiff University
School of Computer Science and Informatics

ii

iii
DECLARATION
This work has not been submitted in substance for any other degree or award at this
or any other university or place of learning, nor is being submitted concurrently in
candidature for any degree or other award.
Signed:
Date: 23/03/2019
STATEMENT 1
This thesis is being submitted in partial fulfilment of the requirements for the degree
of PhD.
Signed:
Date: 23/03/2019
STATEMENT 2
This thesis is the result of my own independent work/investigation, except where
otherwise stated, and the thesis has not been edited by a third party beyond what is
permitted by Cardiff University’s Policy on the Use of Third-Party Editors by
Research Degree Students. Other sources are acknowledged by explicit references.
The views expressed are my own.
Signed:
Date: 23/03/2019

iv
STATEMENT 3
I hereby give consent for my thesis, if accepted, to be available online in the
University’s Open Access repository and for inter-library loan, and for the title and
summary to be made available to outside organisations.
Signed:
Date: 23/03/2019
v
Abstract
Healthcare professionals increasingly view medical images and videos in a variety of
environments. The perception and interpretation of medical visual information across
all specialties, career stages, and practice settings are critical to patient care and safety.
However, medical images and videos are not self-explanatory and thus need to be
interpreted by humans, who are prone to errors caused by the inherent limitations of
the human visual system. It is essential to understand how medical experts perceive
visual content, and use this knowledge to develop new solutions to improve clinical
practice. Progress has been made in the literature towards such understanding,
however studies remain limited.
This thesis investigates two aspects of human visual experience in medical imaging,
i.e., visual quality assessment and visual attention. Visual quality assessment is
important as diverse visual signal distortion may arise in medical imaging and affect
the perceptual quality of visual content, and therefore potentially impact the diagnosis
accuracy. We adapted existing qualitative and quantitative methods to evaluate the
quality of distorted medical videos. We also analysed the impact of medical specialty
on visual perception and found significant differences between specialty groups, e.g.,
sonographers were in general more bothered by visual distortions than radiologists.
Visual attention has been studied in medical imaging using eye-tracking technology.
In this thesis, we firstly investigated gaze allocation with radiologists analysing two-
view mammograms and secondly assessed the impact of expertise and experience on
gaze behaviour. We also evaluated to what extent state-of-the-art visual attention
models can predict radiologists’ gaze behaviour and showed the limitations of existing
models.
This thesis provides new experimental designs and statistical processes to evaluate the
perception of medical images and videos, which can be used to optimise the visual
experience of image readers in clinical practice.

vi

vii
Acknowledgements
Many people, worldwide, helped me and supported me during my PhD journey, which
would not have been possible, nor even imaginable without them. I would love to use
this opportunity to show them my gratefulness.
First, I would like to express my deepest gratitude to my supervisor, Dr. Hantao Liu,
for offering me the possibility to apply for a PhD position, and for his excellent advice
on my work. I would also like to thank Dr. Christine Ménard, Prof. Patrick Le Callet,
and Prof. Hilde Bosmans for their help on my research, as well as all the other
researchers (the list is very long!) I had the chance to meet in diverse
conferences/countries/continents.
This work would not have been possible without the many medical experts from
Angers (France), Hull (United Kingdom), and Leuven (Belgium) hospitals, and Breast
Test Wales, who participated in my subjective experiments, particularly Fleur
Plumereau, Emilie Lermite, Matthieu Labriffe, Louis-Marie Leiber, Pamela Parker,
Lesley Cockmartin, Machteld Keupers, Chantal Van Ongeval, Phillippa Young, and
Claire Godfrey. I would like to acknowledge their interest and generosity, as we all
know that doctors are always extremely busy.
My thanks also go to my colleagues (and friends) in Cardiff School of Computer
Science and Informatics, as we shared a few tears and a lot of laughter, as well as a lot
of food during all our coffee breaks, tea breaks, cake breaks... Thank you Nyala Noë
and Baskoro Adi Pratomo for being the best teaching partners ever!
Talking about friends, I probably need to mention – and thank – all my “buddies”
around the world, particularly Emilie Leclerc (in France), Fangjian Hu (in China) and
Kwesi Afful (in Ghana), who have been following me and loving me from the
beginning. So many other people have to be cited, but I would need a whole chapter
to do so.

viii
Finally, my deepest appreciation goes to my parents, Laurent and Béatrice, my
grandparents, Georges and Marguerite, and my brother, Adrien, who have always been
supporting me no matter what – even when I travel the world on my own, with my
backpack and my camera, and do not tell them when/if I will come back home.
Je dédicace cette thèse à mon Papy, le meilleur. Tu nous manques énormément.
Lucie
PS: “The future belongs to those who believe in the beauty of their dreams.”
– Eleanor Roosevelt

ix
Table of contents
Abstract ........................................................................................................................ v
Acknowledgements .................................................................................................... vii
Table of contents ......................................................................................................... ix
List of publications ................................................................................................... xiii
Chapter 1: Introduction ................................................................................................ 1
1.1 Motivation .......................................................................................................... 1
1.2 Research questions and objectives ..................................................................... 3
1.3 Thesis structure and contributions ...................................................................... 4
Chapter 2: Background ................................................................................................ 7
2.1 Image quality assessment ................................................................................... 7
2.1.1 General methodologies ................................................................................ 7
2.1.2 Application to medical imaging ................................................................... 9
2.1.3 Summary points ......................................................................................... 14
2.2 Eye-tracking in medical imaging...................................................................... 18
2.2.1 Visual search patterns ................................................................................ 19
2.2.2 Influence of experience and expertise ....................................................... 22
2.2.3 Impact of training on viewing behaviour ................................................... 26
Chapter 3: How do medical professionals perceive video quality? ........................... 29
3.1 Introduction ...................................................................................................... 29
3.2 Semi-structured interviews: relating quality in the context of telesurgery....... 30
3.2.1 Protocol ...................................................................................................... 30
3.2.2 Results ........................................................................................................ 32
3.3 Controlled experiment: rating quality in the context of telesurgery ................ 34
3.3.1 Methodology .............................................................................................. 34
3.3.2 Results for open surgery ............................................................................ 39
x
3.3.3 Results for laparoscopic surgery ................................................................ 44
3.4 Dedicated study: the impact of video compression .......................................... 48
3.4.1 Methodology .............................................................................................. 48
3.4.2 Experimental results .................................................................................. 51
3.5 Main findings and contributions ....................................................................... 55
Chapter 4: The impact of medical specialty on the perceived quality ...................... 57
4.1 Introduction ...................................................................................................... 57
4.2 Visual quality perception experiment with radiologists and sonographers ...... 57
4.2.1 Stimuli ........................................................................................................ 57
4.2.2 Experimental procedure ............................................................................. 59
4.2.3 Test environment and participants ............................................................. 60
4.3 Image quality assessment behaviour analysis: radiologists versus
sonographers ........................................................................................................... 61
4.4 Main findings and contributions ....................................................................... 71
Chapter 5: Study of visual attention in screening mammography ............................. 73
5.1 Introduction ...................................................................................................... 73
5.2 Eye-tracking experiment .................................................................................. 74
5.2.1 Stimuli ........................................................................................................ 74
5.2.2 Experimental procedure ............................................................................. 76
5.2.3 Participants................................................................................................. 77
5.3 Experimental results ......................................................................................... 77
5.3.1 Number and duration of fixations .............................................................. 77
5.3.2 Fixation deployment .................................................................................. 82
5.3.4 Computational saliency.............................................................................. 87
5.4 Main findings and contributions ....................................................................... 91
Chapter 6: Impact of the medical specialty and experience on image readers gaze
behaviour .................................................................................................................... 93
6.1 Introduction ...................................................................................................... 93

xi
6.2 Eye-tracking experiment .................................................................................. 93
6.2.1 Stimuli ........................................................................................................ 93
6.2.2 Experimental procedure ............................................................................. 94
6.2.3 Participants................................................................................................. 95
6.3 Experimental results ......................................................................................... 96
6.3.1 Gaze duration ............................................................................................. 96
6.3.2 Fixation deployment ................................................................................ 102
6.3.3 Analysis of saccadic features ................................................................... 106
6.4 Main findings and contributions ..................................................................... 109
Chapter 7: Conclusions and discussion .................................................................... 111
7.1 Study of perceived visual quality ................................................................... 111
7.2 Study of human visual attention ..................................................................... 112
7.3 Future work .................................................................................................... 113
7.3.1 Technological complexity........................................................................ 113
7.3.2 User community ....................................................................................... 113
7.3.3 Demographic complexity ......................................................................... 113
7.3.4 Objective approaches ............................................................................... 114
Bibliography ............................................................................................................. 115
Appendix .................................................................................................................. 125

xii
xiii
List of publications
The work presented in this thesis is based on the following peer-reviewed publications.
More specifically,
Chapter 2 is based on:
L. Lévêque et al., “On the Subjective Assessment of the Perceptual Quality of Medical
Images and Videos”, 10th International Conference on Quality of Multimedia
Experience (QoMEX), Sardinia, Italy, May 2018.
L. Lévêque, H. Bosmans, L. Cockmartin, and H. Liu, “State of the Art: Eye-Tracking
Studies in Medical Imaging”, IEEE Access, vol. 6, pp. 37023-37034, June 2018.
Chapter 3 is based on:
L. Lévêque, W. Zhang, C. Cavaro-Ménard, P. Le Callet, and H. Liu, "Study of Video
Quality Assessment for Telesurgery”, IEEE Access, vol. 5, pp. 9990-9999, May 2017.
L. Lévêque, H. Liu, C. Cavaro-Ménard, Y. Cheng, and P. Le Callet, "Video Quality
Perception in Telesurgery", 19th IEEE International Workshop on Multimedia Signal
Processing (MMSP), Luton, United Kingdom, October 2017.
Chapter 4 is based on:
L. Lévêque, W. Zhang, P. Parker, and H. Liu, “The Impact of Specialty Settings on
the Perceived Quality of Medical Ultrasound Video”, IEEE Access, vol. 5, pp. 16998-
17005, August 2017.

xiv
Chapter 6 is based on:
L. Lévêque, B. Vande Berg, H. Bosmans, L. Cockmartin, M. Keupers, C. Van
Ongeval, and H. Liu, “A Statistical Evaluation of Eye-Tracking Data of Screening
Mammography: Effects of Expertise and Experience on Image Reading”, submitted to
Elsevier Signal Processing: Image Communication, October 2018.
1
Chapter 1:
Introduction
1.1 Motivation
Medical imaging involves several scanning techniques to visualise the interior of the
human body, along with a representation of the functions of some organs or tissues.
Medical imaging provides clinical information either unavailable by other means or
with reduced invasiveness, playing a key role in assisting clinicians in diagnosis,
treatment planning, and monitoring of patients. Digital medical images are nowadays
used in a broad range of medical specialties, including radiology, cardiology,
pathology, and ophthalmology [1]. In radiology, for instance, there are approximately
one billion imaging examinations conducted worldwide every year. The technologies
used to acquire medical images in radiology include X-ray, ultrasound, thermography,
computed tomography (CT), magnetic resonance imaging (MRI), positron-emission
tomography (PET), single-photon emission computed tomography (SPECT), etc. Both
2D and 3D content may be generated using some of these imaging modalities, as well
as video content. Therefore, a large amount of medical visual information is being
continuously created, to be viewed or manipulated by medical professionals in their
routine practice. Besides radiology, other imaging procedures are commonly applied
in diagnosis and treatment planning, such as pathology slides and endoscopic surveys.
Furthermore, with the advancements in telemedicine, and particularly in image-guided
surgery and tele-surgery [2], images and videos are now being applied in real-time
frameworks.
However, medical images are not self-explanatory, i.e., their conclusions are not
always obvious. Ultimately, medical images need to be inspected and interpreted by
the human eye-brain system. Unfortunately, this interpretation task is not always easy
and even competent clinicians can make errors, mainly due to the inherent limitations
of human perception. Estimates indicate that, in some areas of radiology, the false
negative rate (i.e., when a test result indicates a patient has no disease, and they
actually have it) may be as high as 30%, with an equally high false-positive rate (i.e.,
2
when a test result indicates a patient has a disease, and they actually do not have it)
[3]. Therefore, the decisions rendered by clinicians are not always absolutely
conclusive [4]. To eliminate errors and improve patient care, it is of fundamental
importance to better understand perceptual factors underlying the creation and
interpretation of medical images [1], [5] as accuracy is the most important objective
in diagnostic imaging practice.
With the advent and growth of imaging technology in medicine, methodologies used
to acquire, process, transmit, store, and display images vary and, consequently, the
ultimate visual information received by clinicians or other health professionals differs
significantly in perceived quality. Visual signal distortions, such as various types of
noise and artifacts arising in medical image acquisition, processing, compression,
transmission, and rendering, affect the perceptual quality of medical images and
potentially impact the accurate and efficient interpretation of images [6]. Quality
degradation of medical images often occurs at the acquisition or image post-
processing stage. For example, the common sources of MRI artifacts include non-ideal
hardware characteristics, intrinsic tissue properties and their possible changes during
scanning, and a poor choice of scanning parameters [7]-[8]. In digital radiology using
X-rays, common artifacts are caused by under-exposure or over-exposure, collimation
issues, and grid use [9]-[10]. CT images are more likely to suffer from artifacts than
other radiographs, as the image reconstruction depends on a large number of
independent measurements [11]. Finally, in telemedicine, where medical images and
videos are being acquired, compressed, transferred, and stored to remotely diagnose
and treat patients, various types of compression artifacts and transmission errors, such
as blurring, ringing and packet loss, can be produced [12]. Such distortions or artifacts
may not preserve essential information for diagnosis and treatment planning. To
minimise potential clinical errors caused by visual distortions, and with a view to
improve general clinical practice, it is important to understand how medical
professionals perceive the quality of medical images and videos through subjective
image quality assessment methodologies and statistical data analysis [13].
The human visual system (HVS) is the part of the central nervous system which
enables humans to see their environment [14]. Visual attention represents a powerful
mechanism of the HVS, which helps the human brain to continuously minimise the
3
overloading amount of input into a manageable flow of information, reflecting the
current needs of the organism and the external demands [15]. In medical imaging,
visual attention has been studied in relation to the perception and interpretation of
images. Eye-tracking – the process of measuring where people look – has been widely
used to record eye movements of image readers, and study how they interact with
visual information. Eye-tracking studies have been conducted, for instance, in
radiology to reveal how visual search and recognition tasks are performed, providing
information that can improve speed and accuracy of radiological reading. Eye-tracking
can indeed help with identifying sources of errors [16]. Finally, eye-tracking can also
be used to improve training of early career radiologists, as training methods can use
gaze training and pattern recognition [17].
1.2 Research questions and objectives
This thesis investigates the following research questions.
How do compression and transmission visual artifacts affect the perceived
quality of medical imaging?
Does the medical specialty (i.e., radiologists vs. sonographers) affect the
quality of visual experience? If so, to what extent?
How is visual attention allocated for different mammogram views (i.e., cranio-
caudal and medio-lateral oblique views) displayed simultaneously?
Does the specialty (i.e., radiologists vs. physicists) and experience (i.e., experts
vs. trainees) affect the gaze behaviour when analysing medical images?
To answer these questions, the following objectives are outlined.
To quantitatively assess the impact of various factors (e.g., compression,
transmission) on the perceived quality.
To quantitatively assess the impact of medical specialty on the perceived
quality.
To measure and analyse gaze data of mammograms via an eye-tracking
experiment.

4
To measure and analyse the gaze behaviour of medical professionals with
different medical specialty and degrees of experience.
1.3 Thesis structure and contributions
Chapter 2 gives a detailed introduction of subjective image and video quality
assessment in medical imaging, and also introduces the human visual attention
and eye-tracking experiments in medical imaging.
Chapter 3 presents new qualitative and quantitative methodologies developed
to assess the perceived quality of medical videos in the particular context of
telesurgery. We first performed semi-structured interviews, followed by video
quality scoring with expert surgeons. In this chapter, impacts of video content
(i.e., scene), compression strategy (i.e., compression scheme and ratio) and
transmission (i.e., frame rate and packet loss rate) on perceived quality are
studied. Statistical analyses show that compression artifacts and transmission
errors significantly affect the perceived quality; and that such effects tend to
depend on the specific surgical procedure, visual content, frame rate, and
degree of distortion.
Chapter 4 describes the conduct of a subjective visual quality assessment
experiment, aiming to understand the impact of medical specialty, i.e.,
radiologists versus sonographers, on the perceived quality of hepatic
ultrasound videos. The effects of video content and compression strategy on
the quality are investigated in this chapter. Results demonstrate that
sonographers are more bothered by the distortions than radiologists for highly
compressed stimuli, whereas they both have a similar experience with stimuli
at lower compression.
Chapter 5 details the design of an eye-tracking experiment with a large number
of cranio-caudal and medio-lateral oblique mammogram views. We conducted
a dedicated eye-tracking experiment with radiologists while reading these
mammography cases. Their eye movements were analysed to assess the
complementary use of these two mammogram views. Results demonstrated
5
that the medio-lateral oblique view attracts more attention than the cranio-
caudal view. Furthermore, we compared existing state of the art computational
models of visual attention with the ground truth visual attention data. We
evaluate whether and to what extent these models can predict gaze behaviour.
Chapter 6 presents a large-scale eye-tracking experiment with expert
radiologists, trainee radiologists, and physicists, aiming to better understand
their gaze patterns when reading medio-lateral oblique views of screening
mammograms. This chapter investigates the impact of expertise and
experience on gaze patterns. Both gaze duration and gaze deployment show
the consistency between expert radiologists, as well as variations between
different specialty groups. We also investigated the saccadic behaviour of
viewers and illustrated the differences between the groups in terms of saccade
amplitudes and orientations.
Finally, Chapter 7 summarises the outcomes of this thesis and discusses
directions for future research, including technological, human, and
demographic complexity, as well as an objective approach to study perceived
visual quality and visual attention in medical imaging.

6

7
Chapter 2:
Background
2.1 Image quality assessment
Despite important improvements in technology and digital imaging, one thing has
remained the same over the years and decades, i.e., the human visual system (HVS).
The HVS is composed of two functional parts, i.e., the eye and the brain. It can perform
a vast number of image processing tasks.
Image quality assessment is therefore critical to control and maintain the perceived
quality of visual content. Two different approaches can be considered to assess image
or video quality, i.e., objective and subjective evaluations [18]. Objective assessment
is based on mathematical algorithms which provide global or local quality measures.
This method is reproducible and does not need input of human observers; the main
goal of an image or video quality assessment metric is to automatically predict the
perceived quality of a content. On the contrary, subjective quality assessment requires
observers for a visual study of quality. As human observers are the ultimate receivers
of visual information, subjective quality assessment is considered the most reliable
approach, particularly in the medical field, where a patient’s safety is the priority.
2.1.1 General methodologies
As introduced previously, subjective image quality assessment provides the ground
truth on how human observers perceive image quality. The International
Telecommunication Union (ITU) established standardised methods for subjective
quality evaluation of image and video content. These methods can be divided into two
groups: single stimulus methods and multi stimulus methods. A brief description of
the representative methods is presented in this section, as well as their merits and
drawbacks.
8
2.1.1.1 Single-stimulus methods
The Absolute Category Rating (ACR) method [19], also called Single Stimulus (SS)
method, is a method where test sequences are presented one by one and rated
independently on a discrete quality rating scale. The most used scale is the five-level
overall quality scale, defined as follows: 1 = Bad, 2 = Poor, 3 = Fair, Good = 4, and 5
= Excellent. This method is easy to implement and allows a quick assessment.
However, a large number of observers is needed to obtain satisfactory statistical
analysis [20].
The configurations of the Single Stimulus Continuous Quality Scale (SSCQS) method
[21] are similar to the ones for the ACR method, but a continuous scale is used in this
case, i.e., a 100-point scale cut into five segments: (0-20) = Bad, (20-40) = Poor, (40-
60) = Fair, (60-80) = Good, and (80-100) = Excellent.
The Single Stimulus Continuous Quality Evaluation (SSCQE) method [21] is used
when the distortions of a video change over time. The score is adjusted in real time by
the observer during the whole duration of a video, on a continuous quality scale. The
main advantage of this method is to provide the evolution of quality over time.
Nevertheless, to use this method.
2.1.1.2 Multi-stimulus methods
The Double-Stimulus Impairment Scale (DSIS) method [19] and the Double-Stimulus
Continuous Quality-Scale (DSCQS) method [21] can be defined simultaneously as
they present some similarities, i.e., they both employ a deferred presentation of the
stimuli. When using the DSIS method, the reference stimulus is presented first, and
the distorted stimulus follows. For the DSCQS method, this presentation is repeated a
second time. A five-level impairment scale is used for the DSIS method where the
score is given for the distorted image, as follows: 1 = Very annoying, 2 = Annoying,
3 = Slightly annoying, 4 = Perceptible but not annoying, and 5 = Imperceptible. The
DSCQS method requires the assessment of two versions of each image on a continuous
quality scale. Both these methods involve multiple presentations of the original stimuli
and therefore require a considerable amount of time for the observers to complete the
experiment.
9
The Stimulus Comparison (SC) method [19], also referred to as Pair Comparison (PC)
method, offers a simultaneous presentation of two images or videos side by side. For
this method, different distortions of the same content are shown to the observer, who
has to choose the one they prefer. The main advantages of this method are that it
presents a simple and quick binary choice for the observer and brings reliable
statistical analyses [22]. However, this method requires a long time and it can be
difficult to watch and compare two videos at the same time.
For the Simultaneous Double Stimulus for Continuous Evaluation (SDSCE) method
[21], the reference stimulus and its distorted version are displayed side by side on a
monitor. As for the SSCQE method, the quality is evaluated over time on a continuous
scale.
Finally, the Subjective Assessment Methodology for Video Quality (SAMVIQ) [23]
offers the visualisation of a short video through a graphic interface, where the observer
can navigate among the reference and the distorted versions of the content. Each video
has to be assessed on a continuous quality scale; the observer has to assess all the
different sequences of a content before being able to assess the other contents. This
method allows the observer to watch the videos several times and to modify their
scores if needed.
2.1.2 Application to medical imaging
In recent years, there has been a growing interest in studying the perceptual quality of
medical images and videos. Previous studies have shown that the influence of
professional expertise on the assessment of medical image quality is significant, and
that experts and naïve observers (i.e., without medical imaging or clinical experience)
differently assess the quality of medical visual content degraded with distortions [24].
Psychovisual experiments have been conducted with medical experts assessing the
quality of images or videos in various application environments, e.g., in radiology or
in the context of telemedicine. Depending on their research question and on the
modality chosen, researchers have been using diverse methodologies suggested by the
ITU to assess the perceived quality of medical content. In this section, we present an
overview of the methods used by diverse research teams, as well as a description of
their experimental procedure and results. The aim is to understand how the perception
of medical imaging users is affected by specific visual distortions and then use these
10
results to develop solutions for improved image quality and better image-based
diagnosis.
2.1.2.1 Radiology
With about one billion exams performed per year [25], radiology encompasses a wide
variety of imaging modalities. In the literature, progress has been made towards the
subjective quality assessment of radiology images and videos.
Neri et al. [26] conducted a subjective quality assessment test with cardiologists using
the ACR method. The perceptual effects of H.264 [27] compression on
echocardiographic and Echo-Doppler sequences were investigated to identify a
minimum bit rate that can preserve the diagnostic effectiveness of the ultrasound
imaging sequences. Six cardiologists participated in the experiment. The results
concluded that a channel capacity of three Mbps is required to preserve the diagnostic
effectiveness of the ultrasound sequences.
Suad et al. [28] used the DSIS method to analyse the impact of different common types
of distortion (i.e., additive Gaussian noise, blurring, JPEG compression, salt and
pepper and sharpness) on brain MR images. A group of fifteen doctors participated in
the study, where they were asked to evaluate the quality of one hundred images.
Results show that the perceived quality is strongly affected by the distortions, with the
highest quality ratio given to sharpness and the poorest to Gaussian noise.
Razaak et al. [29] studied the impact of HEVC (high efficiency video coding) [30]
compression on nine medical ultrasound video sequences. The compressed sequences
were assessed by both medical experts and non-experts using the DSCQS method. The
results were used to analyse the compression performance of HEVC in terms of
acceptable diagnostic and perceptual video quality and showed that the level of
experience of the experts has an influence on the assessment of diagnostic quality.
Moreover, the authors found that an excellent diagnostic quality was obtained up to
compression ratio 420:1.
Gray et al. [31] analysed the quality of real time wirelessly transmitted medical
ultrasound video, using the DSCQS method. Four ultrasound trained medical
professionals rated the quality of videos from eight patients. Using an ANOVA
11
(Analysis of Variance), the authors showed that the bit rate has a large effect on the
quality scores. The results were then used to develop a minimum bit rate threshold to
ensure transmitted video is of adequate quality so that physicians may make an
accurate diagnosis. The threshold was defined at one Mbps (megabit per second) with
H.264 compression for wireless transmission of ultrasound video.
Chow et al. [32] carried out subjective experiments to assess the quality of twenty-five
reference MR images of the human brain, spine, knee, and abdomen distorted by six
types of distortion (Rician noise, Gaussian white noise, Gaussian blur, discrete cosine
transform (DCT), JPEG compression and JPEG 2000 compression) at five different
levels. They made use of the SDSCE methodology. The observers, twenty-eight
research scholars from the Electrical Engineering department, had to rate the distorted
image by judging the differences with the original image. According to the results
obtain by t-test, correlations and regression analysis, they declared that Rician noise
and Gaussian white noise strongly affect the quality of MR images.
Finally, the impact of a set of common distortions on the perceived quality of brain,
liver, breast, foetus, hip, knee, and spine MR images was also studied by Liu et al.
[24]. Ghosting, edge ghosting, white noise and coloured noise artifacts were simulated
on MR scans with different content and acquisition protocols, for two experiments.
The first experiment was divided into two parts: the first one included ghosting and
white noise artifacts, while the second included edge ghosting and coloured noise.
Five different energy levels were defined for each artifact. In each part, a total of thirty
stimuli were shown to fifteen and seventeen expert participants, respectively, using
the SDSCE method with a scale from 0 to 100. For the second experiment, a similar
procedure was followed with eighteen expert subjects, using the two higher energy
levels of all artifacts plus three new variations of the coloured noise, in a total of 112
stimuli. The scores obtained from a one-way ANOVA indicate that artifacts with a flat
spectral power density (i.e., white noise and edge ghosting) are nearly twice as
bothersome as artifacts with a spectral power density similar to the original image (i.e.,
coloured noise and ghosting), at the same energy level. The study also concludes that
differences in content are very likely to affect artifact visibility and relative impact.
12
2.1.2.2 Surgery
Psychological studies have also been undertaken in other areas, such as surgery and
telesurgery. Most studies conducted focus on laparoscopic surgery, also referred to as
“keyhole surgery”, which is a type of minimally invasive surgery.
Shima et al. [33] used the DSCQS method to assess four source videos representing
different types of cancer in the context of surgical telemedicine. When videos were
transmitted over the DVTS (digital video transport system), the quality perceived by
eight doctors decreased for pancreatic cancer videos but not for oesophageal, colon
and gastric cancers. They also demonstrated that encryption with a VPN (virtual
private network) did not degrade the image quality.
Nouri et al. [34] also made use of the DSCQS method on four videos representing
different stages of a laparoscopic surgery. Using a regression analysis, the authors
found a quality threshold at bit rate of 3.2 megabits per second (or compression ratio
90:1 for MPEG2 compression), below which the surgeons considered the quality too
low to perform surgical tasks.
Martini et al. [35] made use of the DSIS (Double Stimulus Impairment Scale) method
to evaluate the effects of video transmission errors on two sequences from a biopsy
suture. They found that the medical experts scored low quality for all the stimuli,
which may be due to the fact that the simulated errors (i.e., various packet loss rates)
are annoying and not acceptable for the surgeons.
Chaabouni et al. [36] made use of the DSCQS method on four laparoscopic surgery
videos to evaluate the impact of H.264 compression. Fourteen ENT (ear, nose and
throat) surgeons participated in the tests. The authors analysed their scores using some
correlations coefficients and a regression analysis, and found that compression
artifacts could be noticeable from compression ratio 100:1 for H.264 compressed
videos.
Another study on H.264 encoded laparoscopic videos was conducted by Münzer et al.
[37]. A group of thirty-seven medical experts participated in a double session test,
using the DSCQS method to evaluate the impact of resolution and the constant rate
factor (CRF) changes on overall image and semantic quality. The results suggested
that an acceptable quality may be achieved even reducing resolution down to 640×360

13
and with CRF = 26. With this set-up, storage requirements drop to 12.5% when
compared to current practice.
Finally, Kumcu et al. [38] chose the ACR (Absolute Category Rating) method to
assess four abdominal sequences from different surgical procedures. Nine
laparoscopic surgeons and sixteen non-experts were involved. Statistical analyses of
their scores showed that bit rate of 5.5 Mbps (or compression ratio 111:1 for H.264)
was suitable for a surgical procedure, whereas bit rate of 3.2 Mbps (or compression
ratio 214:1) was too poor to conduct a surgery.
2.1.2.3 Other modalities
Subjective image and video quality assessment experiments have also been conducted
in other medical areas, including, but not limited to: pathology, ophthalmology,
endoscopy, and 3D images.
Tulu et al. [39] studied the effects of delay, jitter, and packet loss ratio (i.e., network
impairments) on ophthalmology videos in the context of telemedicine, using the
SSCQS method. With an ANOVA, they found a significant effect of jitter for high-
movement videos. Furthermore, they showed that the perceived quality does not only
depend on technical parameters such as jitter and delay, but also on critical frames,
i.e., the frames which allow making a diagnosis, as they play a decisive role for the
viewer.
Platisa et al. [40] investigated the effects of blurring, colour, gamma parameters, noise,
and image compression on animal digital pathology images (dog gastric fundic glands
and foal liver). For that, they conducted an image quality assessment evaluation with
six veterinary pathologists, seven veterinary students, and eleven imaging experts
using the Single Stimulus Hidden Reference Removal (SS-HRR) method with a six-
point ACR scale. Using median opinion scores and Kruskal-Wallis non-parametric
one-way analysis of variance, they observed the disagreement between the quality
ratings made by different expertise groups, warning against guiding the development
of any pathology specific image algorithms or imaging systems by psycho-visual
responses of subjects who are not experts in pathology.
Kara et al. [41] made use of the ACR method with a view to study the angular
resolution and the light field reconstruction on 3D heart images. They chose a ten-
14
point scale for their tests and recruited twenty observers, eight medical experts and
twelve non-experts. Thanks to a regression analysis, results showed that observers are
more sensitive to degradations in texture than to a lower number of views.
Finally, Usman et al. [42] assessed the impact of the quantization parameter (QP) in
both visual and diagnostic quality of HEVC compressed videos from wireless capsule
endoscopy using the DSCQS. A total of twenty-five observers participated in the
study, consisting of nineteen non-expert and six medical expert observers.
Experimental results, analysed with correlations, recommended QP threshold values
of 35 and 37 in order to provide satisfactory diagnostic quality and visual quality,
respectively.
2.1.3 Summary points
2.1.3.1 Single-stimulus vs. multi-stimulus methods
As we noticed from the studies presented previously, both single- and multi- stimulus
methods can be used for subjective assessment of perceptual quality of medical images
and videos that differ in acquisition modalities, such as ultrasound, surgery, pathology,
etc. Each methodology has claimed advantages. Experiments conducted using single
stimulus methods are usually quicker to conduct than with double stimulus methods,
and they avoid potential vote inversions as only one stimulus is rated at a time [43].
However, single stimulus experiments may lead to a score drift over the course of a
session [44]. New methods have therefore been defined, such as the SAMVIQ method,
which allows observers to re-view the reference and re-evaluate their scores.
2.1.3.2 Influential factors
The standardised methods as mentioned above, i.e., single- and multi- stimulus, are
widely used to assess the perceived quality of natural visual content under natural
viewing conditions. However, the use of these methods for the assessment of medical
images and videos remains an open-ended question. It should be noted that clinical
practice is rather complex, and issues such as how medical experts perceive video
quality aspects remain largely unexplored. The perceptual quality of medical images
and videos can be affected by many different influential factors (IFs), which can be
grouped into three categories [45]: system IFs, context IFs, and human IFs.
15
The methods used for subjective assessment of medical content usually take into
account the system IFs, which refer to properties and characteristics that determine the
technically produced quality of medical image and video. There are four types of
system IFs: content-related IFs, media-related IFs, network-related IFs and device-
related IFs. In subjective assessment of the perceptual quality of medical images and
videos, content-related IFs consist of content type, media-related IFs include all media
configuration factors, while network-related and device-related IFs refer to all network
and device parameters that affect the perceptual quality, respectively. Since content-
related and media-related IFs are interlaced, they can be discussed jointly. Many
research studies introduced in the previous section dealt with content and media-
related IFs (e.g., distortion type, scene, bit rate, resolution, encryption), whereas the
network-related IFs (e.g., delay, jitter, packet loss) have not received as much focus.
Moreover, there is no evidence that device-related IFs have been considered in
subjective assessment of perceptual quality of medical contents. Content and media-
related IFs are manipulated at different levels in order to conduct various statistical
analysis that describe their impact on the perceptual quality of medical images and
videos.
In subjective user studies, the perceived quality of medical contents may vary with
viewing environments which have different context IFs. They refer to any situational
properties of the environment of medical images and videos that have an impact on
perceptual quality. The most important context IFs are physical, temporal and
task/social IFs. Although many subjective studies are conducted in different
environments and under various conditions, methods for subjective assessment do not
consider them as physical or task context IFs. In this sense, different numbers of
medical observers are usually asked to watch and evaluate the perceptual quality of
medical contents in a single-tasking situation without taking into account a large
number of other context IFs. Therefore, a deeper and more comprehensive analysis of
context IFs is required to properly assess the perceptual quality of medical content,
such as applications (e.g., diagnosis, surgery, training), clinical factors (e.g.,
emergency care, lesion suitableness), requirements (e.g., real-time/offline, location),
medical data (e.g., clinical information, anatomical, functional, physiological),
acquisition modalities (e.g., ultrasound, X-Ray, MRI), and data types (signal,
images/videos, monochrome/colour) [12].
16
The perceptual quality of medical contents may also be affected by human IFs, which
refer to any properties or characteristics of the human user that influence his/her
perception of quality. Human IFs can generally be classified into two categories, i.e.,
low-level processing IFs (e.g., physical, emotional and mental constitution of human),
and high-level processing IFs (e.g., demographic and socio-economic background).
Based on the literature review presented, one may notice that there are almost no
subjective user studies considering the impact of the low-level processing human IFs
(e.g., emotional state of the medical observer) on the perceptual quality of medical
images and videos. The number and expertise domain of the subjects, which is are
important high-level level processing human Ifs, were usually taken into account when
conducting subjective tests.
The number of assessors (i.e., medical observers) varies between studies. One can
argue that the availability of medical experts is determinant. The domain of expertise
of the assessors encompass: radiologists (specialised in medical imaging and trained
to interpret the scans to help in making a diagnosis), specialists (specialised in
diagnosis and treatment of a particular organ), surgeons (specialised in surgery with
more anatomical knowledge and its clinical relevance), etc. Zhang et al. [46] asked
four radiologists and eight naïve observers to complete a task of the detection of
abnormality. Results showed that radiologists have a better ability to detect hyper-
signal than naïve observers. In their study on the quality assessment of compressed
laparoscopic videos, Kumcu et al. [38] asked surgeons and non-experts to rate the
overall quality of twenty sequences. Their first observation was that the subjective
median scores were correlated between experts and non-experts with a Spearman
correlation score of 0.83. Their second remark was that the surgeons have an ability
to appreciate the specific anatomical structures when assessing the quality, while non-
experts were insensitive to the content when evaluating the effects of compression.
Kumcu et al. suggested that non-experts should not be used as surrogates of surgeons
for quality judgment. According to the above-mentioned experiments, we may
conclude that the expertise of assessors must be carefully considered during the
preparation of the subjective experiment in the medical context. Nevertheless, non-
medical or naïve assessors could be involved, if no-prior medical knowledge is
required for certain applications (such as a pre-assessment task or a supplementary
test).
17
All this suggests that conventional methodologies may require modifications when
applied to medical images and videos. Attempts to adjust and refine experimental
methodologies have been made by Shima et al. [33] and Kumcu et al. [38] where
practical aspects (e.g., “suitability for surgery” and “usefulness”) had been considered
and integrated into conventional quality scoring tasks. Similarly, in [47], Kowalik-
Urbaniak et al. intended to find out the degree to which a medical image can be
compressed, using JPEG or JPEG2000 algorithms, before its quality is compromised.
A set of ten compressed CT images were presented to two radiologists, who were
requested to rate the quality of an image using a binary scale, i.e., acceptable or
unacceptable. In the experiment, the radiologists were instructed to flag an image as
unacceptable in the case they believed there was any noticeable distortion that could
have any impact on diagnostic tasks. Results indicated that compression ratio was not
always a correct measure for visual quality.
2.1.3.3 Statistical analyses
Furthermore, when conducting subjective experiments, some observers may report
dubious scores. This can be due to misunderstanding the instructions or to a lack of
engagement in the task [48]. It is thus recommended to use an outlier detection and
subject exclusion procedure, presented in ITU-R recommendation BT.500-11 [21].
Subjective experiments with medical images and videos present different
characteristics than experiments conducted with natural content, due to the distinctive
nature of medical imaging. In a medical context, it is particularly important to test
whether participants are consistent in their quality scoring, as their years of experience
in medicine may affect their perception of visual distortions [49]-[50]. Therefore, it
may appear necessary to divide observers into groups depending on their experience
and/or specialty, as it has been done by some of the studied research teams. A common
way to analyse the impact of the participants on scoring is to conduct an ANOVA on
the scores. Indeed, the ANOVA is used to compare the means of two or more
independent samples when assuming normality and homogeneity of the variance.
Two other main analyses were used in the studied articles: correlation and regression
analysis. Correlation is often used to study whether two variables are correlated and
the strength of this relationship. Contrary to correlation, regression allows to predict
one variable from another. However, it can be noted that these analyses were not used
18
for the same purpose. Indeed, the correlation coefficients have mostly been used to
evaluate the relationship between existing image quality metrics and the human scores
obtained.
2.2 Eye-tracking in medical imaging
Eye-tracking is a widely used method which enables to record eye positions and eye
movements of a human subject. In fact, eye movements allow a deeper insight into
human attention, even revealing their needs and emotional states for instance [51]. The
phenomenon of human visual attention has been studied for over a century, with the
objective of understanding how human brain continuously minimises overloading
amount of input into a manageable flow of information. Significant findings were
established in literature that visual attention is essentially driven by two general
attentional processes, i.e., bottom-up and top-down [52]. Bottom-up aspects are based
on characteristics of the visual scene, making it stimulus driven. Regions of interest
that attract attention in a bottom-up way must be sufficiently distinctive with respect
to surrounding features [53]. On the other hand, top-down attention is driven by factors
such as knowledge, expectation and experience.
Eye-tracking, and more particularly the measurement of the point of gaze, has emerged
as the key means of studying visual attention. The origins of eye-tracking date back to
1879 when French ophthalmologist Louis Emile-Javal noticed, based on naked-eye
observations, that readers’ eyes make quick movements (i.e., saccades) mixed with
short pauses (i.e., fixations) while reading. The first eye-tracker, which was an
intrusive device, was built in 1908 by Edmund Huey. The first non-intrusive
recordings of eye movements were conducted by Guy Thomas Buswell, an
educational psychologist, in 1937 [54]. During the 1970s and 1980s, video-based eye-
trackers were invented to enable less intrusive and more accurate eye-tracking
practice. Nowadays, it is used in a wide range of applications, including cognitive
psychology, marketing research, usability engineering, human computer interaction,
and medical image quality [55]. An eye-tracking study usually involves the
participation of a certain number of human subjects, the recording of their eye
movements using a sophisticated eye-tracker, and the agglomerated analysis of their
fixation/gaze patterns.
19
In recent years, there has been a growing interest in the use of eye-tracking technology
in medical imaging. In radiology for example, eye-tracking methodologies have been
widely used to study how visual search and recognition tasks are performed, providing
information that can improve speed and accuracy of radiological reading. Generally,
in a typical eye-tracking study, a target stimulus is presented to a sample of image
readers while their eye movements are recorded by an eye-tracker. The resulting eye-
tracking data is then statistically analysed to provide evidence of the subjects’ visual
behaviour. This information can be subsequently used to assess the image quality of
diagnostic imaging systems and to improve task performance of medical
professionals. Also, it would be highly beneficial for image readers to have a tool that
can automatically and accurately predict where experts look in images. This can be
used as an automated perceptual feedback system to enhance their diagnostic
performance.
In this section, we present a comprehensive literature review that focuses on eye-
tracking studies in medical imaging.
2.2.1 Visual search patterns
Visual search patterns in medical imaging can be extremely complex due to their
important outcomes, e.g., the detection of a particular disease. This is why it is crucial
to identify visual search patterns associated with accuracy and precision.
In 1981, Carmody et al. [56] published one of the first eye-tracking studies where
visual search was investigated by means of eye-position recording techniques. They
studied the detection of lung nodules in chest X-ray films. Four radiologists
participated in the experiment, where they were asked to search for nodules in ten
chest films. Their eye movements were recorded using special glasses based on
corneal reflection technique. Subjects were instructed to press a key when they found
a nodule in the X-rays. The eye-tracking data, i.e., visual dwell times, were used to
analyse visual search behaviour. It was found that false negative (i.e., omission) errors
were impacted by both the visibility of the nodule and the scanning strategies used by
the radiologist.
A decade later, Beard et al. [57] conducted an eye-tracking study using an Eye Mark
Recorder (model V) to understand visual scan patterns developed by radiologists when
20
interpreting both single chest and multiple abdominal CT scans. Four radiologists and
one radiology resident participated in the first part of the study where single CT scans
were tested. Their task was to read and interpret three patient cases, each of which
contained 30 to 40 image slices. Radiologist scan patterns were rendered manually
from the tape records; and a systematic sequential visual scan pattern was found. The
second part of the study was to assess how images were cross compared, using
multiple CT scans. The radiologists had to view three patient folders each containing
more than one CT scan with the number of films exceeding the available viewing
space. Eye-tracking data showed that the radiologists used a similar approach of
reading single CT scans, i.e., a systematic sequential visual scan, however, they also
developed a comparison method.
Suwa et al. [58] also carried out a study with CT images, but in the field of dentistry.
They recruited eight dentists, and each was shown ten normal and ten pathologic CT
images. Eye movements of the dentists were recorded with an eye-tracking system
(model 504) when interpreting the images. Six parameters were extracted from the
eye-tracking data: time to determine whether the image is normal or pathologic,
fixation point count, distance between fixations, time spent on each fixation, total gaze
fixation time, and minimum gaze fixation time. Based on these parameters, the gaze
patterns of dentists were investigated. Considering the difference in gaze patterns
between normal and pathologic images, it was found that when viewing a normal
image, the subjects tended to move sequentially (as noticed by Beard et al. [57]),
whereas, when viewing a pathologic image, the tendency was to focus on suspected
regions. Moreover, they found that both the travel distance between fixations and the
minimum gaze fixation time were longer for pathologic images than normal ones. The
total gaze fixation time, which is shorter for normal images, significantly contributed
to determine whether an image was normal or pathologic.
Eye-tracking studies were also conducted in other medical specialties, such as
mammography. Kundel et al. [59] gathered eye-tracking data collected independently
at three institutions with an ASL (Applied Science Laboratories) eye-tracking device,
where experienced mammographers, mammography fellows, and radiology residents
searched for cancers in mammograms, both on craniocaudal and mediolateral oblique
views. They found that 57% of cancer locations were fixated within the first second
of viewing. They concluded that the initial detection occurs before visual scanning and
21
that the development of expertise may consist of a shift from scan-look-detect to look-
detect-scan mechanism.
Voisin et al. [60] also worked on mammogram images. They investigated the
association between gaze patterns and diagnostic performance for lesion detection in
mammograms. They recorded the eye movements of six radiologists while evaluating
the likelihood of malignancy of forty mammographic masses, using a Mirametrix S2
eye-tracker. By assessing various quantitative metrics derived from the eye-tracking
data, such as the fixation duration, number of fixations, and fixation/saccade ratio,
they showed that these gaze metrics were highly correlated with radiologists’
diagnostic errors. For instance, a long review time leads to a high chance of error.
Almansa et al. [61] investigated the relationship between gaze patterns captured with
an ASL mobile eye-tracking device and adenoma detection rate in colonoscopy
videos. Eleven endoscopists participated in a study in which they were asked to watch
three high-definition video clips from three normal colonoscopies. Diverse forms of
information were gathered from the eye-tracking data, including total gaze time,
number of fixations, and mean duration of fixations. The results showed that the
adenoma detection rate was significantly correlated with the central gaze time, i.e.,
time spent on the centre of the screen. It was found that the participants who detected
the highest number of adenomas showed a tendency to focus on the centre of the
screen, whereas participants who detected less lesions moved their eyes more broadly.
Drew et al. [62] worked on 3D CT images. Twenty-four radiologists were recruited to
search for lung nodules in chest CT scans. Five cases were used, and there were fifty-
two nodules in total. The radiologists were asked to find as many nodules as possible
in three minutes (note false positives were deleted from the database). Based on the
eye-tracking data collected using an EyeLink1000 eye-tracking device, Drew et al.
divided the radiologists into two groups depending on their reading strategies:
“scanners” and “drillers”. Scanners usually search throughout a slice in depth before
moving to a new depth, whereas drillers limit their search to a part of the lung while
scrolling through slices in depth. In general, drillers found more nodules than scanners.

22
2.2.2 Influence of experience and expertise
With a view to improve the diagnostic performance of medical students, it is necessary
to understand how they perceive medical images and then to compare their viewing
behaviour with that of medical experts. Existing eye-tracking studies that compare
viewing behaviour of experts and novices can be divided into two categories: studies
on medical diagnosis and studies on surgery. We will discuss each category in detail
below.
2.2.2.1 Diagnosis
This section is looking at studies that compare experts and novices when rendering
diagnoses based on diverse modalities of medical imaging, including, but not limited
to CT, MR, and radiographs.
Nodine et al. [63] carried out an eye-tracking experiment where participants (i.e., three
mammographers and six radiology trainees) were asked to view forty mammogram
cases and decide whether they were “normal” or “abnormal”. Their eye movements
were recorded using an ASL4000 eye-head tracker. Experimental results showed there
was no significant difference in terms of decision time between experts and trainees,
however, mammographers’ performance was always higher than trainees’. The eye-
fixation patterns of trainees were compared to that of experienced mammographers;
and the results indicated that trainees did not spend enough time on the lesions.
Similar findings were obtained in the study of Tourassi et al. [64], where three breast
imaging radiologists and three residents were asked to view twenty screening
mammograms for a specific task of mass detection while wearing a H6 head-mounted
eye-tracker. In consistence with the study of Nodine et al. [63], the residents’ detection
accuracy was on average lower compared to the experts. The recall rate of residents
and expert radiologists was nonetheless the same on average. The results also showed
that radiologists possess a more complex gaze behaviour than residents.
There are few studies that focus on CT images, such as Cooper et al. [65], Matsumoto
et al. [66], Bertram et al. [67]-[68], and Mallett et al. [69]. Cooper et al. [65]
investigated visual search behaviour on stroke images with three experienced readers,
one trainee and four novices. Participants were asked to rate eight clinical cases on a
five-point Likert scale, depending on the presence or absence of abnormality and their
23
degree of confidence. The results showed a significant difference in diagnostic
accuracy between novices and experts; the experts performed better than the novices.
Recorded eye-tracking data were used to reveal the reasoning behind the observed
difference between novices and experts. In case of an acute stroke, the trainee reader
noticed the region of interest with the 34th fixation whereas the experts fixated in with
their first fixation. For a chronic stroke case, novices only spent a short time looking
at the affected area, and experts concentrated on the affected tissue from the first
fixation. Matsumoto et al. [66] also studied stroke cases two years later, with twelve
neurologists and twelve control subjects consisting of nurses, medical technologists,
psychologists, and medical students. Findings proved that both neurologists and
control subjects gazed at visually salient areas in the images, however, only
neurologists gazed at visually low-salient areas with clinical importance. Bertram et
al. [67]-[68] applied the approach of the two aforementioned studies to abdominal CT
images. In their first study [67], they compared the eye movements of seven
radiologists, nine radiographers and twenty-two psychology students when watching
abdominal CT scans. Participants had to perform an easy task, i.e., detecting visually
salient abnormalities, and a difficult task, i.e., detecting enlarged lymph nodes. Results
showed that for the difficult task, experts performed better than semi-experts and naïve
participants; however, there was no difference in detection performance between
semi-experts and novices. For the easy task, experts and semi-experts performed better
than naïve participants. In the second study [68], Bertram et al. investigated markers
of visual expertise using twenty-six abdominal CT images. An eye-tracking
experiment was conducted with twelve specialists, fifteen advanced residents and
fifteen early residents when performing a detection task. Similar to their first study,
they found that the detection rate of specialists was higher than that of residents, and
that advanced residents detected more lesions than early residents. On average, eye-
tracking data showed that specialists reacted to the presence of lesions using long
fixation durations and short saccades. Finally, Mallett et al. [69] focused their study
on twenty-three 3D CT colonography videos, which were interpreted by twenty-seven
experienced and thirty-eight inexperienced radiologists. Experimental results showed
that experienced readers had a higher rate of polyp identification than inexperienced
readers, but there was no difference between the two groups in terms of percentage of
pursuits and total assessment period. Eye-tracking data revealed that readers examined
polyps by multiple pursuits, meaning that they recognised the importance of the

24
lesions. There was no difference regarding the rate of scanning errors between
experienced and inexperienced readers.
The scope of eye-tracking studies was broadened by Manning et al. [70], Leong et al.
[71], Vaidyanathan et al. [72], and Turgeon et al. [73], for radiographs, chest images,
dermatological images, and panoramic images, respectively. Manning et al. [70]
analysed the gaze behaviour of eight experienced radiologists, five experienced
radiographers (before and after training) and eight undergraduate radiography students
when detecting nodules, with an ASL504 remote eye-tracking device. They showed
that the radiologists and radiographers after training were better at performing the task
than the novices, and that the novices and radiographers before training made more
fixations per film. In the study of Leong et al. [71], they recruited twenty-five
observers with different specialisation who had to examine thirty-three skeletal
radiographs and identify fractures. Their eye movements were recoded using a Tobii
1750 eye-tracker. Results showed that there was no significant difference between the
groups in the time spent on evaluating the radiographs. However, the experts had a
higher number of true positives. Vaidyanathan et al. [72] compared the eye movements
of twenty-two dermatology experts and twelve undergraduate novices when viewing
thirty-four dermatological images. As a result, they found that experts can weigh a
region’s importance after a brief fixation, whereas novices need multiple re-fixations.
Moreover, they discovered that the median fixation duration and saccade amplitude
are significantly higher for experts than for novices. Finally, in a more recent study,
Turgeon et al. [73] used twenty dental panoramic images to assess the influence of
experience on eye movements with a SMI RED-m device. They asked fifteen oral and
maxillofacial radiologists and thirty dental students to view freely the images, while
their gaze movements were recorded. They found that all participants spent more time
on normal images than abnormal images. Radiologists needed less time before making
their first fixation on the region of interest, and they made fewer fixations than the
students on images of pathoses.
To summarise, the findings from different eye-tracking studies showed that experts
and novices have different gaze behaviours when making diagnoses based on medical
images. Novices should be trained in order to reach the experts’ level characterised by
a particular gaze behaviour.
25
2.2.2.2 Surgery
This section examines studies that compare experts and novices when evaluating
surgical images or videos.
Law et al. [74] were the first researchers to investigate gaze behaviour between experts
and non-experts for laparoscopic surgery in 2004. They believed that there would be
distinctive characteristics in gaze between the two subject groups. Law et al.
conducted an eye-tracking experiment with five expert surgeons and five students,
where subjects had to perform a virtual task: they were asked to touch a small target
using a virtual laparoscopic tool, as quickly as possible and without committing an
error if possible, for two blocks of five trials each. Eye-tracking data were collected
using an ASL 504 remote eye-tracking device. Results showed that the experts
performed significantly better than non-expert participants, both in time and precision.
In terms of visual behaviour, novices spent more time looking at the tool than the
experts.
Kocak et al. [75] then recorded the eye movements of eight novices, eight
intermediates and eight experts in surgery with a Cyclops Eye Trak saccadometer
when performing three basic laparoscopic tasks, i.e., loops, rope and beans. The results
showed that the degree of experience affected the fixations and saccades. The average
saccadic rate was significantly higher for novices than the experts. Furthermore, the
duration of fixations was higher for the expert group than the intermediate group and
the novice group.
In 2010, Ahmidi et al. [76] published their eye-tracking study on laparoscopic surgery.
They recruited five expert surgeons and six novices who had to find a given anatomy
in the sinus cavity and touch it using an endoscope. Their work showed that the
surgeons’ gaze data included skill related structures, which were, however, not found
for novices. They also presented an objective method to assess the expertise level of
surgeons using the Hidden Markov Model.
At the same time, Richstone et al. [77] published their study, in which twenty-one
surgeons participated in a simulated and live surgery where they had to achieve
different tasks of varying degrees of difficulty. Their eye movements were recorded
using an EyeLink II eye-tracker. Quantitative metrics related to eye movements, such
as blink rate, fixation rate, pupil metric and vergence were evaluated. Their work
26
demonstrated that, for both simulation study and live surgery, eye metrics made a
distinction between non-expert and expert surgeons in a reliable way.
Finally, Khan et al. [78] studied the eye movements of surgeons when performing a
surgical task and later on when watching the operative video, as well as the gaze of
surgical residents. Two expert surgeons and twenty novices were recruited for the eye-
tracking study using a Tobii X50 device. Sixteen laparoscopic cholecystectomy cases
were used. The results showed that there was a 55% overlap for expert surgeons
between “doing” and “self-watching”, and only 43.8% for junior residents. The
difference between the two groups is statistically significant.
All eye-tracking studies available in literature focus on laparoscopic surgery, which is
a type of minimally invasive surgery. This practice is of benefit to patients due to the
reduced incisions and recovery time. Findings with regards to the impact of expertise
in gaze behaviour largely coincide with those in radiology studies.
2.2.3 Impact of training on viewing behaviour
In the previous section, differences between medical students and experts were
discussed in terms of their viewing behaviour. The next step is therefore to improve
training, so that trainees become, in turn, experts. In this section, eye-tracking studies
assessing the impact of training on the viewing behaviour of medical professionals are
presented.
As mentioned previously, expert surgeons tend to focus on their task whereas novices
follow the tool during laparoscopic surgery. Wilson et al. [79] developed further
research to study the effect of training on gaze behaviour in laparoscopic surgery with
an ASL mobile eye-tracking device. Thirty medical trainees with no previous
laparoscopic training participated in the experiments. They were divided into three
equal groups, and each group received a different training program, i.e., gaze training,
movement training, or discovery training. The first group was shown a video of an
expert’s eye movements when performing a coordination task. The second group was
shown the same video but without the gaze cursor. Finally, the third group was given
no video or instructions but was allowed to examine their own performance. Before
training, statistical analyses showed no significant difference between the three groups
in terms of completion time. After training, the results proved that the gaze group was

27
significantly faster than the movement group and the discovery group. Furthermore,
the gaze group spent significantly more time than the other two groups using target
locking fixations, i.e., fixations spent on the target ball and not on the tool. It is
suggested that neural mechanisms in charge of goal-directed movements benefit from
the foveated target [80].
Vine et al. [81] conducted a similar study to assess the impact of gaze training in
laparoscopic surgery; however, in contrast to the study of Wilson et al. [79], the
participants were not made aware of the objective of the training. Twenty-seven
participants who had not received any laparoscopic training were involved in the
study. They were assigned to a gaze training group or to a discovery learning group.
Each participant had to complete a task, i.e., to move foam balls into a cup using a
single instrument. The first group was shown a surgery training template to passively
adopt experts’ gaze patterns, whereas the second group did not use a template. There
was no significant difference between the two groups before training. After training,
statistical analyses revealed a significant difference between the two groups in terms
of completion time and accuracy. The gaze training group completed the task more
quickly and was in general more accurate than the discovery learning group.
It should be noted that laparoscopic surgery is not the only field where the impact of
training was assessed based on eye-tracking. For example, Krupinski et al. [82] studied
the impact of training on viewing behaviour in pathology with an ASL SU4000 device.
They followed four pathology residents over time during their training, i.e., once a
year for four consecutive years. Each time, the residents had to select the top three
locations they would like to zoom into in twenty breast core biopsy surgical pathology
cases. The fixation positions were recorded, and the dwell time was calculated for each
fixation. Statistical analyses showed that the residents became more efficient with
training, and generated fewer fixations as well as revisited fewer locations.

28
29
Chapter 3:
How do medical professionals perceive
video quality?
3.1 Introduction
Telemedicine refers to “the use of information and communications technologies
(ICT) to provide and support clinical healthcare at a distance” [83]. The ultimate goal
of telemedicine is to improve the accessibility, efficiency, and effectiveness of clinical
processes utilised by healthcare organisations, practitioners and patients.
Telemedicine is being conducted to optimise medical resources and compensate for
the lack of healthcare provision in places where the number of medical professionals
relative to the size of the population is very small and access to advanced healthcare
is limited. As a result, the use of telemedicine offers a transformative opportunity for
access to and delivery of high-quality healthcare in resource-poor settings,
particularly, but not exclusively, in rural areas.
There are four recognised acts of telemedicine, namely tele-consultation, tele-
expertise, tele-monitoring and tele-assistance [83]. Tele-consultation involves a
remote consultation between a doctor and a patient, which is often conducted via
telephone or videoconference. Tele-expertise is concerned with communicating a
remote request of clinical advice between medical professionals, such as seeking a
second opinion on image-based diagnosis off-line. Tele-monitoring enables medical
professionals to remotely interpret pre-recorded medical data of patients. Tele-
assistance is used to allow a clinical expert to support other clinical professionals
during a medical intervention, which is the topic to be investigated in this chapter.
In principle, tele-assistance is conducted in more demanding situations, where the
success of the practice partially depends on the effectiveness of the transmission of
medical videos in real time. Recently, telesurgery (also known as remote surgery), has
emerged as a prevalent form of medical tele-assistance, where the clinical practice
involves an expert surgeon assisting a remote (less-experienced) surgeon to complete
30
a surgical procedure [2]. It is useful in case of a shortage of experienced professionals,
and benefits healthcare services in terms of timely surgery for patients, reduction of
costs, and training of young surgeons.
The implementation of telesurgery would not have been possible without the support
of modern digital image and video communication systems. Unfortunately, these
systems generate, as a side effect, various types of distortion in visual signals, such as
visual impairments caused by lossy data compression and transmission errors due to
bandwidth limitations [84]. Therefore, the ultimate visual content received by the end
user largely differs in perceived quality, depending on the system and its applications.
The visual distortions can affect viewers’ visual experiences and, consequently, may
impact the practice of telesurgery, and thus risk the patient’s health. Being able to
maintain, control and improve the quality of medical videos has become a fundamental
challenge in the design of telesurgery systems [13].
In this chapter, we describe interviews carried out with abdominal surgeons from
Angers University Hospital in France. A controlled experiment was then designed and
conducted based on a better understanding of the context of telesurgery, thanks to the
qualitative data collected during the interviews.
3.2 Semi-structured interviews: relating quality in the
context of telesurgery
3.2.1 Protocol
In order to better understand quality perception in the context of telesurgery, we
carried out qualitative research through interviews – an important gathering technique
involving verbal communication between the researcher and research subject [85].
Interviews can be structured or semi-structured. For a structured interview, a rigorous
set of questions is prepared prior to the interview and usually allows a limited number
of answers. A semi-structured interview is more open (i.e., allowing informants the
freedom to bring up ideas or express their views during the interview), but with a list
of specific topics of interest being thought about well in advance which have to be
covered. These interviews are used to collect data on a particular topic [86]. Semi-
structured interviews are widely used in qualitative research to provide reliable and

31
comparable qualitative data [87]. We used semi-structured interviews to reveal all
relevant aspects of the image quality assessment problem, including purpose, context,
and meaning, to get preliminary information linked to the quality attributes present in
the videos.
Knowledge management is a methodology commonly used to conduct semi-structured
interviews. The principle of knowledge management is to make the know-how of
experts explicit (i.e., the transition from a tacit know-how to explicit knowledge) [88].
CTA (Cognitive Task Analysis) [89] is a knowledge capitalisation method whose
purpose is to elicit knowledge and skills used by an expert during a task involving a
strong cognitive activity (such as making a decision, solving a problem, and being
aware). This method is made of five steps: collection of preliminary knowledge,
identification of knowledge representations, application of knowledge elicitation
methods, analysis of acquired data and formatting results. This method is the extension
of traditional task analysis techniques to underline goal generation, decision-making
and judgments [90], which are essential to study image quality assessment in the
context of telesurgery.
As recommended by the CTA methodology, a literature review was made on the topic
of interest (i.e., telemedicine and surgery) to set up the interviews. We then made a
list of questions and topics to be explored with the surgeons. The topics can be divided
into two categories: telemedicine and field of expertise on the one hand, video quality
on the other hand. The questions asked are: ‘What do you generally expect in a setting
of telesurgery?’; ‘What are the most important aspects you would look for in this type
of exam?’; ‘What is the most challenging part of this procedure?’; and ‘What are the
necessary knowledge and materials for the conduct of such a procedure?’. Three
surgeons were interviewed, and each interview lasted approximately one hour. During
each interview, several videos of abdominal surgery (i.e., open and laparoscopic
surgeries) were shown. These videos were pre-captured in Angers University Hospital,
with a Sony Handycam HDR-CX280 model for open surgeries and a Stryker’s
endoscope for laparoscopic surgeries. All interviews were tape-recorded.
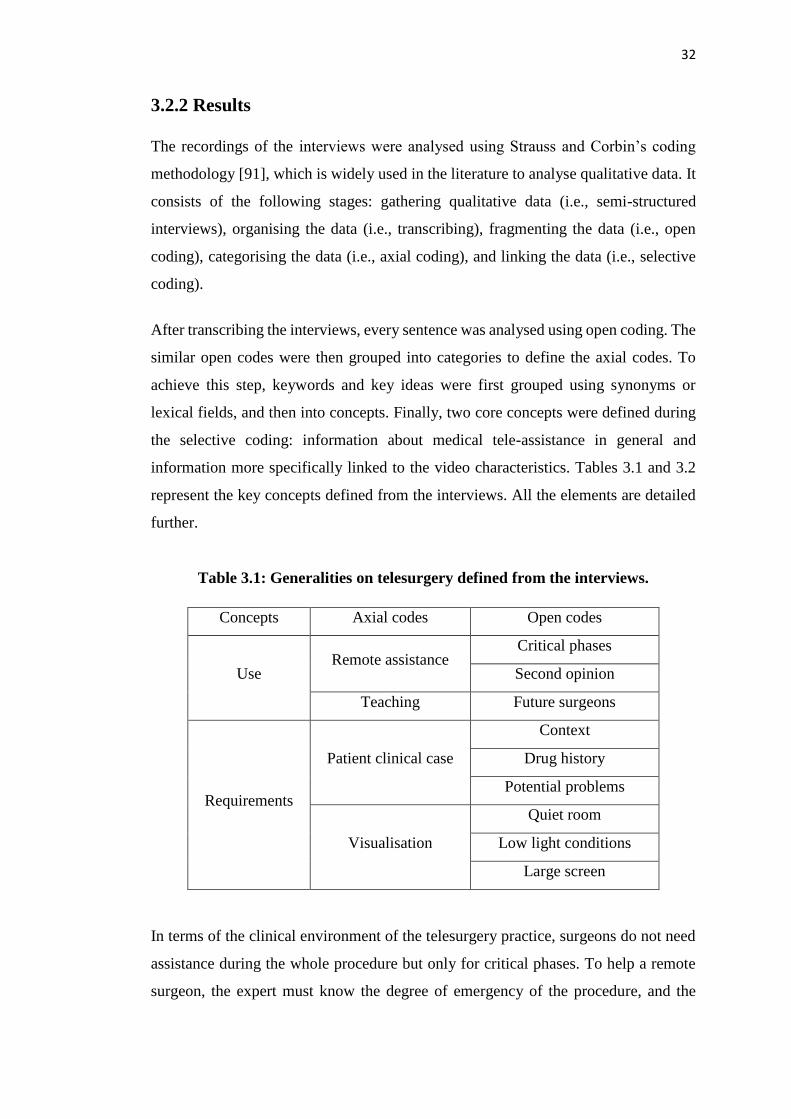
32
3.2.2 Results
The recordings of the interviews were analysed using Strauss and Corbin’s coding
methodology [91], which is widely used in the literature to analyse qualitative data. It
consists of the following stages: gathering qualitative data (i.e., semi-structured
interviews), organising the data (i.e., transcribing), fragmenting the data (i.e., open
coding), categorising the data (i.e., axial coding), and linking the data (i.e., selective
coding).
After transcribing the interviews, every sentence was analysed using open coding. The
similar open codes were then grouped into categories to define the axial codes. To
achieve this step, keywords and key ideas were first grouped using synonyms or
lexical fields, and then into concepts. Finally, two core concepts were defined during
the selective coding: information about medical tele-assistance in general and
information more specifically linked to the video characteristics. Tables 3.1 and 3.2
represent the key concepts defined from the interviews. All the elements are detailed
further.
Table 3.1: Generalities on telesurgery defined from the interviews.
Concepts Axial codes Open codes
Use Remote assistance
Critical phases
Second opinion
Teaching Future surgeons
Requirements
Patient clinical case
Context
Drug history
Potential problems
Visualisation
Quiet room
Low light conditions
Large screen
In terms of the clinical environment of the telesurgery practice, surgeons do not need
assistance during the whole procedure but only for critical phases. To help a remote
surgeon, the expert must know the degree of emergency of the procedure, and the
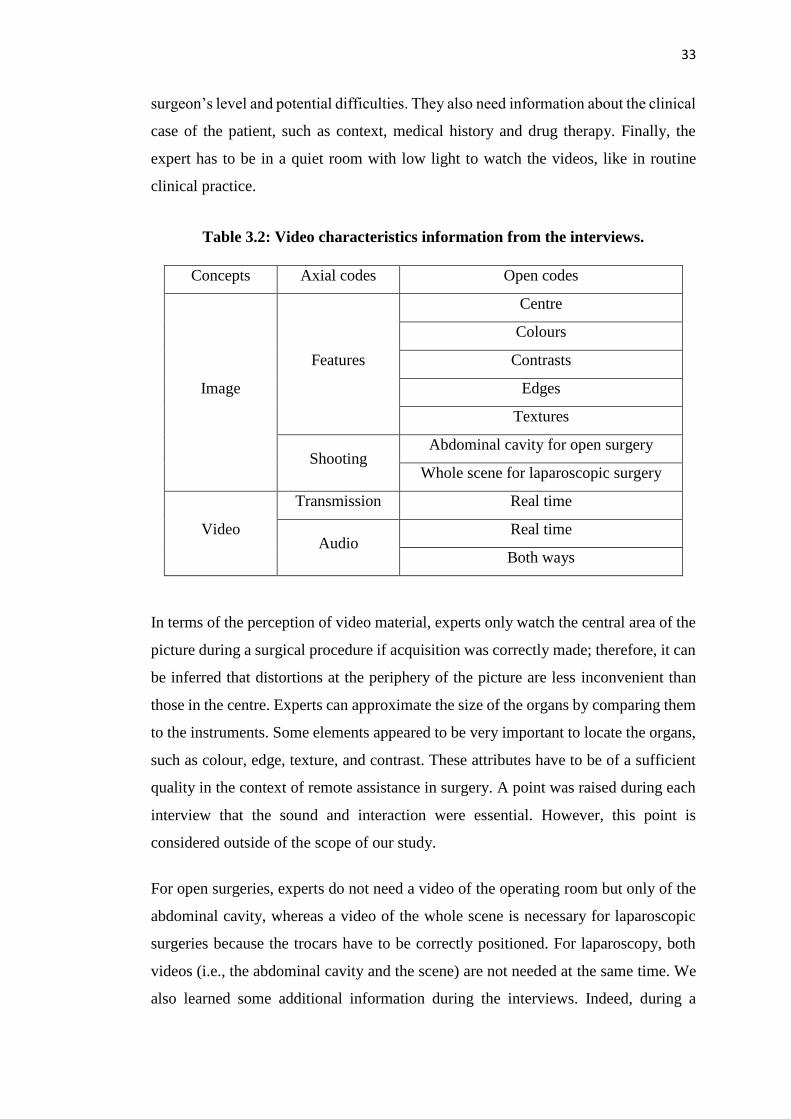
33
surgeon’s level and potential difficulties. They also need information about the clinical
case of the patient, such as context, medical history and drug therapy. Finally, the
expert has to be in a quiet room with low light to watch the videos, like in routine
clinical practice.
Table 3.2: Video characteristics information from the interviews.
Concepts Axial codes Open codes
Image
Features
Centre
Colours
Contrasts
Edges
Textures
Shooting Abdominal cavity for open surgery
Whole scene for laparoscopic surgery
Video
Transmission Real time
Audio Real time
Both ways
In terms of the perception of video material, experts only watch the central area of the
picture during a surgical procedure if acquisition was correctly made; therefore, it can
be inferred that distortions at the periphery of the picture are less inconvenient than
those in the centre. Experts can approximate the size of the organs by comparing them
to the instruments. Some elements appeared to be very important to locate the organs,
such as colour, edge, texture, and contrast. These attributes have to be of a sufficient
quality in the context of remote assistance in surgery. A point was raised during each
interview that the sound and interaction were essential. However, this point is
considered outside of the scope of our study.
For open surgeries, experts do not need a video of the operating room but only of the
abdominal cavity, whereas a video of the whole scene is necessary for laparoscopic
surgeries because the trocars have to be correctly positioned. For laparoscopy, both
videos (i.e., the abdominal cavity and the scene) are not needed at the same time. We
also learned some additional information during the interviews. Indeed, during a
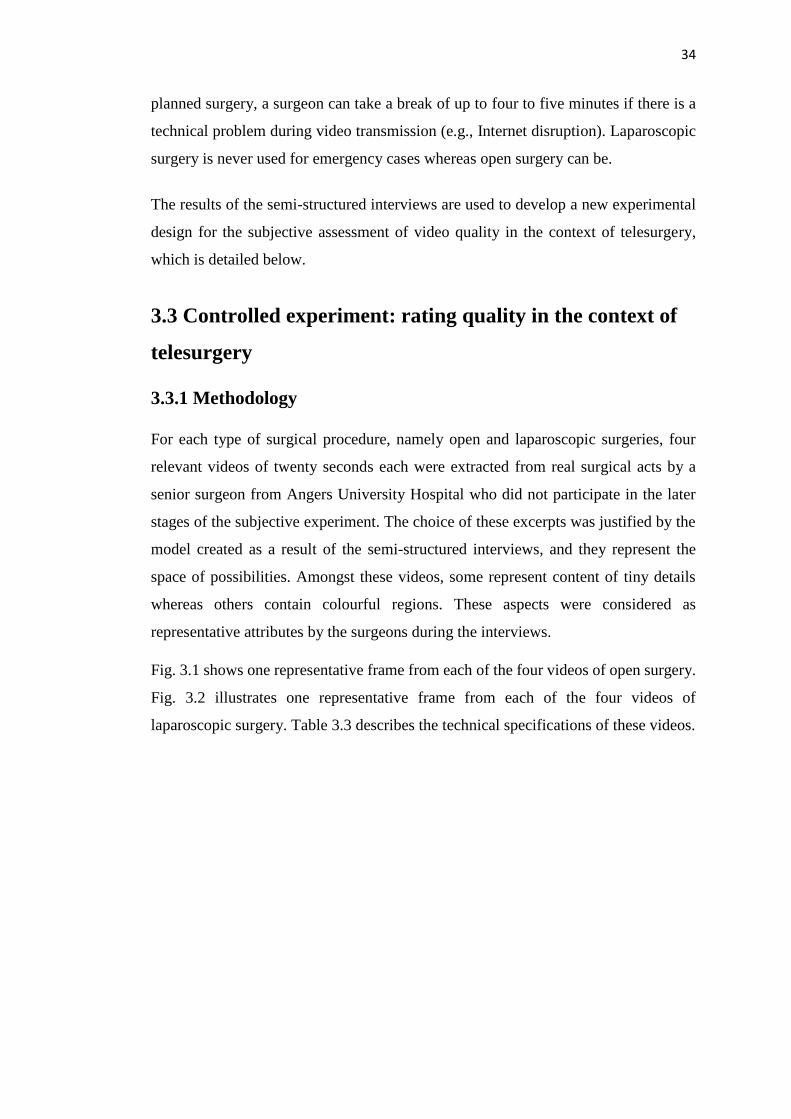
34
planned surgery, a surgeon can take a break of up to four to five minutes if there is a
technical problem during video transmission (e.g., Internet disruption). Laparoscopic
surgery is never used for emergency cases whereas open surgery can be.
The results of the semi-structured interviews are used to develop a new experimental
design for the subjective assessment of video quality in the context of telesurgery,
which is detailed below.
3.3 Controlled experiment: rating quality in the context of
telesurgery
3.3.1 Methodology
For each type of surgical procedure, namely open and laparoscopic surgeries, four
relevant videos of twenty seconds each were extracted from real surgical acts by a
senior surgeon from Angers University Hospital who did not participate in the later
stages of the subjective experiment. The choice of these excerpts was justified by the
model created as a result of the semi-structured interviews, and they represent the
space of possibilities. Amongst these videos, some represent content of tiny details
whereas others contain colourful regions. These aspects were considered as
representative attributes by the surgeons during the interviews.
Fig. 3.1 shows one representative frame from each of the four videos of open surgery.
Fig. 3.2 illustrates one representative frame from each of the four videos of
laparoscopic surgery. Table 3.3 describes the technical specifications of these videos.
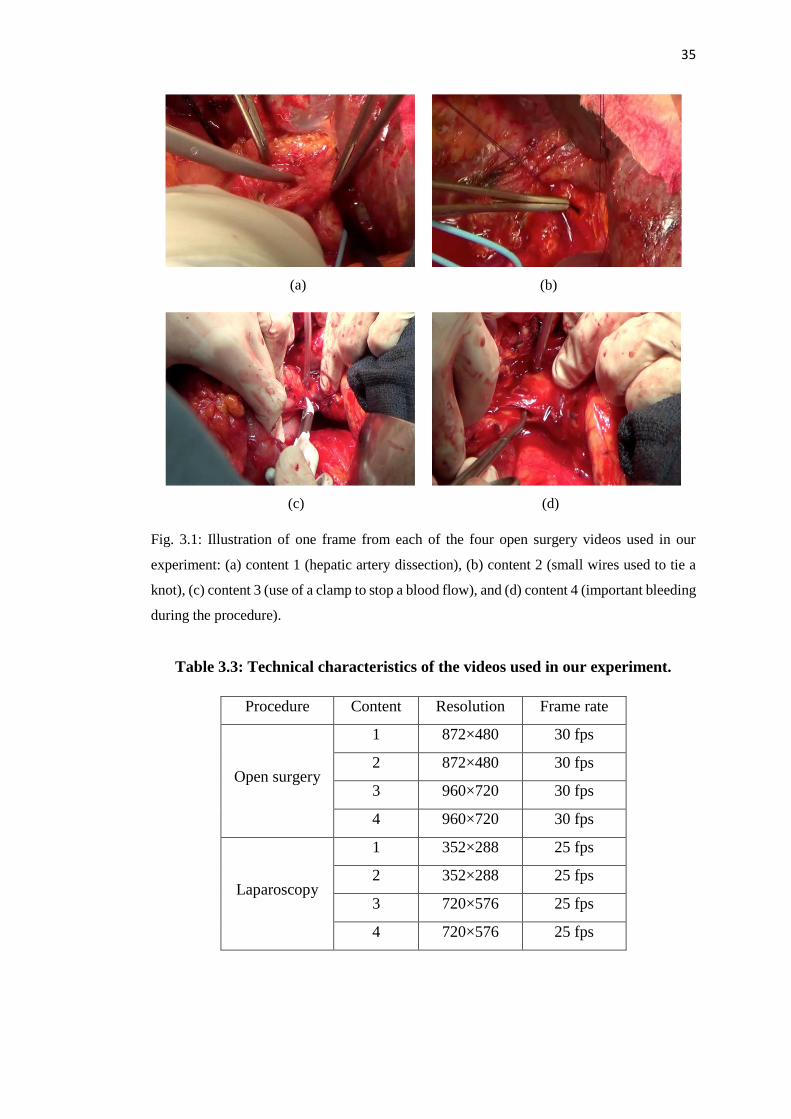
35
(a) (b)
(c) (d)
Fig. 3.1: Illustration of one frame from each of the four open surgery videos used in our
experiment: (a) content 1 (hepatic artery dissection), (b) content 2 (small wires used to tie a
knot), (c) content 3 (use of a clamp to stop a blood flow), and (d) content 4 (important bleeding
during the procedure).
Table 3.3: Technical characteristics of the videos used in our experiment.
Procedure Content Resolution Frame rate
Open surgery
1 872×480 30 fps
2 872×480 30 fps
3 960×720 30 fps
4 960×720 30 fps
Laparoscopy
1 352×288 25 fps
2 352×288 25 fps
3 720×576 25 fps
4 720×576 25 fps
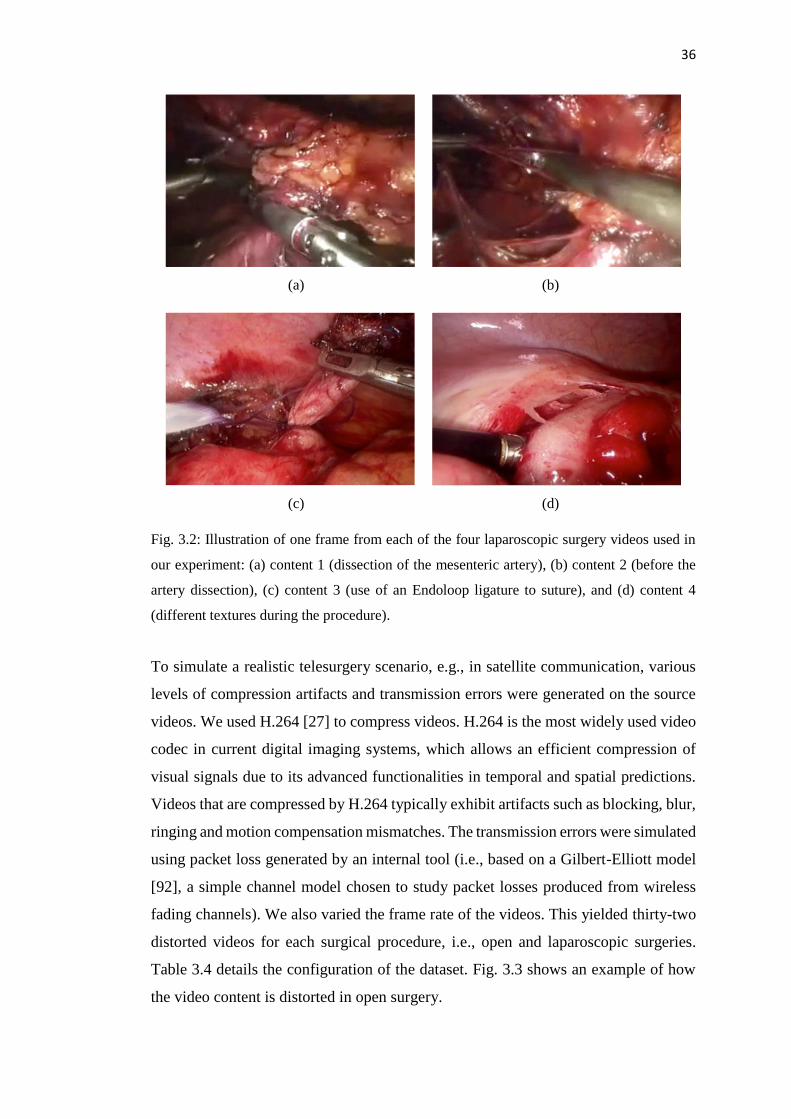
36
(a) (b)
(c) (d)
Fig. 3.2: Illustration of one frame from each of the four laparoscopic surgery videos used in
our experiment: (a) content 1 (dissection of the mesenteric artery), (b) content 2 (before the
artery dissection), (c) content 3 (use of an Endoloop ligature to suture), and (d) content 4
(different textures during the procedure).
To simulate a realistic telesurgery scenario, e.g., in satellite communication, various
levels of compression artifacts and transmission errors were generated on the source
videos. We used H.264 [27] to compress videos. H.264 is the most widely used video
codec in current digital imaging systems, which allows an efficient compression of
visual signals due to its advanced functionalities in temporal and spatial predictions.
Videos that are compressed by H.264 typically exhibit artifacts such as blocking, blur,
ringing and motion compensation mismatches. The transmission errors were simulated
using packet loss generated by an internal tool (i.e., based on a Gilbert-Elliott model
[92], a simple channel model chosen to study packet losses produced from wireless
fading channels). We also varied the frame rate of the videos. This yielded thirty-two
distorted videos for each surgical procedure, i.e., open and laparoscopic surgeries.
Table 3.4 details the configuration of the dataset. Fig. 3.3 shows an example of how
the video content is distorted in open surgery.
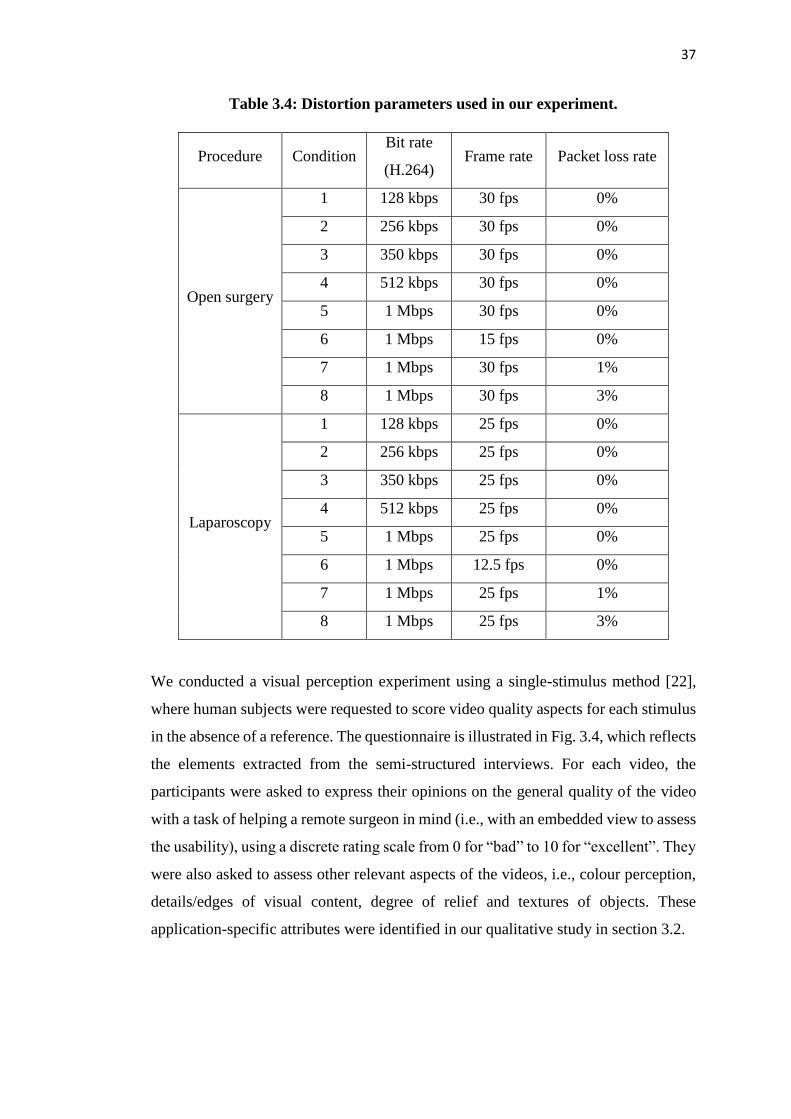
37
Table 3.4: Distortion parameters used in our experiment.
Procedure Condition Bit rate
(H.264) Frame rate Packet loss rate
Open surgery
1 128 kbps 30 fps 0%
2 256 kbps 30 fps 0%
3 350 kbps 30 fps 0%
4 512 kbps 30 fps 0%
5 1 Mbps 30 fps 0%
6 1 Mbps 15 fps 0%
7 1 Mbps 30 fps 1%
8 1 Mbps 30 fps 3%
Laparoscopy
1 128 kbps 25 fps 0%
2 256 kbps 25 fps 0%
3 350 kbps 25 fps 0%
4 512 kbps 25 fps 0%
5 1 Mbps 25 fps 0%
6 1 Mbps 12.5 fps 0%
7 1 Mbps 25 fps 1%
8 1 Mbps 25 fps 3%
We conducted a visual perception experiment using a single-stimulus method [22],
where human subjects were requested to score video quality aspects for each stimulus
in the absence of a reference. The questionnaire is illustrated in Fig. 3.4, which reflects
the elements extracted from the semi-structured interviews. For each video, the
participants were asked to express their opinions on the general quality of the video
with a task of helping a remote surgeon in mind (i.e., with an embedded view to assess
the usability), using a discrete rating scale from 0 for “bad” to 10 for “excellent”. They
were also asked to assess other relevant aspects of the videos, i.e., colour perception,
details/edges of visual content, degree of relief and textures of objects. These
application-specific attributes were identified in our qualitative study in section 3.2.
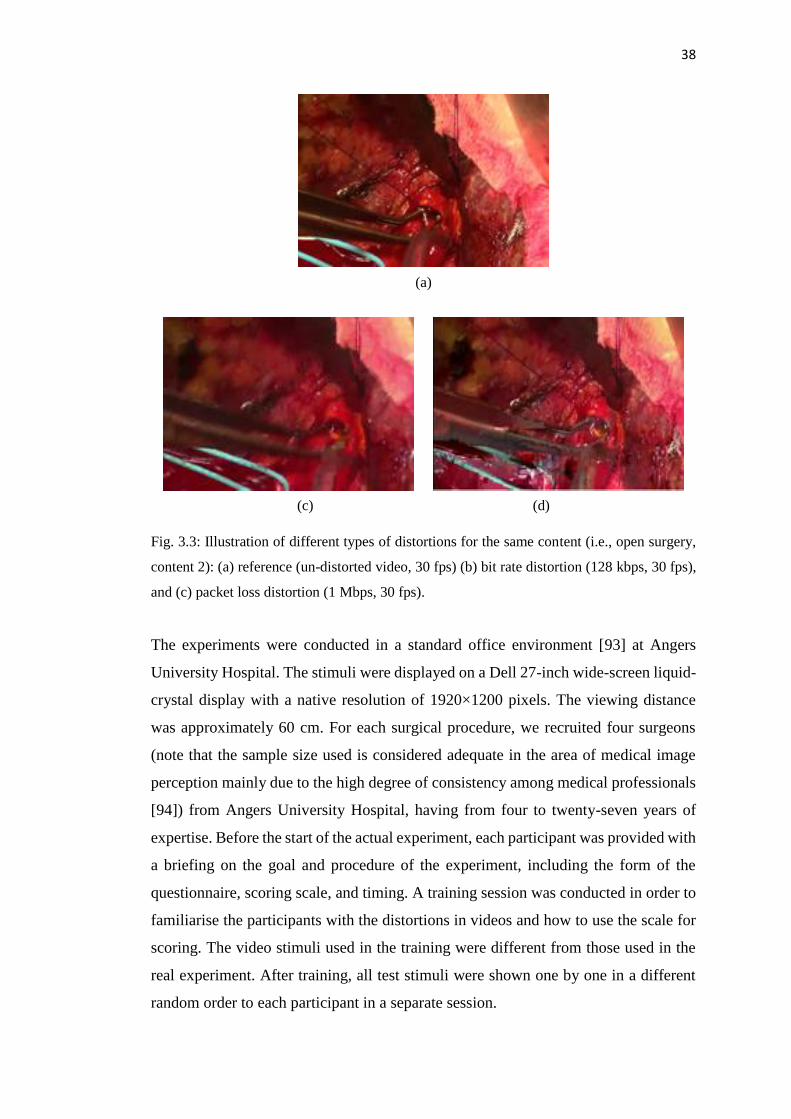
38
(a)
(c) (d)
Fig. 3.3: Illustration of different types of distortions for the same content (i.e., open surgery,
content 2): (a) reference (un-distorted video, 30 fps) (b) bit rate distortion (128 kbps, 30 fps),
and (c) packet loss distortion (1 Mbps, 30 fps).
The experiments were conducted in a standard office environment [93] at Angers
University Hospital. The stimuli were displayed on a Dell 27-inch wide-screen liquid-
crystal display with a native resolution of 1920×1200 pixels. The viewing distance
was approximately 60 cm. For each surgical procedure, we recruited four surgeons
(note that the sample size used is considered adequate in the area of medical image
perception mainly due to the high degree of consistency among medical professionals
[94]) from Angers University Hospital, having from four to twenty-seven years of
expertise. Before the start of the actual experiment, each participant was provided with
a briefing on the goal and procedure of the experiment, including the form of the
questionnaire, scoring scale, and timing. A training session was conducted in order to
familiarise the participants with the distortions in videos and how to use the scale for
scoring. The video stimuli used in the training were different from those used in the
real experiment. After training, all test stimuli were shown one by one in a different
random order to each participant in a separate session.
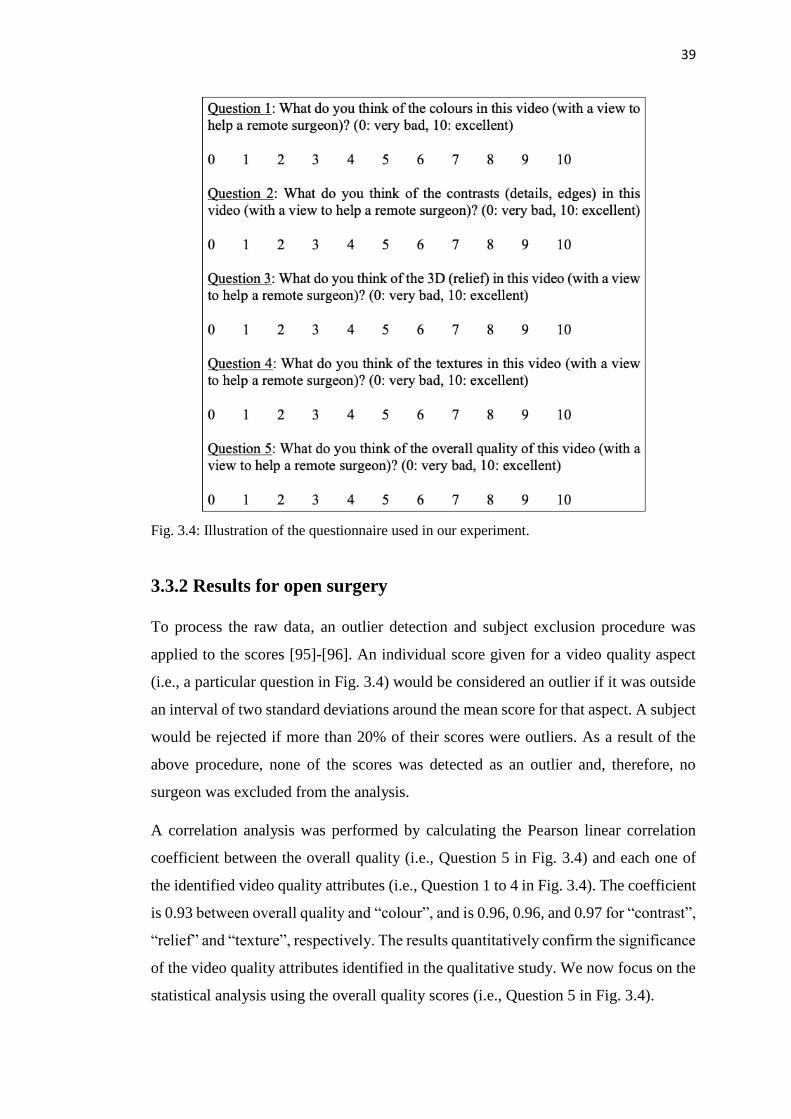
39
Fig. 3.4: Illustration of the questionnaire used in our experiment.
3.3.2 Results for open surgery
To process the raw data, an outlier detection and subject exclusion procedure was
applied to the scores [95]-[96]. An individual score given for a video quality aspect
(i.e., a particular question in Fig. 3.4) would be considered an outlier if it was outside
an interval of two standard deviations around the mean score for that aspect. A subject
would be rejected if more than 20% of their scores were outliers. As a result of the
above procedure, none of the scores was detected as an outlier and, therefore, no
surgeon was excluded from the analysis.
A correlation analysis was performed by calculating the Pearson linear correlation
coefficient between the overall quality (i.e., Question 5 in Fig. 3.4) and each one of
the identified video quality attributes (i.e., Question 1 to 4 in Fig. 3.4). The coefficient
is 0.93 between overall quality and “colour”, and is 0.96, 0.96, and 0.97 for “contrast”,
“relief” and “texture”, respectively. The results quantitatively confirm the significance
of the video quality attributes identified in the qualitative study. We now focus on the
statistical analysis using the overall quality scores (i.e., Question 5 in Fig. 3.4).
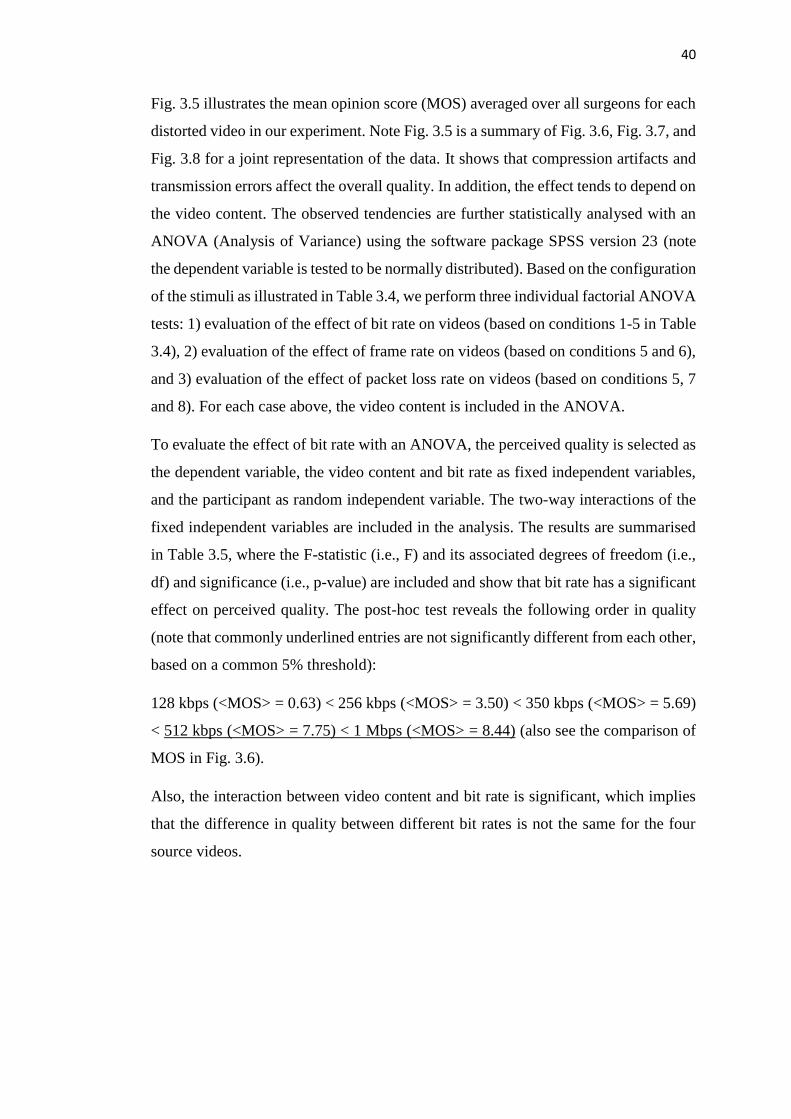
40
Fig. 3.5 illustrates the mean opinion score (MOS) averaged over all surgeons for each
distorted video in our experiment. Note Fig. 3.5 is a summary of Fig. 3.6, Fig. 3.7, and
Fig. 3.8 for a joint representation of the data. It shows that compression artifacts and
transmission errors affect the overall quality. In addition, the effect tends to depend on
the video content. The observed tendencies are further statistically analysed with an
ANOVA (Analysis of Variance) using the software package SPSS version 23 (note
the dependent variable is tested to be normally distributed). Based on the configuration
of the stimuli as illustrated in Table 3.4, we perform three individual factorial ANOVA
tests: 1) evaluation of the effect of bit rate on videos (based on conditions 1-5 in Table
3.4), 2) evaluation of the effect of frame rate on videos (based on conditions 5 and 6),
and 3) evaluation of the effect of packet loss rate on videos (based on conditions 5, 7
and 8). For each case above, the video content is included in the ANOVA.
To evaluate the effect of bit rate with an ANOVA, the perceived quality is selected as
the dependent variable, the video content and bit rate as fixed independent variables,
and the participant as random independent variable. The two-way interactions of the
fixed independent variables are included in the analysis. The results are summarised
in Table 3.5, where the F-statistic (i.e., F) and its associated degrees of freedom (i.e.,
df) and significance (i.e., p-value) are included and show that bit rate has a significant
effect on perceived quality. The post-hoc test reveals the following order in quality
(note that commonly underlined entries are not significantly different from each other,
based on a common 5% threshold):
128 kbps (<MOS> = 0.63) < 256 kbps (<MOS> = 3.50) < 350 kbps (<MOS> = 5.69)
< 512 kbps (<MOS> = 7.75) < 1 Mbps (<MOS> = 8.44) (also see the comparison of
MOS in Fig. 3.6).
Also, the interaction between video content and bit rate is significant, which implies
that the difference in quality between different bit rates is not the same for the four
source videos.

41
Fig. 3.5: Illustration of the mean opinion score (MOS) averaged across subjects for each
distorted video for open surgery. “Content” refers to a source video. Error bars indicate a 95%
confidence interval.
Table 3.5: Results of the ANOVA to evaluate the effect of “Bit rate” and
“Content” on the perceived quality for open surgery.
Factor df F p-value
Bit rate 4 89.445 <0.001
Content 3 3.255 0.074
Bit rate * Content 12 2.230 0.032
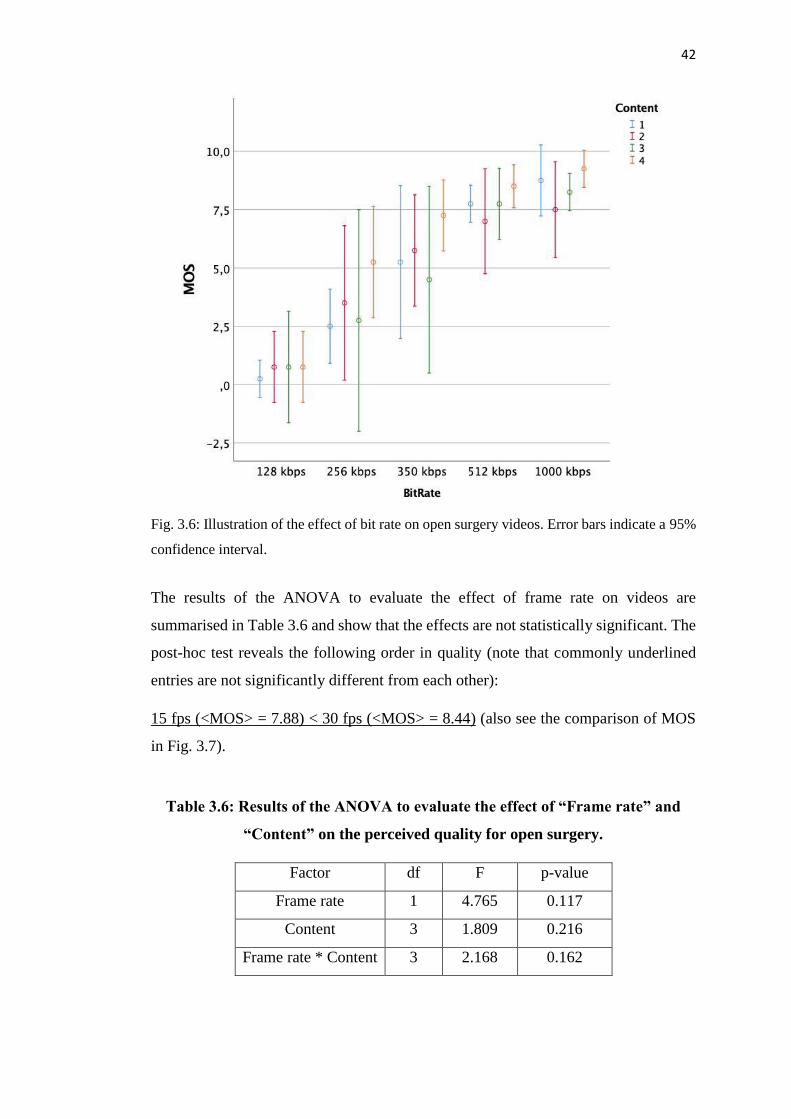
42
Fig. 3.6: Illustration of the effect of bit rate on open surgery videos. Error bars indicate a 95%
confidence interval.
The results of the ANOVA to evaluate the effect of frame rate on videos are
summarised in Table 3.6 and show that the effects are not statistically significant. The
post-hoc test reveals the following order in quality (note that commonly underlined
entries are not significantly different from each other):
15 fps (<MOS> = 7.88) < 30 fps (<MOS> = 8.44) (also see the comparison of MOS
in Fig. 3.7).
Table 3.6: Results of the ANOVA to evaluate the effect of “Frame rate” and
“Content” on the perceived quality for open surgery.
Factor df F p-value
Frame rate 1 4.765 0.117
Content 3 1.809 0.216
Frame rate * Content 3 2.168 0.162

43
Fig. 3.7: Illustration of the effect of frame rate on open surgery videos. Error bars indicate a
95% confidence interval.
The results of the ANOVA to evaluate the effect of packet loss on videos are
summarised in Table 3.7, and show that packet loss rate has a significant effect on
perceived quality. The post-hoc test reveals the following order in quality:
3% (<MOS> = 3.063) < 1% (<MOS> = 5.81) < 0% (<MOS> = 8.44) (also see the
comparison of MOS in Fig. 3.8).
Table 3.7: Results of the ANOVA to evaluate the effect of “Packet loss rate” and
“Content” on the perceived quality for open surgery.
Factor df F p-value
Packet loss rate 2 17.858 0.003
Content 3 2.673 0.082
Packet loss rate * Content 6 2.538 0.059
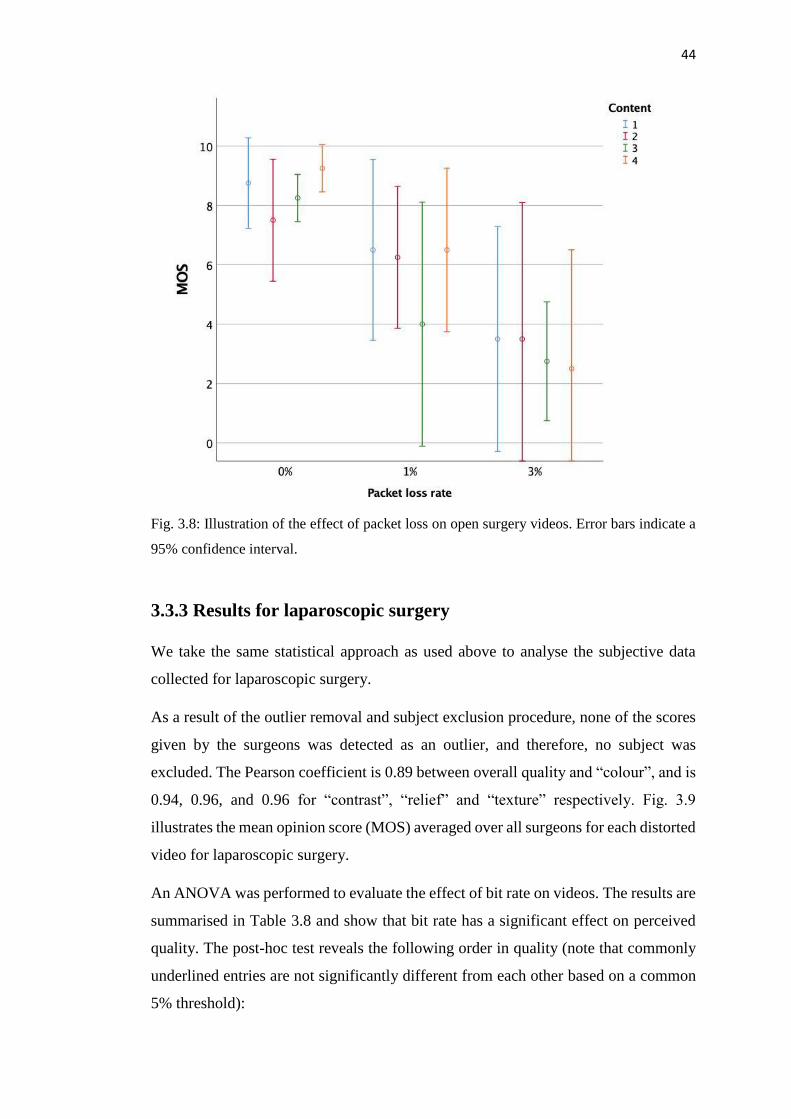
44
Fig. 3.8: Illustration of the effect of packet loss on open surgery videos. Error bars indicate a
95% confidence interval.
3.3.3 Results for laparoscopic surgery
We take the same statistical approach as used above to analyse the subjective data
collected for laparoscopic surgery.
As a result of the outlier removal and subject exclusion procedure, none of the scores
given by the surgeons was detected as an outlier, and therefore, no subject was
excluded. The Pearson coefficient is 0.89 between overall quality and “colour”, and is
0.94, 0.96, and 0.96 for “contrast”, “relief” and “texture” respectively. Fig. 3.9
illustrates the mean opinion score (MOS) averaged over all surgeons for each distorted
video for laparoscopic surgery.
An ANOVA was performed to evaluate the effect of bit rate on videos. The results are
summarised in Table 3.8 and show that bit rate has a significant effect on perceived
quality. The post-hoc test reveals the following order in quality (note that commonly
underlined entries are not significantly different from each other based on a common
5% threshold):

45
128 kbps (<MOS> = 2.25) < 256 kbps (<MOS> = 4.5) < 350 kbps (<MOS> = 5.25) <
512 kbps (<MOS> = 7.25) < 1 Mbps (<MOS> = 8.13) (also see the comparison of
MOS in Fig. 3.10).
Fig. 3.9: Illustration of the mean opinion score (MOS) averaged across subjects for each
distorted video for laparoscopic surgery. “Content” refers to a source video. Error bars indicate
a 95% confidence interval.
Table 3.8: Results of the ANOVA to evaluate the effect of “Bit rate” and
“Content” on the perceived quality for laparoscopic surgery.
Factor df F p-value
Bit rate 4 63.676 <0.001
Content 3 3.395 0.067
Bit rate * Content 12 1.970 0.058
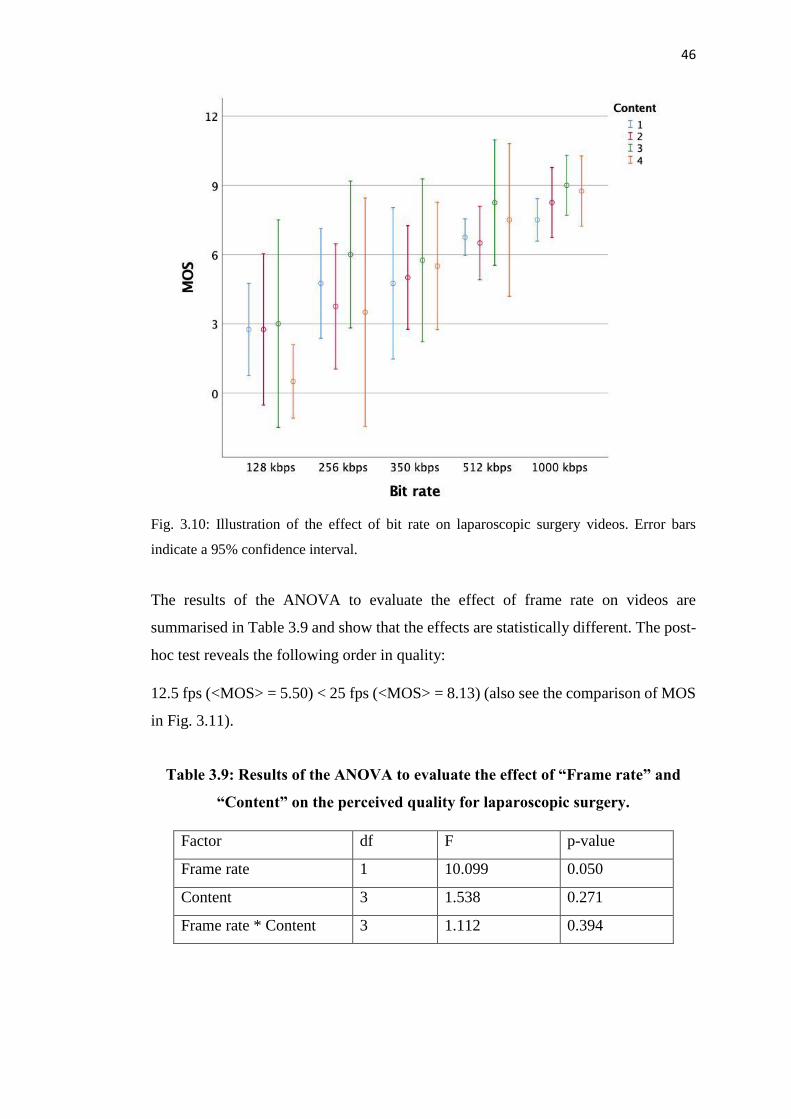
46
Fig. 3.10: Illustration of the effect of bit rate on laparoscopic surgery videos. Error bars
indicate a 95% confidence interval.
The results of the ANOVA to evaluate the effect of frame rate on videos are
summarised in Table 3.9 and show that the effects are statistically different. The post-
hoc test reveals the following order in quality:
12.5 fps (<MOS> = 5.50) < 25 fps (<MOS> = 8.13) (also see the comparison of MOS
in Fig. 3.11).
Table 3.9: Results of the ANOVA to evaluate the effect of “Frame rate” and
“Content” on the perceived quality for laparoscopic surgery.
Factor df F p-value
Frame rate 1 10.099 0.050
Content 3 1.538 0.271
Frame rate * Content 3 1.112 0.394
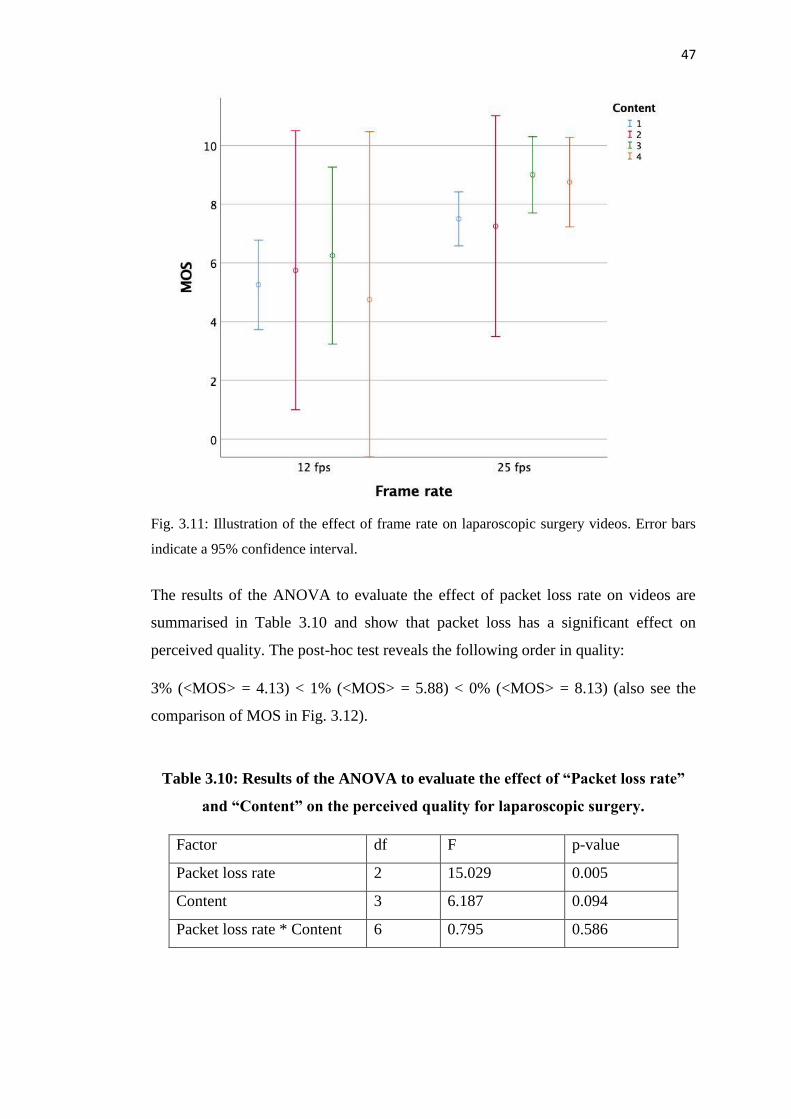
47
Fig. 3.11: Illustration of the effect of frame rate on laparoscopic surgery videos. Error bars
indicate a 95% confidence interval.
The results of the ANOVA to evaluate the effect of packet loss rate on videos are
summarised in Table 3.10 and show that packet loss has a significant effect on
perceived quality. The post-hoc test reveals the following order in quality:
3% (<MOS> = 4.13) < 1% (<MOS> = 5.88) < 0% (<MOS> = 8.13) (also see the
comparison of MOS in Fig. 3.12).
Table 3.10: Results of the ANOVA to evaluate the effect of “Packet loss rate”
and “Content” on the perceived quality for laparoscopic surgery.
Factor df F p-value
Packet loss rate 2 15.029 0.005
Content 3 6.187 0.094
Packet loss rate * Content 6 0.795 0.586
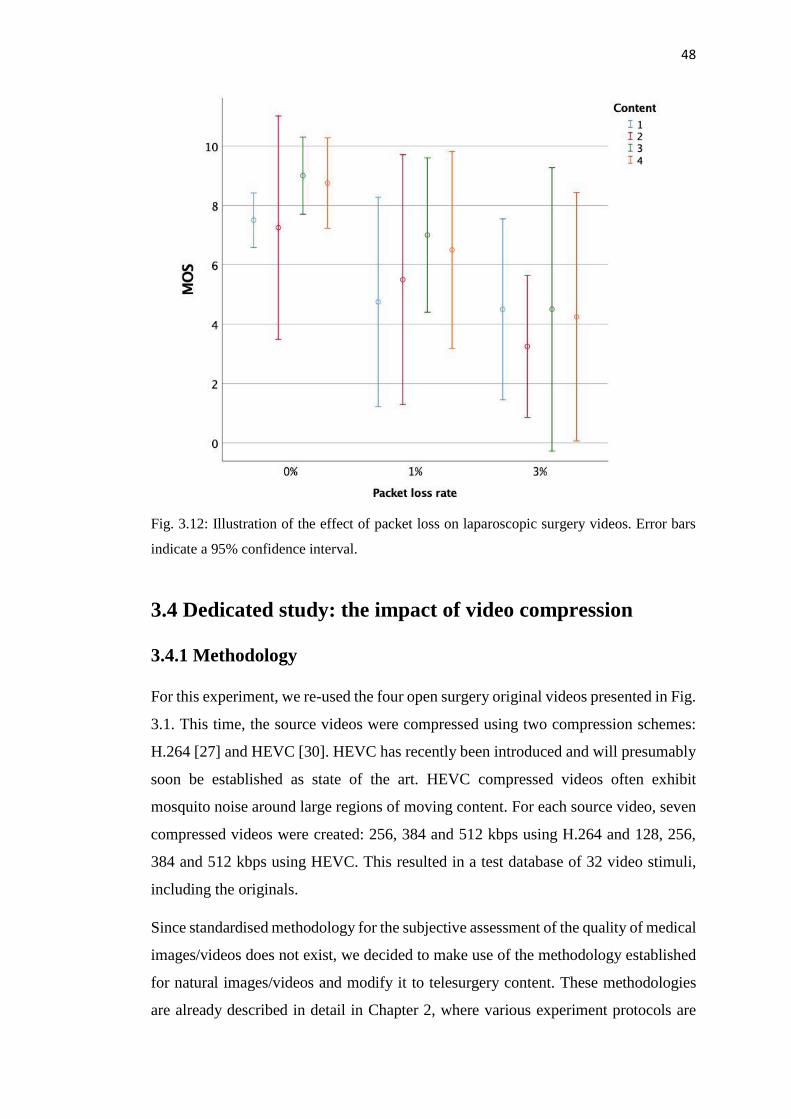
48
Fig. 3.12: Illustration of the effect of packet loss on laparoscopic surgery videos. Error bars
indicate a 95% confidence interval.
3.4 Dedicated study: the impact of video compression
3.4.1 Methodology
For this experiment, we re-used the four open surgery original videos presented in Fig.
3.1. This time, the source videos were compressed using two compression schemes:
H.264 [27] and HEVC [30]. HEVC has recently been introduced and will presumably
soon be established as state of the art. HEVC compressed videos often exhibit
mosquito noise around large regions of moving content. For each source video, seven
compressed videos were created: 256, 384 and 512 kbps using H.264 and 128, 256,
384 and 512 kbps using HEVC. This resulted in a test database of 32 video stimuli,
including the originals.
Since standardised methodology for the subjective assessment of the quality of medical
images/videos does not exist, we decided to make use of the methodology established
for natural images/videos and modify it to telesurgery content. These methodologies
are already described in detail in Chapter 2, where various experiment protocols are
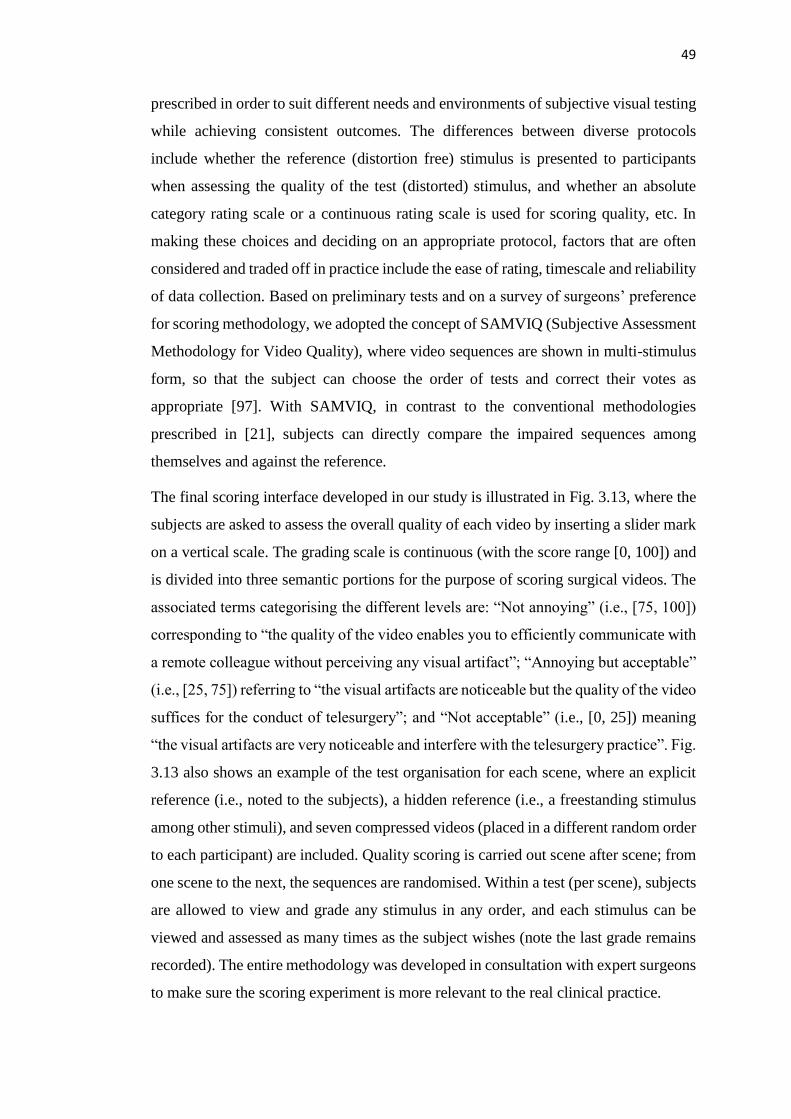
49
prescribed in order to suit different needs and environments of subjective visual testing
while achieving consistent outcomes. The differences between diverse protocols
include whether the reference (distortion free) stimulus is presented to participants
when assessing the quality of the test (distorted) stimulus, and whether an absolute
category rating scale or a continuous rating scale is used for scoring quality, etc. In
making these choices and deciding on an appropriate protocol, factors that are often
considered and traded off in practice include the ease of rating, timescale and reliability
of data collection. Based on preliminary tests and on a survey of surgeons’ preference
for scoring methodology, we adopted the concept of SAMVIQ (Subjective Assessment
Methodology for Video Quality), where video sequences are shown in multi-stimulus
form, so that the subject can choose the order of tests and correct their votes as
appropriate [97]. With SAMVIQ, in contrast to the conventional methodologies
prescribed in [21], subjects can directly compare the impaired sequences among
themselves and against the reference.
The final scoring interface developed in our study is illustrated in Fig. 3.13, where the
subjects are asked to assess the overall quality of each video by inserting a slider mark
on a vertical scale. The grading scale is continuous (with the score range [0, 100]) and
is divided into three semantic portions for the purpose of scoring surgical videos. The
associated terms categorising the different levels are: “Not annoying” (i.e., [75, 100])
corresponding to “the quality of the video enables you to efficiently communicate with
a remote colleague without perceiving any visual artifact”; “Annoying but acceptable”
(i.e., [25, 75]) referring to “the visual artifacts are noticeable but the quality of the video
suffices for the conduct of telesurgery”; and “Not acceptable” (i.e., [0, 25]) meaning
“the visual artifacts are very noticeable and interfere with the telesurgery practice”. Fig.
3.13 also shows an example of the test organisation for each scene, where an explicit
reference (i.e., noted to the subjects), a hidden reference (i.e., a freestanding stimulus
among other stimuli), and seven compressed videos (placed in a different random order
to each participant) are included. Quality scoring is carried out scene after scene; from
one scene to the next, the sequences are randomised. Within a test (per scene), subjects
are allowed to view and grade any stimulus in any order, and each stimulus can be
viewed and assessed as many times as the subject wishes (note the last grade remains
recorded). The entire methodology was developed in consultation with expert surgeons
to make sure the scoring experiment is more relevant to the real clinical practice.

50
Fig. 3.13: Illustration of the rating interface used in our experiment.
We set up a standard office environment [93] at Angers University Hospital for the
conduct of the experiment. The venue represented a controlled viewing environment to
ensure consistent experimental conditions: low surface reflectance and approximately
constant ambient light. For the display of the test stimuli, we used a Dell 27-inch wide-
screen liquid-crystal display with a native resolution of 1920×1200 pixels. No video
adjustment (zoom, window level) was allowed during the experiment.
Eight abdominal surgeons (having three to twenty-seven years of experience in
surgery) from Angers University Hospital participated in the experiment. Note the
surgeons who participated in the preliminary study did not participate in the dedicated
study. Each participant was first given written instructions on the experimental
procedure prior to the start of the actual testing. A training session was then performed
where participants had the opportunity to understand the specific visual distortions and
to familiarise themselves with how to use the range of the scoring scale. As for the
preliminary study, the stimuli shown in the training session were different from those
presented in the actual experiment.

51
3.4.2 Experimental results
After the subjective experiment, raw scores were filtered to reject outlier evaluations
and individuals, as already explained in Section 3.3.2. This procedure caused only two
scores to be rejected as outliers (i.e., one for “Content 1” and one for “Content 4”),
and no surgeon to be rejected. After data filtering, the remaining scores were analysed.
Fig. 3.14 gives the mean opinion score (MOS) averaged over all participants, for each
compressed surgical video in our subjective experiment. It clearly illustrates that the
compression scheme (i.e., H.264 versus HEVC) and the compression ratio impact the
perceived video quality. The figure also shows that the change of quality tends to
depend on the content of the stimulus. To statistically analyse the observed tendencies,
we performed a full factorial ANOVA using the subjective quality as the dependent
variable, the video content and compression (i.e., scheme and ratio) as fixed
independent variables, and the participant as random independent variable (note the
dependent variable is tested to be normally distributed). The statistical analysis also
contained the two-way interactions of the fixed variables. Table 3.11 summarises the
results, including for each variable the F-statistic (F-value), the degrees of freedom
(df) and the significance (p-value). These results indicate that all main effects and
interactions are statistically significant. Not all source videos (i.e., “Content”) receive
the same average rating of quality (note underlined items are not statistically different
from each other):
“Content 4” < “Content 2” < “Content 3” < “Content 1”
There is also a significant difference in quality between the seven configurations of
compression, and the statistical analysis reveals the following order of average quality:
HEVC: 128 kbps < H.264: 256 kbps < H.264: 384 kbps < HEVC: 256 kbps < H.264:
512 kbps < HEVC: 384 kbps < HEVC: 512 kbps
In addition, the interaction between content and compression is significant. This
indicates that the impact the different compression strategies have on quality depends
on the video content.
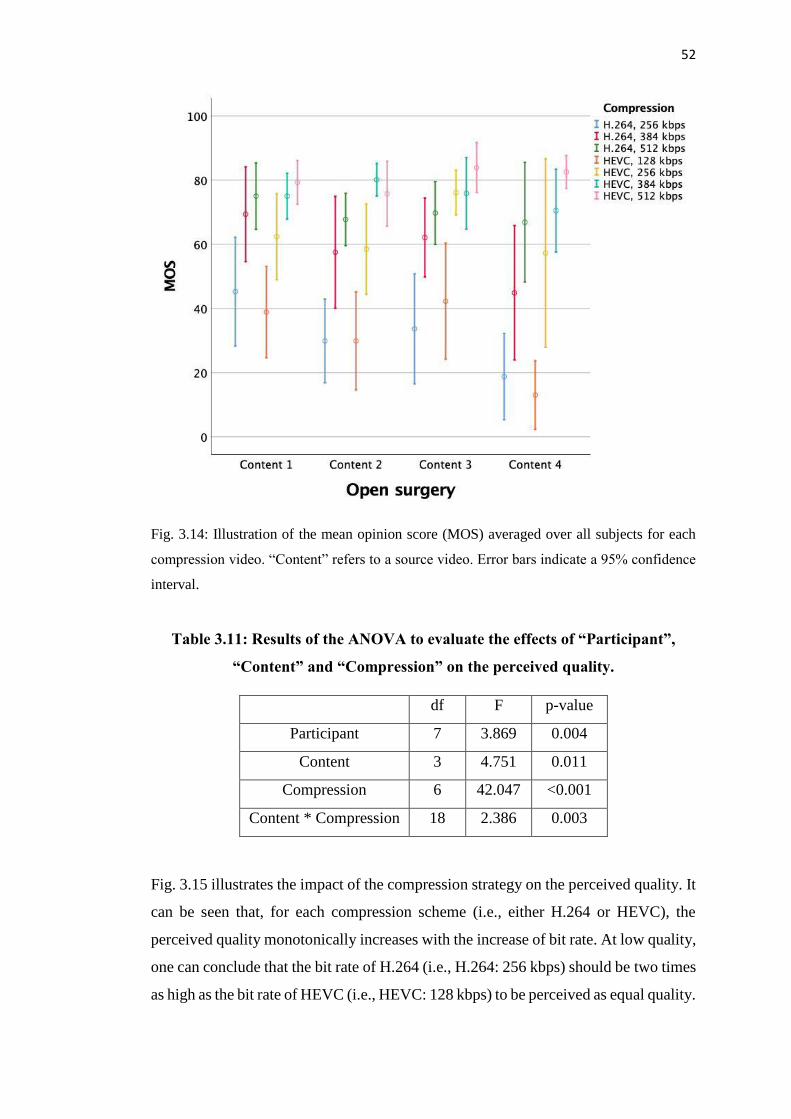
52
Fig. 3.14: Illustration of the mean opinion score (MOS) averaged over all subjects for each
compression video. “Content” refers to a source video. Error bars indicate a 95% confidence
interval.
Table 3.11: Results of the ANOVA to evaluate the effects of “Participant”,
“Content” and “Compression” on the perceived quality.
df F p-value
Participant 7 3.869 0.004
Content 3 4.751 0.011
Compression 6 42.047 <0.001
Content * Compression 18 2.386 0.003
Fig. 3.15 illustrates the impact of the compression strategy on the perceived quality. It
can be seen that, for each compression scheme (i.e., either H.264 or HEVC), the
perceived quality monotonically increases with the increase of bit rate. At low quality,
one can conclude that the bit rate of H.264 (i.e., H.264: 256 kbps) should be two times
as high as the bit rate of HEVC (i.e., HEVC: 128 kbps) to be perceived as equal quality.

53
At higher bit rate, to achieve the same perceived quality, the bit rate of H.264 (i.e.,
H.264: 384 kbps) should be 1.5 times the bit rate of HEVC (i.e., HEVC: 256 kbps).
Pairwise comparisons are further performed with hypothesis testing between the two
compression schemes. The results are summarised in Table 3.12, where a paired
sample t-test is performed if both samples are normally distributed; otherwise, in the
case of non-normality, a nonparametric version analogue to a paired sample t-test (i.e.,
Wilcoxon signed rank sum) is conducted. It clearly indicates that there is no
statistically significant difference between H.264: 256 kbps and HEVC: 128 kbps, and
that similarly for the following pairwise comparisons: H.264:384 kbps vs. HEVC: 256
kbps, and HEVC: 384 kbps vs. HEVC: 512 kbps, the difference is not statistically
significant for each case.
Fig. 3.15: Illustration of quality averaged over all subjects and all source videos for each
compression configuration. Error bars indicate a 95% confidence interval.
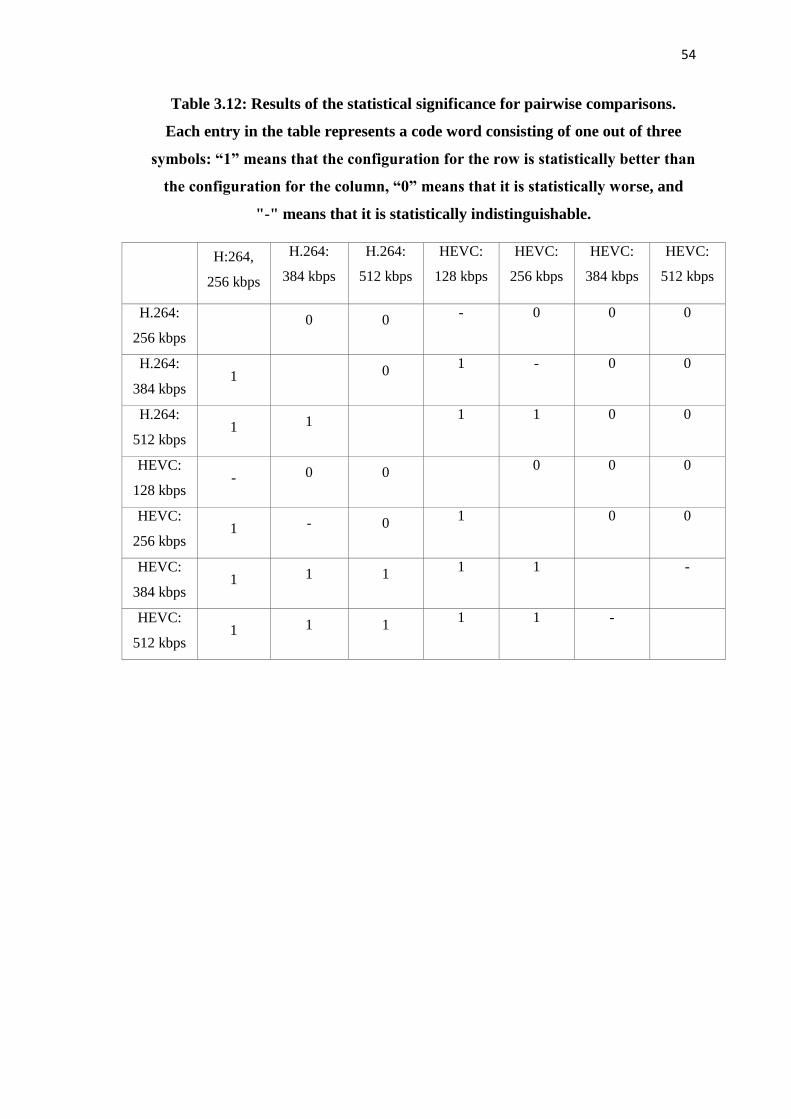
54
Table 3.12: Results of the statistical significance for pairwise comparisons.
Each entry in the table represents a code word consisting of one out of three
symbols: “1” means that the configuration for the row is statistically better than
the configuration for the column, “0” means that it is statistically worse, and
"-" means that it is statistically indistinguishable.
H:264,
256 kbps
H.264:
384 kbps
H.264:
512 kbps
HEVC:
128 kbps
HEVC:
256 kbps
HEVC:
384 kbps
HEVC:
512 kbps
H.264:
256 kbps 0 0
- 0 0 0
H.264:
384 kbps 1 0
1 - 0 0
H.264:
512 kbps 1 1
1 1 0 0
HEVC:
128 kbps - 0 0
0 0 0
HEVC:
256 kbps 1 - 0
1 0 0
HEVC:
384 kbps 1 1 1
1 1 -
HEVC:
512 kbps 1 1 1
1 1 -
55
3.5 Main findings and contributions
We conducted subjective experiments to study how variations in video distortion can
affect the quality perception of surgeons in the practice of telesurgery, with two
distinct procedures, i.e., open surgery and laparoscopic surgery.
For both procedures, compression artifacts have a statistically significant effect on the
perceived quality. More specifically, for open surgery, H.264 compression has a
significant impact on the quality, and the way video quality changes with the bit rate
depends on the video content. The impact of video content is probably due to that
content itself may induce an intrinsic difference in sensitivity to distortion and thus, in
the annoyance of distortion. However, the results showed that there is no statistically
significant difference between the two higher bit rates studied, i.e., 512 kbps and 1
Mbps. For laparoscopic surgery, the impact of the different bit rates on video quality
is the same for all video scenes. No statistically significant difference was found
between intermediate bit rates, i.e., 256 kbps and 350 kbps with H.2.64.
We also found that at high bit rate (i.e., 1 Mbps), transmission errors (i.e., packet loss)
can significantly reduce the perceived video quality for both surgical procedures in the
similar way. The quality of videos for open surgery is not sensitive to the change of
frame rate (i.e., from 30 to 15 frames per second). For laparoscopic surgery, videos
with a lower frame rate are scored lower in quality than videos with a higher frame
rate (i.e., from 25 to 12.5 frames per second).
A dedicated study to assess the impact of the compression strategy for open surgery
was also designed and conducted. The results showed that the bit rate of H.264
compressed videos has to be two times the bit rate of HEVC compressed videos to
provide the same perceived quality in telesurgery at low quality (i.e., H.264: 256 kbps)
and 1.5 times the bit rate of HEVC compressed videos at higher quality (i.e., H.264:
384 kbps).

56
57
Chapter 4:
The impact of medical specialty
on the perceived quality
4.1 Introduction
As introduced previously, the perception of medical image quality is critical to clinical
practice. In the previous chapter, we presented a study on how medical professionals
perceive medical imaging. However, since health professionals are increasingly
viewing medical images in a variety of environments, it is important to understand
quality perception across speciality practice settings. Little progress has been made
towards this purpose. In radiology practice, there are two groups of professionals who
interact with and process image information. A radiologist is a doctor who is specially
trained to interpret diagnostic images, and a radiographer is a person who has been
trained to acquire medical images (note if a radiographer has been trained to perform
an ultrasound, he/she may be called a sonographer). Both specialities are important for
medical diagnosis. However, very little is known about the difference between
radiologists and radiographers in term of their perception of image quality.
In this chapter, we investigate whether and to what extent specialty practice, i.e.,
radiologists versus sonographers, affect the quality perception of ultrasound video,
through perception experimentation with compressed visual stimuli.
4.2 Visual quality perception experiment with radiologists
and sonographers
4.2.1 Stimuli
Unlike other related visual quality assessment studies in the literature which are either
limited to a specific compression scheme or a small degree of stimulus variability, we
aim to study a more comprehensive set of stimuli of a larger diversity in visual content
and distortion. By this, we mean the dataset would include alternative popular
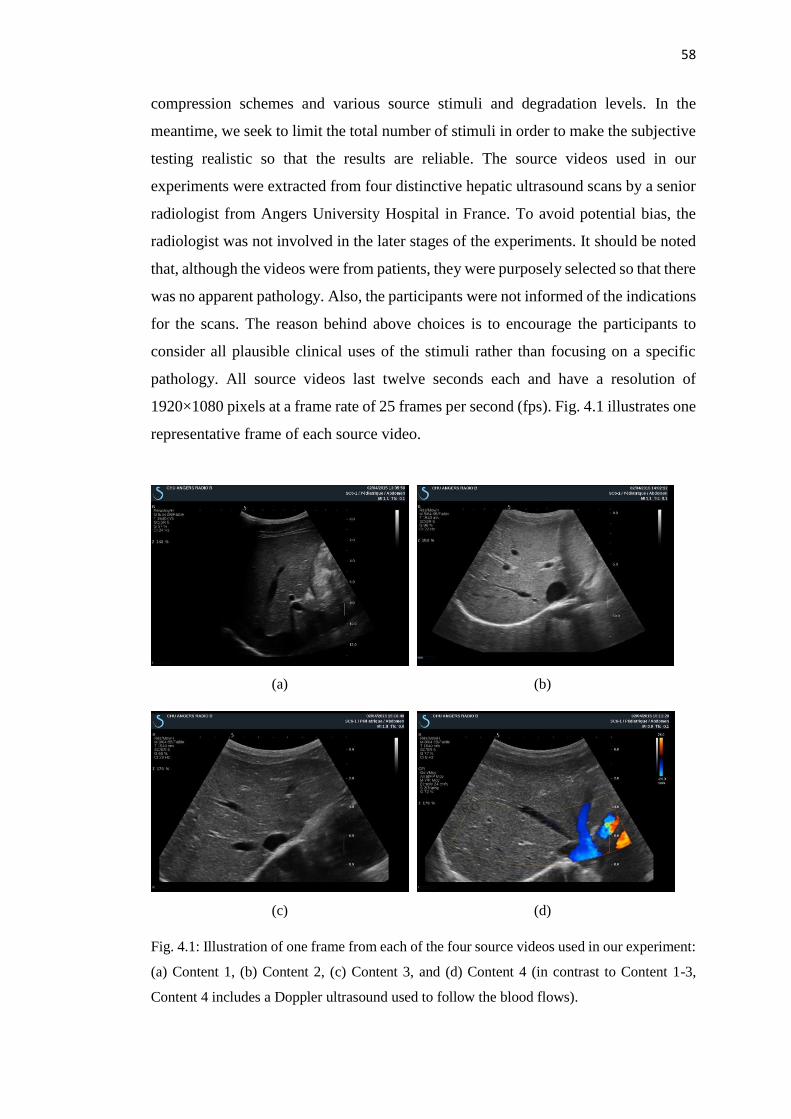
58
compression schemes and various source stimuli and degradation levels. In the
meantime, we seek to limit the total number of stimuli in order to make the subjective
testing realistic so that the results are reliable. The source videos used in our
experiments were extracted from four distinctive hepatic ultrasound scans by a senior
radiologist from Angers University Hospital in France. To avoid potential bias, the
radiologist was not involved in the later stages of the experiments. It should be noted
that, although the videos were from patients, they were purposely selected so that there
was no apparent pathology. Also, the participants were not informed of the indications
for the scans. The reason behind above choices is to encourage the participants to
consider all plausible clinical uses of the stimuli rather than focusing on a specific
pathology. All source videos last twelve seconds each and have a resolution of
1920×1080 pixels at a frame rate of 25 frames per second (fps). Fig. 4.1 illustrates one
representative frame of each source video.
(a) (b)
(c) (d)
Fig. 4.1: Illustration of one frame from each of the four source videos used in our experiment:
(a) Content 1, (b) Content 2, (c) Content 3, and (d) Content 4 (in contrast to Content 1-3,
Content 4 includes a Doppler ultrasound used to follow the blood flows).
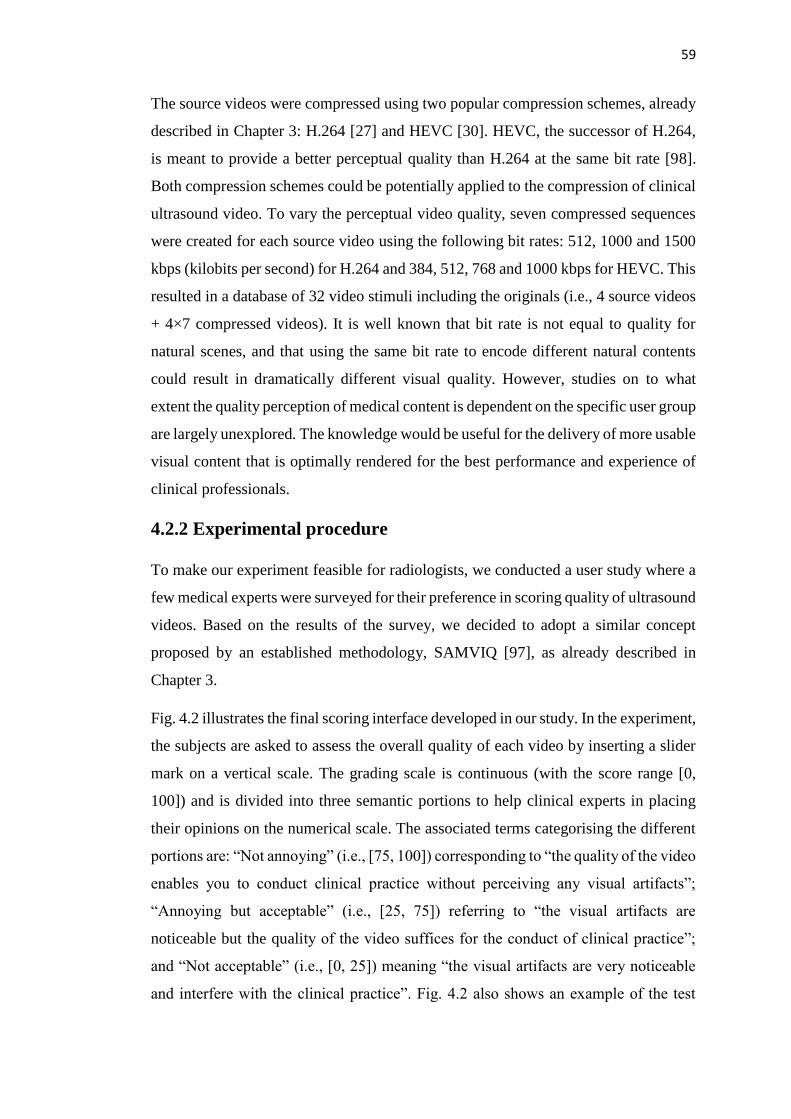
59
The source videos were compressed using two popular compression schemes, already
described in Chapter 3: H.264 [27] and HEVC [30]. HEVC, the successor of H.264,
is meant to provide a better perceptual quality than H.264 at the same bit rate [98].
Both compression schemes could be potentially applied to the compression of clinical
ultrasound video. To vary the perceptual video quality, seven compressed sequences
were created for each source video using the following bit rates: 512, 1000 and 1500
kbps (kilobits per second) for H.264 and 384, 512, 768 and 1000 kbps for HEVC. This
resulted in a database of 32 video stimuli including the originals (i.e., 4 source videos
+ 4×7 compressed videos). It is well known that bit rate is not equal to quality for
natural scenes, and that using the same bit rate to encode different natural contents
could result in dramatically different visual quality. However, studies on to what
extent the quality perception of medical content is dependent on the specific user group
are largely unexplored. The knowledge would be useful for the delivery of more usable
visual content that is optimally rendered for the best performance and experience of
clinical professionals.
4.2.2 Experimental procedure
To make our experiment feasible for radiologists, we conducted a user study where a
few medical experts were surveyed for their preference in scoring quality of ultrasound
videos. Based on the results of the survey, we decided to adopt a similar concept
proposed by an established methodology, SAMVIQ [97], as already described in
Chapter 3.
Fig. 4.2 illustrates the final scoring interface developed in our study. In the experiment,
the subjects are asked to assess the overall quality of each video by inserting a slider
mark on a vertical scale. The grading scale is continuous (with the score range [0,
100]) and is divided into three semantic portions to help clinical experts in placing
their opinions on the numerical scale. The associated terms categorising the different
portions are: “Not annoying” (i.e., [75, 100]) corresponding to “the quality of the video
enables you to conduct clinical practice without perceiving any visual artifacts”;
“Annoying but acceptable” (i.e., [25, 75]) referring to “the visual artifacts are
noticeable but the quality of the video suffices for the conduct of clinical practice”;
and “Not acceptable” (i.e., [0, 25]) meaning “the visual artifacts are very noticeable
and interfere with the clinical practice”. Fig. 4.2 also shows an example of the test
60
organisation for each source scene, where an explicit reference (i.e., noted to the
subjects), a hidden reference (i.e., a freestanding stimulus among other test stimuli)
and seven compressed versions (placed in a different random order to each participant)
are included. For each participant, the experiment is carried out scene after scene; and
the order of scenes is randomised. Within a test (per scene), as shown in Fig. 4.2,
subjects are allowed to view and grade any stimulus in any order; and each stimulus
can be viewed and assessed as many times as the subject wishes (note the last score
remains recorded). Note the entire methodology was developed in consultation with
clinical experts to make sure the scoring experiment is more relevant and realistic to
the reading environments in real clinical practice.
Fig. 4.2: Illustration of the rating interface used in our experiment.
4.2.3 Test environment and participants
The experiment was conducted in a typical radiology reading room environment. The
venue represented a controlled viewing environment to ensure consistent experimental
conditions: low surface reflectance and approximately constant ambient light (i.e.,
with an indirect horizontal illumination of 100 lux). The stimuli were displayed on a
Dell UltraSharp 27-inch wide-screen liquid-crystal display with a native resolution of
2560×1440 pixels, which was calibrated to the Digital Imaging and Communications
in Medicine (DICOM): Grayscale Standard Display Function (GSDF) [99]-[101]. The
61
viewing distance was approximately 60 cm. No video adjustment (zoom, window
level) was allowed.
Before the start of the actual experiment, each participant was provided with
instructions on the procedure of the experiment (e.g., explaining the type of assessment
and the scoring interface). A training session was conducted in order to familiarise the
participants with the visual distortions involved and with how to use the range of the
scoring scale. The video stimuli used in the training were different from those used in
the real experiment. After training, all test stimuli were shown to each participant.
Since the goal of the study is to investigate visual quality perception across different
specialities, our experiments were conducted with both radiologists and sonographers.
Eight radiologists were recruited from Angers University Hospital, Angers, France,
and nine sonographers from Castle Hill Hospital and Hull Royal Infirmary, Hull,
United Kingdom.
4.3 Image quality assessment behaviour analysis:
radiologists versus sonographers
The two sets of raw data, one collected from radiologists and one from sonographers,
were individually processed in the same way. Firstly, a simple outlier detection and
subject exclusion procedure, as previously described in Chapter 3, was applied to the
raw scores within a subject group [95]-[96]. As a result of the outlier removal and
subject exclusion procedure, none of the scores were detected as an outlier in both
datasets and, therefore, no radiologists or sonographers were excluded from further
analysis.
Fig. 4.3 and Fig. 4.4 illustrate the mean opinion score (MOS), averaged over all
subjects (within a subject group) for radiologists and sonographers, respectively, for
each compressed video in our experiment. It can be seen clearly from these figures
that sonographers appear to be more bothered by the low-quality videos than
radiologists, as sonographers scored the highly compressed videos (i.e., H.264: 512
kbps and HEVC: 384 kbps) lower in quality than radiologists. However, the difference
is less obvious for the higher quality videos. The observed tendencies are further
statistically analysed. In the case of the low-quality videos, i.e., H.264: 512 kbps and
62
HEVC: 384 kbps, a statistical significance test is performed with the quality as the
dependent variable and the specialty, i.e., radiologist vs. sonographer, as the dependent
variable. As the test for the assumption of normality is not satisfied (i.e., p-value<0.05
for the Shapiro-Wilk test), a nonparametric version (i.e., the Mann-Whitney u-test)
analogue to an independent samples t-test is conducted. The test results (i.e., u-
value<0.05) indicate that there is a statistically significant difference between
radiologists and sonographers in rating low-quality videos. Similarly, in the case of
higher quality videos, i.e., H.264: 1000 and 1500 kbps and HEVC: 512, 768 and 1000
kbps, preceded by a test for the assumption of normality, a Mann-Whitney u-test is
performed and the results (i.e., u-value>0.05) reveal that there is no statistically
significant difference between radiologists and sonographers in rating higher quality
videos.
Fig. 4.3 and Fig. 4.4 show that compression settings – both variables of compression
scheme and compression ratio – affect the video quality. Also, the effect tends to be
subject to video content, for example, in both cases of radiologists and sonographers,
the quality of “Content 1” has consistently been scored higher than the quality of
“Content 2”, independent of the compression scheme or compression ratio. Now, to
further understand the impact of compression and content on video quality, we
performed a statistical analysis, i.e., ANOVA (Analysis of Variance). In each case, the
perceived quality is selected as the dependent variable, the video content and
compression as fixed independent variables and the participant as random independent
variable. The two-way interactions of the fixed variables are included in the analysis.
The results are summarised in Table 4.1 and Table 4.2 for radiologists and
sonographers, respectively, where the F-statistic (i.e., F) and its associated degrees of
freedom (i.e., df) and significance (i.e., p-value) are included.

63
Fig. 4.3: Illustration of the MOS averaged over all radiologists for each compressed video.
“Content” refers to a source video. Error bars indicate a 95% confidence interval.
Fig. 4.4: Illustration of the MOS averaged over all sonographers for each compressed video.
“Content” refers to a source video. Error bars indicate a 95% confidence interval.
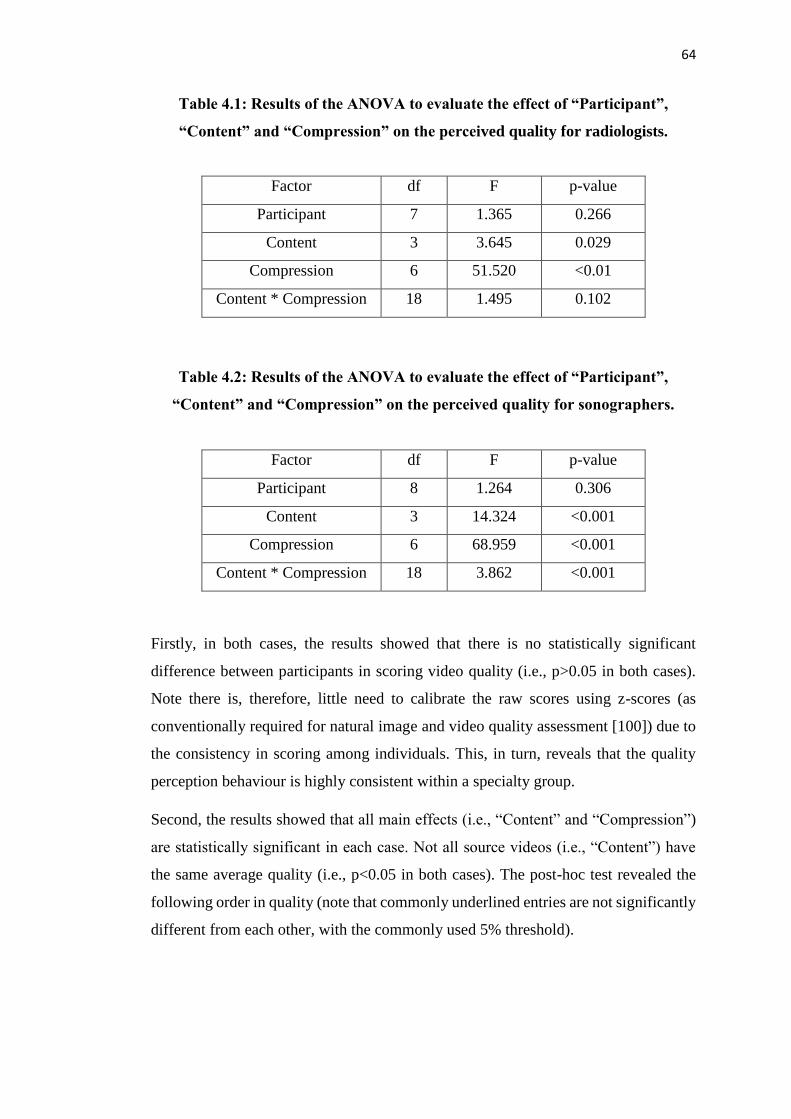
64
Table 4.1: Results of the ANOVA to evaluate the effect of “Participant”,
“Content” and “Compression” on the perceived quality for radiologists.
Factor df F p-value
Participant 7 1.365 0.266
Content 3 3.645 0.029
Compression 6 51.520 <0.01
Content * Compression 18 1.495 0.102
Table 4.2: Results of the ANOVA to evaluate the effect of “Participant”,
“Content” and “Compression” on the perceived quality for sonographers.
Factor df F p-value
Participant 8 1.264 0.306
Content 3 14.324 <0.001
Compression 6 68.959 <0.001
Content * Compression 18 3.862 <0.001
Firstly, in both cases, the results showed that there is no statistically significant
difference between participants in scoring video quality (i.e., p>0.05 in both cases).
Note there is, therefore, little need to calibrate the raw scores using z-scores (as
conventionally required for natural image and video quality assessment [100]) due to
the consistency in scoring among individuals. This, in turn, reveals that the quality
perception behaviour is highly consistent within a specialty group.
Second, the results showed that all main effects (i.e., “Content” and “Compression”)
are statistically significant in each case. Not all source videos (i.e., “Content”) have
the same average quality (i.e., p<0.05 in both cases). The post-hoc test revealed the
following order in quality (note that commonly underlined entries are not significantly
different from each other, with the commonly used 5% threshold).
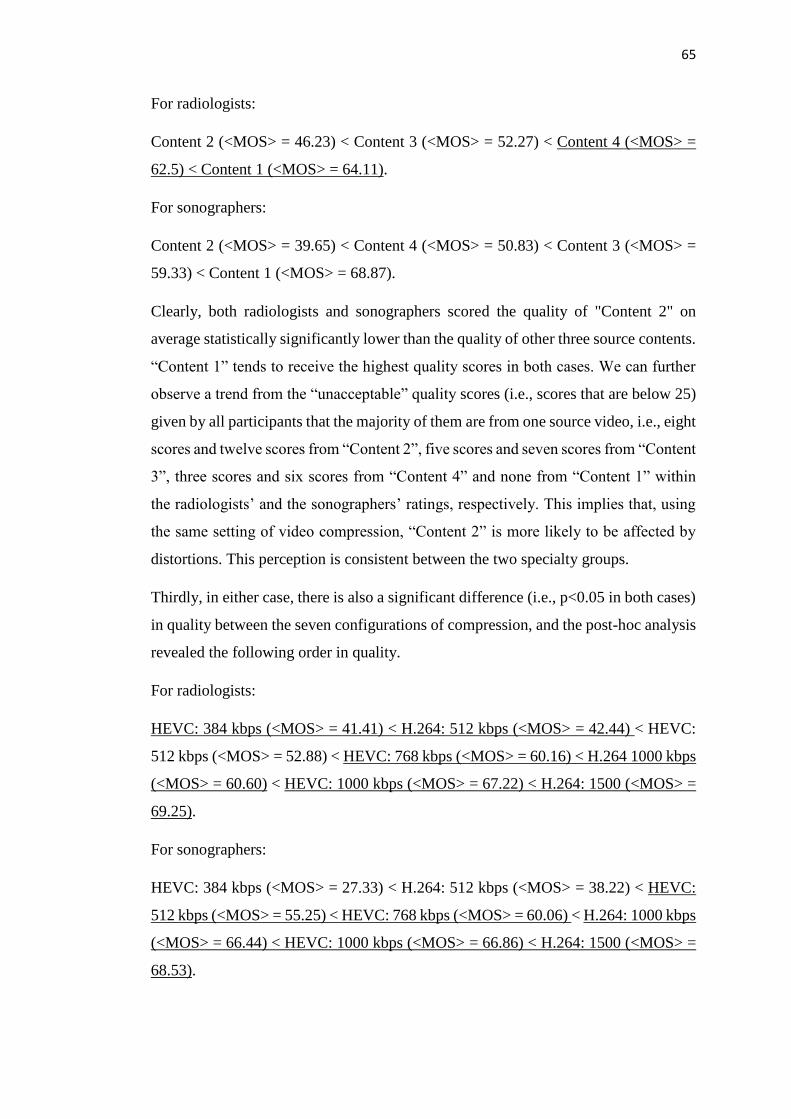
65
For radiologists:
Content 2 (<MOS> = 46.23) < Content 3 (<MOS> = 52.27) < Content 4 (<MOS> =
62.5) < Content 1 (<MOS> = 64.11).
For sonographers:
Content 2 (<MOS> = 39.65) < Content 4 (<MOS> = 50.83) < Content 3 (<MOS> =
59.33) < Content 1 (<MOS> = 68.87).
Clearly, both radiologists and sonographers scored the quality of "Content 2" on
average statistically significantly lower than the quality of other three source contents.
“Content 1” tends to receive the highest quality scores in both cases. We can further
observe a trend from the “unacceptable” quality scores (i.e., scores that are below 25)
given by all participants that the majority of them are from one source video, i.e., eight
scores and twelve scores from “Content 2”, five scores and seven scores from “Content
3”, three scores and six scores from “Content 4” and none from “Content 1” within
the radiologists’ and the sonographers’ ratings, respectively. This implies that, using
the same setting of video compression, “Content 2” is more likely to be affected by
distortions. This perception is consistent between the two specialty groups.
Thirdly, in either case, there is also a significant difference (i.e., p<0.05 in both cases)
in quality between the seven configurations of compression, and the post-hoc analysis
revealed the following order in quality.
For radiologists:
HEVC: 384 kbps (<MOS> = 41.41) < H.264: 512 kbps (<MOS> = 42.44) < HEVC:
512 kbps (<MOS> = 52.88) < HEVC: 768 kbps (<MOS> = 60.16) < H.264 1000 kbps
(<MOS> = 60.60) < HEVC: 1000 kbps (<MOS> = 67.22) < H.264: 1500 (<MOS> =
69.25).
For sonographers:
HEVC: 384 kbps (<MOS> = 27.33) < H.264: 512 kbps (<MOS> = 38.22) < HEVC:
512 kbps (<MOS> = 55.25) < HEVC: 768 kbps (<MOS> = 60.06) < H.264: 1000 kbps
(<MOS> = 66.44) < HEVC: 1000 kbps (<MOS> = 66.86) < H.264: 1500 (<MOS> =
68.53).

66
The rankings of compression configurations (based on their average quality) tend to
be highly consistent between radiologists and sonographers. Again, it is worth noticing
here the difference in quality perception of low-quality videos between the two
specialty groups. For HEVC: 384 kbps, sonographers score the quality on average
much lower (i.e., <MOS> = 27.33) than radiologists (i.e., <MOS> = 41.41); similarly,
for H.264: 512 kbps, sonographers’ score on the quality is on average lower (i.e.,
<MOS> = 38.22) than radiologists (i.e., <MOS> = 42.44). This indicates that
radiologists show more tolerance of high distortions, whereas sonographers are more
sensitive to highly distorted videos. At higher quality, sonographers are in close
agreement with radiologists in terms of the average quality.
Finally, we investigate the impact of H.264 versus HEVC on the perceived quality of
ultrasound videos. Fig. 4.5 and Fig. 4.6 illustrate the impact of the compression
strategy on perceived quality, averaged over all subjects (within a subject group) for
radiologists and sonographers, respectively, and all source videos. For both cases, it
can be seen that for each compression scheme (i.e., either H.264 or HEVC), the
perceived quality monotonously increases with the increase of bit rate. Also, the
following observations can be directly interpreted from these figures. For radiologists,
at low quality, one can conclude that the bit rate of H.264 (i.e., H.264: 512 kbps)
should be 1.3 times as high as the bit rate of HEVC (i.e., HEVC: 384 kbps) to be
perceived as equal quality. At high quality, to achieve the same perceived quality, the
bit rate of H.264 (i.e., H.264: 1500 kbps) should be 1.5 times the bit rate of HEVC
(i.e., HEVC: 1000 kbps). For sonographers, at high quality, to achieve the same
perceived quality, the bit rate of H.264 (i.e., H.264: 1000 or 1500 kbps) should be 1 to
1.5 times the bit rate of HEVC (i.e., 1000 kbps).
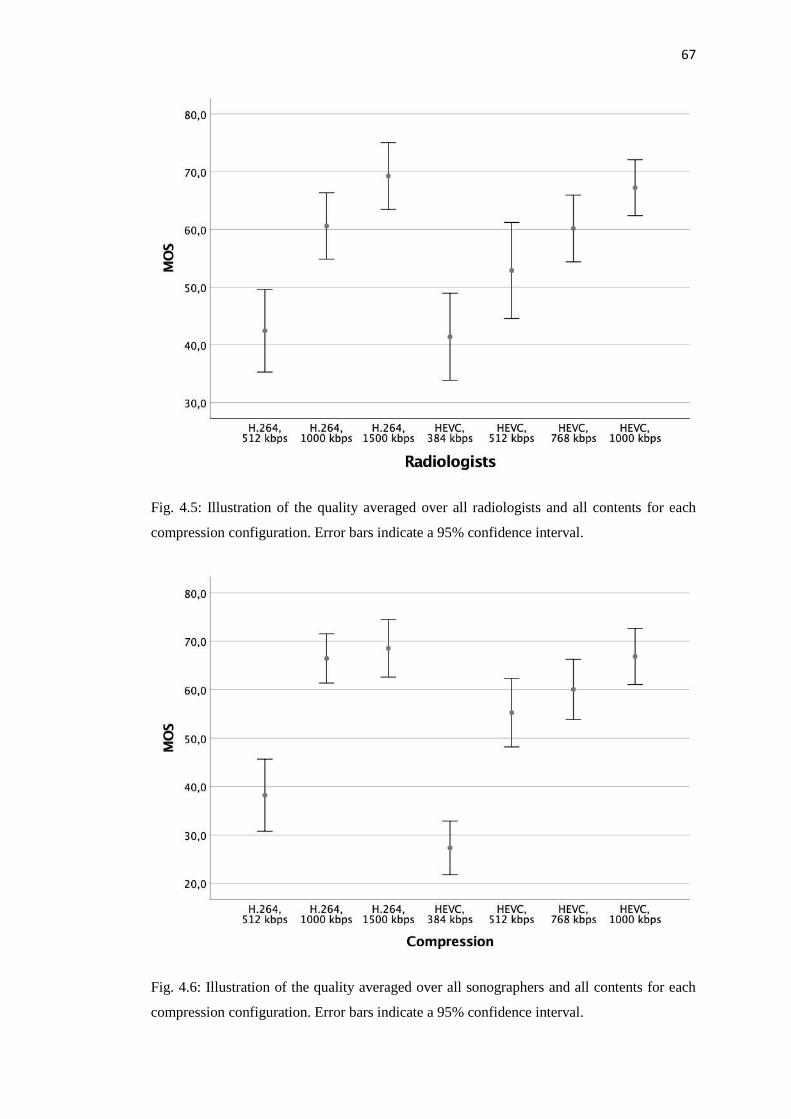
67
Fig. 4.5: Illustration of the quality averaged over all radiologists and all contents for each
compression configuration. Error bars indicate a 95% confidence interval.
Fig. 4.6: Illustration of the quality averaged over all sonographers and all contents for each
compression configuration. Error bars indicate a 95% confidence interval.
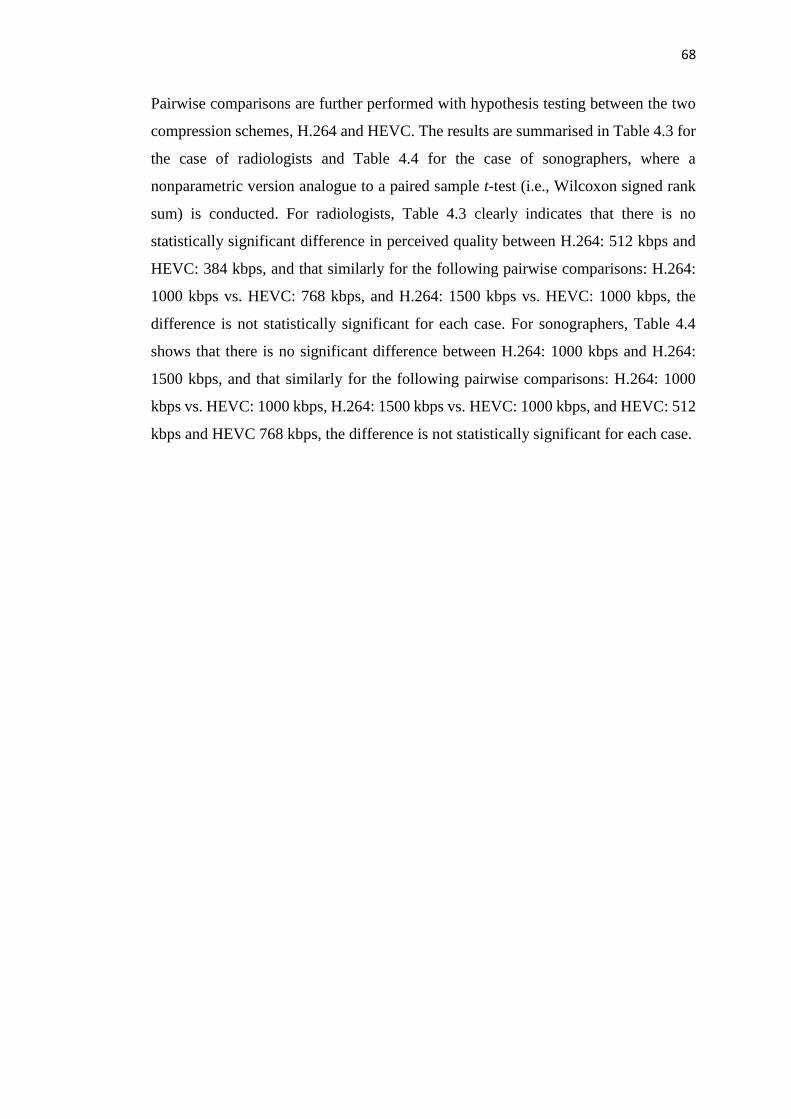
68
Pairwise comparisons are further performed with hypothesis testing between the two
compression schemes, H.264 and HEVC. The results are summarised in Table 4.3 for
the case of radiologists and Table 4.4 for the case of sonographers, where a
nonparametric version analogue to a paired sample t-test (i.e., Wilcoxon signed rank
sum) is conducted. For radiologists, Table 4.3 clearly indicates that there is no
statistically significant difference in perceived quality between H.264: 512 kbps and
HEVC: 384 kbps, and that similarly for the following pairwise comparisons: H.264:
1000 kbps vs. HEVC: 768 kbps, and H.264: 1500 kbps vs. HEVC: 1000 kbps, the
difference is not statistically significant for each case. For sonographers, Table 4.4
shows that there is no significant difference between H.264: 1000 kbps and H.264:
1500 kbps, and that similarly for the following pairwise comparisons: H.264: 1000
kbps vs. HEVC: 1000 kbps, H.264: 1500 kbps vs. HEVC: 1000 kbps, and HEVC: 512
kbps and HEVC 768 kbps, the difference is not statistically significant for each case.

69
Table 4.3: Results of the statistical significance for pairwise comparisons
(radiologists). Each entry in the table represents a code word consisting of one
out of three symbols: “1” means that the configuration for the row is
statistically better than the configuration for the column, “0” means that it is
statistically worse, and “-” means that it is statistically indistinguishable.
H.264,
512
kbps
H.264,
1 Mbps
H.264,
1.5
Mbps
HEVC,
384
kbps
HEVC,
512
kbps
HEVC,
768
kbps
HEVC,
1 Mbps
H.264,
512
kbps
0 0 - 0 0 0
H.264,
1 Mbps 1 0 1 1 - 0
H.264,
1.5
Mbps
1 1 1 1 1 -
HEVC,
384
kbps
- 0 0 0 0 0
HEVC,
512
kbps
1 0 0 1 0 0
HEVC,
768
kbps
1 - 0 1 1 0
HEVC,
1 Mbps 1 1 - 1 1 1
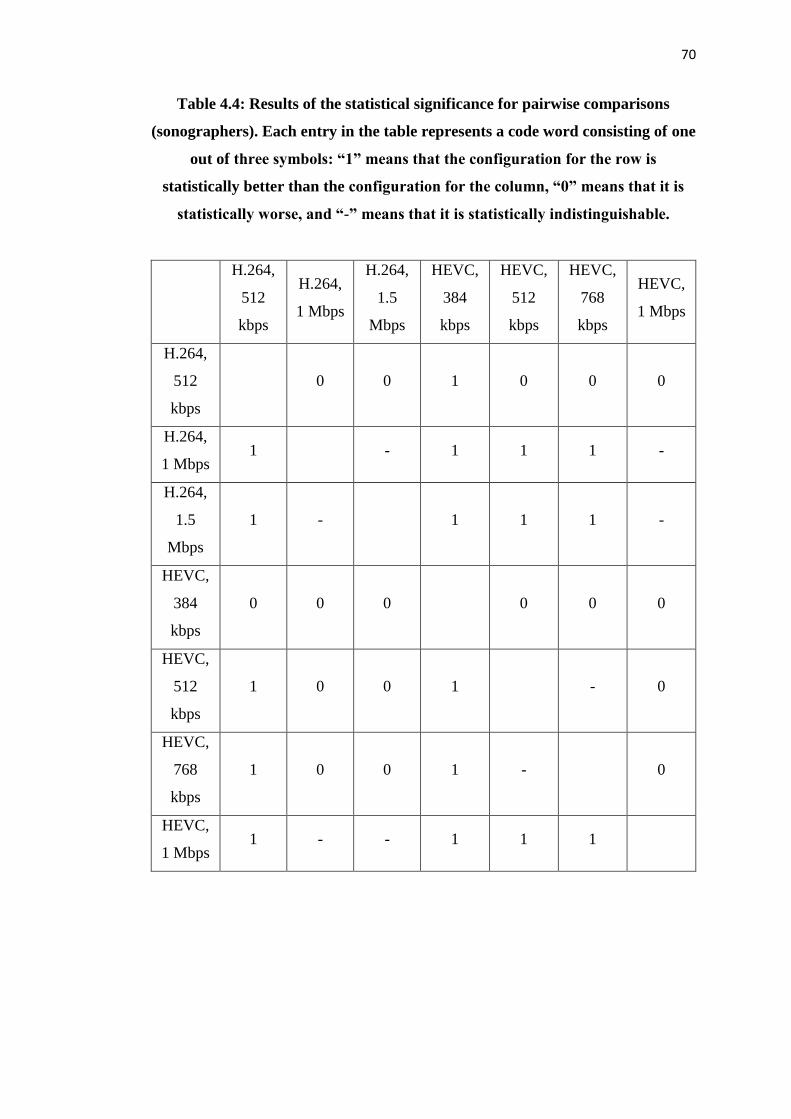
70
Table 4.4: Results of the statistical significance for pairwise comparisons
(sonographers). Each entry in the table represents a code word consisting of one
out of three symbols: “1” means that the configuration for the row is
statistically better than the configuration for the column, “0” means that it is
statistically worse, and “-” means that it is statistically indistinguishable.
H.264,
512
kbps
H.264,
1 Mbps
H.264,
1.5
Mbps
HEVC,
384
kbps
HEVC,
512
kbps
HEVC,
768
kbps
HEVC,
1 Mbps
H.264,
512
kbps
0 0 1 0 0 0
H.264,
1 Mbps 1 - 1 1 1 -
H.264,
1.5
Mbps
1 - 1 1 1 -
HEVC,
384
kbps
0 0 0 0 0 0
HEVC,
512
kbps
1 0 0 1 - 0
HEVC,
768
kbps
1 0 0 1 - 0
HEVC,
1 Mbps 1 - - 1 1 1

71
4.4 Main findings and contributions
In this chapter, we investigated how different medical specialty groups assess the
quality of ultrasound video via a dedicated subjective experiment. We designed and
conducted a perception experiment, where videos of different ultrasound exams
distorted with various compression schemes and ratios were assessed by both
radiologists and sonographers.
For both specialty groups, the impact of visual content and compression configuration
(i.e., video codec and bit rate) on the perceived quality of videos is found to be
significant. Statistical analyses showed that the way the video quality changes with
the content and compression configuration tends to be consistent for radiologists and
sonographers, i.e., the perceived quality monotonically increases with the increase of
the bit rate.
However, the results demonstrated that for the highly compressed (i.e., H.264: 512
kbps and HEVC: 384 kbps) stimuli, sonographers are more bothered by the distortions
than the radiologists; and that for the moderately compressed (i.e., H.264: 1000, and
1500 kbps and HEVC: 512, 768, and 100 kbps) stimuli, radiologists and sonographers
behave similarly in terms of their quality of visual experience.
Finally, the impact of the compression scheme (i.e., H.264 vs. HEVC) was analysed.
The results showed that, for radiologists, the bit rate of H.264 for highly compressed
videos should be 1.3 times the bit rate of HEVC to be perceived similarly, whereas it
should be 1.5 times the bit rate of HEVC for lower compression. For sonographers,
the bit rate of H.264 should be 1 to 1.5 times the bit rate of HEVC to achieve the same
perceived quality at high quality.

72
73
Chapter 5:
Study of visual attention
in screening mammography
5.1 Introduction
In Chapters 3 and 4, we studied how medical professionals perceive the quality of
medical visual content, as well as the impact of the specialty settings on the quality of
experience. Another essential component of the human visual system (HVS) is visual
attention, which refers to the process that enables to efficiently select the most relevant
information from a visual scene [14].
Understanding visual attention is primordial in medical imaging, as healthcare
professionals look at specific areas in images in order to render a diagnosis. Three
different types of erroneous decisions in radiology are described in the literature:
search errors, recognition errors and decision-making errors [5], [63], [102].
Perceptual errors, or errors made during the detection and recognition phases, are more
frequent than interpretative errors in radiology [103]. These findings were confirmed
for the mammography specialty by Nodine et al. [104] in a study involving missed
lesions on twenty breast cancer cases.
Screening mammography has been widely used over the last few decades to detect
early breast cancer by use of low-dose X-ray imaging. Indeed, being able to detect
early breast lesions is highly beneficial for patients as it increases the likelihood of
cancer being successfully treated and increases the chance of recovery.
Mammography is therefore a useful but highly challenging modality in medical
imaging [105]. Breast cancer is the most common type of cancer in Europe and there
are twice as many new breast cancer cases annually than new cancer cases in any other
site [106]. It is an important mortality cause for women over fifty years old.
Eye-tracking technology can play an important role in understanding why lesions are
missed in radiology for instance, by unravelling the visual search process. In a typical
eye-tracking study, radiologists are asked to view images and report abnormalities as

74
they normally do in clinical practice while their eye positions and eye movements are
recorded using an eye-tracking system. A variety of eye-tracking studies have been
undertaken in the area of mammography. These studies present different concepts of
experimental design; some studies are conducted with films, some with digitised films,
and some with fully digital mammograms; images are obtained from public screening
databases or from specifically selected cases; and stimuli are displayed on laptops or
monitors for viewing. In the literature, Kundel et al. [59] gathered eye-tracking data
from three different public databases, including a total of 400 eye movement records
from experienced mammographers, mammography fellows, and radiology residents
viewing mammograms with and without lesions. Their main finding was that 67% of
cancer locations were fixated within the first second of viewing; and they suggested
that the observers should use a global approach when searching for cancer in
mammograms. Studies in the literature are often limited in terms of stimuli or number
of participants. Furthermore, little work has been done to compare different views of
mammograms used in routine practice.
In this chapter, we want to study how attention is allocated between different
mammogram views to better understand how radiologists perceive and interpret
mammograms, and use such understanding to improve clinical practice in screening
mammography.
5.2 Eye-tracking experiment
5.2.1 Stimuli
In practice, mammograms are usually captured from several views in order to yield a
better diagnosis. Two widely used views are the cranio-caudal (CC) and the medio-
lateral oblique (MLO) views. For each breast, a CC view is taken horizontally (i.e.,
with a 0-degree angle), whereas a MLO view is taken diagonally (i.e., with a 45-degree
angle). The MLO views thus display a broader portion of breast tissue.
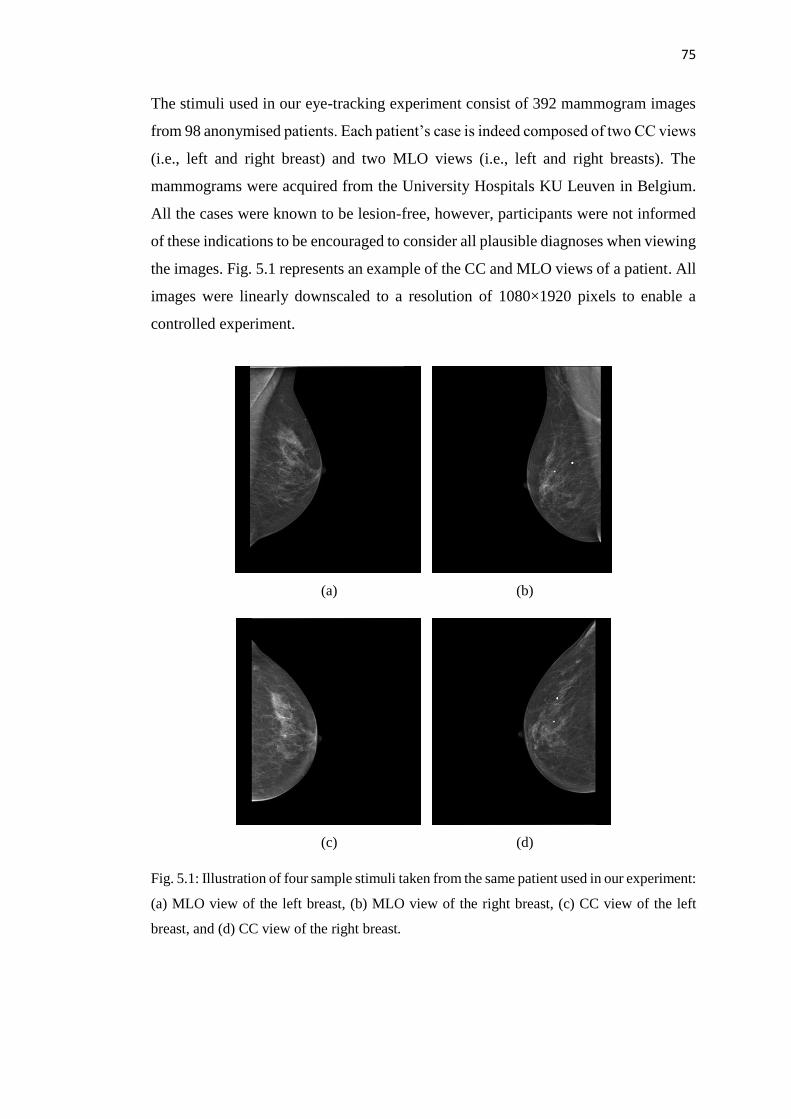
75
The stimuli used in our eye-tracking experiment consist of 392 mammogram images
from 98 anonymised patients. Each patient’s case is indeed composed of two CC views
(i.e., left and right breast) and two MLO views (i.e., left and right breasts). The
mammograms were acquired from the University Hospitals KU Leuven in Belgium.
All the cases were known to be lesion-free, however, participants were not informed
of these indications to be encouraged to consider all plausible diagnoses when viewing
the images. Fig. 5.1 represents an example of the CC and MLO views of a patient. All
images were linearly downscaled to a resolution of 1080×1920 pixels to enable a
controlled experiment.
(a) (b)
(c) (d)
Fig. 5.1: Illustration of four sample stimuli taken from the same patient used in our experiment:
(a) MLO view of the left breast, (b) MLO view of the right breast, (c) CC view of the left
breast, and (d) CC view of the right breast.

76
5.2.2 Experimental procedure
In routine practice, radiologists analyse both views (i.e., MLO and CC) of a breast at
the same time to make diagnostic decisions. This configuration was simulated in our
experiment, where the MLO and CC views of the left breast were presented first to the
radiologists for eight seconds, followed by the MLO and CC views of the right breast
for the same amount of time. After viewing the four views of a case, the radiologists
had to answer the question “refer or not refer” by focusing on one of these options on
the screen. This question was defined in accordance with the practice of routine
screening mammography, where radiologists decide if they report the image as
suspicious of containing abnormalities. The test configuration is illustrated in Fig. 5.2.
(a) (b)
(c)
Fig. 5.2: Illustration of the experimental procedure: (a) MLO and CC views of the left breast,
(b) MLO and CC views of the right breast, and (c) question asked to the radiologists after
viewing (a) and (b).
The images were displayed on a 19-inch LCD monitor screen calibrated to the DICOM
Greyscale Standard Display Function (GSDF) [99]-[101]. The eye-tracking
experiment was carried out in a mammography reading room, i.e., in a controlled
viewing environment. The distance between the observer and the monitor was
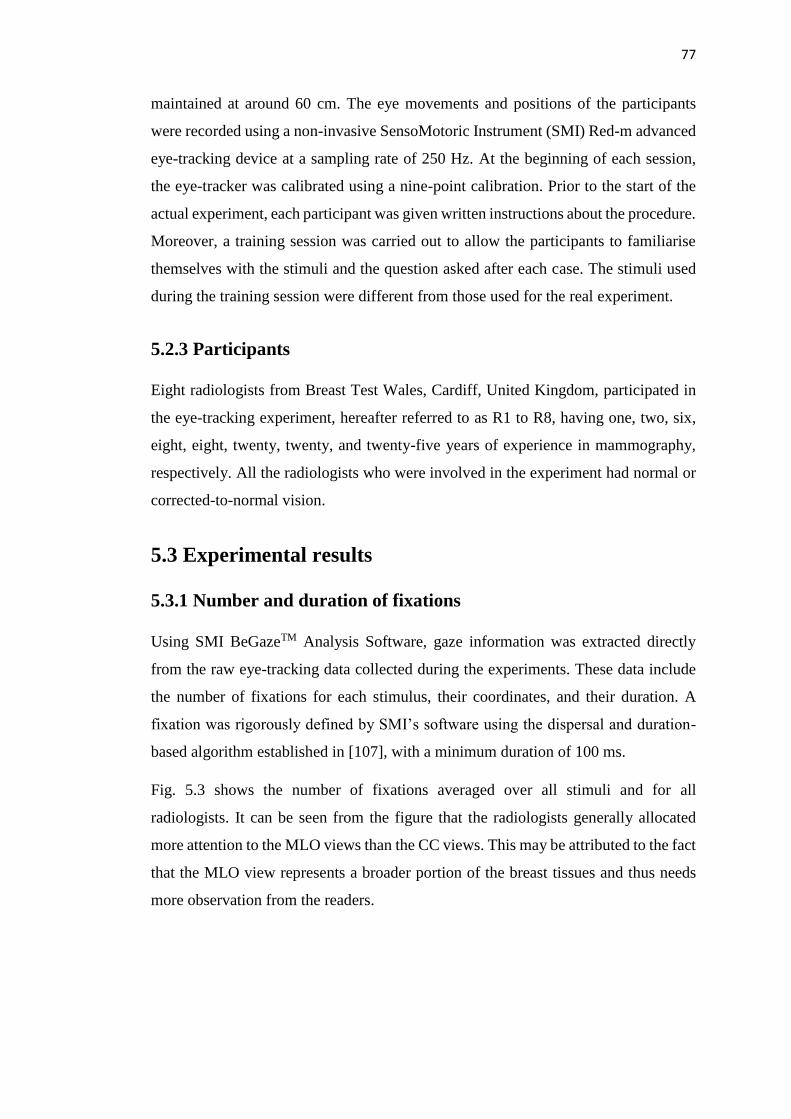
77
maintained at around 60 cm. The eye movements and positions of the participants
were recorded using a non-invasive SensoMotoric Instrument (SMI) Red-m advanced
eye-tracking device at a sampling rate of 250 Hz. At the beginning of each session,
the eye-tracker was calibrated using a nine-point calibration. Prior to the start of the
actual experiment, each participant was given written instructions about the procedure.
Moreover, a training session was carried out to allow the participants to familiarise
themselves with the stimuli and the question asked after each case. The stimuli used
during the training session were different from those used for the real experiment.
5.2.3 Participants
Eight radiologists from Breast Test Wales, Cardiff, United Kingdom, participated in
the eye-tracking experiment, hereafter referred to as R1 to R8, having one, two, six,
eight, eight, twenty, twenty, and twenty-five years of experience in mammography,
respectively. All the radiologists who were involved in the experiment had normal or
corrected-to-normal vision.
5.3 Experimental results
5.3.1 Number and duration of fixations
Using SMI BeGazeTM Analysis Software, gaze information was extracted directly
from the raw eye-tracking data collected during the experiments. These data include
the number of fixations for each stimulus, their coordinates, and their duration. A
fixation was rigorously defined by SMI’s software using the dispersal and duration-
based algorithm established in [107], with a minimum duration of 100 ms.
Fig. 5.3 shows the number of fixations averaged over all stimuli and for all
radiologists. It can be seen from the figure that the radiologists generally allocated
more attention to the MLO views than the CC views. This may be attributed to the fact
that the MLO view represents a broader portion of the breast tissues and thus needs
more observation from the readers.

78
Fig. 5.3: Illustration of the number of fixations averaged over all stimuli, left and right breasts,
and all participants for each view (i.e., MLO and CC). Error bars indicate a 95% confidence
interval.
Similarly, Fig. 5.4 represents the average number of fixations for the CC views of right
and left breasts and MLO views of right and left breasts. Table 5.1 gives the results of
the ANOVA conducted to analyse the impact of the view (i.e., MLO and CC), and the
impact of the breast (i.e., left or right) on the number of fixations. The results show
that there is a significant difference between the CC and MLO views (i.e., p-
value<0.05), but there is no statistically significant difference between the left and
right breasts (i.e., p-value>0.05).
Table 5.1: Results of the ANOVA to evaluate the effect of “View” and “Breast”
on the number of fixations.
Factor df F p-value
View 1 935.92 <0.001
Breast 1 0.719 0.397
View * Breast 1 1.878 <0.001

79
Fig. 5.4: Illustration of the number of fixations averaged over all stimuli and all participants
for left breast CC view, right breast CC view, left breast MLO view, and right breast MLO
view. Error bars indicate a 95% confidence interval.
Nonetheless, the number of fixations analysed previously does not give any
information about the dwell time: a subject could spend many short fixations on an
image or, on the contrary, only a few but long fixations on this image.
Fig. 5.5 shows the mean duration of fixations recorded over all stimuli and all
radiologists for CC and MLO views. The mean duration of fixations µi for a radiologist
i is defined as follows:
µi =1
n∑𝑥𝑗
𝑛
𝑗=1
where n is the total number of fixations and xj is the duration of the fixation j.
80
The average duration of fixations over all the eight radiologists is defined as follows:
µ =1
8∑µi
8
𝑖=1
with µi as previously described for a radiologist i.
Fig. 5.5: Illustration of the duration of fixations averaged over all stimuli, and all participants
for each view (i.e., MLO and CC). Error bars indicate a 95% confidence interval.
Fig. 5.6 illustrates the mean duration of fixations recorded over all stimuli and all
radiologists for the CC views of left and right breasts and for the MLO views of left
and right breasts.

81
Fig. 5.6: Illustration of the duration of fixations averaged over all stimuli, and all participants
for left breast CC view, right breast CC view, left breast MLO view, and right breast MLO
view. Error bars indicate a 95% confidence interval.
It can be clearly seen from the Fig. 5.5 and Fig. 5.6 that the MLO attracted longer
dwell times from readers than the CC views. This tendency is further analysed with an
ANOVA, and results are presented in Table 5.2. Similar to the conclusions obtained
for the number of fixations, there is a statistically significant difference between the
MLO view and the CC view (i.e., p-value<0.05), but there is no significant difference
between the left breast and the right breast (i.e., p-value>0.05).
Table 5.2: Results of the ANOVA to evaluate the effect of “View” and “Breast”
on the duration of fixations.
Factor df F p-value
View 1 3488.21 <0.001
Breast 1 3.61 0.057
View * Breast 1 14.822 <0.001
82
5.3.2 Fixation deployment
In the area of computer vision, researchers focus on the deployment of fixation
locations, and aim to automatically predict where people look in images. To do this,
eye-tracking data is often used to generate a so-called saliency map, i.e., a topographic
representation indicating conspicuousness of scene locations [108]. Therefore, in a
given saliency map, the salient regions (i.e., regions with higher density of fixations)
represent where human observers focus their gaze with a higher frequency.
A saliency map is thus created using the fixations obtained from eye-tracking
experiments, with each fixation location giving rise to a greyscale patch simulating
the foveal vision of the human visual system. The activity of the patch is modelled as
a Gaussian distribution. We use the full width at half maximum (FWHM) of a
Gaussian to approximates the size of the fovea (i.e., two degrees of visual angle) [109].
Note alternative approximation methods or choice of visual angle may be used; this
may affect the local intensity of salient regions in a saliency map but does not
significantly alter the global distribution of these salient regions. Investigating the
impact of the simulation of the fovea (e.g. using different parameters of a Gaussian or
difference choices of visual angle) on the comparison (either subjective or objective)
of saliency maps is outside the scope of this thesis. A saliency map over all fixations
of all subjects can be calculated as follows:
𝑆𝑀𝑖(𝑘, 𝑙) =∑exp(−
𝑇
𝑗=1
(xj − 𝑘)2+ (𝑦𝑗 − 𝑙)
2
σ2)
where SMi(k, l) indicates the saliency map for the stimulus Ii; (xj, yj) indicates the
spatial coordinates of the jth.tn fixation (j = 1…T); T is the total number of all fixations
over all subjects; and 𝜎 indicates the standard deviation of the Gaussian, and is
determined when the FWHM is equal to the projection of two degrees of visual angle
on the screen [110].
Fig. 5.7 represents the saliency maps created from our eye-tracking data for two patient
cases. From the saliency maps, we can see how the attention is allocated between the
MLO views (on the left), and the CC views (on the right). In general, the MLO views
attracted more attention from the readers as the left images contain more white areas
(the brighter the regions, the higher the saliency).

83
(a)
(b)
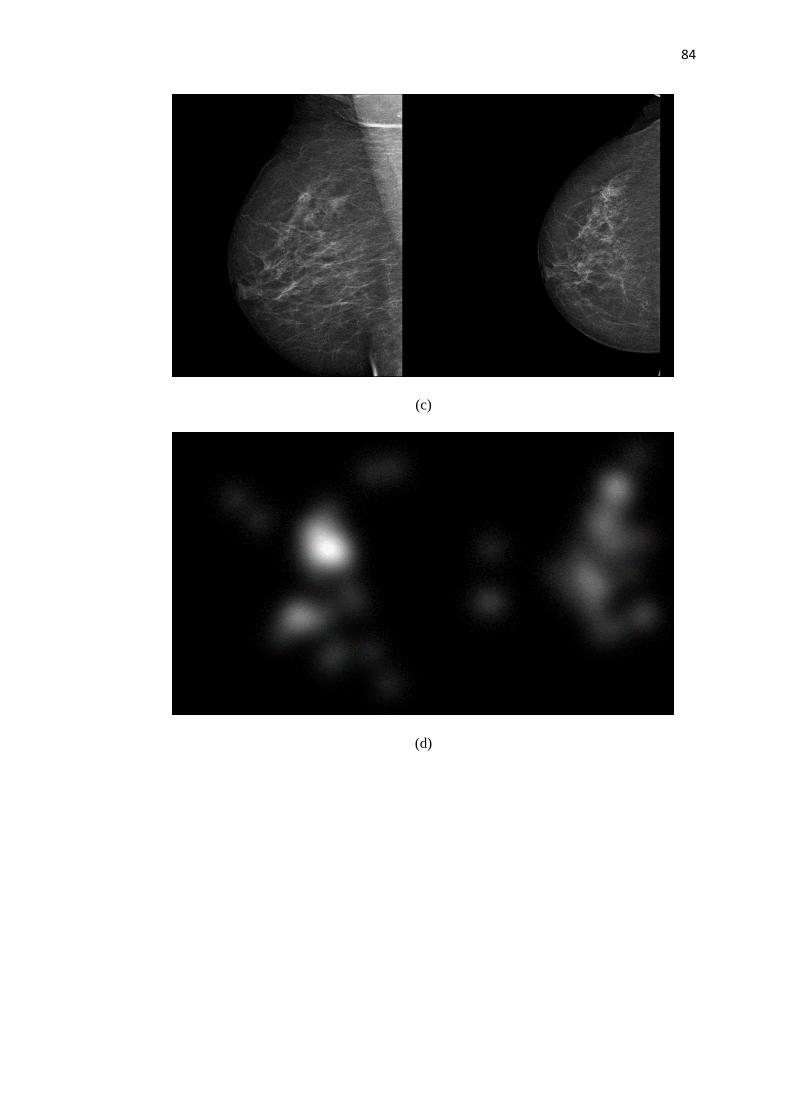
84
(c)
(d)
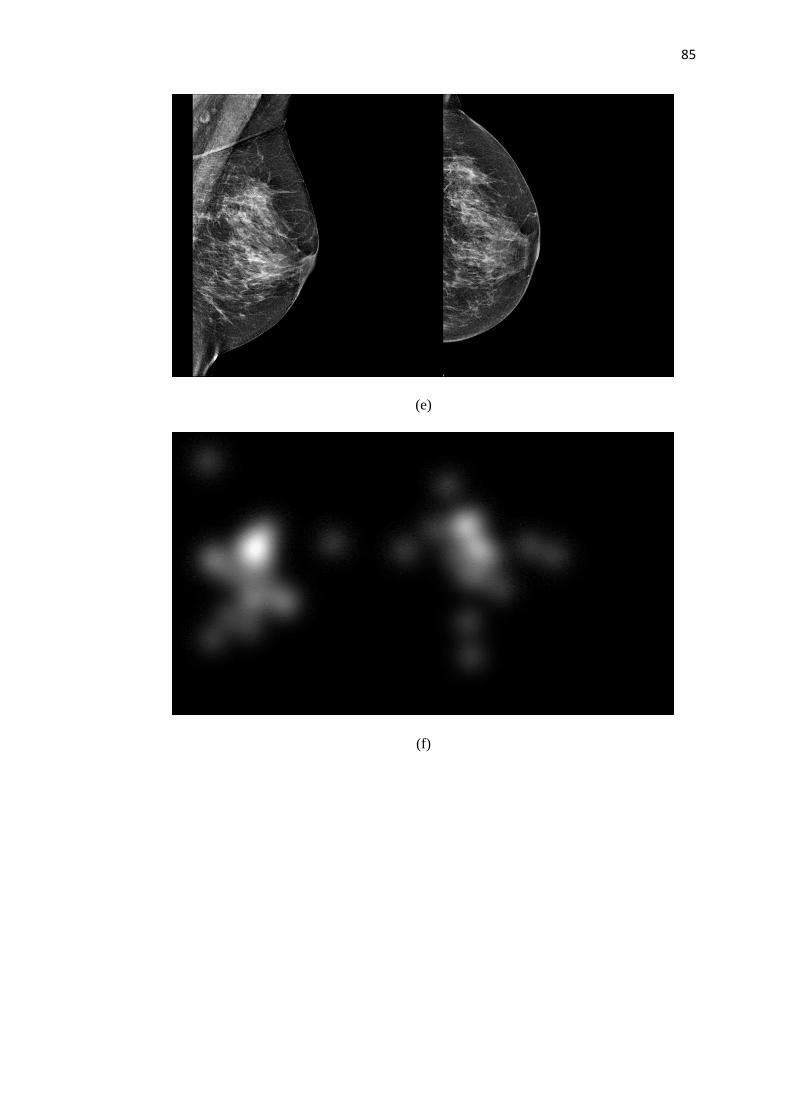
85
(e)
(f)

86
(g)
(h)
Fig. 5.7: Illustration of the saliency maps constructed for two patient cases: (a) patient 1, MLO
and CC views of the left breast, (c) patient 1, MLO and CC views of the right breast, (e) patient
2, MLO and CC views of the left breast, (g) patient 2, MLO and CC views of the right breast;
(b), (d), (f), and (h) are the saliency maps of (a), (c), (e), and (g), respectively.
87
5.3.4 Computational saliency
Eye-tracking is useful, but it can be cumbersome and impractical in many
circumstances. A more realistic way to integrate gaze information into imaging
systems is to use computational saliency. Saliency models, which aim to predict visual
saliency of images, are available in the literature [111]. These models were developed
for different applications, e.g., object detection; however, very little is known about
whether these models are directly applicable to medical imaging and, more
specifically, to screening mammography. To investigate above issue, an evaluation
was carried out using three state-of-the-art saliency models, namely Graph Based
Visual Saliency model (GBVS) [112], Itti [113], and RARE2012 [114]. The GBVS
model is a bottom-up visual saliency model composed of two steps including the
formation of activation maps and their normalisation to highlight conspicuity. Itti’s
model was inspired by the neuronal architecture of the primate visual system. Attended
locations are selected by a neural network. Finally, RARE2012 selects information
based on a multi-scale spatial rarity. Fig. 5.8 shows the computational saliency maps
generated by these three widely used saliency models for two sample stimuli contained
in our dataset. It can be seen from the figure that the saliency models do not precisely
match with the ground truth (i.e., the “human attention”).

88
(a)
(b)
(c)
(d)
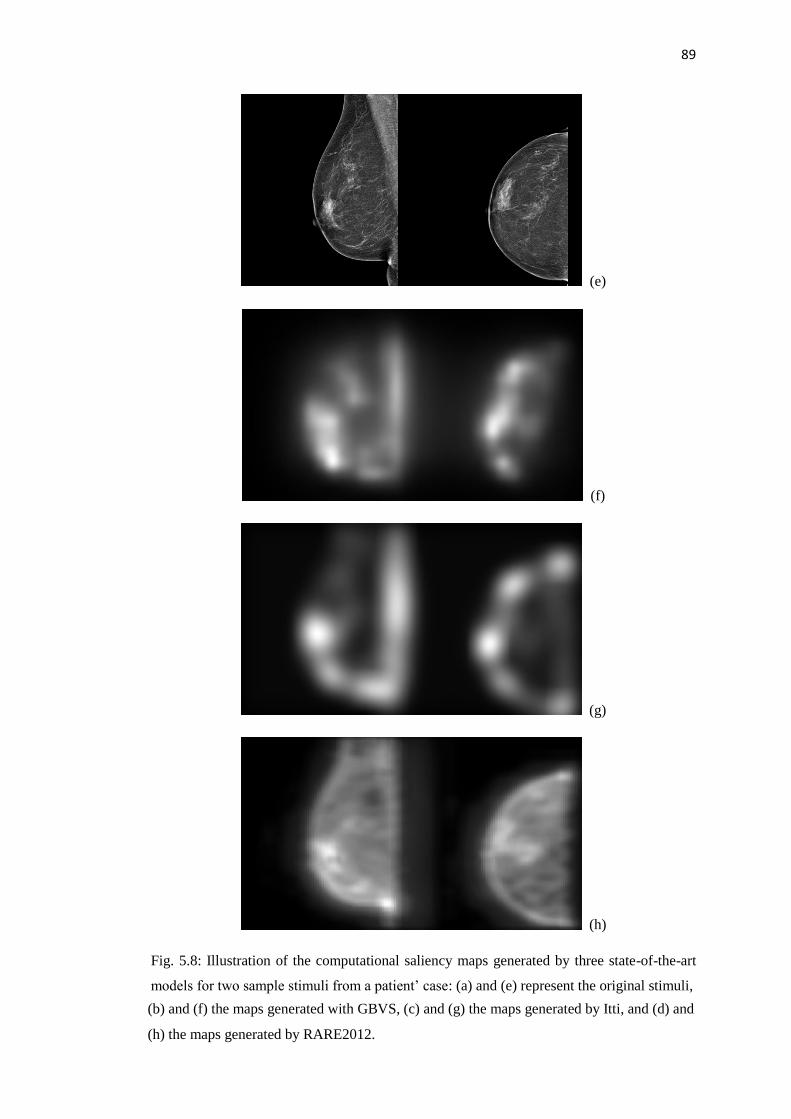
89
(e)
(f)
(g)
(h)
Fig. 5.8: Illustration of the computational saliency maps generated by three state-of-the-art
models for two sample stimuli from a patient’ case: (a) and (e) represent the original stimuli,
(b) and (f) the maps generated with GBVS, (c) and (g) the maps generated by Itti, and (d) and
(h) the maps generated by RARE2012.
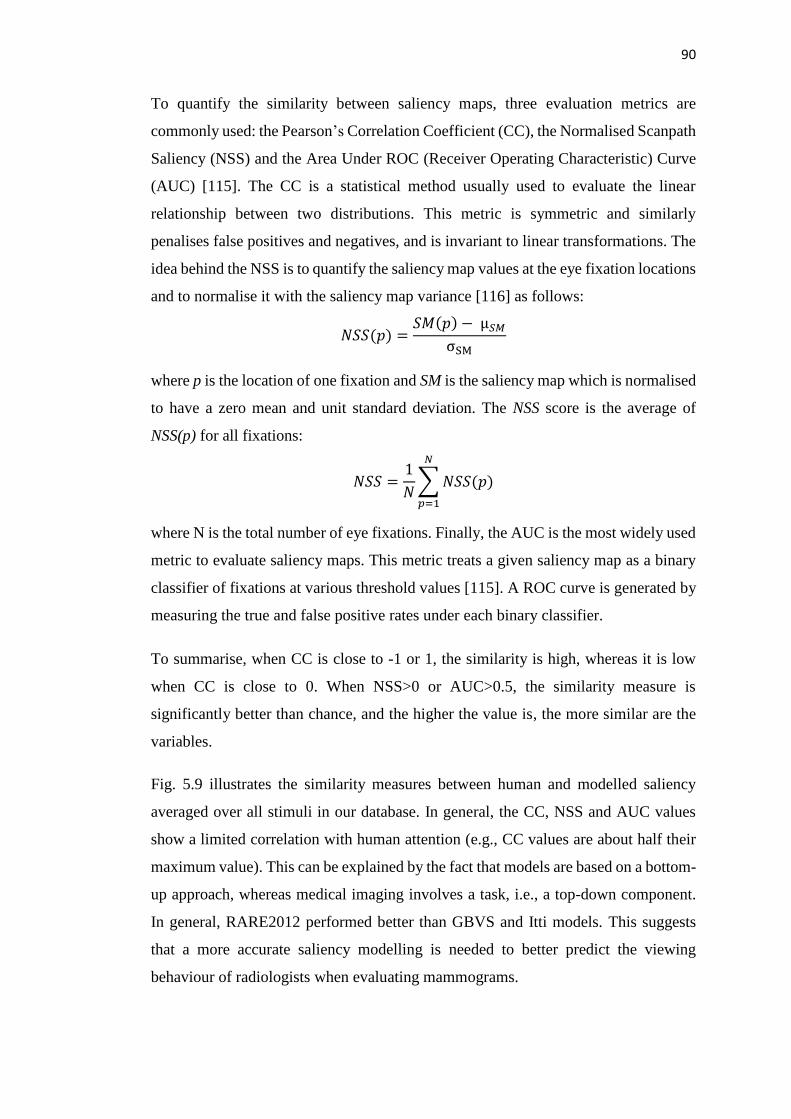
90
To quantify the similarity between saliency maps, three evaluation metrics are
commonly used: the Pearson’s Correlation Coefficient (CC), the Normalised Scanpath
Saliency (NSS) and the Area Under ROC (Receiver Operating Characteristic) Curve
(AUC) [115]. The CC is a statistical method usually used to evaluate the linear
relationship between two distributions. This metric is symmetric and similarly
penalises false positives and negatives, and is invariant to linear transformations. The
idea behind the NSS is to quantify the saliency map values at the eye fixation locations
and to normalise it with the saliency map variance [116] as follows:
𝑁𝑆𝑆(𝑝) =𝑆𝑀(𝑝) −µ𝑆𝑀
σSM
where p is the location of one fixation and SM is the saliency map which is normalised
to have a zero mean and unit standard deviation. The NSS score is the average of
NSS(p) for all fixations:
𝑁𝑆𝑆 =1
𝑁∑𝑁𝑆𝑆(𝑝)
𝑁
𝑝=1
where N is the total number of eye fixations. Finally, the AUC is the most widely used
metric to evaluate saliency maps. This metric treats a given saliency map as a binary
classifier of fixations at various threshold values [115]. A ROC curve is generated by
measuring the true and false positive rates under each binary classifier.
To summarise, when CC is close to -1 or 1, the similarity is high, whereas it is low
when CC is close to 0. When NSS>0 or AUC>0.5, the similarity measure is
significantly better than chance, and the higher the value is, the more similar are the
variables.
Fig. 5.9 illustrates the similarity measures between human and modelled saliency
averaged over all stimuli in our database. In general, the CC, NSS and AUC values
show a limited correlation with human attention (e.g., CC values are about half their
maximum value). This can be explained by the fact that models are based on a bottom-
up approach, whereas medical imaging involves a task, i.e., a top-down component.
In general, RARE2012 performed better than GBVS and Itti models. This suggests
that a more accurate saliency modelling is needed to better predict the viewing
behaviour of radiologists when evaluating mammograms.
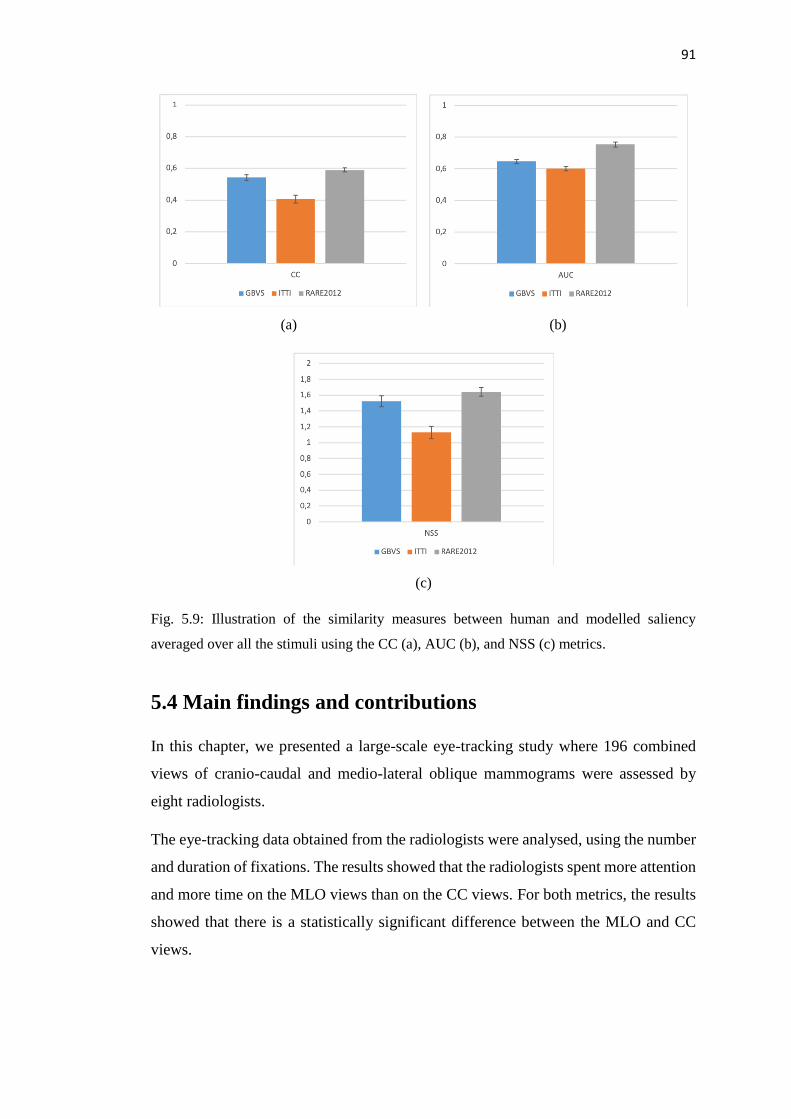
91
(a) (b)
(c)
Fig. 5.9: Illustration of the similarity measures between human and modelled saliency
averaged over all the stimuli using the CC (a), AUC (b), and NSS (c) metrics.
5.4 Main findings and contributions
In this chapter, we presented a large-scale eye-tracking study where 196 combined
views of cranio-caudal and medio-lateral oblique mammograms were assessed by
eight radiologists.
The eye-tracking data obtained from the radiologists were analysed, using the number
and duration of fixations. The results showed that the radiologists spent more attention
and more time on the MLO views than on the CC views. For both metrics, the results
showed that there is a statistically significant difference between the MLO and CC
views.

92
We also analysed the fixation deployment for the MLO and CC views when displayed
simultaneously. Radiologists’ gaze data were compared with three state-of-the-art
models of visual attention. Similarity measures (i.e, Pearson correlation coefficient,
normalised scanpath saliency, and area under ROC curve) showed the poor correlation
between these models’ predictions and the human attention, and we thus demonstrated
the need for improvement of computational attention models to reliably predict
radiologists’ gaze behaviour.
93
Chapter 6:
Impact of the medical specialty and experience
on image readers gaze behaviour
6.1 Introduction
As demonstrated in Chapter 5, eye-tracking technology can be used to study the gaze
patterns of medical experts while reading radiological content. In the literature review
given in Chapter 2, it has also been shown that eye movements could be used to
distinguish medical experts and novices. In practice, a broad community of readers is
involved in medical image analysis as readers have diverse specialised training or
experience. For example, radiologists are specialised in the interpretation of clinical
imaging and focus on lesion research and recognition. Medical physicists apply
physics to provide clinical services in diagnosis, managing the technological
components of radiology. Therefore, both radiologists and physicists deal with
mammograms in their practice, but for different purposes.
In this chapter, we perform statistical analysis to investigate whether and how the
medical specialty practice and the degree of experience affect the gaze behaviour
through an eye-tracking experiment with a large number of mammogram images.
6.2 Eye-tracking experiment
6.2.1 Stimuli
As mentioned in Chapter 5, screening mammography usually involves capturing two
views: one from above the breast, the cranio-caudal (CC) view, and one from an
angled view, the medio-lateral oblique (MLO) view. As the MLO view is taken using
a lateral projection, most of the breast tissues can be imaged and thus a more reliable
diagnosis can be rendered. Furthermore, we demonstrated in Chapter 5 that readers
spent more effort on analysing the MLO images. For that reason, we focus on MLO
views in this chapter.
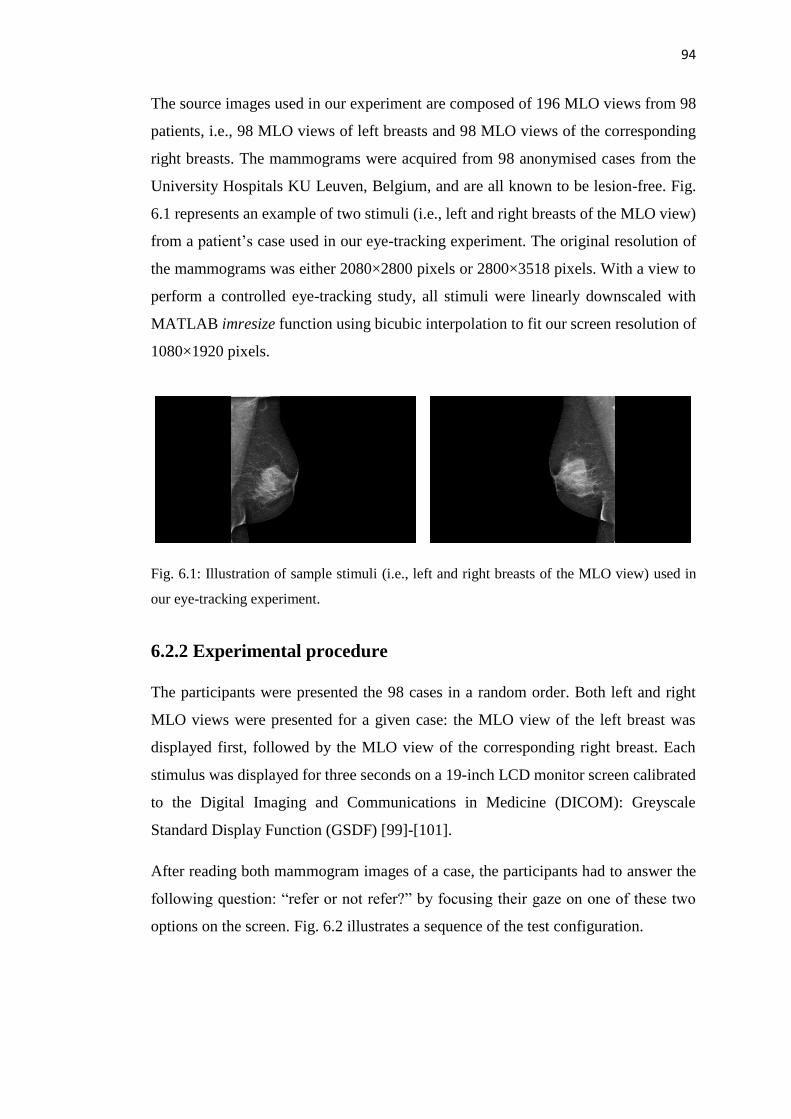
94
The source images used in our experiment are composed of 196 MLO views from 98
patients, i.e., 98 MLO views of left breasts and 98 MLO views of the corresponding
right breasts. The mammograms were acquired from 98 anonymised cases from the
University Hospitals KU Leuven, Belgium, and are all known to be lesion-free. Fig.
6.1 represents an example of two stimuli (i.e., left and right breasts of the MLO view)
from a patient’s case used in our eye-tracking experiment. The original resolution of
the mammograms was either 2080×2800 pixels or 2800×3518 pixels. With a view to
perform a controlled eye-tracking study, all stimuli were linearly downscaled with
MATLAB imresize function using bicubic interpolation to fit our screen resolution of
1080×1920 pixels.
Fig. 6.1: Illustration of sample stimuli (i.e., left and right breasts of the MLO view) used in
our eye-tracking experiment.
6.2.2 Experimental procedure
The participants were presented the 98 cases in a random order. Both left and right
MLO views were presented for a given case: the MLO view of the left breast was
displayed first, followed by the MLO view of the corresponding right breast. Each
stimulus was displayed for three seconds on a 19-inch LCD monitor screen calibrated
to the Digital Imaging and Communications in Medicine (DICOM): Greyscale
Standard Display Function (GSDF) [99]-[101].
After reading both mammogram images of a case, the participants had to answer the
following question: “refer or not refer?” by focusing their gaze on one of these two
options on the screen. Fig. 6.2 illustrates a sequence of the test configuration.
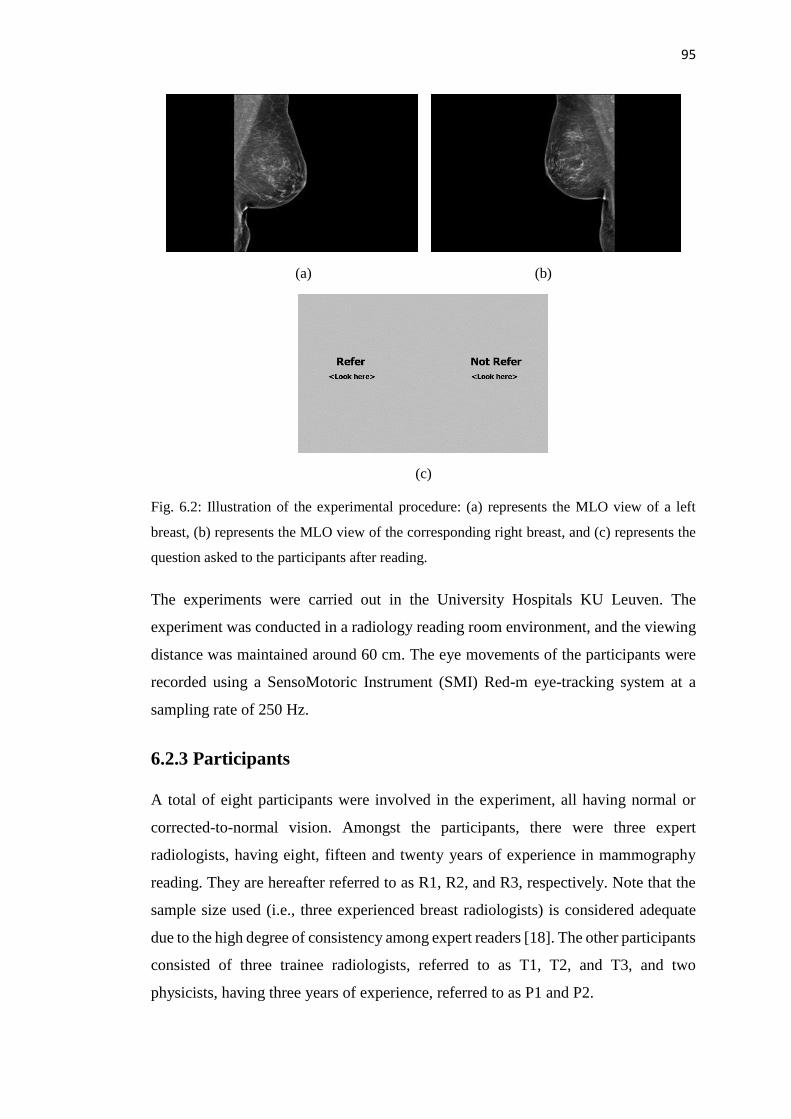
95
(a) (b)
(c)
Fig. 6.2: Illustration of the experimental procedure: (a) represents the MLO view of a left
breast, (b) represents the MLO view of the corresponding right breast, and (c) represents the
question asked to the participants after reading.
The experiments were carried out in the University Hospitals KU Leuven. The
experiment was conducted in a radiology reading room environment, and the viewing
distance was maintained around 60 cm. The eye movements of the participants were
recorded using a SensoMotoric Instrument (SMI) Red-m eye-tracking system at a
sampling rate of 250 Hz.
6.2.3 Participants
A total of eight participants were involved in the experiment, all having normal or
corrected-to-normal vision. Amongst the participants, there were three expert
radiologists, having eight, fifteen and twenty years of experience in mammography
reading. They are hereafter referred to as R1, R2, and R3, respectively. Note that the
sample size used (i.e., three experienced breast radiologists) is considered adequate
due to the high degree of consistency among expert readers [18]. The other participants
consisted of three trainee radiologists, referred to as T1, T2, and T3, and two
physicists, having three years of experience, referred to as P1 and P2.
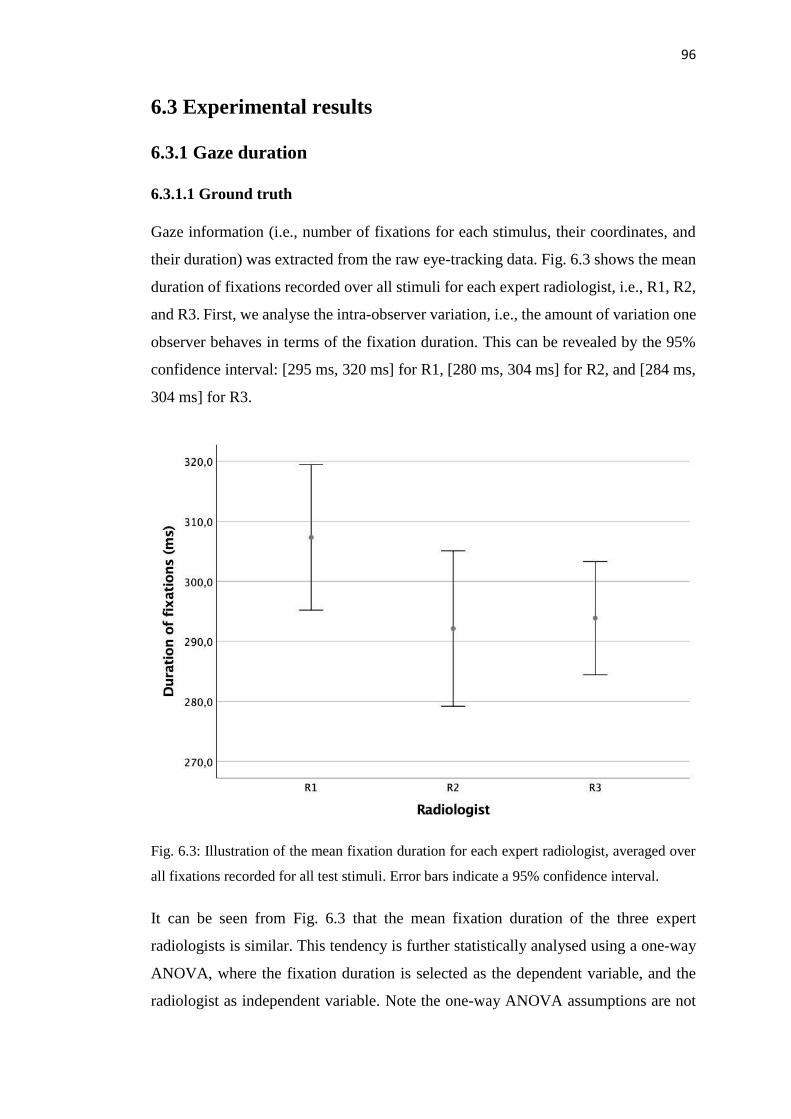
96
6.3 Experimental results
6.3.1 Gaze duration
6.3.1.1 Ground truth
Gaze information (i.e., number of fixations for each stimulus, their coordinates, and
their duration) was extracted from the raw eye-tracking data. Fig. 6.3 shows the mean
duration of fixations recorded over all stimuli for each expert radiologist, i.e., R1, R2,
and R3. First, we analyse the intra-observer variation, i.e., the amount of variation one
observer behaves in terms of the fixation duration. This can be revealed by the 95%
confidence interval: [295 ms, 320 ms] for R1, [280 ms, 304 ms] for R2, and [284 ms,
304 ms] for R3.
Fig. 6.3: Illustration of the mean fixation duration for each expert radiologist, averaged over
all fixations recorded for all test stimuli. Error bars indicate a 95% confidence interval.
It can be seen from Fig. 6.3 that the mean fixation duration of the three expert
radiologists is similar. This tendency is further statistically analysed using a one-way
ANOVA, where the fixation duration is selected as the dependent variable, and the
radiologist as independent variable. Note the one-way ANOVA assumptions are not
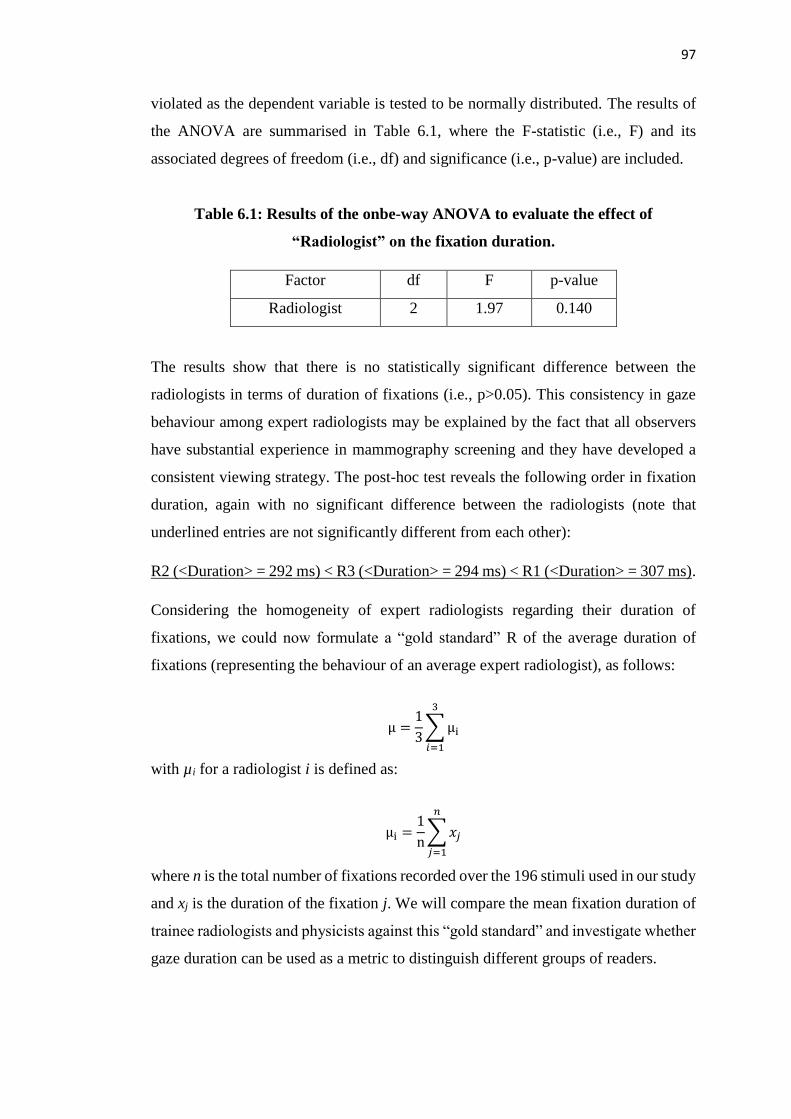
97
violated as the dependent variable is tested to be normally distributed. The results of
the ANOVA are summarised in Table 6.1, where the F-statistic (i.e., F) and its
associated degrees of freedom (i.e., df) and significance (i.e., p-value) are included.
Table 6.1: Results of the onbe-way ANOVA to evaluate the effect of
“Radiologist” on the fixation duration.
Factor df F p-value
Radiologist 2 1.97 0.140
The results show that there is no statistically significant difference between the
radiologists in terms of duration of fixations (i.e., p>0.05). This consistency in gaze
behaviour among expert radiologists may be explained by the fact that all observers
have substantial experience in mammography screening and they have developed a
consistent viewing strategy. The post-hoc test reveals the following order in fixation
duration, again with no significant difference between the radiologists (note that
underlined entries are not significantly different from each other):
R2 (<Duration> = 292 ms) < R3 (<Duration> = 294 ms) < R1 (<Duration> = 307 ms).
Considering the homogeneity of expert radiologists regarding their duration of
fixations, we could now formulate a “gold standard” R of the average duration of
fixations (representing the behaviour of an average expert radiologist), as follows:
µ =1
3∑µi
3
𝑖=1
with µi for a radiologist i is defined as:
µi =1
n∑𝑥𝑗
𝑛
𝑗=1
where n is the total number of fixations recorded over the 196 stimuli used in our study
and xj is the duration of the fixation j. We will compare the mean fixation duration of
trainee radiologists and physicists against this “gold standard” and investigate whether
gaze duration can be used as a metric to distinguish different groups of readers.

98
6.3.1.2 Trainee radiologists
Gaze information was similarly extracted for the three trainee radiologists. According
to the literature, mammography readers with different degrees of experience can be
characterised by their gaze duration [5]. The duration of fixations of each student was
thus further compared with the average expert radiologist. Fig. 6.4 represents the
average fixation duration of T1, T2, and T3 when compared with the “gold standard”
gaze duration of R. The intra-observer variation is revealed by the 95% confidence
interval: [271 ms, 290 ms] for T1, [263 ms, 279 ms] for T2, and [165 ms, 176 ms] for
T3.
Fig. 6.4: Illustration of the mean fixation duration of the average expert radiologist R and of
the trainee radiologists T1, T2 and T3, averaged over all fixations recorded for all test stimuli.
Error bars indicate a 95% confidence interval.
A statistical significance test is performed with the duration of fixations as dependent
variable and the participant, i.e., average expert radiologist vs. trainee radiologist, as
independent variable. The test for the assumption of normality indicates that the
samples are normally distributed, therefore independent samples t-test are conducted
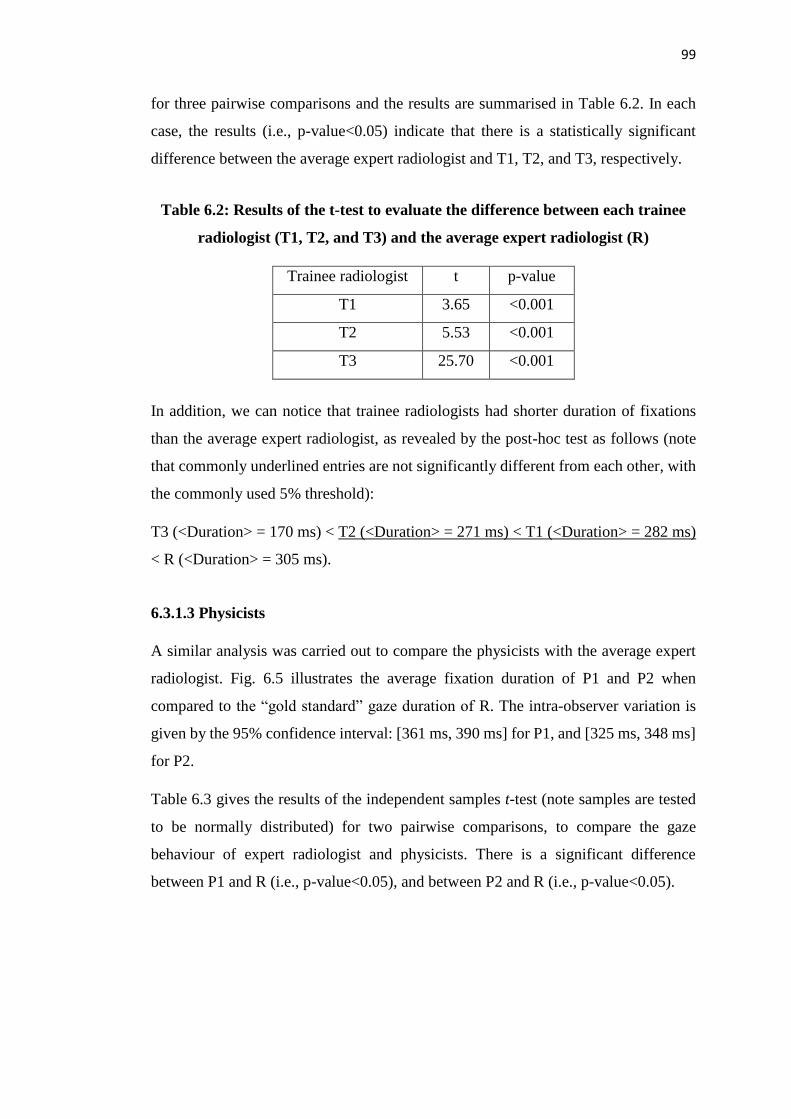
99
for three pairwise comparisons and the results are summarised in Table 6.2. In each
case, the results (i.e., p-value<0.05) indicate that there is a statistically significant
difference between the average expert radiologist and T1, T2, and T3, respectively.
Table 6.2: Results of the t-test to evaluate the difference between each trainee
radiologist (T1, T2, and T3) and the average expert radiologist (R)
Trainee radiologist t p-value
T1 3.65 <0.001
T2 5.53 <0.001
T3 25.70 <0.001
In addition, we can notice that trainee radiologists had shorter duration of fixations
than the average expert radiologist, as revealed by the post-hoc test as follows (note
that commonly underlined entries are not significantly different from each other, with
the commonly used 5% threshold):
T3 (<Duration> = 170 ms) < T2 (<Duration> = 271 ms) < T1 (<Duration> = 282 ms)
< R (<Duration> = 305 ms).
6.3.1.3 Physicists
A similar analysis was carried out to compare the physicists with the average expert
radiologist. Fig. 6.5 illustrates the average fixation duration of P1 and P2 when
compared to the “gold standard” gaze duration of R. The intra-observer variation is
given by the 95% confidence interval: [361 ms, 390 ms] for P1, and [325 ms, 348 ms]
for P2.
Table 6.3 gives the results of the independent samples t-test (note samples are tested
to be normally distributed) for two pairwise comparisons, to compare the gaze
behaviour of expert radiologist and physicists. There is a significant difference
between P1 and R (i.e., p-value<0.05), and between P2 and R (i.e., p-value<0.05).
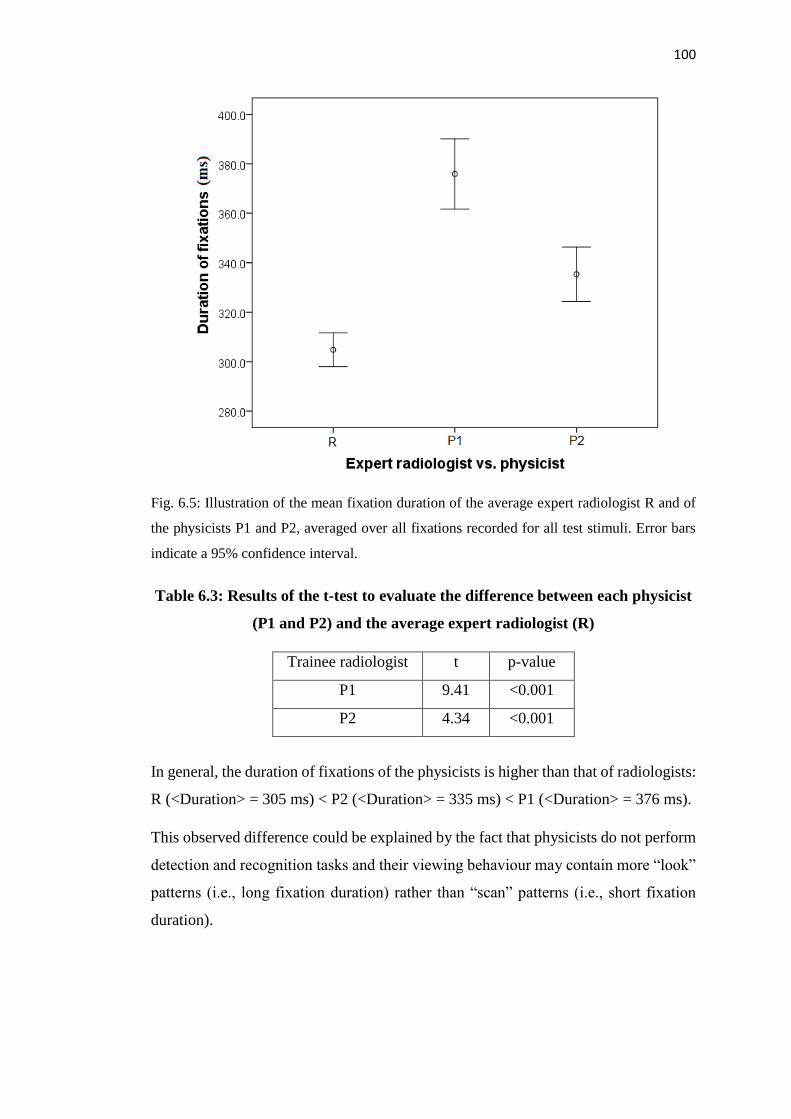
100
Fig. 6.5: Illustration of the mean fixation duration of the average expert radiologist R and of
the physicists P1 and P2, averaged over all fixations recorded for all test stimuli. Error bars
indicate a 95% confidence interval.
Table 6.3: Results of the t-test to evaluate the difference between each physicist
(P1 and P2) and the average expert radiologist (R)
Trainee radiologist t p-value
P1 9.41 <0.001
P2 4.34 <0.001
In general, the duration of fixations of the physicists is higher than that of radiologists:
R (<Duration> = 305 ms) < P2 (<Duration> = 335 ms) < P1 (<Duration> = 376 ms).
This observed difference could be explained by the fact that physicists do not perform
detection and recognition tasks and their viewing behaviour may contain more “look”
patterns (i.e., long fixation duration) rather than “scan” patterns (i.e., short fixation
duration).

101
6.3.1.4 Summary
Fig. 6.6 summarises the duration of fixations for each reader group, i.e., expert
radiologists, trainee radiologists, and physicists.
Fig. 6.6: Illustration of the mean fixation duration of the expert radiologists R1, R2 and R3 (in
red), the trainee radiologists T1, T2 and T3 (in green) and the physicists P1 and P2 (in blue),
averaged over all fixations recorded for all test stimuli. Error bars indicate a 95% confidence
interval.
It can be seen that the three groups of readers have different viewing behaviour in
terms of duration of fixations. Physicists have a significantly higher dwell time than
expert radiologists; and trainee radiologists have a significantly lower dwell time than
expert radiologists. The differences in fixation duration intrinsically reflect the effects
of expertise and experience on image reading, and thus could be potentially used to
characterise the behaviour of mammogram readers.
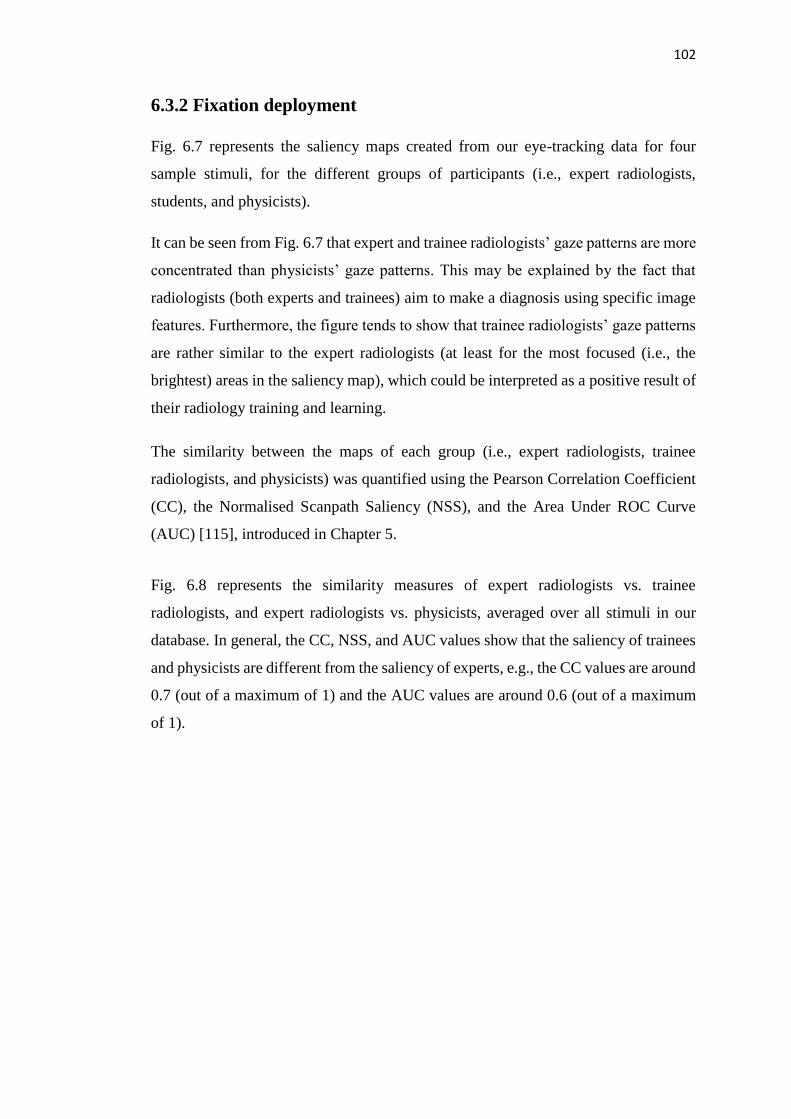
102
6.3.2 Fixation deployment
Fig. 6.7 represents the saliency maps created from our eye-tracking data for four
sample stimuli, for the different groups of participants (i.e., expert radiologists,
students, and physicists).
It can be seen from Fig. 6.7 that expert and trainee radiologists’ gaze patterns are more
concentrated than physicists’ gaze patterns. This may be explained by the fact that
radiologists (both experts and trainees) aim to make a diagnosis using specific image
features. Furthermore, the figure tends to show that trainee radiologists’ gaze patterns
are rather similar to the expert radiologists (at least for the most focused (i.e., the
brightest) areas in the saliency map), which could be interpreted as a positive result of
their radiology training and learning.
The similarity between the maps of each group (i.e., expert radiologists, trainee
radiologists, and physicists) was quantified using the Pearson Correlation Coefficient
(CC), the Normalised Scanpath Saliency (NSS), and the Area Under ROC Curve
(AUC) [115], introduced in Chapter 5.
Fig. 6.8 represents the similarity measures of expert radiologists vs. trainee
radiologists, and expert radiologists vs. physicists, averaged over all stimuli in our
database. In general, the CC, NSS, and AUC values show that the saliency of trainees
and physicists are different from the saliency of experts, e.g., the CC values are around
0.7 (out of a maximum of 1) and the AUC values are around 0.6 (out of a maximum
of 1).
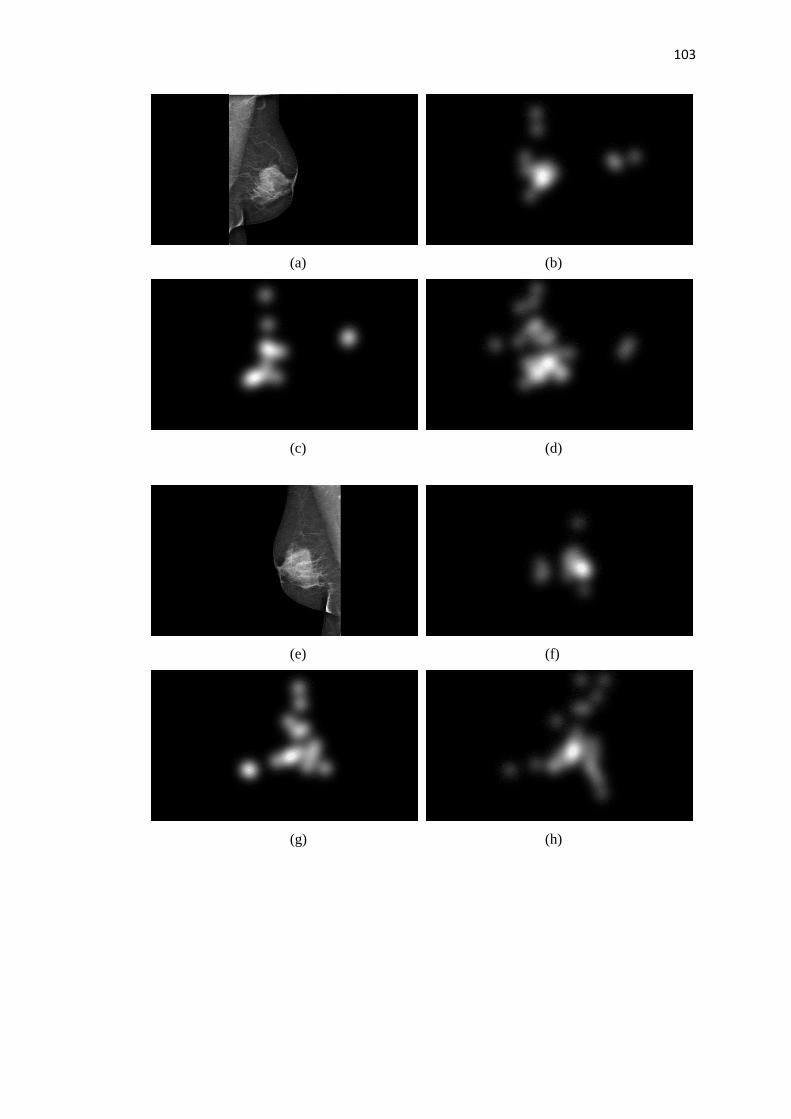
103
(a) (b)
(c) (d)
(e) (f)
(g) (h)
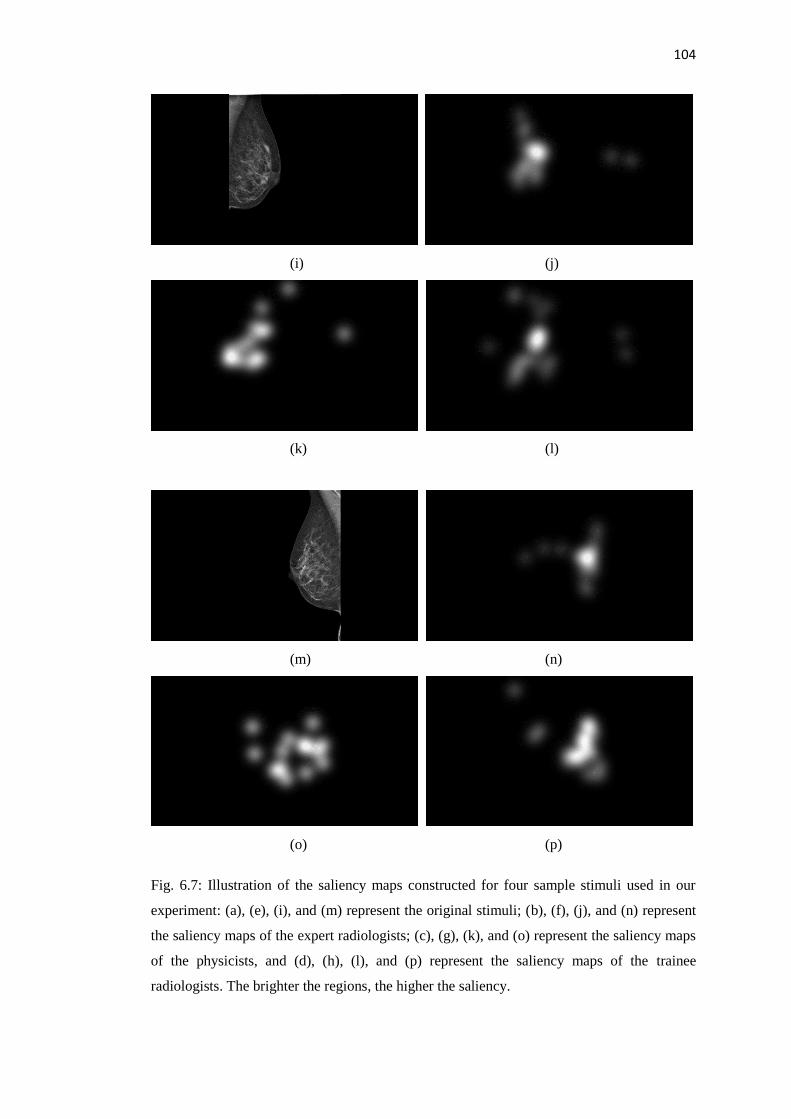
104
(i) (j)
(k) (l)
(m) (n)
(o) (p)
Fig. 6.7: Illustration of the saliency maps constructed for four sample stimuli used in our
experiment: (a), (e), (i), and (m) represent the original stimuli; (b), (f), (j), and (n) represent
the saliency maps of the expert radiologists; (c), (g), (k), and (o) represent the saliency maps
of the physicists, and (d), (h), (l), and (p) represent the saliency maps of the trainee
radiologists. The brighter the regions, the higher the saliency.
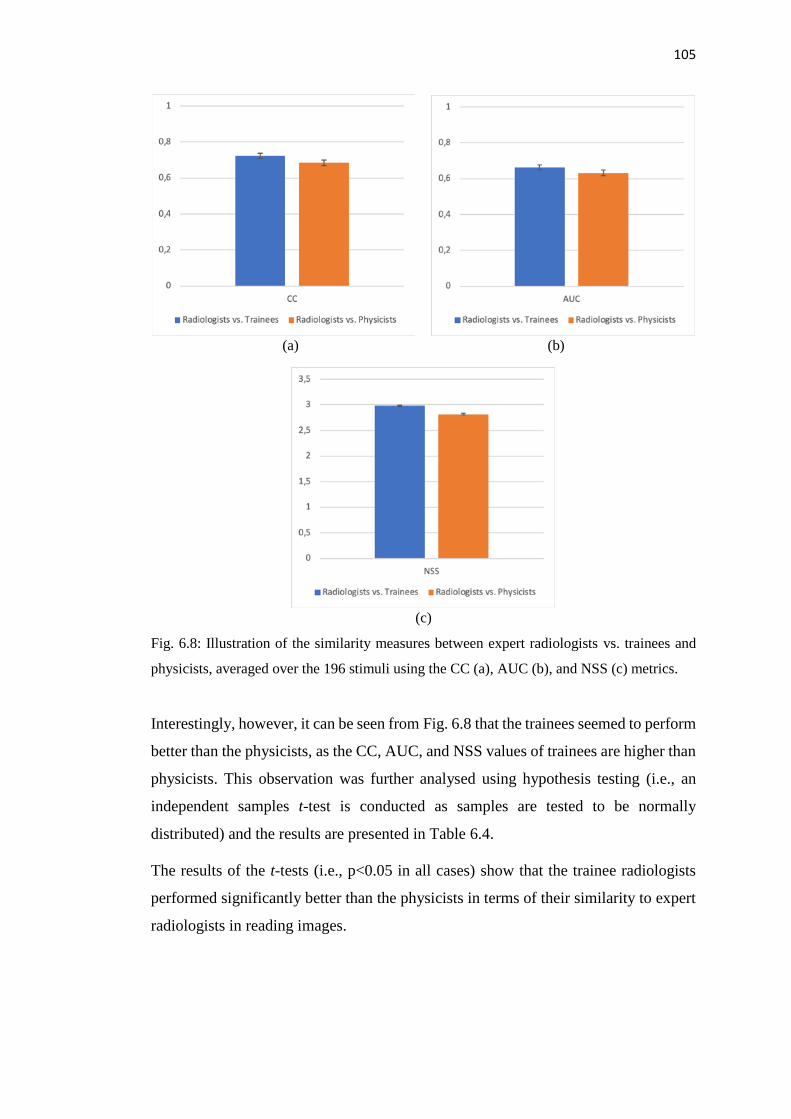
105
(a) (b)
(c)
Fig. 6.8: Illustration of the similarity measures between expert radiologists vs. trainees and
physicists, averaged over the 196 stimuli using the CC (a), AUC (b), and NSS (c) metrics.
Interestingly, however, it can be seen from Fig. 6.8 that the trainees seemed to perform
better than the physicists, as the CC, AUC, and NSS values of trainees are higher than
physicists. This observation was further analysed using hypothesis testing (i.e., an
independent samples t-test is conducted as samples are tested to be normally
distributed) and the results are presented in Table 6.4.
The results of the t-tests (i.e., p<0.05 in all cases) show that the trainee radiologists
performed significantly better than the physicists in terms of their similarity to expert
radiologists in reading images.
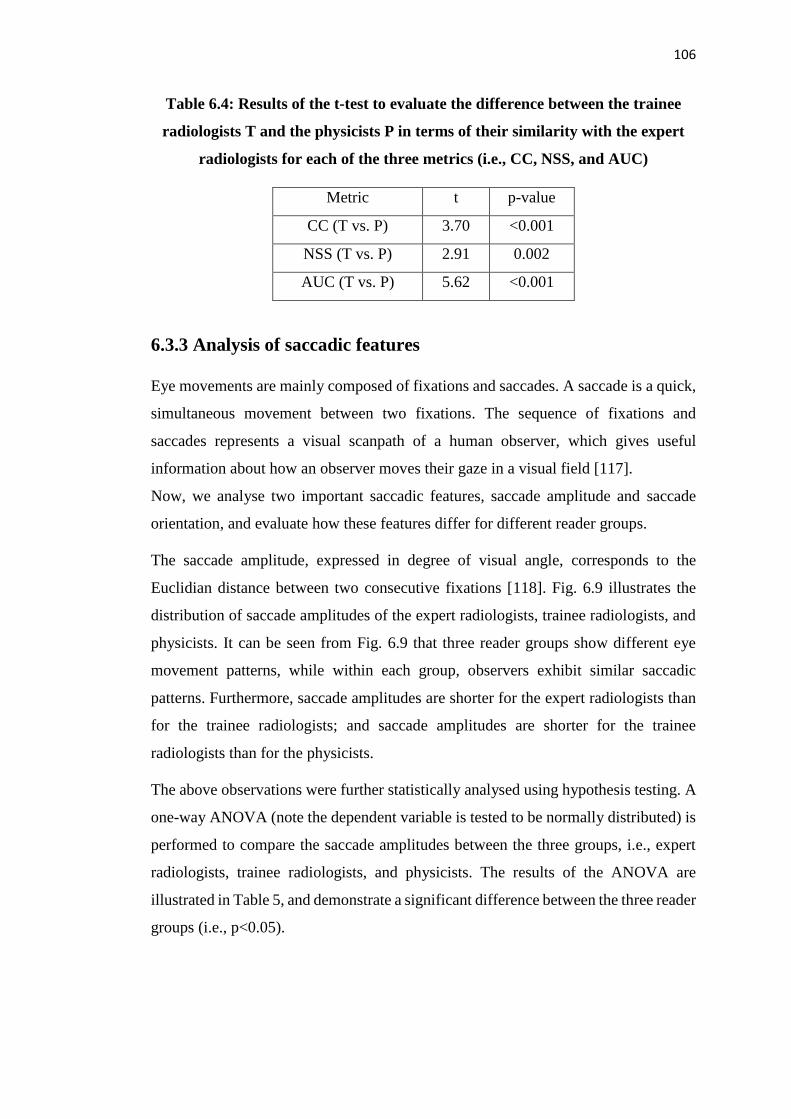
106
Table 6.4: Results of the t-test to evaluate the difference between the trainee
radiologists T and the physicists P in terms of their similarity with the expert
radiologists for each of the three metrics (i.e., CC, NSS, and AUC)
Metric t p-value
CC (T vs. P) 3.70 <0.001
NSS (T vs. P) 2.91 0.002
AUC (T vs. P) 5.62 <0.001
6.3.3 Analysis of saccadic features
Eye movements are mainly composed of fixations and saccades. A saccade is a quick,
simultaneous movement between two fixations. The sequence of fixations and
saccades represents a visual scanpath of a human observer, which gives useful
information about how an observer moves their gaze in a visual field [117].
Now, we analyse two important saccadic features, saccade amplitude and saccade
orientation, and evaluate how these features differ for different reader groups.
The saccade amplitude, expressed in degree of visual angle, corresponds to the
Euclidian distance between two consecutive fixations [118]. Fig. 6.9 illustrates the
distribution of saccade amplitudes of the expert radiologists, trainee radiologists, and
physicists. It can be seen from Fig. 6.9 that three reader groups show different eye
movement patterns, while within each group, observers exhibit similar saccadic
patterns. Furthermore, saccade amplitudes are shorter for the expert radiologists than
for the trainee radiologists; and saccade amplitudes are shorter for the trainee
radiologists than for the physicists.
The above observations were further statistically analysed using hypothesis testing. A
one-way ANOVA (note the dependent variable is tested to be normally distributed) is
performed to compare the saccade amplitudes between the three groups, i.e., expert
radiologists, trainee radiologists, and physicists. The results of the ANOVA are
illustrated in Table 5, and demonstrate a significant difference between the three reader
groups (i.e., p<0.05).
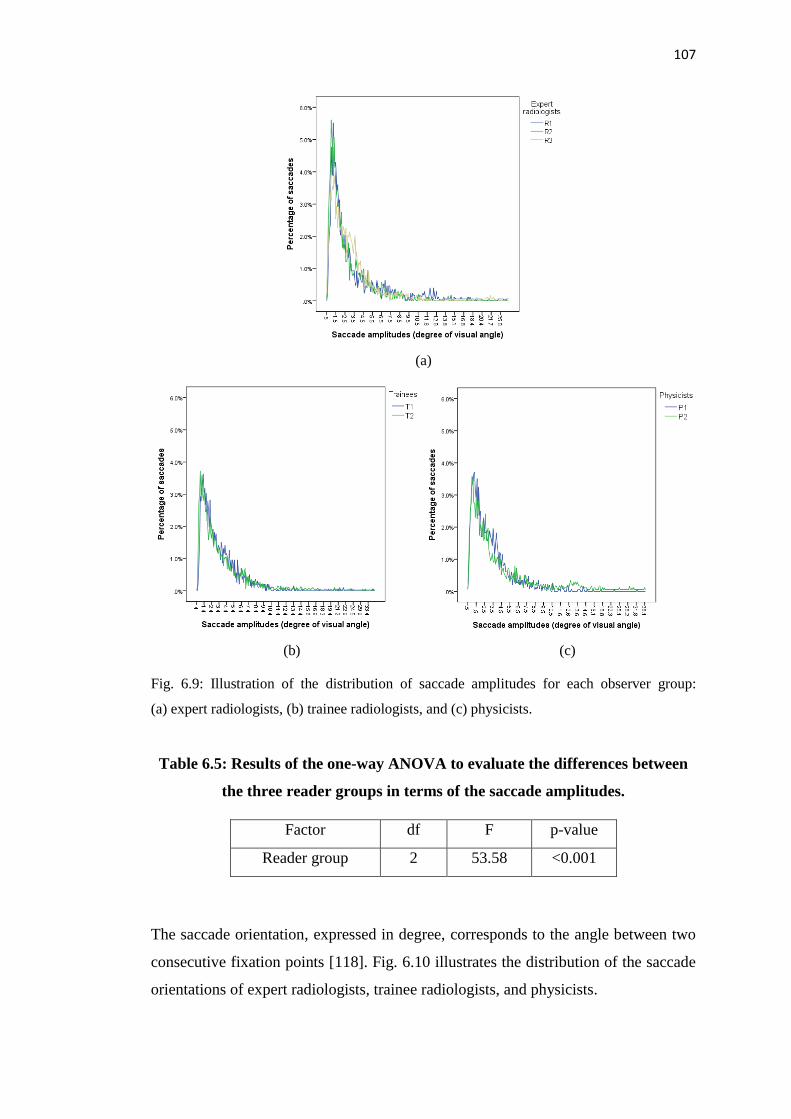
107
(a)
(b) (c)
Fig. 6.9: Illustration of the distribution of saccade amplitudes for each observer group:
(a) expert radiologists, (b) trainee radiologists, and (c) physicists.
Table 6.5: Results of the one-way ANOVA to evaluate the differences between
the three reader groups in terms of the saccade amplitudes.
Factor df F p-value
Reader group 2 53.58 <0.001
The saccade orientation, expressed in degree, corresponds to the angle between two
consecutive fixation points [118]. Fig. 6.10 illustrates the distribution of the saccade
orientations of expert radiologists, trainee radiologists, and physicists.
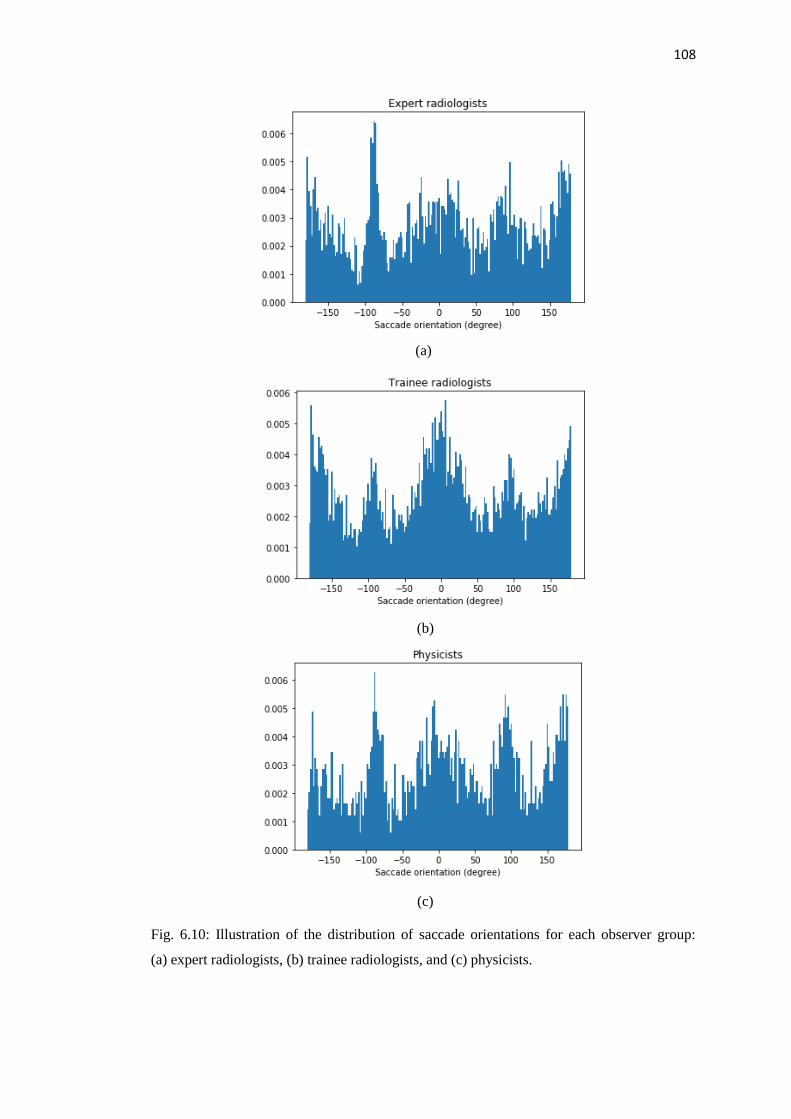
108
(a)
(b)
(c)
Fig. 6.10: Illustration of the distribution of saccade orientations for each observer group:
(a) expert radiologists, (b) trainee radiologists, and (c) physicists.
109
It can be seen from the figure that the three observer groups present different
orientation distributions. For instance, expert radiologists’ distribution of saccade
orientations shows a sharp peak around -100 degrees; the distribution of trainee
radiologists’ saccade orientations presents a gradual peak around 0 degree; and
physicists’ distribution contains multiple gradual peaks.
In summary, the results suggest that saccadic features, including saccade amplitudes
and orientations are strongly dependent on observers’ expertise and experience in
image reading. Again, these saccadic features can be used to characterise the gaze
behaviour of mammogram readers.
6.4 Main findings and contributions
In this chapter, we studied the impact of different medical specialties (i.e., radiologist
versus physicist) and levels of experiences (i.e., expert versus trainee radiologist) on
the human perceptual behaviour while interpreting medio-lateral oblique mammogram
views through a large-scale eye-tracking experiment.
The eye-tracking data, collected from expert radiologists, trainees, and physicists,
were analysed using different – yet complementary – metrics, i.e., gaze duration, gaze
deployment, and saccadic features. The results showed that gaze metrics can be used
to quantify to what extent trainees or physicists are in agreement with experts in terms
of where to focus in images. In general, physicists have a significantly higher dwell
time than experts, and trainee radiologists have a significantly lower dwell time than
experts. The physicists gaze patterns were more dispersed than that of the radiologists,
whereas the trainees showed similar patterns to that of the radiologists. The trainee
radiologists thus performed better than the physicists.

110
111
Chapter 7:
Conclusions and discussion
This thesis aims to investigate the perceptual behaviour of medical professionals when
interacting with medical visual content (i.e., images or videos) in various contexts of
applications. Existing issues in medical image perception have been identified in the
previous chapters, and subjective experiments were designed and conducted to
approach these problems. Statistical evaluations were performed to reveal and
quantify the viewing behaviour of observers.
Overall, our research questions were answered by experimental results, and research
objectives were fulfilled. In this final chapter, the main conclusions drawn are first
summarised. Afterwards, several points in close relation to this thesis are discussed,
as well as some possible research directions which could be considered in future
studies.
7.1 Study of perceived visual quality
With the advances in medical imaging technologies, as well as in information and
communication technologies, health professionals are nowadays viewing medical
imaging content in diverse environments. Furthermore, their quality of experience
might be affected depending on their medical specialty, their degree of experience,
and the clinical context they are facing. To optimise clinical practice, it is thus of
fundamental importance to understand how medical experts perceive the visual quality
of medical images and videos.
In this thesis, we first conducted subjective experiments in the context of telemedicine
with expert surgeons. Based on the qualitative results provided by semi-structured
interviews, a subjective video quality assessment experiment was designed and carried
out. Quantitative results showed the strong impact of the contextual factor, i.e.,
medical procedure and video content, on the perceived quality. Similarly, the system
factor, i.e., video compression scheme, bit rate, frame rate, and packet loss rate, also
demonstrated its impact on the perceived quality.

112
Secondly, a psychophysical study was undertaken to evaluate how specialty settings
affect the perceived quality. Via a dedicated subjective experiment, we investigated
whether and to what extent radiologists and sonographers, two specialties working
together but having distinct backgrounds, differently perceive the quality of
compressed ultrasound videos. Toward this goal, videos of different ultrasound exams
were distorted with various compression schemes and ratios. The statistical analyses
showed that the way video quality changes with content and compression
configuration tends to be consistent for radiologists and sonographers, however, the
results demonstrated that sonographers are more bothered by the distortions than the
radiologists for highly compressed stimuli.
7.2 Study of human visual attention
Another unintrusive way to explore medical experts’ perception of medical visual
information is by using eye-tracking technology, which allows analysing the gaze
behaviour of human subjects. We first conducted a new eye-tracking study where a
large-scale database of two-view mammograms was assessed by eight expert
radiologists. The analysis of their eye movements showed how attention is allocated
to the medio-lateral oblique view versus the cranio-caudal view, using the fixation
duration and fixation deployment metrics. Furthermore, we demonstrated that existing
computational models of visual attention fail to represent the “ground truth” data
obtained from the radiologists.
Finally, we conducted another eye-tracking study where a large number of medio-
lateral oblique view mammograms was assessed by expert radiologists, trainee
radiologists, and physicists. Statistical analyses showed the consistency between the
experts in terms of gaze duration, as well as the differences between trainee
radiologists and experts, and between physicists and experts. An evaluation of the
fixation deployment reinforced this conclusion. The trainee radiologists performed
better than the physicists in terms of their similarity with the radiologists’ gaze
behaviour. Knowledge on how expert radiologists search mammograms could be used
to improve educational practice.
113
7.3 Future work
7.3.1 Technological complexity
Medical imaging is composed of a wide range of areas of application, including, but
not limited to: radiography, ultrasonography, and endoscopy. Each area presents
diverse set of characteristics in imaging, including 2D or 3D content, images or videos,
and content in colour or in black and white.
Due to the technological complexity of medical imaging, distinct artifacts may be
induced in the medical visual signals in data acquisition or image reconstruction. In
this thesis, only a limited sample of medical imaging modalities (i.e., open and
laparoscopic surgery, hepatic ultrasound, and mammograms) and artifacts were
investigated. Exploring more modalities would be highly beneficial for medical image
perception research.
7.3.2 User community
The fact that different health practitioners work with the same set of medical content
was raised in the previous chapters, and this can happen in the same hospital or
environment. Even though they have different backgrounds and received different
specialised training, all the practitioners aim to care for their patients. Due to their
different experience and expertise, these users present distinct needs and perceptual
behaviour when viewing medical imaging data.
In this thesis, we studied different health professionals, i.e., surgeons, radiologists,
sonographers, and physicists. This list already covers a broad range of professions,
however, there are yet more to be added, including generalist practitioners and nurses
for instance. Widening the field of medical professions will help research by offering
a better comprehension of the problem.
7.3.3 Demographic complexity
In this thesis, we worked closely with British and French health professionals, i.e.,
from developed countries (MEDCs), and thus with up-to-date technologies. But what
about developing countries (LEDCs) in Asia, Africa, and Latin America with lower
economic levels, and therefore with fewer state-of-the-art resources?
114
There has been an increasing demand for telemedicine in developing economies,
where access to and delivery of timely and high-quality healthcare in resource-poor
settings remain very limited. For example, in August 2014, the National Health and
Family Planning Commission of the People’s Republic of China (NHFPC) issued
comprehensive guidelines on telemedicine services to push forward the deployment.
It would be highly beneficial to develop medical image perception research with
developing countries to improve their clinical practice and health conditions.
7.3.4 Objective approaches
In this thesis, a subjective approach was developed for video quality assessment, i.e.,
experiments with human subjects (medical professionals in our case). It should be
noted that evaluation with subjective experimentation is intrinsically time-consuming,
and thus limited with respect to the amount of test stimuli and the number of available
medical experts. Adding more experimental data to our evaluation would be highly
beneficial, especially in terms of adding confidence to the generalisability of the
conclusions.
A more realistic and practical way to assess the perceived quality of images and videos
is to use computational models, i.e., image and video quality metrics. To date, very
little objective quality assessment has been done for the development of medical
images and videos. Some recommended compression ratios have been published in
the literature, but they are based on subjective scores given by radiologists assessing
a small number of images.
Widely recognised models developed for natural images and videos, such as PSNR
(peak signal-to-noise ratio) and SSIM (structural similarity index) [119], were applied
in the literature for the assessment of image and video quality in medical imaging. The
correlation between the predictions of these models is very poor. These results suggest
that there is plenty of headroom for further improvement in objective quality
assessment in the particular context of medical imaging. Such new objective methods
would benefit not only the acquisition, storage, and presentation of medical images,
but also the development of new medical imaging methods which could offer better
image quality.

115
Bibliography
[1] E. Krupinski, “Current perspectives in medical image perception”, Attention, Perception
& Psychophysics, vol. 72, pp. 1205-1217, 2010.
[2] D. Holt, “Telesurgery: Advances and trends”, University of Toronto Medical Journal, vol.
82, 2004.
[3] A. Brady, “Error and discrepancy in radiology: Inevitable or avoidable?”, Insights
Imaging, vol. 8, pp. 171-182, 2017.
[4] E. Samei, and E. Krupinski, The Handbook of medical image perception and techniques,
Cambridge University Press, 438p., 2010.
[5] E. Krupinski, “Visual scanning patterns of radiologists searching mammograms”,
Academic Radiology, vol. 3, pp.137-144, 1996.
[6] E. Krupinski, “Improving Patient Care Through Medical Image Perception Research”,
Policy Insights from the Behavioral and Brain Sciences, vol. 2, pp. 74-80, 2015.
[7] E. Pusey, R. Lufkin, R. Brown, M. Solomon, D. Stark, R. Tarr, and W. Hanafee,
“Magnetic resonance imaging artifacts: mechanism and clinical significance”,
Radiographics, vol. 6, pp. 891-911, 1986.
[8] J. Clark, and W. Kelly, “Common artifacts encountered in magnetic resonance imaging”,
Radiologic Clinics of North America, vol. 26, pp. 893-920, 1988.
[9] S. Solomon, R. Jost, H. Glazer, S, Sagel, D. Anderson, and P. Molina, “Artifacts in
computed radiography”, American Journal of Roentgenology, vol. 157, pp. 181-185,
1991.
[10] L. Cesar, B. Schueler, F. Zink, T. Daly, J. Taubel, and L. Jorgenson, “Artifacts found in
computer radiography”, The British Journal of Radiology, vol. 74, pp. 195-202, 2001.
[11] J. Barrett, and N. Keat, “Artifacts in CT: Recognition and avoidance”, RadioGraphics,
vol. 24, pp. 1679-1691, 2004.
[12] C. Cavaro-Ménard, L. Zhang-Ge, and P. Le Callet, “QoE for Telemedicine: Challenges
and Trends,” SPIE 8856, Applications of Digital Image Processing XXXVI, vol.
8856, 2013.
[13] M. Razaak, and M. Martini, “Medical image and video quality assessment in e-health
applications and services”, IEEE 15th International Conference on e-Health Networking,
Applications and Services, Lisbon, Portugal, pp. 6-10, 2013.
[14] F. Schaeffel, Processing of information in the human visual system, Handbook of Machine
Vision, Chapter 1, pp. 1-33, 2007.
116
[15] J. Gross, F. Schmitz, I. Schnitzler, K. Kessler, K. Shapiro, B. Hommel, and A. Schnitzler,
“Modulation of long-range neural synchrony reflects temporal limitations of visual
attention in humans”, Proceedings of the National Academy of Sciences of the USA, vol.
101, pp. 13050-13055, 2004.
[16] H. Kundel, C. Nodine, E. Conant, and S. Weinstein, “Holistic component of image
perception in mammogram interpretation: Gaze-tracking study”, Radiology, vol. 242, pp.
396-402, 2007.
[17] T. Tien, P. Pucher, M. Sodergren, K. Sriskandarajah, G. Yang, and A. Darzi, “Eye tracking
for skills assessment and training: A systematic review”, Elsevier Journal of Surgical
Research, vol. 191, pp. 169-178, 2014.
[18] P. Mohammadi, A. Ebrahimi-Moghadam, and S. Shirani, “Subjective and objective
quality assessment of image: A survey,” Elsevier Journal of Visual Communication and
Image Representation, vol. 9, pp. 55-83, 2014.
[19] Recommendation ITU-T, P.910, Subjective video quality assessment methods for
multimedia applications, 2008.
[20] D. Rouse, R. Pépion, P. Le Callet, and S. Hemami, “Tradeoffs in subjective testing
methods for image and video quality assessment,” Proceedings SPIE Human Vision and
Electronic Imaging, vol. 7527, 2010.
[21] Recommendation ITU-R BT.500-13, Methodology for the subjective assessment of the
quality of television pictures, 2012.
[22] J. Li, Methods for assessment and prediction of QoE preference and visual discomfort in
multimedia application with focus on S-3DTV, Thesis of Nantes University (France),
235p., 2013.
[23] Recommendation ITU-R BT.1788, Methodology for the subjective assessment of video
quality in multimedia applications, 2007.
[24] H. Liu, J. Koonen, M. Fuderer, and I. Heynderickx, "The relative impact of ghosting and
noise on the perceived quality of MR images," IEEE Transactions on Image Processing,
vol. 25, pp. 3087-3098, 2016.
[25] M. Bruno, E. Walker, and H. Abujudeh, “Understanding and confronting our mistakes:
The epidemiology of error in radiology and strategies for error reduction”, Radiographics,
vol. 35, pp. 1668-1676, 2015.
[26] A. Neri, F. Battisti, M. Carli, M. Salatino, M. Goffredo, and T. D’Alessio, "Perceptually
lossless ultrasound video coding for telemedicine applications", International Workshop
on Video Processing and Quality Metrics, Scottsdale, USA, 2007.
117
[27] T. Wiegand, G. Sullivan, G. Bjontegaard, and A. Luthra, “Overview of the H.264/AVC
video coding standard”, IEEE Transactions Circuits and Systems for Video Technology,
vol. 13, pp. 560-576, 2003.
[28] J. Suad, and W. Jbara, “Subjective quality assessment of new medical image database”,
International Journal of Computer Engineering and Technology, vol. 4, pp. 155-164,
2013.
[29] M. Razaak, and M. Martini, “Rate-distortion and rate-quality performance analysis of
HEVC compression of medical ultrasound videos”, 4th International Conference on
Selected Topics in Mobile & Wireless Networking, Rome, Italy, vol. 40, pp. 230-236,
2014.
[30] G. Sullivan, J-R. Ohm, W-J. Han, and T. Wiegand, “Overview of the High Efficiency
Video Coding (HEVC) standard”, IEEE Transactions on Circuits and Systems for Video
Technology, vol. 22, pp. 1649-1668, 2012.
[31] M. Gray, H. Morchel, and V. Hazelwood, “Evaluating the effect of bit rate on the quality
of portable ultrasound video”, IEEE 12th International Symposium on Biomedical
Imaging, New York, USA, 2015.
[32] L. Chow, H. Rajagopal, R. Paramesran, and Alzheimer's Disease Neuroimaging Initiative,
"Correlation between subjective and objective assessment of magnetic resonance (MR)
images", Magnetic Resonance Imaging, vol. 34, pp. 820-831, 2016.
[33] Y. Shima, A. Suwa, Y. Gomi, H. Nogawa, H. Nagata, and H. Tanaka, “Qualitative and
quantitative assessment of video transmitted by DVTS (digital video transport system) in
surgical telemedicine”, Journal of Telemedicine and Telecare, vol. 13, pp. 148-153, 2007.
[34] N. Nouri, D. Abraham, J. Moureaux, M. Dufaut, J. Hubert, and M. Perez, "Subjective
MPEG2 compressed video quality assessment: Application to tele-surgery", 7th IEEE
International Symposium on Biomedical Imaging, Rotterdam, Netherlands, pp. 1945-
7928, 2010.
[35] M. Martini, C. Hewage, M. Nasralla, R. Smith, I. Jourdan, and T. Rockall, “3-D robotic
tele-surgery and training over next generation wireless networks”, 35th Annual
International Conference of the IEEE EMBS, Osaka, Japan, 2013.
[36] A. Chaabouni, Y. Gaudeau, J. Lambert, J-M. Moureaux, and P. Gallet, "Subjective and
objective quality assessment for H264 compressed medical video sequences", 4th
International Conference on Image Processing Theory, Tools and Applications, Paris,
France, 2014.
118
[37] B. Munzer, K. Schoeffmann, L. Boszormenyi, J. Smulders, and J. Jakimowicz,
“Investigation of the impact of compression on the perceptional quality of laparoscopic
videos”, IEEE 27th International Symposium on Computer-Based Medical Systems, New
York, USA, pp. 153-158, 2014.
[38] A. Kumcu, K. Bombeke, H. Chen, L. Jovanov, L. Platisa, H. Luong, J. Van Looy, Y. Van
Nieuwenhove, P. Schelkens, and W. Philips, “Visual quality assessment of H.264/AVC
compressed laparoscopic video”, SPIE Medical Imaging 2014: Image Perception,
Observer Performance, and Technology Assessment, vol. 9037, pp. 1-12, 2014.
[39] B. Tulu, and S. Chatterjee, “Internet-based telemedicine: An empirical investigation of
objective and subjective video quality”, Decisions Support Systems, vol. 45, pp. 681-696,
2008.
[40] L. Platisa, L. Van Brantegem, A. Kumcu, R. Ducatelle, and W. Philips, “Influence of
study design on digital pathology image quality evaluation: the need to define a clinical
task”, Journal of Medical Imaging, vol. 4, 2017.
[41] P. Kara, P. Kovacs, S. Vagharshakyan, M. Martini, S. Imre, A. Barsi, K. Lackner, and T.
Balogh, “Perceptual quality of reconstructed medical images on projection-based light
field displays”, eHealth 2016, vol. 181, pp. 476-483, 2017.
[42] M. A. Usman, M. R. Usman, and S. Shin, "Quality assessment for wireless capsule
endoscopy videos compressed via HEVC: From diagnostic quality to visual perception",
Computers in Biology and Medicine, vol. 91, pp. 112-134, 2017.
[43] A. Kumcu, K. Bombeke, L. Platisa, L. Jovanov, J. Van Looy, and W. Philips,
“Performance of Four Subjective Video Quality Assessment Protocols and Impact of
Different Rating Preprocessing and Analysis Methods”, IEEE Journal of Selected Topics
in Signal Processing, vol. 11, pp. 48-63, 2017.
[44] M. Pinson, and S. Wolf, “Comparing subjective video quality testing methodologies”,
Visual Communications and Image Processing, vol. 5150, pp. 573-582, 2003.
[45] S. Ickin, K. Wac, M. Fiedler, L. Jankowski, J. Hong, and A. Dey, “Factors Influencing
Quality of Experience of Commonly Used Mobile Applications,” IEEE Communication
Magazine, vol. 50, pp. 48-56, 2012.
[46] L. Zhang, C. Cavaro-Ménard, P. Le Callet, and L. Cooper, "The effects of anatomical
information and observer expertise on abnormality detection task”, SPIE Medical
Imaging, vol. 7966, 2011.

119
[47] I. Kowalik-Urbaniak, D. Brunet, J. Wang, D. Koff, N. Smolarski-Koff, E. Vrscay, B.
Wallace, and Z. Wang, “The quest for “diagnostically lossless” medical image
compression: A comparative study of objective quality metrics for compressed medical
images”, SPIE Medical Imaging: Image Perception, Observer Performance, and
Technology Assessment, San Diego, USA, vol. 9037, 2014.
[48] R. K. Mantiuk, A. Tomaszewska, and R. Mantiuk, “Comparison of four subjective
methods for image quality assessment”, Computer Graphics forum, vol. 31, pp. 2478-
2491, 2012.
[49] C. Nodine, H. Kundel, S. Lauver, and L. Toto, “Nature of expertise in searching
mammograms for breast masses”, Academic Radiology, vol. 3, pp. 1000-10006, 1996.
[50] E. Krupinski, and R. Weinstein, “Changes in visual search patterns of pathology residents
as they gain experience”, Proceedings of SPIE, vol. 7966, 2011.
[51] T. Ohno, “One-point calibration gaze tracking method”, Proceedings of the Symposium
on Eye Tracking Research and Applications, San Diego, California, pp. 34-34, 2006.
[52] C. Connor, H. Egeth, and S. Yantis, “Visual attention: bottom-up versus top-down”,
Current Biology, vol. 14, pp. 850-852, 2004.
[53] W. Zhang, and H. Liu, "Toward a reliable collection of eye-tracking data for image quality
research: challenges, solutions, and applications," IEEE Transactions on Image
Processing, vol. 26, pp. 2424-2437, 2017.
[54] G. Buswell, How people look at pictures: A study of the psychology of perception in art,
The University of Chicago Press, 214p., 1935.
[55] A. Borji, and L. Itti, “State-of-the-art in visual attention modelling”, IEEE Transactions
on Pattern Analysis and Machine Intelligence, vol. 35, pp. 185-207, 2013.
[56] D. Carmody, C. Nodine, and H. Kundel, “Finding lung nodules with and without
comparative visual scanning”, Perception & Psychophysics, vol. 29, pp. 594-598, 1981.
[57] D. Beard, R. Johnston, O. Toki, and C. Wilcox, “A study of radiologists viewing multiple
computed tomography examinations using an eye-tracking device”, Journal of Digital
Imaging, vol. 4, pp. 230-237, 1990.
[58] K. Suwa, A. Furukawa, T. Mastumoto, and T. Yosue, “Analyzing the eye movement of
dentists during their reading of CT images”, Odontology, vol. 89, pp. 54-61, 2001.
[59] H. Kundel, C. Nodine, E. Krupinski, and C. Mello-Thoms, “Using gaze-tracking data and
mixture distribution analysis to support a holistic model for the detection of cancers on
mammograms”, Academic Radiology, vol. 15, pp. 881-886, 2008.
120
[60] S. Voisin, F. Pinto, S. Xu, G. Morin-Ducote, K. Hudson, and G. Tourassi, "Investigating
the association of eye gaze pattern and diagnostic error in mammography”, Proceedings
of Medical Imaging: Image Perception, Observer Performance, and Technology
Assessment, vol. 8673, 2013.
[61] C. Almansa, M. Shahid, M. Heckman, S. Preissler, and M. Wallace, “Association between
visual gaze patterns and adenoma detection rate during colonoscopy: A preliminary
investigation”, The American Journal of Gastroenterology, vol. 106, pp. 1070-1074,
2011.
[62] T. Drew, M. Le-Hoa Vo, A. Olwal, F. Jacobson, S. Seltzer, and J. Wolfe, “Scanners and
drillers: Characterizing expert visual search through volumetric images”, Journal of
Vision, vol. 13, pp. 1-13, 2013.
[63] C. Nodine, C. Mello-Thoms, H. Kundel, and S. Weinstein, “Time course of perception
and decision making during mammographic interpretation”, American Journal of
Roentgenology, vol. 179, pp. 917-923, 2002.
[64] G. Tourassi, S. Voisin, V. Paquit, and E. Krupinski, "Investigating the link between
radiologists’ gaze, diagnostic decision, and image content”, Journal of the American
Medical Informatics Association, vol. 20, pp. 1067-1075, 2013.
[65] L. Cooper, A. Gale, I. Darker, A. Toms, and J. Saada, “Radiology image perception and
observer performance: how does expertise and clinical information alter interpretation?
Stroke detection explored through eye-tracking.”, Proceedings of Medical Imaging:
Image Perception, Observer Performance, and Technology Assessment, vol. 7263, 2009.
[66] H. Matsumoto, Y. Terao, A. Yugeta, H. Fukuda, M. Emoto, T. Furubayashi, T. Okano, R.
Hanajima, and Y. Ugawa, “Where do neurologists look when viewing brain CT images?
An eye-tracking study involving stroke cases”, PLoS One, vol. 6, 2011.
[67] R. Bertram, L. Helle, J. Kaakinen, and E. Svedstrom, “The effect of expertise on eye
movement behaviour in medical image perception”, PLoS One, vol. 8, 2013.
[68] R. Bertram, J. Kaakinen, F. Bensch, L. Helle, E. Lantto, P. Niemi, and N. Lundbom, “Eye
movements of radiologists reflect expertise in CT study interpretation: A potential tool to
measure resident development”, Radiology, vol. 281, pp. 805-815, 2016.
[69] S. Mallett, P. Philips, T. Fanshawe, E. Helbren, D. Boone, A. Gale, S. Taylor, D. Manning,
D. Altman, and S. Halligan, “Tracking eye gaze during interpretation of endoluminal
three-dimensional CT colonography: Visual perception of experienced and inexperienced
readers”, Radiology, vol. 273, pp. 783-792, 2014.

121
[70] D. Manning, S. Ethell, T. Donovan, and T. Crawford, “How do radiologists do it? The
influence of experience and training on searching for chest nodules”, Radiography, vol.
12, pp. 134-142, 2006.
[71] J. Leong, M. Nicolaou, R. Emery, A. Darzi, and G. Yang, “Visual search behaviour in
skeletal radiographs: a cross-specialty study”, Clinical Radiology, vol. 62, pp. 1069-1077,
2007.
[72] P. Vaidyanathan, J. Pelz, C. Alm, P. Shi, and A. Haake, “Recurrence quantification
analysis reveals eye-movement behavior differences between experts and novices”,
Proceedings of the Symposium on Eye Tracking Research and Applications, pp. 303-306,
2014.
[73] D. Turgeon, and E. Lam, “Influence of experience and training on dental students’
examination performance regarding panoramic images”, Journal of Dental Education,
vol. 80, pp. 156-164, 2016.
[74] B. Law, M. Atkins, A. Kirkpatrick, A. Lomax, and C. Mackenzie, “Eye gaze patterns
differentiate novice and experts in a virtual laparoscopic surgery training environment”,
Proceedings of the Symposium on Eye tracking research and applications, San Antonio,
USA, pp. 41-48, 2004.
[75] E. Kocak, J. Ober, N. Berme, and W. Melvin, “Eye motion parameters correlate with level
of experience in video-assisted surgery: Objective testing of three tasks”, Journal of
Laparoendoscopic & Advanced Surgical Techniques, vol. 15, pp. 575-580, 2005.
[76] N. Ahmidi, G. Hager, L. Ishii, G. Fichtinger, G. Gallia, and M. Ishii, “Surgical Task and
Skill Classification from Eye Tracking and Tool Motion in Minimally Invasive Surgery”,
International Conference on Medical Image Computing and Computer-Assisted
Intervention, vol. 13, pp. 295-302, 2010.
[77] L. Richstone, M. Schwartz, C. Seideman, J. Cadeddu, S. Marshall, and L. Kavoussi, “Eye
metrics as an objective assessment of surgical skill”, Annals of Surgery, vol. 252, pp. 177-
182, 2010.
[78] R. Khan, G. Tien, M. Atkins, B. Zheng, O. Panton, A. Meneghetti, "Analysis of eye gaze:
Do novice surgeons look at the same location as expert surgeons during a laparoscopic
operation?”, Surgical Endoscopy, vol. 26, pp. 3536-3540, 2012.
[79] M. Wilson, S. Vine, E. Bright, R. Masters, D. Defriend, and J. McGrath, “Gaze training
enhances laparoscopic technical skill acquisition and multi-tasking performance: a
randomized, controlled study”, Surgical Endoscopy, vol. 25, pp. 3731-3739, 2011.
[80] M. Land, “Vision, eye movements, and natural behavior”, Visual Neuroscience, vol. 26,
pp. 51-62, 2009.
122
[81] S. Vine, R. Masters, J. McGrath, E. Bright, and M. Wilson, “Cheating experience: Guiding
novices to adopt the gaze strategies of experts expedites the learning of technical
laparoscopic skills”, Surgery, vol. 152, pp. 32-40, 2012.
[82] E. Krupinski, A. Graham, and R. Weinstein, “Characterizing the development of visual search
expertise in pathology residents viewing whole slide images”, Human Pathology, vol. 44,
pp. 357-364, 2013.
[83] National Research Council, “Telemedicine: A guide to assessing telecommunications for
health care”, The National Academies Press, 1996.
[84] C. Cavaro-Ménard, A. Naït-Ali, Compression of Biomedical Imaging and Signals, Wiley,
288 p., 2008.
[85] R. Weiss, Learning from strangers: the art and method of qualitative interview studies,
Free Press, 256p., 1995.
[86] H. Bernard, Research methods in Anthropology: Qualitative and quantitative approaches,
AltaMira Press, 520p., 1988.
[87] S. Jamshed, “Qualitative research method-interviewing and observation”, Journal of
Basical and Clinical Pharmacy, vol. 5, pp. 87-88, 2014.
[88] J-L. Ermine, “Challenges and approaches for knowledge management”, Proceedings of
the 4th European Conference on Principles and Practice of Knowledge Discovery in
Database, pp. 5-11, 2000.
[89] R. Clark, D. Feldon, “Cognitive Task Analysis”, Handbook of research on educational
communications and technology, pp. 577-593, 2006.
[90] J. Annett, N. Stanton, Task analysis, CRC Press, 248p., 2000.
[91] A. Strauss, J. Corbin, Basics of qualitative research: Techniques and procedures for
developing grounded theory, SAGE publications, 312p., 1998.
[92] G. Hasslinger, O. Hohlfeld, “The Gilbert-Elliott Model for packet loss in real time services
on the internet”, Proc. 14th GI/ITG Conference Measuring, Modelling and Evaluation of
Computer and Communication Systems, pp. 1-15, 2008.
[93] K. Robson, C. Kotre, “Pilot study into optimisation of viewing conditions for
electronically displayed images”, Radiation Protection Dosimetry, vol. 117, pp. 298-303,
2005.
[94] E. Krupinski, “Diagnostic accuracy and visual search efficiency: Single 8 MP vs. dual 5
MP displays”, Journal of Digital Imaging, vol. 30, pp.144-147, 2017.
[95] Z. Wang, A. Bovik, Modern image quality assessment: Synthesis lectures on image, video
and multimedia processing, Morgan & Claypool, 156p., 2006.
123
[96] H. Sheikh, M. Sabir, A. Bovik, “A statistical evaluation of recent full reference image
quality assessment algorithms”, IEEE Transactions on Image Processing, vol. 15, pp.
3440-3451, 2006.
[97] F. Kozamernik, V. Steinmann, P. Sunna, and E. Wyckens, “SAMVIQ – A new EBU
methodology for video quality evaluations in multimedia”, Society of Motion Picture and
Television Engineers, vol. 114, pp. 152-160, 2005.
[98] J. Nightingale, Q. Wang, C. Grecos, and S. Goma, “The impact of network impairment
on quality of experience (QoE) in H.265/HEVC video streaming”, IEEE Transactions on
Consumer Electronics, vol. 60, pp. 242-250, 2014.
[99] E. Samei, “Assessment of display performance for medical imaging systems”, Report of
the American Association of Physicists in Medicine, Task group 18, Medical Physics
Publishing, vol. 32, pp. 1205-1225, 2005.
[100] B. Hemminger, R. Johnston, J. Rolland, and K. Muller, “Introduction to perceptual
linearization of video display systems for medical image presentation”, Journal of Digital
Imaging, vol. 8, pp. 21-34, 1995.
[101] National Electrical Manufacturers Association, Digital Imaging and Communications in
Medicine (DICOM) Part 14: Greyscale Standard Display Function, Rosslyn, USA, 2004.
Available online: http://medical.nema.org/dicom/2004/04_14PU.pdf accessed on
September 2018.
[102] H. Kundel, C. Nodine, and D. Carmody, “Visual scanning, pattern recognition and
decision-making in pulmonary nodule detection”, Investigative Radiology, vol. 13, pp.
175-181, 1978.
[103] J. Donald, and S. Barnard, “Common patterns in 558 diagnostic radiology errors”,
Journal of Medical Imaging and Radiation Oncology, vol. 56, pp. 173-178, 2012.
[104] C. Nodine, C. Mello-Thoms, S. Weinstein, H. Kundel, E. Conant, R. Heller-Savoy, S.
Rowlings, and J. Birnbaum, “Blinded review of retrospectively visible unreported breast
cancers: an eye-position analysis”, Radiology, vol. 221, pp. 122-129, 2001.
[105] P. Agrawal, M. Vatsa, and R. Singh, “Saliency based mass detection from screening
mammograms”, Signal Processing, vol. 99, pp. 29-47, 2014.
[106] International Agency for Research on Cancer, World Cancer Report, Edited by Stewart
BW and Wild CP, 2014.
[107] D. Salvucci, and J. Goldberg, “Identifying fixations and saccades in eye-tracking
protocols”, Proceedings of the Eye Tracking Research and Applications Symposium,
Tampa, USA, pp. 71-78, 2000.
124
[108] H. Liu, and I. Heynderickx, “Visual attention in objective image quality assessment:
based on eye-tracking data”, IEEE Transactions Circuits and Systems for Video
Technologies, vol. 21, pp. 971-982, 2011.
[109] C. Privitera, and L. Stark, “Algorithms for defining visual regions-of-interest: comparison
with eye fixations”, IEEE Transactions on Pattern Analysis and Machine Intelligence,
vol. 22, pp. 970-982, 2000.
[110] H. Liu, and I. Heynderickx, “Visual attention modeled with luminance only: from eye-
tracking data to computational models”, 5th International Workshop on Video Processing
and Quality Metrics for Consumer Electronics, Scottsdale, USA, 2010.
[111] T. Judd, F. Durand, and A. Torralba, “A benchmark of computational models of saliency
to predict human fixations”, MIT Technical Report, 2012.
[112] J. Harel, C. Koch, and P. Perona, “Graph-Based Visual Saliency”, Proceedings of
Advances of Neural Information Processing Systems, Pasadena, USA, pp. 545-552, 2006.
[113] L. Itti, C. Koch, and E. Niebur, “A model of saliency-based visual attention for rapid
scene analysis”, IEEE Transactions on Pattern Analysis and Machine Intelligence, vol.
20, pp. 1254-1259, 1998.
[114] N. Riche, M. Mancas, M. Duvinage, M. Mibulumukini, B. Gosselin, and T. Dutoit,
"RARE2012 : A multi-scale rarity based saliency detection with its comparative statistical
analysis”, Image Communication, vol. 28, pp. 642-658, 2013.
[115] Z. Bylinskii, T. Judd, A. Oliva, A. Torralba, and F. Durand, “What do different evaluation
metrics tell us about saliency models?”, arXiv:1611.09571, 2016.
[116] R. Peters, A. Iyer, L. Itti, and C. Koch, “Components of bottom-up gaze allocation in
natural images”, Vision Research, vol. 45, pp. 2397-2416, 2005.
[117] O. Le Meur, and Z. Liu, “Saccadic model of eye movements for free-viewing condition”,
Vision Research, vol. 116, pp. 152-164, 2015.
[118] O. Le Meur, A. Coutrot, and Z. Liu, “Visual attention saccadic models learn to emulate
gaze patterns from childhood to adulthood”, IEEE Transactions on Image Processing, vol.
26, pp. 4777-4789, 2017.
[119] Z. Wang, A. Bovik, H. Sheik, and E. Simoncelli, “Image quality assessment: from error
visibility to structural similarity”, IEEE Transactions on Image Processing, vol. 13, pp.
600-612, 2004.

125
Appendix
Appendix 1: Raw data, controlled experiment, open surgery
Content Surgeon 128
kbps
256
kbps
350
kbps
512
kbps
1000
kbps
1 1 0 2 8 8 8
1 2 0 2 5 8 9
1 3 0 2 3 8 8
1 4 1 4 5 7 10
2 1 0 3 7 8 7
2 2 1 4 5 7 8
2 3 0 1 4 5 6
2 4 2 6 7 8 9
3 1 0 2 4 7 8
3 2 0 2 4 8 8
3 3 0 0 2 7 8
3 4 3 7 8 9 9
4 1 0 7 8 9 9
4 2 1 4 6 8 9
4 3 0 4 8 9 9
4 4 2 6 7 8 10
Content Surgeon 15 fps PL
1%
PL
3%
1 1 8 7 7
1 2 8 5 3
1 3 8 5 2
1 4 8 9 2
2 1 8 7 6
2 2 7 5 1
2 3 6 5 1
2 4 9 8 6
3 1 7 5 4
3 2 8 3 3
3 3 8 1 1
3 4 10 7 3
4 1 8 8 6
4 2 7 5 2
4 3 9 5 2
4 4 7 8 0

126
Appendix 2: Raw data, controlled experiment, laparoscopy
Content Surgeon 128
kbps
256
kbps
350
kbps
512
kbps
1000
kbps
1 1 3 6 3 7 7
1 2 4 3 6 7 8
1 3 1 4 3 6 7
1 4 3 6 7 7 8
2 1 3 2 4 6 9
2 2 0 4 5 6 8
2 3 3 3 4 6 7
2 4 5 6 7 8 9
3 1 3 5 5 6 9
3 2 1 5 4 8 8
3 3 1 5 5 9 9
3 4 7 9 9 10 10
4 1 0 3 4 8 9
4 2 0 2 5 7 8
4 3 0 1 5 5 8
4 4 2 8 8 10 10
Content Surgeon 12.5
fps
PL
1%
PL
3%
1 1 6 6 3
1 2 4 4 5
1 3 5 2 3
1 4 6 7 7
2 1 3 4 2
2 2 5 3 2
2 3 5 6 4
2 4 10 9 5
3 1 5 7 2
3 2 5 5 2
3 3 6 7 6
3 4 9 9 8
4 1 2 7 2
4 2 4 6 2
4 3 3 4 7
4 4 10 9 6
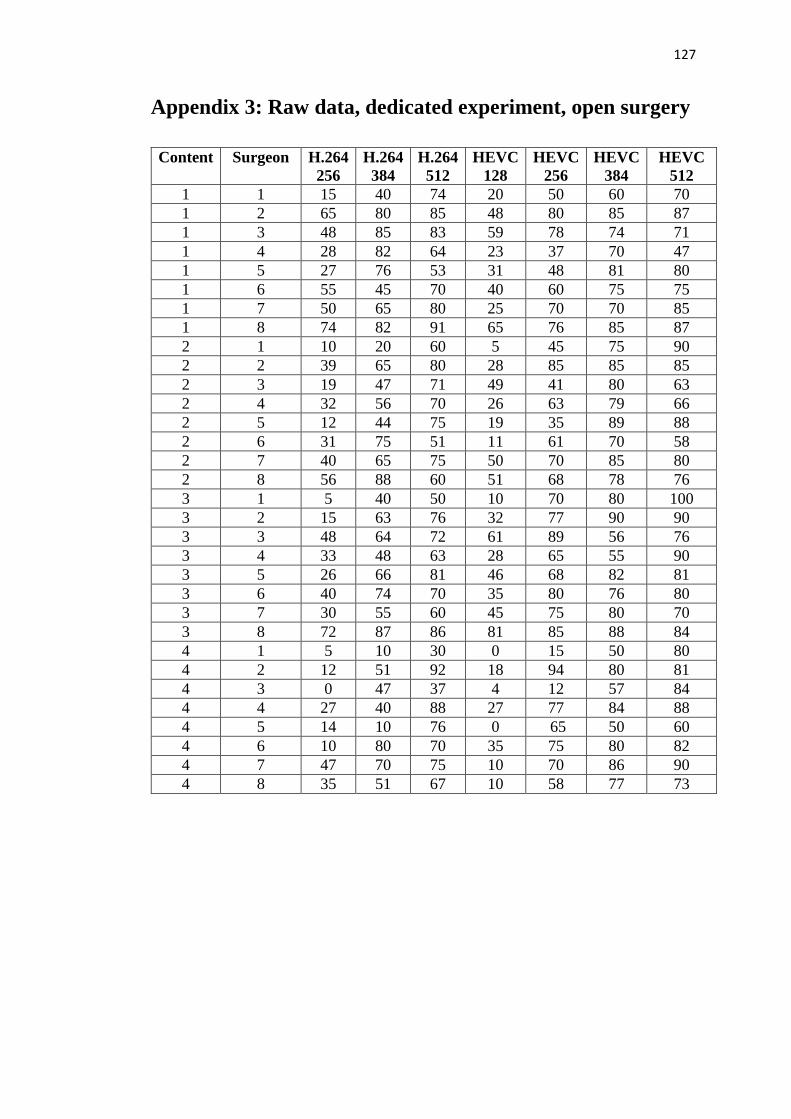
127
Appendix 3: Raw data, dedicated experiment, open surgery
Content Surgeon H.264
256
H.264
384
H.264
512
HEVC
128
HEVC
256
HEVC
384
HEVC
512
1 1 15 40 74 20 50 60 70
1 2 65 80 85 48 80 85 87
1 3 48 85 83 59 78 74 71
1 4 28 82 64 23 37 70 47
1 5 27 76 53 31 48 81 80
1 6 55 45 70 40 60 75 75
1 7 50 65 80 25 70 70 85
1 8 74 82 91 65 76 85 87
2 1 10 20 60 5 45 75 90
2 2 39 65 80 28 85 85 85
2 3 19 47 71 49 41 80 63
2 4 32 56 70 26 63 79 66
2 5 12 44 75 19 35 89 88
2 6 31 75 51 11 61 70 58
2 7 40 65 75 50 70 85 80
2 8 56 88 60 51 68 78 76
3 1 5 40 50 10 70 80 100
3 2 15 63 76 32 77 90 90
3 3 48 64 72 61 89 56 76
3 4 33 48 63 28 65 55 90
3 5 26 66 81 46 68 82 81
3 6 40 74 70 35 80 76 80
3 7 30 55 60 45 75 80 70
3 8 72 87 86 81 85 88 84
4 1 5 10 30 0 15 50 80
4 2 12 51 92 18 94 80 81
4 3 0 47 37 4 12 57 84
4 4 27 40 88 27 77 84 88
4 5 14 10 76 0 65 50 60
4 6 10 80 70 35 75 80 82
4 7 47 70 75 10 70 86 90
4 8 35 51 67 10 58 77 73
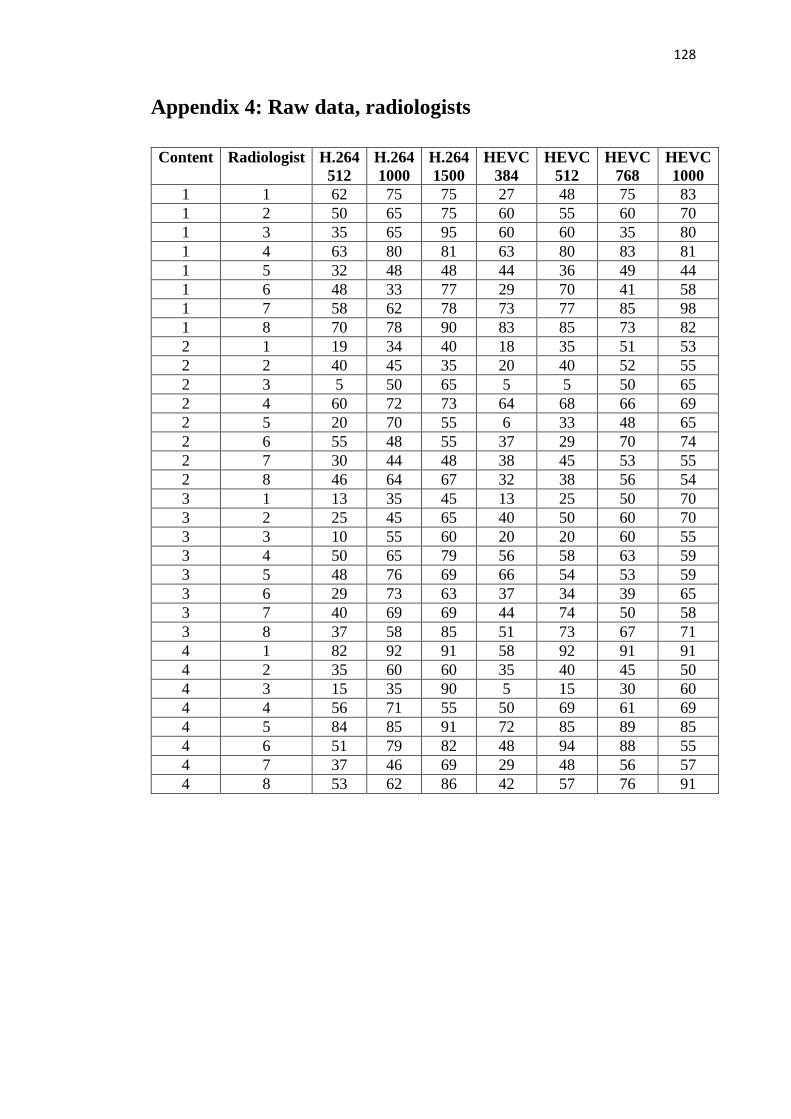
128
Appendix 4: Raw data, radiologists
Content Radiologist H.264
512
H.264
1000
H.264
1500
HEVC
384
HEVC
512
HEVC
768
HEVC
1000
1 1 62 75 75 27 48 75 83
1 2 50 65 75 60 55 60 70
1 3 35 65 95 60 60 35 80
1 4 63 80 81 63 80 83 81
1 5 32 48 48 44 36 49 44
1 6 48 33 77 29 70 41 58
1 7 58 62 78 73 77 85 98
1 8 70 78 90 83 85 73 82
2 1 19 34 40 18 35 51 53
2 2 40 45 35 20 40 52 55
2 3 5 50 65 5 5 50 65
2 4 60 72 73 64 68 66 69
2 5 20 70 55 6 33 48 65
2 6 55 48 55 37 29 70 74
2 7 30 44 48 38 45 53 55
2 8 46 64 67 32 38 56 54
3 1 13 35 45 13 25 50 70
3 2 25 45 65 40 50 60 70
3 3 10 55 60 20 20 60 55
3 4 50 65 79 56 58 63 59
3 5 48 76 69 66 54 53 59
3 6 29 73 63 37 34 39 65
3 7 40 69 69 44 74 50 58
3 8 37 58 85 51 73 67 71
4 1 82 92 91 58 92 91 91
4 2 35 60 60 35 40 45 50
4 3 15 35 90 5 15 30 60
4 4 56 71 55 50 69 61 69
4 5 84 85 91 72 85 89 85
4 6 51 79 82 48 94 88 55
4 7 37 46 69 29 48 56 57
4 8 53 62 86 42 57 76 91
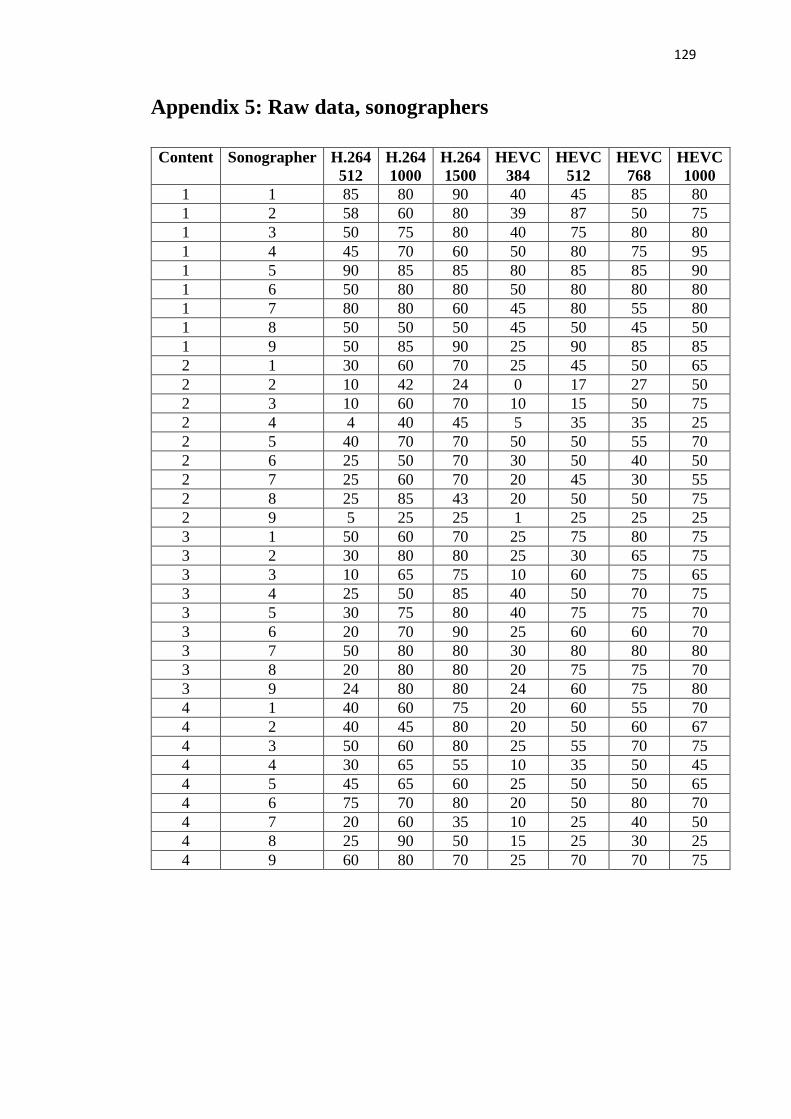
129
Appendix 5: Raw data, sonographers
Content Sonographer H.264
512
H.264
1000
H.264
1500
HEVC
384
HEVC
512
HEVC
768
HEVC
1000
1 1 85 80 90 40 45 85 80
1 2 58 60 80 39 87 50 75
1 3 50 75 80 40 75 80 80
1 4 45 70 60 50 80 75 95
1 5 90 85 85 80 85 85 90
1 6 50 80 80 50 80 80 80
1 7 80 80 60 45 80 55 80
1 8 50 50 50 45 50 45 50
1 9 50 85 90 25 90 85 85
2 1 30 60 70 25 45 50 65
2 2 10 42 24 0 17 27 50
2 3 10 60 70 10 15 50 75
2 4 4 40 45 5 35 35 25
2 5 40 70 70 50 50 55 70
2 6 25 50 70 30 50 40 50
2 7 25 60 70 20 45 30 55
2 8 25 85 43 20 50 50 75
2 9 5 25 25 1 25 25 25
3 1 50 60 70 25 75 80 75
3 2 30 80 80 25 30 65 75
3 3 10 65 75 10 60 75 65
3 4 25 50 85 40 50 70 75
3 5 30 75 80 40 75 75 70
3 6 20 70 90 25 60 60 70
3 7 50 80 80 30 80 80 80
3 8 20 80 80 20 75 75 70
3 9 24 80 80 24 60 75 80
4 1 40 60 75 20 60 55 70
4 2 40 45 80 20 50 60 67
4 3 50 60 80 25 55 70 75
4 4 30 65 55 10 35 50 45
4 5 45 65 60 25 50 50 65
4 6 75 70 80 20 50 80 70
4 7 20 60 35 10 25 40 50
4 8 25 90 50 15 25 30 25
4 9 60 80 70 25 70 70 75