a fluorescent imaging technique for quantifying …
TRANSCRIPT

Atomization and Sprays, 24 (4): 367–373 (2014)
A FLUORESCENT IMAGING TECHNIQUEFOR QUANTIFYING SPRAY DEPOSITS ONPLANT LEAVES
Daniel E. Martin
USDA-ARS Areawide Pest Management Research Unit, College Station,Texas 77845, USA; E-mail: [email protected]
Original Manuscript Submitted: 08/16/2013; Final Draft Received: 11/07/2013
Because of the unique characteristics of electrostatically-charged sprays, use of traditional methodshas failed to accurately quantify deposition from these sprays. A new fluorescent imaging techniquewas developed that quantifies spray deposits from electrostatically-charged sprays on natural plantleaves. Results indicate that this technique can successfully detect and enumerate individual spraydroplets on the underside of beet leaves. Further, this technique reveals the spatial distribution of thespray droplets. Researchers will be able to use this technique to quantify spray deposits on a multitudeof artificial and natural deposition samplers.
KEY WORDS: spray droplets, droplet count, spray application
1. INTRODUCTION
In order for agricultural spray applications to be effective, the correct size of spraydroplets must be applied to the intended target. The intended target may be a leaf, a fun-gal spore, or an insect. For many systemic herbicides, merely depositing several largedroplets on the top side of a leaf is sufficient for adequate control. However, for controlof many plant diseases or insects, the droplets must be smaller (less than 200µm) toachieve good coverage and must deposit on the underside of the leaves where the insectsor fungal spores often reside (Byrne and Bellows, 1991; O’Brien et al., 1993; Wilson,1993; Ebert and Cartwright, 1997).
Artificial and natural samplers are both used to evaluate deposition from spray appli-cation treatments. Typical artificial samplers that have been used in laboratory and fieldstudies include mylar sheets, water-sensitive papers, glass slides, strings, monofilamentlines, mesh screens, and plastic soda straws (Fritz et al., 2007; Martin et al., 2010). Nat-ural samplers include insects and plants, either whole or in part (e.g., leaves and stems).Fluorescent dyes often are added to the spray solution as tracers to confirm where thespray was applied and to quantify the amount deposited (MacIntyre-Allen et al., 2007).Mylar sheets are excellent for quantifying total spray deposition from conventional spray
1044–5110/14/$35.00 c© 2014 by Begell House, Inc. 367

368 Martin
applications by solvent extraction of fluorescent dye that has been uniformly mixed intothe spray solution. Water-sensitive papers do not require a fluorescent dye and can beprocessed with customized software to yield individual droplet data (Hoffmann and He-witt, 2005; Thomson and Lyn, 2011), but spoil easily at high humidity and do not capturesmall droplets (less than∼50 µm) very well. Plant leaves are natural samplers that canbe washed top and bottom with solvents to extract and quantify total fluorescent traceramounts (Carlton, 1992, 1996), but individual droplet data are difficult to extract fromthese samplers.
Conventional spray applications primarily rely on gravity to transport the spray tothe intended target. Electrostatically charged sprays use gravity and an electrostatic fieldto direct the spray to the target (Carlton et al., 1995). While artificial samplers workwell with conventional sprays, they can interfere with the deposition of electrostaticallycharged sprays. Sharp edges and corners on artificial samplers can induce a buildup ofcharge at those points. This buildup of charge can subsequently deter charged dropletsfrom depositing at those locations. In addition, the lack of an electrical ground for thesesamplers reduces the affinity of charged droplets to these samplers. Although manyplants have leaves with points and edges, the plants are grounded and provide excel-lent samplers because they are the actual intended target.
Since typical artificial samplers are not appropriate for sampling electrostaticallycharged sprays, natural plant materials must be used. However, current sampling tech-niques for plants only yield total spray deposition data. The study described herein de-tails how to quantify the number of individual droplets on plant leaves, and visualize thespatial distribution of spray droplets on these leaves.
1.1 Objectives
The objectives of this study were to:
1. Detect fluorescent dye droplets using digital fluorescence imaging.
2. Quantify the number of individual spray droplets on plant leaves.
3. Visualize the spatial distribution of spray droplets.
2. MATERIALS AND METHODS
2.1 Spray Application
A solution of tap water and daylight visible dye (10% v/v DayGlo Rocket Red, ECO-13,DayGlo Color Corp., Cleveland, OH) was charged to +10 kV using a custom powersupply, and applied at 483 kPa to mature beet plants at 45 cm above canopy usinga ground-based electrostatic spraying system (3D Surface Sanitizer, Spectrum Elec-trostatic Sprayers, Houston, TX) with a TXVK-3 spray tip (Spraying Systems Co.,
Atomization and Sprays
A Fluorescent Imaging Technique 369
Wheaton, IL). The spray was allowed to dry on the beet leaves for 10 min prior to col-lection. The leaves were placed in plastic zippered bags for transport to the laboratory.
2.2 Digital Imaging
The spray deposits on the underside of stemless beet leaves were imaged with an 8megapixel 4-CCD digital still camera (model F828, Sony Corporation, Tokyo, Japan)fitted with a 58 mm infrared filter (B&W Infracolor #099, Bad Kreuznach, Germany)and a fixed aperture setting of f5.6 and 1.0 s exposure time. Two 1.2 m blacklight bulbs(model F40BLB, General Electric, Fairfield, CT) placed 36 cm overhead illuminatedthe plant leaves. The camera was secured to a tripod with the lens positioned 48 cmabove the target leaves. The matte black platform was cleaned after imaging each leaf toremove residual traces of fluorescent dye.
2.3 Image Processing
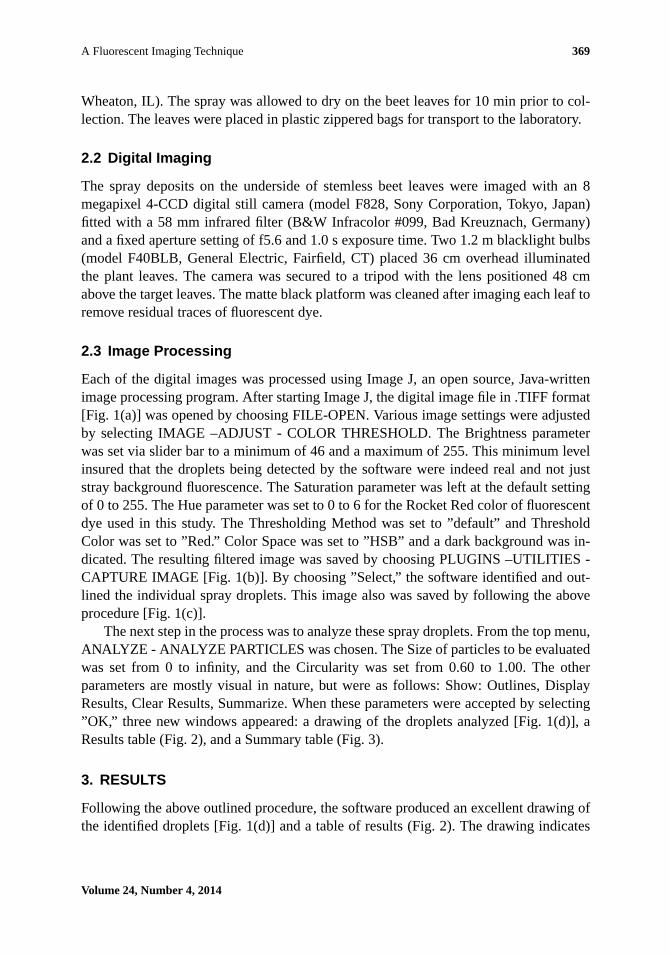
Each of the digital images was processed using Image J, an open source, Java-writtenimage processing program. After starting Image J, the digital image file in .TIFF format[Fig. 1(a)] was opened by choosing FILE-OPEN. Various image settings were adjustedby selecting IMAGE –ADJUST - COLOR THRESHOLD. The Brightness parameterwas set via slider bar to a minimum of 46 and a maximum of 255. This minimum levelinsured that the droplets being detected by the software were indeed real and not juststray background fluorescence. The Saturation parameter was left at the default settingof 0 to 255. The Hue parameter was set to 0 to 6 for the Rocket Red color of fluorescentdye used in this study. The Thresholding Method was set to ”default” and ThresholdColor was set to ”Red.” Color Space was set to ”HSB” and a dark background was in-dicated. The resulting filtered image was saved by choosing PLUGINS –UTILITIES -CAPTURE IMAGE [Fig. 1(b)]. By choosing ”Select,” the software identified and out-lined the individual spray droplets. This image also was saved by following the aboveprocedure [Fig. 1(c)].
The next step in the process was to analyze these spray droplets. From the top menu,ANALYZE - ANALYZE PARTICLES was chosen. The Size of particles to be evaluatedwas set from 0 to infinity, and the Circularity was set from 0.60 to 1.00. The otherparameters are mostly visual in nature, but were as follows: Show: Outlines, DisplayResults, Clear Results, Summarize. When these parameters were accepted by selecting”OK,” three new windows appeared: a drawing of the droplets analyzed [Fig. 1(d)], aResults table (Fig. 2), and a Summary table (Fig. 3).
3. RESULTS
Following the above outlined procedure, the software produced an excellent drawing ofthe identified droplets [Fig. 1(d)] and a table of results (Fig. 2). The drawing indicates
Volume 24, Number 4, 2014
370 Martin
(a) (b)
(c) (d)
FIG. 1: Droplets containing fluorescent dye applied to the underside of a beet leaf by anelectrostatic sprayer: (a) original digital image, (b) digitally thresholded image, (c) imagewith droplets outlined, and (d) computer drawing of selected droplets with backgroundremoved.
the droplets selected for analysis and allows the user to assess the spatial distributionof those droplets. The table displays droplet data for each individual droplet identifiedand measured. Results outputted include a unique droplet number, the projected area ofthe droplets (in user-selected units), the average droplet dimension, and the minimumand maximum droplet dimensions. In addition, the software also produced a summarydata table (Fig. 3). This table summarizes the data for each image analyzed. It reportsthe image name, the total number of droplets analyzed, the total projected area and theaverage projected area of those droplets, the percent area of the image that the dropletsoccupy, and the average droplet size for all droplets measured. The user has the optionof saving these tables for further data or statistical analysis.
For the particular study at hand, the software detected 1201 droplets on the undersideof this particular leaf. By running the leaf through a leaf area meter, the droplet density, in
Atomization and Sprays

A Fluorescent Imaging Technique 371
FIG. 2: Abridged results table output from analysis of droplets. Table shows sequentialdroplet number as assigned by Image J, area of droplet (in user-selected units), mean,minimum, and maximum droplet dimensions.
FIG. 3: Summary table output from analysis of droplets. Table shows the image thatwas analyzed, the total number of droplets, the total area those droplets occupied, theaverage size of the droplets (in user-selected units), the percent area of the image thatthe droplets occupied, and the mean droplet size.
drops/cm2, could be calculated and compared to the droplet density of the other spray ap-plication treatments. In addition, it could be seen from Fig. 1(c) that the charged dropletscovered more of the interior and perimeter of the underside of the leaves, whereas thedroplets from the uncharged treatments tended to reside around just the perimeter of theunderside of the leaf.
Volume 24, Number 4, 2014
372 Martin
4. CONCLUSIONS
The imaging technique described herein provided excellent quantification of spray drop-lets on plant leaves and visualizing their spatial distribution. Other spray depositionanalysis techniques, using both natural and artificial samplers, have been proven forconventional spray applications, but do not provide individual droplet data for naturalplant samples and may skew sampling of electrostatically charged sprays because of thebuildup of electrostatic fields at sharp points on the samplers. This technique fills thatvoid for electrostatic aerial spray application but has its limitations also. Namely, forthis technique to be successful, the spray droplets must be unique and distinct from oneanother. Since relatively few droplets typically deposit on the underside of plant leaves,this technique is ideal for this situation. The leaf surface or target of interest also needsto be as flat or two-dimensional as possible. This makes it easier for all of the dropletsin the image to be in focus at one time. In addition, this technique requires relativelycontrolled conditions for imaging. Field imaging would be possible, but proper lightingand focus would be critical. Although the objective of this work focused on electrostaticagricultural spray applications, the technique presented may be broadly applicable toother areas such as spray coatings, printing, and food sanitation. Future work would in-clude quantification of the spatial distribution of the deposited droplets and methods offluorescent imaging three-dimensional targets.
ACKNOWLEDGMENTS
The author thanks Spectrum Electrostatics for use of a handheld electrostatic sprayer,and Mr. Chris Parker for his valuable assistance in collecting and compiling the data.
REFERENCES
Byrne, D. N. and Bellows, Jr., T. S., Whitefly biology,Ann. Rev. Entomol., vol. 36, no. 1, pp.431–457, 1991.
Carlton, J. B., Simple techniques for measuring spray deposits in the field-II: Dual side leafwasher, ASAE Paper No. 921618, ASAE, St. Joseph, MI, 1992.
Carlton, J. B., Bouse, L. F., and Kirk, I. W., Electrostatic charging of aerial spray over cotton,Trans. ASAE, vol. 38, no. 6, pp. 1641–1645, 1995.
Carlton, J. B., Dual-Side Plant Leaf Washer and Immersion Cell, USA, 1996.
Ebert, T. A. and Cartwright, B., Biology and ecology of Aphis gossypii Glover (Homoptera:Aphididae),Southwest. Entomol., vol. 22, no. 1, pp. 116–153, 1997.
Fritz, B. K., Hoffmann, W. C., Martin, D. E., and Thomson, S. J., Aerial application methods forincreasing spray deposition on wheat heads,Appl. Eng. Agric., vol. 23, no. 6, pp. 709–715,2007.
Hoffmann, W. C. and Hewitt, A. J., Comparison of three imaging systems for water-sensitivepapers,Appl. Eng. Agric.,vol. 21, no. 6, pp. 961–964, 2005.
Atomization and Sprays
A Fluorescent Imaging Technique 373
MacIntyre-Allen, J. K., Tolman, J. H., Scott-Dupree, C. D., and Harris, C. R., Confirmationby fluorescent tracer of coverage of onion leaves for control of onion thrips using selectednozzles, surfactants and spray volumes,Crop Protection, vol. 26, no. 1, pp. 1625–1633, 2007.
Martin, D. E., Lopez Jr, J. D., Lan, Y., Fritz, B. K., and Hoffmann, W. C., Novaluron as an ovicidefor bollworm on cotton: Deposition and efficacy of field-scale aerial applications,J. CottonScience,vol. 14, no. 2, pp. 99–106, 2010.
O’Brien, P. J., Stoetzel, M. B., Navasero, R. C., and Graves, J. B., Field biology studies of thecotton aphid,Aphis gossypiiGlover,Southwest. Entomol., vol. 18, no. 1, pp. 25–35, 1993.
Thomson, S. J. and Lyn, M. E., Environmental and spray mixture effects on droplet size repre-sented by water-sensitive paper used in drift studies,Trans. ASABE,vol. 54, no. 3, pp. 803–807, 2011.
Wilson, L. J., Spider mites (Acari: Tetranychidae) affect yield and fiber quality of cotton,J. Econ.Entomol., vol. 86, no. 2, pp. 566–585, 1993.
Volume 24, Number 4, 2014