analyses of the mechanisms of amplitude modulation of aero ... · analyses of the mechanisms of...
TRANSCRIPT

General rights Copyright and moral rights for the publications made accessible in the public portal are retained by the authors and/or other copyright owners and it is a condition of accessing publications that users recognise and abide by the legal requirements associated with these rights.
Users may download and print one copy of any publication from the public portal for the purpose of private study or research.
You may not further distribute the material or use it for any profit-making activity or commercial gain
You may freely distribute the URL identifying the publication in the public portal If you believe that this document breaches copyright please contact us providing details, and we will remove access to the work immediately and investigate your claim.
Downloaded from orbit.dtu.dk on: May 26, 2020
Analyses of the mechanisms of amplitude modulation of aero-acoustic wind turbinesound
Fischer, Andreas; Aagaard Madsen , Helge; Kragh, Knud Abildgaard; Bertagnolio, Franck
Published in:Proceedings of European Wind Energy Association Conference and Exhibition 2014
Publication date:2014
Document VersionPublisher's PDF, also known as Version of record
Link back to DTU Orbit
Citation (APA):Fischer, A., Aagaard Madsen , H., Kragh, K. A., & Bertagnolio, F. (2014). Analyses of the mechanisms ofamplitude modulation of aero-acoustic wind turbine sound. In Proceedings of European Wind EnergyAssociation Conference and Exhibition 2014 European Wind Energy Association (EWEA).

Analyses of the mechanisms of amplitude modulation
of aero-acoustic wind turbine sound
Andreas Fischer1, Helge Aagaard Madsen1, Knud Abildgaard Kragh1
and Franck Bertagnolio1
1 Department for Wind Energy, Technical University of Denmark, Frederiksborgvej 399,DK-4000 Roskilde
E-mail: [email protected]
Abstract. This paper explores the source mechanism which cause amplitude modulation ofthe emitted sound of a wind turbine at large distances from the turbine, named as otheramplitude modulation. Measurements of the fluctuating surface pressure on a 2.3MW windturbine showed a considerable variation over a blade revolution in the presence of angle ofattack variations. If the blade undergoes transient stall, the variation of the surface pressurespectrum was enhanced and shifted to frequencies below 200Hz. The surface pressure spectracould be directly related to the emitted far field sound. These findings give further evidencethat transient stall is a main mechanism to cause other amplitude modulation. Wind shear wasidentified as a critical condition to cause angle of attack variations. Different control strategiesto mitigate other amplitude modulation were proposed.
1. IntroductionThe noise emitted from wind turbines and wind parks is an important issue for the developmentof onshore wind energy. The complaints about noise of people living close by wind turbines havebecome more numerous in the recent years. Today wind farms have to be operated in deratedmodes to limit noise emission or in extreme cases even to be shut down to avoid the disturbanceof neighbours. And for the development of new projects the noise emission is often a limitingfactor.Wind turbine noise is perceived as even more annoying if the amplitude of the emitted soundmodulates. A recently published study by RenewableUK [1] distinguishes between two types ofamplitude modulation: normal amplitude modulation (NAM) and other amplitude modulation(OAM). NAM is characterised as a swishing sound which is perceived by a ground based observerat a distance of one or two rotor diameter. In this case trailing edge noise of the blade is themain noise source on the rotor. Due to the directivity of trailing edge noise most of the sound isradiated towards the leading edge and the observer hears the swish when the blade moves towardshim. The swishing sound is broad band with a frequency band width ranging approximatelyfrom 400Hz to 1000 or 2000Hz. Normally this kind of amplitude modulation is not problematic,because at the typical distance between dwellings and wind farms it cannot be perceived.OAM is described as a thumping sound with high intensity in the low frequency range below200Hz. It can be perceived in up and down wind direction at a distance of several kilometresaway from the turbine. This kind of amplitude is much more a problem, because it is perceived by

neighbours of the wind farm/turbine. The study [1] named transient stall as possible explanationfor OAM. But the conclusion were based on theoretical considerations. The present paperdelivers experimental evidence that transient stall causes a significant amplitude modulation ofthe surface pressure close to the trailing edge of the blade which is the source of the emittedsound.The first section of the paper outlines a full scale wind turbine experiment. In this experimentthe surface pressure fluctuations, inflow vector to the blade and the mean pressure distributionwere monitored. In the next section, the surface pressure field is related to the emitted farfield sound. These result were obtained from an experiment in an anechoic wind tunnel. In thefollowing section wind conditions which lead to the variation of the surface pressure field over arevolution are identified. In the final section control strategies to mitigate OAM are explored.
2. Surface Pressure field on a MW wind turbineThe DAN-AERO MW project was funded by the Danish Energy Research programme EFP-2007 under contract Journal no. 33033-0074. The project was carried out in the period fromMarch 2007 to December 2009 in corporation between DTU Wind Energy and the companiesLM Wind Power, Vestas Wind Systems, Siemens Wind Power and DONG Energy. More detailsof the project are presented in [2].
2.1. Setup of the Field experimentOne blade of the three bladed NEG-Micon NM80 turbine was heavily equipped withmeasurement sensors. The turbine has a rotor diameter of 80m and the hub height is 57m,the rated power is 2.3MW. The blade contained pressure tabs at radial position r=13m, 19m,30m and 37m and four five-hole pitot tubes at radial position r=14.5m, 20.3m, 31m and 36m,figure 1(a). At radial position r=37m, microphones to measure the pressure fluctuations were
(a) NM80 turbine (b) Map of the wind farm
Figure 1. The blade of the NM80 turbine equipped with measurement devices and themap of the wind farm in Tjæreborg Enge. NM80: NM80 turbine, WT: wind turbine, MM:meteorological mast.
distributed along the chord. The microphone on the suction side of the blade which was closedto the trailing edge was located at position x/c=0.84.The turbine was placed in a small wind farm of 8 turbines at Tjæreborg Enge, about 1kmaway from the west coast of Jutland, Denmark, figure 1(b). A meteorological mast was situatedabout half way between the two turbines south-west of the NM80. The mast was equippedwith cup anemometers and wind vanes at a height of 17m, 28.5m, 41m, 57m, 77m and 93m to

provide wind speed and direction measurements. Additionally there were 3 sonic anemometersat altitude 17m, 57m and 93m. They provided measurements of the three components of thewind vector.The wind turbine was operated in an rather unusual way in the selected cases. The blades werepitched to a high negative angle (−4.5◦) to cause transient blade stall. It ran with constantrotational speed 16.23rpm. The wind speed at hub height was rather high, about 12m/s.
2.2. Blade Inflow and Surface Pressure FieldThe wind profiles measured as ten minutes average at the meteorological mast for the twoexamples from September 1st, 2009 are depicted in figure 2. In both examples the wind speed
6 7 8 9 10 11 12 1310
20
30
40
50
60
70
80
90
100
110
altit
ude
[m]
velocity [m/s]
met mast mean wind speed
cupsonicHAWC2 pl
roto
r di
sc d
imen
sion
(a) 10:00
7 8 9 10 11 12 13 14 1510
20
30
40
50
60
70
80
90
100
110
altit
ude
[m]
velocity [m/s]
met mast mean wind speed
cupsonicHAWC2 pl
roto
r di
sc d
imen
sion
(b) 11:40
Figure 2. Wind profile measured at a met mast close to the turbine on Sept. 1st, 2009 (10minutes average).
at hub height is high and the wind profile can be approximately described by a power law withexponent 0.3. At 11:40 the wind profile is not well described by the power law, because aninternal boundary layer had built up. Hence, the shear over the rotor disc is less than for apower law with exponent 0.3, but the wind speed at hub height is higher than in the exampleat 10:00.The angle of attack (AoA) for the two cases is presented in figure 3. The AoA was derived from
0 2 4 6 8 106
7
8
9
10
11
12
time t [s]
angl
e of
atta
ck α
[deg
]
(a) 10:00
0 2 4 6 8 108
9
10
11
12
13
14
time t [s]
angl
e of
atta
ck α
[deg
]
(b) 11:40
Figure 3. Measured angle of attack at radial position r = 31m. red dots: half second averages.
the measured inflow angle. The inflow angle was corrected for the effects of the bending of the
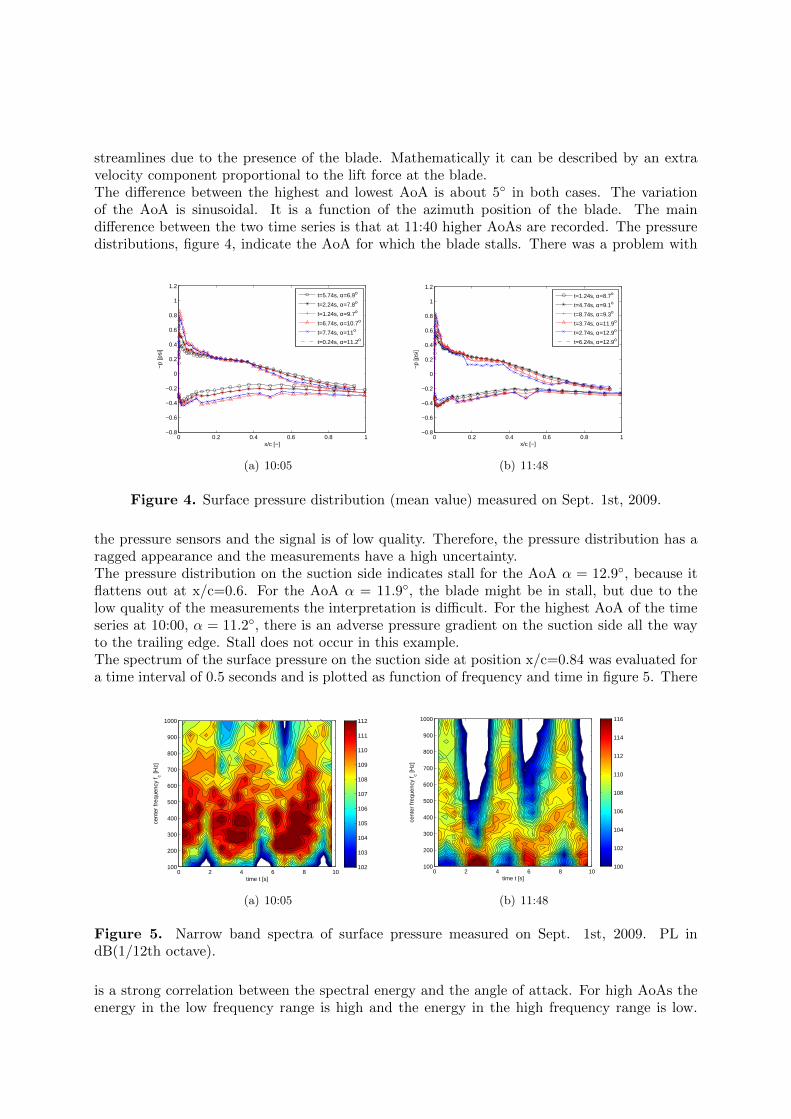
streamlines due to the presence of the blade. Mathematically it can be described by an extravelocity component proportional to the lift force at the blade.The difference between the highest and lowest AoA is about 5◦ in both cases. The variationof the AoA is sinusoidal. It is a function of the azimuth position of the blade. The maindifference between the two time series is that at 11:40 higher AoAs are recorded. The pressuredistributions, figure 4, indicate the AoA for which the blade stalls. There was a problem with
0 0.2 0.4 0.6 0.8 1−0.8
−0.6
−0.4
−0.2
0
0.2
0.4
0.6
0.8
1
1.2
x/c [−]
−p
[psi
]
t=5.74s, α=6.9o
t=2.24s, α=7.8o
t=1.24s, α=9.7o
t=6.74s, α=10.7o
t=7.74s, α=11o
t=0.24s, α=11.2o
(a) 10:05
0 0.2 0.4 0.6 0.8 1−0.8
−0.6
−0.4
−0.2
0
0.2
0.4
0.6
0.8
1
1.2
x/c [−]
−p
[psi
]
t=1.24s, α=8.7o
t=4.74s, α=9.1o
t=8.74s, α=9.3o
t=3.74s, α=11.9o
t=2.74s, α=12.9o
t=6.24s, α=12.9o
(b) 11:48
Figure 4. Surface pressure distribution (mean value) measured on Sept. 1st, 2009.
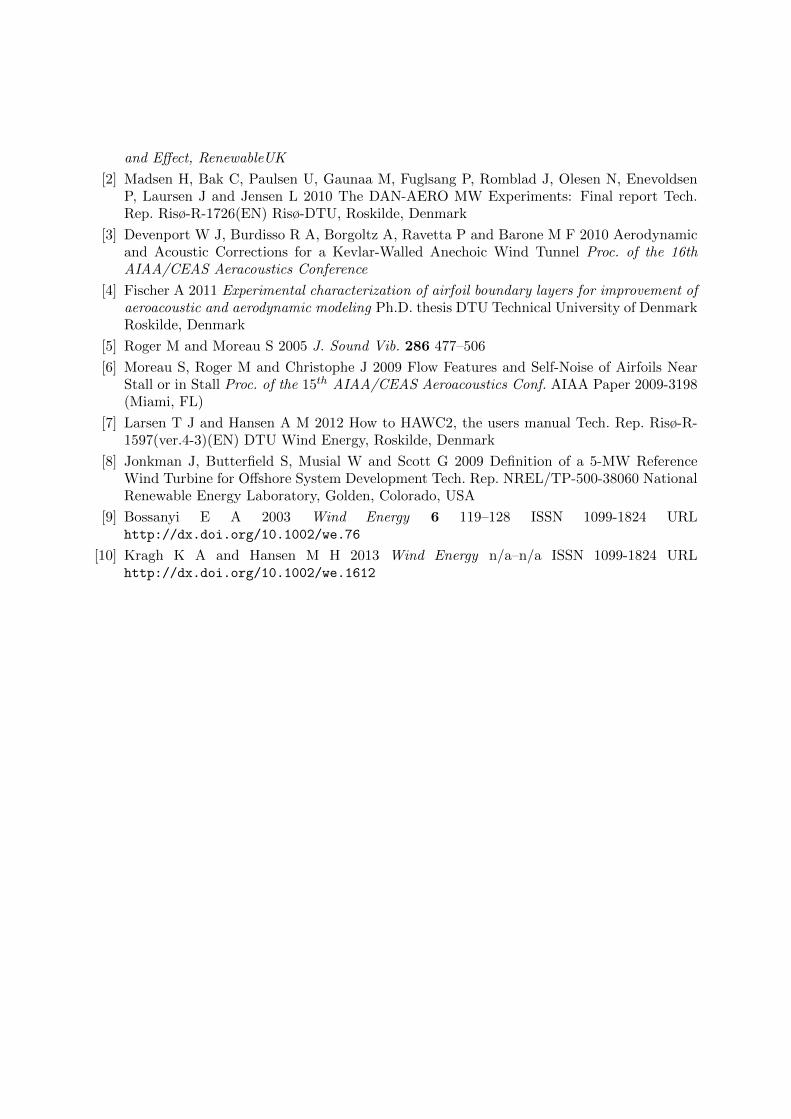
the pressure sensors and the signal is of low quality. Therefore, the pressure distribution has aragged appearance and the measurements have a high uncertainty.The pressure distribution on the suction side indicates stall for the AoA α = 12.9◦, because itflattens out at x/c=0.6. For the AoA α = 11.9◦, the blade might be in stall, but due to thelow quality of the measurements the interpretation is difficult. For the highest AoA of the timeseries at 10:00, α = 11.2◦, there is an adverse pressure gradient on the suction side all the wayto the trailing edge. Stall does not occur in this example.The spectrum of the surface pressure on the suction side at position x/c=0.84 was evaluated fora time interval of 0.5 seconds and is plotted as function of frequency and time in figure 5. There
time t [s]
cent
er fr
eque
ncy
f c [Hz]
0 2 4 6 8 10100
200
300
400
500
600
700
800
900
1000
102
103
104
105
106
107
108
109
110
111
112
(a) 10:05
time t [s]
cent
er fr
eque
ncy
f c [Hz]
0 2 4 6 8 10100
200
300
400
500
600
700
800
900
1000
100
102
104
106
108
110
112
114
116
(b) 11:48
Figure 5. Narrow band spectra of surface pressure measured on Sept. 1st, 2009. PL indB(1/12th octave).
is a strong correlation between the spectral energy and the angle of attack. For high AoAs theenergy in the low frequency range is high and the energy in the high frequency range is low.

For small AoAs the opposite is the case. The energy in the high frequency range is stronglydampened when sound propagates. Hence, the energy contents in the low frequency range isof concern in this investigation. In the measurement at 10:05 the strongest modulation of thesurface pressure over time is found in the frequency range between 200Hz and 500Hz. The peakto peak level is about 8dB. Such a source modulation does probably not lead to OAM, becausefrequencies above 200Hz are still considerably dampened over such a distance. Additionally, theamplitude modulation of the far field sound is much smaller than the amplitude modulation ofthe surface pressure on one blade, because the maxima of the source on the three blades areseparated in phase by 120◦.In the measurement at 11:48 an amplitude modulation of the surface pressure of 16dB in thefrequency range below 150Hz can be detected. Comparing to the analysis above, the maxima ofthe spectral energy in the low frequency range can be related to blade stall. The source variationis much stronger and more low frequency than in the measurements at 10:05. It is probable thatsuch an amplitude modulation of the surface pressure leads to OAM.
3. The relation between the surface pressure field and the far field soundIn the full scale experiment only surface pressure measurements were available. The relationbetween the far field sound pressure and the surface pressure needs to be established. In thispaper, we use simultaneous measurements of the surface pressure and far field sound made inan acoustic wind tunnel.
3.1. Wind Tunnel ExperimentThe measurements presented in this section were made in the acoustic wind tunnel of VirginiaTech University [3] (VTST). The VTST is a classical closed loop wind tunnel. The test sectionhas a cross sectional area of 1.8 times 1.8m and a maximum velocity of 75m/s can be reached.The aerofoil model has a chord length of 0.6m. The Reynolds number range of the experimentwas 1 to 2 million. The test section of the VTST is surrounded by an anechoic chamber andthe test section walls parallel to the plane of the aerofoil model are made of Kevlar and aretransparent for sound, but contain the mean flow, figure 6. Behind the Kevlar walls at a distance
Figure 6. The acoustic test sectionof the VTST.
of about 1.5m to the aerofoil a microphone array is situated. It consists of 116 microphones andthe diameter of the disc is 1.1m.The aerofoil shape is a NACA64-618 and the model is equipped with microphones connected tothe surface of the aerofoil. A tubing system made it possible to place microphones at a distanceof only 15mm away from the trailing edge. The pressure field in spanwise and chordwise directionwas measured with this surface pressure microphone array. Further details of the experimentare found in [4].

3.2. Noise emission for attached flow conditionsWhen the flow over the aerofoil is attached, trailing edge noise is the dominant noise sourcein the experiment and the far field sound pressure can be predicted with the measurements ofthe surface pressure field and trailing edge noise theory. We chose the trailing edge noise modeldescribed in [5] for this task. The comparison between the microphone array measurements ofthe far field sound pressure and the predictions are shown in figure 7. Detailed measurements of
102
103
104
20
25
30
35
40
45
50
55
60
center frequency f [Hz]
far
field
sou
nd s
pect
rum
Spp
[dB
1/12
]
αE=−0.88o
αE=0.93o
αE=2.77o
αE=6.52o
mic. array
Figure 7. Far field sound pressurespectrum of the NACA64-618 aero-foil measured in the Virginia Techwind tunnel at Reynolds number1.5 · 106.
the surface pressure field were only available on the suction side. The pressure side contributionis therefore ignored in the prediction. At high AoAs (α = 6.52◦), the pressure side contributionis negligible and the prediction is in agreement with the microphone array measurements. Forthe lower AoAs the pressure side contribution is in the same order of magnitude as the suctionside contribution. Therefore the predicted values are up to 3dB to low. It results in slightlylower values than the microphone array measurements.Overall the agreement between prediction and microphone array is very good and the trendsfor AoA changes are the same. This proves the direct relation of the measured surface pressurefield and the far field sound pressure.
3.3. Noise emission from aerofoils in stallIf the aerofoil is in stall, the mechanism for generating sound is different. Theoretical modelsfor the far field sound prediction exist, for example [6], but have not been implemented yet. Forthe present study it is sufficient to show a direct correlation between the surface pressure fieldand the far field sound when the aerofoil is in stall.In figure 8 the surface pressure spectrum close to the trailing edge and the far field soundpressure spectrum of the aerofoil for Reynolds number 1.9 million are presented. The threedifferent AoAs in figure 8 represent three different flow regimes: attached flow for α = 6.27◦,the beginning of flow separation close to the trailing edge, α = 8.23◦, and deep stall with flowseparation at the leading edge, α = 12.21◦. Comparing the attached flow situation with thetwo stall cases, the far field noise in proportion to the surface pressure increases. But for thetwo cases in stall the far field sound pressure is in the same proportion to the surface pressure.Therefore we can conclude that the surface pressure on a wind turbine blade can be used toempirically characterise the far field sound even when stall occurs on the blade.
4. Wind conditions and rotor inflowIn section 2 it was shown that the amplitude modulation of the surface pressure is directly linkedto AoA variations during a blade revolution. However, the wind turbine operated in an unusualmode. Hence, the measured inflow angle variations are not representative for MW wind turbines

102
103
104
65
70
75
80
85
90
95
100
105
110
115
center frequency f [Hz]
surf
ace
pres
sure
spe
ctru
m S
pp [d
B1/
12]
αE=6.27o
αE=8.23o
αE=12.21o
(a) Surface Pressure at x/c=0.975
102
103
104
30
35
40
45
50
55
60
center frequency f [Hz]
far
field
sou
nd s
pect
rum
Spp
[dB
1/12
]
αE=6.27o
αE=8.23o
αE=12.21o
(b) Far Field Sound Pressure
Figure 8. Pressure spectra for several AoAs of the NACA64-618 aerofoil measured in theVirginia Tech wind tunnel at Reynolds number 1.9 · 106.
in normal operation. In this section flow conditions leading to AoA variations for normal windturbine operation are identified.
4.1. Setup of second field experimentAlso as part of the DANAERO experiment, a Siemens 3.6MW wind turbine was equipped witha five hole pitot tube to measure the inflow to the blade, figure 9. The pitot tube was located at
(a) Siemens 3.6 MWWind Turbine
(b) Blade section with pitot tube
Figure 9. The five hole pitot tube mounted at radius 36 m on the blade in a distance of about0.80 m in front of the leading edge of the blade of a 3.6MW Siemens Wind Turbine.
radial position r=36m, corresponding to 63% of the blade radius. The turbine was located onthe Høvsøre test site. On this site there are five stands for MW wind turbines separated by adistance of 300m. Close to each stand a meteorological mast is situated. It measures the windspeed and direction at the altitudes 10m, 40m, 60m, 80m, 100m and 116m.
4.2. Wind shear and inflow angle variationsThe wind condition measurements on March 28, 2007 are presented in figure 10(a). On this dayvery stable conditions during the night led to a strong wind shear. During the day turbulent

(a) Wind profile (b) Inflow
Figure 10. Measurement of the wind profile and inflow on March 28, 2007.
mixing increased and the velocity profile is close to uniform. The change happened between 4and 11 o’clock.The variations of the measured inflow angle, figure 10(b), are directly linked to the wind shear.At 4 o’clock the variations of the inflow angle over a rotation is almost 10◦. When the inflowprofile becomes uniform at 11 o’clock the variation of the inflow angle is less than 1◦.However, the variations of the measured inflow angle are larger than the variations of the AoAwhich is more significant for the aerofoil performance. The AoA can be computed from theinflow angle if the lift of the aerofoil section is known. This information was not available in thepresented case. Therefore computations with the aeroelastic code HAWC2 [7] were performedand the AoA was converted to the inflow angle and compared to the measurements. To setup the computations the measured shear profiles were linearised, figure 11(a). The computed
(a) Wind profiles (b) Inflow angle
Figure 11. Wind shear profiles and inflow angle variation as function of linearised shear.
inflow angles match well with the measured ones. The difference might be due to wind veer.The measurements of the met mast show a variation of the wind direction over the rotor disc ofabout 20◦. Wind veer is not modelled in the computation.However, due to the good agreement of the computed and measured inflow angle we concludethat the AoA variations are predicted correctly by HAWC2. Hence, for the highest measuredshear a variation of the AoA over a revolution is about 4◦.

5. Control Strategies to mitigate OAMThe control strategies aim on avoiding transient stall. This can be done by operating the bladeat lower AoAs and thereby increasing the margin to the stall angle or by decreasing the AoAvariations over a revolution. The first strategy can be achieved with a conventional collectivepitch controller. For the second option, individual pitch control (IPC) or yaw control is necessary.
5.1. Collective pitch controlThe mean AoA at below rated operation can be decreased if the minimum pitch value isincreased. The possibilities of decreasing the mean AoA by increasing the minimum pitch angleare investigated by calculating the steady state mean AoA and power production for the NREL5MW reference turbine [8] using HawcStab2, figure 12. HawcStab2 is an aeroelastic stability
0 5 10 15 20 250.1
0.2
0.3
0.4
0.5
0.6
0.7
0.8
0.9
1
1.1
Mean wind speed [m/s]
AoA
Fra
ctio
n [−
]
Min Pitch: 0 degMin Pitch: 1 degMin Pitch: 2 degMin Pitch: 3 degMin Pitch: 4 degMin Pitch: 5 deg
0 5 10 15 20 250.82
0.84
0.86
0.88
0.9
0.92
0.94
0.96
0.98
1
1.02
Mean wind speed [m/s]
Pow
er F
ract
ion
[−]
Min Pitch: 0 degMin Pitch: 1 degMin Pitch: 2 degMin Pitch: 3 degMin Pitch: 4 degMin Pitch: 5 deg
Figure 12. Steady state mean AoA and power production as a function of wind speed whendifferent minimum pitch angles are specified for the variable speed controller. The results arenormalised with the mean AoA and power production at a minimum pitch angle of 0◦.
simulation tool developed at DTU Wind Energy.The results have been normalised with the mean AoA and power production a 0◦ minimumpitch. From this figure it is evident that it is possible to achieve large reductions of the meanAoA and thus operate further away from the stall region. However, it is also seen that thesereductions are obtained at the expense of decreased power production.
5.2. Individual pitch controlSimulation for the NREL 5MW reference turbine were performed with the HAWC2 code. An IPCsimilar to the one described in [9] was implemented in the code. The controller was designed toalleviate azimuthally varying loads, but it is likely to also lower the AoA variations. The resultsfor AoA variations and power production are shown in figure 13. For the uniform inflow, it isseen that the AoA variations are only reduced slightly, because they are small for a uniforminflow. Furthermore, it is seen that for the uniform inflow, the AoA variations are actuallyincreased by the IPC at wind speeds below 8 m/s. This increase is caused by the IPC that seeksto mitigate blade root bending moment variations. At low wind speeds and uniform inflow theblade root bending moment variations are caused by the gravitational loading on the blades.The gravitationally induced blade loads are mitigated by pitch actuation in phase with the AoAvariations, which hereby are increased. For the sheared inflow, it is seen that the AoA variationsare significantly lowered at both above and below rated wind speeds. The IPC applied in thisstudy is a standard IPC for load mitigation. It is possible that even larger reductions of theAoA variations could be achieved using on-blade inflow measurements and a controller designfor AoA variation mitigation.

4 6 8 10 12 14 16 18 20 220.9
1
1.1
1.2
1.3
1.4
1.5
Mean wind speed at hub height [m/s]
∆αIP
C/∆
αCol
[−]
(a) Uniform Inflow, AoA variations
4 6 8 10 12 14 16 18 20 220.996
0.9965
0.997
0.9975
0.998
0.9985
0.999
0.9995
1
1.0005
Mean wind speed at hub height [m/s]
∆ P
IPC
/∆ P
Col
[−]
(b) Uniform Inflow, mean power
4 6 8 10 12 14 16 18 20 220.45
0.5
0.55
0.6
0.65
0.7
0.75
Mean wind speed at hub height [m/s]
∆αIP
C/∆
αCol
[−]
(c) Sheared Inflow exp=0.5, AoA variations
4 6 8 10 12 14 16 18 20 220.94
0.95
0.96
0.97
0.98
0.99
1
1.01
Mean wind speed at hub height [m/s]
∆ P
IPC
/∆ P
Col
[−]
(d) Sheared Inflow exp=0.5, mean power
Figure 13. Fraction between the magnitude of the AoA variations and fraction between thethe mean power for the collective pitch controlled turbine and the individual pitch controlledturbine.
The costs of applying the IPC are increased pitch actuation rates and lowered power output.The greatest power loss is observed for low wind speeds (0.35% for uniform inflow and 5.5% forthe sheared inflow). At above rated wind speeds there is no power loss due to the IPC. However,in most cases the power loss is below 1%.
5.3. Yaw controlYaw control can also be applied for load alleviation [10] by minimising the AoA variation over arevolution. This effect is explored through simulations of the NREL 5MW turbine. Figure 14(a)shows results from a number of simulations where the yaw misalignment angle is varied at oneparticular wind speed. It is seen that a yaw misalignment angle can be found that minimizesthe range of the angle of attack variations. Such an optimum yaw misalignment angle can befound for all wind speeds.The fraction between the mean power with the optimal yaw misalignment applied and the meanpower at 0◦ yaw misalignment is displayed in figure 14(b). It is seen that the power is actuallyincreased at below rated wind speeds when the optimal yaw misalignment angle is applied. Itis surprising that the power is not decreased at below rated wind speeds when the optimal yawmisalignment is applied. However, the increased power might be explained by the asymmetricinflow to the turbine. This phenomena should be investigated further.

−40 −30 −20 −10 0 10 20 30 400.5
1
1.5
2
2.5
3
3.5
4
Yaw misalignment angle [deg]
Ran
ge o
f AoA
var
iatio
ns [d
eg]
(a) AoA variations, wind speed 8m/s, shearedinflow exp=0.2
4 6 8 10 12 14 16 18 20 221
1.01
1.02
1.03
1.04
1.05
1.06
1.07
Mean wind speed at hub height [m/s]
Pop
t /P0 [−
]
(b) Power fraction
Figure 14. Angle of attack variation for specific wind speed and power fraction as function ofthe mean wind speed.
6. ConclusionsMeasurements of the surface pressure on the blade of a MW wind turbine were investigated toidentify the mechanisms leading to amplitude modulation of the far field sound. Modulations ofthe surface pressure level were linked to angle of attack variations over a blade revolution. If theblade was subjected to transient stall, the spectral energy increased strongly in the frequencyrange below 200Hz. The amplitude modulation of the surface pressure in this frequency rangeover a blade revolution was about 16dB, double of the value as for cases when the blade wasnot subjected to transient stall. Hence, the data gives further evidence that other amplitudemodulation of the far field sound is caused by transient stall. Measurements in an acoustic windtunnel validated the method of using surface pressure measurements to characterise the far fieldsound.In a second full scale experiment the wind condition which lead to angle of attack variations wereinvestigated. The inflow angle was measured on the blade of a Siemens 3.6MW wind turbine.The variations of the inflow angle could be directly related to wind shear. The angle of attackvariations were about 4◦ for the strongest measured shear. Transient stall only occurs if theblade operates with a small margin to the stall angle. The operational point of the blade isvery turbine specific and the conditions leading to transient stall have to be verified for eachcase. Wind shear seems to be a necessary condition to cause transient stall, but alone it is notsufficient.Different control strategies to mitigate other amplitude modulation were investigated. Withcollective pitch control the operation point of the blade can be moved to lower angles of attackand thereby the margin to the stall angle is increased. However, lowering the operational angle ofattack leads to significant losses in power. Another control strategy to alleviate other amplitudemodulation is to decrease the angle of attack variations over a revolution. It can be achievedby individual pitch control or yaw misalignment control. The power losses with individual pitchcontrol are small, but the pitch actuation rates are increased. For yaw control a significant powerloss is expected, but the simulations for a sheared inflow case actually showed an increase of thepower production. But it is only a preliminary result and has to be investigated further.
References[1] Oerlemans S 2011 An explanation for enhanced amplitude modulation of wind turbine noise
Wind Turbine Amplitude Modulation: Research to Improve Understanding as to its Cause
and Effect, RenewableUK
[2] Madsen H, Bak C, Paulsen U, Gaunaa M, Fuglsang P, Romblad J, Olesen N, EnevoldsenP, Laursen J and Jensen L 2010 The DAN-AERO MW Experiments: Final report Tech.Rep. Risø-R-1726(EN) Risø-DTU, Roskilde, Denmark
[3] Devenport W J, Burdisso R A, Borgoltz A, Ravetta P and Barone M F 2010 Aerodynamicand Acoustic Corrections for a Kevlar-Walled Anechoic Wind Tunnel Proc. of the 16thAIAA/CEAS Aeracoustics Conference
[4] Fischer A 2011 Experimental characterization of airfoil boundary layers for improvement ofaeroacoustic and aerodynamic modeling Ph.D. thesis DTU Technical University of DenmarkRoskilde, Denmark
[5] Roger M and Moreau S 2005 J. Sound Vib. 286 477–506
[6] Moreau S, Roger M and Christophe J 2009 Flow Features and Self-Noise of Airfoils NearStall or in Stall Proc. of the 15th AIAA/CEAS Aeroacoustics Conf. AIAA Paper 2009-3198(Miami, FL)
[7] Larsen T J and Hansen A M 2012 How to HAWC2, the users manual Tech. Rep. Risø-R-1597(ver.4-3)(EN) DTU Wind Energy, Roskilde, Denmark
[8] Jonkman J, Butterfield S, Musial W and Scott G 2009 Definition of a 5-MW ReferenceWind Turbine for Offshore System Development Tech. Rep. NREL/TP-500-38060 NationalRenewable Energy Laboratory, Golden, Colorado, USA
[9] Bossanyi E A 2003 Wind Energy 6 119–128 ISSN 1099-1824 URLhttp://dx.doi.org/10.1002/we.76
[10] Kragh K A and Hansen M H 2013 Wind Energy n/a–n/a ISSN 1099-1824 URLhttp://dx.doi.org/10.1002/we.1612