anaerobic digestion deployment in the uk
TRANSCRIPT

Anaerobic Digestion Deployment
in the United Kingdom
Lucy Hopwood
Lead Consultant – Bioenergy & Anaerobic Digestion
REA Biogas Group Meeting, London
01 December 2014

Copyright © NNFCC 2014.
AD Deployment in the UK

Copyright © NNFCC 2014.
AD Deployment in the UK
Definitions
Plant scale
• Small scale refers to installations with an installed capacity of 250kWe and below.
• Medium scale refers to installations with an installed capacity of above 250kWe to 500kWe.
• Large scale refers to installations with an installed capacity of above 500kWe.
Plant type
• Waste-fed refers to installations where the contribution of municipal (e.g. food waste; green waste), commercial (e.g. food waste) and industrial wastes (e.g. brewery waste; animal processing wastes) towards the total feedstock requirement is greater than 50%.
• Farm-fed refers to installations where the contribution of farm-based feedstocks (e.g.
manure; slurry; energy crops; crop wastes) towards the total feedstock requirement is greater than 50%.
Copyright © NNFCC 2014.
AD Deployment in the UK
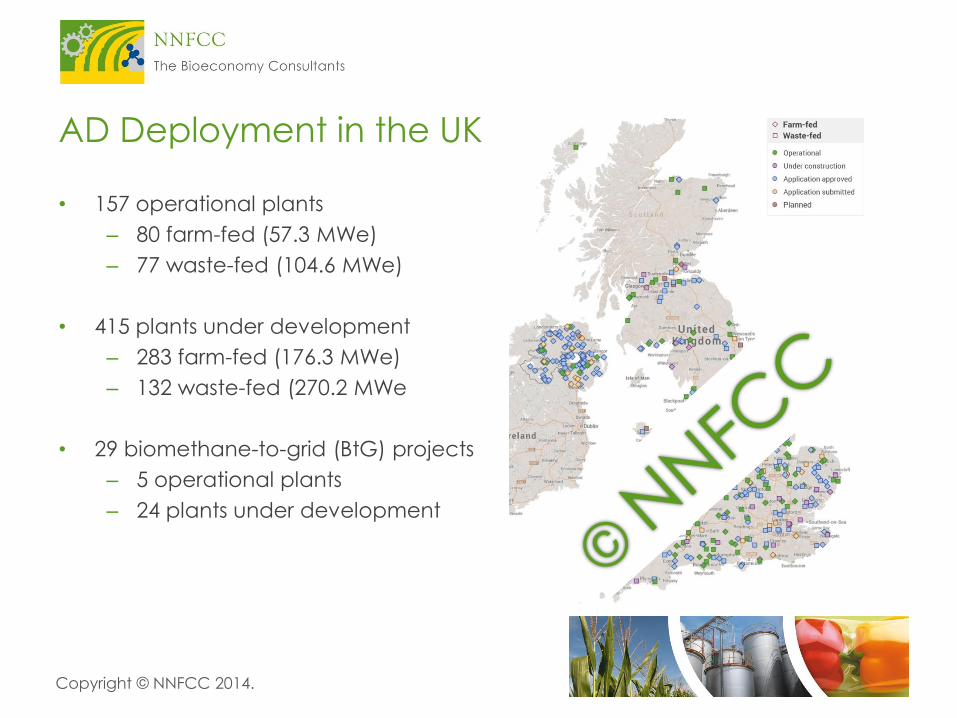
• 157 operational plants
– 80 farm-fed (57.3 MWe)
– 77 waste-fed (104.6 MWe)
• 415 plants under development
– 283 farm-fed (176.3 MWe)
– 132 waste-fed (270.2 MWe
• 29 biomethane-to-grid (BtG) projects
– 5 operational plants
– 24 plants under development

Copyright © NNFCC 2014.
AD Deployment in the UK
• 19 plants online since last report (15
farm-fed; 4 waste-fed)
• 74 more plants undergoing
development (70 farm-fed; 4 waste-
fed)
• Clear movement towards the
development of agricultural plant

Copyright © NNFCC 2014.
AD Deployment in the UK
National Deployment
• Deployment currently
strongest in England
• Attractive support under
NIRO could see NI
deployment increase over
the next few years
0
50
100
150
200
250
300
350
400
450
500
0
50
100
150
200
250
300
350
400
450
500
United
Kingdom
England Northern
Ireland
Scotland Wales
Nu
mb
er o
f pla
nts
Inst
alle
d C
ap
ac
ity (
MW
e)
Operational (MWe) In Development (MWe) Operational In Development
© NNFCC

Copyright © NNFCC 2014.
AD Deployment in the UK
Regional Deployment
• Deployment strongest across
the Midlands and Southern
regions
• Deployment weakest in
North East
• Broadly consistent
distribution in other regions
0
10
20
30
40
50
60
70
80
0
10
20
30
40
50
60
70
80
NW NE YH WM EM EE SW SE LDN IoW
Nu
mb
er o
f pla
nts
Inst
alle
d C
ap
ac
ity (
MW
e)
Operational (MWe) In Development (MWe) Operational In Development
© NNFCC

Copyright © NNFCC 2014.
AD Deployment in the UK
Future Deployment
• If all plants under
development completed
capacity would quadruple
by 2017
• However, only around 30-
50% of plants in pipeline
expected to complete
• Consistent with existing linear
deployment
0
50
100
150
200
250
300
350
400
0
50
100
150
200
250
300
350
400
pre
2005
2005 2006 2007 2008 2009 2010 2011 2012 2013 2014 2015 2016 2017
Cu
mu
lativ
e N
um
be
r of P
lan
ts
Cu
mu
lative
In
sta
lled
Ca
pa
city (
MW
e)
Farm-fed (MWe) Waste-fed (MWe) Farm-fed Waste-fed
© NNFCC

Copyright © NNFCC 2014.
AD Deployment in the UK
Deployment by scale
• Large scale plants currently
dominate in terms of
number and capacity
• Consistent growth across all
scales, despite FiT degression
for small and medium scale
earlier in the year
• Deployment of small scale
and BtG still at low level
• BtG sector anticipated for
growth, although RHI tariff
undergoing review
0
50
100
150
200
250
300
350
400
0
50
100
150
200
250
300
350
400
Small scale Medium scale Large scale BtG
Nu
mb
er o
f pla
nts
Inst
alle
d c
ap
ac
ity (
MW
e)
Operational (MWe) In Development (MWe) Operational In Development
© NNFCC

Copyright © NNFCC 2014.
AD Deployment in the UK
Current feedstock requirements
• 1,780,000 tpa food waste
• 880,000 tpa energy crops
• 830,000 tpa ‘other’ waste
• 520,000 tpa manure/slurry
• 220,000 tpa crop waste
0
1,000
2,000
3,000
4,000
5,000
6,000
pre
2005
2005 2006 2007 2008 2009 2010 2011 2012 2013 2014 2015 2016 2017
Fe
ed
sto
ck V
olu
me
s (k
tpa
)
Manure/Slurry Crop Food Waste
Crop waste Other Manure/Slurry (Cum.)
Crop (Cum.) Food Waste (Cum.) Crop waste (Cum.)
Other (Cum.)
© NNFCC

Copyright © NNFCC 2014.
AD Deployment in the UK
Projected (theoretical) feedstock requirements – March 2014
0
1,000
2,000
3,000
4,000
5,000
6,000
pre
2005
2005 2006 2007 2008 2009 2010 2011 2012 2013 2014 2015 2016 2017
Fe
ed
sto
ck V
olu
me
s (k
tpa
)
Manure/Slurry Crop Food Waste
Crop waste Other Manure/Slurry (Cum.)
Crop (Cum.) Food Waste (Cum.) Crop waste (Cum.)
Other (Cum.)
© NNFCC

Copyright © NNFCC 2014.
AD Deployment in the UK
Projected (theoretical) feedstock requirements – September 2014
0
1,000
2,000
3,000
4,000
5,000
6,000
pre
2005
2005 2006 2007 2008 2009 2010 2011 2012 2013 2014 2015 2016 2017
Fe
ed
sto
ck V
olu
me
s (k
tpa
)
Manure/Slurry Crop Food Waste
Crop waste Other Manure/Slurry (Cum.)
Crop (Cum.) Food Waste (Cum.) Crop waste (Cum.)
Other (Cum.)
© NNFCC

Copyright © NNFCC 2014.
AD Deployment in the UK
Projected feedstock requirements
• Balance of feedstock in projections changed noticeably over the last 6
months
– Food waste projections increased by under 200,000 tpa
– ‘Other’ waste projections increased by 400,000 tpa
– Manure projections increased by just over 400,000 tpa
– Crop projections increased by almost 1.2 million tpa

Copyright © NNFCC 2014.
AD Deployment in the UK
Food waste
• New report from Eunomia
suggests the UK is near
capacity with regards to
volumes of available food
waste entering AD
• NNFCC data provides
further evidence for this
notion
© Eunomia Research & Consulting; 2014

Copyright © NNFCC 2014.
AD Deployment in the UK
Energy crops
• Large growth in anticipated demand for energy crops in AD
• Largely on account of the initiation of a number of very large scale crop-
only projects in the East Midland and East of England
• Possible reasons:
– Large scale AD developers attracted towards crop feedstock as food
waste approaches capacity
– FiT degression for small and medium scale AD has encouraged farm-
based AD developers to consider larger scales than initially envisaged
– Biomethane-to-grid now becoming very attractive at scale

Copyright © NNFCC 2014.
0
10,000
20,000
30,000
40,000
50,000
60,000
70,000
80,000
90,000
100,000
pre
2005
2005 2006 2007 2008 2009 2010 2011 2012 2013 2014 2015 2016 2017
Cro
p a
rea
(H
a)
Crop area Crop area (Cum.)
AD Deployment in the UK
Required cropland
• Assuming an energy crop
yield of 45 fresh tonnes/Ha
the UK AD industry requires
19,500 Ha of land
• If all plants under
development were to
complete the UK AD industry
would require 86,000 Ha of
land (1.5% of UK crop land)
• Break crops often used for AD
© NNFCC

Copyright © NNFCC 2014.
AD Deployment in the UK
Summary and future development
• Development pipeline remains strong despite FiT degression earlier in the year
• However, considerable challenges ahead for both the agriculture and food
waste AD sectors
• Improved utilisation of slurries/manures, especially from poultry sector, could
support increased deployment
• RHI could become a more stable form of support in the future and result in
further BtG deployment

Celebrating 10 years of Bioeconomy
development
NNFCC is a UK based consultancy with
expertise on the conversion of biomass
to bioenergy, biofuels and biobased
products.
We help industry solve complex
business challenges and provide vital
evidence for policy makers.
| | www.nnfcc.com | [email protected]
Lucy Hopwood,
Lead Consultant – Bioenergy & Anaerobic Digestion