an overview of the indian services sector arpita mukherjee july 19, 2008
TRANSCRIPT

An Overview of the Indian Services Sector
Arpita Mukherjee
July 19, 2008

Outline of the Presentation
Indian Services Sector - Trends and Developments Factors contributing to Growth Trade in Services India’s position vis-a-vis other Countries Sector-wise Services Trade Impact of Growth/Liberalisation/Globalisation External Barriers Domestic Challenges Reforms
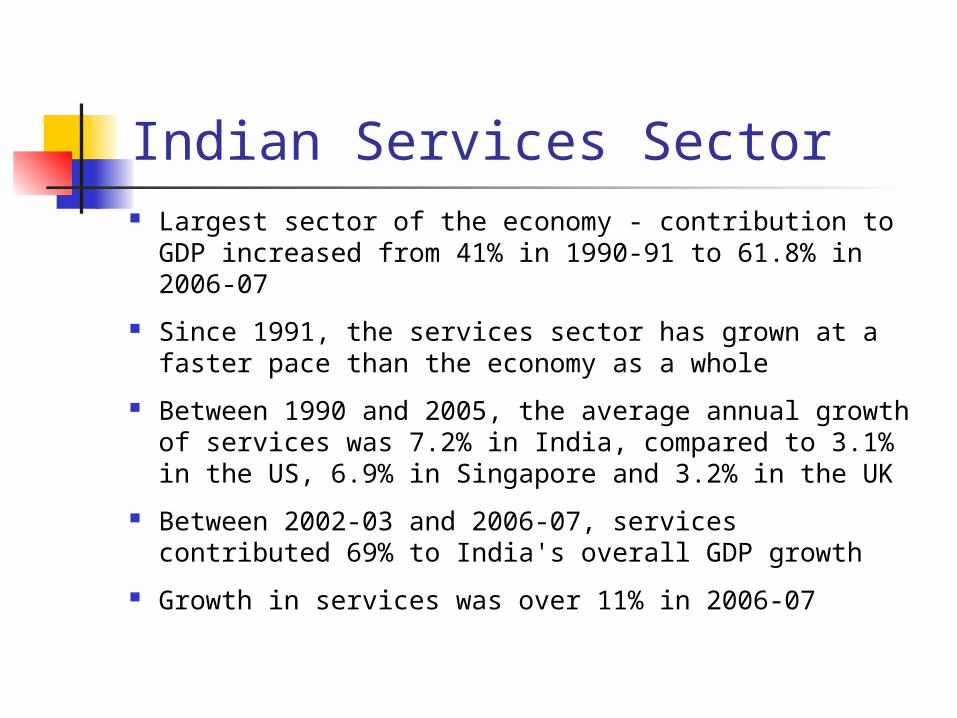
Indian Services Sector Largest sector of the economy - contribution to GDP
increased from 41% in 1990-91 to 61.8% in 2006-07
Since 1991, the services sector has grown at a faster pace than the economy as a whole
Between 1990 and 2005, the average annual growth of services was 7.2% in India, compared to 3.1% in the US, 6.9% in Singapore and 3.2% in the UK
Between 2002-03 and 2006-07, services contributed 69% to India's overall GDP growth
Growth in services was over 11% in 2006-07

Indian Services Sector…..cont
In 2005, services contributed to 69% of organized sector employment (Economic Survey 2007-08)
Employment in IT/BPO services increased from 284,000 in 1999-00 to 1.6 million in 2006-07
Boston Consulting Group estimated 40 million new services jobs, $200 billion revenue by 2020
Certain services such as communication services, insurance and banking, IT have grown at a much faster rate than the growth of the service sector
Total revenue of the IT/BPO sector increased ten folds since FY 1998

Factors Contributing to Growth Liberalisation since the 1990s – few entry barriers (retail, legal,
railways, insurance, etc.) Positive impact of liberalisation – telecommunications Investment by Indian Corporate Attractive destination for Foreign Investment
Services sector (financial and non-financial) has attracted the highest cumulative FDI inflows: April 2000-March 2008. 22.64% of total inflows
Computer hardware and software ranked 2nd, 13.07% of total inflows
Telecommunications – 6.81% Availability of educated English speaking manpower at
competitive prices Government incentives and support

India’s Trade in Services Share of services in total trade of India increased from
20.9% in 1997 to 28.9% in 2006 Services exports as percentage of total exports nearly
doubled – 20.3% in 1997 to around 39% in 2006 Nearly two-third of the revenue of IT/BPO sector is through
exports Services import as percentage of total imports was 21.4%
in 2006 India currently enjoys trade surplus in services Exporter of knowledge-based services
Skilled Labour shortage - Ageing population on developed countries
Importer of infrastructure services

Trade in Services…cont
Outsourcing Hub About three-fourth of the Fortune 500
companies and at least half of Global 2000 corporations are sourcing technology related services from India
Cost saving of 25-50% Moving up the value chain Multi-location delivery platforms
Indian companies are investing abroad

Ranking of India in Trade in Commercial Services
Commercial Service
Exports
Commercial Service
Imports 1995
2006 1995 2006
34 10 28 12
Source: WTO, International Trade Statistics 1996, 2007
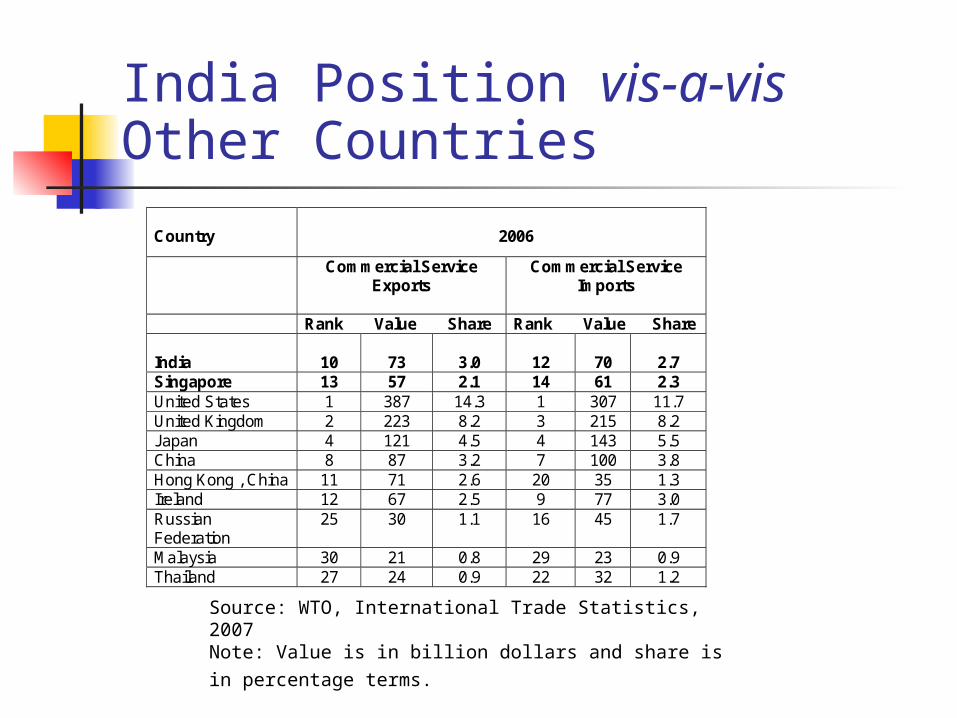
India Position vis-a-vis Other Countries
Country
2006
Commercial Service Exports
Commercial Service Imports
Rank Value Share Rank Value Share India
10
73
3.0
12
70
2.7
Singapore 13 57 2.1 14 61 2.3 United States 1 387 14.3 1 307 11.7 United Kingdom 2 223 8.2 3 215 8.2 Japan 4 121 4.5 4 143 5.5 China 8 87 3.2 7 100 3.8 Hong Kong , China 11 71 2.6 20 35 1.3 Ireland 12 67 2.5 9 77 3.0 Russian Federation
25 30 1.1 16 45 1.7
Malaysia 30 21 0.8 29 23 0.9 Thailand 27 24 0.9 22 32 1.2
Source: WTO, International Trade Statistics, 2007 Note: Value is in billion dollars and share is in percentage
terms.

RCAs for India
2001 2002 2003 2004 2005 2006 Transport 0.54 0.60 0.61 0.53 0.49 0.53 Travel 0.63 0.56 0.67 0.59 0.51 0.49 Other Commercial Service 1.42 1.42 1.34 1.42 1.44 1.37 Construction 0.19 0.63 0.61 0.72 0.93 0.28 Communication 2.86 1.93 1.88 1.34 1.57 1.28 Personal NA NA NA 0.09 0.22 0.28 Financial 0.28 0.56 0.28 0.15 0.42 0.41 Insurance 0.88 0.64 0.60 0.92 0.86 0.72 Computer 12.83 12.97 12.76 10.24 9.35 8.84 Royalty 0.04 0.02 0.02 0.03 0.05 0.03 Others 0.59 0.60 0.39 0.91 1.11 1.38
Source: BoP Statistics, IMF

Sector-wise Services Trade Transportation Services
Share was 1.2% in world’s export in 2006, 0.6% in 2000 Share was 3.3 % in world’s import in 2006, 2.1% in 2000
Travel Services Not among the top 15 exporters Share 1% in world’s import in 2006, was 0.6% in 2000
Other Commercial Services Share 4.2% in world’s exports in 2006
Share was 2.6% for imports in 2006

Sector-wise Services Trade
Communication Services Ranked 4th among exporting countries and 9th among
importing countries in 2006 Construction Services
7th largest exporter and 10th largest importer in 2006 Financial Services
10th exporter and 8th importer in 2006 Computer and Information Services
Ranked 2nd in terms of exports and 7th in imports in 2006

Impact… Performance and global competitiveness of the
sector determines government’s negotiating position India has autonomously liberalised most of the service
sectors Need foreign investment/technical know-how Exports are increasing - Indian service providers are
facing several barriers in markets of export interest From a passive player in the Uruguay Round, India
has an offensive interest in services liberalisation in the on-going Doha Round
Important component of India’s Bilateral Agreements

Challenges - in Foreign Markets Barriers faced by professionals
Lack of recognition of qualifications and experiences Restrictive work permit/visa regimes Non-transparent/cumbersome administrative
procedures Economic Needs Tests/Labour Market Tests Wage Parity conditions Social security contributions without corresponding
benefits Nationality/residency/citizenship/registration
requirements Quantitative ceiling

Challenges - in Foreign Markets …………….cont
Barriers to establishing presence in foreign country Form of legal entity Local incorporation requirements FDI restrictions Nationality/residency requirements Economic Needs Tests Requirement to employ locals Restrictions on advertising Minimum capital requirements Limitation on foreign exchange and profit repatriation Limitation on the type of projects undertaken by foreign
service providers

Challenges - in Foreign Markets…….cont
Barriers to outsourcing/cross-border trade Commercial presence requirement Security/data protection issues Anti-outsourcing sentiments Non-recognition of qualifications
Other Barriers Cumbersome licensing procedures Environment and labour standards Subsidies/Government procurement Security issues Lack of market knowledge Languages

Other Challenges High dependence on some key markets
The US alone accounts for two-third of the software and services exports while Europe accounts for around 25 per cent. Within Europe, the UK accounts for around 15 per cent followed by Germany 2-3 per cent
Competition from other developing countries

Domestic Challenges
Infrastructure Quality of physical infrastructure affects the efficiency
of the services sector In 2005-06, total logistic cost was 15% of GDP
Shortages of Right Skills Do we really have excess supply? Gross enrollment ratio is 11% compared to the global
average of 23.3 % Quality and standards

Domestic Challenges …….cont
Slow reform process Regulatory framework is evolving – energy, education,
retail, postal and courier – uncertain investment climate Backdated/outmoded regulations
High and multiple taxes Multiple clearances requirements Data Protection Lack of inter-ministerial coordination – piecemeal
policies/liberalisation

What needs to be done? Comprehensive services sector policy Upgrade Infrastructure
Logistic infrastructure – freight corridors, port facilities, storage and warehousing services, etc.
Upgrading smaller cities & Urban planning Broadband & internet connectivity Electricity
Establish the Regulatory Framework which promotes efficiency and competition
Amend the outdated and outmoded laws Enact new regulations

What needs to be done? …….cont
Education & Skill Development Enhance both quantity and quality of higher education Enforcement of international standards of training and
qualifications Revise curricula at regular intervals Focus on development of analytical and creative skills Teaching profession should be made more attractive Public private cooperation Collaborations with councils/industry bodies in training Ranking of institutes

What needs to be done? …….cont
Rationalize taxes, licensing, etc. Diversify exports markets and areas of operations Public-private cooperation in developing Global
Market Strategies Indian Embassies needs to be more proactive Negotiate multilaterally/bilaterally to remove/reduce
barriers in markets of export interests Ease trade barriers through
Mutual Recognition Agreements Totalization Agreements Cooperation Agreements
