arpita water quality assessment
TRANSCRIPT

Parana Journal of Science and Education (PJSE) – V.3, n.6, (34-41) December 18, 2017
ISSN: 2447-6153 https://sites.google.com/site/pjsciencea 34
Assessment of Coastal Water Quality using Aquatic Health Index (AHI)
Arpita Saha
1*, Sufia Zaman2
§ and Abhijit Mitra2◊
1Department of Oceanography, Techno India University, West Bengal, Salt Lake Campus,
Kolkata, 700091, W. B, India.
2Department of Marine Science, University of Calcutta, 35 B.C Road, Kolkata, 700019, W. B, India.
Abstract
The coastal and estuarine zone of West Bengal (India) is noted for its rich biodiversity owing to the presence of
Sundarbans mangrove ecosystem. However, due to intense industrialization and urbanization, many of the
pockets have become ecologically sensitive. The present paper is an attempt to evaluate the Ecologically
Sensitive Zone (ESZ) through enumeration of Aquatic Health Index (AHI). In the present programme, three
stations in and around Indian Sundarbans namely Canning, Junput and Sagar Island were selected and the
aquatic health index value of these stations varied as per the order Sagar Island > Canning > Junput. The lower
value of the index reflects deteriorated condition of the coastal water due to excessive industrial, agricultural and
domestic run-off. The high values of the index are the indicators of congenial coastal environment.
Keywords: Aquatic Health Index (AHI), Coastal environment, Sundarbans mangrove ecosystem.
* E-mail: [email protected]
§ E-mail: [email protected]
◊ E-mail: [email protected]

Parana Journal of Science and Education (PJSE) – V.3, n.6, (34-41) December 18, 2017
ISSN: 2447-6153 https://sites.google.com/site/pjsciencea 35
1. Introduction
India, with a long coastline of over 8,000 km
and 2 million km2 of EEZ (Exclusive
Economic Zone) has great potential for
utilizing the marine and estuarine resources for
the economic benefit of the country. West
Bengal, a maritime state of the northeastern
part of the country, adjacent to Bangladesh, is
indented in the south by numerous river
openings. The state has a coastal area of
10,055 km2 spread in three major districts
namely 24 Parganas (N), 24 Parganas (S) and
Midnapur (E). The Hugli-Matla estuarine
complex adjacent to coastal West Bengal is
one of the most dynamic estuaries of the
world, which is serving as the nursery of
several varieties of finfishes and shellfishes
that have great potentiality in strengthening
the economic backbone of the country.
However, it has become a significant conveyor
of pollutants of different categories as because
this system receives domestic, agricultural and
industrial wastes containing cellulose, acids,
alkalis, nitrogenous compounds, heavy metals,
fly ash, phenol, sulphides and pesticide
residues, which adversely affect the fish food
organisms, near the outfall regions (Mitra,
1998) [1]. Matla and other eastward estuaries
receive Kolkata and suburban sewage with
organic load, heavy metals, ammonia and
synthetic detergents flowing down (through
the Kulti and Bidyadhari estuaries Mitra,
2013) [2]. The chain of the industries situated
in and around Haldia port-cum-industrial
complex (Annexure 1) has aggravated the
situation in the western sector of Indian
Sundarbans. Regular monitoring of the entire
process is of utmost importance in this context
to keep an eagle’s eye on the quality of aquatic
phase in and around Indian Sundarbans. One
important step towards this is scaling of the
water quality of different site through
consideration of most relevant parameters,
which are functions of space and time. The
process of scaling is done by developing an
index through which a single value can be
assigned to the aquatic phase for the purpose
of its scoring in terms of status, use and
management. Thus AHI aims at giving a
single value to a particular aquatic system on
the basis of list of constituents
(parameters/variables) and their concentrations
in the said aquatic system. One can then
compare different samples for quality on the
basis of the index value of each sample. The
present article is an approach to compare the
AHI (Aquatic Health Index) of three sites in
different salinity zones in and around Indian
Sundarbans, with the aim to prepare a
scorecard for rating these water bodies in
connection to the ecologically sensitive zone.
2. Materials and Methods
The entire network of the present programme
consists of the evaluation of the health of
coastal and estuarine water with respect to
selective physicochemical variables like
surface water salinity, pH, temperature,
transparency, dissolved oxygen (DO), nitrate,
phosphate, silicate, oil and grease, dissolved
Pb, dissolved Zn and dissolved Cu during
June, 2016. Samplings have been carried out at
three stations in and around Indian Sundarbans
namely Canning (low saline zone), Junput
(high saline zone) and Sagar Island (high
saline zone).
For convenience, the entire working procedure
has been divided into three phases as
mentioned below:
Phase A: Site Selection.
Phase B: Analysis of hydrological
parameters of water bodies.
Phase C: Evaluation of water quality
index.
2.1. Phase A: Site Selection
Samplings were carried out from three stations
in and around Indian Sundarbans namely
Canning (Stn. 1), Junput (Stn. 2) and Sagar
Island (Stn. 3) during premonsoon season
(June, 2016).
2.2. Phase B: Analysis of hydrological
parameters of pond water
The relevant hydrological parameters in
connection to identification of ecologically
sensitive zone in the coastal stretch of West
Bengal and associated estuaries are surface
water salinity, fecal coliform, BOD
(Biological Oxygen Demand), dissolved
oxygen (DO), oil and grease, dissolved Pb,
dissolved Zn, dissolved Cu, transparency,

Parana Journal of Science and Education (PJSE) – V.3, n.6, (34-41) December 18, 2017
ISSN: 2447-6153 https://sites.google.com/site/pjsciencea 36
water temperature, pH, nitrate, phosphate and
silicate.
Surface water salinity was measured in the
field by refractometer and cross-checked in the
laboratory by argentometric method.
Transparency was measured in the field by
using a Secchi disc of 30 cm in diameter.
Surface water temperature was measured by a
Celsius thermometer and pH of the pond water
was measured by a portable pH meter
(sensitivity = ± 0.02). BOD, DO, oil and
grease, nitrate, phosphate and silicate were
measured as per the procedure stated in
Strickland and Parsons (1972) [3] and APHA
(1995) [4].
The dissolved metal (Zn, Cu and Pb) analysis
of water samples through Atomic Absorption
Spectrophotometer (AAS) were carried out as
per Chakraborti et al. (1987). [5]
For microbial analysis of the coastal water in
terms of Fecal Coliform load, the Most
Probable Number (MPN) procedure by
Multiple Fermentation Technique was
followed as stated in APHA (1995). [4]
2.3. Phase C: Water quality index
evaluation
For evaluating the water quality of the coastal
water through AHI the following expression
was adopted, which is a modification of
Brown’s index (1970) [6]:
∑ 𝑊𝑖 . 𝑞𝑖 (1)
𝑛
𝑖 = 1
where, Wi = weight of ith parameter, qi =
quality of the ith parameter (a number between
0 and 100). Depending on the importance of
the parameter they are allotted a ranking value
of 1 (highest) to 10 (lowest). To convert
ratings into weights, a temporary weight of 1.0
was assigned to the parameter, which received
the highest significance ratings (here salinity
received the topmost score). All other
temporary weights were obtained by dividing
the highest ranking with each individual
rating. Each temporary weight was then
divided by the sum of all the temporary
weights to arrive at the final weight of each
parameter. The sum of the product of the
individual final weight Wi and individual
quality rating qi was used.
3. Results and Discussions
The Ecologically Sensitive Zone (ESZ) may
be defined as the zone which sustains endemic
gene pool and restricts activities that pose
adverse impact on the biodiversity and the
physical environment of the zone. The basis of
evaluating the ESZ is to understand the
magnitude of human interference on natural
system. In the present era the adverse impact
on natural system has increased due to intense
industrialization and rapid urbanization in the
coastal zone. The mushrooming of shrimp
farms and unplanned proliferation of tourism
unit has increased the magnitude of
deterioration of water quality in the coastal
zone. It is in this context the environmental
quality assessment its monitoring and survey
have, received prime importance.
Water Quality Index (WQI) evaluation is an
approach to understand the health of the
aquatic system by considering all the
parameters relevant for determining the
ecologically sensitive zone in the coastal
stretch. Evaluation of water quality index is a
step to monitor the health of the aquatic
ecosystem. The index has gained currency
during the last three decades but the concept in
its rudimentary form was first introduced more
than 150 years ago – in 1848 – in Germany
where presence or absence of certain
organisms in water was used as indicator of
the fitness or otherwise of a water source.
[Mitra and Zaman, 2016] [6]. Since, various
European countries have developed and
applied different systems to classify the
quality of the waters within their regions.
These water classification systems are usually
of two types:
those concerned with the amount of
pollution present, and
those concerned with living communities
of microscopic or microscopic organisms.
Rather than assigning a numerical value to
represent water quality, these classification
systems categorized water bodies into one of
several pollution classes or levels. By contrast,
indices that use a numerical scale to represent
gradations in water quality levels are a recent

Parana Journal of Science and Education (PJSE) – V.3, n.6, (34-41) December 18, 2017
ISSN: 2447-6153 https://sites.google.com/site/pjsciencea 37
phenomenon, beginning with Horton’s index
in 1965. [7]
In course of time, the National Sanitation
Foundations Water Quality Index (NSFWQI)
developed by Brown et al. (1970) [8], gained
much importance, but the index does not
recognize and incorporate specific water
supply, agriculture, industry etc. Later on
another Coastal Water Quality Index (CWQI)
was established by another group of
researchers to better understand the coastal
water quality in Taiwan by using Delphi [It is
a process that aims to determine the extent to
which experts or lay people agree about a
given issue and with each other and in areas
where they disagree, achieve a consensus
opinion. Delphi technique is usually conducted
through questionnaires] to select several
parameters from Marine Water Quality
Standard (CZMP, 1996) [9]. However, the
parameters identified by them are pH, DO,
BOD, cyanide, Cu, Zn, Pb, Cd and Cr. These
indexes also does not reflect parameters
related to coastal and estuarine environment
like salinity, silicate level, oil and grease etc,
which have great influence on regulating the
health of those ecosystems. On this
background, the present index is an addition of
relevant parameters on the skeleton of
Brown’s index (1970) [8].
The Aquatic Health Index (AHI) in the present
area of investigation is in the order Stn. 3
(Sagar Island, 50.5049) > Stn. 1 (Canning,
43.4687) > Stn. 2 (Junput, 41.3285). The order
reflects the congenial environment at Sagar
Island, which is at the confluence of the river
Hugli and the Bay of Bengal. The presence of
mangroves and the tidal flushing of the
seawater (from Bay of Bengal) are the
probable causes for environmental upgradation
in this zone. The Junput and Canning on the
other hand are constantly under anthropogenic
pressure due to presence of fish landing
stations, markets, tourism and other human
activities. It is become of human interference
the coastal health undergoes deterioration and
subsequently the value of aquatic health index
gets reduced. In case of Canning the lower
AHI value may be due to the proximity of the
station to the highly urbanized and
industrialized city of Kolkata, which regularly
unload huge quantum of wastes of complex
characters in the Kulti lock gate zone. But in
case of Junput the lower AHI value may be
attributed to excessive tourist load (as it is
much nearer to the tourists spots of Digha and
Shankarpur) (Mitra, 2013). [2] In addition to
this, the presence of fish landing stations at
Junput is another prominent cause behind the
lowering of the aquatic health index in this
zone. The fishing vessels and trawlers
contribute appreciable amount of Zn, Cu and
Pb (from the antifouling paints that are used
for conditioning the vessels), oil and grease in
the ambient aquatic phase. Absence of proper
treatment facility in the landing stations
resulted in enhancement of the value of BOD
and microbial load.
4. Conclusion
The coastal and estuarine waters, being the
cradle of several of finfish, shellfish, seaweeds
of commercial importance, needs regular
monitoring, as a part of safe-guarding the
ecosystem. The enumeration of Aquatic health
index is a definite approach to pinpoint the
magnitude of deterioration of the coastal zone
on the basis of which proper planning can be
done to keep the ecosystem intact and stable.
References
[1] Mitra, A. Status of coastal pollution in
West Bengal with special reference to heavy
metals. Journal of Indian Ocean Studies, 5 (2):
135-138, (1998).
[2] Mitra, A. In: Sensitivity of Mangrove
Ecosystem to Changing Climate by Dr.
Abhijit Mitra. Publisher Springer New Delhi
Heidelberg New York Dordrecht London,
2013 edition (August 31, 2013); ISBN-10:
8132215087; ISBN-13: 978-8132215080.,
copyright Springer, India 2013; ISBN 978-81-
322-1509-7 (eBook), (2013).
[3] Strickland, J. D. H. and Parsons, T. R. A.
Practical Handbook of Seawater Analysis.
2ed. In: Bulletin Fisheries Research Board of
Canada, 167: 310, (1972).
[4] APHA (American Public Health
Association). Standard methods for the
examination of water and waste water. 20th
edition, APHA, Washington, D. C. (1995).

Parana Journal of Science and Education (PJSE) – V.3, n.6, (34-41) December 18, 2017
ISSN: 2447-6153 https://sites.google.com/site/pjsciencea 38
[5] Chakraborty, D., Adams, F., Van Mol, W.
and Irgolic, J. K. Determination of trace
metals in natural waters at nanogram per
litre levels by electrothermal atomic
absorption spectrometry after extraction
with sodium diethyldithiocarbamate. In:
Analytica Chemica Acta, 196: 23-31, (1987).
[6] Mitra, A and Zaman, S. Basics of Marine
and Estuarine Ecology. Springer, ISBN 978-
81-322-2705-2, (2016).
[7] Horton, R. K. An index number system
for rating water quality. Journal of Water
Pollution Control Federation, 37(3): 300-305,
(1965).
[8] Brown, R. M., McLelland, N. J.,
Deininger, R. A. and Tozer, R. G. A Water
Quality Index, Do We Dare? Water &
Sewage Works: 339-343, (1970.).
[9] CZMP for West Bengal, Environment
Department, Gov. of W. B., (1996).
Tables and Annexure
Table 1. Significance, Ratings and Weights of the relevant parameters in connection,
to Coastal Water Quality determination.
Parameter Ranking Temporary weight Final weight (Wi)
Salinity (‰) 1.2 1.0000 0.2060
Fecal Coliform (no./100 ml) 1.5 0.8000 0.1648
BOD (5-day) 2.5 0.4800 0.0989
Dissolved O2 (mg/l) 2.9 0.4137 0.0852
Oil and grease(mg/l) 3.1 0.3871 0.0797
Dissolved Pb (µg/l) 4.5 0.2667 0.0549
Dissolved Cu (µg/l) 4.7 0.2553 0.0526
Dissolved Zn (µg/l) 4.9 0.2449 0.0504
Transparency (cm) 5.7 0.2105 0.0433
Temperature (0C) 6.5 0.1846 0.0380
pH 7.1 0.1690 0.0348
NO3 (µg at/l) 7.9 0.1519 0.0313
PO4 (µg at/l) 8.1 0.1481 0.0305
SiO3 (µg at/ l) 8.5 0.1412 0.0290
∑ 4.8530 ∑ 0.9994

Parana Journal of Science and Education (PJSE) – V.3, n.6, (34-41) December 18, 2017
ISSN: 2447-6153 https://sites.google.com/site/pjsciencea 39
Table 2. Determination of Aquatic Health Index (AHI) for Canning (Stn 1).
Parameters Final
weight
(Wi)
Measured
Value
Optimum
value *
Individual
quality
rating (qi)
wiqi
Salinity (‰) 0.2060 24.45 25.00 98 20.1880
Fecal Coliform (no./100 ml) 0.1648 550.00 100.00 0 0
BOD (5-day) 0.0989 6.20 3.00 0 0
Dissolved O2 (mg/l) 0.0852 5.12 5.00 98 8.3496
Oil and grease (mg/l) 0.0797 2.90 0.10 0 0
Dissolved Pb (µg/l) 0.0549 34.57 10.00 0 0
Dissolved Cu (µg/l) 0.0526 152.47 50.00 0 0
Dissolved Zn (µg/l) 0.0504 483.12 100.0 0 0
Transparency (cm) 0.0433 14.60 30.00 49 2.1217
Temperature (0C) 0.0380 34.00 32.00 94 3.5720
pH 0.0348 7.79 8.00 97 3.3756
NO3 (µg at/l) 0.0313 13.59 15.00 91 2.8483
PO4 (µg at/l) 0.0305 2.45 1.50 37 1.1285
SiO3 (µg at/ l) 0.0290 107.67 80.00 65 1.8850
∑wiqi = 43.4687
Table 3. Determination of Aquatic Health Index (AHI) for Junput (Stn 2).
Parameter Final
weight
(Wi)
Measured
Value
Optimum
value *
Individual
quality
rating (qi)
wi qi
Salinity (‰) 0.2060 29.18 25.00 83 17.0980
Fecal Coliform (no./100 ml) 0.1648 425.00 100.00 0 0
BOD (5-day) 0.0989 5.80 3.00 7 0.6923
Dissolved O2 (mg/l) 0.0852 4.11 5.00 82 6.9864
Oil and grease(mg/l) 0.0797 3.10 0.10 0 0
Dissolved Pb (µg/l) 0.0549 18.46 10.00 15 0.8235
Dissolved Cu (µg/l) 0.0526 109.56 50.00 0 0
Dissolved Zn (µg/l) 0.0504 348.69 100.0 0 0
Transparency (cm) 0.0433 15.90 30.00 47 2.0351
Parana Journal of Science and Education (PJSE) – V.3, n.6, (34-41) December 18, 2017
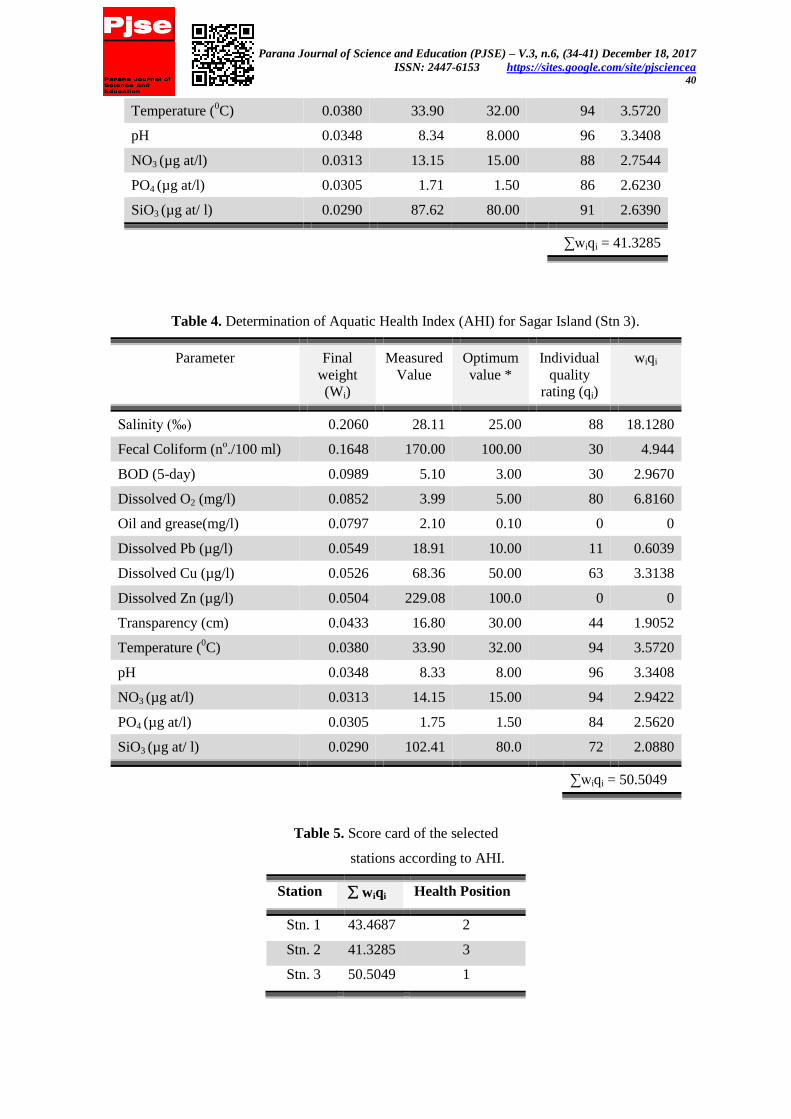
ISSN: 2447-6153 https://sites.google.com/site/pjsciencea 40
Temperature (0C) 0.0380 33.90 32.00 94 3.5720
pH 0.0348 8.34 8.000 96 3.3408
NO3 (µg at/l) 0.0313 13.15 15.00 88 2.7544
PO4 (µg at/l) 0.0305 1.71 1.50 86 2.6230
SiO3 (µg at/ l) 0.0290 87.62 80.00 91 2.6390
∑wiqi = 41.3285
Table 4. Determination of Aquatic Health Index (AHI) for Sagar Island (Stn 3).
Parameter Final
weight
(Wi)
Measured
Value
Optimum
value *
Individual
quality
rating (qi)
wiqi
Salinity (‰) 0.2060 28.11 25.00 88 18.1280
Fecal Coliform (no./100 ml) 0.1648 170.00 100.00 30 4.944
BOD (5-day) 0.0989 5.10 3.00 30 2.9670
Dissolved O2 (mg/l) 0.0852 3.99 5.00 80 6.8160
Oil and grease(mg/l) 0.0797 2.10 0.10 0 0
Dissolved Pb (µg/l) 0.0549 18.91 10.00 11 0.6039
Dissolved Cu (µg/l) 0.0526 68.36 50.00 63 3.3138
Dissolved Zn (µg/l) 0.0504 229.08 100.0 0 0
Transparency (cm) 0.0433 16.80 30.00 44 1.9052
Temperature (0C) 0.0380 33.90 32.00 94 3.5720
pH 0.0348 8.33 8.00 96 3.3408
NO3 (µg at/l) 0.0313 14.15 15.00 94 2.9422
PO4 (µg at/l) 0.0305 1.75 1.50 84 2.5620
SiO3 (µg at/ l) 0.0290 102.41 80.0 72 2.0880
∑wiqi = 50.5049
Table 5. Score card of the selected
stations according to AHI.
Station wiqi Health Position
Stn. 1 43.4687 2
Stn. 2 41.3285 3
Stn. 3 50.5049 1

Parana Journal of Science and Education (PJSE) – V.3, n.6, (34-41) December 18, 2017
ISSN: 2447-6153 https://sites.google.com/site/pjsciencea 41
Annexure 1. Major Haldia Industries: Waste generation, treatment and disposal.
Name of the
Industry
Size & Category
Status
Water
Use
(m3/d)
Waste
Generation
Status of disposal of
Waste Effluent
Effluent
(m3/d)
Solid
(m3/d)
Status of
Effluent
Disposal of
Effluent
Discharged
in the Sea
Waste
Direct /
Indirect
Solid
Waste
Shaw Wallace & Co. Large Pesticides Private 265 50 0.007 Treated Indirect NA
Hindustan Lever Ltd. Large Chemicals Private 3750 1065 NA Treated Indirect NA
Consolidated Fibers &
Synthetic Chemicals
Ltd.
Large Fiber Private 3185 2303 0.002 Treated Indirect NA
Haldia Dock Complex Large Dock Private 2880 640 25 Untreated Indirect NA
IOC Ltd. Large Oil &
Refinery
Private 14650 13800 NA Treated Indirect NA
Chloride Industries Large Lead Battery Private 446 402 0.008 Treated Indirect NA
HFC Ltd (Main Plant
fertilizer not operating
since 1978)
Large Fertilizer Private 3400 3400 NA Partly
Treated
Indirect NA
Source: CZMP for West Bengal, Environment Department, Gov. of W. B., 1996. [13]
NA= Not Available.