an overview of amtrak - aashto - high speed rail - … overview of amtrak stephen gardner vice...
TRANSCRIPT

An Overview of Amtrak
Stephen Gardner
Vice President, Policy and Development
February 15, 2011
PRIIA Next Generation Equipment Pool Committee Annual Meeting

1
Amtrak 101 – basic company and system statistics
• Congressionally chartered corporation (majority of stock owned by U.S. Government), created in 1970 and operated as a quasi-nonprofit corporation for the provision of intercity passenger rail service in the U.S.
• The mission of Amtrak is to provide efficient and effective intercity passenger rail mobility consisting of high quality service that is trip-time competitive with other intercity travel options
• We operate a 21,200 mile system
– 308 daily intercity trains– 528 stations– 1,519 cars and 469 locomotives, 80 auto carriers, and 101 baggage cars– More than 20,000 employees– More than half of our services operate at 90+ mph– 70% of our train-miles are run on track owned by other railroads (mostly large
freight railroads)
• We carried 28.7 million riders in FY 10 – biggest year in our history
• Amtrak generated total of $2.5 billion in revenues in FY 10 (incl. ancillary business)
– Covered 85% of operating cost (heavy rail passenger carriers in the U.S. typically fall into the 40-60% range)
– Our FY 10 farebox recovery was 76% - highest U.S. passenger railroad
• Federal funding for Amtrak totaled slightly more than $1.5 billion in FY 2010
– $563 million for operating expenses– $1 billion for capital needs

2
Congressional overview
• Focus is on fiscal austerity – and the legislative environment will be challenging
• Major uncertainty surrounding the legislative agenda:– Transportation reauthorization?
– Debt ceiling?
• Administration’s decision to focus on high speed rail is significant– Continues the precedent established with Recovery Act
funding
– We strongly support it as a visionary step, with potential to change the way America travels

3
The near-term funding situation
• House of Representatives announced proposed spending cuts for FY 11 budget on Feb 9– Originally, Approps Bill proposed $75B in spending cuts
– Amtrak level to be cut to $1.413B – slightly more than FY 08 level
– On Feb 10, Approps Committee expanded cuts to $100B
– Amtrak funding at the revised level TBA
• FY 12 budget announced yesterday– Amtrak requested $2.2B – right around the authorized funding level
– Detailed discussion on this budget won’t start for some time – but will be protracted

4
Short distance/state corridor trains
• Trains operated over relatively short distances (86-750 miles), often in partnership with states
• Are the only service at 203 of our 528 stations
• 220 daily trains – more than half our daily total
• Fastest-growing business line, and the largest one, too
• Many routes will benefit from DOT’s High Speed and Intercity Passenger Rail and TIGER grant programs
Amtrak SD Ridership by Route, 1998-2010
02,000,0004,000,0006,000,0008,000,000
10,000,00012,000,00014,000,00016,000,000
FY98FY00FY02FY04FY06FY08FY10
Year
Tota
l Rid
ersh
ipEthan Allen VermonterAlbany-Niagara Falls-Toronto DowneasterNew Haven-Springfield KeystoneEmpire Chicago-St. LouisHiawatha WolverineIllini Illinois ZephyrHeartland Flyer Pacific SurflinerCascades Capitol CorridorSan Joaquin AdirondackBlue Water Washington-LynchburgWashington-Newport News Hoosier StateKansas City-St. Louis PennsylvanianPere Marquette CarolinianCarolinian Special trains

5
Amtrak’s Northeast Corridor – what is it?
• More than half our daily trains (153 of 305), more than 1,800 daily commuter trains
• Carries more than 722,000 riders every day!
• We own (and maintain) 363 of the 457 route- miles
– 17 tunnels (six underwater tunnels to access Manhattan)
– 1,186 bridges (14 of them moveable)
• Top speeds of 150 mph for Acela Express and 125 mph for Northeast Regionals
• We carry more passengers than all the airlines put together between:
– NYC and Boston– NYC and Washington, DC
Baltimore’s B&P Tunnel:In continuous service since1873
Acela Express on the 1835Canton Viaduct – at 125mph
Susquehanna River Bridge, 1907

6
Line 15 mph (Cl I)
16-30 mph (CL II)
31-60 mph (CL III)
61-80 mph (CL IV)
81-90 mph (CL V)
91-110 mph (CL VI)
111-125 mph (CL VII)
126-150 mph
(CL VIII)
Total Track Miles
NEC Main Stem 4.7 18.8 68.4 145 144.6 273.7 267.6 195.4 1118.2Percentage 0.4% 1.7% 6.1% 13.0% 12.9% 24.5% 23.9% 17.5% 100.0%
The NEC is a bona-fide HSR operation…..
Does not include about 400 miles of miscellaneous yard tracks
•About 65.9% of the Amtrak-owned NEC Main Line trackage usable for 110-150 mph service
•Amtrak is the only company in America that maintains track for 110+ mph service
•24.7% Boston to New York Operation is High Speed (125+ MPH)
•44.9% Boston to Washington Operation is High Speed (125+ MPH)
•65.7% New York to Washington Operation is High Speed (125+ MPH)
Maximum Speeds on the NEC

7
Fleet Needs
• Age, utilization, and • Fleet age, utilization, mileage,
and demand are all issues– Hardest-run fleet in America
– Average age at an all-time high
– No capacity to accommodate growing ridership
• Issued fleet plan in 2010, updating it now
• First tranche of orders last year:– 70 electric locomotive
– 130 single-level long distance cars
Bob Pickering photo
020406080
100120140160180200
Alaska
Rail
road
Northsta
r Line (
Twin Citie
s)TRE
Tri-Met (P
ortlan
d)VRE
Sound
erCDOT
Music
City Star
Altamont
Commuter Exp
ress
MTA - Mary
land
RailRun
ner (N
M)Metr
a
NCTD - San D
iego
NJ Tran
sitCaltra
in
MBTA - B
oston
SEPTA
NICTD - S
outh
Shore
Metroli
nk - L
A
MTA MNCRR
MTA LIRR
TriRail
Utah Trans
it Auth
orityHoriz
onSurf
liner
Amfleet I
Amtrak F
leet A
verag
eAmfle
et IIHerita
geView
liner
Superl
iner
Fleet
Ave
rage
Ann
ual C
ar M
ileag
e Amtrak
Average Annual Car Mileage

8
Major fleet issues
• Age of equipment is at an all-time high:– Average Amtrak car is now older than the average car we inherited in 1971– Heritage equipment is pushing (and in some cases past) sixty years
• Lack of homogeneity (multiple classes of equipment for short and long distance and corridor service) complicates maintenance
– Complete standardization will never be possible – but we need to reduce the number of classes and mechanically distinct variants
• Sizes of equipment classes vary widely, and mass obsolescence is a problem
• Supply base is limited – lack of market demand led to market exit– Transit and commuter rail have taken attention of remaining manufacturers– Amtrak needs to take a lead, or:
- Market will offer equipment not optimized for intercity service- Limited range of choices may lead to increased cost and risks- Industry may continue to atrophy

9
Major components of this fleet plan
• Set limits on maximum equipment age (“lifing”)– Need to get away from 60 year old equipment
– Need to determine useful life and commercial life- Useful life is the maximum period we want to
have equipment in service – 30 years for engines,40 years for passenger cars
- Commercial life is the period when the equipmentis maintainable, technically viable and commerciallyattractive for its designed service
• Model ridership demand in future years
• Develop assumptions for costs and production/purchase rates
• Include associated costs (acquisition, maintenance, etc.)
• Create demand for every type of equipment, and provide potential economies of scale and consistency for suppliers and state partners

10
Major components of this fleet plan (cont’d)
• Plan designed for 2% ridership growth on existing services – but procurement model allows us to easily expand order sizes based on
– Requirements of new corridors (Sec 305 committee)
– Large-scale growth beyond conservative levels
• Average cost is about $743 million per year
• Total anticipated cost in 2009 dollars will be– $11 billion through 2023
– $23 billion through 2040
– These costs include associated improvements to maintenance facilities, provision of spare parts, and provision of fleet overhaul services for the period
• Total fleet procurement over a 30 year period will include more than 2,500 cars and 700 locomotives, independent of needs for projected state-supported corridors and new services
11
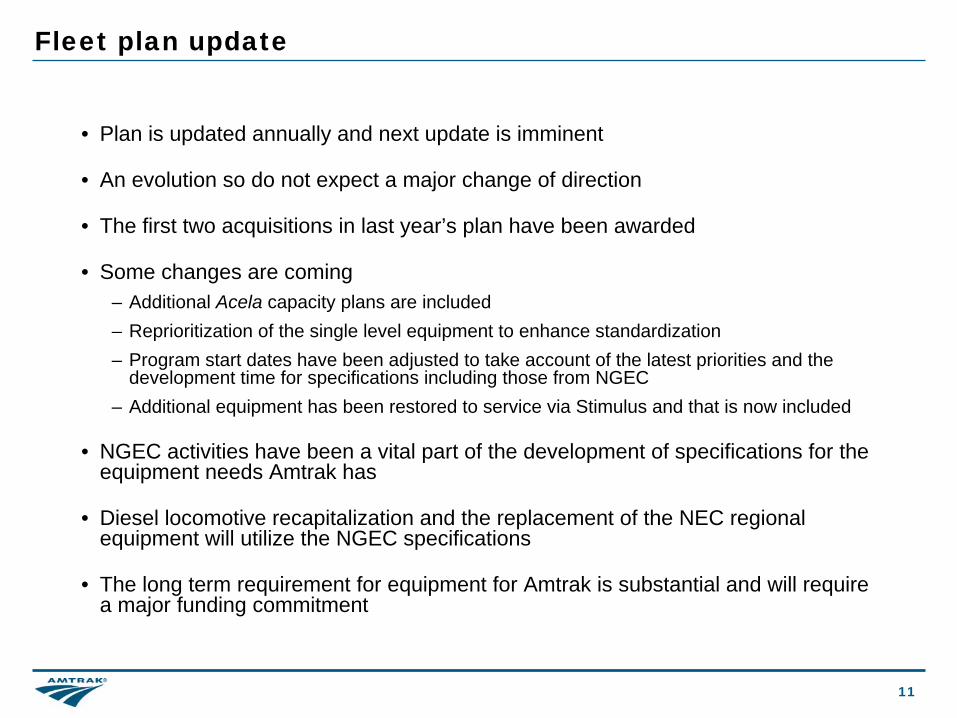
Fleet plan update
• Plan is updated annually and next update is imminent
• An evolution so do not expect a major change of direction
• The first two acquisitions in last year’s plan have been awarded
• Some changes are coming– Additional Acela capacity plans are included– Reprioritization of the single level equipment to enhance standardization– Program start dates have been adjusted to take account of the latest priorities and the
development time for specifications including those from NGEC– Additional equipment has been restored to service via Stimulus and that is now included
• NGEC activities have been a vital part of the development of specifications for the equipment needs Amtrak has
• Diesel locomotive recapitalization and the replacement of the NEC regional equipment will utilize the NGEC specifications
• The long term requirement for equipment for Amtrak is substantial and will require a major funding commitment
12
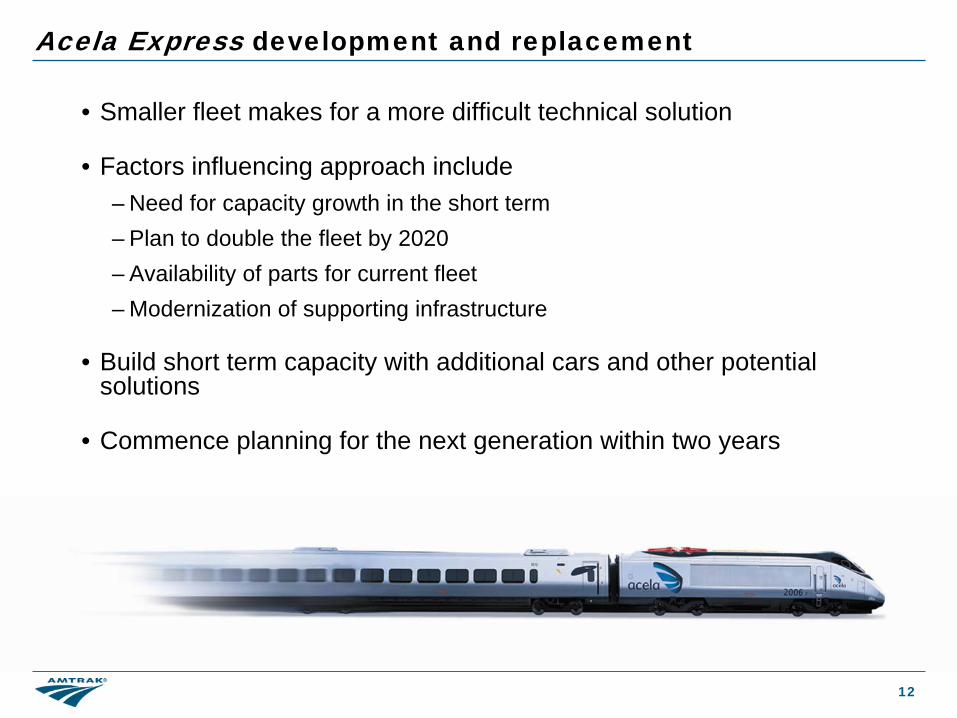
• Smaller fleet makes for a more difficult technical solution
• Factors influencing approach include– Need for capacity growth in the short term– Plan to double the fleet by 2020– Availability of parts for current fleet– Modernization of supporting infrastructure
• Build short term capacity with additional cars and other potential solutions
• Commence planning for the next generation within two years
Acela Express development and replacement

13
Electric Locomotive purchase
• Variant of popular Siemens Euro-sprinter design
– Revenue service speed of 125mph, max speed of 135 mph
– Sufficient horsepower to pull 18 cars at 125 mph
• Base order will be for 70 locomotives
• Incorporates several key features– Regenerative braking– Redundant HEP power– Compliant w/ CFR238A as of Jan 2010 for front
end strength
• Total cost about $466M
Planned FY10 FY11 FY12 FY13 FY14 FY15 FY16Delivery 0 0 0 10 27 33 0

14
Long Distance Single Level Car (LDSL) purchase
• Modeled on existing Viewliner fleet to: – Ensure uniformity of appearance,
– Limit variation in part and component pools
• Will be able to operate anywhere on the system at up to 125 mph
• Bag-dorms will free up badly-needed revenue space on single-level LD trains (e.g., Cardinal)
• Will finally allow retirement of remaining Heritage equipment:
– Baggage cars
– Dining cars
• Estimated cost $298.1M
CAR TYPE BASE ORDER OPTIONS
BAGGAGE / DORM 25 15
SLEEPER 25 10
DINER 25 15
BAGGAGE 55 30
TOTAL 130 70
Planned Delivery: FY11 FY12 FY13 FY14 FY15
Number of cars 0 2 57 71 0

15
Implications of these Rolling Stock purchases
• New equipment will replace all existing:– Electric locomotives currently in service
– Heritage equipment
• Existing equipment will not necessarily be replaced on a one-for-one basis:
– Single level dining car fleet will grow by five cars
– Sleeper purchase will add 25 cars
– At a minimum, will ensure improvements in availability, passenger satisfaction
– Bag-dorms will free up revenue space in Viewliner trains, possibly in shorter Superliner trains
• 110mph speed restrictions for long distance trains on the NEC will end– Trip times for NYC-DC leg of Cardinal, Crescent, Silver Service, Palmetto and
Carolinian can be shortened

16
Next round of Amtrak rolling stock purchases
• Amtrak anticipates utilizing the PRIIA 305 Specifications to acquire additional equipment and continue implementation of its Fleet Plan in the upcoming year. – Diesel Road Locomotives
– Diesel switchers
– Single Level Cars
– Bi-Level Cars
– Additional Acela car procurement
• Expect to begin Acela II procurement in 2020
17
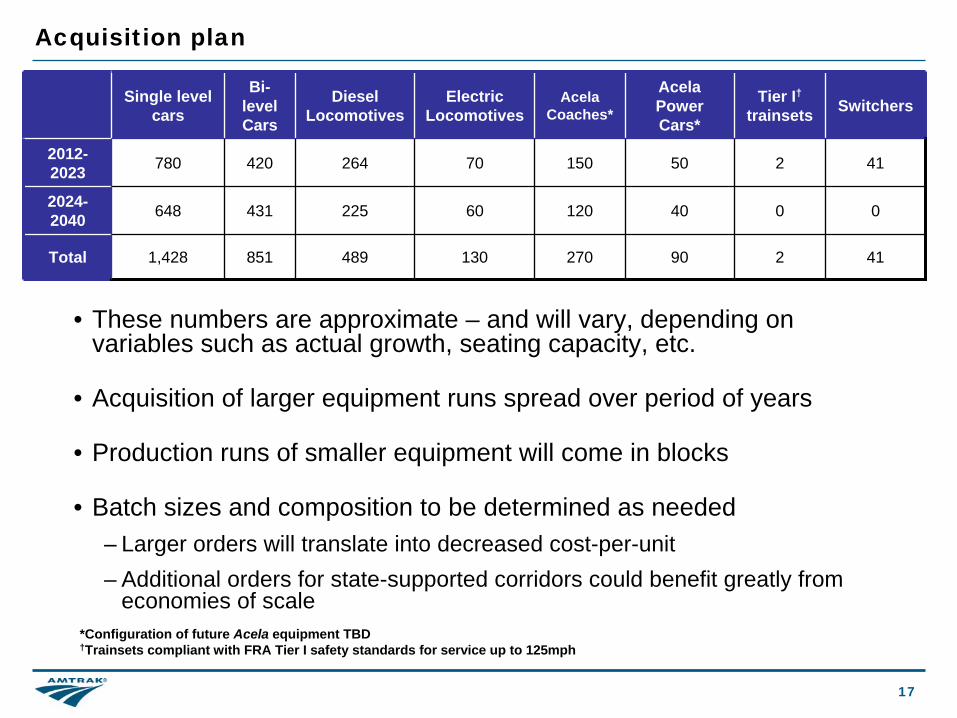
Acquisition plan
• These numbers are approximate – and will vary, depending on variables such as actual growth, seating capacity, etc.
• Acquisition of larger equipment runs spread over period of years
• Production runs of smaller equipment will come in blocks
• Batch sizes and composition to be determined as needed– Larger orders will translate into decreased cost-per-unit– Additional orders for state-supported corridors could benefit greatly from
economies of scale
Single level cars
Bi- level Cars
Diesel Locomotives
Electric Locomotives
Acela Coaches*
Acela Power Cars*
Tier I†
trainsets Switchers
2012- 2023 780 420 264 70 150 50 2 41
2024- 2040 648 431 225 60 120 40 0 0
Total 1,428 851 489 130 270 90 2 41
*Configuration of future Acela equipment TBD†Trainsets compliant with FRA Tier I safety standards for service up to 125mph

18
Working with the 305 Committee
• Incorporating 305 Activities into Amtrak Fleet Strategy– Amtrak anticipates utilizing the PRIIA 305 Specifications to acquire
additional equipment and continue implementation of its Fleet Plan in the upcoming year.
– Utilizing the Section 305 Specifications and Processes will allow for:- Standardization- Opportunities for state corridor(s) joint acquisitions/partnerships
- Economies of Scale- Orders of sufficient size to help rebuild the domestic equipment
industry- Create pool of equipment that can be flexibly deployed as necessary
• Implementation framework will be of great importance– Managerial structure– Financing mechanisms
• 305 Committee work is important to us – and to the future of passenger rail in America