an organizational perspective on patenting and...
TRANSCRIPT

OrganizationScienceVol. 25, No. 6, November–December 2014, pp. 1744–1763ISSN 1047-7039 (print) � ISSN 1526-5455 (online) http://dx.doi.org/10.1287/orsc.2014.0911
© 2014 INFORMS
An Organizational Perspective onPatenting and Open Innovation
Ajay BhaskarabhatlaErasmus School of Economics, Erasmus University Rotterdam, 3000 DR Rotterdam, The Netherlands,
Deepak HegdeStern School of Business, New York University, New York, New York 10012,
Achange in U.S. patent law in the early 1980s increased the value of patents, particularly for firms in the electronics andsemiconductors industry, yet many of the industry’s leading firms did not embrace patenting after the change. We show
through an in-depth study of International Business Machines (IBM), the world’s largest patentee, that the company’s practicesduring much of the 1980s discouraged patenting. IBM adopted pro-patent management practices in 1989 after the installationof a new research and development head and in the face of faltering financial performance. IBM’s increased patenting andlicensing activities improved its financial bottom lines but curtailed its industry-wide knowledge spillovers. These causes andconsequences of pro-patent practices are visible in several other large U.S. corporations. Thus, in the context of the “patentexplosion” of the 1980s, we show that intraorganizational forces such as inertia, financial pressures, and new leadershipshaped established firms’ uptake of pro-patent management practices and their success. Our findings also suggest thatpro-patent practices associated with “open innovation” may stem the free flow of knowledge across organizational boundaries.
Keywords : technology and innovation management; patents and intellectual property rights; diffusion of innovation; strategyimplementation; management processes; strategy and policy; strategy and firm performance; external environment;organization and management theory; organizational processes
History : Published online in Articles in Advance May 12, 2014.
1. IntroductionA key task of managers is to deal with change (Mintzberg1990). Ecological and evolutionary theorists contendthat managers in large and established firms are slow torespond to change. This inertia in organizations leads topoor financial performance and, sometimes, their death(Hannan and Freeman 1977, Henderson and Clark 1990,Rumelt 1995, Christensen 1997, Tripsas and Gavetti2000). Yet anecdotal observations from several industriessuggest that some established organizations were slowto respond to change but managed to renew themselvesand thrive in their dynamic environments (see Tushmanand Romanelli 1985, Agarwal and Helfat 2009). Whatloosened the grip of inertial forces on these organizationsand stimulated their response to change? Can delayedresponse recover profitability? Does firm-specific responsehave industry-wide consequences? We take up thesequestions in the context of the U.S. “patent explosion” ofthe 1980s.
Figure 1 shows the dramatic growth in U.S. patentingafter 1983. According to patent scholars, the creation ofthe Court of Appeals of the Federal Circuit (CAFC) in1982, and its subsequent pro-patent decisions, strength-ened patent rights and led to increased patenting (Kortumand Lerner 1999, Hall 2005). This growth was pronouncedin electronics and semiconductors—industries in which
patents were traditionally not considered important forprotecting firms’ research and development (R&D) invest-ments (Hall and Ziedonis 2001). Still, not all firms withinthe electronics and semiconductors industry increasedtheir patenting immediately in response to the institutionalchange that made patents more valuable. Figure 2 revealsthe heterogeneity in the post-1983 patenting of top U.S.electronics and semiconductors corporations. In the five-year span after 1983, Hewlett-Packard (HP) increasedits patent applications by 275%, Intel by 213%, Kodakby 187%, and Texas Instruments (TI) by 168%. Moremodestly, Motorola increased its applications by 43%,Xerox by 23%, and IBM by 10%. AT&T’s patentingdecreased by 32%.
We explore the reasons behind this heterogeneitythrough an in-depth case study of the intellectual property(IP) management practices at one firm, IBM, between1979 and 1998. We focus on IBM because, as Figure 3shows, the company lagged its rivals in responding to theincreased value of patents despite being the industry’slargest R&D performer. IBM’s share of patents in theelectronics and semiconductors industry started decliningafter 1983, but the firm turned this trend around in 1989and emerged as the world’s largest patentee in 1993.
Our qualitative research documents the role played byJames McGroddy, who was appointed IBM’s director of
1744
Dow
nloa
ded
from
info
rms.
org
by [
128.
122.
201.
75]
on 2
5 M
arch
201
5, a
t 11:
48 .
For
pers
onal
use
onl
y, a
ll ri
ghts
res
erve
d.

Bhaskarabhatla and Hegde: An Organizational Perspective on Patenting and Open InnovationOrganization Science 25(6), pp. 1744–1763, © 2014 INFORMS 1745
Figure 1 Successful U.S. Patent Applications by PatentApplication Year, 1975–1998
No.
of a
pplic
atio
ns(thousands)
research in 1989, in implementing pro-patent managementpractices at the company. We quantitatively isolate theconsequences of IBM’s adoption of pro-patent practicesby employing a differences-in-differences approach thatcompares IBM’s patenting propensity, and its effects, tothat of 114 control-group firms in its industry before andafter 1989. We show that the adoption of pro-patent prac-tices increased IBM’s patent propensity, led to an increasein its licensing revenues, and enhanced profitability. Butaggressive patenting and patent enforcement appears tohave stifled IBM’s industry-wide knowledge spillovers.
The objective of our study is to provide a nuancedunderstanding of the ways in which established firmsresponded to an exogenous change in their IP environmentand the consequences of their response. Accordingly,our in-depth study of one firm allows us to complementour quantitative analysis with a qualitative descriptionof both the circumstances that led to the adoption ofpro-patent management practices and the mechanisms
Figure 2 Growth in Patenting by Top Patentees in Electronicsand Semiconductors, 1983–1988
No.
of a
pplic
atio
ns
Notes. This graph shows the growth of successful U.S. patentapplications for eight of the largest U.S. corporate patentees insemiconductors and electronics by application year, with 1983 as thereference year. In 1983, AT&T had 493, HP 59, IBM 580, Kodak 242,Xerox 216, Motorola 250, TI 132, and Intel 16 (successful) patentapplications.
Figure 3 IBM’s Share of Patents by Compustat Firms in ItsIndustry, 1979–1998
10
1979
1981
1983
1985
1987
1989
1991
1993
1995
1997
14
18
22
26
30
34
38
Notes. This graph shows IBM’s share of successful U.S. patentapplications by Compustat firms in the electronics and semiconductorindustries for application years 1979–1998. Compustat firms arethe 114 firms that (1) had annual Compustat records for at least15 years, without gaps, between 1979 and 1998 and (2) had atleast one successful patent application in the USPTO patent classesof IBM patents during the period. The vertical line indicates theintroduction of pro-patent management practices at IBM in 1989.
through which the practices affected private returns andknowledge spillovers. We also extend our study to eightother large U.S. corporations, which, along with IBM,owned 57% of the patents assigned to publicly listed U.S.firms in the electronics and semiconductors industry. Wefind that these firms, similar to IBM, adopted pro-patentpractices typically following changes in leadership andin the shadow of declining financial performance. Theadoption of the practices by these firms had a strikingimpact, as in IBM’s case, on increasing their privatereturns but decreasing knowledge spillovers.
Our findings offer several insights for the developmentof theory on organizational change and the managementof innovation. Neoclassical economic theories imply thatprofit-maximizing firms seamlessly adapt to changes intheir environment to maximize profits; deviations fromthis norm are argued to be due to informational frictions(see Bloom et al. 2013). Here, we show that establishedU.S. corporations delayed the adoption of pro-patentmanagement practices in the aftermath of a well-knownlegal change that increased the value of patents. It isunlikely that this delayed adoption was a consequenceof informational constraints. Instead, our case studyof IBM suggests that inertial forces, reinforced by the“open-science” norms at the company and entrenchedleadership, played a role in resisting adoption—a findingconsistent with the literature on the ossifying effects oforganizational inertia (Hannan and Freeman 1977, Tripsasand Gavetti 2000, Siggelkow 2001). Our analysis alsoshows that financial pressures and new leadership explainthe eventual adoption of the practices by the laggards suchas IBM, thus underscoring the relevance of problemistic
Dow
nloa
ded
from
info
rms.
org
by [
128.
122.
201.
75]
on 2
5 M
arch
201
5, a
t 11:
48 .
For
pers
onal
use
onl
y, a
ll ri
ghts
res
erve
d.

Bhaskarabhatla and Hegde: An Organizational Perspective on Patenting and Open Innovation1746 Organization Science 25(6), pp. 1744–1763, © 2014 INFORMS
search, rather than profit maximization, as a driver oftransformation (in the spirit of Cyert and March 1963,Nelson and Winter 1982, and, more recently, Greve 2008).Hence, not just the shock of environmental change butdeteriorating financial health and new leadership playkey roles in overturning the forces that resist change inestablished corporations. Unlike the preponderance ofstudies that establish incumbent firms’ failure to overturninertial forces in the face of change (Tripsas and Gavetti2000 present an excellent survey of such studies), ourstudy demonstrates their successful transformation andprovides an account of the circumstances surrounding thetransformation. From a methodological perspective, wecontribute a careful assessment of the consequences ofpro-patent practices to the literature on the management ofinnovation (Grindley and Teece 1997, Rivette and Kline2000, Somaya et al. 2007, Di Minin and Bianchi 2011).
A recent line of work on “open-innovation” businessmodels heralds the benefits of pro-patent practices, includ-ing licensing, for organizational profitability and theindustry-wide diffusion of innovation (Chesbrough 2006).Our findings suggest that firms’ pursuit of profits throughaggressive enforcement of their patent rights comes atthe cost of foreclosing the diffusion of knowledge acrossorganizational boundaries. To the extent that the adoptionof pro-patent practices is associated with superior profitsfor the adoptees, at least in the short run as suggestedby our analysis, we provide a counterpoint to argumentsthat the shift away from open-science norms decreasesfirms’ productivity (as argued in Cockburn and Hender-son 1998). Although open-science norms may augmentfirms’ productivity by equipping them to recognize andexploit external knowledge, they may also thwart firms’attempts to appropriate the returns from their proprietaryknowledge.
2. IP Management Practicesin the 1980s and 1990s
IP management refers to firm-specific practices thatseek to profit from the organization’s intellectual assets(Grindley and Teece 1997). These practices include man-agement’s choice of mechanisms (e.g., patents, copyrights,defensive publications, secrecy) to protect the company’sIP; formal and informal organizational incentives thatalign employee behavior with the chosen mechanism;and the implementation of specific strategies (e.g., licens-ing, cross-licensing, litigation) to profit from intellectualproperty.
2.1. The Post-1983 Patent ExplosionThe number of successful patent applications at the U.S.Patent and Trademark Office (USPTO) varied withina narrow range between 61,000 and 66,000 each yearfor a decade before 1983 but grew to 104,000 in 1992.According to Hall and Ziedonis (2001), this growth in
patenting was spurred by a series of legal changes, culmi-nating in the establishment of the CAFC in 1982, whichstrengthened patent holders’ rights. In the years followingthe CAFC’s establishment, patent holders started assertingtheir patents, particularly against product manufacturersin “complex-product” industries—industries such as elec-tronics and semiconductors, in which a single product canembody the IP covered by hundreds of patents (Cohenet al. 2000, Hall 2005).1 In many cases, individual patentholders succeeded in obtaining not just millions of dollarsin royalties and damages from product manufacturers butalso injunction orders that prevented the manufacturersfrom selling their products (e.g., Polaroid’s well-publicizedinfringement case against Kodak forced the latter to shutdown its instant-camera business in 1985 and cost thecompany upwards of a billion dollars). Thus, strongerpatent rights brought about by the CAFC’s establishmentin 1982 increased the value of patents both as offensiveweapons and as defensive shields in legal battles, andfirms, particularly in the electronics and semiconductorsindustry, responded to the increased value of patents byramping up their patenting.
2.2. IP Management at IBMWe have defined IP management as firm-specific practicesthat seek to profit from the firm’s intellectual assets.These practices include a firm’s choice of mechanisms,such as patents, to protect its IP, incentives that align thechoice with employee behavior, and strategies to profitfrom IP. According to Grindley and Teece (1997), largeU.S. corporations in the electronics and semiconductorindustries started managing their IP in the 1980s todefend themselves against patent litigation and to profitfrom patent licensing, cross-licensing, and litigation. Forexample, TI nearly doubled its patent applications from132 in 1983 to 236 in 1984 and, in 1985, demandedroyalties from several Japanese companies for infringingon its “integrated circuit” and “manufacturing methods”patents. When the companies refused, TI litigated themand won $2 billion in damages and royalties between1986 and 1993. Other U.S. corporations, such as Motorola,HP, AT&T, and IBM, attempted to follow TI’s lead inadopting practices to profit from their IP (Rivette andKline 2000). Di Minin and Bianchi (2011) document theIP management practices at large telecommunicationscorporations, arguing that the practices strongly influencethe internationalization strategies of the corporations.
We focus on IP management at IBM because R&Dmanagers and patent attorneys at IBM did not file formore patents in response to either the legislative changesin 1981 that made software patentable (IBM was theworld’s leading software company at the time) or theCAFC’s formation. IBM’s R&D expenditures doubledfrom $3 billion in 1981 to $6 billion in 1987 (all monetaryfigures in this paper are in USD (2000)), but its patentapplications dropped from 589 to 541 between the same
Dow
nloa
ded
from
info
rms.
org
by [
128.
122.
201.
75]
on 2
5 M
arch
201
5, a
t 11:
48 .
For
pers
onal
use
onl
y, a
ll ri
ghts
res
erve
d.
Bhaskarabhatla and Hegde: An Organizational Perspective on Patenting and Open InnovationOrganization Science 25(6), pp. 1744–1763, © 2014 INFORMS 1747
years. In 1988, despite being the industry’s leading R&Dspender, IBM lagged its foreign rivals, such as Hitachi,Toshiba, Philips, and Siemens, in U.S. patenting. But in1993, the company emerged as the world’s top patentee,with 1,265 patent applications and 1,085 patent grants.
To gain insight into the management practices thatshaped IBM’s remarkable patenting turnaround, we inter-viewed executives who were in charge of IBM’s researchand legal divisions between 1979 and 1998. These execu-tives include Ralph Gomory (director of research, 1970–1986), John Armstrong (director of research, 1986–1989),James McGroddy (director of research, 1989–1996), Mar-shall Phelps (head of the legal division, 1991–1996),and John Cronin (head of IBM’s “Patent Factory,” 1991–1998). We also perused archival records of IBM’s internalmagazine, Think, which communicated key managementinitiatives and decisions to employees. Thus, by combin-ing the material from interviews, archival records, andscholarly articles, we were able to put together a pictureof the major events at IBM that may have affected thecompany’s patenting between 1979 and 1998.
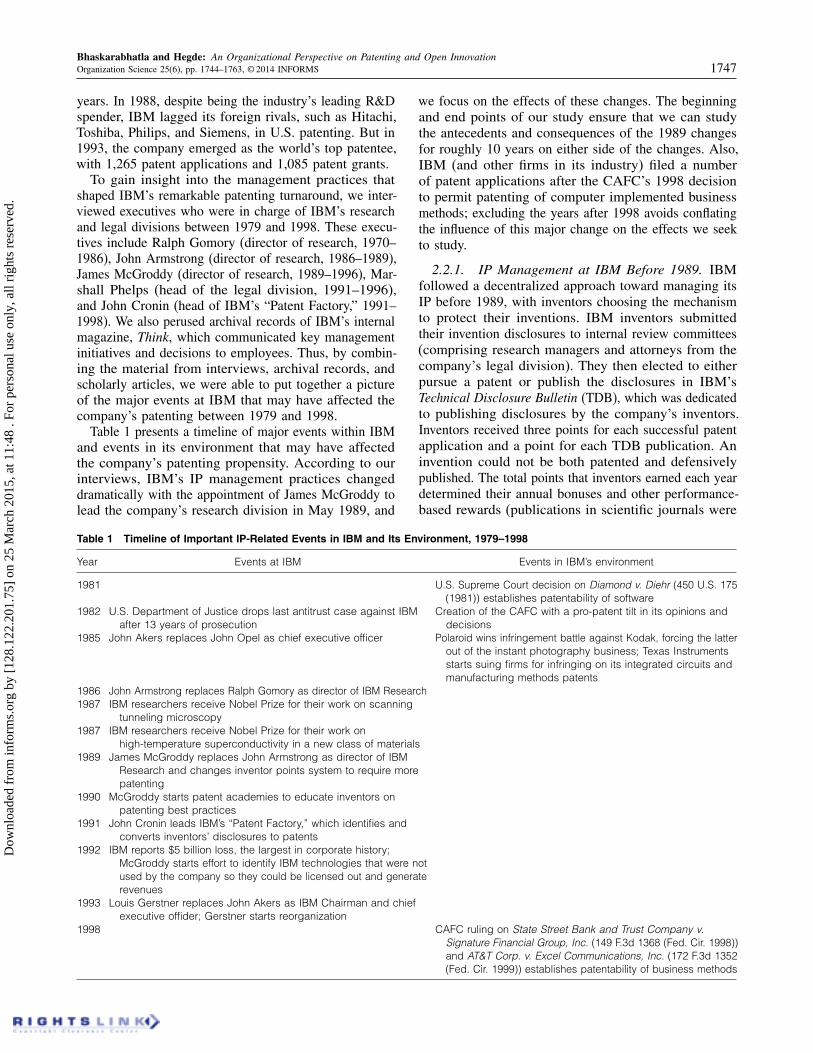
Table 1 presents a timeline of major events within IBMand events in its environment that may have affectedthe company’s patenting propensity. According to ourinterviews, IBM’s IP management practices changeddramatically with the appointment of James McGroddy tolead the company’s research division in May 1989, and
Table 1 Timeline of Important IP-Related Events in IBM and Its Environment, 1979–1998
Year Events at IBM Events in IBM’s environment
1981 U.S. Supreme Court decision on Diamond v. Diehr (450 U.S. 175(1981)) establishes patentability of software
1982 U.S. Department of Justice drops last antitrust case against IBMafter 13 years of prosecution
Creation of the CAFC with a pro-patent tilt in its opinions anddecisions
1985 John Akers replaces John Opel as chief executive officer Polaroid wins infringement battle against Kodak, forcing the latterout of the instant photography business; Texas Instrumentsstarts suing firms for infringing on its integrated circuits andmanufacturing methods patents
1986 John Armstrong replaces Ralph Gomory as director of IBM Research1987 IBM researchers receive Nobel Prize for their work on scanning
tunneling microscopy1987 IBM researchers receive Nobel Prize for their work on
high-temperature superconductivity in a new class of materials1989 James McGroddy replaces John Armstrong as director of IBM
Research and changes inventor points system to require morepatenting
1990 McGroddy starts patent academies to educate inventors onpatenting best practices
1991 John Cronin leads IBM’s “Patent Factory,” which identifies andconverts inventors’ disclosures to patents
1992 IBM reports $5 billion loss, the largest in corporate history;McGroddy starts effort to identify IBM technologies that were notused by the company so they could be licensed out and generaterevenues
1993 Louis Gerstner replaces John Akers as IBM Chairman and chiefexecutive offider; Gerstner starts reorganization
1998 CAFC ruling on State Street Bank and Trust Company v.Signature Financial Group, Inc. (149 F.3d 1368 (Fed. Cir. 1998))and AT&T Corp. v. Excel Communications, Inc. (172 F.3d 1352(Fed. Cir. 1999)) establishes patentability of business methods
we focus on the effects of these changes. The beginningand end points of our study ensure that we can studythe antecedents and consequences of the 1989 changesfor roughly 10 years on either side of the changes. Also,IBM (and other firms in its industry) filed a numberof patent applications after the CAFC’s 1998 decisionto permit patenting of computer implemented businessmethods; excluding the years after 1998 avoids conflatingthe influence of this major change on the effects we seekto study.
2.2.1. IP Management at IBM Before 1989. IBMfollowed a decentralized approach toward managing itsIP before 1989, with inventors choosing the mechanismto protect their inventions. IBM inventors submittedtheir invention disclosures to internal review committees(comprising research managers and attorneys from thecompany’s legal division). They then elected to eitherpursue a patent or publish the disclosures in IBM’sTechnical Disclosure Bulletin (TDB), which was dedicatedto publishing disclosures by the company’s inventors.Inventors received three points for each successful patentapplication and a point for each TDB publication. Aninvention could not be both patented and defensivelypublished. The total points that inventors earned each yeardetermined their annual bonuses and other performance-based rewards (publications in scientific journals were
Dow
nloa
ded
from
info
rms.
org
by [
128.
122.
201.
75]
on 2
5 M
arch
201
5, a
t 11:
48 .
For
pers
onal
use
onl
y, a
ll ri
ghts
res
erve
d.

Bhaskarabhatla and Hegde: An Organizational Perspective on Patenting and Open Innovation1748 Organization Science 25(6), pp. 1744–1763, © 2014 INFORMS
not rewarded with points but played a significant role innominations to be appointed an “IBM Fellow,” the highesthonor given to four to nine IBM researchers each year).
Unlike successful patent applications, disclosuresrequired little additional work to be published becausearticles in IBM’s TDB were edited versions of inventors’project write-ups and typically two to three pages long.Hence, even though a single successful application couldgarner an inventor three times as many points as a publi-cation, inventors preferred to publish their disclosures asthe easiest way to earn points (McGroddy 2011). Theseincentives that encouraged disclosure via publicationsrather than patents were consistent with the open-sciencenorms at the company. IBM’s research leadership playedno small part in encouraging open-science norms: RalphGomory, the director of IBM Research between 1970 and1986, was an award-winning mathematician; his successor,John Armstrong (director of research between 1986 and1989), was a noted physicist. According to Gomory, IBMresearchers were similar to academic scientists—theyrarely worked with the company’s product-developmentand manufacturing teams and were free from the obliga-tions of contributing to the company’s financial bottomlines (Gomory 1989). Indicative of IBM’s academicorientation and the basic nature of its research, com-pany scientists won the Nobel Prize in Physics in 1986and 1987.
Scholars have traced IBM’s subdued patenting to thelate 1950s, when federal antitrust authorities viewedpatenting by large corporations as attempts to strengthentheir monopoly and issued “consent decrees” that requiredthe corporations to compulsorily license their patents(Scherer 1987). Although the antitrust authorities droppedtheir last case against IBM in 1982, the company continuedto patent only a small fraction of its inventions eachyear, primarily to enhance its prestige and recognize itsprominent inventors (Bhaskarabhatla and Pennings 2013).Thus, a long history of antitrust stipulations, inventorincentives, and open-science norms at IBM discouragedpatenting, and in 1988, IBM inventors patented only 18%of their disclosures, choosing to publish the rest.
2.2.2. IP Management at IBM, 1989 and After. JamesMcGroddy started his professional career at IBM in 1965and was appointed director of research in May 1989after his predecessor, John Armstrong, was promoted tochief scientific officer. McGroddy had worked on manycritical projects at IBM, including the creation of theenormously successful display technology for IBM’sThinkPad line of laptop computers, and was seen asa natural successor to Armstrong in a company thatrewarded a combination of merit and seniority in itspromotion decisions (Buderi 2000).
Immediately after his appointment, McGroddy imple-mented several changes to IBM’s IP management. First,he established patents as the primary mechanism to protect
IBM’s inventions. McGroddy started an internal “patentacademy” to “educate all technical professionals on writ-ing, evaluating and processing patent disclosures andwhat makes a good patent” (Boyer 1990, p. 11). Workingwith the legal division, he directed John Cronin to set upan internal “patent factory.” Cronin traveled to IBM’svarious R&D locations with a small team of experiencedinventors and attorneys, unearthed hundreds of inventionsthat were previously neglected, and converted them topatent applications. According to Lynam (2009), the“Patent Factory team expanded its reach throughout IBM’smicroelectronics installations and helped the companybecome the country’s top patentee.”
Second, McGroddy changed inventors’ incentives toalign with his chosen mechanism to protect the company’sIP by requiring them to earn more “points,” which deter-mined their annual compensation, from patent applications.According to McGroddy (2011),
Rewards [for IBM inventors] were given to “write andpublish” and “write and file for patent.” For instance, somehad an arrangement with their patent attorney—to get theirinventions rated for “write and publish,” which yieldedpoints quickly. The policy of publishing literature andorganizing it for the benefit of everyone did not seem to bea good strategy. After becoming R&D head, [I] unilaterallyset standards for the fraction of inventions that had to be“write and file” for rewards. At least [a] quarter or halfhad to be “write and file” now.
Third, McGroddy started a “business developmentgroup,” whose responsibilities included patent licensing.Marshall Phelps, a leading IP attorney, was put in chargeof IBM’s out-licensing efforts, and his team was asked togenerate enough licensing revenues to fund a significantportion of the company’s R&D expenditures. Inventorswere also awarded additional bonuses if their patentsreceived licensing revenues. In McGroddy’s words, “If apatent yielded licensing revenues, inventors of the patentwere given $20,000 to $50,000. Even more money ifrevenues were great” (McGroddy 2011).
Apart from the above changes, IBM also adopted otheroperational practices to bring down its patenting costs.For example,
IBM has struck this balance between the volume and costof patenting using an entity it refers to as the virtual lawfirm. The company recruits its retiring patent attorneys,along with retirement eligible attorneys seeking a stay-at-home work/life balance. It associates these provenperformers with one of its outside counsel and guaranteesthem levels of patent application and prosecution workat fixed fees. This win–win strategy generates a largestable of company-savvy, technologically experiencedpatent practitioners at rates untouchable in a traditionallaw firm-corporate relationship.
(Davis and Harrison 2001, p. 33)
In a decade since the adoption of its pro-patent practices,IBM increased its successful patent applications by 492%—from 637 in 1988 to 3,777 in 1998. IBM inventors
Dow
nloa
ded
from
info
rms.
org
by [
128.
122.
201.
75]
on 2
5 M
arch
201
5, a
t 11:
48 .
For
pers
onal
use
onl
y, a
ll ri
ghts
res
erve
d.

Bhaskarabhatla and Hegde: An Organizational Perspective on Patenting and Open InnovationOrganization Science 25(6), pp. 1744–1763, © 2014 INFORMS 1749
elected to patent nearly 85% of their disclosures in 1998(compared with 18% in 1988), and the company stoppedpublishing its TDB in the same year.
2.2.3. Why Did IBM’s IP Management Change in1989? IBM’s executives and archival records suggest thatthe company’s pro-patent shift was in response to changesin its IP environment brought about by the CAFC’sestablishment in 1982, but it was catalyzed by IBM’snew leadership and financial pressures on IBM Research.Jack Kuehler, president of IBM between 1989 and 1993,communicated the reasons for the company’s pro-patentshift to the company’s employees as follows:
A series of new laws in the [United States]—plus a much-improved court system for handling disputes [the CAFC]—are helping patent holders protect their rights better thanbefore 0 0 0 0 From a simple means of protecting inventionspatents have evolved into competitive weapons. Recentcases before the courts have resulted in multimillion dollarsettlements affecting product line and even corporateprofitability in what are now high-stakes battles 0 0 0 0 Beinga world-class manufacturer and marketer is not enough.You need to own the right to compete. That’s why IBM isencouraging more patenting of inventions.
(Boyer 1990, p. 10)
Why did IBM respond to the 1982 changes in itsenvironment only in 1989, several years after other firmsin its industry—such as TI, Kodak, HP, and Motorola—started enhancing their patent portfolios? Our discussionswith McGroddy, Gomory, and other IBM executivessuggests that the following two factors explain the timingof IBM’s response:
• Leadership change: IBM was engaged in an antitrustbattle with the U.S. Department of Justice (DOJ) between1956 and 1982. During this time, IBM was restrictedfrom enforcing its patents through a consent decree thatrequired compulsory licensing of its patents. Althoughthe DOJ dropped its last antitrust case against IBM in1982, incumbent executives were unwilling to change thecompany’s approach toward patenting. The open-scienceculture nurtured by IBM’s academically oriented R&Dleadership until 1989 contributed to this resistance. Theappointment of Gomory as director of IBM Research in1989 may have made it easier to step away from theseopen-science norms and adopt pro-patent managementpractices.
• Financial troubles: IBM’s 1989 R&D budget, $7.2 bil-lion, was higher than in any previous year. But thecompany’s gradual financial decline in the late 1980sincreased the pressure on its R&D division to contributeto the company’s revenues (Buderi 2000). IBM’s R&Dbudget was cut to $5.2 billion in 1992 and to $3.9 billionin 1993, and 25% of IBM’s 3,400-odd research workforcewere laid off between 1991 and 1993. IBM’s financialdecline and the growing chorus of demands for R&D tocontribute to its profitability may have motivated the pro-patent switch, since after the legal changes in 1982, firms
were actively deploying patents to either earn licensingrevenues or act as “bargaining chips” in negotiations toaccess to others’ technologies.
3. Did IP Management ChangesAffect Patenting?
3.1. The Effect of the 1989 Changes inIBM’s IP Management
Our qualitative research reveals that McGroddy’s appoint-ment triggered IBM’s adoption of pro-patent IP manage-ment practices in 1989. Around the same time, however,IBM’s R&D was undergoing a shift toward more appliedtechnologies, and there was an industry-wide increasein patenting propensity. To isolate the effects of IBM-specific pro-patent management on patenting, we employa differences-in-differences analysis that compares IBM’spatenting propensity to that of a control group of largeelectronics and semiconductor firms before and after 1989.The analysis controls for several observable companycharacteristics, including R&D intensity, capital invest-ments in plant and equipment, scale, and other variablesthat determine patenting. The baseline “patent productionfunction” we estimate can be stated as follows:
PAT it = � log RDit +� log PEit +� IBM i +
1998∑
t=1979
�tTt
+
1998∑
t=1979
�t4Tt × IBM i5+∑
�Iit + �it1 (1)
where PAT denotes the number of successful patent appli-cations by firm i in year t.2 The explanatory variablesinclude R&D expenditures, the most important deter-minant of a firm’s number of patent applications. Wefollow Hall and Ziedonis (2001) in using investmentsin plant and equipment as a predictor of the propensityto patent for defensive purposes (since firms’ incentivesto protect themselves against patent-infringement suitsrises in proportion to their sunk investments in plantand equipment). We use three-year moving averagesfor R&D and plant and equipment (P&E) expenditures(i.e., the average of expenditures during years t, t− 1,and t − 2) to smooth investments and to account forthe fact that a firm’s patenting during any year is mostlikely to be affected by contemporaneous and past-yearinvestments.3 We normalize R&D and P&E expendituresby corresponding-year sales before calculating the movingaverages to avoid confounding their effects with theinfluence of size and scale. Thus, the variables RD and PEin the equation denote R&D intensity and capital intensity,respectively. Four control variables comprise I : three-year moving average of revenues (proxy for size/scale);patenting age (proxy for patenting experience); a dummyindicator set to zero if the firm reported R&D expen-ditures for the years t, t − 1, or t − 2; and a variable
Dow
nloa
ded
from
info
rms.
org
by [
128.
122.
201.
75]
on 2
5 M
arch
201
5, a
t 11:
48 .
For
pers
onal
use
onl
y, a
ll ri
ghts
res
erve
d.

Bhaskarabhatla and Hegde: An Organizational Perspective on Patenting and Open Innovation1750 Organization Science 25(6), pp. 1744–1763, © 2014 INFORMS
that counts the number of years between 1979 and 1998for which Compustat data were not available for thefirm (this variable does not vary with t5. Several othersbefore us, including Hall and Ziedonis (2001), Bessenand Hunt (2007), Somaya et al. (2007), and Hegde et al.(2009), have estimated the patent production functionwith the above set of variables but in different empiricalcontexts. The 20 dummy variables for each year between1979 and 1998 in T represent year-specific effects, suchas technological and legal changes, that influence thepatenting of all firms in the sample, and the interactionterms of the year-specific dummies with the IBM dummy(IBM) identify IBM-specific patenting trends.
The estimation sample consists of 2,009 firm-yearobservations for the 115 U.S. publicly traded electronicsand semiconductor firms, including IBM, between 1979and 1998. We identified the control-group firms as thosethat had patented at least once in the same USPTOtechnology classes as IBM’s patents and whose mainline of business was “electronics and semiconductors”according to Compustat. We do not distinguish betweenthe subindustries within electronics and semiconductorsbecause the large corporations in our sample, includingIBM, operated in multiple subindustries within electronicsand semiconductors, sometimes changing their Compustat-assigned subindustry category during the period of ourstudy (however, we address the consequences of IBM’schanging technological focus on its patenting below). Weretained only firms with at least 15 continuous years ofCompustat records during our 20-year study to avoidmaking assumptions about missing records and to ensurecomparability with IBM. We then matched the annualCompustat record of each firm to its total number ofsuccessful U.S. patent applications that year.
Between 1979 and 1998, on average, IBM spent $5.1 bil-lion annually on R&D and applied for 1,281 patents,whereas control-group firms spent $2 million annuallyon R&D and applied for 58.4 patents. Despite thesedifferences in research inputs and outputs, the annualpatent/R&D$ ratio for IBM, at 0.1 patents per millionR&D$, is similar to that for the average control-groupfirm until 1989. Figure 4 shows that after a sharp upturnin 1990, the ratio rose to 0.8 patents per million R&D$ in1998 for IBM, whereas the average control-group firmsgrew at a much slower rate to 0.18 in 1998.4
We next investigate differences in the conditional patent-ing propensities of IBM and the control-group firms byestimating the multivariate function in Equation (1). Weemploy the Poisson pseudo-maximum-likelihood (PPML)estimator, which imposes less restrictive distributionalassumptions than other count-variable estimators (seeSantos Silva and Tenreyro 2006, 2010).5 We also ensurethat negative binomial regressions, which are convention-ally employed in the presence of overdispersion, yieldqualitatively similar estimates (see Hausman et al. 1984).6
The PPML estimates obtained by fitting our sample of
Figure 4 Patents per Million R&D Dollars of IBM and ControlGroup Firms, 1979–1998
Notes. The light grey line with the square marker represents theratio of IBM’s successful patent applications to its R&D expenditures(in USD (2000) million), and the dark grey line with the diamondmarker represents the same ratio for the average control-groupfirm. Control-group firms are the 114 Compustat firms described inthe Figure 3 notes. The vertical line indicates the introduction ofpro-patent management practices at IBM in 1989.
2,009 firm-year observations to (1) are as follows (num-bers in brackets represent robust standard errors clusteredat the firm level):
PAT it = 7071 log RDit︸ ︷︷ ︸
2037
+0038 log PEit︸ ︷︷ ︸
0046
−0012 IBM i︸ ︷︷ ︸
0029
+
1998∑
t=1979
�tTt +1998∑
t=1979
�t4Tt × IBM i5+∑
�Iit3
log likelihood = −5210610 (2)
The estimates confirm that R&D intensity is a signifi-cant predictor of patenting propensity. The unreportedestimated coefficients for sales and the indicator variabledenoting firm-years with nonmissing R&D data are posi-tive and significant at p < 0001; for age and the numberof years of missing Compustat data, they are negativebut not statistically significant. The estimated coefficientfor IBM’s average patent propensity between 1979 and1998 is not significantly different from that of control-group firms. However, we are interested in the patentingpropensity of IBM relative to that of control-group firmsbefore and after the 1989 changes at IBM, which canbe gauged from �t for t = 4197911980119811 0 0 0 119985.Figure 5 plots these estimates and their 95% confidenceintervals after converting them to incident rate ratios(IRRs) for ease of interpretation (1979 is dropped from theregression estimations to avoid perfect multicollinearity;see Table A4 of the supplementary appendix (availableas supplemental material at http://dx.doi.org/10.1287/orsc.2014.0911) for the full set of estimates).7
Figure 5 shows that for given levels of R&D intensity,P&E intensity, revenues, and other variables, IBM’spatent propensity is not significantly different from that
Dow
nloa
ded
from
info
rms.
org
by [
128.
122.
201.
75]
on 2
5 M
arch
201
5, a
t 11:
48 .
For
pers
onal
use
onl
y, a
ll ri
ghts
res
erve
d.

Bhaskarabhatla and Hegde: An Organizational Perspective on Patenting and Open InnovationOrganization Science 25(6), pp. 1744–1763, © 2014 INFORMS 1751
Figure 5 PPML Estimates of Trends in Patenting for IBM andControl-Group Firms
0
1980
1982
1984
1986
1988
1990
1992
1994
1996
1998
0.5
1.0
1.5
2.0
2.5
3.0
3.5
4.0Estimated patent propensity of IBM(relative to control group)95% confidence interval
Notes. The light grey line with square markers represents PPMLestimates of patenting propensity for IBM (estimated coefficientsfor IBM × 1980–1998 year dummies) relative to control-group firms.The PPML estimates are presented as incident rate ratios; hence,an estimate of 1 indicates that IBM and the control group firmshad identical patenting propensity. The dotted lines represent 95%confidence intervals (CIs) around the estimates. The vertical lineindicates the introduction of pro-patent management practices atIBM in 1989.
of control-group firms before 1989, experiences a clearuptick immediately after 1989, and ends up 2.3 timeshigher than control group firms in 1998 (an IRR estimateof 1 for � indicates that IBM’s patenting rate is similarto that of control-group firms; an estimate greater than1 indicates IBM’s patenting propensity is higher thancontrol-group firms).
The above estimation restricts the patent/R&D andpatent/P&E relationships (� and �, respectively) to beidentical for IBM and control-group firms, but the rela-tionships may have changed for IBM in ways that theireffects are correlated with that of pro-patent IP manage-ment practices. For example, and as discussed before,IBM’s R&D may have yielded more patentable inventionsafter 1989 because of a shift in the company’s research,thus compromising our interpretation that the post-1989increase was due to IP management changes. One way totease out the effects of IBM-specific changes in the rela-tionship between the company’s R&D and patenting is toinclude “triple-interaction terms” in the regressions—i.e.,terms obtained by multiplying the IBM dummy, the R&Dintensity variable, and the year dummies. However, suchtriple-interaction terms are inconsistently estimated innonlinear models, and we would have to include multipletriple-interaction terms to partial out the effects of thechanging relationship between other variables (e.g., P&Eintensity) and patenting. Hence, we instead estimate theregressions in four five-year subperiod samples withtwo-way interaction terms (IBM × RD and IBM × PE) toallow for changes in IBM-specific relationships betweenthe two explanatory variables and patenting across thesubperiods. We also include operating income and its
interaction with IBM to control for IBM-specific changesin financial performance.
Table 2 shows that the estimated coefficient for theinteraction term of IBM and R&D intensity is significantlypositive for 1979–1983 and 1984–1988, but it turnsnegative for the periods 1989–1993 and 1994–1998. Thisobserved inverse relationship between patenting and R&Dintensity for the later subperiods reflects the observationthat IBM became less research intensive while squeezingmore patents out of its R&D dollars in the post-1989years.8 Bessen and Hunt (2007) found a similar inversecorrelation between software patents and R&D intensityand interpreted this as evidence for the decreased cost ofsoftware patenting relative to R&D. The IBM-specificrelationship between P&E expenditures and patenting alsoturns negative for 1994–1998, suggesting that the companywas filing for more patents to protect proportionatelylower levels of capital investment in the later periods. TheIBM-specific relationship between changes in operatingincome and patenting switches from positive to negativein the last two subperiods, suggesting that increases inpatenting followed declining financial performance.
The estimated coefficients for the IBM dummies con-firm that IBM-specific patent propensity was significantlylower than that of the control-group firms during thesubperiods 1979–1983 and 1984–1988 and significantlyhigher during 1989–1993 and 1994–1998. Hence, IBM-specific factors other than changes in the company’sR&D, P&E, or operating income appear to have playeda significant role in increasing its patenting propensity(relative to control group firms) after 1989.
3.2. Alternative ExplanationsOur differences-in-differences analysis shows that con-trolling for the observable determinants of patenting,IBM’s patenting rate increased relative to other firms inits industry after 1989. Our qualitative and quantitativeresearch suggests that the adoption of the pro-patent IPmanagement practices at IBM in 1989 explains this jump,but could the increase be due to other influences notadequately controlled for in our regressions? We explorethree plausible alternative explanations below.
(i) Changes in IBM’s technological focus. Changesin technological focus affect patenting by changing thepatent yield of R&D. Hence, allowing for IBM-specificchanges in the patent/R&D relationship, as we havedone in the regressions, should account for changes inIBM’s R&D focus correlated with changes in patentpropensity. Still, one might argue that IBM switchedits product portfolio to more patentable technologies in1989 by making changes not captured by patent/R&D orpatent/P&E correlations. We probe this possibility furtherin Figure 6, by plotting trends in IBM’s patenting in theseven USPTO technology classes that accounted for thelion’s share of its patents (over 70%) in 1979.
Dow
nloa
ded
from
info
rms.
org
by [
128.
122.
201.
75]
on 2
5 M
arch
201
5, a
t 11:
48 .
For
pers
onal
use
onl
y, a
ll ri
ghts
res
erve
d.

Bhaskarabhatla and Hegde: An Organizational Perspective on Patenting and Open Innovation1752 Organization Science 25(6), pp. 1744–1763, © 2014 INFORMS
Table 2 PPML Estimates of Patent Propensity for IBM and Control-Group Firms, 1979–1998
Parameter 1979–1983 1984–1988 1989–1993 1994–1998
IBM −126031∗∗ −2079∗∗ 48025∗∗ 4093∗∗
6370077 600497 610877 600477log(R&D/sales) −006 5021+ 4065∗ 8015∗∗
630457 630057 620067 630087IBM× log(R&D/sales) 11688040∗∗ 29034∗∗ −819060∗∗ −0051
65030447 670177 6250067 630137log(P&E/sales) −1023∗∗ −0074 1018 2085∗∗
600257 600577 600757 600977IBM× log(P&E/sales) 70024∗∗ 0029 34060∗∗ −17019∗∗
6200057 600557 600927 610057Operating income change −0018 0000 0008∗∗ 0020∗
600167 600007 600027 600087IBM×Operating income change 0098+ 1055∗∗ −5010∗∗ −1008∗∗
600587 600087 600167 600087log(Sales) 0091∗∗ 0089∗∗ 0081∗∗ 0079∗∗
600047 600097 600087 600077log(Age) −0001 0005 −0019 −0002
600277 600227 600327 600257R&D not zero 2051∗∗ 2024∗∗ 2027∗∗ 6060∗∗
600537 600787 600847 610517No. of years missing −0004 −0005 −0027∗∗ 0003
600037 600047 600107 600077Constant −5027 −5046 −4018 −9054Observations 307 525 550 511No. of clusters 87 115 114 113Log likelihood −3119702 −8176007 −11156001 −19199401R2 00899 00641 00782 00757
Notes. Method of estimation is PPML regression. The dependent variable is the number of successfulpatent applications for each firm-year. Time-period subsamples are drawn from the larger sample of 115firms (including IBM), each with annual Compustat records, without gaps, for at least 15 years during1979–1998 and at least one successful patent application in the USPTO patent classes of IBM patentsduring the period. Three-year moving averages (for years t, t− 1, and t− 2) are used for R&D/sales,P&E/sales, and sales. R&D expenses, P&E expenses, and sales are expressed in USD (2000) million.Employees are in the thousands. Robust standard errors, clustered at the firm level, are in brackets.
+p < 001; ∗p < 0005; ∗∗p < 0001.
Figure 6 reveals the following facts: (i) IBM’s patentingremained relatively flat in all technologies until 1989,declining gradually in some technology classes (e.g.,“semiconductor device manufacturing”)—reflecting thecompany’s shift away from the technologies—while grad-ually increasing in others (e.g., the database and file man-agement and multicomputer data transfer classes, whichare most likely to contain software patents). (ii) IBM’spatenting in all technology classes, even those that werenot considered IBM’s focus (e.g., “solid state devices”and “semiconductor device manufacturing”) increasedsharply after 1989, suggesting that the increases were notdue solely to changes in the company’s focus. Instead,the increases are consistent with IBM’s post-1989 IP man-agement practices to aggressively patent technologies thatwere not part of its business focus so that they could bedeployed to generate licensing revenues (Gomory 1989).
The above analysis does not rule out changes in thenature of R&D within IBM’s patent technology classes.Hence, we explore IBM-specific trends in two patent-levelvariables—the proportion of backward citations in patents
to scientific publications (after excluding citations toIBM’s own TDBs) and the average vintage of citationsto prior art in patents—that could reflect changes in thenature of IBM’s R&D (Narin et al. 1997, Sørensen andStuart 2000). Table 3 confirms that neither the extent towhich IBM’s patents cited prior scientific publications northe average vintage of its backward citations to patentschanged sharply in 1989. The table reveals a surprisingtendency for IBM’s patents (relative to control grouppatents) to cite a greater share of scientific publicationsduring later years; IBM’s patents also appear to increas-ingly build on more recent prior art (relative to controlgroup patents), but neither of these trends, nor the changesin the trends, coincides with the sharp 1989 upturn inpatenting. We can thus be confident that sharp changesin the nature of IBM’s R&D and technology did notcoincide with its patenting turnaround in 1989.
(ii) Changes in human capital. A second alternativeexplanation is that, in 1989, IBM started hiring researcherswho were better trained to perform patentable research.Figure 7 shows the number of successful patents and
Dow
nloa
ded
from
info
rms.
org
by [
128.
122.
201.
75]
on 2
5 M
arch
201
5, a
t 11:
48 .
For
pers
onal
use
onl
y, a
ll ri
ghts
res
erve
d.

Bhaskarabhatla and Hegde: An Organizational Perspective on Patenting and Open InnovationOrganization Science 25(6), pp. 1744–1763, © 2014 INFORMS 1753
Figure 6 Growth in IBM Patenting by Patent Technology,1979–1998
No.
of a
pplic
atio
ns
Notes. This graph shows the number of successful U.S. patentapplications by application year for the seven patent technologyclasses in which IBM patented most frequently in 1979. The verticalline indicates the introduction of pro-patent management practicesat IBM in 1989.
publications assigned to the average inventor in the fol-lowing three cohorts: inventors with a record of inventions(i.e., patents or publications) at IBM only before 1989;inventors with a record of inventions at IBM only after1989; and inventors with a record of inventions at IBM
Table 3 Patent Characteristics for IBM and Control-Group Firms, 1979–1998
Panel A Panel B
% share of backward cites to scientific papers Average vintage of backward cites in years
Patent application year IBM Control firms Difference p-Value of t-test IBM Control firms Difference p-Value of t-test
1979 600 706 −106∗ 0003 503 504 000 00461980 808 802 005 0049 504 506 −002∗∗ 00011981 709 805 −006 0044 507 508 −001 00301982 807 808 −001 0091 602 600 002∗ 00031983 708 806 −008 0028 603 603 000 00851984 801 805 −004 0059 607 605 002∗∗ 00011985 808 809 −001 0088 605 608 −003∗∗ 00011986 1100 901 109∗∗ 0001 606 608 −002∗∗ 00011987 1200 905 205∗∗ 0001 608 609 −001 00101988 1003 909 004 0055 609 609 000 00601989 1101 1003 008 0030 608 701 −003∗∗ 00011990 1008 1001 007 0027 609 701 −002∗∗ 00011991 1204 1005 200∗∗ 0001 701 702 −001 00081992 1204 1103 101∗ 0004 607 702 −004∗∗ 00011993 1301 1109 102∗ 0004 609 703 −004∗∗ 00011994 1201 1105 006 0023 609 703 −004∗∗ 00011995 1107 1107 000 0095 609 703 −004∗∗ 00011996 1006 1005 001 0073 603 609 −006∗∗ 00011997 1107 1001 106∗∗ 0001 508 606 −008∗∗ 00011998 1002 908 004 0022 507 603 −006∗∗ 0001
Notes. Panel A shows the percentage of backward citations in IBM and control group patents (by application year) to scientific literature(backward citations can be to either previous patents or scientific papers; we exclude citations from IBM’s patents to disclosures published inits own TDBs), differences in means of IBM and control patents, and p-values obtained from t-tests for the differences. Panel B shows theaverage age (in years) of citations to previous patents from the focal patent’s application date for IBM and control group patents by applicationyear, differences in means of IBM and control patents, and p-values obtained from t-tests for the differences.
∗∗p < 0001; ∗p < 0005.
Figure 7 Patenting and Publishing by IBM Inventors, 1979–1998
1979
1981
1983
1985
1987
1989
1991
1993
1995
1997
0.00
0.50
1.00
1.50
2.00
2.50
3.00Publications per IBM inventorPatents per IBM inventor
Notes. The dark grey line with the square markers indicates theaverage number of successful patent applications each year for the9,109 IBM inventors with a history of invention before 1988 and after1990. The dashed line immediately below shows the average numberof patent applications for the IBM inventors that drop out of thesample after 1989 and the average number of patent applicationsfor IBM inventors that enter the sample only after 1989. The line withthe square markers indicates the average number of publications forthe corresponding inventor samples. The vertical line indicates theintroduction of pro-patent management practices at IBM in 1989.
both before and after 1989. The last group consists ofinventors who received the pro-patent IP management“treatment” in 1989. The figure shows that the number ofsuccessful patent applications per year by the average
Dow
nloa
ded
from
info
rms.
org
by [
128.
122.
201.
75]
on 2
5 M
arch
201
5, a
t 11:
48 .
For
pers
onal
use
onl
y, a
ll ri
ghts
res
erve
d.

Bhaskarabhatla and Hegde: An Organizational Perspective on Patenting and Open Innovation1754 Organization Science 25(6), pp. 1744–1763, © 2014 INFORMS
inventor in the last group remained more or less constantat 0.33 patent applications per year from 1979 to 1989but, after an upturn in 1989, rose to two applicationsper year in 1998. The figure also shows that the numberof publications by the same group of inventors droppedfrom 2.2 per year in 1979 to 0.8 per year in 1998. Recallthat IBM inventors earned their points (tied to theirannual compensations) through either TDB publicationsor patents; in 1989, McGroddy stipulated that inventorsearn at least 25%–50% of their points by filing patentapplications. This sharp increase in the patenting activityof incumbent inventors at IBM after 1989, along withthe accompanying drop in their publications, suggeststhat the incentive change for existing inventors, not newpersonnel, was responsible for increased patenting.
4. What Were the Consequences ofPro-Patent IP Management?
4.1. The Private Returns of PatentingAccording to IBM executives, the goals of the 1989changes were to improve profits through licensing revenuesand to preserve the company’s “freedom to operate.” Thissection investigates whether IBM’s delayed adoption ofpro-patent practices (relative to other firms in its industry)achieved these goals. IBM’s annual licensing revenueswere less than $20 million before 1991, but jumped to$30 million in 1992, $345 million in 1993, and $1.1 billionin 1998 (nearly 25% of its R&D budget for that year).This rise in licensing revenues was unprecedented and,arguably, made possible by the aggressive patenting andlicensing practices we consider part of IP management.
Although licensing revenues were welcome, the chiefthrust behind IBM’s pro-patent shift was the use of patentsas “bargaining chips” in negotiations to gain access toothers’ technologies. Kuehler stated the following as themain reason for IBM’s pro-patent shift in 1989:
[T]o shorten our cycles, we need to have access to theinventions of the rest of the world. And this is why IBM’sown patent portfolio is so important. This library of patentsgains us access to the inventions of others.
(Boyer 1990, p. 11)
Roger Smith, IBM’s IP counsel, also expressed theaccess motive for the 1989 changes as follows:
Access is far more valuable to IBM than the fees it receivesfrom its patents. There’s no direct calculation of this value,but it is many times larger than the fee income, perhapsan order of magnitude larger. (Boyer 1990, p. 10)
As Smith’s quote suggests, the private returns fromaccess to others’ technologies enabled by patents cannot beinferred from conventional profitability metrics. Therefore,we estimate the private returns of IBM’s pro-patentmanagement practices by relating its patent stocks to ameasure of the company’s intangible value, its Tobin’s q
before and after 1989, relative to a control group. Tobin’s qis the ratio of a firm’s market value to the book value ofits tangible assets and is often used as a proxy for thevalue of firms’ intangible assets (e.g., Hall et al. 2005).We estimate the relationship between IBM’s Tobin’s q andpatent stocks in the following differences-in-differencesequation:
logQit = � log PAT it +� IBM i + �4log PAT it × IBM i5
+∑
�Iit + �it1 (3)
where Q denotes Tobin’s q of firm i in year t. Wecalculate the numerator in Tobin’s q (market value) as thesum of market value of equity (book value of preferredstock, long-term debt, and current liabilities less currentassets) and the denominator (book value of tangibleassets) as total assets less current assets and intangibles,plus the book value of inventory (as in Dowell et al.2000). PAT denotes three-year aggregate stocks of patentgrants to firm i in years t, t− 1, and t− 2; I containsa set of firm-specific variables that control for factorspotentially related to both patenting and market value,including R&D intensity (R&D/revenues), capital intensity(P&E/revenues), size/scale (revenues), patent age, and adummy variable set to zero for firm-years with missingR&D expenditures. We use three-year moving averagesfor R&D and P&E expenditures, as before, and includefor each firm a variable that counts the number of yearsbetween 1979 and 1998 for which Compustat data werenot available. T is a vector of year-specific controls forchanges in firms’ technological and legal environmentsthat influence patenting. The IBM dummy (IBM), set to 1for IBM observations and 0 for the control-group firms,controls for IBM-specific determinants of market value,and the interaction of the IBM dummy with the patentstock variable captures the IBM-specific relationshipbetween patent stocks and market value.
Our estimation sample consists of the same set of 115electronics and semiconductor firms and 2,009 firm-yearobservations used in the patent-propensity regressions. Weuse ordinary least squares (OLS) regressions to estimateTobin’s q separately for the following four subperiods:1979–1983, 1984–1988, 1989-1993, and 1994–1998. IfIBM’s patents enhanced its competitive position becauseof the 1989 changes, then � should be higher for the1989–1993 and 1994–1998 subperiods.
Table 4 shows that the three-year patent stock variableis not positively related to Tobin’s q in any subperiodfor the control-group firms.9 In contrast, the relationshipbetween patent stock and market value varies significantlyacross the four subperiods for IBM: between 1979 and1983, when IBM’s patent intensity was higher than that ofthe average control-group firm, a 1% increase in its patentstock is associated with a 2.6% increase in its Tobin’s q(p < 0001); between 1984 and 1988, when IBM fell behindits rivals in patenting, the relationship between its patent
Dow
nloa
ded
from
info
rms.
org
by [
128.
122.
201.
75]
on 2
5 M
arch
201
5, a
t 11:
48 .
For
pers
onal
use
onl
y, a
ll ri
ghts
res
erve
d.

Bhaskarabhatla and Hegde: An Organizational Perspective on Patenting and Open InnovationOrganization Science 25(6), pp. 1744–1763, © 2014 INFORMS 1755
Table 4 OLS Estimates of Tobin’s q for Compustat Firms, 1979–1998
Parameter 1979–1983 1984–1988 1989–1993 1994–1998
log(Patent stock) −0010∗ 0 0004 −0003600057 600047 600047 600057
IBM× log(Patent stock) 2059∗∗ −2097∗∗ 0 2004∗∗
600077 600087 600057 600077R&D not zero 0015 0019 0055 −0015
600257 600217 600377 600287log(R&D/sales) 8045∗∗ 1097+ 1018 4016∗∗
610437 610007 610347 610527log(P&E/sales) −0022 −0047 −0060+ −1039∗∗
600287 600327 600327 600377IBM −17075∗∗ 22035∗∗ −0031 −17016∗∗
600517 600617 600427 600527log(Sales) −0001 0004 0006 0014∗∗
600057 600047 600047 600057log(Age) 0012 −0001 −0023∗ 0003
600097 600067 600117 600107No. of gaps 0004 0004+ −0001 0002
600037 600027 600027 600027N 400 547 550 512No. of clusters 93 115 114 113R2 00564 00438 00205 00516
Notes. The dependent variable is log of Tobin’s q. Time-period subsamples are drawn from the larger sample of115 firms, each with annual Compustat records, without gaps, for at least 15 years during 1979–1998 and at leastone successful patent application in the USPTO patent classes of IBM patents during the period. Three-yearstocks (for years t, t − 1, and t − 2) are used for patents and three-year moving averages for R&D/sales,P&E/sales, and sales. R&D expenses, P&E expenses, and sales are expressed in USD (2000) million. Employeesare in the thousands. Robust standard errors, clustered at the firm level, are in brackets.
+p < 001; ∗p < 0005; ∗∗p < 0001.
stocks and market value is negative (�= 20973 p < 0001);between 1989 and 1993, when IBM’s patenting caught upto its rivals’, the relationship between its patent stocksand Tobin’s q is not statistically different than that of theaverage control-group firm (�= 0); and in the 1994–1998subperiod, when IBM was the world’s largest patentee, a1% increase in its patent stocks is associated with a 2%increase in Tobin’s q (p < 0001).
We acknowledge that the relationship between patentingand private value is complex and shaped by several factorsnot considered by our analysis, such as industry structureand competitors’ patenting strategies. Executives alsomake decisions about the optimum level of patentingafter considering their benefits. Thus, the above condi-tional correlations are not causal estimates but providesuggestive evidence for the success of IBM’s pro-patentmanagement practices in enhancing the intangible returnsto the company from its patents.
4.2. Patenting and Knowledge SpilloversIn theory, patents enhance the private returns of knowledgeinvestments by increasing competitors’ cost of usingproprietary knowledge. This tension between privateappropriability and public diffusion associated with patentshas been empirically studied in the context of increased
patenting by U.S. universities after the Bayh–Dole Actof 1980 (e.g., Argyres and Liebeskind 1998, Heller andEisenberg 1998, Henderson et al. 1998, Mowery et al.2001, Murray and Stern 2006). However, few studieshave investigated the effects of corporate patenting onknowledge spillovers. A stream of research closely relatedto our work investigates the benefits to corporations ofengaging in open-science norms, including investments inbasic research, collaborations with academic scientists,and corporate incentives to publish (Cohen and Levinthal1990, Cockburn and Henderson 1998). This researchsuggests that the adoption of open-science norms by firmsincreases the productivity of their R&D by equipping thefirms to effectively identify and utilize external knowledge.However, this work has stopped short of examiningthe industry-wide consequences of firms’ adoption ofopen-science norms.
We investigate the consequences of pro-patent practices,which represent a move away from open-science normsfor knowledge diffusion in the context of corporate paten-tees, particularly IBM. One indicator of the importanceof IBM’s research is that the company accounted fornearly 4%, whereas U.S. universities accounted for lessthan 1% of all patents in electronics and semiconduc-tor technologies between 1979 and 1998. During the
Dow
nloa
ded
from
info
rms.
org
by [
128.
122.
201.
75]
on 2
5 M
arch
201
5, a
t 11:
48 .
For
pers
onal
use
onl
y, a
ll ri
ghts
res
erve
d.

Bhaskarabhatla and Hegde: An Organizational Perspective on Patenting and Open Innovation1756 Organization Science 25(6), pp. 1744–1763, © 2014 INFORMS
same period, the average IBM patent received 14 cita-tions, whereas the average university patent received 12.5citations (in comparable five-year citation windows andtechnology classes) indicative of both the high quality andspillovers associated with IBM’s inventions. Accordingto Gomory (1989), the company’s competitors benefitedtremendously from the knowledge spillovers made pos-sible through a combination of IBM’s publications andlimited patenting before 1989.
Did the 1989 pro-patent shift at IBM reduce its knowl-edge spillovers? Figure 8 shows that IBM’s publisheddisclosures, in its TDBs, dropped after 1984 and, afterreaching a high of 4,229 articles in 1990, declined by18% to 3,459 articles in 1991 and by 82% to 759 articlesin 1998 (publications by IBM inventors in other scientificjournals also decreased, but only after 1992). The numberof IBM publications appears to have declined one totwo years after the 1989 changes (and the increase inpatenting) because the years reflect their publication dates,and the numbers for patents reflect their application dates.These aggregate patterns are consistent with those in Fig-ure 7, which shows that the post-1989 drop in the numberof publications per inventor was accompanied by a sharpincrease in patenting. Therefore, IBM’s 1989 pro-patentpolicies appear to have curtailed the dissemination of itsknowledge through publications.10
We further probe the implications of IBM’s pro-patentshift for knowledge spillovers by comparing citationsto IBM’s patents with citations to control group patentsbefore and after 1989. Citations are noisy measuresof knowledge spillovers, but we use them because oftheir ready availability for each invention (patent) in our
Figure 8 IBM and Other U.S. Corporate Publications, 1980–1998
Notes. IBM publications in its Technical Disclosure Bulletin wereobtained from IBM. Publications in scientific journals, for both IBMand other corporations, were obtained through Thomson’s ScienceCitation Index. “U.S. non-IBM corporate publications” are those inwhich at least one coauthor was affiliated with a corporate entity(“corporation,” “incorporate,” or “company”) in the same subjectareas as IBM’s publications. The vertical line indicates the introductionof pro-patent management practices at IBM in 1989.
study, their use by several scholars before us to measurespillovers (since the pioneering work of Jaffe et al. 1993),and the absence of a compelling argument suggesting thatthe noise is correlated with the errors in our regression.11
We estimate
CITESit = � IBM +�SCITESit+�4SCITESit×IBM5
+
1998∑
t=1979
�tTt+1998∑
t=1979
�t4Tt×IBM5
+∑
c
�c CLASSc+
1998∑
g=1979
�g GYEARg+�1 (4)
where the dependent variable, CITES, is the annual numberof citations to each patent i from inventors other thanthe patent owner in year t; Tt is a dummy variable thatindicates the citation year t; IBM is a dummy variableset to 1 for IBM patents and 0 for control-group patents;CLASS is a vector of 258 dummy variables that representthe USPTO technology class of the patent; and GYEAR isa dummy variable that indicates the patent grant year g.Other inventors’ citations to a patent depend on theunderlying invention’s quality as well as the extent towhich its owner enforces the patent. We include SCITES,the number of self-citations to the patent (i.e., the numberof citations to the patent from the company’s own patents)each year, to control for the invention’s quality andisolate the effect of appropriability on spillovers. CLASSand GYEAR control for patent technology class- andpatent grant year-specific features that influence citations,respectively.
We seek to identify the distinct effects of pro-patentmanagement practices on IBM’s industry-wide knowl-edge spillovers; this requires controlling for changesin the nature and quality of IBM’s research that mayhave coincided with the adoption of pro-patent practices.Section 3.2 produced evidence from the vintage of IBMpatents’ backward citations and references to scientificpapers to rule out the possibility that IBM’s shift towardincreased patenting in 1989 coincided with a switch tomore applied research. Still, one might argue that anypost-1989 decrease in others’ citations to IBM patentsmay stem from the declining quality of IBM patents(since IBM started filing more patents) not adequatelycontrolled for by our self-citations measure of quality.Hence, we remove IBM’s post-1989 patents from ouranalysis and analyze whether other inventors’ citationsto IBM’s pre-1989 patents decreased, relative to controlgroup patents, after 1989. If others’ citations to IBM’s pre-1989 patents decrease relative to the citations received bycontrol patents after 1989, then we can be confident thatthe drop reflects decreased spillovers of IBM’s knowledge,not changes in the quality of IBM’s patents.
Our estimation sample retains only the 5,665 IBMpatents granted between 1979 and 1989, which correspondto 41,366 citation-year observations for IBM and 440,478
Dow
nloa
ded
from
info
rms.
org
by [
128.
122.
201.
75]
on 2
5 M
arch
201
5, a
t 11:
48 .
For
pers
onal
use
onl
y, a
ll ri
ghts
res
erve
d.

Bhaskarabhatla and Hegde: An Organizational Perspective on Patenting and Open InnovationOrganization Science 25(6), pp. 1744–1763, © 2014 INFORMS 1757
Figure 9 Forward Citations to IBM and Control-Group Patents,1979–1998
Citations to IBM patents (right scale)95% CI, IBM
1980
1982
1984
1986
1988
1990
1992
1994
1996
1998
–0.2
–0.1
0
0.1
0.2
0.3
0.4
Notes. This graph plots PPML regression coefficient estimates ofcitation trends for IBM and control-group patents by the applicationyear of citing patents. The estimates are obtained from the regressionspecified in Equation (4). The vertical line indicates the introductionof pro-patent management practices at IBM in 1989.
citation-year observations for 114 control-group firms. Weemploy PPML regressions to estimate Equation (4) anddo not report the full set of estimates here for brevity’ssake. We find that, on average, IBM’s patents receivemore citations each year from other inventors (1.79)than control-group patents do (1.66) for patents grantedbetween 1979 and 1989. Since we are interested in thedifferences in citation trends for IBM and control-grouppatents (estimated by �t for years t = 19791 0 0 0 11998),we plot the corresponding estimates in Figure 9 (the lasttwo columns of Table A4 in the supplementary appendixreports the full set of estimates). The figure shows thatthe annual number of other inventors’ citations to IBMpatents (relative to control patents) increases until 1989and decreases during 1990–1998. Since we control forself-citations, technology field, and grant year-specificeffects, the estimates imply that an “average” IBM patentreceived 17% 4exp400165− 15 more citations than anidentical control group patent in 1989, but 14% fewercitations than an identical control group patent in 1998(the decline is statistically significant at p < 0005). It isalso noteworthy that others’ citations to IBM patents donot recover in the later years of our study, even after IBMrecovers profitability, suggesting that the drop is likely dueto decreased spillovers rather than a “declining firm” effect.The observed drop in others’ citations to IBM patentsafter 1989 is also robust to alternative constructions of theestimation sample such as inclusion of post-1989 IBMpatents and their citations and exclusion of post-1989control group patents and their citations.
Next, we investigate trends in the propensity of non-IBM inventors to cite IBM’s publications.12 We collectdata on the number of times IBM publications are cited byIBM patents and non-IBM patents by patent-applicationyear. Figure 10 shows that non-IBM patents accounted
Figure 10 Share of Others’ Citations to IBM Publications,1979–1998
1979
1981
1983
1985
1987
1989
1991
1993
1995
1997
70
72
74
76
78
80
82
84
86
88
90
No.
of patents
Notes. This graph plots the share of non-IBM patents among allpatents that cite IBM’s publications by patent application year. IBMpublications are exclusively those in its TDBs and may have beenpublished in any year. The vertical line indicates the introduction ofpro-patent management practices at IBM in 1989.
for 85% of the citations to IBM’s publications between1979 and 1989 but for only 74% of the citations to IBM’spublications between 1990 and 1998, with a pronounceddrop in 1990.
We conclude that the decrease in others citations toIBM’s patents and publications after 1989 indicatesreduced spillovers. What might be the mechanisms throughwhich pro-patent management practices reduce spillovers?As suggested above, we argue that the cost of usingIBM’s knowledge was relatively low to other inventorsbefore 1989, either because IBM did not patent all itsinventions or because it did not enforce its patents throughlicensing deals. However, IBM’s aggressive patenting andpatent licensing practices increased the costs of usingIBM’s knowledge to other inventors after 1989, potentiallydeterring some inventors from building on IBM’s patentedknowledge and thus reducing industry-wide spillovers.Of course, each of our above measures of knowledgespillovers—the post-1989 decrease in the number ofIBM publications, the drop in others’ citations to IBM’spre-1989 patents, and the drop in others’ citations toIBM’s TDB publications relative to its own citations—has its limitations, but all consistently suggest that pro-patent management practices effectively curtailed IBM’sknowledge spillovers.
5. IP Management at Other FirmsWe have shown that IBM’s patenting surged after theadoption of pro-patent practices in 1989. In the yearsfollowing adoption, IBM’s patent stocks are related tohigher private returns and lower knowledge spillovers. Canwe conclude from IBM’s case that pro-patent practicesaffected patenting propensity, private returns, and knowl-edge spillovers of other corporate patentees? We next
Dow
nloa
ded
from
info
rms.
org
by [
128.
122.
201.
75]
on 2
5 M
arch
201
5, a
t 11:
48 .
For
pers
onal
use
onl
y, a
ll ri
ghts
res
erve
d.

Bhaskarabhatla and Hegde: An Organizational Perspective on Patenting and Open Innovation1758 Organization Science 25(6), pp. 1744–1763, © 2014 INFORMS
specifically test whether the adoption of pro-patent prac-tices explains these outcomes for large U.S. corporatepatentees other than IBM.
Extending our qualitative research on IP managementpractices to a larger sample requires information on firm-specific causes and correlates of the practices, whichis not easily available. Hence, we selected the top 20patentees in 1998 from our control group and searchedmedia reports, popular books on IP, annual companyreports, and scholarly articles for descriptions of changesin their IP management. We were able to find informationon significant pro-patent IP management changes in eightfirms other than IBM between 1979 and 1998. (Exhibit 1briefly describes these changes and their timing for eachof the eight corporations.) These eight firms (AdvancedMicro Devices (AMD), Eastman Kodak, Hewlett-Packard,Intel, Micron Technologies, Motorola, Texas Instruments,and Xerox) owned 47% of the non-IBM patents between1979 and 1998 in our sample, and we check whether theadoption of pro-patent management practices in these eightfirms are related to changes in their patenting propensity,market value, and industry-wide knowledge spillovers. Toavoid influencing the analysis with IBM-specific effects,we omit IBM observations from the following analysis.
First, we consider the eight firms for which we haveinformation on their IP management practices as thetreatment group and the remaining 106 firms as partof the control group. Since each of the eight treatmentgroup firms received the “treatment” (that is, sharp andwell-publicized pro-patent IP management changes) indifferent years, we capture the average treatment effect byincluding a dummy variable that indicates the years afterthe treated firms received the treatment. We then estimateour differences-in-differences equation, comparable tothe one in Equation (1), with the number of successfulpatents (PAT) of firms each year as the dependent variable.Our estimation sample consists of 1,874 observations, andwe obtain the following PPML estimates for firm-yearpatenting propensity:
PAT it = 4056 log RDit︸ ︷︷ ︸
2093
−0014 log PEit︸ ︷︷ ︸
0042
−0046 TREATEDi︸ ︷︷ ︸
0056
+ 0080 TREATED_AFTERit︸ ︷︷ ︸
0020
−0000 OICit︸ ︷︷ ︸
0001
+
1998∑
t=1979
�Tt +∑
�Iit3
log likelihood = −3511490 (5)
Converting the estimated coefficient of the treatmenteffect (TREATED_AFTER: 0.80, p < 0001) to its IRR
implies that the treated firms’ patenting increased by122% in the years following their adoption of pro-patentmanagement practices, holding other factors that influencepatenting constant (control variables are as described in§3.1 and employed in Table 2). The estimated coefficientof operating income change (OIC) is negative, reflectingan increase in patent propensity with declining financialperformance but the effect is not statistically significant.
One might argue that our analysis, since it considersfirms that received treatment from among the top patenteesin 1998, suffers from biases associated with sampling onsuccessful outcomes. The advantage of the differences-in-differences estimator is that it estimates the effectsof the treatment after controlling for the fact that thetreated firms are different from the control group firms.Still, in a robustness check, we limited the “treatedfirms” to only those firms that were among the top 20patentees in the first five years of our study (Kodak,Xerox, Motorola, TI, HP, and Intel) and adopted pro-patent changes. We then limited the estimation sample tothe top 20 patentees during 1979–1983 and reestimatedour patent-propensity regressions. This specification limitsthe estimation sample to firms with the highest patentpropensity during 1979–1983 (rather than in 1998, thusavoiding sampling on outcomes) and checks whetherthe patenting propensity of these firms is explained bytheir pro-patent management practices. Two of the eighttreated firms (AMD and Micron) are not part of thetop 20 patentees during 1979-1983 and are excludedfrom the analysis. The estimated PPML coefficient onTREATED_AFTER obtained from this regression is 0.97(p < 0001). It is statistically comparable to the treatmenteffect (0.80, p < 0001) estimated in the sample with 114firms. The estimates reported in (5) are also qualitativelysimilar to the ones obtained through firm random-effectsand fixed-effects estimations.13
Next, we estimate the market-value regression, specifiedin Equation (3), with the eight firms that underwentpro-patent IP management changes as part of our originaltreatment group. The estimation sample consists of 1,989firm-year observations, and we obtain the following OLSestimates for Tobin’s q:
logQit = −00003 log PAT it︸ ︷︷ ︸
0003
+0083 TREATEDi︸ ︷︷ ︸
0015
− 00174log PAT it × TREATEDi5︸ ︷︷ ︸
0003
+ 001154log PAT it × TREATED_AFTERit5︸ ︷︷ ︸
00035
+∑
�Iit3 adjusted R2 = 00450 (6)
Dow
nloa
ded
from
info
rms.
org
by [
128.
122.
201.
75]
on 2
5 M
arch
201
5, a
t 11:
48 .
For
pers
onal
use
onl
y, a
ll ri
ghts
res
erve
d.

Bhaskarabhatla and Hegde: An Organizational Perspective on Patenting and Open InnovationOrganization Science 25(6), pp. 1744–1763, © 2014 INFORMS 1759
The statistically significant positive effect of the interac-tion term of patent stocks and post-IP management yearson Tobin’s q, observed in the case of IBM, extends toother large patentees. The estimates share another aspectin common with the estimates for IBM’s Tobin’s q: thesignificant negative relationship between patent stocksand Tobin’s q before the adoption of pro-patent IP man-agement practices. The estimates appear robust in modelsspecified with firm-fixed effects and random effects (seecolumns (3) and (4) of Table A5).
Although we do not investigate in detail the reasonsbehind the uptake of IP management practices, this findingsuggests that, like IBM, the treatment group firms adoptednew practices when their returns from patenting were eitherdeclining or below average, perhaps because organizationalchanges are easier to justify and implement during “badtimes.” Our qualitative research confirms that at least fourof the treatment group firms adopted pro-patent practicesunder the shadow of negative events: Xerox ramped up itspatenting in 1984 after failing to patent and exploit itsgroundbreaking inventions such as the personal computerand the graphical user interface underlying the Windowsand Macintosh operating systems (Rivette and Kline 2000);Kodak, in 1986, after it was found guilty of infringingon Polaroid’s instant-photography patents and orderedto pay approximately $1 billion to Polaroid in damages(Chesbrough 2006); AMD, in 1995, in the midst of itslosing IP battle with Intel (Miele 2001); and Motorola, in1987, after competition from Japanese rivals threatenedthe profitability of its cellular business (Sosnin 2000). Thedescriptions of IP management changes at four of thetreated firms (AMD, HP, Motorola, and Xerox) mentionedchanges in their IP leadership. These findings echo theones from IBM’s case and suggested that establishedorganizations did not all embrace greater patenting inresponse to the legal changes that increased the value ofpatents. Instead, declining profits and changes in leadershipplayed an important role in hastening the adoption ofpro-patent practices among firms that did not immediatelyrespond to the legal changes.
Finally, as with IBM, we check whether citationsfrom others to the patents of treated firms changed afterthe firms adopted pro-patent management practices byestimating an equation identical to the one specified in(4) after excluding IBM patents. As before, we purgethe sample of patents belonging to the treatment firmsafter they adopted pro-patent management practices toensure that any drop in the post-treatment quality ofpatents is not due to the lower quality of the patents. Theestimates obtained from a sample of 306,317 citation-yearobservations are as follows:
CITES = −0003 SCITES︸ ︷︷ ︸
00010
+00014SCITES × TREATED5︸ ︷︷ ︸
00020
+ 0007 TREATED︸ ︷︷ ︸
00016
−0008 TREATED_AFTER︸ ︷︷ ︸
00017
+
1998∑
t=1980
�tTt +∑
c
�c CLASSc
+
1998∑
g=1979
�g GYEARg3
log likelihood = −55311710 (7)
The treatment group patents, on average, receive sig-nificantly more citations compared with control-grouppatents before treatment. As in the case of IBM, firmsthat implemented pro-patent IP management experience adecline (of 7.7%, significant at p < 0001) in citations totheir patents.
We conclude from the above analysis that our find-ings from IBM’s case about the effects of pro-patent IPmanagement practices apply to a larger sample of U.S.electronics and semiconductors corporations. Still, thisanalysis suffers from important limitations. First, becauseof the difficulty associated with tracking firm-level adop-tion of management practices, we selectively identifiedcorporations with sharp and well-publicized changes intheir IP management strategy as part of the treatmentgroup. It is possible that to the extent that these arealso the firms for which the changes worked as intended(in increasing patenting and private returns), we haveoverestimated the effects of pro-patent IP managementpractices. Relatedly, just because we were unable to findinformation on the IP management practices of controlgroup firms does not mean that they did not adopt pro-patent practices. Our differences-in-differences estimationaccounts for this purposive (and potentially erroneous)assignment of firms into the treatment and control groups,but perhaps not perfectly. Second, we have identified theeffect of IP management practices through the timingof their adoption. Although we have controlled for theinfluences of first-order variables (such as R&D andfirm size) that affect patent propensity, our analysis doesnot rule out the effect of other practices that may havebeen implemented with changes in IP management andincreased the patenting output of firms. We have carefullyexamined and ruled out the possibility of these alternativeinfluences in IBM’s case, but replicating this exercise fora larger sample is difficult. Third, our measures of privatereturns and knowledge spillovers are imperfect and mayhave induced unknown biases in our estimations.
6. ConclusionOur research was motivated by the heterogeneity infirms’ responses to an important change in their legalinstitution that increased the value of patents. We focusedon the case of IBM, which lagged its competitors inresponding to the increased value of patents but emerged
Dow
nloa
ded
from
info
rms.
org
by [
128.
122.
201.
75]
on 2
5 M
arch
201
5, a
t 11:
48 .
For
pers
onal
use
onl
y, a
ll ri
ghts
res
erve
d.

Bhaskarabhatla and Hegde: An Organizational Perspective on Patenting and Open Innovation1760 Organization Science 25(6), pp. 1744–1763, © 2014 INFORMS
as the world’s largest patentee in 1993. After ruling outseveral alternative influences—including changes in IBM’sR&D intensity, defensive patenting, hiring practices, andtechnological focus—we show that the adoption of pro-patent IP management practices brought about IBM’spatenting turnaround.
We find an immediate, striking, and persistent con-sequence of IBM’s pro-patent practices: in the decadefollowing their adoption, IBM inventors increased theirpatent applications by three times and decreased their pub-lications by the same number. IBM’s knowledge spillovers,as evidenced by citations of other inventors to IBM’spatents and publications, were substantially reduced afterthe adoption of pro-patent practices. We obtain similarresults for a sample of top U.S. corporations that adoptedpro-patent practices. Hence, pro-patent IP managementappears to augment private returns by restricting knowl-edge spillovers. Although we have not provided a fullwelfare analysis that measures the gains from licensingmade possible through increased patenting, our resultsprovide a cautionary note that pro-patent policies associ-ated with open-innovation practices might foreclose thefree diffusion of knowledge (Chesbrough 2006).
According to Cockburn and Henderson (1998), firms inthe biomedical sector encourage open-science practicessuch as publications, in-house conduct of basic research,and collaborations with academic scientists to develop the“absorptive capacity” required to exploit, and profit from,external knowledge (Cohen and Levinthal 1990). Althoughwe have not fully investigated the effects of a shift awayfrom other open-science practices, we find that firmswere able to augment their private returns by making itcostly for others to use their knowledge through strongerpatent enforcement. Our findings, taken together withthe prevailing wisdom on the benefits to corporations ofpursuing open-science practices, suggest that organizationsface a trade-off: practices to plug leakages of proprietaryknowledge may make it hard to identify and exploitexternal knowledge.14 A careful analysis of the long-termconsequences of aggressive patenting, which is outsidethe scope of our present analysis, is necessary to establishthe outcome of this trade-off.
More broadly, our findings raise the natural question: Ifcertain practices (in our context, pro-patent management)augment profitability, then why do firms delay theiradoption? Recent economic theories explain delayedadoption by suggesting the presence of informationalconstraints in markets such that “laggards” are not awareof the benefits and costs of new practices (see Bloomet al. 2013). Yet, in our context, the legal change to U.S.patent laws were well known in the industry, after a seriesof high-profile patent infringement cases following theCAFC’s establishment in 1982 (Hall 2005). Hence, it isnot probable that firms, particularly large corporationswith access to expert legal counsel, were unaware of
the benefits of strengthening their patent portfolios. Ourqualitative research on IBM suggests that rather thaninformational constraints, inertia may have played a rolein resisting a switch to increased patenting.
How did IBM and other laggards come to adapt tochanges in their environment? Our quantitative analysisreveals that adaptation was systematically related toflailing financial health, and, in a significant number ofcases, adaptation was initiated by new leadership. Hence,our findings suggest a general process of organizationalresponse to environmental changes. Firms are motivatedby profits, but rather than seamlessly embracing newpractices associated with superior profits, establishedfirms are more likely to act when they face threatsto their survival. To an extent, new leadership maybetter perceive the severity of threats and thus play animportant role in shaping organizational response tothe threats.15
Some established firms that adopt the new practicesare able to emerge as successful. Our study’s contri-bution thus lies in articulating an instance in whichestablished firms successfully overcame inertial resistanceto a literature that largely focuses on incumbents’ failures(Cooper and Schendel 1976, Hannan and Freeman 1977,Majumdar 1982, Tushman and Anderson 1986, Hendersonand Clark 1990, Amburgey et al. 1993, Tushman andO’Reilly 1996, Christensen 1997, Tripsas and Gavetti2000). By demonstrating the role of financial pressuresand new leadership in facilitating transformation, wecontribute to a deeper understanding of the processesthat shape organizational adaptation to their environ-ment (in the spirit of Cyert and March 1963, Nelsonand Winter 1982, Levinthal 1997, and, more recently,Greve 2008). Our study suggests that realistic theories oforganizations should incorporate the interactions betweenenvironmental change and intraorganizational processes tounderstand the sources and consequences of organizationalchange.
AcknowledgmentsAuthors are listed in alphabetical order. The authors are gratefulto James McGroddy, Marshall Phelps, John Cronin, RalphGomory, and other IBM executives who patiently answeredquestions regarding management practices at IBM. DavidHart kindly provided access to his library of IBM’s Thinkmagazine. Ashish Arora, Rich Bettis, Luis Cabral, Gino Cattani,Wesley Cohen, J. P. Eggers, Jon Fjeld, Robert Hoskisson,David Hounshell, and participants at New York University’sManagement Department Seminar, Duke University’s Economicsof Innovation Seminar, and Erasmus School of Economics’Departmental Seminar provided helpful suggestions. D. Hegdeacknowledges funding from the Kauffman Junior FacultyFellowship [Grant 20120562].
Supplemental MaterialSupplemental material to this paper is available at http://dx.doi.org/10.1287/orsc.2014.0911.
Dow
nloa
ded
from
info
rms.
org
by [
128.
122.
201.
75]
on 2
5 M
arch
201
5, a
t 11:
48 .
For
pers
onal
use
onl
y, a
ll ri
ghts
res
erve
d.
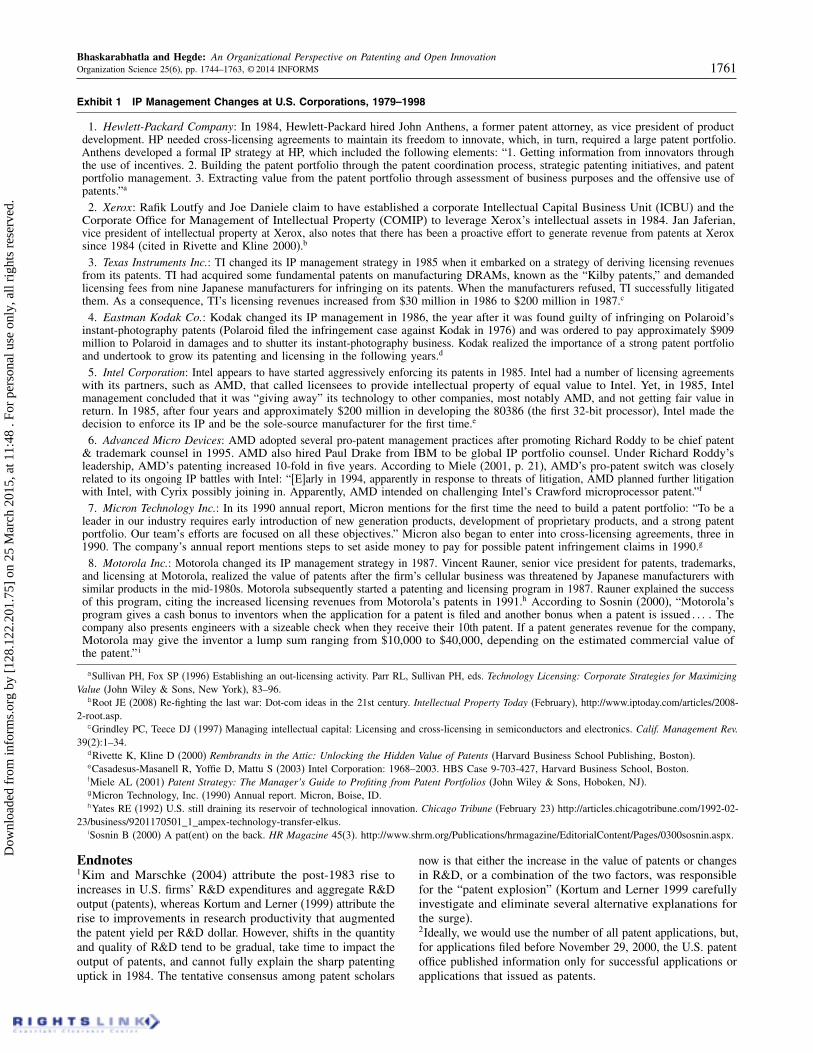
Bhaskarabhatla and Hegde: An Organizational Perspective on Patenting and Open InnovationOrganization Science 25(6), pp. 1744–1763, © 2014 INFORMS 1761
Exhibit 1 IP Management Changes at U.S. Corporations, 1979–1998
1. Hewlett-Packard Company: In 1984, Hewlett-Packard hired John Anthens, a former patent attorney, as vice president of productdevelopment. HP needed cross-licensing agreements to maintain its freedom to innovate, which, in turn, required a large patent portfolio.Anthens developed a formal IP strategy at HP, which included the following elements: “1. Getting information from innovators throughthe use of incentives. 2. Building the patent portfolio through the patent coordination process, strategic patenting initiatives, and patentportfolio management. 3. Extracting value from the patent portfolio through assessment of business purposes and the offensive use ofpatents.”a
2. Xerox: Rafik Loutfy and Joe Daniele claim to have established a corporate Intellectual Capital Business Unit (ICBU) and theCorporate Office for Management of Intellectual Property (COMIP) to leverage Xerox’s intellectual assets in 1984. Jan Jaferian,vice president of intellectual property at Xerox, also notes that there has been a proactive effort to generate revenue from patents at Xeroxsince 1984 (cited in Rivette and Kline 2000).b
3. Texas Instruments Inc.: TI changed its IP management strategy in 1985 when it embarked on a strategy of deriving licensing revenuesfrom its patents. TI had acquired some fundamental patents on manufacturing DRAMs, known as the “Kilby patents,” and demandedlicensing fees from nine Japanese manufacturers for infringing on its patents. When the manufacturers refused, TI successfully litigatedthem. As a consequence, TI’s licensing revenues increased from $30 million in 1986 to $200 million in 1987.c
4. Eastman Kodak Co.: Kodak changed its IP management in 1986, the year after it was found guilty of infringing on Polaroid’sinstant-photography patents (Polaroid filed the infringement case against Kodak in 1976) and was ordered to pay approximately $909million to Polaroid in damages and to shutter its instant-photography business. Kodak realized the importance of a strong patent portfolioand undertook to grow its patenting and licensing in the following years.d
5. Intel Corporation: Intel appears to have started aggressively enforcing its patents in 1985. Intel had a number of licensing agreementswith its partners, such as AMD, that called licensees to provide intellectual property of equal value to Intel. Yet, in 1985, Intelmanagement concluded that it was “giving away” its technology to other companies, most notably AMD, and not getting fair value inreturn. In 1985, after four years and approximately $200 million in developing the 80386 (the first 32-bit processor), Intel made thedecision to enforce its IP and be the sole-source manufacturer for the first time.e
6. Advanced Micro Devices: AMD adopted several pro-patent management practices after promoting Richard Roddy to be chief patent& trademark counsel in 1995. AMD also hired Paul Drake from IBM to be global IP portfolio counsel. Under Richard Roddy’sleadership, AMD’s patenting increased 10-fold in five years. According to Miele (2001, p. 21), AMD’s pro-patent switch was closelyrelated to its ongoing IP battles with Intel: “[E]arly in 1994, apparently in response to threats of litigation, AMD planned further litigationwith Intel, with Cyrix possibly joining in. Apparently, AMD intended on challenging Intel’s Crawford microprocessor patent.”f
7. Micron Technology Inc.: In its 1990 annual report, Micron mentions for the first time the need to build a patent portfolio: “To be aleader in our industry requires early introduction of new generation products, development of proprietary products, and a strong patentportfolio. Our team’s efforts are focused on all these objectives.” Micron also began to enter into cross-licensing agreements, three in1990. The company’s annual report mentions steps to set aside money to pay for possible patent infringement claims in 1990.g
8. Motorola Inc.: Motorola changed its IP management strategy in 1987. Vincent Rauner, senior vice president for patents, trademarks,and licensing at Motorola, realized the value of patents after the firm’s cellular business was threatened by Japanese manufacturers withsimilar products in the mid-1980s. Motorola subsequently started a patenting and licensing program in 1987. Rauner explained the successof this program, citing the increased licensing revenues from Motorola’s patents in 1991.h According to Sosnin (2000), “Motorola’sprogram gives a cash bonus to inventors when the application for a patent is filed and another bonus when a patent is issued 0 0 0 0 Thecompany also presents engineers with a sizeable check when they receive their 10th patent. If a patent generates revenue for the company,Motorola may give the inventor a lump sum ranging from $10,000 to $40,000, depending on the estimated commercial value ofthe patent.” i
aSullivan PH, Fox SP (1996) Establishing an out-licensing activity. Parr RL, Sullivan PH, eds. Technology Licensing: Corporate Strategies for MaximizingValue (John Wiley & Sons, New York), 83–96.
bRoot JE (2008) Re-fighting the last war: Dot-com ideas in the 21st century. Intellectual Property Today (February), http://www.iptoday.com/articles/2008-2-root.asp.
cGrindley PC, Teece DJ (1997) Managing intellectual capital: Licensing and cross-licensing in semiconductors and electronics. Calif. Management Rev.39(2):1–34.
dRivette K, Kline D (2000) Rembrandts in the Attic: Unlocking the Hidden Value of Patents (Harvard Business School Publishing, Boston).eCasadesus-Masanell R, Yoffie D, Mattu S (2003) Intel Corporation: 1968–2003. HBS Case 9-703-427, Harvard Business School, Boston.fMiele AL (2001) Patent Strategy: The Manager’s Guide to Profiting from Patent Portfolios (John Wiley & Sons, Hoboken, NJ).gMicron Technology, Inc. (1990) Annual report. Micron, Boise, ID.hYates RE (1992) U.S. still draining its reservoir of technological innovation. Chicago Tribune (February 23) http://articles.chicagotribune.com/1992-02-
23/business/9201170501_1_ampex-technology-transfer-elkus.iSosnin B (2000) A pat(ent) on the back. HR Magazine 45(3). http://www.shrm.org/Publications/hrmagazine/EditorialContent/Pages/0300sosnin.aspx.
Endnotes1Kim and Marschke (2004) attribute the post-1983 rise toincreases in U.S. firms’ R&D expenditures and aggregate R&Doutput (patents), whereas Kortum and Lerner (1999) attribute therise to improvements in research productivity that augmentedthe patent yield per R&D dollar. However, shifts in the quantityand quality of R&D tend to be gradual, take time to impact theoutput of patents, and cannot fully explain the sharp patentinguptick in 1984. The tentative consensus among patent scholars
now is that either the increase in the value of patents or changesin R&D, or a combination of the two factors, was responsiblefor the “patent explosion” (Kortum and Lerner 1999 carefullyinvestigate and eliminate several alternative explanations forthe surge).2Ideally, we would use the number of all patent applications, but,for applications filed before November 29, 2000, the U.S. patentoffice published information only for successful applications orapplications that issued as patents.
Dow
nloa
ded
from
info
rms.
org
by [
128.
122.
201.
75]
on 2
5 M
arch
201
5, a
t 11:
48 .
For
pers
onal
use
onl
y, a
ll ri
ghts
res
erve
d.
Bhaskarabhatla and Hegde: An Organizational Perspective on Patenting and Open Innovation1762 Organization Science 25(6), pp. 1744–1763, © 2014 INFORMS
3We used three-year moving averages to smooth out fluctuationsin R&D and P&E expenditures and also because typical projectcycles in semiconductors and electronics yield patents aftertwo–three years of R&D investments (see the discussion in Hallet al. 1986). Experimenting with different lag structures yieldedresults qualitatively similar to the ones obtained by using thethree-year moving averages.4Table A1 of the supplementary appendix compares IBM and theaverage control-group firm along several key variables (patents,R&D, P&E expenditures, and sales) for each year between 1979and 1998. Table A2 of the supplementary appendix reportscorrelations among the variables in our sample.5In our case, PPML regressions yield coefficient estimatesidentical to those of the simple Poisson regressions.6The standard deviation of the number of patents for eachfirm-year, 226, is significantly greater than the mean, 68.5, thusproviding evidence of overdispersion.7The IRR is obtained by calculating 4ebi − 15× 100%, where biis the corresponding PPML coefficient.8The magnitudes of some the four IBM-specific coefficientsare quite large because they are estimated using within-IBMvariation across just five years (and thus five observations) ineach subsample. For example, the estimated magnitude of theIBM × RD coefficient drops substantially if we leave out one ofthe IBM-specific interaction coefficients—say, IBM × Operatingincome change from the regressions (see Table A3 of thesupplementary appendix for the corresponding estimates).9Hall (2005) estimates changing trends in the market value ofpatent stocks and reports that the coefficients on patent stocks(in an equation that predicts Tobin’s q) turns from negative andsignificant in the pre-1984 years to insignificant in the post-1984years for firms in the electrical and electronics industry; thisfinding is broadly consistent with our estimated coefficients forthe control group firms.10Of course, technical knowledge may also be disseminatedafter the publication of patents, but, unlike publications, a patentconfers the inventor the legal rights to exclude others fromusing the patented invention during its term.11Alcacer and Gittelman (2006) and Lampe (2012) thoughtfullydiscuss examiner citations and strategic applicant citations aspotential sources of noise in patent citations. These sourcesof noise are unlikely to be systematically different for IBMand control-group patents assigned to other large corporationsand thus bias our estimates. However, one might argue thatpatentees strategically withhold citing the “prior art” of entitiesmore likely to enforce their patents. To the extent that IBMwas more likely to enforce its patents after 1989, a decline inits post-1989 citations may reflect strategic (non)citation, andnot reduced spillovers, although the USPTO’s “duty of candor”requirement, and examiners’ search for prior art impose a checkon such strategic (non)citations.12We are unable to perform this analysis in a formal differences-in-differences setup because most control group firms do notpublish in their own publication outlets. For this reason, it isalso difficult to identify citations by patents to the publicationsof control group firms.13The first two columns of Table A5 of the supplementaryappendix report the corresponding Poisson estimates. Thefixed-effects specifications drop TREATED from the estimationssince the variable’s value does not change within firms and isperfectly collinear with firm-fixed effects.
14Incidentally, Lim (2010) suggests that IBM researchers con-tinued to publish their R&D results in some areas while atthe same time keeping valuable, process-specific inventionsproprietary.15Eggers and Kaplan (2009) provide evidence that variation inmanagers’ ability to recognize the technical changes affectingtheir industry explains the variation in the timing of firms’ entryinto new markets.
ReferencesAgarwal R, Helfat CE (2009) Strategic renewal of organizations. Organ.
Sci. 20(2):281–293.
Alcacer J, Gittelman M (2006) Patent citations as a measure ofknowledge flows: The influence of examiner citations. Rev.Econom. Statist. 88(4):774–779.
Amburgey T, Kelly D, Barnett W (1993) Resetting the clock: Thedynamics of organizational change and failure. Admin. Sci. Quart.38(1):51–73.
Argyres NS, Liebeskind JP (1998) Privatizing the intellectual com-mons: Universities and the commercialization of biotechnology.J. Econom. Behav. Organ. 35:427–454.
Bessen J, Hunt R (2007) An empirical look at software patents.J. Econom. Management Strategy 16(1):157–189.
Bhaskarabhatla A, Pennings E (2013) Defensive disclosure of patentableinventions under antitrust enforcement. Working paper, Era-sumus University Rotterdam, Rotterdam, The Netherlands.http://ssrn.com/abstract=2154558.
Bloom N, Eifert B, Mahajan A, McKenzie D, Roberts J (2013) Doesmanagement matter: Evidence from India. Quart. J. Econom.128(1):1–51.
Boyer C (1990) The power of the patent portfolio. Think 56(5):10–11.
Buderi R (2000) Engines of Tomorrow: How the World’s Best Compa-nies Are Using Their Research Labs to Win the Future (Simon &Schuster, New York).
Chesbrough H (2006) Open-Innovation: The New Imperative forCreating and Profiting from Technology (Harvard Business SchoolPublishing, Boston).
Christensen CM (1997) The Innovator’s Dilemma: The RevolutionaryBook that Will Change the Way You Do Business (HarvardBusiness School Publishing, Boston).
Cockburn IM, Henderson RM (1998) Absorptive capacity, coauthoringbehavior, and the organization of research in drug discovery.J. Indust. Econom. 46(2):157–182.
Cohen WM, Levinthal DA (1990) Absorptive capacity: A new perspec-tive on learning and innovation. Admin. Sci. Quart. 35(1):128–152.
Cohen WM, Nelson RR, Walsh JP (2000) Protecting their intellectualassets: Appropriability conditions and why firms patent or not?NBER Working Paper 7552, National Bureau of EconomicResearch, Cambridge, MA. http://www.nber.org/papers/w7662.
Cooper AC, Schendel D (1976) Strategic responses to technologicalthreats. Bus. Horizons 19(1):61–69.
Cyert R, March J (1963) A Behavioral Theory of the Firm (Prentice-Hall,Upper Saddle River, NJ).
Davis J, Harrison S (2001) Edison in the Boardroom: How LeadingCompanies Realize Value from Their Intellectual Assets (JohnWiley & Sons, Hoboken, NJ).
Di Minin A, Bianchi M (2011) Safe nests in global nets: Internalizationand appropriability of R&D in wireless telecom. J. Internat. Bus.Stud. 42(7):910–934.
Dowell G, Hart S, Yeung B (2000) Do corporate global environmentalstandards create or destroy market value? Management Sci.46(8):1059–1074.
Dow
nloa
ded
from
info
rms.
org
by [
128.
122.
201.
75]
on 2
5 M
arch
201
5, a
t 11:
48 .
For
pers
onal
use
onl
y, a
ll ri
ghts
res
erve
d.

Bhaskarabhatla and Hegde: An Organizational Perspective on Patenting and Open InnovationOrganization Science 25(6), pp. 1744–1763, © 2014 INFORMS 1763
Eggers JP, Kaplan S (2009) Cognition and renewal: Comparing CEOand organizational effects on incumbent adaptation to technicalchange. Organ. Sci. 20(2):461–477.
Gomory R (1989) Moving IBM’s technology from research to develop-ment. Res. Tech. Management (November–December):27–32.
Greve HR (2008) A behavioral theory of firm growth: Sequentialattention to size and performance goals. Acad. Management J.51(3):476–494.
Grindley PC, Teece DJ (1997) Managing intellectual capital: Licensingand cross-licensing in semiconductors and electronics. Calif.Management Rev. 39(2):1–34.
Hall BH (2005) Exploring the patent explosion. J. Tech. Transfer30(1–2):35–48.
Hall BH, Ziedonis RH (2001) The determinants of patenting in theU.S. semiconductor industry, 1980–1994. RAND J. Econom.32:101–128.
Hall BH, Jaffe A, Trajtenberg M (2005) Market value and patentcitations. RAND J. Econom. 36(1):16–38.
Hannan MT, Freeman J (1977) The population ecology of organizations.Amer. J. Sociol. 82(5):929–964.
Hausman JA, Hall BH, Griliches Z (1984) Econometric models forcount data with an application to the patents-R&D relationship.Econometrica 52(4):909–938.
Hegde D, Mowery DC, Graham SJH (2009) Pioneering inventors orthicket builders: Which U.S. firms use continuations in patenting?Management Sci. 55(7):1214–1226.
Heller MA, Eisenberg RS (1998) Can patents deter innovation? Theanticommons in biomedical research. Science 280(5364):698–701.
Henderson R, Jaffe AB, Trajtenberg M (1998) Universities as a sourceof commercial technology: A detailed analysis of universitypatenting, 1965–1988. Rev. Econom. Statist. 80(1):119–127.
Henderson RM, Clark KB (1990) Architectural innovation: The recon-figuration of existing product technologies and the failure ofestablished firms. Admin. Sci. Quart. 35(1):9–30.
Jaffe AB, Trajtenberg M, Henderson R (1993) Geographic knowledgespillovers as evidenced by patent citations. Quart. J. Econom.108(3):577–598.
Kim J, Marschke GR Jr (2004) Accounting for the recent surge in U.S.patenting: Changes in R&D expenditures, patent yields, and thehigh tech sector. Econom. Innovation New Tech. 13(6):543–558.
Kortum S, Lerner J (1999) What is behind the recent surge in patenting?Res. Policy 28(1):1–22.
Lampe R (2012) Strategic citations. Rev. Econom. Statist. 94(1):320–333.
Levinthal DA (1997) Three faces of organizational learning: Wisdom,inertia, and discovery. Garud R, Nayyar PR, Shapira ZB, eds.Technology Innovation. Oversights and Foresights (CambridgeUniversity Press, Cambridge, UK), 167–180.
Lim K (2010) The many faces of absorptive capacity: Spillovers ofcopper interconnect technology for semiconductor chips. Indust.Corporate Change 18(6):1249–1284.
Lynam J (2009) Patent medicine man. Business People-Vermont (March)http://www.vermontguides.com/2009/03-mar/ipcapital.html.
Majumdar BA (1982) Innovations, Product Developments and Tech-nology Transfers—An Empirical Study of Dynamic CompetitiveAdvantage: The Case of Electronic Calculators (University Pressof America, Washington, DC).
McGroddy J (2011) Personal email communication with first author,January.
Miele AL (2001) Patent Strategy: The Manager’s Guide to Profitingfrom Patent Portfolios (John Wiley & Sons, Hoboken, NJ).
Mintzberg H (1990) The manager’s job: Folklore and fact. HarvardBus. Rev. 68(March–April):163–176.
Mowery D, Nelson R, Sampat B, Ziedonis A (2001) The growth ofpatenting and licensing by U.S. universities: An assessment of theeffects of the Bayh–Dole Act of 1980. Res. Policy 30(1):99–119.
Murray F, Stern S (2006) Do formal intellectual property rights hinderthe free flow of scientific knowledge? An empirical test ofthe anti-commons hypothesis. J. Econom. Behav. Organ. 63(4):648–687.
Narin F, Hamilton KS, Olivastro D (1997) The increasing link-age between U.S. technology and public science. Res. Policy26(3):317–330.
Nelson RR, Winter SG (1982) An Evolutionary Theory of EconomicChange (Harvard University Press, Cambridge, UK).
Rivette K, Kline D (2000) Rembrandts in the Attic: Unlocking theHidden Value of Patents (Harvard Business School Publishing,Boston).
Rumelt RP (1995) Inertia and transformation. Montgomery CA, ed.Resource-Based and Evolutionary Theories of the Firm (KluwerAcademic Publishers, Norwell, MA), 101–132.
Santos Silva JMC, Tenreyro S (2006) The log of gravity. Rev. Econom.Statist. 88(4):641–658.
Santos Silva JMC, Tenreyro S (2010) On the existence of the maxi-mum likelihood estimates in Poisson regression. Econom. Lett.107(2):310–312.
Scherer FM (1987) Antitrust, efficiency and progress. New York Univ.Law Rev. 62(5):998–1019.
Siggelkow N (2001) Change in the presence of fit: The rise, thefall, and the renaissance of Liz Claiborne. Acad. Management J.44(4):838–857.
Somaya D, Williamson IO, Zhang X (2007) Combining patent lawexpertise with R&D for patenting performance. Organ. Sci.18(6):922–937.
Sørensen JB, Stuart TE (2000) Aging, obsolescence and organizationalinnovation. Admin. Sci. Quart. 45(1):81–112.
Sosnin B (2000) A pat(ent) on the back. HR Magazine 45(3) http://www.shrm.org/Publications/hrmagazine/EditorialContent/Pages/0300sosnin.aspx.
Tripsas M, Gavetti G (2000) Capabilities, cognition, and inertia: Evi-dence from digital imaging. Strategic Management J. 21(10–11):1147–1161.
Tushman ML, Anderson P (1986) Technological discontinuities andorganizational environments. Admin. Sci. Quart. 31(3):439–465.
Tushman ML, O’Reilly CA III (1996) Ambidextrous organizations:Managing evolutionary and revolutionary change. Calif. Manage-ment Rev. 38(4):8–30.
Tushman ML, Romanelli E (1985) Organizational evolution: A meta-morphosis model of convergence and reorientation. Staw BM,Cummings LL, eds. Research in Organization Behavior, Vol. 7(JAI Press, Greenwich, CT), 171–222.
Ajay Bhaskarabhatla is an assistant professor of organizationand strategy at Erasmus School of Economics. He received hisPh.D. from Carnegie Mellon University. His research interestsinclude strategy, industry evolution, and innovation.
Deepak Hegde is an assistant professor of managementand organizations at New York University’s Stern Schoolof Business. He received his Ph.D. from the University ofCalifornia, Berkeley. His research interests include innovation,intellectual property rights, and entrepreneurship.
Dow
nloa
ded
from
info
rms.
org
by [
128.
122.
201.
75]
on 2
5 M
arch
201
5, a
t 11:
48 .
For
pers
onal
use
onl
y, a
ll ri
ghts
res
erve
d.