abstract title: an organizational culture perspective …
TRANSCRIPT

ABSTRACT
Title: AN ORGANIZATIONAL CULTURE PERSPECTIVE ON ROLE EMERGENCE AND ROLE ENACTMENT
Sophia V. Marinova, Doctor of Philosophy, 2005
Directed By: Professor Paul E. Tesluk, Department of Management and Organization
Organizational culture has received ample attention both in the popular and
scholarly press as an important factor predicting organizational effectiveness by
inducing employees to behave effectively (Cooke & Rousseau, 1988; Schein, 1985,
1990). The assertion that culture leads to behavior, however, has received only
limited empirical support. The purpose of this dissertation is to explicate the impact
of organizational culture on employees' roles and subsequent role behaviors. I
propose that four types of cultures (clan, entrepreneurial, market and hierarchy) exert
different and at times competing pressures, thus, creating distinct role schemas
regarding the range of expected employee behaviors, which in turn, guide distinct
forms of employee role behavior (e.g. helping, innovation, achievement and
compliance).
In addition, I examine boundary conditions on the relationships between
culture and role perceptions and role perceptions and behavior. I propose that in the
process of role emergence, culture strength as an organizational level characteristic,

cognitive self-monitoring, and perceived person-organization (P-O) fit influence the
degree to which individuals interpret and incorporate the organizational culture’s
norms as part of their roles at work. I also suggest that culture strength, behavioral
self-monitoring as well as P-O fit have an impact on the extent to which employees
enact the expected organizational work roles.
Data from about hundred different organizations were collected to test the
proposed relationships. The empirical results provide support for most of the
proposed relationships between culture and employee roles, thereby validating the
role of culture in establishing what is expected and valued at work. In addition,
culture strength had moderating effect on the linkages between culture and employee
roles for two of the culture dimensions (clan and hierarchical). Surprisingly, self-
monitoring (cognitive) had a significant moderating effect but in a direction different
from the predicted. Perceived fit moderated the relationship between market culture
and helping role. Innovative role exhibited a negative significant relationship with
compliant behavior while market strength intensified the negative relationship
between achievement role and helping behavior. Thus, the results lend some support
to the overall framework. Implications for theory and practice, as well as directions
for future research, are discussed.

AN ORGANIZATIONAL CULTURE PERSPECTIVE ON ROLE EMERGENCE AND ROLE ENACTMENT
By
Sophia V. Marinova
Dissertation submitted to the Faculty of the Graduate School of the University of Maryland, College Park, in partial fulfillment
of the requirements for the degree ofDoctor of Philosophy
2005
Advisory Committee:
Professor Paul E. Tesluk, ChairProfessor Paul HangesProfessor Henry P. SimsProfessor Cynthia K. Stevens Professor M. Susan Taylor

© Copyright bySophia V. Marinova
2005

ii
Dedication
There are several people who have been an inspiration to me during the challenging
times of the Ph.D. program. I’d like to dedicate this dissertation to:
Sophia Iantcheva (my grandmother), who has taught me the value of staying
optimistic in the face of great challenges.
Nina Marinova (my mother), for her unswerving belief in me.
Ivan Anastassov (my husband), for his selfless encouragement and support.
Krustio Krustev, for being a great inspiration to me.

iii
Acknowledgements
There are a number of people who have provided me with tremendous support
throughout my Ph.D. student tenure and with respect to my dissertation.
First of all, I’d like to thank all of my dissertation committee members: Paul
Tesluk, Hank Sims, Paul Hanges, Cindy Stevens, and Susan Taylor. I am grateful to
Paul Tesluk, my dissertation advisor, who has been a source of great support to me
and has always constructively challenged me to develop my professional skills. I wish
to thank Hank for his moral support and advice throughout the Ph.D. program, for
being a great mentor, and for being there for me during difficult times. I also greatly
appreciate the support and advice from Paul Hanges, Cindy Stevens, and Susan
Taylor.
A special thanks to Myeong-Gu Seo for assisting me with the data-collection
process for the dissertation. I would also like to thank Henry Moon for his research
mentoring. I appreciate the support of several other faculty members as well: Ian
Williamson, Kay Bartol, Anil Gupta, Ken Smith, Scott Turner, and Dave Lepak.
I’d also like to thank my classmates for their collegiality and for helping me
laugh throughout these years. A special thanks to Riki Takeuchi, Qing Cao, Long
Jiang, Wei Liu, Lisa Dragoni, Jennifer Marrone, Alice Zhang, Meredith Burnett,
Nevena Koukova, Antoaneta Petkova, and Karen Wouters: I consider myself
fortunate to have been your colleague and friend.
Last but not least, I’d like to thank my husband Ivan Anastassov for his love,
tremendous support, encouragement and his great sense of humor; my mother Nina
Marinova and father Vladimir Marinov, for their love and advice; to my brothers

iv
Nikolay Marinov, Pavel Marinov, and Krasen Marinov for always being supportive
with me.
Thank you all!

v
Table of Contents
Dedication ..................................................................................................................... iiAcknowledgements...................................................................................................... iiiTable of Contents.......................................................................................................... vList of Tables ............................................................................................................... viList of Figures ............................................................................................................. viiChapter 1: Problem Statement ...................................................................................... 1Chapter 2: Theoretical Concepts................................................................................. 14
Organizational Culture............................................................................................ 14Roles and Role Theory............................................................................................ 23Employee Behaviors ............................................................................................... 25
Summary............................................................................................................. 35Individual differences and attitudes ........................................................................ 36
Chapter 3: Hypotheses Development.......................................................................... 39Organizational Culture as Antecedent of Work Roles............................................ 39Roles as Predictors of Behavior.............................................................................. 43Moderators of The Relationships Between Organizational Culture, Roles, and Behaviors ................................................................................................................ 44Summary................................................................................................................. 54
Chapter 4: Method Section ......................................................................................... 57Research Design...................................................................................................... 57Sample..................................................................................................................... 57Analysis................................................................................................................... 59Summary................................................................................................................. 62Relationships between Culture and Roles............................................................... 81Relationships between Roles and Behaviors .......................................................... 92Summary of results ............................................................................................... 113
Chapter 6: Discussion ............................................................................................... 116Relationships between Culture and Roles............................................................. 116Relationships between Roles and Behavior .......................................................... 123Implications........................................................................................................... 125Limitations ............................................................................................................ 129Directions for Future Research ............................................................................. 132
Conclusion ................................................................................................................ 134Appendices................................................................................................................ 136
Appendix A: Focal Questionnaire ........................................................................ 136Appendix B: Coworker Questionnaire.................................................................. 145Appendix C: Supervisor Questionnaire ................................................................ 152
Bibliography ............................................................................................................. 155

vi
List of Tables
Table 1: The OCI Cultural Styles .............................................................................. 17Table 2: Sources for Primary Analysis ....................................................................... 62Table 3: Exploratory Factor Analysis of Organizational Culture............................... 63Table 4:Correlations between Dimensions of Culture from the Coworker and Focal
Perspectives......................................................................................................... 67Table 5: Multi-trait Multi-method Approach to Culture............................................. 68Table 6: Exploratory Factor Analysis of Role Perceptions of Organizational
Expectations........................................................................................................ 72Table 7: Correlation Table (Roles as Dependent Variable)........................................ 78Table 8: Regression Analysis of the Relationship between Culture and Roles.......... 82Table 9: Interaction Results: Culture and Culture Strength on Roles......................... 85Table 10 (strength as agreement):Interaction Results ................................................ 86Table 11:Interaction Results: Culture and Self-monitoring on Roles......................... 89Table 12: Culture and Perceived Person-Organization Fit (P-O Fit) Interaction on
Roles ................................................................................................................... 91Table 13:Correlation Table: Coworker-Rated Behaviors as a Dependent Variable... 93Table 14: Relationships between Roles and Behaviors (coworker ratings) .............. 96Table 15: Correlations among behaviors (coworkers and supervisors as sources) .... 98Table 16: Correlation Table: Supervisor-Rated Behaviors as a Dependent Variable 99Table 17: Relationships between Roles and Behaviors (supervisor ratings) ............ 102Table 18: Interaction between Culture Strength and Roles on Behaviors (coworker
ratings) .............................................................................................................. 104Table 19: Interactions between Roles and Strength (agreement) on Behaviors
(coworker ratings) ............................................................................................. 105Table 20: Interaction between Roles and Culture Strength on Behaviors (supervisor
ratings) .............................................................................................................. 106Table 21: Interactions between Roles and Agreement on Behaviors (supervisor
ratings) .............................................................................................................. 107Table 22: Interaction Results for Roles and Self-monitoring (behavioral) on
Behaviors (coworker ratings)............................................................................ 109Table 23: Interaction Results for Roles and P-O fit on Behaviors (coworker ratings)
........................................................................................................................... 110Table 24: Interaction Results for Roles and Self-monitoring (behavioral) on
Behaviors (supervisor ratings) .......................................................................... 111Table 25: Interaction Results for Roles and P-O fit on Behaviors (supervisor ratings)
........................................................................................................................... 112Table 26: Summary of Results.................................................................................. 115
vii
List of Figures
1. Culture Types……………….………………………………………………..222. Model of Role Perceptions and Role Enactment…………………………….563. Interactions between Culture and Culture Strength………………….………874. Interaction between self-monitoring (cognitive) and entrepreneurial
culture………………………………………………………………..………905. Interaction between P-O fit and market culture……………………………...92

1
Chapter 1: Problem Statement
The notion that employees are crucial for organizational effectiveness has come to
be viewed as a truism in the management literature (Barnard, 1938; Coff, 1997; Deal &
Kennedy, 1988; Katz, 1964; Lengnick-Hall & Lengnick-Hall, 2003). From a resource-
based theory perspective, human capital is considered as valuable, hard-to-imitate, and
socially complex and therefore (Coff, 1997), can serve as a source of competitive
advantage for organizations. As a result, the process through which employees contribute
to organizational effectiveness has received a great deal of attention. One important area
of research examining human capital is the literature exploring the work performance
domain and its various forms and manifestations in the workplace (Barnard, 1938;
Borman & Motowidlo, 1993; Katz, 1964; Organ, 1988).
It has been established that satisfying the specific job requirements on a day-to-
day basis through on-the-job task performance is not the only important component of
employee effectiveness (Borman & Motowidlo, 1993; Organ, 1988; Van Scotter &
Motowidlo, 1996). Rooted in earlier notions that organizations need to ensure that
employees engage in beneficial behaviors beyond their immediate technical job
requirements (Barnard, 1938; Katz & Kahn, 1978), extensive research has been devoted
to fleshing out behavioral constructs that go beyond the specific technical requirements of
a job and add value to employee effectiveness and which ultimately contribute to group
and organizational effectiveness (Katz, 1964; Organ, 1988; Podsakoff, Ahearne, &
MacKenzie, 1994; Van Scotter & Motowidlo, 1996). While task behaviors directly
concern the technical core of the organization by serving to transform raw materials into
products and distributing, and providing service for products, non-task behaviors “do not

2
support the technical core itself as much as they support the broader organizational,
social, and psychological environment, in which the technical core must function”
(Motowidlo & Van Scotter, 1994, p.476). Terms such as organizational citizenship
behavior (Smith, Organ, & Near, 1983), organizational spontaneity (George & Brief,
1992), contextual performance (Borman & Motowidlo, 1993; Motowidlo & Van Scotter,
1994) and prosocial behavior (Brief & Motowidlo, 1986) have been used as labels for
these valuable non-task employee behaviors.
The proliferation of terms to describe the broad domain of employee behaviors
has been accompanied by a sustained interest in identifying the antecedents and
performance implications of these behaviors. Some studies have examined individual
differences such as personality in relation to citizenship behaviors, but the predictive
validity of personality has been found to be limited for the most part to the trait of
conscientiousness (Organ & Ryan, 1995). Considerable research has been conducted on
the premises of the social exchange perspective (Blau, 1964), according to which
employees engage in beneficial behaviors to reciprocate favorable treatment by the
organization (Podsakoff, MacKenzie, Paine, & Bachrach, 2000; Zellars & Tepper, 2003).
Antecedents such as perceived organizational support (Eisenberger, Armeli, Rexwinkel,
Lynch, & Rhoades, 2001; Rhoades & Eisenberger, 2002), fairness (Ball, Trevino, &
Sims, 1984; Konovsky & Pugh, 1994; Masterson, Lewis, Goldman, & Taylor, 2000), and
leader-member exchange (Settoon, Bennett, & Liden, 1996) have been explored from a
social exchange theoretical perspective.
As critical as a social exchange framework might be, factors at the organizational
level, notably organizational culture, may also serve as a fundamental mechanism for

3
eliciting these important non-task behaviors (Schein, 1985). At the same time, relatively
little research to date has sought to directly investigate the relationships that might exist
between organizational culture and employee behavior. This is perhaps surprising since
the literature linking organizational culture and organizational effectiveness has stressed a
behavioral explanation by arguing that cultures elicit, encourage and reinforce certain
critical behaviors by employees to facilitate organizational effectiveness (Denison &
Mishra, 1995; Kotter & Heskett, 1992). In other words, the implicit assumption is that
organizational culture provides a blueprint for eliciting and supporting the types of
employee behaviors which the organization has developed to cope with its problems of
external adaptation and internal integration (Quinn & Rohrbaugh, 1983; Schein, 1985).
This important assumption, that culture drives employee behaviors, however, has
received only limited direct empirical attention (Tesluk, Hofmann, & Quigley, 2002).
Recent events in the business world nevertheless suggest that understanding
organizational culture and its impact on human behavior in organizations may be of
critical importance. Enron, for instance, is an exemplar of how having the wrong
organizational culture precipitates business failure. Enron’s high achievement oriented,
entrepreneurial employees reinforced the competitive “survival-of-the-fittest” culture of
the company (Byrne, 2002). Because of the unreasonably high performance expectations,
competitive behavior taken to an unethical level became the norm for many Enron
managers and employees. The Enron leadership sustained this aggressive culture by
enriching themselves possibly unethically. By comparison, companies prominent for their
innovation competencies like 3M and Apple effectively reinforce innovative employee
behavior by sustaining a culture for creativity and innovation (Tesluk, Farr & Klein,

4
1997). Companies pursuing internal stability such as large government bureaucracies are
likely to seek to instill respect for order and rule following as appropriate behaviors in
their employees in order to facilitate functioning on complex tasks (Leavitt, 2003;
Thompson & Wildavsky, 1986). Ouchi (1981) juxtaposed the traditional American and
Japanese organizational culture styles and suggested that management through
commitment and cohesiveness seems to be the success formula in Japan. In the US, on
the other hand, tragic events such as September 11th have demonstrated that the courage,
cooperation and cohesiveness of the rescuer teams of firefighters and police officers was
key for the successful management of this emergency situation. These examples reinforce
the idea that fostering a specific culture is likely to be crucial for eliciting a variety of
employee behaviors ranging from high individual achievement to cooperation and help,
and from strict rule observance to innovation.
Organizational culture provides a meaning system (Cooke & Rousseau, 1988;
Martin, 1992; Parker, 2001; Schein, 1985) for employees who are making sense of their
environment (Weick, 1995). As such, organizational culture serves as a vehicle of the
organizational influence on the individual’s identity and behavior (Parker, 2000) by
socializing individuals into specific norms and patterns of behavior (Louis, 1980) and by
providing socially shared perceptions, which create predictability in the organizational
environment (Cooke & Rousseau, 1988). Only a limited number of studies have
examined the impact of organizational culture on employee behavior, and those have
specifically been restricted to studying collectivistic and individualistic organizational
cultural norms as predictors of cooperative employee behavior (Chatman & Barsade,
1995; Chatman, Polzer, Barsade & Neale, 1998). Consequently, there has been a relative

5
paucity of research examining the impact of a wider range of organizational culture
norms on employee behaviors.
Culture encompasses elements of the organization such as artifacts, values, and
symbols, which permeate the organizational environment and provide blueprints for
employees of what is expected in their work environment (Chatman & Barsade, 1995;
Chatman et al., 1998; Hatch, 1993; Schein, 1985). Assumptions and values are a major
component of organizational culture and this determines its largely preconscious nature
(Ashforth, 1985). I propose that roles provide the perceptual link between culture and
behaviors. As Katz & Kahn (1978) in their treatise on the formulation and enactment of
roles suggested: “The concept of role is proposed as the major means for linking the
individual and organizational levels of research and theory: it is at once the building
block of social systems and the summation of the requirements with which such systems
confront their members as individuals” (p. 219-220). A role theory perspective provides
the bridging mechanism between organizational culture and behaviors.
Research on national culture supports the importance of roles by demonstrating
that culture influences the cognitive processes of individuals by intensifying the retrieval
of perceptions consistent with the overall cultural values (Trafimow, Triandis, & Goto,
1991; Triandis, 1989). Organizational culture consists of ambient stimuli that are likely to
prime role cognitions coherent with their content and direction (Katz & Kahn, 1978). In
the business world, cultures such as that of Dell might initiate employees’ developing
achievement role perceptions, which in turn drive high individual achievement behavior,
while at 3M or Apple employees might espouse an innovative role orientation consistent
with the organizational culture of innovation. Thus, I propose that different

6
organizational cultures create different patterns of role perceptions and subsequent
behavioral responses.
One of the most prominent definitions of organizational culture comes from the
work of Edgar Schein who proffered that “ Organizational culture is the pattern of basic
assumptions that a given group has invented, discovered, or developed in learning to cope
with its problems of external adaptation and internal integration, and that have worked
well enough to be considered valid, and, therefore, to be taught to new members as the
correct way to perceive, think, and feel in relation to those problems” (1984: p. 3). Two
basic dimensions along which cultures may be expected to differ and which emerge as
important in Schein’s (1985) definition are the external and internal focus of
organizations. Moreover, Schein (1985) suggested that organizations are concerned with
their adaptation (flexibility) and integration (stability) at the same time. Specifically, as
Schein (1985) puts it:
“All group and organizational theories distinguish two major sets of problems that
all groups, no matter what their size, must deal with: (1) survival, growth, and adaptation
in their environment and (2) internal integration that permits daily functioning and the
ability to adapt” (p. 11).
It can therefore be inferred that organizational culture is concerned with adaptation in its
internal environment and with respect with its external environment but at the same time
seeks to establish internal integration and stability.
A specific framework, which approaches cultures as reflecting how organizations
cope with the competing tensions of internal and external focus and the need to sustain

7
flexibility and stability, describes organizational cultures as falling under one of four
general culture types: clan, adhocracy (here I will refer to it as entrepreneurial), hierarchy
and market culture types (Cameron & Quinn, 1999; Denison & Mishra, 1995; Ouchi,
1979; Quinn & Rohrbaugh, 1983). These four culture types capture the stable patterns of
norms that organizations develop to cope with their environment by focusing primarily
on either their internal or their external environment and by choosing either to pursue
stability or to develop their adaptability (Denison & Mishra, 1995; Tesluk et al., 2002).
According to the Cameron and Quinn (1999) framework, based on earlier empirical work
by Quinn and Rohrbaugh (1983), some organizations choose to focus on their external
environment for achieving competitive advantage (e.g. Dell), while the effectiveness of
other organizations is predicated upon sustaining their internal organizational focus
through stable internal systems (e.g. bureaucratic systems). In addition, using a clustering
technique, Quinn and Rohrbaugh (1983) showed that another continuum along which
organizations differ is the stability-adaptability continuum (Lawrence & Lorsch, 1967),
with some organizations defining effectiveness along the lines of protecting the stability
of the organizational functioning, while others emphasizing quick adaptability as the
basis of their effectiveness.
Furthermore, according to Quinn and Rohrbaugh (1983), organizations choose
different means of organizing depending on the ends they pursue. For instance, the clan
culture type has an internal organizational focus and emphasizes adaptability through
encouraging cohesion, morale and cooperation among employees (Cameron & Quinn,
1999; Ouchi, 1979; Quinn & Rohrbaugh, 1983); the bureaucracy type of culture also has
an internal focus, but achieves this instead with an emphasis on organizational stability

8
through the use of rules and regulations (Cameron & Quinn, 1999; Ouchi, 1979;
Zammuto, Giffort, & Goodman, 2000). The market culture can be characterized with a
strong external market orientation and concern with external competitiveness and
stability through efficiency control. Finally, like a market culture, an entrepreneurial
culture is externally oriented, but norms in the entrepreneurial culture emphasize
individual creativity and the ability to deal with external challenges by coming up with
innovative solutions (Cameron & Quinn, 1999; Quinn & Rohrbaugh, 1983; Zammuto et
al., 2000). I propose that these four culture types prime cognitive role perceptions, which
in turn lead to employee behaviors.
Research in organizations has examined role perceptions as a predictor of
employee behaviors within an organizational context (Hofmann, Morgeson, & Gerras,
2003; Morrison, 1994; Tepper, Lockhart, & Hoobler, 2001). From a role theory
perspective, organizations must communicate what roles are expected of employees,
thereby enabling individuals to make sense of their environment and enact the
communicated roles (Katz & Kahn, 1978; Weick, 1993). In support of the predictive
validity of role perceptions, a number of studies have confirmed a positive relationship
between perceiving helpful organizational citizenship behavior (OCB) to be part of one’s
role at work and the incidence of citizenship behaviors (Hofmann et al., 2003; Morrison,
1994; Tepper et al., 2001). Perceived roles provide a socially constructed cognitive
environment that guides the thinking and acting patterns of people in the organization
(Cooke & Rousseau, 1988; Weick, 1981). Organizational culture provides a salient
system of meaning, which creates specific cognitive role perceptions (scripts) as to what

9
is expected in the workplace. Those cognitive role perceptions are among the proximal
factors leading to behaviors (Hofmann et al., 2003; Morrison, 1994; Tepper et al., 2001).
I propose that different organizational cultures create different role expectations,
which are functional for the respective culture (Katz & Kahn, 1978). For instance, the
clan culture would create the expectation that individuals should cooperate and
collaborate on tasks; the bureaucracy culture, on the other hand, primes cognitions that
strict rule observation of established procedures is anticipated in the organization; the
market culture type suggests an achievement role to achieve maximum efficiency and
finally, the entrepreneurial culture type creates innovative role cognitions (Zammuto et
al., 2000). I also propose that these role cognitions lead to behaviors ranging from
cooperation to competition and from rule observance to creativity. Even though some of
these behaviors might be construed as part of or closely interrelated with the task
performance of specific jobs (e.g. being innovative in a R&D unit or being strict in
observing the existing rules in the military), each behavior may occur in any occupation
and is not limited to a job type.
Examining the link between culture and behavior through the lens of role
perceptions in itself explicates the mechanism through which culture translates into
observable behaviors. Furthermore, to shed light on the boundary factors, which may
play a role in the process, I consider additional individual and organizational level
factors. I suggest that self-monitoring (Mehra, Kilduff, & Brass, 2001; Snyder, 1986) and
culture strength (Payne, 1996), for instance, are two factors, which may impact the
strength of the proposed relationships between culture types and cognitive role
perceptions. Self-monitoring is an individual difference variable that describes an
10
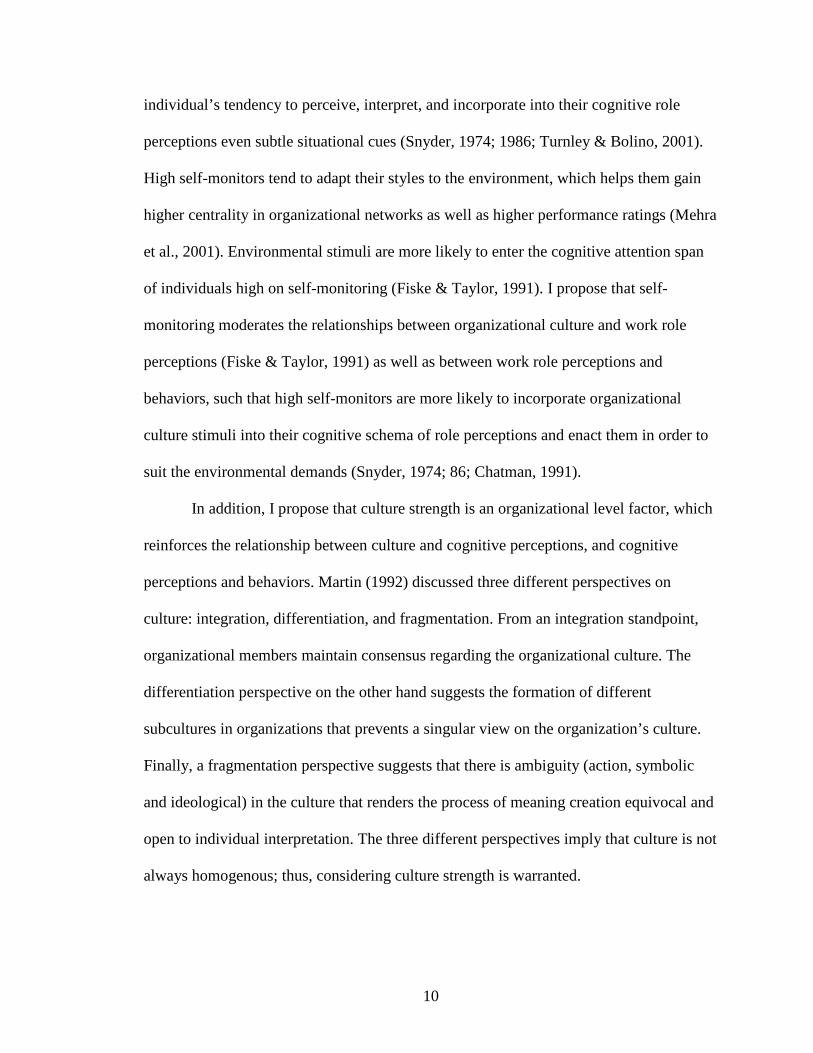
individual’s tendency to perceive, interpret, and incorporate into their cognitive role
perceptions even subtle situational cues (Snyder, 1974; 1986; Turnley & Bolino, 2001).
High self-monitors tend to adapt their styles to the environment, which helps them gain
higher centrality in organizational networks as well as higher performance ratings (Mehra
et al., 2001). Environmental stimuli are more likely to enter the cognitive attention span
of individuals high on self-monitoring (Fiske & Taylor, 1991). I propose that self-
monitoring moderates the relationships between organizational culture and work role
perceptions (Fiske & Taylor, 1991) as well as between work role perceptions and
behaviors, such that high self-monitors are more likely to incorporate organizational
culture stimuli into their cognitive schema of role perceptions and enact them in order to
suit the environmental demands (Snyder, 1974; 86; Chatman, 1991).
In addition, I propose that culture strength is an organizational level factor, which
reinforces the relationship between culture and cognitive perceptions, and cognitive
perceptions and behaviors. Martin (1992) discussed three different perspectives on
culture: integration, differentiation, and fragmentation. From an integration standpoint,
organizational members maintain consensus regarding the organizational culture. The
differentiation perspective on the other hand suggests the formation of different
subcultures in organizations that prevents a singular view on the organization’s culture.
Finally, a fragmentation perspective suggests that there is ambiguity (action, symbolic
and ideological) in the culture that renders the process of meaning creation equivocal and
open to individual interpretation. The three different perspectives imply that culture is not
always homogenous; thus, considering culture strength is warranted.

11
The literature on social comparison and conformity (Ashforth, 1985; Festinger,
1954; Janis, 1972) also provides a theoretical perspective that explicates the mechanism
through which culture strength acts as a moderator. Social conformity suggests that in the
presence of social agreement individuals are less likely to deviate from the social norms.
I propose that culture strength, which denotes the level of agreement (integration) among
organizational members (Martin, 1992), moderates the relationship between
organizational culture and role perceptions, as well as between role perceptions and
behaviors such that when the culture strength is higher indicating higher consensus
regarding the organizational culture, the relationships between culture and cognitive role
perceptions, and between role perceptions and respective behaviors, would be stronger
due to the increased pressure for social conformity.
Additionally, I examine person-organization fit (Chatman, 1989; O’Reilly,
Chatman, & Caldwell, 1991) as a moderator of the relationships between culture and
cognitive role perceptions, and between roles and exhibited behaviors. P-O fit is a
concept associated with the degree to which individuals feel that their values and
personality fit those of their current organization. P-O fit specifically captures the extent
to which there is a match between organizational culture and the individual preferences
for culture type. Consequently, it has been proposed that individuals who experience
higher degree of fit with their organization are more likely to engage behaviors that are
prescribed by the organizational context (Chatman, 1989).
Here I propose that fit will enhance the convergence between culture and
perceived roles such that individual who experience high fit will perceive roles more
consonant with the context. In addition, from an enactment perspective (Abolafia &

12
Kilduff, 1988; Weick, 1981; 1995), individuals are not only passive sensemakers but are
also active creators of their environment. Here, I propose that a high degree of fit will
enhance the relationship between cognitive role perceptions and expected behaviors since
individuals with greater fit will actively try to reinforce their existing environments.
Employees experiencing low fit with their organizations may try to resist or actively
change their environment by withholding expected behaviors and possibly approaching
their work in alternative ways.
In sum, the research questions that I present are as follows: How does
organizational culture influence cognitive role perceptions and what is the role of
individual and contextual factors in this process? While the virtues of self-monitoring
have been traditionally extolled, it is possible that for dysfunctional organizational
cultures such as the one which seemed to permeate Enron’s environment, low self-
monitors would be more likely to oppose traditional ways of thinking. The strength of an
organizational culture might also have important implications in determining the extent to
which it culture translates into observable behaviors. Another research question I am
posing concerns the relationship between culture, cognitive role perceptions and
behaviors, and the role that P-O fit might have in this process. Here, it could be argued
that even though individuals with high fit and organizational identification sustain
existing organizational cultures, individuals who experience low levels of fit and
commitment would be more adept at organizational change and in some extreme
examples, those individuals might go the extra mile of reporting dysfunctional
organizational activities (Watkins, 2003).

13
In conclusion, while examining organizational culture has much promise,
according to Weick (1981) “People in organizations repeatedly impose that which they
later claim imposes on them” (p.269). Weick’s (1981) perspective emphasizes the role of
the individual as an active creator of the environment by engaging in specific actions,
which create knowledge and meaning. To the extent to which “people… create many of
their own environments” (p. 279), at times it might be difficult to tell if culture has a
predominant impact on eliciting behaviors via roles or it is the individual’s behaviors,
which impose the environment itself and trigger a self-fulfilling cycle of perceiving
organizational roles as consistent with individual actions. From that perspective,
organizational culture may be reinforced through the actions and cognitions of
individuals even in periods when the organizational leadership is attempting to change
the cultural environment of the organization. Here, I propose some specific factors such
as culture strength and person-organization fit, which might increase the tendency of the
culture phenomenon to persist in organizations. But more research is needed to explore
the causality of actions and interpretations taking into account the dynamic nature of
sensemaking both through perceiving the environment and through actions and
behaviors, which create the environment.

14
Chapter 2: Theoretical Concepts
Organizational Culture
Defining organizational culture. The term culture, as defined by the school of
cognitive anthropology, consists of the psychological structures, which guide individuals’
and groups’ behavior. For instance, Goodenough who is representative of that school of
thought, pointed out that the culture of society: ”consists of whatever it is one to know or
believe in order to operate in a manner acceptable to its members” (In Geertz, 1973,
p.11). The term organizational culture has a similar meaning, only, it is applied to the
concept of organization instead of society. For instance, Eliot Jaques provides the
following description of the culture of a factory:
“The culture of the factory is its customary and traditional way of thinking and of
doing things, which is shared to a greater or lesser extent by all its members, and which
new members must learn, and at least partially accept… Culture is part of the second
nature of those who have been with the firm for a long time.” (1951: 251).
Culture, thus, consists of the set of assumptions, values, norms, symbols and
artifacts within the organization, which convey meaning to employees regarding what is
expected and shape individual and group behavior (Enz, 1988; Hatch, 1993; O’Reilly et
al, 1991; Rousseau, 1990). Schein (1985) defined culture as, “A pattern of shared basic
assumptions that the group learned as it solved problems of external adaptation and
internal integration, that has worked well enough to be considered valid and, therefore, to
be taught to new members as the correct way to perceive, think, and feel in relation to
these problems.” (p.12). Martin and Siehl (1983) viewed culture as the glue, which holds

15
the organization together via patterns of shared meaning, while Swartz and Jordon (1980)
suggested that culture is the composition of expectations and beliefs about behavior
shared in the organization. Therefore, organizational culture is expected to have an
important bearing on behavior (Cooke & Szumal, 2000; Chatman & Barsade, 1995;
Martin & Siehl, 1983; Schein, 1985).
There are some natural drawbacks to attempts to empirically measure culture due
to its inherent subjectivity (Geertz, 1973; Rousseau, 1990). Culture is a socially
constructed phenomenon and as such may be difficult to capture and quantify (Denison,
1996). Geertz (1973), in an attempt to emphasize the subjective nature of culture cites
Goodenaugh, who believed that culture was embedded in the minds and hearts of people.
Therefore, it could be maintained that culture has infinite forms such as is the number of
possible subjective interpretations. Such a conclusion precludes the quantifiable
measurement of organizational culture.
A debate making the culture literature even more complicated has revolved
around the methods of culture measurement (Denison, 1996; Denison & Mishra, 1995).
In the emic measurement tradition, researchers have advocated qualitative methods of
measurement capturing the native point of view (Denison, 1996), while the etic
perspective, which allows for quantitative measurement with instruments theoretically
developed by the culture researcher has been applied more consistently to the
measurement of climate rather than culture. In spite of the ongoing disagreements over
the nature and measurement of culture, a number of quantitative instruments have been
developed through a combination of methods that allow for the quantifiable measurement
of culture.

16
Measurement of organizational culture. The person-organization fit literature
represents one identifiable stream of culture research that has attempted to measure
organizational culture and individual preferences for organizational culture (Chatman,
1989, 1991;Kristoff, 1996; O’Reilly, Chatman, & Caldwell, 1991). O’Reilly, Chatman,
and Caldwell (1991), have made considerable progress in identifying key measurable
dimensions of organizational culture along with individual culture preferences. They
provided a comprehensive literature review in order to identify a wide-ranging list of
categories that are relevant to individual culture preferences and organizational cultures.
Their research was prompted by a willingness to appropriately study quantitatively
organizational culture in a way that allows for meaningful comparisons between the
values of individuals and organizations. To that end, O’Reilly and colleagues (1991)
developed the organizational culture profile (OCP), which consists of 54 statements
describing both the organization and the individual in terms of enduring values and
characteristics. A central focus of the P-O fit literature has been to discover the effects of
good and poor person-organization fit on these values on important proximal outcomes
such as employee performance, satisfaction, commitment and turnover (Chatman, 1989,
1991; Kristof, 1996; Saks, 1997).
Other organizational typologies have also been developed to assess organizational
culture apart from the P-O fit stream of research. For instance, the organizational culture
inventory (OCI) developed by Cooke & Lafferty (1986) has been used to test
relationships between antecedents and culture as well as between culture and outcomes of
interest (Klein, Masi, & Weidner, 1995). This culture inventory is based on a circumplex
notion of personality that taps interpersonal and task-related styles (Cooke & Rousseau,

17
1988; Wiggins, 1991). The OCI consists of 12 specific styles that are placed on a circle.
Examples of the OCI styles include humanistic-helpful, affiliative, conventional,
competitive, and achievement.
Although the OCI presents 12 main cultural styles or norms, the latter cluster in
three more general types: constructive, passive/defensive, and aggressive/defensive
(Cooke & Rousseau, 1988; Cooke & Szumal, 2000). In the constructive culture type,
cooperation, enjoyment of the task and creativity are valued. The passive-defensive
culture type is characterized by traditional authority, norms of conformity and
compliance, and top-down authority. Finally, aggressive-defensive cultures exhibit some
negative dynamics such as competition and opposition that could be detrimental for the
organization in the long-term. Therefore, the OCI typology incorporates elements of the
four behavioral patterns of helping, innovation, rule observance, and competition on the
level of organizational culture. Table 1 provides a summary of the specific culture norms
and culture types as they are defined by the OCI circumplex.
Table 1: The OCI Cultural Styles 1
Cultural Norms Characteristics Culture Type Cluster to Which the Style
BelongsHumanistic-Helpful
NormsThe organization is managed in a person-oriented manner; members are expected to be helpful and supportive with each other.
Constructive Culture
Affiliative Norms The organization places high priority on interpersonal harmony.
Constructive Culture
Achievement Norms In this type of culture, setting and achievement of challenging goals is central to the work
Constructive Culture
1 This table is based on the work of Cooke & Lafferty (1986), Cooke & Rousseau (1988) and Cooke & Szumal (2000).

18
concept.Self-Actualization Norms Creativity, quality over quantity,
and employee development and self-actualization are central to this type of culture.
Constructive Culture
Approval Norms Conflict is avoided at any cost for the sake of preserving good relationships.
Passive/Defensive Culture
Conventional Norms The organizational culture is conservative.
Passive/Defensive Culture
Dependent Norms Found in hierarchical organizations, where the decision-making is centralized.
Passive/Defensive Culture
Avoidance Norms Organizational culture in which success is not recognized but failure and mistakes are punished. Characterized by people shifting responsibilities to others so that they don’t take the blame for mistakes.
Passive/Defensive Culture
Oppositional Norms Confrontation and negativism are strong forces at work. Status and influence are the main goals of organizational members.
Aggressive/Defensive Culture
Power Norms Authority is inherent in the power position of individuals. Hierarchical pattern of decision-making and structuring of activities.
Aggressive/Defensive Culture
Competitive Norms In this type of culture, members are rewarded for outperforming each other. Winning is central to the organization and a “win-lose” framework defines work relationships.
Aggressive/Defensive Culture
Competence/Perfectionist Norms
This exists in organizations in which hard work and perfectionism on specific objectives are especially important aspects of performance.
Aggressive/Defensive Culture
Another stream of research has examined culture traits and a model of
effectiveness is the competing values framework (Denison & Mishra, 1995; Quinn &

19
Rohrbaugh, 1983; Tesluk et al., 2002). According to this approach, organizations are
constantly involved in reconciling multiple forces pulling the organization in opposite
directions (Denison & Mishra, 1995; Quinn & Rohrbaugh, 1983; Tesluk et al. 2002). The
two main pairs of opposites rooted in Shein’s (1985) definition of culture that
organizations have to reconcile are the need for internal integration and external
adaptation and the need to be stable and yet, at the same time ready and able to change
(Tesluk et al., 2002). Quinn and Rohrbaugh (1983) found support for a four-dimensional
model of organizational effectiveness that represents the multiple objectives that
organizations pursue. The specific outcomes were maintaining cohesion/ morale,
maintaining flexibility, efficiency/productivity, and stability of the organizational status-
quo (Quinn & Rohrbaugh, 1983). Denison and Mishra (1995) proposed a model of
organizational culture traits, which lead to dimensions of organizational performance,
situated along the same dimensions as the model of organizational effectiveness (Quinn
& Rohrbaugh, 1983), namely external adaptation versus internal integration and change
versus stability.
Each of the discussed research streams on culture measurement has its strong
points. The P-O fit research (Chatman, 1989; O’Reilly et al., 1991), for instance, is most
suitable for research, the focus of which is mostly on the precise measurement of fit
between a finite number of cultures and individual preferences. The OCI profile attempts
at deriving a comprehensive typology of culture norms, which are not necessarily
associated with specific individual values and preferences. Finally, the competing value
framework presents a paradoxical perspective on the forces that shape culture such that
there are contradictory ends, which different cultures pursue (Cameron & Quinn, 1999).

20
The different measures of culture indicate that there is a growing agreement that
culture can be measured. Here, I choose to maintain a four-dimensional conceptualization
of culture that integrates aspects of both the circumplex perspective on culture (OCI:
Cooke & Rousseau, 1988; Cooke & Szumal, 2000) and the four-dimensional
conceptualization of culture and effectiveness defined by the axes of external-internal and
flexibility –stability foci. The reason why I choose this model over the P-O fit
conceptualization, for instance, is that it provides a parsimonious but comprehensive
view on the dimensions of culture (Van Vianen, 2000). The three main factors of the
OCI, for example, suggest the presence of innovativeness, cooperation, competition and
rule observance (Cooke & Szumal, 2000). The constructive culture type, for instance,
instills norms for cooperation and creative behavior, which are two roles that I am
examining. Moreover, one characteristic of the passive/defensive culture is that it entails
conservatism and centralized decision-making, which implies existing norms for rule-
observance. This type of culture corresponds to a compliant role orientation whereby
employees strive to sustain order. Finally, in the aggressive/defensive culture
confrontation and negativism are strong forces at work. Due to the aggressive nature of
the aggressive/defensive culture, an aggressive role orientation would be the norm.
The culture-effectiveness model maintains four specific outcomes of culture:
cohesion/ morale, maintaining flexibility, efficiency/productivity, and stability of the
organizational status quo (Quinn & Rohrbaugh, 1983). The culture traits established by
Denison and Mishra (1995) are situated along the same dimensions as the effectiveness
model, namely external adaptation versus internal integration and change versus stability.
Cameron and Quinn (1999) have developed a specific questionnaire that taps four types

21
of culture, which can also be situated on the model defined by the stability-adaptability
and internal-external axes. The four culture types are as follows: clan (cooperative),
adhocracy (entrepreneurial/innovative), market (competitive), and hierarchy
(conservative). Cohesion/morale as an outcome of culture (Quinn & Rohrbaugh, 1983)
can be construed as an outcome of the clan culture. This type of culture emphasizes
cooperation and positive interpersonal interactions, and has, thus, been labeled “clan”
culture (Cameron and Quinn, 1999). Cameron and Quinn (1999) characterize the
adhocracy (innovative) culture as a place where entrepreneurship and creativity would be
valued employee behavior. Cultures where optimum efficiency is the norm may create
high-achievement, competitive orientations on the part of employees because of the high
performance goals. Cameron and Quinn (1999) labeled this type of culture as “market
culture” and pointed out that because market organizations are exclusively focused on
bottom-line results (Ouchi, 1979), people are expected to become goal-oriented and
competitive. The outcomes of a market culture resemble the efficiency/productivity
dimension of effectiveness (Quinn & Rohrbaugh, 1983). Finally, in the “hierarchy”
culture, stability is valued at all costs, and as a result, employees are encouraged maintain
the stability of the organization by carefully observing and following organizational rules
and procedures (Cameron & Quinn, 1999; Quinn & Rohrbaugh, 1983). Figure 1 presents
graphically the culture types in accordance with Cameron & Quinn’s (1999) initial
conceptualization.

22
Figure 1: Culture Types
Culture strength as an attribute of culture. According to Payne (1996), culture has
three important attributes: strength, direction, and pervasiveness. Strength denotes the
degree to which the culture is intense and strong. If a culture is strong, then the
underlying assumptions, the upheld norms, and the existing artifacts and symbols should
express a clear, singular message, thereby providing a more convincing and clear set of
expectations to employees. Individuals within the organization are more likely to
understand and comply with the culture norms if they are clear and strong (Payne, 1996;
Schein, 1984; 1985).
Culture Types
External
Market Culture
(Outcome: Efficiency/
Productivity)
Hierarchy Culture
(Outcome: Stability)
Entrepreneurial Culture
(Outcome: Flexibility)
Clan Culture
(Outcome:
Cohesion/Morale)
Stability Flexibility

23
Martin (1992) also emphasized the importance of understanding culture strength
by describing three perspectives on culture: integration, differentiation, and
fragmentation. In the integration perspective, culture has a strong impact on perceptions
and behavior because people in the organization agree on the content and direction of
culture. The fragmentation and differentiation perspectives suggest that when culture is
not strong and shared cohesively, symbols and values become ambiguous and open to
interpretation (fragmentation) and different subcultures may emerge (differentiation).
Roles and Role Theory
Role theory is concerned with studying human behavior in context by defining the
expectations and rewards associated with certain forms of behavior (Biddle, 1979). Social
position is a central concept associated with roles. Social position refers to the identity
that stratifies people in different social groups such as, for example, teacher, mother, and
manager. From a role behavior standpoint, each position has a characteristic role
associated with it. In addition, according to the predictions of role theory, roles are
induced through shared expectations of behavior (Biddle, 1979). The pragmatic view on
roles suggests that expectations are instilled in the individual during socialization and
individuals who are assimilated into groups conform to their expected roles. Another
important defining characteristic of roles, especially from a structural role theory
perspective, is their functionality for the social systems in which they are embedded
(Biddle, 1979; Stryker, 2002). For instance, if a player in a football team is being too
competitive with his own teammates, his behavior is not likely to be functional for the
overall performance of the team. In the same way, in a larger organization,

24
communicated roles should be functional for their respective context. For instance,
coming up with creative ideas in a largely bureaucratic context is probably not going to
be viewed favorably. By the same token, overly strict rule observation in a company that
heavily depends and innovative and creativity would not qualify as a functional role.
These examples illustrate how the functionality of a specific role depends on the context.
From a social cognitive perspective, organizational roles are not only the product
of the person but are also a function of the social environment and, as a result, are
inextricably bound to the social context (Biddle, 1979; Ilgen & Hollenbeck, 1991; Van
Dyne, Cummings, Parks, 1995). Roles are the organizing structures of knowledge and
information about the appropriate role behaviors in social situations and prompt the
individual to act in a relatively automatic manner (Biddle, 1979; Fiske & Taylor, 1991).
Therefore, it seems warranted to understand what factors in the social environment create
specific roles.
Here, I focus on roles from a social cognitive perspective, proposing that the
social context has an important bearing on the received role (Salancik & Pfeffer, 1978).
Work by Ilgen and Hollenbeck (1991) has elaborated on the distinction between formal
job descriptions and roles in order to illustrate why and how roles in the workplace are
different from jobs. Ilgen and Hollenbeck pointed out that their “interest is in the
dynamic interaction between characteristics of the physical and social environments of
individuals with the persons themselves and with the behavioral and attitudinal
consequences of such interactions.” (1991: 166). The environment in which jobs exist is
subjective, interpersonal, and dynamic, which brings up the issue of emergent task
elements (task elements added to the job of the incumbent through a variety of social

25
sources). The latter task elements differentiate a role from a job. A work role is more
dynamic and more fluid than a job description and is more likely to contain elements
communicated to the employee or negotiated by the employee by means of the social
system (Dansereau, Graen, & Haga, 1975; Welbourne, Johnson, and Erez, 1998).
According to Turner (2002), for instance, incumbents use information from the
social system (such as their peers or organizational culture) to develop their roles. Graen
(1976) described an interdependent role-systems model according to which role demands
are generated via the organizational/situational demands, social or role-set demands, and
personal/personality demands. Hence, research suggests that roles emerge from the social
context and situational demands. Organizational culture may be one such potent
situational factor, which defines the social context and provides information about
expected roles.
Employee Behaviors
Increasingly, researchers and practitioners examining the employee performance
domain have started to recognize the importance of a number of competencies and
behaviors such as interpersonal cooperation and innovation that go beyond the confines
of the formal job description requirements (Goleman, 1998; Organ, 1988; Podsakoff &
MacKenzie, 1997; Van Scotter & Motowidlo, 1996). For instance, Goleman (1998)
emphasized the importance of a range of competencies above and beyond technical
expertise that contribute to employee effectiveness through the performance of behaviors
such as cooperation. Relying on individual knowledge a decade ago seemed to have been
sufficient for job performance; relying on the group mind for information, however, has
26
already become a norm in many jobs (Goleman, 1998). Collaboration and cooperation,
thus, have become essential performance behaviors.
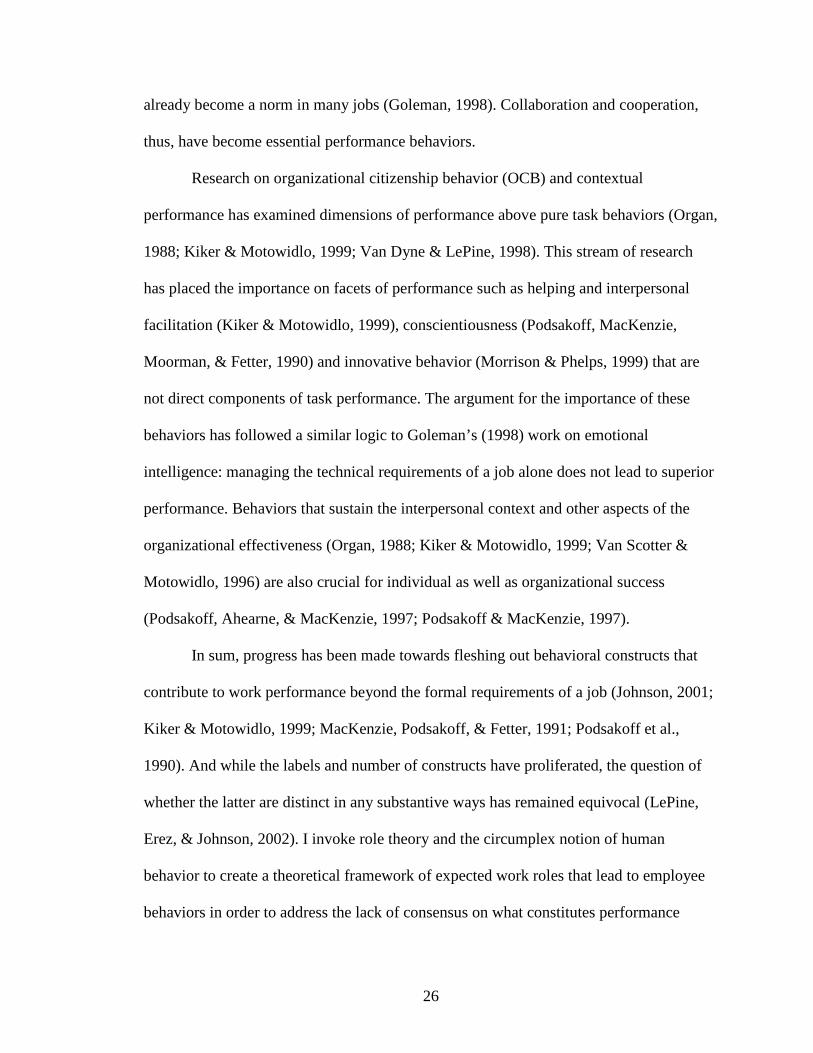
Research on organizational citizenship behavior (OCB) and contextual
performance has examined dimensions of performance above pure task behaviors (Organ,
1988; Kiker & Motowidlo, 1999; Van Dyne & LePine, 1998). This stream of research
has placed the importance on facets of performance such as helping and interpersonal
facilitation (Kiker & Motowidlo, 1999), conscientiousness (Podsakoff, MacKenzie,
Moorman, & Fetter, 1990) and innovative behavior (Morrison & Phelps, 1999) that are
not direct components of task performance. The argument for the importance of these
behaviors has followed a similar logic to Goleman’s (1998) work on emotional
intelligence: managing the technical requirements of a job alone does not lead to superior
performance. Behaviors that sustain the interpersonal context and other aspects of the
organizational effectiveness (Organ, 1988; Kiker & Motowidlo, 1999; Van Scotter &
Motowidlo, 1996) are also crucial for individual as well as organizational success
(Podsakoff, Ahearne, & MacKenzie, 1997; Podsakoff & MacKenzie, 1997).
In sum, progress has been made towards fleshing out behavioral constructs that
contribute to work performance beyond the formal requirements of a job (Johnson, 2001;
Kiker & Motowidlo, 1999; MacKenzie, Podsakoff, & Fetter, 1991; Podsakoff et al.,
1990). And while the labels and number of constructs have proliferated, the question of
whether the latter are distinct in any substantive ways has remained equivocal (LePine,
Erez, & Johnson, 2002). I invoke role theory and the circumplex notion of human
behavior to create a theoretical framework of expected work roles that lead to employee
behaviors in order to address the lack of consensus on what constitutes performance

27
dimensions. I use roles to denominate a broader domain of employee performance, which
encompasses differing definitions of employee effectiveness.
Peterson & Smith (2000), in an attempt to explicate the process of meaning
creation in the workplace, conclude that roles are a primary source of meaning
concerning expected role behaviors. It is important to note that according to these authors
explicit assignment to formal roles affects the thoughts and actions of that individual but
this is “not a conclusion that wholly determines actual role relationships.” (Peterson &
Smith, 2000: p.105). It is, thus, essential for both scholars and practitioners to be able to
understand the substantive content as well as the nomological network of predictors and
outcomes of roles in organizations in order to gain a better understanding of the full range
of performance dimensions.
Organizational initiatives such as job enrichment, total quality management, and
employee involvement programs have been instituted with the purpose of enhancing
organizational competitiveness through the proactive employee engagement in the work
process (Lawler, 1992; Welbourne, Johnson, and Erez, 1998). This trend in management
practices has been paralleled by growing interest on the part of researchers in taking a
broader view of work performance and examining the notion of roles in the workplace
(Parker, 1998; Parker, 2000; Welbourne et al., 1998). Parker (1998; 2000) has considered
proactive role orientation and role breath self-efficacy as the ability of individuals to
expand their job domains (Graen, 1976). Welbourne, Johnson, and Erez have (1998)
advocated a broader view on performance as well. They have derived role-based
performance scales (RBPS) for measuring roles in the workplace based on role and
identity theory as theoretical frameworks.
28
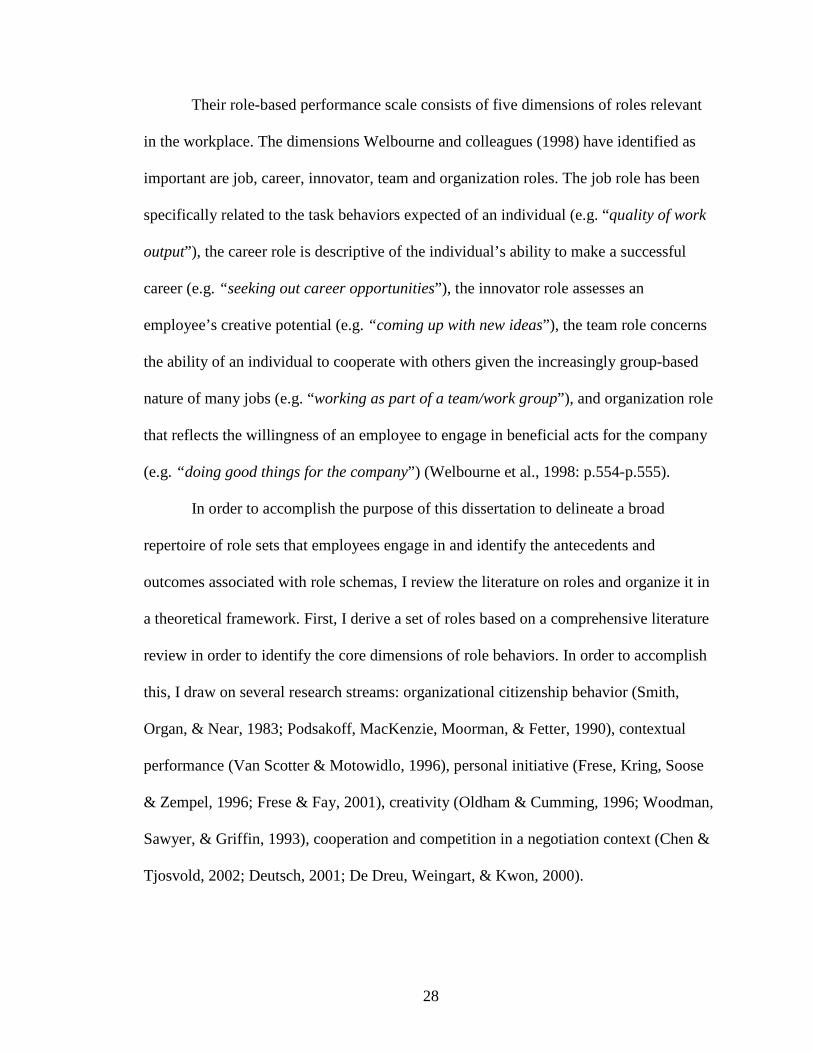
Their role-based performance scale consists of five dimensions of roles relevant
in the workplace. The dimensions Welbourne and colleagues (1998) have identified as
important are job, career, innovator, team and organization roles. The job role has been
specifically related to the task behaviors expected of an individual (e.g. “quality of work
output”), the career role is descriptive of the individual’s ability to make a successful
career (e.g. “seeking out career opportunities”), the innovator role assesses an
employee’s creative potential (e.g. “coming up with new ideas”), the team role concerns
the ability of an individual to cooperate with others given the increasingly group-based
nature of many jobs (e.g. “working as part of a team/work group”), and organization role
that reflects the willingness of an employee to engage in beneficial acts for the company
(e.g. “doing good things for the company”) (Welbourne et al., 1998: p.554-p.555).
In order to accomplish the purpose of this dissertation to delineate a broad
repertoire of role sets that employees engage in and identify the antecedents and
outcomes associated with role schemas, I review the literature on roles and organize it in
a theoretical framework. First, I derive a set of roles based on a comprehensive literature
review in order to identify the core dimensions of role behaviors. In order to accomplish
this, I draw on several research streams: organizational citizenship behavior (Smith,
Organ, & Near, 1983; Podsakoff, MacKenzie, Moorman, & Fetter, 1990), contextual
performance (Van Scotter & Motowidlo, 1996), personal initiative (Frese, Kring, Soose
& Zempel, 1996; Frese & Fay, 2001), creativity (Oldham & Cumming, 1996; Woodman,
Sawyer, & Griffin, 1993), cooperation and competition in a negotiation context (Chen &
Tjosvold, 2002; Deutsch, 2001; De Dreu, Weingart, & Kwon, 2000).

29
Organizational citizenship behavior and contextual performance. Although OCBs
have attained a life of their own as an important organizational behavior construct in the
past decade through the work of many organizational scientists (Bateman & Organ, 1983;
Organ, 1988; Smith et al., 1983; Williams & Anderson, 1991), they have developed from
earlier notions of organizational efficiency (Barnard, 1938; Katz, 1964; Katz & Kahn,
1978). The interest in extra-role behaviors has been first advocated by Barnard (1938)
and later on promoted by Katz (1964). It is worth noting early on that even though extra-
role has been used consistently to describe behaviors above and beyond the formal duties
(Organ, 1988), the approach I take is that behaviors outside of the job description are not
extra-role. As the distinction drawn by Ilgen & Hollenbeck (1991) suggests, roles can be
different and broader than job descriptions. As a result, a behavior, which goes beyond
formal duties and task requirements, is not necessarily extra-role (Morrison, 1994;
Tepper, et al., 2001).
According to Barnard (1938), for example, it is crucial for executives to ensure
that employees in their organizations engage in discretionary cooperative behaviors. Katz
(1964) has also elaborated on what constitutes important employee behaviors beyond the
formal task duties. Innovative and spontaneous behaviors, cooperation, protection,
providing constructive ideas, self-developing oneself, as well as holding favorable
attitudes toward the organization all represent important behavioral tenets of
organizational efficiency (Katz, 1964).
In addition, it is worth noting that the term OCB has not been used consistently
for the description of non-prescribed behaviors. Some of the most prominent extant
conceptualizations different from and yet similar to OCB include organizational

30
spontaneity (George & Brief, 1992), contextual performance (Borman & Motowidlo,
1993; Van Scotter & Motowidlo, 1996), and prosocial organizational behavior (Brief &
Motowidlo, 1986; George & Brief, 1992). Although the existing definitions diverge
somewhat, theoretically they share a common focus on non-task employee behaviors that
in the aggregate provide firms with competitive advantage (George & Brief, 1992; Organ,
1988; Podsakoff & MacKenzie, 1997; Van Scotter & Motowidlo, 1996).
However, in spite of the compelling conceptual similarities between the “extra-
role” behaviors that different organizational behavior scholars have identified, no
consistent attempts have been made at using similar labels for similar behaviors.
Therefore, a brief literature review follows that compares the different conceptualizations
of non-prescribed behaviors. One of the earliest definitions of prosocial behaviors comes
from Katz’ s work (1964). He identifies helping, protecting the organization, making
constructive suggestions, developing oneself, and spreading goodwill as important
employee behaviors. Organizational spontaneity (George & Brief, 1992) is a construct,
which encompasses the types of behaviors that have been put forward by Katz (1964).
However, George & Brief (1992) have not examined empirically the existence of the five
categories in an organizational context.
The early empirical work that has focused on both theoretical specification and
empirical analysis of the dimensionality of OCB has essentially started with the work of
Smith et al. (1983) and Bateman & Organ (1983). Their studies have generated two
important aspects of “extra-role”2 performance: compliance and altruism (Bateman, &
2 The term “extra-role” has been consistently used to describe beneficial behaviors such as OCB. In this dissertation, I take a different approach that allows for a role to be broader and incorporate behaviors such as OCB. This view is currently supported and viewed as valid by OCB scholars (Organ, 1997). In the interest of authenticity, however, I use the term extra-role if it has been used in the work I am citing.

31
Organ, 1983; Smith et al., 1983). Compliance can essentially be described as exemplary
rule following and conscientiousness. Altruism stands for helping behaviors and overall
cooperation.
Others prompted by Organ’s (1988) seminal book on OCBs have found empirical
support for a five-dimensional structure of the organizational citizenship behaviors
construct consisting of altruism, conscientiousness, sportsmanship, courtesy, and civic
virtue (Niehoff & Moorman, 1993; Podsakoff et al., 1990). Altruism and
conscientiousness correspond to altruism and generalized compliance respectively as
defined by Smith et al. (1983). The three added dimensions, hence, consist of
sportsmanship, courtesy, and civic virtue. Sportsmanship, for instance, represents
benevolent employee behaviors such as refraining from complaining in the face of
adversity. Courtesy, on the other hand, consists of interpersonal gestures that prevent
potential problems. Finally, the added dimension of civic virtue according to Organ
(1988) “implies a sense of involvement in what policies are adopted and which
candidates are supported” (p. 13). Furthermore, Organ (1988) goes on to describe
different forms of civic virtue behaviors such as attending meetings, reading the mail,
personal time, and speaking up.
Contextual performance scholars (Borman & Motowidlo, 1993; Van Scotter &
Motowidlo, 1996) have advocated a set of behaviors that are similar to OCBs. The two
main types of behaviors that are examined in the contextual performance literature are
labeled interpersonal facilitation and job dedication. The interpersonal facilitation
domain combined aspects of the altruism, courtesy, and sportsmanship dimensions
(Organ, 1988; Podsakoff et al., 1990; Niehoff & Moorman, 1993). The job dedication

32
aspect resembled Smith et al. (1983) compliance factor and Organ’s (1988)
conscientiousness dimension. In spite of the subtle differences (Van Scotter &
Motowidlo, 1996) between contextual performance and OCB, substantially it
encompasses behaviors that have already been identified by Organ (1988).
Innovation, Personal initiative and Creativity. The work of Morrison & Phelps
(1999) was probably one of the few empirical attempts at extending the OCB (or
contextual performance) domain to include change-oriented and creative behaviors
identified earlier by Katz (1964). Morrison and Phelps (1999) maintained that the OCB
literature had often neglected an important change-oriented extra-role behavior—taking
charge. Most of the OCB and contextual performance literature has examined beneficial
behaviors such as helping and compliance but has not focused as much on the active
change-oriented efforts that employee undertake on their job (Morrison & Phelps, 1999).
The construct of taking charge in contrast consisted of active attempts to improve the
organization through innovation endeavors and for that reason it was clearly distinct from
the other forms of OCB that had been consistently explored in the OCB literature
(Morrison & Phelps, 1999).
Innovation may be construed as a type of personal initiative at work. Personal
employee initiative has become crucial for organizational effectiveness in the context of
constant competition (Lawler, 1992; Milkovich & Boudreau, 1997; Van Dyne, Graham,
& Dienesch, 1994; Welbourne et al., 1998). Frese & Fay (2001) draw an important
distinction between OCB-compliance and personal initiative (PI). According to them,
conscientiousness/ compliance is a passive form of behavior wherein the employee shows
outstanding adherence to rules and norms. However, as they pointed out “the concept of

33
PI often implies ignoring or even being somewhat rebellious toward existing rules and
regulations” (Frese & Fay, 2001: p.166). Therefore, PI can be viewed as a distinct from
compliance (a typical OCB dimension) facet of employee discretionary behavior that is
essential for organizational effectiveness.
Creativity is a similar to personal initiative construct in that it is change-oriented
and it stands for spontaneous employee behaviors (Oldham & Cummings, 1996; Tierney
& Farmer, 2002; Woodman et al., 1993). According to Ford (1996) “Researchers and
laypersons seem to agree that creativity refers to something that is both novel and in
some sense valuable” (p.1114). Oldham and Cummings (1996) proffered “When
employees perform creatively, they suggest novel and useful products, ideas, or
procedures that provide an organizational with important raw material for subsequent
development and possible implementation…” (p.607). Morrison and Phelps (1999)
suggested that scholars should define personal initiative or what they called innovation as
an important aspect of performance that goes beyond the formal job description. The
construct of innovation that they examined was constructive ideas and suggestions for
improving the workflow that employees provided. In sum, personal creativity at work in
its various has attracted significant attention as an important aspect of performance.
Cooperative and competitive (achievement) behavior. In the OCB and contextual
performance tradition, help and cooperation are oftentimes considered as the central core
of non-prescribed employee behaviors and roles (Organ, 1988; Van Scotter &
Motowidlo, 1996). Interest towards a construct somewhat opposite to that of cooperation,
competition as an employee role behavior, however, has been somewhat lacking from the
organizational behavior management literature. Competition and competitive dynamics

34
as a macro phenomenon on the firm and industry level, conversely, has been studied
extensively in the strategic management literature (Gnyawali & Madhavan, 2001;
Hambrick, Cho, & Chen, 1996; Haveman & Nonnemaker, 2000). Therefore, it is
somewhat surprising that competitiveness, as a micro- level phenomenon has not been
addressed as much.
The extant literature on competition has been mainly focused on individual
decision-making, negotiation, and group performance in experimental settings. This
literature builds upon the theory of cooperation and competition (Deutsch, 1949;
Deutsch, 1973) and identifies three social motives: individualistic, competitive, and
prosocial (De Dreu & Van Lange, 1995; De Dreu et al., 2000). According to De Dreu et
al.’s (2000) comprehensive meta-analysis, social motives can be rooted in stable
individual differences or in the situation. From an individual difference perspective,
people possessing an individualistic social value have the propensity to maximize their
own outcomes (De Dreu & Van Lange, 1995; McClintock & Liebrand, 1988).
Competitive orientation is characterized by willingness to maximize one’s own outcomes
at the expense of others (De Dreu & Van Lange, 1995; McClintock & Liebrand, 1988).
Finally, those who have prosocial values are similar to altruists inasmuch as they want to
maximize the joint gain in negotiations (De Dreu & Van Lange, 1995). Certain aspects of
the situation such as the task structure (McClintock & Liebrand, 1988) have been found
to affect the relationship between social value orientation and negotiation behavior as
well.
The early experiments on cooperation and competition (Deutsch, 1949) suggest
that incentives may influence the incidence of cooperative, individualistic, and

35
competitive behavior in groups. If important individual outcomes are tied in with
competitive behavior, members exhibit more competitive behavior and vice versa; if
incentives are based on cooperative behavior, individuals behave more cooperatively
with each other (Deutsch, 1949). The overall results of these experiments suggest that
groups with cooperative incentives have better group process and higher productivity
than groups with competitive incentives (Deutsch, 1949). I examine achievement
behavior as a mixture of competitive and individualistic behavior, and achievement role
orientation as a type of non-task behavior and role, which has received somewhat scant
attention in the organizational behavior literature.
Summary
A large body of literature has accumulated, which suggests that roles go beyond
the formal job description. The existing empirical research has focused on several
specific role behaviors as particularly important. The OCB and contextual performance
research draw attention to help /cooperative behavior and compliance/conscientiousness/
rule observance. Most of the OCB and contextual performance literature has examined
beneficial behaviors such as helping and compliance but has not focused as much on the
active change-oriented efforts that employee undertake on their job (Morrison & Phelps,
1999). The literature on creativity and PI has addressed this shortcoming by considering
innovative behavior an important component of employee performance. Finally, the
theory of cooperation and competition has been concerned with identifying antecedents
of cooperative, individualistic, and competitive behavior as two opposing forms of roles
and behaviors. Here, I focus on four types of behaviors (and respective roles), which have
a recurring role in the extant literature. Specifically, I am examining help, innovative,

36
achievement-oriented, and compliant aspects of behavior. I relied on the existing
empirical research to put together a comprehensive set of behaviors and performance
roles that may go beyond the job description.
Individual differences and attitudes
Self-monitoring. Individual differences also play a prominent role in schema use
and construction (Fiske & Taylor, 1991). For example, self-monitoring is an individual
difference that might be particularly relevant in an organizational culture context. Snyder
(1974) succinctly described self-monitoring as “An acute sensitivity to the cues in a
situation which indicate what expression or self-presentation is appropriate and what is
not is a corollary ability to self-monitoring.” (p.527). High self-monitors are concerned
with presenting a public self that is in line with the expectations of the situation and the
people involved in a certain situation (Snyder, 1987). They are more adaptable and more
likely to change their behavior to suit what is socially accepted and socially desirable.
High self-monitors are prone to give higher performance evaluations and to be less
accurate because they want to be socially desirable (Jawahar, 2001). Individuals with
higher levels of self-monitoring have also been found to occupy more central positions in
their organizational networks due to their ability to adapt to the situation (Mehra et al.,
2001). High self-monitors are also more adept at using impression management tactics so
that they are seen as likable when using impression-management (Turnley & Bolino,
2001) and are viewed more favorably even when they are demographically different
(Flynn, Chatman, & Spataro, 2001). Low self-monitors, on the other hand, are viewed
unfavorably when they use impression management (Turnley & Bolino, 2001). These

37
findings are in line with earlier research by Snyder (1974), showing that high self-
monitors are better at enacting emotions when instructed to do so. Moreover, Snyder
(1974) found that the mean score of professional actors on self-monitoring is higher that
the mean score of a sample of non-actors. In addition, high self-monitors obtain more
favorable network positions in part due to their better interpersonal skills and higher
adaptability (Gangestad & Snyder, 2000; Mehra et al., 2001).
According to Lennox & Wolfe’s (1984) conceptualization of self-monitoring, it
consists of a cognitive and behavioral component. They refer to the cognitive component
as “sensitivity to the expressive behavior of others”. This component reflects the
tendency of high self-monitors to be sensitive, and aware of environmental stimuli such
as the emotions of others. The behavioral component, which they label "ability to modify
self-presentation” is concerned with the extent to which individuals are capable of
adapting to the situation.
Perceived fit. Studying the influence of organizational culture and individual
values on important organizational outcomes has been an area of considerable research in
the past decade in the field of organizational behavior (Chatman, 1989; Chatman, 1991;
Judge & Cable, 1997; O’Reilly, Chatman, & Caldwell, 1991). The general assumption
that drives the recurring interest in understanding the direct and interactive effects of
organizational culture and individual values is that both individual values and
organizational (situational) characteristics influence actual behaviors (Chatman, 1989;
Ekehammar, 1974).
A large body of literature on organizational culture has focused on person-
organization fit (Cable & Judge, 1996; Chatman, 1989; Kristof, 1996; O’Reilly et al.,

38
1991), also informing other streams of research examining perceived fit in other
important dimensions such as personal and team goals (Kristof-Brown & Stevens, 2001).
The assumptions underlying research on P-O fit are that a) individuals hold specific
values and beliefs and b) organizations have specific value systems (culture) (Chatman,
1989). Therefore, it is conceivable that combining individuals’ value systems and
organizational culture can result either in a good fit or a poorer fit, which in turn affect
important outcomes such as performance, satisfaction, commitment and turnover
(Chatman, 1989; Chatman, 1991; Kristof, 1996; Saks, 1997).

39
Chapter 3: Hypotheses Development
Organizational Culture as Antecedent of Work Roles
According to the interdependent role-systems model (Graen, 1976),
organizational culture is among the organizational factors that determine the set of role
demands placed on a specific individual. Katz & Kahn (1978) also emphasized the
importance of organizational factors in determining roles and argued that roles are the
cognitive linking mechanisms between organizational stimuli and individuals because
they “confront” organizational members with the system’s expectations (1978: 220).
Organizational culture research specifically suggests that organizational culture
establishes shared norms and expectations throughout the organization (Cooke &
Lafferty, 1986; Cooke & Szumal, 2000; Denison & Mishra, 1995; Schein, 1985) and the
sensemaking literature suggests that people construct their perceptions of the world by
making sense of a socially-constructed environment (Weick, 1995). Organizational
culture permeates and defines the organizational environment, providing a means for the
organization and its leadership to communicate its expectations to organizational
members (Ashforth, 1985).
An important assumption of the organizational culture literature examining the
link between culture and effectiveness is that culture motivates and guides employee
behaviors by establishing norms and expectations. To date no research has empirically
examined the process through which culture may influence behaviors. Applying a role
theory and sensemaking perspective on behaviors in a social context, I propose that
culture provides the system of meaning, which informs the roles that individuals in the

40
organization perceive as expected and appropriate (Ashforth, 1985; Fiske & Taylor,
1991; Katz & Kahn, 1978; Salancik & Pfeffer, 1978; Weick, 1995).
Research on individualism-collectivism suggests that when primed subjects
retrieve cognitive responses attuned to the specific type of priming (Trafimow et al.,
1991). Research on national culture also suggests that subjects from different cultures
emphasize different aspects of the self (Triandis, 1989), have different cognitions,
emotions, and motivations (Markus & Kitayama, 1991), form distinct representations of
conflict depending on their cultural background (Gelfand et al., 2001) as well as work
differently in work groups depending on their level of individualism-collectivism (Earley,
1993).
Similarly, organizational culture has an impact on individual behavior, patterns of
social interaction and performance outcomes (Chatman & Barsade, 1995;Chatman et al.,
1998; Schein, 1985). As Schein (1985) put it:
“To function as a group, the individuals who come together must establish a
system of communication and a language that permits interpretation of what is going on.
The human organism cannot tolerate too much uncertainty and/or stimulus overload.
Categories of meaning that organize perceptions and thought, thereby filtering out what is
unimportant while focusing on what is important, become not only a major means of
reducing overload and anxiety but also a necessary precondition for any coordinated
action.” (p. 71).
In line with Schein’s predictions, Chatman and colleagues proposed: “Members
of collectivistic organizational cultures will view organizational membership as a more
salient category than will members of individualistic organizations” (1998: 751), thereby

41
suggesting a cognitive perspective on the mechanism via which organizational culture
influences processes and behavior. Gioa and Sims also emphasized the importance of
cognition as an antecedent to action: “They [people in organizations] are unique in that
they do not just do, they also think. More accurately, perhaps, they often take action as a
result of their thinking. In a related vein, organizations themselves do not “behave”
independently of the people who construct and manage them.” (1986: 1). Given the
importance cognition has been given in the literature, it seems surprising that the impact
of culture on the cognitive roles as bridging mechanisms and process variables, which
link the organization and the individual has not been explored. I use a role theory
perspective to propose that organizational cultures create cognitive roles functional for
the specific organizational environment, which reduce ambiguity by suggesting that
specific patterns of behavior are appropriate and expected in the organization (Biddle,
1979; Katz & Kahn, 1978; Schein, 1985).
Therefore, I am examining the impact of specific dimensions of organizational
culture on individual role perceptions. The culture typology based on the competing
values framework defines organizations as reconciling multiple demands, resulting in
four different strategies for managing organizational processes- by focusing on internal
stability, internal flexibility, external stability, or external flexibility. Building on the
predictions of the competing values framework that organizations with different cultures
pursue different ends (Cameron & Quinn, 1999) such as cohesion in the clan culture,
external competitiveness in the market culture, adaptation through innovativeness in the
entrepreneurial culture, and preserving the status-quo through strict observance of the
existing rules in the hierarchy culture, I propose both positive and negative relationships

42
between culture and roles in accordance with the competing values framework (Cameron
& Quinn, 1999; Tesluk et al., 2002). Specifically, in the competing value model,
entrepreneurial, and hierarchy cultures are expected to convey opposing objectives. In a
similar vein, the clan and market dimensions emphasize differing aspects, namely
internal flexibility via interpersonal harmony versus external efficiency through
aggressiveness. While Quinn and Rohrbaugh (1983) acknowledge that organizations
may need to pursue more than one end at the same time, they also suggest that there is an
inherent contradiction between the competing objectives situated on opposite poles.
Therefore, I expect that culture and role perceptions will be related in the following way:
Hypothesis 1. a) A clan type of organizational culture will be positively
related to individuals’ adoption of a helping role and b) negatively related to the
adoption of an achievement role.
Hypothesis 1. c) A market type of organizational culture will be positively related
to individuals’ adoption of an achievement role and d) negatively related to the adoption
of a helping role.
Hypothesis 1. e) An entrepreneurial type of organizational culture will be
positively related to individuals’ adoption of innovative role and f) negatively related to
the adoption of a compliant role.
Hypothesis 1. g) A hierarchy type of organizational culture will be positively
related to individuals’ adoption of a compliant role and h) negatively related to the
adoption of an innovative role.

43
Roles as Predictors of Behavior
Why is it important to understand the social cognitive nature of work role
behavior? One important reason for investigating this is to gain the ability to understand
what leads to positive and negative work outcomes and to be able to steer the process in
the right direction. Roles are organized schemas that initiate behavior in social situations
(Biddle, 1979; Fiske & Taylor, 1991). Therefore, roles are the scripts that guide
behaviors. For instance, the extent to which an individual endorses OCBs as part of a
work-role is likely to lead to actual OCB (Hofmann et al., 2003; Morrison, 1994; Tepper
et al., 2001). I am examining a broader domain of role perceptions and based on the
predictions of cognitive role theories (Fiske & Taylor, 1991; Lord & Foti, 1986) I make
similar predictions regarding the outcomes of roles.
Role perceptions act like schemas to provide a system for organizing knowledge
(Freeman, Romney, & Freeman, 1987) and lead to relatively automatic processing of
information and behavior (Lord & Foti, 1986). From a role theory perspective (Biddle,
1979; Katz & Kahn, 1978), roles convey organizational expectations. Therefore, I predict
that employees’ work roles will be positively related to the respective expected behaviors
and negatively related to the behaviors that are dysfunctional.
Hypothesis 2 a). A helping role will be positively related to helping behavior and
b) negatively related to achievement behavior.
Hypothesis 2 c). An achievement role will be positively related to achievement
behavior and negatively related to d) helping behavior.

44
Hypothesis 2. e) An innovative role will be positively related to innovative
behavior and f) negatively related to compliant behavior.
Hypothesis 2. g). A compliant role will be positively related to compliant behavior
and h) negatively related to innovative behavior.
Moderators of The Relationships Between Organizational Culture, Roles, and Behaviors
Culture strength as a moderator. From a role theory perspective as well
consensus is an important attribute of roles and expectations. As Biddle (1979)
suggested: “… role theorists should avoid the concept of shared expectation… unless the
actual condition of consensus can be established” (p. 195). Consensus denotes the extent
to which people in a situation hold convergent expectations of each other roles and
expected behaviors, thus, facilitating the uninterrupted functioning of social systems
(such as organizational systems). In the presence of consensual beliefs, social stability
and behavior conformity is likely to occur (Biddle, 1979).
Research on work climate has examined climate strength (Klein, Conn, Smith, &
Sorra, 2001; Schneider, Salvaggio, & Subiratis, 2002). For instance, Schneider and
colleagues (2002) found that high climate strength boosted the relationship between
aspects of climate for service and customer satisfaction, while Gonzales-Roma, Peiro, &
Tordera (2002) found that high climate strength intensifies the links between type of
climate and outcome variables such as commitment and satisfaction. Mischel’s (1976)
perspective on the influence of situational strength on attitudes and behavior provides one
theoretical avenue, which has been explored in the climate research (Schneider et al.,

45
2002). Schneider and colleagues (2002), for instance, have built on Mischel’s work to
suggest that strong climates induce more uniform patterns of behavior consistent with the
group climate as compared to weak climates. More recently, human resource
management scholars have also emphasized the importance of strength of the HRM
system in inducing appropriate and uniform employee perceptions and behaviors (Bowen
& Ostroff, 2004).
Building on the literature on culture and existing empirical research on climate
strength, I also expect that strength of culture will modify the relationships between
culture types and outcome variables. For instance, a strong culture also is likely to reflect
the presence of strong normative beliefs regarding what is acceptable in the organization,
which would in turn induce uniform expectations in line with the propositions of the
situational strength research (Mischel, 1976). In addition, when the culture is stronger,
individuals are more likely to perceive their roles in ways consonant with the
organizational culture, due to the higher clarity of the organizational system (Martin,
1992). Therefore, I propose that culture strength acts as a moderator of the relationships
presented in Hypotheses 1a-1h such that when the culture strength is higher, suggesting a
higher level of consensus, culture would have a stronger impact on employees’ cognitive
role perceptions.
Hypothesis 3 .a) Culture strength moderates the positive relationship between a
clan type of organizational culture and helping role and b) the negative relationship
between a clan type and achievement role such that when culture strength is high, the

46
proposed relationships will be stronger and when culture strength is low the proposed
relationships will be weaker.
Hypothesis 3. c) Culture strength moderates the positive relationship between
market type of organizational culture and achievement role and d) the negative
relationship between market type of organizational culture and helping role s such that
when culture strength is high, the proposed relationships will be stronger and when
culture strength is low the proposed relationships will be weaker.
Hypothesis 3. e) Culture strength moderates the positive relationship between
entrepreneurial type of organizational culture and innovative role and f) the negative
relationship between entrepreneurial type of organizational culture and compliant role
perceptions such that when culture strength is high, the proposed relationships will be
stronger, and when culture strength is low the proposed relationships will be weaker.
Hypothesis 3. g) Culture strength moderates the positive relationship between
hierarchy type of organizational culture and compliant role and h) the negative
relationship between hierarchy type of culture and innovative role perceptions such that
when culture strength is high, the proposed relationships will be stronger and when
culture strength is low the proposed relationships will be weaker.
Moreover, applying a social conformity (Janis, 1972, 1982) perspective helps
explicate the influence of culture strength on behavioral outcomes of interest. A
persistent finding of the literature on social conformity, also labeled “groupthink,” is that
individuals in groups tend to publicly agree with the opinion of the majority even when
they hold a divergent view. One reason for this effect is that social conformity sometimes
seems to elicit personal benefits; for instance, socially conforming individuals tend to

47
become promoted in bureaucratic organizations (Coates & Pellegrin, 1957). Moreover,
exhibiting social conformity is an easier way to get by without “rocking the boat” or
being stereotyped as a deviant individual.
Individuals in groups exhibit social conformity for a variety of reasons including
normative pressure or due to distortion of perception or judgment (Asch, 1958;
Hackman, 1992). High culture strength indicates cohesion and agreement; thus, a strong
culture may signify the existence of pressures for social conformity. Therefore, I expect
that in the presence of high culture strength, role perceptions would also elicit stronger
behavioral outcomes.
Hypothesis 4. Culture strength will moderate the relationships between roles and
behaviors such that a) the positive relationship between helping role and helping
as behavior and b) the negative relationship between helping role and
achievement behavior, will be more pronounced in the presence of higher culture
strength
Hypothesis 4. Culture strength will moderate the relationships between roles and
behaviors such that c) the positive relationship between achievement role and
achievement behavior and d) the negative relationship between achievement role
and helping as behavior, will be more pronounced in the presence of higher
culture strength.
Hypothesis 4. Culture strength will moderate the relationships between roles and
behaviors such that e) the positive relationship between an innovative role and
innovative behavior and f) the negative relationship between compliant role and

48
compliant behavior, will be more pronounced in the presence of higher culture
strength.
Hypothesis 4. Culture strength will moderate the relationships between roles and
behaviors such that g) the positive relationship between a compliant role and
compliant behavior and h) the negative relationship between compliant role and
innovative behavior, will be more pronounced in the presence of higher culture
strength.
Self-monitoring as a moderator. The literature on self-monitoring suggests that
high self-monitors are adept at deciphering situational cues, they are skilled at acting
appropriately, and using impression management to enhance their images. Based on the
literature on self-monitoring, Chatman (1991) proposed that self-monitoring would lead
to higher P-O fit one year after entry because high self-monitors are more socializable.
The statistical results did not reach significance but they were in the predicted positive
direction. High self-monitors are motivated to read the situation while low self-monitors
are either not motivated or not adept at sensing situation cues (Snyder, 1986).
Therefore, I expect that self-monitoring will affect the degree to which
organizational culture has an effect on the individual’s role perceptions. High self-
monitors can be expected to incorporate situational stimuli more in their cognitive
schemas. In line with Lennox & Wolfe’s (1984), two-component conceptualization of
self-monitoring, high self-monitors are sensitive to the expressive behavior of others on a
cognitive level (cognitive self-monitoring) as well as they are more capable of adapting
behaviorally to a specific situation (behavioral self-monitoring). Therefore, one argument

49
concerns the ability of high self-monitors, due to their sensitivity in observing and
decoding situations more so than low self-monitors, to incorporate more of the
organizational culture stimuli into their own role perceptions.
Hypothesis 5. The relationships between clan type of organizational culture and
a) helping (positive) and b) achievement (negative) role will be moderated by level of
self-monitoring (cognitive) such that when self-monitoring is higher, the proposed
relationships will be enhanced.
Hypothesis 5. The relationships between market type of organizational culture
and c) achievement (positive) and d) helping (negative) role will be moderated by level of
self-monitoring (cognitive) such that when self-monitoring is higher, the proposed
relationships will be enhanced.
Hypothesis 5. The relationships between entrepreneurial type of organizational
culture and e) innovative (positive) and f) compliant (negative) role will be moderated by
level of self-monitoring (cognitive) such that when self-monitoring is higher, the
proposed relationships will be enhanced.
Hypothesis 5. The relationships between the hierarchy type of organizational
culture and g) compliant (positive) and h) innovative (negative) role will be moderated
by level of self-monitoring (cognitive) such that when self-monitoring is higher, the
proposed relationships will be enhanced.
In addition, the ability and willingness of high self-monitors to adapt to the
situation at hand is another aspect of self-monitoring (Chatman, 1991; Lennox & Wolfe,

50
1984; Mehra et al., 1991). High self-monitors, therefore, can be expected to enact their
organizational roles more so than low self-monitors. This leads to the next set of
propositions outlined in hypothesis 6:
Hypothesis 6. Self-monitoring (behavioral) will moderate the relationships
between roles and behaviors such that a) the positive relationship between helping role
and helping as behavior and b) the negative relationship between helping role and
achievement behavior,
c) The positive relationship between achievement role and achievement behavior
and d) the negative relationship between achievement role and helping as behavior,
e) The positive relationship between an innovative role and innovative behavior
and f) the negative relationship between compliant role and compliant behavior,
g) The positive relationship between a compliant role and compliant behavior and
h) the negative relationship between compliant role and innovative behavior, will be
more pronounced when self-monitoring (behavioral) is higher.
P-O fit as a moderator. The extent to which an applicant feels he/she fits with the
organization is also likely to influence the frequency of his/her extra-role behaviors
(Chatman, 1989). Subjective fit has been shown to mediate the relationship between
objective fit and organizational attractiveness (Judge & Cable, 1997). This suggests that
perceived fit with an organization is a fairly accurate reflection of objective fit between
individual values and cultural preferences. Furthermore, the way that individuals perceive
their fit with an organization before working in it carries a lot of importance for their

51
organizational choice later (Judge & Cable, 1997). In addition, perceived fit with an
organization has a positive relationship with work attitudes such as job satisfaction,
organizational commitment and a negative association with intentions to turnover (Cable
& Judge, 1996).
Further advocating the importance of person-organization fit, Chatman (1989)
argued that high person-organization fit increases the probability that individuals will
engage in specific behaviors such as cooperation if they feel that what the organization
values is congruent with their own values. Socialization research suggests that
newcomers are more willing to take on roles compatible with their personal values
(Chatman, 1991; Fisher, 1986; Schein, 1978). The degree of person-organization fit (P-O
fit), thus, is an important motivational aspect that fosters the acceptance of
organizationally endorsed values (Chatman, 1989; Saks, 1997).
Building on the extant literature, the congruence between individuals’ preferences
and organizational values can be expected to lead to stronger adoption of the
organizational values. Individuals who are feel that they are fitting well with the
organizational environment may also be more likely to accurately perceive and interpret
the organizational expectations communicated through the culture. This leads to my next
hypothesis:
Hypothesis 7 .a) P-O fit moderates the positive relationship between a clan type
of organizational culture and helping role and b) the negative relationship between a
clan type and achievement role such that when P-O fit is high, the proposed relationships
will be stronger.

52
Hypothesis 7. c) P-O fit moderates the positive relationship between market type
of organizational culture and achievement role and d) the negative relationship between
market type of organizational culture and helping role s such that when P-O fit is high,
the proposed relationships will be stronger.
Hypothesis 7. e) P-O fit moderates the positive relationship between
entrepreneurial type of organizational culture and innovative role and f) the negative
relationship between entrepreneurial type of organizational culture and compliant role
perceptions such that when P-O fit is high, the proposed relationships will be stronger.
Hypothesis 7. g) P-O fit moderates the positive relationship between hierarchy
type of organizational culture and compliant role and h) the negative relationship
between hierarchy type of culture and innovative role such that when P-O fit is high, the
proposed relationships will be stronger.
Moreover, using an enactment perspective, individual action is driven by personal
motives and individuals are active creators of their environment and are not just passive
recipients (Abolafia & Kilduff, 1988; Weick, 1981). And while task performance usually
has a direct impact on performance evaluations, acting in accordance with the existing
culture norms may not be as readily and easy to observe and reward or punish. Therefore,
due to the expected higher discretion that roles allow, P-O fit may play an especially
prominent role in the process of role enactment.
Consistent with the logic of enactment, individuals with high fit are, for instance,
more likely to seek to sustain the existing environment by engaging in behaviors
consistent with the expectations. Individuals who experience low fit, however, might

53
engage less in these behaviors prescribed by the organizational culture context in an
attempt to resist or change the existing environment. I propose that P-O fit will moderate
the relationship between roles and behaviors. When the degree of perceived fit with the
organization is high for the employee, then he/she is more likely to engage in a role-
prescribed behavior than when it is low.
Hypothesis 8. a) The positive relationship between helping role and helping
behavior and the negative relationship between helping role, and b) achievement
behavior will be moderated by the degree of P-O fit so that when P-O fit is high the
proposed relationships will be stronger.
Hypothesis 8. c) The positive relationship between achievement role and
achievement behavior and the d) negative relationships between achievement role and
helping behavior will be moderated by P-O fit so that when P-O fit is high the proposed
relationships will be stronger.
Hypothesis 8. e) The positive relationship between innovative role and innovative
behavior and f) the negative relationship between innovative role and compliant behavior
will be moderated by the degree of P-O fit so that when P-O fit is high the proposed
relationships will be stronger.
Hypothesis 8. g) The positive relationship between compliant role and compliant
behavior and h) the negative relationship between compliant role and innovative
behavior will be moderated by P-O fit so that when P-O fit is high the proposed
relationships will be stronger.

54
Summary
Research on organizational culture suggests that culture is a potent predictor of
employee behaviors because culture defines the norms of accepted behaviors. The emic
and etic perspectives on culture have recommended different methods for measuring
culture. Here, I adopt an etic perspective in that I adapt an existing instrument of culture
and apply it to multiple organizational settings to generate results that could be
generalized irrespective of the specific organization.
The specific dimensions that I examine are based on existing measures and
conceptualizations of culture and they correspond to four role types that I explore. In
particular, I explore market, entrepreneurial, hierarchy and clan cultures in line with
Denison and Mishra’s (1995) and Cameron and Quinn’s (1999) model of culture and
effectiveness. I propose direct relationships between culture and role perceptions such
that entrepreneurial type of culture is positively related to innovative role perceptions and
negatively related to compliant role. I also expect a direct positive link between clan type
of culture and helping role perceptions and a negative link between clan culture and
achievement role perceptions. In addition, I propose a positive relationship between the
hierarchy type of culture and compliant role and a negative relationship between
hierarchy culture and innovative role. I also propose a positive relationship between a
market type of culture and achievement role perceptions as well as a negative relationship
between market culture and helping role. I also hypothesize positive and negative
relationship between roles and respective behaviors (e.g. innovative role and innovative
behavior).

55
I propose several moderators of the direct relationships: culture strength, self-
monitoring, and P-O fit based on the literature review. Culture strength describes the
degree to which the culture is unequivocal and socially shared, thus, reducing uncertainty
about expected behaviors (Schein, 1985). I propose that when the organizational culture’s
strength is high, the relationships between culture dimensions and respective role
perceptions would be stronger. In addition, I posit that culture strength will also induce
more uniform relationships between roles and behaviors building on the logic of social
conformity theory. Self-monitoring is an individual difference that describes the degree to
which an individual is adept at deciphering situational cues and is also likely to comply
with situation cues. I propose that higher levels of self-monitoring will strengthen the
relationships between organizational culture, and roles, and roles and behaviors.
Finally, the level of fit with the organization will have an impact on the extent to
which, individuals perceived roles consistent with the cultural norms of the organization,
as well the degree to which cognitive roles lead to actual behaviors. From an enactment
perspective individuals are not only passive observers of their environment but active
creators. Therefore, individuals who are high on P-O fit are more likely to comply with
the organizational role expectations; while employees with lower P-O fit might be less
willing to engage in organizationally expected roles. Figure 2 displays the proposed
relationships.

56
Figure 2: Model of Role Perceptions and Role Enactment
ROLE EMERGENCE ROLE ENACTMENT
H3 & H7 H4 & H8
H1 H2
H5 H6
ORGANIZATIONAL
CULTURE
• Clan
• Entrepreneurial
• Hierarchy
• Market
ROLE
PERCEPTIONS
• Helping
• Innovative
• Compliant
• Achievement
BEHAVIORS
• Help
• Innovation
• Compliance
• Achievement
Self-Monitoring(Cognitive)
Self-Monitoring
(Behavioral)
Culture Strength
P-O Fit
57
Chapter 4: Method Section
Research Design
The data were collected in the fall semester of 2004. The research project was
designed to minimize potential common method bias caused by collecting data from a
single source. Specifically, responses were collected from students enrolled in four core
part-time MBA classes at a large Mid-Atlantic public university as well as from their
coworkers and supervisors. First, focal employees (i.e., part-time MBAs) were asked to
provide their ratings of their organization’s culture, role perceptions, self-monitoring, fit,
and culture strength. In addition, students solicited the participation of their coworkers
and supervisors to respond to surveys regarding organizational culture (coworkers) and
the focal MBA students’ behaviors (coworkers and supervisors). In exchange, students
received a detailed developmental feedback report regarding their teamwork and
leadership capabilities.
The surveys were collected electronically, by sending emails directing the
students and their colleagues to websites containing the respective surveys. The
participants had unique user names and passwords known only by them individually and
by the student investigator. This ensured the confidentiality of the survey collection
process. Moreover, only aggregate scores were used for the coworker/supervisor-based
portion of the student feedback in order to guarantee that their individual responses
would remain anonymous and confidential.
Sample

58
Initial focal MBA sample. I collected data from 206 participants, working in
organizations and studying as part-time MBA students. The average age of respondents
was between 26-35 years (71.8%), female participants accounted for 24.80% of all
respondents, 98.50% of the participants were employed full-time during the data
collection period in a variety of occupations as follows: 21% in financial
services/banking companies, 16% in consulting/government relations companies, another
16% in high tech companies, 10.50% in the government in defense contractor companies,
(the remainder were employed in various types of companies, each accounting for less
that 10% of the sample). Respondents had average company tenure of 3.31 years
(SD=2.70) and average job tenure of 2.45 years (SD=1.88), 33% reported that they
worked less than 50% of their time as part of a work team. The majority of respondents
categorized themselves as White/Caucasian (58.30%), followed by Indian
Subcontinental/Pacific Islander (14.60%), Asian (14.10%), African American (6%),
Hispanic/Latino (6.50%), and Native American (.5%).
Coworker/supervisor sample. A total of 792 coworkers responded to the coworker
portion of the survey regarding work behaviors of 202 of the MBA student participants
(98% of the focal participants). A total of 358 supervisors responded to the supervisor
part of the survey for 193 MBA participants (94% of the focal participants). I did not
collect any demographic data from the supervisors and coworkers because they were only
providing ratings regarding the focal MBA or the organizational culture (coworkers).
There was no theoretical reason to believe that demographic data would influence these
particular ratings.

59
Analysis
For the actual analysis of the proposed relationships, sub-sets of the initial
samples of respondents were used such that they were selected based on theoretical
reasons to allow analyzing the proposed relationships between constructs of interests. For
purposes of clarity, this section is organized in two parts: the first section describes the
sample utilized for the analysis of relationships between culture and roles. And the
second section provides details about the sample used in the analysis of the relationships
between roles and behaviors.
Section one: relationship between culture and role perceptions. For the analysis
of the first part of the model examining the relationships between culture and role
perceptions of organizational expectations, a theoretically derived subset of the initial
sample of coworkers was used. I focused on coworkers for capturing culture because I
wanted to capture the shared perceptions of culture rather than an individual’s single
perception (Rentsch, 1990). This approach is consistent with the climate literature,
wherein a distinction is drawn between organizational, and psychological climate.
Specifically, the former refers to the shared, aggregated perceptions of multiple
individuals, while the latter is reserved for an individual’s unique perception of the
climate (Gavin & Howe, 1975; Glick, 1985; Jones & James, 1979; Parker et al., 2003).
In addition, some more considerations were made in selecting the specific set of
coworkers for reporting organizational culture. First, only the responses of individuals
currently working in the same organization as the focal were used since they were
expected to report the relevant organizational culture of the respective participant (which
reduced the initial sample to N=160 focal employees). In addition, the research questions

60
focus on organizational culture. Therefore, the survey included some screening items
regarding the level at which the respondents were reporting. In particular, respondents
were prompted to report what level they referred to as they were completing the
questionnaire (e.g. organization, group, department). Only the respondents who reported
organizational level were retained to maintain the focus on the organization as the
relevant entity of interest. This procedure was employed to exclude individuals reporting
on different levels because their perceptions were likely to be the result of an
organizational subculture rather than the overall culture that organizational leaders
maintain (Martin, 1992). The resulting sample had 98 focal individual observations and
257 coworker responses (Average N=2.62 per focal).
In the resulting sample, the predominant percentage of focal respondents were
between 26-35 years (73.5%), female participants accounted for 26.50% of focal
respondents, 99% of the participants were employed full-time during the data collection
period in a variety of occupations as follows: 18.2% in financial services/banking
companies, 14.3% in consulting/government relations companies, another 16.9% in high
tech companies, 10.40% in government, 10.4% in manufacturing (the remainder were
employed in various types of companies, each accounting for less that 10% of the
sample). Respondents had average company tenure of 3.71 years (SD=3.40) and average
job tenure of 2.30 years (SD=1.73), 37% reported that they worked less than 50% of their
time as part of a work team. The majority of respondents categorized themselves as
White/Caucasian (61.7%), followed by Asian (11.70%), Indian Subcontinental/Pacific
Islander (10.60%), African American (10.6%), Hispanic/Latino (5.30%). The

61
characteristics of this sample were, thus, very similar to the characteristics of the larger
sample of focal working individuals.
Moreover, I compared the means of the selected sample with the excluded sample
on the four culture dimensions to check If there were systematic differences between the
initial set of respondents, and the selected respondents. The differences between three of
the four culture dimensions were not significant. Only the means for market culture
differed significantly for both samples such that individuals used in the analysis reported
slightly higher values on market culture (F= .63, p< .05). This difference may suggest
that on average respondents in organizations higher on market culture perceive the
organizational level as more salient, thus, reporting culture on the organizational level.
The means of the other measures did not differ in the two samples.
Section two: relationships between roles and behaviors. For the second set of
analyses, the focus was on roles and behaviors. There were two sources used to measure
focal employee behaviors: coworkers and supervisors. Here a different procedure was
employed to select the most theoretically viable sample. For instance, for the coworker
sample, the focus was on retaining those coworkers who are familiar with the focal
individual behaviors such that their report would be most informed. The sample resulted
in 107 focal observations and 325 coworkers (average N=3 respondents per focal). In
this sample, the focal characteristics were very similar to the ones described in the
previous samples. The sample for supervisors was selected using a similar method by
focusing only on those supervisors who have reported knowing the person’s work well or
very well. This resulted in a sample of 143 supervisors responding for 89 focal
individuals (average N=1.66 per focal).

62
Summary
To summarize, I used coworker ratings for the evaluation of culture. My use of
coworkers as a source of rating culture was based on the premise that there is an
objective, shared reality underlying the culture phenomenon (Gavin & Howe, 1975;
Glick, 1985; Parker et al., 2003). In addition, using coworker rating for culture allowed
me to triangulate the rating sources of roles and culture. On the other hand, I used the
focal employee’s rating of roles, perceived fit, self-monitoring, and culture strength.
Given the nature of the scales (e.g. how an individual perceives their fit with the
organization), the use of self-report seemed warranted.
The ultimate outcome of interest was employee behaviors, which were captured
both from the coworkers’ and supervisors’ perspectives. I expected that coworkers would
provide more informed ratings than supervisors. Moreover, I did not use self-report for
behaviors due to the potential for social desirability as well as common method bias.
Table 2 shows the relationship between sources and measurement scales.
Table 2: Sources for Primary Analysis
Scale/Source Focal Coworker(s) Supervisor(s)Organizational culture X
Culture Strength XSelf-monitoring X
P-O fit XRole Perceptions X
Behaviors X X
Measures
Organizational culture. I adapted an existing measure originally developed by
Cameron & Quinn (1999) to measure organizational culture. The measure captures four

63
dimensions of organizational culture- clan (cooperative), adhocracy
(entpreneurial/innovative), hierarchy (compliant), and market (competitive) types. Here,
I refer to clan culture as clan or cooperative culture; adhocracy culture as entrepreneurial
or innovative; hierarchy culture as hierarchy or hierarchical, and market culture as market
or market-oriented culture culture. The initial questionnaire contained 20 questions (5 per
culture type) divided in four sections describing different aspects of the organizational
culture (e.g. sample item from clan reads: “This organization is a very personal place. It
is like an extended family. People seem to feel comfortable sharing their personal
situations with colleagues.”). Respondents were instructed to rate the degree to which
each statement is characteristic of the culture that they experience it.
An exploratory factor analysis (EFA) with principal axis factoring was conducted
on the coworker responses, specifying four factors. The factor structure revealed that two
of the items from the entrepreneurial culture had high cross-loadings, thus, were dropped
from further analysis. The results of the EFA are presented in table 3.
Table 3: Exploratory Factor Analysis of Organizational Culture
Scale3 FactorItems
1 2 3 4
1. This organization is a very personal place. It is like an extended family. People seem to feel comfortable sharing their personal situations with colleagues.
C .50 .05 .06 .12
2. The management style in this organization is characterized by teamwork, consensus, and participation.
C .79 .01 -.04 .08
3. The glue that holds this organization together is loyalty and mutual trust. Commitment to this organization runs high.
C .87 .03 -.18 -.09
4. This organization emphasizes personal and C .87 .02 .01 -.08
3 C refers to clan culture; E- entrepreneurial culture; M- market culture; H- hierarchy culture.

64
professional development. There is a strong focus on developing skills and providing interesting work opportunities.5. This organization defines success on the basis of the development of human resources, teamwork, employee commitment and concern for people.
C .82 .09 -.03 .06
6. This organization is a very controlled & structured place. Formal procedures generally govern what people do.
E -.07 .82 -.17 -.16
7. The management style of this organization is characterized by security of employment, conformity, predictability, and stability
E .15 .77 .04 .01
8. The glue that holds this organization together is formal rules and policies. Maintaining a smooth-running organization is important.
E .02 .90 .15 -.04
9. This organization emphasizes permanence and stability. Efficiency, control, and smooth operations are important.
E .13 .87 .07 .01
10. This organization defines success of the basis of efficiency. Dependable delivery, smooth scheduling, and low-cost production are critical.
E -.10 .61 -.14 .11
11. This organization is very results oriented. A major concern is with getting the job done. People are very competitive and achievement oriented.
M -.03 .06 -.78 .08
12. The management style in this organization is characterized by hard-driving competitiveness, high demands, and achievement.
M .15 -.06 -.89 -.19
13. The glue that holds this organization together is the emphasis on achievement and goal accomplishment. Aggressiveness and winning are common themes.
M .12 -.04 -.81 -.05
14.This organization emphasizes competitive actions and achievement. Hitting stretch targets and winning in the marketplace are dominant.
M .04 .07 -.84 .04
15. This organization defines success on the basis of winning in the marketplace and outpacing the competition. Competitive market leadership is key.
M -.16 .07 -.66 .25
16. This organization is a very dynamic and entrepreneurial place. People are willing to
H .52 -.18 -.25 .33

65
stick their necks out and take risks. 17. The management style of this organization is characterized by individual risk-taking, innovation, freedom and uniqueness.
H .43 -.17 -.04 .47
18. The glue that holds this organization together is commitment to innovation and development. There is an emphasis on being on the cutting edge.
H .26 .02 .06 .77
19. This organization emphasizes acquiring new resources and creating new challenges. Trying new things and prospecting for opportunities are valued.
H .33 -.12 -.09 .58
20. This organization defines success on the basis of having the most unique or newest products. It is a product/service leader and innovator.
H .03 .01 -.28 .57
Eigenvalues 5.83 3.42 4.70 4.72
Note. N=98 (aggregate of 257 coworkers). This table is based on the results of a prinicipal axis factoring analysis with oblique rotation (four factors). A key phrase from each item is used to represent each item.
A confirmatory factor analysis using the focal responses to the culture items was
performed as an additional test providing evidence for the generalizability of the four-
factor structure across different samples of respondents (Bentler, 1990; Bentler &
Bonnett, 1980). The CFA results suggest that the 18 items provide good fit for a four-
factor model (CFI= .96; RMSEA= .06; SRMR= .08), that all of the items load
significantly on their intended factors, and that the factors have sufficient discriminant
validity (the highest inter-correlation is at .59, between entrepreneurial and clan culture).
To limit the potential influence of common method bias in examining the
relationship between organizational culture and role perceptions, I use the average of
coworkers’ ratings of the organizational culture in examining the relationship between

66
culture and roles. The reliability of the clan culture measure is .90. The reliability of the
entrepreneurial culture measure equals .85. The market-oriented culture measure also
exhibited a high degree of reliability of .91. Finally, the hierarchy culture measure has a
reliability of .89. Therefore, all of the culture dimensions measures exhibited acceptable
reliabilities.
In addition, I measured organizational culture perceptions from the focal
participant’s perspective. The standardized reliability estimates in the focal sample are as
follows: .80 for the clan culture, .82 for the entrepreneurial culture, .90 for market
culture, and .86 for the hierarchy culture.
To provide initial evidence on the convergent validity of the culture measure, I
estimated the correlations between the aggregated coworker perceptions of culture and
the focal individual’s perceptions of the same organization’s culture. The correlation
between the clan cultures from both perspectives is positive and significant (r= .49, p<
.01). Entrepreneurial culture measurements from both perspectives were correlated at .47,
which is also significant at p< .01. Furthermore, the competitive culture measures were
related at .52 (p< .01). Finally, hierarchy culture from both perspectives was correlated at
.47 (p< .01). Table 4 provides more detail regarding the convergent and discriminant
validity of organizational culture from the focal and coworker perspectives.

67
Table 4:Correlations between Dimensions of Culture from the Coworker and Focal Perspectives
Note. N=98. * p <0.05 ** p<0.01 . Reliabilities appear on the diagonal. a = Co-worker-rated b = Focal perspective.
A confirmatory factor analysis using the focal responses to the culture items was
performed as an additional test providing evidence for the generalizability of the four-
factor structure across different samples of respondents. The CFA results suggest that the
18 items provide good fit for a four-factor model (CFI= .96; RMSEA= .06; SRMR= .08),
that all of the items load significantly on their intended factors, and that the factors have
sufficient discriminant validity (the highest inter-correlation is at .59, between
entrepreneurial and clan culture).
To limit the potential influence of common method bias in examining the
relationship between organizational culture and role perceptions, I use the average of
coworkers’ ratings of the organizational culture in examining the relationship between
culture and roles. The reliability of the clan culture measure is .90. The reliability of the
Variable M S.D. 1 2 3 4 5 6 7 8
1. Clan a 4.87 1.07 (.90)
2. Entrepreneurial a 4.59 1.16 .64** (.85)
3. Market-oriented a 5.10 .96 .34** .48** (.91)
4. Hierarchy a 4.65 1.02 .09 -.06 .13 (.89)
5. Clan b 4.35 1.24 .49** .33** .23* .00 (.80)
6. Entrepreneurial b 4.17 1.52 .38** .47** .33** -.11 .45** (.82)
7. Market-oriented b 4.87 1.38 .11 .18 .52** -.16 .27* .51** (.90)
8. Hierarchy b 4.41 1.47 -.24** -.31** -.20* .47** -.18 -.29* -.16 (.86)
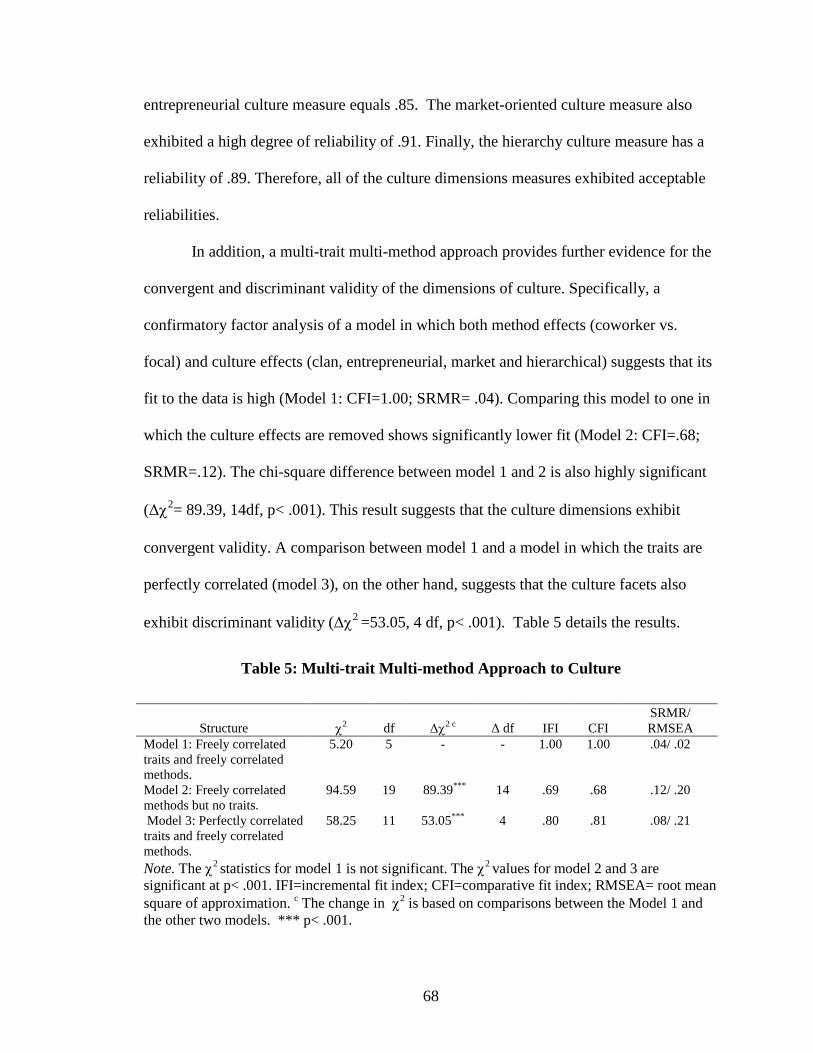
68
entrepreneurial culture measure equals .85. The market-oriented culture measure also
exhibited a high degree of reliability of .91. Finally, the hierarchy culture measure has a
reliability of .89. Therefore, all of the culture dimensions measures exhibited acceptable
reliabilities.
In addition, a multi-trait multi-method approach provides further evidence for the
convergent and discriminant validity of the dimensions of culture. Specifically, a
confirmatory factor analysis of a model in which both method effects (coworker vs.
focal) and culture effects (clan, entrepreneurial, market and hierarchical) suggests that its
fit to the data is high (Model 1: CFI=1.00; SRMR= .04). Comparing this model to one in
which the culture effects are removed shows significantly lower fit (Model 2: CFI=.68;
SRMR=.12). The chi-square difference between model 1 and 2 is also highly significant
(∆χ2= 89.39, 14df, p< .001). This result suggests that the culture dimensions exhibit
convergent validity. A comparison between model 1 and a model in which the traits are
perfectly correlated (model 3), on the other hand, suggests that the culture facets also
exhibit discriminant validity (∆χ2 =53.05, 4 df, p< .001). Table 5 details the results.
Table 5: Multi-trait Multi-method Approach to Culture
Structure χ2 df ∆χ2 c ∆ df IFI CFISRMR/RMSEA
Model 1: Freely correlated traits and freely correlated methods.
5.20 5 - - 1.00 1.00 .04/ .02
Model 2: Freely correlated methods but no traits.
94.59 19 89.39*** 14 .69 .68 .12/ .20
Model 3: Perfectly correlated traits and freely correlated methods.
58.25 11 53.05*** 4 .80 .81 .08/ .21
Note. The χ2 statistics for model 1 is not significant. The χ2 values for model 2 and 3 are significant at p< .001. IFI=incremental fit index; CFI=comparative fit index; RMSEA= root mean square of approximation. c The change in χ2 is based on comparisons between the Model 1 and the other two models. *** p< .001.

69
Data aggregation for organizational culture. I calculated intra-class correlations
ICC (1) and ICC (2) to assess the degree to which organizational culture can be
considered an organizational level phenomenon as measured in the current study. ICC (1)
can be interpreted as a measure of the proportion of variance explained by organization
membership or as the degree to which ratings from respondents from the same unit of
analysis (e.g. the organization) are substitutable (Bliese, 2000). The formula for
computing ICC (1) is based on a one-way ANOVA with organization membership as the
independent variable and the scales of interest as the dependent variable. The
organizational culture ratings on each of the four dimensions are the outcome variables of
interest. The computations of the ICC (1) an (2) were performed using the appropriate
ANOVA method.
The formula used to compute the ICC (1) is as follows:
ICC (1)=(MSB-MSW)/[MSB+(k-1)*MSW]
Where k is the average number of respondents from the same organization (k=2.92 in this
sample). All of the F-tests associated with organization membership were significant (p<
.001). The ICC (1) values are as follows: .26 for clan culture, .27 for the entrepreneurial
culture, .21 for the market culture, and .43 for the hierarchy culture. These values suggest
that membership in a specific organization explains between 27% and 44% of the
variance in organizational culture ratings. These values are higher than the median ICC
(1) of .12, which was reported by James (1982), indicating that there is a good amount of
between-organization variability relative to within-organization in respondents’
perceptions of their organization’s culture.

70
ICC (2) is a measure of the reliability group (i.e., organization-level) means
(Bliese, 2000) and was calculated with the following formula:
ICC (2)=(MSB-MSW)/MSB
The ICC (2) values are .50, .50, .45, and .70 for clan, entrepreneurial, market, and
hierarchy cultures, respectively. The ICC (2) values were relatively low for the most part
may be partially attributed to the low number of respondents per organization.
The rwg values reflect the level of agreement among coworkers regarding levels of
culture. The median rwg value for clan culture was .55, median rwg value for
entrepreneurial culture was .58, the median rwg for market culture was equal to .70, and
finally, the rwg for hierarchy culture was equal to .58. Overall, these values suggest
presence of agreement to allow aggregation of the scales.
Roles and employee behaviors. There are alternative methods of measuring roles
available in the literature. Morrison (1994), for example, measured role perceptions by
asking individuals to assign respective outcome activities into one of two categories: 1)
activities that are an expected part of the job, and 2) activities, which are somewhat above
what is expected. Lam and colleagues (1999), on the other hand, used a 5-point Likert
scale to determine if an activity is more in-role or more extra-role. They asked
respondents to rate the degree to which they agreed that each activity is an expected part
of the role. Hofmann and colleagues (2003) used a 5-point Likert scale anchored so that 1
meant that an activity is an expected part of the job, while 5 stood for “definitely above
and beyond what is expected for my job” (p. 172).
I used a procedure similar to Hofmann and colleagues (2003) by asking
individuals to indicate on a Likert scale (1-7) whether an activity is extra-role or in-role.

71
Specifically, focal MBA participants were asked to indicate the extent to which they
perceive four different types of behaviors to be expected of them by their organization.
The instructions specifically read: “Rate the extent that your organization expects you to
perform each role (NOTE: Work roles are activities that are not necessarily part of the
job description but are expected by the organization)”. A 1-7 anchored scale is used to
indicate the extent to which each behavior was an expected part of a work role (1-
definitely NOT expected as part of my work role; 2-only slightly expected as part of my
work role; 3-somewhat expected; 4-moderately expected as part of my work role; 5-
strongly expected as part of my work role; 6-very strongly expected as part of my work
role; 7-absolutely expected as part of my work role).
The participants provided their roles ratings by responding to an initial pool of 34
items (7 items for helping role, 13 items for innovative role, 6 items for achievement role,
and 8-items for compliant role). Most of these items were adapted from existing sources
(e.g. Morrison & Phelps, 1999) or developed based on a literature review; some new
items were also added to scales that were not so well developed in the literature (e.g.
achievement and compliant roles). I conducted a factor analysis of the items to see if the
items loaded on their component factors. Results from the exploratory analysis suggest
that some items need to be dropped due to cross-loadings or because of low loading on
their respective components. The initial item pool was not conforming to a four-factor
solution. However, after several iterations and after removing cross-loading items, a
smaller set of 13 items was derived using principal axis factoring with oblique rotation.
Table 6 provides details regarding the factor analysis. (Please see Appendix A for the
specific items).

72
Table 6: Exploratory Factor Analysis of Role Perceptions of Organizational Expectations
Scale FactorItems
1 2 3 4
1. Generating creative ideas. I .89 -.11 .00 .012. Promoting and championing ideas to others. I .89 .07 .08 .053. Being innovative. I .91 -.07 -.06 -.034. Doing my job in a way that emphasizes efficiency rather than creativity.
C -.06 .65 -.05 -.20
5. Sticking with existing rules and procedures when doing my job rather than being creative
C -.01 .90 -.05 .08
6. Going about solving problems following existing procedures
C .07 .83 -.03 -.01
7. Relying on the existing work processes and procedures when it comes to completing my job responsibilities
C -.06 .76 .09 .09
8. Taking time to listen to coworkers’ problems and worries.
H -.04 -.03 .71 .04
9. Going out of the way to help new employees.
H .03 -.05 .63 -.06
10. Taking a personal interest in other employees.
H -.02 .07 .94 .01
11. Strongly advocating my points and perspectives in meetings and discussions.
A .39 .05 .03 -.46
12. Doing whatever it takes to achieve my performance goals and targets.
A -.10 -.01 -.09 -1.02
13. Being an aggressive advocate for my interests and agendas.
A .12 .01 .22 -.64
Eigenvalues 3.61 2.87 2.40 2.27Note. N=98. This table is based on the results of a prinicipal axis factoring analysis with oblique rotation. A key phrase from each item is used to represent each item. I refers to innovative role; C to compliant role; H to help role; A to achievement role.
Employee behaviors were measured using the same set of items for consistency
purposes. Since I had already established the dimensionality of the role perceptions and I
expected for behaviors to conform to the same structure, I used a confirmatory factor
analysis (CFA) approach. The results of the CFA suggest that the four-dimensional
structure is well suited for the coworker ratings of behaviors (CFI= .98; SRMR= .08;
RMSEA= .04). In addition, all of the factors were loading significantly on their

73
respective factors and the inter-correlations between factors did not exceed .85
recommended as the cutoff point for discriminant validity purposes (Kline, 1994). The
internal Cronbach alpha-reliability of the help scale was .83, the reliability for innovative
behavior was .90; the competitive/high performance scale had a reliability of .73, and
finally, the scale for compliant behavior exhibited a reliability of .80.
The scales used to measure behaviors also exhibited good fit using the supervisor
perceptions (CFI= .96; SRMR= .10; RMSEA= .07). The items were loading on the
specified latent factors, and none of the inter-correlations between factors was higher
than .85. The reliabilities in the supervisor sample were as follows: .85 (help), .93
(innovative behavior), .84 (achievement), and .79 (compliant behavior).
Issues of aggregation with behaviors. In order to justify the aggregation of
coworker rated behaviors for each individual I selected a score of within-group inter-rater
agreement Rwg to establish if there is sufficient agreement between respondents (James,
Demaree, & Wolf, 1984, 1993). The median Rwg values for the help/cooperation,
innovation, achievement, and compliant behavior, were as follows: .88, .87, .67 and 0.61
(in the coworker sample). All of these values are above the recommended level of .60
(James, 1982), thus, justifying the aggregation of multiple sources for each individual.
In addition, I calculated the ICC statistics using the same procedures as with the
measures of culture. The F-statistics associated with organizational membership for three
of the behaviors rated by coworkers was significant at p<. 001; it was not significant for
achievement behavior (p< .18). The ICC (1) values in the coworker sample were as
follows: 0.10 for help, 0.08 for achievement behavior, 0.20 for innovative behavior, and
finally, 0.12 for compliant behavior, thus, suggesting that there are some discernible

74
differences in behavior across organizations. The ICC (2) values were as follows: 0.25
for help, 0.16 for achievement behavior, 0.46 for innovative behavior, and 0.30 for
compliant behavior.
Self-Monitoring. Self-monitoring is a form of social skill, related to the
recognition and regulation of emotion in a social context (Lennox & Wolfe, 1984). Focal
MBA participants were asked to rate their level of self-monitoring (on a 1-strongly
disagree to 7-strongly agree scale format) on a previously developed and validated scale
(Lennox & Wolf, 1984). A sample item reads “ I am often able to read people’s true
emotions correctly through their eyes.” I conducted a CFA to confirm the dimensionality
of the scale. One of the dimensions reflected social awareness, which Lennox & Wolfe
(1984) labeled sensitivity to expressive behavior of others (sample item: “In conversation,
I am sensitive to even the slightest change in the facial expression of the persons I’m
conversing with.”). Alpha reliability of the scale was equal to .82. Here I refer to this
dimension as cognitive self-monitoring.
The other dimension seemed to reflect a more active, behavioral component,
which can be labeled ability to modify self-presentation (Lennox & Wolfe, 1984; Sample
item: “In social situations, I have the ability to alter my behavior if I feel that something
else is called for”). The CFA analysis showed that one item had very low explanatory
power with respect to the overall latent dimension. Therefore, it was dropped from
further analysis. The alpha reliability of the scale was .80. In my thesis, I refer to that
dimension of self-monitoring as behavioral self-monitoring.
A 2-factor solution is consistent with the Lennox & Wolfe (1984) study, in which
they found an identical two-factor structure. The CFI and IFI indices for the two-
75
dimensional model are equal to .99, indicating very good fit. In addition, the SRMR was
equal to .05 (< .10) and the RMSEA was equal to .02. All of the indicator factor loading
are significant at p< .001 and their paths were more than 2 times larger than the standard
errors (Anderson & Gerbing, 1988). Using the available criteria for model fit, results
from the CFA suggested that the 2-factor model provided a good fit.
Culture strength. Culture strength is defined as the extent to which culture is
shared and reinforced in the organization (Martin, 1992). Here, I developed four 1-items
measures for the primary analysis uses. A sample item reads: “Strength is defined in
terms of the degree to which people in your organization collectively recognize and share
a common set of values and beliefs about what is valued that are reinforced via formal
and informal rewards, and work practices. Rate the culture strength on the following
dimension of culture: a. innovation and adaptability—emphasis on risk and being on the
cutting edge.”). The scale for culture strength was anchored on a 7-point scale from 1-
extremely weak to 7-extremely strong.
In addition, consistent with research on climate strength (Schneider et al., 2002),
an alternative way to measure culture “strength” or more precisely, agreement is by the
standard deviation of employee perceptions from each organization regarding the type of
culture. This analysis is somewhat secondary because the construct validity of the
standard deviation as a measure of strength has not been well established. Therefore, it is
difficult to assess the extent to which agreement between employees on a culture
dimension captures “strength”.

76
P-O fit. P-O fit is measured by 3 items, adapted from Cable & Judge (1996) –A
sample item is “I feel that my values “match” or fit my organization and the current
employees in my organization”. The reliability of this scale was .90.
Controls. Kidder and McLean Parks (2001) suggested that certain organizational
roles might be influenced by gender stereotypes. For instance, women may perceive
helping as more in-role while men may be more drawn to traditionally masculine
competitive roles. Therefore, I am planning to include gender as a control variable.
Job type may also have implications for role perceptions and behaviors.
Individuals who have more experience in a certain job may be more likely to possess the
expertise to be innovative or helpful with other individuals. At the same time,
organizational experience may provide incentives to individuals to abide by the
organizational policies and rules (thus, inducing compliant behavior). To isolate its
possible effect on outcome variables of interest, I am planning to include organizational
experience (years, months in the current organization) as a control variable as well.
While there it is theoretically justified to include controls, I do not expect the controls
hold equally across different dependent variables. Therefore, I only report the effect of
controls in those regressions where they are both theoretically relevant and empirically
significant.
77
Chapter 5: Results
The results are outlined in two sections: one describing the relationships in the
first part of the model (between culture and roles) and the other describing the results for
the second part of the model (roles to behaviors).
Relationships between Culture and Role Perceptions
Table 7 describes the inter-correlations, means, standard deviations, and
reliabilities of the variables used to test the proposed relationships between culture and
roles.

78
Table 7: Correlation Table (Roles as Dependent Variable)
Variable M S.D. 1 2 3 4 5 6 7 8 9 10 11
1. Gender 0.27 0.45 _
2. Job type 0.55 0.50 .03 _
3. Company experience 3.70 3.41 -.14 -.08 _
4. Clan 4.87 1.08 -.02 .04 -.07 (.80)
5. Entrepreneurial 4.60 1.16 .02 -.01 -.13 .65** (.82)
6. Market-oriented 5.11 0.96 -.05 -.05 -.11 .35** .48** (.90)
7. Hierarchy 4.66 1.03 -.05 .03 .12 .09 -.07 .12 (.86)
8. Clan strength 4.20 1.49 .03 .13 .11 .43** .25* .20* -.02 _
9. Entrepren. strength 4.09 1.46 .01 .07 .08 .24* .34* .36** -.15 .31** _
10. Market strength 4.82 1.58 .13 .02 .02 .27* .25* .44** -.14 .37** .46** _
11. Hierarchy strength 4.40 1.56 .06 .04 .16 -.08 -.20* .03 .32** .25* -.20* .06 _

79
TABLE 7 (Continued).
Variable M S.D. 1 2 3 4 5 6 7 8 9 10 11
12. SD (clan)a 1.19 0.47 -.08 -.24 -.01 -.23 -.13 .02 -.14 .02 -.18 -.22 .11
13.SD (entrepreneurial) a 1.23 0.57 -.13 -.08 .17 -.05 -.14 .11 -.04 -.25* .01 .07 -.19
14. SD (market) a 1.09 0.47 -.18 -.15 .18 .00 -.15 -.21 .16 -.11 .06 -.28* -.05
15. SD (hierarchy) a 1.11 0.45 -.11 -.06 .05 -.19 -.06 .05 -.51** .04 .05 .12 -.04
16. Perceived fit 4.66 1.38 -.04 .18 .11 .31** .17 .25* -.15 .58** .37** .46** .12
17.Self-mon. (cognitive) 5.04 .84 -.03 -.10 .09 -.03 -.04 -.02 .04 .02 .02 .01 .26*
18. Helping Role 3.67 1.49 .04 -.12 .25* -.05 -.02 .01 -.06 .18 .22* .29** .07
19. Innovative Role 4.67 1.52 -.02 .06 .06 .11 .25* .13 -.22* .37** .35** .35** -.06
20. Achievement Role 3.89 1.43 -.13 -.02 .01 .04 .08 .22* -.05 .03 .10 .34** .02
21. Compliant Role 4.09 1.27 -.08 .01 .04 -.22* -.27** -.13 .15 -.15 -.40** -.11 .49**

80
TABLE 7 (Continued)
Note. N=96; *p< .05; ** p< .01; a N= 67.
Variable M S.D. 12 13 14 15 16 17 18 19 20 21
12. SD (clan) 1.19 0.47 _
13. SD (entrepreneurial) 1.23 0.57 .30* _
14. SD (market) 1.09 0.47 .20 .23 _
15. SD (hierarchy) 1.11 0.45 .24* .06 .04 _
16. Perceived fit 4.66 1.38 -.18 -.04 -.09 .07 (.90)
17.Self-mon. (cognitive) 5.04 .84 -.05 -.04 .04 .22 .05 (.81)
18. Helping Role 3.67 1.49 .02 .05 .22 -.11 .25* .18 (.80)
19. Innovative Role 4.67 1.52 .06 -.01 -.08 .16 .23 .14 .31** (.93)
20. Achievement Role 3.89 1.43 .01 .23 -.16 .11 .17 .17 .13 .39** (.72)
21. Compliant Role 4.09 1.27 .08 -.08 .00 .02 .08 .27** -.10 -.31** .04 (.87)

81
Relationships between Culture and Roles
To test hypotheses 1a-1h, which predicted that culture would influence role
perceptions, I ran multiple regression analysis. I entered all of the control variables to
check if they are significant predictors of the dependent role perceptions. Only company
experience was significant for one of the dependent variables, specifically helping
(teamwork) role. Hypothesis 1a, in which I posited that clan culture would be a
significant positive prediction of helping role, was not supported (β= -.03, n.s.). Company
experience as a control was a positive predictor of helping role such that employees who
had longer tenure with their companies perceived that their company expected of them to
be helpful with other employees (β= .25, p< .05, ∆R2 =0.06). Hypothesis 1b, which
suggested a negative link between clan and achievement role was also not supported (β=
.04, n.s.). Hypothesis 1c was supported, in that market culture norms were positively
associated with an achievement role (β= .21, p< .05, ∆R2 =0.04). The relationship
between market culture and helping role, on the other hand, was not significant (β= .04,
n.s.), which did not provide support for hypothesis 1d. The link between entrepreneurial
culture and innovative role received strong support (β= .27, p< .01, ∆R2 = .07), which
substantiated empirically hypothesis 1e. The negative relationship between
entrepreneurial culture and compliant role (hypothesis 1f) was also confirmed (β= -.29,
p< .01, ∆R2 = .08). Finally, the proposed positive relationship between hierarchy culture
and compliant role (hypothesis 1g) was not supported although it was in the predicted
direction (β= .15, n.s.) but the negative relationship between hierarchy culture and
innovative role received empirical support (β= .21, p< .05. ∆R2 = .04). Table 8 displays
the results.

82
Table 8: Regression Analysis of the Relationship between Culture and Roles
H1a & H1d H1b & H1c H1e & H1h H1f & H1gHelping Role a Achievement Role Innovative Role Compliant Role
Predictors
Step 1 Model 1 Model 2 Model 1 Model 2 Model 1 Model 2 Model 1 Model 2Company experience .25*
Clan culture -.03 .04Entrepreneurial culture .27** -.29**
Market culture .04 .21*
Hierarchy culture -.21* .15R2 .06 .06 .06 .00 .04 .07 .04 .08 .02∆R2 (∆F) .06
(6.27*).00
(.09).00
(.17).00
(.19).04
(4.37*).07
(7.40**).04
(4.55*).08
(8.54**).02
(2.17)
Note. N=98. a N=96; * p< .05; ** p< .01;

83
For the interaction hypotheses, the main effects were entered first (culture and
strength), followed by the interactive terms. Hypothesis 3a, in which I posited that clan
strength, will moderate the relationship between clan culture norms and helping role did
not receive support (β=-.05, n.s.). The interactive effect of clan strength and clan culture
on achievement role hypothesis 3b), on the other hand, was significant. I plotted the
interaction in line with existing guidelines by using +1SD and –1SD from the means of
the independent variables as anchor values to represent the high and low values (Aiken &
West, 1991). The shape of the figure shows that there is a stronger negative relationship
between clan culture and achievement role when strength around teamwork is perceived
to be higher (β= -.23, p< .05, ∆R2 = .05).
On the other hand, there was an unexpected increase in achievement role in the
condition of higher clan culture and lower strength perceptions, such that when the
perceived strength and agreement around norms of teamwork was low, higher scores on
clan organizational culture contributed to higher achievement role. Hypothesis 3c and
Hypothesis 3d that predicted an interactive effect between market culture and market
strength on achievement and helping role respectively were not supported (β= -.10, n.s. &
-.16, n.s.).
The predicted interactive effects between entrepreneurial culture and
entrepreneurial strength on innovative and compliant role were not supported (β= -.16,
n.s. & β= -.13, n.s.), thus, failing to provide empirical support for hypothesis 3e and 3f.
Hypothesis 3g, which posited an interaction between hierarchy and hierarchy
strength on compliant role received some support. Specifically, the interaction term was
significantly related to compliant role perceptions (β=-.25, p< .05, ∆R2 = .05). Its shape

84
suggested that the largest difference occurs at the low level of hierarchical culture such
that when the organizational espoused culture is not perceived as strongly hierarchical but
there is a perception that those norms that exist around procedures are clear and strong,
individuals tend to perceive more compliant roles than those of individuals who
experience low levels of both. The role of strength seemed to have diminishing returns
when the overall espoused culture was strongly hierarchical, perhaps, suggesting that
strength and culture in this case are substitutable.
In addition, I tested whether strength as agreement captured by the standard
deviation on a culture dimension would interact with culture to influence role
perceptions. The interaction terms were not significant. Tables 9 (culture strength as 1-
item measure) and 10 (culture strength as a standard deviation) demonstrate the primary
and supplementary regression results and figures 3a and 3b display the shape of the
significant interaction effects.

85
Table 9: Interaction Results: Culture and Culture Strength on Roles
H3a: Helping Role a H3b: AchievementRole
H3c: AchievementRole
H3d: Helping RolePredictors/ Dependent variables
Step 1 Step 2 Step 3 Step 1 Step 2 Step 1 Step 2 Step 2 Step 3Company experience .25*
Clan culture -.12 .05Clan strength .21 .00Market culture .28* -.11Market strength .09 .33**
Clan x Strength -.05 -.23*
Market x Strength -.10 -.16R2 .06 0.09 0.09 0.00 0.05 0.11 0.12 .15 .18∆R2 (∆F) .06
(6.27*)0.03
(1.76)0.00(.28)
0.00(.09)
0.05(5.02*)
0.11(6.17**)
.01(1.14)
.09(4.94**)
.03(2.85)
Predictors/Dependent variables
H3e: Innovative Role H3f: Compliant Role
H3g: Compliant Role
H3h: Innovative Role
Entrepreneurial culture .15 -.16Entrepreneurial strength .32** -.36**
Hierarchy culture -.10 -.23*
Hierarchy strength .42** .06Entrepreneurial x strength -.16 -.13Hierarchy x strength -.25* .07R2 .16 .18 .20 .21 .20 .25 .05 .05∆R2 (∆F) .16
(9.09**)
.02
(2.80)
.20
(11.75**)
.01
(1.87)
.20
(11.65**)
.05
(6.14*)
.05
(2.40)
.00
(.36)Note. N=98. a N=96; * p< .05; ** p< .01.

86
Table 10 (strength as agreement):Interaction Results
H3a: Helping Role H3b: AchievementRole
H3c: AchievementRole
H3d: Helping RolePredictors/ Dependent variables
Step 1 Step 2 Step 3 Step 1 Step 2 Step 1 Step 2 Step 2 Step 3Company experience .29*
Clan culture .02 .26*
SD4 Clan .02 .08Market culture .35** .10SD Market -.09 .19Clan x SD clan .14 -.05Market x SD market -.11 -.01R2 .08 .08 .09 .07 .07 .14 .15 .12 .12∆R2 (∆F) .08
(5.89*).00
(.03).01
(.91).07
(2.82*).00
(.11).14
(5.39**).15
(.76).04
(1.34).00
(.01)Predictors/Dependent variables
H3e: Innovative Role H3f: Compliant Role
H3g: Compliant Role
H3h: Innovative Role
Entrepreneurial culture .35** -.14SD Entrepreneurial .02 -.07Hierarchy culture .22 -.23SD Hierarchy .19 -.03Entrepreneurial x SD entr. .17 -.08Hierarchy x SD hierarchy -.02 .11R2 .12 .14 .02 .03 .04 .04 .05 .05∆R2 (∆F) .12
(4.51*).03
(2.07).02
(.72).01
(.41).04
(1.50).00
(.00).05
(1.57).00
(.13)Note. N=68. * p< .05; ** p< .01.
4 SD stands for standard deviation on the respective dimension of culture.

87
Figure 3: Interactions between Culture and Culture Strength
Figure 3a: Interaction between clan culture and clan strength.
Figure 3b: Interaction between hierarchy culture and hierarchy strength
3.2
3.4
3.6
3.8
4
4.2
4.4
4.6
low clan high clan
Clan Culture
Low strength
High strength
Achievement Role
00.5
11.5
22.5
33.5
44.5
55.5
low high
Hierarchical Culture
Compliant Role
Low strength
High strength

88
Hypotheses 5a and 5h posited that self-monitoring will moderate the relationships
between culture and roles in a way similar to culture strength. Similarly to hypotheses 3a-
3h, I tested 5a-5h by first entering the main effects (and relevant controls), and then the
interaction term. Only one of the interaction terms was significant, specifically the
interaction of entrepreneurial culture and self-monitoring on compliant role (hypothesis
5f: β= .19, p< .05, ∆R2 = .03). I plotted the interaction to see the nature of the result.
Surprisingly, instead of the expected enhancing effect of self-monitoring on the
negative relationship between entrepreneurial culture and compliant role perceptions the
effect seemed to follow an opposite shape. In particular, low self-monitors were more
likely to adjust their perceptions of organizational expectations more as a result of higher
levels of entrepreneurial culture. This may in fact suggest that the cognitive element of
self-monitoring is more concerned with people rather than the environment such that high
self-monitors perceive broader roles even when the broader context is not supportive of
that role. Therefore, the results do not provide support for the proposed relationships in
hypotheses 5a through 5h. Table 11 provides more details regarding the specific
regressions and figure 4 shows the shape of the significant interaction.

89
Table 11:Interaction Results: Culture and Self-monitoring on Roles
H5a: Helping Role H5b: AchievementRole
H5c: AchievementRole
H5d: Helping RolePredictors/ Dependent variables
Step 1 Step 2 Step 3 Step 1 Step 2 Step 1 Step 2 Step 2 Step 3Company experience .25*
Clan culture -.03 .05Self-monitoring (cognitive) .16 .18 .19 .16Market culture .22* .02Clan x Self-monitoring -.06 .20Market x Self-monitoring -.10 -.03R2 0.06 0.09 0.09 0.03 0.07 0.08 0.12 0.02 0.02∆R2 (∆F) 0.06
(6.27*)0.03
(1.31)0.00(.30)
0.03(1.17)
0.04(3.60)
0.08(4.12*)
.01(1.14)
0.02(1.20)
0.00(.08)
Predictors/Dependent variables
H5e: Innovative Role H5f: Compliant Role
H5g: Compliant Role
H5h: Innovative Role
Entrepreneurial culture .27** -.28**
Self-monitoring .19* .19* .20* .19Hierarchy culture .14 -.22*
Entrepreneurial x Self-monitoring
-.09 .19*
Hierarchy x Self-monitoring
.05 .00
R2 .11 .12 .12 .15 .06 .06 .08 .08∆R2 (∆F) .11
(5.69**) .01(.94)
.12 (6.43**)
.03(3.82*)
.06 (3.10*)
.06(.27)
.08(4.11*)
.00(.00)
Note. * p< .05; ** p< 0.01. There may be some slight differences in values required to reach significance levels due to rounding.

90
Figure 4: Interaction between self-monitoring (cognitive) and
entrepreneurial culture
Hypotheses 7a through 7h posited that the relationships between culture and role
would be moderated by the perceived P-O fit. P-O fit had a main effect on helping and
innovative role (β= .27, p< .01 and β= .26, p< .01, respectively). In addition, only the
interactive effect of P-O fit and market culture on helping role was significant (H7d: β= -
.19, p< .05, ∆R2 = .04). The significant interaction between P-O fit and market culture
was in the predicted direction such that when the organizational culture had a strong
market orientation and the level of perceived fit was high, the relationship between
market culture and helping role was increasingly negative. In addition, at low market
culture individuals with high fit perceived helping to be more expected in their role than
individuals with low fit. Table 12 demonstrates the regression results for hypotheses 7a
through 7h and figure 5 illustrates the shape of the interaction.
2
2.5
3
3.5
4
4.5
5
low high
Entrepreneurial Culture
Compliant Role
High self-monitoring
Low self-monitoring

91
Table 12: Culture and Perceived Person-Organization Fit (P-O Fit) Interaction on Roles
H7a: Helping Role H7b: AchievementRole
H7c: AchievementRole
H7d: Helping RolePredictors/ Dependent variables
Step 1 Step 2 Step 3 Step 1 Step 2 Step 1 Step 2 Step 2 Step 3Company experience .25*
Clan culture -.12 .02P-O fit .27** .07 .03 .25*
Market culture .20* -.04Clan x P-O fit -.10 -.18Market x P-O fit -.10 -.19*
R2 0.06 0.13 0.14 0.01 0.04 0.04 0.05 0.06 0.10∆R2 (F) 0.06
(6.27*)0.07
(3.59*)
0.01
(1.06)
0.01
(.33)
0.03
(3.08)
0.04
(2.21)
0.01
(1.08)
0.06
(3.01*)
0.04
(3.79*)Predictors/Dependent variables
H7e: Innovative Role H7f: Compliant Role
H7g: Compliant Role
H7h: Innovative Role
Entrepreneurial culture .22* -.27**
P-O fit .26** -.08 -.12 .28**
Hierarchy culture .13 -.17Entrepreneurial x P-O fit -.07 -.13Hierarchy x P-O fit .12 .00R2 .14 .14 .09 .11 .04 .05 .12 .12∆R2 step (F) .14
(7.61**).00
(.47).09
(4.62*).02
(1.78).04
(1.75).01
(1.41).12
(6.57**).00
(0.00)

92
Figure 5: Interaction between P-O fit and market culture
Relationships between Roles and Behaviors
Coworker ratings and supervisor ratings. Hypotheses 2a through 2h posited that
there would be relationships between roles and respective behaviors. I tested the
proposed relationships using the aggregate coworker ratings of behaviors. Table 13
describes the inter-correlations, means, standard deviations, and reliabilities of the
variables used to test the proposed relationships between roles and behaviors in the
coworker sample. One of the control variables had a significant effect on one of the
outcome variables—innovative behavior. Specifically, individuals in engineering/
professional jobs were viewed as more innovative than those in managerial jobs (β = .26,
p< .01, ∆R2 = .07). Therefore, this control variable was retained as a control for
innovative behavior. Table 14 provides the regression results for hypotheses 2a through
2h. Only hypothesis 2f was supported (innovative role had a negative relationship with
compliant behavior. (β= -.30, p< .01, ∆R2 = .09).
0
1.5
3
4
5
Low HighMarket Culture
HelpingRole
Low fit
High Fit

93
Table 13:Correlation Table: Coworker-Rated Behaviors as a Dependent Variable
Variable M S.D. 1 2 3 4 5 6 7 8 9 10 11
1. Gender 0.26 0.44 _
2. Job type 0.55 0.50 -.06 _
3. Company experience 3.58 3.24 -.11 -.08 _
4. Help role 3.73 1.46 .00 -.16 .24* (.80)
5. Innovative role 4.69 1.48 -.01 -.07 .08 .34** (.82)
6. Achievement role 3.95 1.41 -.07 .00 -.01 .18 .41** (.90)
7. Compliant role 4.16 1.22 -.10 .09 .02 -.11 -.37** .18 (.86)
8. P-O fit 4.55 1.35 .03 .03 .15 .24* .32** .13 -.12 (.88)
9. Self-Mon. (behavioral) 5.07 0.87 -.08 .05 .10 .15 .16 .11 .11 .13 (.81)
10. Clan strength 4.13 1.47 .05 .02 .14 .14 .36** .08 -.17 .58** .04 _
11. Entrepren. Strength 4.07 1.39 .06 .02 .09 .09 .36** .06 -.41** .45** .03 .33** _

94
TABLE 13 (Continued)
Variable M S.D. 1 2 3 4 5 6 7 8 9 10 11
12. Market strength 4.82 1.53 .17 -.11 .04 .20* .28** 32** -.09 .45** -.03 .36** 47**
13. Hierarchy strength 4.35 1.52 .05 -.09 .17 .03 -.05 .04 .44** .17 .06 .26** -.17
14. SD (clan) a 1.23 0.48 -.01 -.07 .04 .14 -.04 -.04 -.06 -.10 -.05 -.19 .04
15.SD (entrepreneurial) a 1.31 0.67 -.23* -.06 .33** .03 .06 .11 -.13 .02 -.16 .18 -.19
16. SD (market) a 1.08 0.47 -22* -.01 .13 .10 .11 -.05 .03 -.01 -.04 .09 -.01
17. SD (hierarchy) a 1.22 0.51 -.11 .02 .06 -.05 .11 .10 -.10 .03 -.20 -.11 .08
18. Helping Behavior 6.00 0.71 .13 .11 .10 .04 .13 -.02 -.08 .08 .01 .11 .14
19. Innovative Behavior 5.81 0.73 .01 .26* -.01 .11 .11 .03 -.03 -.05 .12 -.02 .03
20.Achievement Behavior 5.43 0.75 .05 -.12 -.03 -.02 -.05 -.10 .08 .08 .12 .06 -.02
21. Compliant Behavior 4.82 0.82 .03 .00 -.04 -.10 -.30** -.20* .13 -.01 .02 .05 -.07

95
TABLE 13 (Continued)
Note. N=107. a N=89.
Variable M S.D. 12 13 14 15 16 17 18 19 20 21
12. Market strength 4.82 1.53 _
13. Hierarchy strength 4.35 1.52 .10 _
14. SD (clan) a 1.23 0.48 -.14 -.08 _
15. SD (entrepreneurial) a 1.31 0.67 .21* -.05 .30** _
16. SD (market) a 1.08 0.47 -.16 .04 .10 .27* _
17. SD (hierarchy) a 1.22 0.51 .13 -.25* .06 .22* .12 _
18. Helping Behavior 6.00 0.71 .08 .02 -.07 .08 -.02 .04 (.83)
19. Innovative Behavior 5.81 0.73 -.11 -.09 -.21* -.12 -.16 .04 .61** (.90)
20.Achievement Behavior 5.43 0.75 -.03 -.09 -.04 -.05 -.14 -.06 .27** .33** (.73)
21. Compliant Behavior 4.82 0.82 -.01 .10 .09 .04 .01 .14 .08 -.11 .22* (.80)
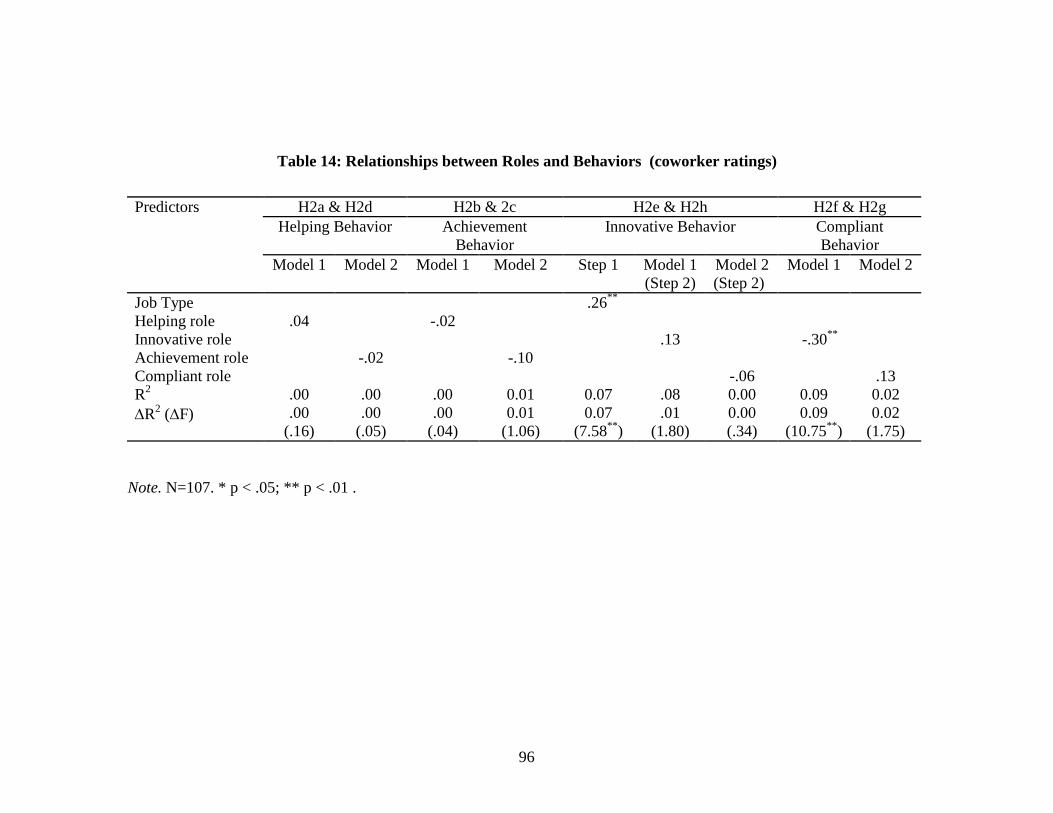
96
Table 14: Relationships between Roles and Behaviors (coworker ratings)
H2a & H2d H2b & 2c H2e & H2h H2f & H2gHelping Behavior Achievement
BehaviorInnovative Behavior Compliant
Behavior
Predictors
Model 1 Model 2 Model 1 Model 2 Step 1 Model 1(Step 2)
Model 2(Step 2)
Model 1 Model 2
Job Type .26**
Helping role .04 -.02Innovative role .13 -.30**
Achievement role -.02 -.10Compliant role -.06 .13R2 .00 .00 .00 0.01 0.07 .08 0.00 0.09 0.02∆R2 (∆F) .00
(.16).00
(.05).00
(.04)0.01
(1.06)0.07
(7.58**).01
(1.80)0.00(.34)
0.09(10.75**)
0.02(1.75)
Note. N=107. * p < .05; ** p < .01 .

97
Supervisor ratings. In addition, I tested hypotheses 2a-2h using the supervisor
ratings of behaviors. The correlations between supervisor and coworker ratings of the
behaviors of the focal person are displayed in table 15. While help and achievement
displayed some degree of statistically significant convergence across the different sources
(r= .22, p< .05 and r= .32, p< .01), the correlations between the supervisor and coworker
ratings of innovation and compliance were lower and not statistically significant (r=.12,
n.s. and r=.13, n.s., respectively). These low correlations suggest differences between the
perspectives of supervisors and coworkers with respect to the focal person’s behaviors.
Table 16 describes the inter-correlations, means, standard deviations, and
reliabilities of the variables used to test the proposed relationships between roles and
supervisor ratings of behaviors.
Hypothesis 2a through 2h, which maintained that roles would lead to behaviors,
were not supported using the supervisor ratings. Specifically, only one of the control
variables had a significant effect on two of the outcome variables. Female individuals
were viewed as more helpful and more compliant than males by their supervisors (β =
.27, p< .05, ∆R2 = .07 and β = .26, p< .05, ∆R2 = .07, respectively). Consequently, this
control variable was retained as a control for both help and compliant behavior. Table 17
provides the regression results for hypotheses 2a through 2h.

98
Table 15: Correlations among behaviors (coworkers and supervisors as sources)
Note. N=86. a Supervisor perspective. b Coworker perspective.
Variable (behavior) M S.D. 1 2 3 4 5 6 7 8
1. Help a
5.77 0.85-
2. Innovative a 5.69 0.98 .44** -
3. Achievement a 4.95 1.30 .18 .43** -4. Compliant a 4.49 0.93 -.14 -.18 .10 -5. Help b 6.03 0.69 .22* .05 .11 .096. Innovative b 5.81 0.71 .09 .13 .07 -.19 .60**
7. Achievement b 5.41 0.75 .26* .28** .32** -.17 .17 .27*
8. Compliant b 4.76 0.80 .03 -.05 -.05 .12 .09 -.11 .22*

99
Table 16: Correlation Table: Supervisor-Rated Behaviors as a Dependent Variable
Variable M S.D. 1 2 3 4 5 6 7 8 9 10 11
1. Gender 0.27 0.45 _
2. Job type 0.54 0.50 -.02 _
3. Company experience 3.81 3.47 -.14 -.06 _
4. Help role 3.77 1.45 .02 -.12 .26* (.80)
5. Innovative role 4.77 1.44 -.05 -.02 .05 .34** (.82)
6. Achievement role 3.92 1.42 -.05 -.05 -.02 .14 .40** (.90)
7. Compliant role 4.14 1.16 .01 .05 .04 -.08 -.32** .19 (.86)
8. P-O fit 4.59 1.32 .01 .15 .16 .19 .25* .07 -.03 (.88)
9. Self-Mon. (behavioral) 5.08 0.91 -.10 .06 .12 .10 .14 .04 .13 .12 (.81)
10. Clan strength 4.12 1.49 -.01 .11 .17 .15 .36** .05 -.20 .61** .08 _
11. Entrepren. Strength 4.11 1.35 .03 .07 .09 .22* .32** .08 -.33** .40** .05 .35** _

100
TABLE 16 (Continued)
Variable M S.D. 1 2 3 4 5 6 7 8 9 10 11
12. Market strength 4.89 1.51 .13 -.07 .01 .18 .18 .33** .04 .40** -.09 .34** .42**
13. Hierarchy strength 4.42 1.51 .06 -.10 .22* .12 -.03 .06 .44** .19 .07 .26** -.14
14. SD (clan) a 1.25 0.46 .14 -.07 .03 .10 -.10 -.05 -.04 -.12 -.03 -.15 .01
15. SD (entrepreneurial) a 1.33 0.66 -.22 -.04 .34** .04 .01 .09 -.19 .01 -.11 .18 .29*
16. SD (market) a 1.09 0.42 -.16 .02 .22 .15 .11 -.03 .06 .02 .02 .16 -.08
17. SD (hierarchy) a 1.25 0.53 -.13 .03 .05 -.14 .08 .12 -.02 -.07 -.24* -.10 .05
18. Helping Behavior 5.77 1.42 .27* -.13 -.01 .05 -.05 -.03 .03 -.14 -.11 .00 -.11
19. Innovative Behavior 5.69 1.16 -.06 -.03 .11 -.12 -.20 -.04 .10 -.01 -.04 -01 -.13
20.Achievement Behavior 4.95 1.32 .08 -.04 .06 -.07 -.10 -.02 .10 .12 .11 -.04 -.05
21. Compliant Behavior 4.48 0.91 .26* .02 -.13 .06 .04 -.05 .02 .18 -.14 .17 .20

101
TABLE 16 (Continued)
Note. For a N=70.
Variable M S.D. 12 13 14 15 16 17 18 19 20 21
12. Market strength 4.89 1.51 _
13. Hierarchy strength 4.42 1.51 .21 _
14. SD (clan) a 1.25 0.46 -.14 .01 _
15. SD (entrepreneurial) a 1.33 0.66 .20 -.03 .28* _
16. SD (market) a 1.09 0.42 -.16 .14 .03 .27* _
17. SD (hierarchy) a 1.25 0.53 .06 -.24* .11 .28* .18 _
18. Helping Behavior 5.77 1.42 .03 .04 .01 -.19 .07 .00 (.85)
19. Innovative Behavior 5.69 1.16 -.16 .04 -.06 .05 .04 -.06 .44** (.93)
20.Achievement Behavior 4.95 1.32 -.14 -.06 -.15 -.10 -.15 -.06 .18 .43** (.84)
21. Compliant Behavior 4.48 0.91 .24* .13 -.12 -.04 -.23 .06 -.14 -.18 .10 (.79)

102
Table 17: Relationships between Roles and Behaviors (supervisor ratings)
H2a & H2d H2b & 2c H2e & H2h H2f & H2gHelping Behavior Achievement
BehaviorInnovative Behavior
CompliantBehavior
Predictors(Roles)
Step 1 Model 1(Step 2)
Model 2(Step 2)
Model 1 Model 2 Model 1 Model 2
Step 1 Model 1(Step 2)
Model 2
Gender .27* .26*
Helping -.10 -.07Innovative -.20 .06Achievement -.02 -.02Compliant .10 .04Total R2 .07 .08 .07 .01 .00 .04 .01 .07 .07 .07∆R2 (∆F) .07
(6.52*).01
(.51).07
(.04).01
(.39).00
(.05).04
(3.56).01
(.88).07
(5.89*).00
(.28).00
(.11)
Note. N=86. * p < .05; ** p < .01 .

103
In hypotheses 4a –4h, I proposed that culture strength would moderate the linkage
between roles and behavior such that under a perception of strong culture, roles will be
more strongly related to respective behaviors. The theoretical reasoning was not
statistically supported using coworker ratings as none of the interaction terms reached
statistical significance. In addition, the interaction results for strength as agreement on
each of the culture dimensions were not supported either. The regression results are
displayed in table 18 & 19.
I tested hypotheses 4a –4h also using the supervisor ratings of behavior. There
was one significant interaction term between market strength and achievement role on
ratings of helping behavior (hypothesis 4d: β = -.28, p< .01). I plotted the interaction in
line with existing guidelines by using +1SD and –1SD from the means of the independent
variables as anchor values to represent the high and low values (Aiken & West, 1991).
The shape of the interaction showed that with the increase of market strength
achievement role had a stronger negative impact on supervisor ratings of help. In
addition, there was an unexpected positive relationship between achievement role and
help when market strength was low. The theoretical reasoning was not statistically
supported for the other hypotheses. The interaction results for strength as agreement on
each of the culture dimensions were not supported either. The regression results are
displayed in table 20 & 21. The interaction is graphically presented in figure 6.

104
Table 18: Interaction between Culture Strength and Roles on Behaviors (coworker ratings)
H4a: Helping Behavior H4b: AchievementBehavior
H4c: AchievementBehavior
H4d: Helping Behavior
Predictors/ Dependent variables
Step 1 Step 2 Step 3 Step 1 Step 2 Step 1 Step 2 Step 1 Step 2Helping Role .05 -.03Clan strength .09 .06Achievement Role -.10 -.05Market strength .00 .08Help Role x Strength -.08 .05Achievement Role x Strength -.02 .05R2 .01 .02 .00 .01 .01 .01 .01 .01∆R2 (∆F) .01
(.61).01
(.67).00
(.21).01
(.27).01
(.53).00
(.04).01
(.33).00
(.30)Predictors/Dependent variables
H4e: Innovative Behavior H4f: Compliant Behavior
H4g: Compliant Behavior
H4h: Innovative Behavior
Step 1 Step 2 Step 3 Step 1 Step 2 Step 1 Step 2 Step 2 Step 3Job Type .26**
Innovative role .14 -.32**
Entrepreneurial strength -.03 .05Compliant Role .12 -.03Hierarchy strength .05 -.06Innovative x strength .02 .08Compliant x strength .03 -.18R2 .07 .08 .08 .09 .10 .02 .00 .07 .10∆R2 (∆F) .07
(7.58**).01
(.94).00
(.05).09
(5.44**).01
(.73).02
(.98).02
(.06).00
(.30).03
(3.16)

105
Table 19: Interactions between Roles and Strength (agreement) on Behaviors (coworker ratings)
H4a: Helping Behavior H4b:AchievementBehavior
H4c: AchievementBehavior
H4d: Helping Behavior
Predictors/ Dependent variables
Step 1 Step 2 Step 3 Step 1 Step 2 Step 1 Step 2 Step 1 Step 2Helping Role .11 .01SD Clan -.08 -.04Achievement Role -.04 .04SD Market -.14 -.02Help Role x SD clan -.12 -.08 .09Achievement Role x SD market -.02R2 .02 .03 .00 .01 .02 .02 .00 .01∆R2 (∆F) .02
(.64).01
(1.2).00
(.07).01
(.50).02
(.90).00
(.04).00
(.12).01
(.65)Predictors/Dependent variables H4e: Innovative Behavior H4f: Compliant
BehaviorH4g: Compliant
BehaviorH4h: Innovative
BehaviorStep 1 Step 2 Step 3 Step 1 Step 2 Step 1 Step 2 Step 2 Step 3
Job Type .32**
Innovative role .17 -.31**
SD Entrepreneurial -.11 .06Compliant Role .17 -.06SD Hierarchy .15 .04Innovative x SD entrepreneurial .04 .07Compliant x SD hierarchy -.06 -.03R2 .10 .14 .14 .10 .11 .04 .01 .11 .11∆R2 (∆F) .10
(10.06**).04
(1.93).00
(.12).10
(4.74**).01
(.51).04
(2.05).05
(.32).01
(.25) .00
(.08)Note. N=89. * p< .05; ** p< .01.

106
Table 20: Interaction between Roles and Culture Strength on Behaviors (supervisor ratings)
H4a: Helping Behavior H4b: AchievementBehavior
H4c: AchievementBehavior
H4d: Helping Behavior
Predictors/ Dependent variables
Step 1 Step 2 Step 3 Step 1 Step 2 Step 1 Step 2 Step 1 Step 2Gender .27*
Helping role .04 -.06Clan strength .00 -.04Achievement role .03 .00Market strength -.16 -.02Help role x clan strength -.10 -.03Achievement role x market strength .04 -.28**
R2 .07 .07 .08 .01 .01 .02 .02 .07 .15∆R2 (∆F) .07
(6.52*).00
(.07).01
(.87).01
(.27).00
(.08).02
(.98).00
(.12).00
(.02).08
(7.36**)
Predictors/Dependent variables H4f: Compliant Behavior H4e: Innovative Behavior
H4g: Compliant Behavior
H4h: Innovative Behavior
Step 1 Step 2 Step 3 Step 1 Step 2 Step 2 Step 3 Step 1 Step 2Gender .26*
Innovative role .00 -.22Entrepreneurial strength .18 -.07Compliant role -.03 .10Hierarchy strength .15 .00Innovative x strength -.07 -.17Compliant x strength .04 -.08R2 .07 .10 .10 .05 .07 .08 .08 .01 .02∆R2 (∆F) .07
(5.89*).03
(1.53).00
(.43).05
(1.96).02
(2.62).01
(.81).00
(.15).01
(.44).01
(.47)

107
Table 21: Interactions between Roles and Agreement on Behaviors (supervisor ratings)
H4a: Helping Behavior H4b: AchievementBehavior
H4c: AchievementBehavior
H4d: Helping Behavior
Predictors/ Dependent variables
Step 1 Step 2 Step 3 Step 1 Step 2 Step 1 Step 2 Step 1 Step 2Gender .23*
Helping Role .08 -.04SD Clan -.03 -.14Achievement Role -.05 -.06SD Market -.15 .11Help Role x SD clan -.09 .07Achievement Role x SD market -.07 -.08R2 .05 .06 .07 .02 .02 .03 .03 .07 .07∆R2 (∆F) .05
(3.84*).01
(.25).01
(.51).02
(.73).00
(.34).03
(.89).00
(.28).02
(.55).00
(.44)Predictors/Dependent variables H4f: Compliant Behavior H4e: Innovative
BehaviorH4g: Compliant
BehaviorH4h: Innovative
BehaviorStep 1 Step 2 Step 3 Step 1 Step 2 Step 2 Step 3 Step 1 Step 2
Gender .25*
Innovative role .02 -.28*
SD Entrepreneurial .04 .05Compliant role .03 .16SD Hierarchy .09 -.06Innovative x SD entrepreneurial .00 -.20Compliant x SD hierarchy .00 -.03R2 .06 .06 .06 .08 .12 .07 .01 .03 .03∆R2 (∆F) .06
(4.57*).00
(.06).00
(.00).08
(2.98).04
(2.88).01
(.33).00
(.00).03
(.99) .00
(.06)

108
Figure 6: Interaction between Achievement Role and Market Strength
Hypotheses 6a-6h and hypotheses 8a-8h, which posited that self-monitoring (behavioral)
and P-O fit would act, as moderators of the proposed relationships between roles and
behaviors (coworker rated) were also not supported. None of the interaction terms was
significant. Therefore, the empirical results did not demonstrate support for the proposed
relationships. Table 22 and 23 display the regression results for coworker ratings.
Finally, Hypotheses 6a-6h and hypotheses 8a-8h, which posited that self-
monitoring (behavioral) and P-O fit would act as moderators of the proposed
relationships between roles and behavior were not supported using supervisor ratings
either. None of the interaction terms was significant. Therefore, the empirical results did
not demonstrate support for the proposed relationships. Table 24 and 25 present the
regression results with supervisor ratings.
5.3
5.4
5.5
5.6
5.7
5.8
5.9
6
6.1
6.2
Low High
Achievement role
HelpingBehavior
Low market strength
High market strength

109
Table 22: Interaction Results for Roles and Self-monitoring (behavioral) on Behaviors (coworker ratings)
H6a: Helping Behavior H6b:AchievementBehavior
H6c: AchievementBehavior
H6d: Helping Behavior
Predictors/ Dependent variables
Step 1 Step 2 Step 3 Step 1 Step 2 Step 1 Step 2 Step 1 Step 2Helping role .06 -.04Self-monitoring .02 .12 .13 .03Achievement role -.11 -.03Helping Role x self-monitoring -.14 -.08Achievement Role x self-monitoring
-.05 .06
R2 .00 .02 .01 .01 .03 .03 .00 .00∆R2 (∆F) .00
(.23).02
(1.86).01
(.79).01
(.72).03
(1.40).00
(.26).00
(.08).00
(.35)Predictors/Dependent variables H6e: Innovative Behavior H6f: Compliant
BehaviorH6g: Compliant
BehaviorH6h: Innovative
BehaviorStep 1 Step 2 Step 3 Step 1 Step 2 Step 1 Step 2 Step 2 Step 3
Job Type .26**
Innovative role .11 -.32**
Self-monitoring .09 .07 .01 .11Compliant role .13 -.07Innovative role x self-monitoring -.16 -.05Compliant role x self-monitoring -.12 .11R2 .07 .09 .12 .10 .10 .02 .03 .08 .09∆R2 (∆F) .07
(7.58**).02
(1.35).03
(3.03).10
(5.64).00
(.25).02
(.87) .01 (1.6)
.01(.91)
.01(1.24)

110
Table 23: Interaction Results for Roles and P-O fit on Behaviors (coworker ratings)
H8a: Helping Behavior H8b:AchievementBehavior
H8c: AchievementBehavior
H8d: Helping Behavior
Predictors/ Dependent variables
Step 1 Step 2 Step 3 Step 1 Step 2 Step 1 Step 2 Step 1 Step 2Helping role .05 -.04P-O fit .06 .09 .09 .07Achievement role -.11 -.03Helping Role x P-O fit -.10 .07Achievement Role x P-O fit .08 .11R2 .01 .02 .01 .01 .02 .03 .01 .02∆R2 (∆F) .01
(.38).01
(.98).01
(.37).00
(.42).02
(.95).01
(.73).01
(.30).01
(1.23)Predictors/Dependent variables H8e: Innovative Behavior H8f: Compliant
BehaviorH8g: Compliant
BehaviorH8h: Innovative
BehaviorStep 1 Step 2 Step 3 Step 1 Step 2 Step 1 Step 2 Step 2 Step 3
Job Type .26**
Innovative role .16 -.31**
P-O fit -.12 .10 .01 -.07Compliant role .13 -.06Innovative role x P-O fit .05 .12Compliant role x P-O fit -.07 .03R2 .07 .10 .10 .10 .12 .02 .02 .07 .07∆R2 (∆F) .07
(7.58**).03
(1.58).00
(.24).10
(5.88).02
(1.64).02
(.87).00
(.54).00
(.44).00
(.00)

111
Table 24: Interaction Results for Roles and Self-monitoring (behavioral) on Behaviors (supervisor ratings)
H6a: Helping Behavior H6b: AchievementBehavior
H6c: AchievementBehavior
H6d: Helping Behavior
Predictors/ Dependent variables
Step 1 Step 2 Step 3 Step 1 Step 2 Step 1 Step 2 Step 1 Step 2Gender .27*
Helping Role .05 -.08Achievement Role -.03 -.02Self-monitoring -.09 .12 .11 -.08Help Role x self-monitoring -.01 .07Achievement Role x self-monitoring
-.03 -.12
Total R2 .07 .08 .08 .02 .02 .01 .01 .08 .09∆R2 step (∆F) .07
(6.52*).01
(.42).00
(.01).02
(.75).00
(.38).01
(.51).00
(.09).01
(.33).01
(1.24)Predictors/Dependent variables H6f: Compliant Behavior H6e: Innovative
BehaviorH6g: Compliant
BehaviorH6h: Innovative
BehaviorStep 1 Step 2 Step 3 Step 1 Step 2 Step 2 Step 3 Step 1 Step 2
Gender .26*
Innovative role .07 -.20Compliant Role .05 .11Self-monitoring -.10 -.01 -.10 -.05Innovative x self-monitoring .00 .05Compliant x self-monitoring .03 -.13R2 .07 .08 .08 .04 .04 .08 .00 .01 .03∆R2 (∆F) .07
(5.89*)01
(.60).00
(.00).04
(1.78).00
(.22).01
(.48).00
(.10).01
(.55) .03
(1.34)

112
Table 25: Interaction Results for Roles and P-O fit on Behaviors (supervisor ratings)
H8a: Helping Behavior H8b: AchievementBehavior
H8c: AchievementBehavior
H8d: Helping Behavior
Predictors/ Dependent variables
Step 1 Step 2 Step 3 Step 1 Step 2 Step 1 Step 2 Step 1 Step 2Gender .27*
Helping Role .07 -.09Achievement Role -.03 -.01P-O fit -.16 .11 .10 -.15Help Role x P-O fit -.10 -.01Achievement Role x P-O fit .00 -.11Total R2 .07 .10 .11 .02 .02 .01 .01 .09 .11∆R2 step (∆F) .07
(6.52*).03
(1.23).01
(.90).02
(.73).00
(.00).01
(.45).00
(.00).02
(1.02).02
(1.00)Predictors/Dependent variables H8f: Compliant Behavior H8e: Innovative
BehaviorH8g: Compliant
BehaviorH8h: Innovative
BehaviorStep 1 Step 2 Step 3 Step 1 Step 2 Step 2 Step 3 Step 1 Step 2
Gender .26*
Innovative role .01 -.21Compliant Role .04 .13P-O fit .19 .04 .19 -.01Innovative x P-O fit -.16 -.09Compliant x P-O fit .13 -.11Total R2 .07 .10 .13 .04 .05 .10 .12 .01 .02∆R2 (∆F) .07
(5.89*).03
(1.64).03
(2.22).04
(1.86).01
(.60).03
1.70).02
(1.40).01
(.44).01
(.98)
113
Summary of results
The empirical results lend some support to the overall theoretical framework.
Building on a contextual and social cognitive perspective on roles, I expected that the
organizational context as evidenced in the organizational culture, would relate to
employee role perceptions. Three of the four dimension of culture, exhibited relationships
in the predicted direction with employee roles supporting many of the proposed
relationships in hypothesis 1. Specifically, market culture was positively related to
achievement role, thereby, supporting the link between a market-oriented, competitive
culture and employee perceiving that high performance is required of them. In addition,
the entrepreneurial culture generated innovative employee roles and discouraged high
levels of compliant, rule-oriented role. Finally, hierarchy culture exhibited a negative link
with innovative role orientation, such that employees in entrepreneurial context tended to
perceive following the rules, and well-established procedures as less in-role. The
relationships between clan culture and helping role, and achievement role were not
supported. Finally, market culture had no linear relationship to perceptions of helping as
in-role.
Hypothesis 2 concerned the relationship between roles and employee behaviors. I
relied on role theory and the social cognitive theory to predict that roles will be linked
positively to functional and negatively, to dysfunctional behaviors. Only one of the
proposed relationships reached statistical significance—specifically, innovative role had
a significant, negative link with compliant behavior. The other theoretically developed
relationships did not receive empirical support.

114
In hypothesis 3, I proposed that culture strength would act as a moderator of the
relationships between culture and roles. In two cases, the interaction effects were
significant. There was a negative relationship between clan culture and achievement
(high performance) role, when both the level of clan culture and culture strength were
high. Finally, hierarchy culture and hierarchy culture strength seemed to have
substitutable effects on the level of compliant role perceptions.
In hypothesis 4, on the basis of social conformity perspective, I predicted that
roles would be more related to expected behaviors in stronger cultures. Only one of the
proposed relationships received statistical support. Employees with achievement role
orientation who perceived the culture of the organization as strongly reinforcing the
dimension of external competitiveness (i.e. had strong market culture) were viewed as
less helpful by their supervisors.
Hypothesis 5 posited that self-monitoring will impact the extent to which
individuals incorporate the organizational culture in their roles. None of the relationships
received empirical support. One of the interaction terms was, in fact, significant but in a
different from the predicted direction. Hypothesis 6, in which I suggested that self-
monitoring will enhance the relationships between roles and exhibited behaviors, was
also not supported.
For hypothesis 7, P-O fit interacted with culture in such a way that individuals
who experienced high fit and were in a highly market-oriented environment, were
increasingly likely to perceive helping as less in-role than individuals who had high fit
but were in organizations with less market-oriented cultures. Hypothesis 8, which
proposed that perceived fit would enhance the enactment of organizational roles, was not

115
supported. Table 26 summarizes the nature of the proposed relationships and the
empirical results.
Table 26: Summary of Results
Hypothesis Number
(H #)
Nature of the proposed relationship Supported
Relationships
H1 a, b, c, d, e, f, g, h Relationships between culture and roles H1 c, e, f, h
H2 a, b, c, d, e, f, g, h Relationships between roles and behaviors H2 f
H3 a, b, c, d, e, f, g, h Interactions between culture and culture
strength on roles
H3 b & g
H4 a, b, c, d, e, f, g, h Interactions between roles and culture
strength on behaviors
H4 d
H5 a, b, c, d, e, f, g, h Interactions between self-monitoring
(cognitive) and culture on roles
Not supported
H6 a, b, c, d, e, f, g, h Interactions between self-monitoring
(behavioral) and roles on behavior
Not supported
H7 a, b, c, d, e, f, g, h Interactions between P-O fit and culture on
roles
H7 d
H8 a, b, c, d, e, f, g, h Interactions between P-O fit and roles on
behaviors
Not supported

116
Chapter 6: Discussion
Relationships between Culture and Roles
The purpose of my thesis was to explicate the relationship between culture and a
variety of employee behaviors. Past research has examined employee behaviors from a
range of perspectives including social exchange and fairness (Blau, 1964; Liden et al.,
2000; Masterson et al., 2000; Wayne et al., 1997). The role of organizational culture as a
potent environmental stimulus has, however, remained largely unexplored (Tesluk et al.,
2002). This research, therefore, focused on attempting to understand the role of
organizational culture in informing and energizing specific employee behaviors through
cognitive perceptions. To achieve this goal, I focused on the competing values model of
organizational culture, which depicts organizations as having to manage competing
demands: efficiency versus flexibility, and internal versus external orientation (Cameron
& Quinn, 1999). This typology posits that organizations pursue different and at times,
competing ends.
The first part of my model suggested that organizational culture would have an
impact on employee role perceptions of organizational expectations. While this
proposition in itself seems relatively intuitive, the extant literature has not tested the
presence of a cognitive mechanism relating the organizational context to individual
employee behaviors, including aspects of citizenship behavior (Organ, 1988). The
findings of this study indeed indicate that culture is related to what individuals perceive
to be the expectations their organizations have of their role. For instance, individuals in
market-oriented cultures reported that they perceived emphasis on high achievement as
part of their expected role. By comparison, highly entrepreneurial cultures were

117
positively associated with perceptions of innovative role while negatively associated with
perceptions that the work role focus of an individual should be on efficiency and
compliance. Cultures that maintained a focus on hierarchy and rules, on the other hand,
were positively, albeit insignificantly, related to perceptions of a compliant role
orientation, while negatively related to innovative role orientation. These findings suggest
that organizations undoubtedly influence the role perceptions of individuals working in
the organization via their management philosophies and espoused values.
Only one aspect of culture—the clan culture, did not appear to be related to
employee perceptions of helping role. The lack of relationship between clan culture and
a helping role may suggest that cognition is not as important for certain aspects of
culture. Therefore, this non-finding may convey the importance of emotional and other
non-cognitive factors such as affective attitudes as more important for helping. Some of
the extant literature corroborates this logic in the sense that relational quality and mood
have both been confirmed as predictors of helping as a form of OCB over and above
fairness cognitions (George, 1991; Wayne et al., 1997).
In this study, interestingly, company experience was a positive predictor of a
helping orientation, suggesting that more experienced workers, were more likely to
possess a helping role orientation. This finding is not surprising because workers who
have been around for longer can also be expected to “know the ropes” in the organization
better, and to be more capable of helping their fellow employees. Employees with less
company experience, by comparison, might be too busy making sense of their
environment and might, as a result, fail to perceive that they should be helping their
coworkers.

118
Working in an organization with a clan culture was also unrelated to achievement
role, failing to support the competing aspects of the clan and market oriented aspects of
culture. The competing values framework (Cameron & Quinn, 1999) suggests that the
market and clan quadrant are opposite to each other. However, as the results indicate this
may not be the case. Specifically, the market aspect in the competing values framework is
captured in the degree to which an organization emphasizes achievement and winning in
the marketplace. Thus, the non-cooperative aspects of competition are emphasized on the
outside of the organization but not necessarily on the inside.
Similarly, while market culture was associated with individuals being more likely
to hold an achievement role, it was not negatively related to a helping orientation. Taken
together, the results for clan and market culture suggest that the focus of competition
(internal versus external) is important in understanding the relationships between culture,
roles, and behaviors. The competing values framework examines external focus on
competition. This type of competition is not intrinsically opposite to cooperation
(helping) within the organization. In fact, it may even be conducive to help when the
identity of the external group is pitted against the identity of the internal group (Ashforth
& Mael, 1989; Turner, 1981).
This conclusion is in line with the predictions of a different culture inventory,
namely the organizational culture inventory (Cooke & Rousseau, 1988), wherein high
achievement roles are inherent in a constructive culture environment, which also
emphasizes cooperation in the attainment of goals. In contrast, the competitive norms in
the organizational culture inventory highlight the less functional competitive aspects of
culture. Therefore, the market and clan aspects of the competing values framework may

119
need to be re-conceptualized to reflect the fact that they are not opposed to each other in
terms of the types of roles and behaviors they encourage from employees. Specifically,
the clan and market culture are not opposite to each other in a correlational sense.
Moreover, I do not find evidence that they have opposite signs in predicting criteria of
interest (criterion validity). Thus, my analysis does not provide support for the competing
aspects of the market and clan aspects of culture.
Culture strength was proposed as a moderator between culture and roles (Martin,
1992). The results suggest that the perception of a shared and reinforced culture around a
specific dimension of proffered culture norms had an impact on the employee role
perceptions in some situations. For instance, individuals in high clan contexts who also
felt that cooperativeness and cohesion were valued and shared by their coworkers
perceived that high individual achievement is not part of their expected role at work. This
finding may suggest that while clan culture is not contradictory to setting high
performance goals for achievement, it becomes dysfunctional for high achievement
expectations when both the overall management philosophy and the strength of norms
emphasize teamwork and cooperativeness. The interaction between hierarchy culture and
strength around rules and regulations indicated that these two aspects of culture seem to
be substitutable in the sense that the lowest perceptions of compliant role were observed
at the low end of strength and culture. The other proposed interactive relationships
involving culture and culture strength were not statistically significant.
It is also worth noting that I only found significant interactions by using a direct
measure of strength, asking participants to assess the level of culture strength. Compared
to the indirect standard deviation approach used in the climate research (Schneider et al.,

120
2002), the direct measure proved to have greater utility for my outcomes of interest.
Based on my results, I’d recommend that construct validation would be an important
aspect of using indirect measures of strength instead of assuming the meaning that they
carry. According to the correlation tables from two of the sub-samples I used, the
standard deviations were mostly not significantly related to the direct measures of
strength (correlations ranging from .01 to -.28).
Only in the case of market culture and hierarchy culture, the standard deviations
were negatively related to the respective measures of strength (-.28, p< .05 & -.24, p<
.05), suggesting that the level of disagreement on market culture had a negative
association with a direct measure of culture strength on the same dimension. However,
there is also a positive association between the standard deviation on entrepreneurial
culture and entrepreneurial culture strength (.29, p< .05), in contrast to what would be
theoretically expected. There may be several theoretically viable explanations of the
observed relationships. Specifically, it is possible that the high standard deviation on
entrepreneurial culture reflects the presence of very high and very low scores on
entrepreneurial culture. Hypothetically, if the focal employees who provided the direct
measure of strength were consistently in agreement with the coworkers who provided the
higher ratings on entrepreneurial culture, this tendency would be reflected in a positive
correlation between the standard deviation and the direct measure of strength. In addition,
the low number of coworkers who provided ratings of culture resulted in lower reliability
of their ratings.
Given the overall inconsistency in the findings with respect to strength as a
standard deviation and strength as agreement, it seems warranted for future research in

121
this area to further refine and include direct measures of strength, as well as to employ
alternative indices of variability (Harrison & Klein, 2005) besides the standard deviation.
For instance, multidimensional conceptualizations of strength aligned with the
organizational context can be employed to capture a more fine-grained picture of the
nature and impact of strength within organizations. Moreover, with respect to statistical
approaches to measuring strength, Harrison & Klein (2005) have recently advocated the
importance of perusing dispersion indices that are precisely aligned with the theoretical
propositions. In this case, the use of standard deviation is what the literature recommends
(Schneider et al., 2002; Harrison & Klein, 2005) but given its weak construct validity
found in this thesis, further consideration seems warranted.
I had also proposed that the cognitive aspect of self-monitoring (sensitivity to the
expressive behavior of others) and perceived fit with the organization would influence the
extent to which individuals align culture norms with their perceptions of organizational
work role expectations. One of the proposed relationships with respect of self-monitoring
reached statistical significance. Self-monitoring emerged as a moderator of the
relationship between entrepreneurial culture and compliant role. However, the shape of
the interaction suggested the presence of an association that was different from the
proposed relationship. In particular, higher self-monitors perceived higher compliant
roles regardless of the context while lower self-monitors adjusted their perceptions more.
While the extant literature on self-monitoring has traditionally suggested that high
self-monitors behave like chameleons frequently adopting behaviors and perceptions that
suit the requirements of a specific context (Snyder, 1974; 1986), the results of this study
indicate that self-monitors may be more likely to enlarge their roles in spite of the

122
specific context. Examining the inter-correlations between self-monitoring the role
perceptions also reveals that self-monitoring has an overall positive impact on all aspects
of work role perceptions (reaching statistical significance with respect to compliant role
perceptions). If the statistical correlations are taken literally, the significance of the
positive association between the cognitive aspect of self-monitoring (sensitivity to the
expressive behavior of others) and compliant role may indicate that high self-monitors
are particularly prone to perceiving rules and regulations as part of their role. It may be
the case that cognitive self-monitoring is exclusively concerned with other individuals
rather than the overall context. In addition, the empirical results did not lend support to
the role of behavioral self-monitoring (ability to modify self-presentation) in enacted
expected roles. Although the lack of results must be interpreted with caution in view of
the possible data flaws as described in this discussion, it suggests that more attention
should be devoted to better understanding what aspects of personality (such as self-
monitoring) have more predictive validity. In sum, it seems warranted to gain a better
understanding of how and why self-monitoring at work as is sometimes viewed as a
component of employee effectiveness, and if indeed it is equally important in every work
environment (Mehra et al., 2001).
Perceived fit had a moderating effect on the relationship between market culture
and helping role perceptions such that in the presence of low norms for external
competitiveness, individuals with higher fit perceived helping others as more in-role than
those with low fit, with this effect evening out at the high end of market culture. The
interaction shape, thus, suggests that overall, individuals with high fit were influenced by
the market context in perceiving help as part of their role.

123
The other proposed interaction effects did not reach statistical significance
(although some of them were close to the .05 threshold). For instance, the interaction
term between clan and perceived fit had a negative influence on achievement role
perceptions and was close to reaching statistical significance (p < .10). The negative
coefficient suggests that when both perceived fit and clan culture are high or low (in the
presence of non-significant main effects for the interaction step), individuals tend to
perceive high achievement as less expected of their role in the organization, thereby
supporting the logic outlined in hypothesis 7b.
Relationships between Roles and Behavior
The second part of the model examined roles as predictors of behavior and
possible boundary conditions (Biddle, 1979). I conducted analysis with both coworkers
and supervisors as a source. The logic for using coworkers was that they are more likely
to be able to directly observe the everyday activities, and behaviors of the focal person
than supervisors (Murphy & Cleveland, 1990; Pollack & Pollack, 1996). Surprisingly,
very few of the proposed relationships were realized. Specifically, innovative role had a
strong negative relationship with compliant behaviors (coworker perspective), and both
compliant and innovative roles had links in the predicted direction with compliance and
innovation but they did not reach statistical significance. Overall, this suggests a weak
pattern of results in relating roles to behaviors, which may be rooted in under-specified
theory or in empirical problems.
From a theoretical perspective, the lack of relationships would suggest the
presence of moderators that act as boundary conditions determining the extent to which
individuals enact expected roles. From an empirical point of view, there may be many

124
factors which might account for the non-significant relationships, among them low
statistical power or inaccurate ratings. Given the number of aggregate coworker and focal
pairs (N=107), weak relationships are not likely to reach statistical significance.
Specifically, the power to detect a correlation of moderate magnitude significantly
different from 0 in the population at p< .05 (e.g., r= .20) with a sample number of
respondents equal to 107 is equal to approximately .55 (Cohen, Cohen, West, & Aiken,
2002). In other words, type I error (the rejection of the null hypothesis when it is false) is
9 times more important than type II error (the failure to reject the null hypothesis/detect
significant effects). For a desired a power of .90 under the same parameter
specifications, 258 subjects would be required. 5
Moreover, the ratings provided by coworkers may also be biased by social
desirability or inaccuracy in spite of the researcher’s attempts to minimize biases.
Specifically, only cases who reported being familiar with the behaviors of the focal
employee were considered, and the raters were assured of the confidentiality of their
feedback, as well as its developmental rather than evaluative purposes, which could be
expected to result in higher truthfulness and reliability of the ratings (Pollack & Pollack,
1996). However, the focal employees were asked to select their raters, which is likely to
have resulted in their selection of friends who may provide inflated ratings (Murphy &
Cleveland, 1990).
The relationships between roles and supervisors’ ratings of behaviors were not
significant and, in fact, sometimes were opposite of their predicted direction. For
instance, innovative role had a negative albeit not significant relationship with supervisor
5 The importance of type I error relative to type II error may be judged by calculating the ratio of (1-power)/significance level (in this case, (1-.55)/.05.

125
ratings of innovative behavior. This pattern of results may be attributed to similar
theoretical and empirical causes as in the case of the coworker ratings. However, in the
case of supervisors, there is an even stronger potential for inaccuracy due to lack of
intimate knowledge with the focal employees’ daily behaviors or due to a “halo” bias,
and inaccuracy of the behavioral/performance ratings (Cardy & Dobbins, 1986; Feldman,
1981; Kozlowski & Kirsch, 1987; Lefkowitz, 2000; Longenecker, Sims, & Gioia, 1987;
Murphy & Balzer, 1986).
In the next stage, I tested the theoretically proposed interactions. Only one
interaction emerged as a significant predictor of the outcome behaviors. Specifically,
achievement role and market strength interacted so that when the culture was perceived
as strongly market-oriented, and individuals perceived that they were expected to
aggressively strive for strong individual performance results, their overall level of helping
decreased as rated from the supervisor perspective. Overall, the inability to detect other
significant interaction results may be partly attributed to the low sample size (lower
statistical power), and the documented difficulty in obtaining theoretically viable
interaction results in field settings (Champoux & Peters, 1987; Chaplin, 1991; West,
Biesanz, & Pitts, 2000).
Implications
Theoretical. The main theoretical contribution of this thesis is that it examines
organizational culture as a predictor of employee roles and behaviors. The results provide
support for most of the proposed relationships between the overall espoused
organizational culture and employee role perceptions. From a theoretical standpoint, this
suggests that the extent to which a behavior is viewed as in-role or extra-role is likely to

126
depend on the overall context (Morrison & Phelps, 1999; Organ, 1988). Therefore, future
studies may need to go beyond social exchange in explaining organizational citizenship
behaviors, or prosocial behaviors (Morrison, 1994; Wayne et al., 1997), and may need to
consider the role of espoused management philosophies in informing employees’ roles
and behaviors. The contextual perspective on employee roles and behaviors does not
negate a social exchange view but rather complements it. Specifically, it suggests
overarching contextual factors, which may provide additional explanatory power in
predicting employees’ cognitions and behaviors.
The difficulty in obtaining results linking roles to behaviors, on the other hand,
suggests that further theoretical exploration is needed to detect what contributes to
individuals enacting their expected roles. The literature on roles suggests that individuals
socialized in a certain context are likely to enact an expected role (Biddle, 1979).
However, the results indicate that a more complex view on the relationships between
roles and behaviors is warranted in an organizational context. Given the complexity of
the organization as a system, perhaps it is not surprising to find that the relationships I
expected did not hold, when considered in isolation from other relevant factors.
Specifically, given that the organizational level is more distant than other levels (such as
the group or team level, or that of the immediate supervisor expectations), organizational
expectations may not be linearly related (or may be unrelated) to observed behaviors due
to intervening factors on intermediate levels (Chan, 1998; Chen, 2005; Gully,
Incalcaterra, Joshi, & Beuabien, 2002; Scott & Bruce, 1994).
Another theoretical implication emanates from the low inter-correlations between
peer and supervisor ratings of behaviors. Perhaps, rigorous research pointing out the
127
causes for rating-source differences and validity of different source ratings would
contribute to our understanding of the benefits of 360-degree feedback efforts, and the
employee behavior/performance appraisal process. The literature on 360-degree feedback
suggests that peers may be in a better position to observe the interpersonal behaviors of
their colleagues, while supervisors may be more apt at rating behaviors directly related to
performance results (Murphy & Cleveland, 1990). In addition, some of the extant
literature points out that the correlations between peers and supervisors are typically high
(e.g. .62 according to meta-analysis by Harris & Schaubroeck, 1988) but this was not the
case in this study. Therefore, a careful theoretically driven examination of the effects of
rater on assessed behaviors seems warranted for enhancing our overall understanding of
the appraisal process.
Applied. The results of this study indicate that culture is an important tool in
shaping employee cognitive roles with respect to what is expected of them in the work
environment. Therefore, organizations seeking to emphasize innovation would be better
off maximizing the entrepreneurial elements in the organizational environment, while de-
emphasizing the extent of rules and regulations if they are to promote an innovative role
orientation. Likewise, organizations that want to encourage high achievement orientation
are likely to benefit from a market-oriented culture, supporting external competition.
Managers of such organizations are, thus, well advised to espouse an external-oriented
culture, and to emphasize achievement in their policies, and procedures. In addition, the
results indicate that maintaining a strong clan environment tends to de-emphasize the
achievement orientation of employees.

128
Overall, the findings suggest that accentuating certain aspects of the environment
while paying special attention to de-emphasizing others is likely to convey the desired
message more effectively to employees. Therefore, leaders should concentrate their
efforts on creating a system of policies that can be combined effectively to influence
employee perceptions of their roles at work. However, the findings also indicated a
difficulty in obtaining evidence for significant links between roles and behaviors. This
should alert leaders of organizations that there are additional factors, which influence the
extent to which employees behave in organizationally prescribed ways.
In addition, some of the findings also convey the importance of roles for
behaviors. For instance, an entrepreneurial role is likely to produce less compliant
behavior. This aspect is, perhaps, important for managers to understand in managing and
evaluating their employees’ performance levels, as they are likely to require some level
of compliance.
The study also has implications for 360-degree feedback efforts and the
management of employees’ competencies. Examining the relatively low correlations
between supervisors and coworkers on the same aspects of focal employee behaviors
(e.g. innovation) suggest that there are significant discrepancies in the way that managers
and peers perceive the focal employees. Therefore, it seems warranted for supervisors to
understand what is driving this difference in administering performance or competency
evaluations. While the differences in perspectives may be valid (Tornow, 1993), the
literature is not conclusive regarding the practical implications of these differences, and
how they should be incorporated in the developmental feedback that a lot of 360-degree
initiatives intend to provide.

129
One explanation for the difference in perspectives may be found in the schema
research. In this study, managers seemed to be more influenced by gender stereotypes
such that they perceived women as more helpful and more compliant than their male
counterparts (Kidder & McLean Parks, 2001). It is a well-established fact that supervisors
use schemas and short cuts in evaluating employees’ performance dimensions (Lord &
Foti, 1986; Park, Sims, & Motowidlo, 1986) but these short-cuts may need to be
reconsidered to the extent to which they create false impressions of exhibited behaviors.
Alerting managers to be more self-aware as well as administering, and taking into
account 360-degree feedback results, may help minimize some of these biases.
Limitations
As with any study, this one has some limitations. For instance, one of the
limitations is presented by its cross-sectional design. While there is a theoretical logic to
expect that relationships will flow in a certain directions (from culture to roles and from
roles to behaviors), having the measurements taken roughly in the same point in time
does not facilitate causal explanation. However, reverse-causality is not a very likely
explanation for the relationship between culture and cognitive roles as individual role
perceptions are unlikely to influence coworkers’ perceptions of culture. The direction of
the relationship between roles and behaviors also seem to be straightforward in terms of
theoretical reasoning. Therefore, while the possibility for reverse causality can’t be
completely rejected, it should not be a great concern for this study.
In addition, the number of respondents for some of the aggregate constructs was
relatively low, thus, contributing to lower group reliability values. For instance,
measuring culture from the perspective of roughly three employees may not be sufficient

130
to reliably capture the culture of the organization. At the same time, the agreement
between respondents coupled with the significant convergence between focal and
coworker perspective provides some assurance that I am capturing the underlying
phenomenon with a fair level of objectivity.
Another limitation of the study is its survey design using rating scale format.
Constructs measured through surveys tend to be influenced by rater errors and biases,
thus, introducing measurement error (Visser, Krosnick, & Lavrakas, 2000). However,
many of the research questions posed in this dissertation required the survey format (e.g.
employee behaviors). Objective assessments regarding those behaviors are difficult to
obtain. Furthermore, I assumed that ratings of behaviors are uniform across raters and
aggregated the ratings based on the aggregation statistics, which were sufficient to allow
aggregation. Naturally, the measures of behavior did not exhibit perfect agreement. While
statistically this is to be expected, theoretically, there may be important differences in
perspectives depending on a range of factors such as the quality of the relationship
between the rater and the ratee (Wayne et al., 1997). However, given my focus on the
context and cognitive role perceptions as drivers of behaviors, I expected sufficient level
of uniformity of behavior across raters.
Somewhat complicating the problem of obtaining valid ratings, was the fact that
focal individual was asked to select his/her raters because he/she was the point of contact
with the researchers. The selection process can, thus, be expected to have resulted in
rating inflation (Murphy & Cleveland, 1990). Obtaining a random sample of raters was
not plausible due to the design of the study. This limitation may be overcome by
collecting data as part of an organizationally endorsed 360-degree feedback initiatives,

131
which would require the managers to select a random sample of raters for each employee
(Pollack & Pollack, 1996).
In addition, with respect to the organizational culture measurement, there are two
perspectives recommending different methods of measurement. The emic measurement
tradition advocates qualitative, rich methods of measurement capturing the native point of
view (Denison, 1996), while the etic perspective promotes quantitative measurement.
Here, I adopted the etic perspective and I measured culture with a survey instrument. The
benefit of this measurement is that it allows the researcher to capture culture across many
different organizations (as in this case) and facilitates generalizability, while the emic
perspective usually suits better research conducted in a few organizations. However, the
drawback of the quantitative approach is that it imposes a theoretical framework on
organizational culture but forsakes the in-depth understanding of each individual culture
as well as the opportunity to develop new theory.On the other hand, while a qualitative
approach fosters the in-depth understanding of unique processes within each
organization, it may also limit the generalizability of findings obtained within each to a
different set of organizations. Therefore, the benefits of using a theoretically driven
quantitative approach seemed to outweigh the costs.
Finally, the focus on individual cognitive perceptions may be construed as a
limitation. Specifically, focusing on individual perceptions does not shed light on
understanding group processes, and how they are influenced by culture. It is however,
useful, for making inferences on the individual level that may in the future be further
researched and generalized to the group level.

132
Directions for Future Research
Role enactment. Based on the results, one notable area that needs further research
is the enactment of organizational roles. Overall, there was more consistent and stronger
evidence that culture communicates certain role expectations. The relationships between
roles and behaviors were not as pronounced, and often times, failed to reach statistical
significant. In addition, the moderating factors proposed here did not seem to be effective
in explaining variance in the outcomes of interest. Therefore, one gap that this research
leaves insufficiently explored is the linkage between roles and behaviors. In particular,
the question of how and why individuals enact expected roles needs further exploration.
Perhaps factors such as managers’ support for the organizational culture and
policies on a local level can be examined as moderators. From an agency theory
perspective (Eisenhardt, 1989), managers may not always act in the best interest of the
organization. The question of when and whether they support the higher-level
organizational policies on an ongoing basis within the organization as well as their
impact on role enactment remains to be explored.
To the extent to which eliciting desirable behaviors is important for long-term
organizational effectiveness (Katz, 1964), an implication of the difficulty in obtaining
relationships between roles and behaviors is for future research to seek ways to remedy
our understanding of the absence of these relationships. One promising approach would
be to engage in theory-inductive research in addition to the theory-deductive approach
(Beyer & Hannah, 2002; Strauss & Corbin, 1990). Qualitative research efforts may be
utilized to create a map of all potentially relevant constructs, which can be then tested
empirically. For instance, interviewing employees regarding the range of factors that

133
facilitate or discourage them from engaging in organizationally prescribed behaviors may
be a viable approach in identifying a comprehensive set of factors (Farh, Zhong, &
Organ, 2004). Based on the initial qualitative stage, a more precise set of quantitative
measures can be employed to test the expected relationships. This would be a more
rigorous method for conducting future research.
The role of individual level factors is also important. Specifically, further research
is needed in the areas of individual differences, and how they may influence the
enactment of organizational roles. For instance, innovative behavior may depend on the
creative self-efficacy of individuals (Tierney & Farmer, 2002), while help may be tied in
with altruism.
Multilevel lens. Another area that deserves further attention is the multilevel
mechanism leading to behaviors. Specifically, factors at all relevant levels such as
organizational, departmental, group, and individual may be examined to establish how
they co-act to determine behaviors. It may be appropriate to use fewer organizations for
this line of research to allow nested designs, and the in-depth analysis of multilevel
factors. For instance, it may be the case that organizational culture, group climate, and
individual level factors have both independent and synergistic influence on desired
behaviors (Scott & Bruce, 1994).

134
Conclusion
In this study, I explored the influence of organizational culture on employee roles
and behaviors. Analysis involving data collected from about a hundred different
organizations in a variety of industries provided support for the overall proposition that
culture shapes employee roles, and that, in some cases, roles lead to behaviors. These
findings have both practical and theoretical implications.
Specifically, the results lend support to the role that organizational leaders can
play in shaping the role orientations of employees through creating the right culture
environment. This phenomenon is evidenced in organizations such as Apple famous for
their innovative capacity, which is often times attributed to the culture that CEO Steve
Jobs has established.
Theoretically, the findings contribute to our overall understanding of roles and
behaviors at work. A large body of literature has accumulated arguing that citizenship
behavior at work is important, and is partially driven by roles and social exchange factors
in organizations (Wayne et al., 1997; Masterson et al., 2000; Morrison, 1994; Settoon et
al., 1996). At its core, good citizenship can be defined as roles and behaviors valued by
the organization.
Here, I advocated a culture perspective on roles and behaviors, which emphasized
the importance of organizational culture (and leadership) in defining what constitutes
good citizenship, as well as valued roles, and behaviors at work. Organizations
emphasizing innovation, for example, are also likely to induce innovative roles in their
employees, while de-emphasizing the value of compliant orientation. The cultural context

135
of the organization, therefore, can and should not be extricated from the definition and
motivation of valuable employee behaviors within organizations.

136
Appendices
Appendix A: Focal Questionnaire
Please, provide the following information.
Q1. What is your current (or most recent) job/title? ____________________________
Q2. Employment status? F- full time, P-part-time, N-non-employed.
Q3a. If you are working, how long have you had this job/position? Years &
Q3b. Months
Q4. Briefly describe the type of company you work for by choosing from the available
categories
___1__Service __2___ Manufacturing _3____ Education/Research/University
__4____ Oil/Chemical ___5__ High Tech ___6__ Communications
___7___ Consulting/Government Relations ___8__ Financial services/Banking
__9___ Healthcare __10___ Government __11___ Defense Contractor __12___
Military ; Other (please explain): __open ended____
Q5a. How long have your worked for your current company? Years &
5b. Months
Q6. Estimate the percentage of you time that you have spent working as part of a project
team (i.e., part of a group that has shared responsibility for some tangible outcome or
objective and where members are interdependent on each other for getting the task
complete) (min. 0- max.100 %) _______________
Q7. Please indicate your age in years. 1- below 25, 2: 26-35, 3: 36-45, 4: 46-55, 5: >55.
Q8. Please, indicate your gender, M: Male; F: Female.
Q9. Please, indicate your ethnic background by selecting from the categories below:

137
___1__White/Caucasian 2_ African American _3_ Native American/Indian
4__Asian 5_Hispanic/Latino __6 Indian Subcontinent/Pacific Islander
Other: __7_____
Please read all instructions carefully before completing the survey.
Organizational Culture (adapted from Cameron & Quinn, 1999).
Rating format: (1= strongly disagree; 2= disagree; 3=somewhat disagree; 4= neither
agree nor disagree; 5=somewhat agree; 6=agree; 7=strongly agree).
Note: Throughout the survey you will see the term “organization.” When you see this
term, please think of the highest level (e.g., work unit, division, department, directorate)
within your overall organization that is most meaningful to you in terms of how you
experience your organization’s culture.
Please respond to the following statements in terms of the degree to which they
accurately reflect your organization’s culture, as it currently exists.
1. This organization is a very personal place. It is like an extended family. People seem
to feel comfortable sharing their personal situations with colleagues.
2. The management style in this organization is characterized by teamwork, consensus,
and participation.
3. The “glue” that holds this organization together is loyalty and mutual trust.
Commitment to this organization runs high.
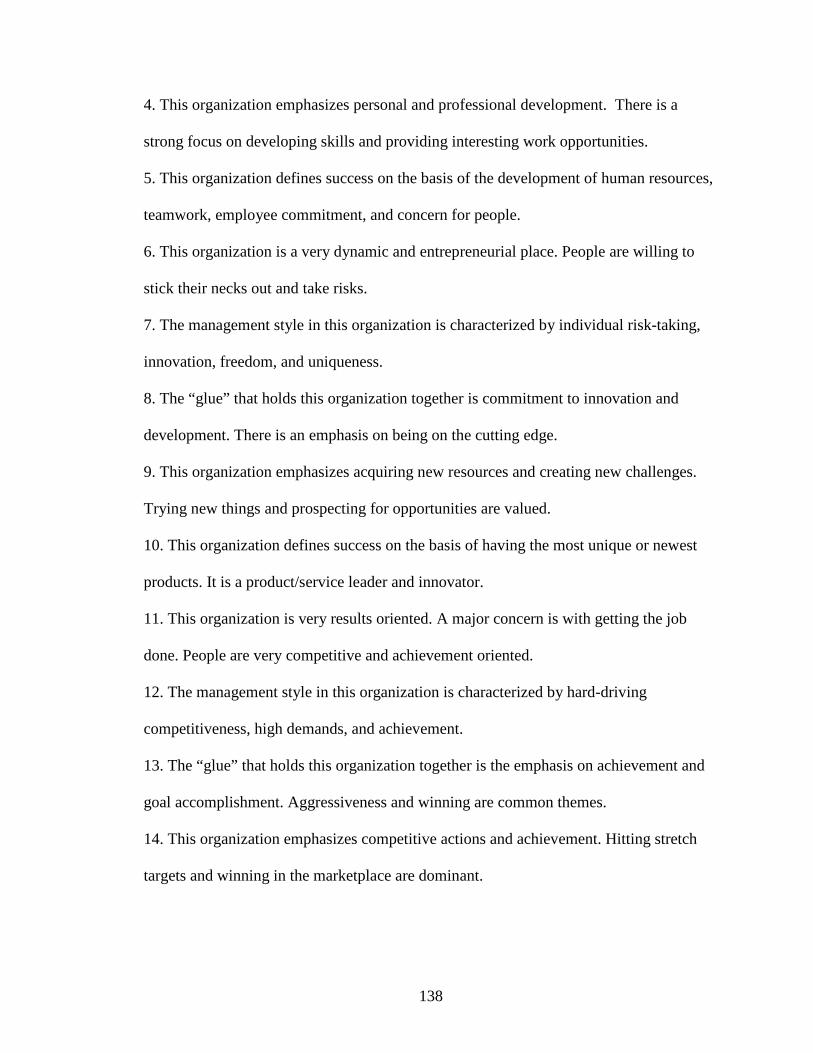
138
4. This organization emphasizes personal and professional development. There is a
strong focus on developing skills and providing interesting work opportunities.
5. This organization defines success on the basis of the development of human resources,
teamwork, employee commitment, and concern for people.
6. This organization is a very dynamic and entrepreneurial place. People are willing to
stick their necks out and take risks.
7. The management style in this organization is characterized by individual risk-taking,
innovation, freedom, and uniqueness.
8. The “glue” that holds this organization together is commitment to innovation and
development. There is an emphasis on being on the cutting edge.
9. This organization emphasizes acquiring new resources and creating new challenges.
Trying new things and prospecting for opportunities are valued.
10. This organization defines success on the basis of having the most unique or newest
products. It is a product/service leader and innovator.
11. This organization is very results oriented. A major concern is with getting the job
done. People are very competitive and achievement oriented.
12. The management style in this organization is characterized by hard-driving
competitiveness, high demands, and achievement.
13. The “glue” that holds this organization together is the emphasis on achievement and
goal accomplishment. Aggressiveness and winning are common themes.
14. This organization emphasizes competitive actions and achievement. Hitting stretch
targets and winning in the marketplace are dominant.

139
15. This organization defines success on the basis of winning in the marketplace and
outpacing the competition. Competitive market leadership is key.
16. This organization is a very controlled and structured place. Formal procedures
generally govern what people do.
17. The management style in this organization is characterized by security of
employment, conformity, predictability, and stability in relationships.
18. The “glue” that holds this organization together is formal rules and policies.
Maintaining a smooth-running organization is important.
19. This organization emphasizes permanence and stability. Efficiency, control and
smooth operations are important.
20. This organization defines success on the basis of efficiency. Dependable delivery,
smooth scheduling, and low-cost production are critical.
21. What was the level in your organization that you were thinking about when you
responded to the above statements?
a. Entire organization (e.g., company, agency).
b. Work unit
c. Department
d. Division
e. Directorate
f. Physical location (e.g., plant, office)
g. Work group
h. Other (please specify) _____________

140
Strength of Your Organization’s Culture
On each of the following dimensions listed under a, b, c & d, please rate the strength of
your organization’s culture on that dimension. Strength is defined in terms of the degree
to which people in your organization collectively recognize and share a common set of
values and beliefs about what is important and valued that are reinforced by through
formal and informal rewards and work practices.
Rating format: 1- extremely weak; 2 very weak; 3- weak. 4-moderate; 5-strong; 6- very
strong; 7 extremely strong.
a. Innovation and adaptability – emphasis on risk taking and being on the cutting edge.
b. Competitiveness and growth – emphasis on beating the competition and being number
one in what our organization does
c. Cooperativeness, cohesion and developing a strong team spirit – emphasis on
teamwork and participation and building employee commitment to the organization.
d. Efficiency and stability – emphasis on maintaining and smooth and efficient
operations and decision making by following detailed procedures, work methods and
organizational hierarchy.
P-O fit (adapted from Cable & Judge, 1996).
1. I feel that my values “match” or fit my organization and the current employees in the
organization?
2. My values match those of the current employees in this organization.

141
3. I think the values and “personality” of this organization reflect my own values and
personality.
Self-monitoring (Lennox & Wolfe, 1984)
Response scale: 1-7. 1-strongly disagree, 2-disagree, 3-somewhat disagree, 4-neither
agree, nor disagree, 5-somewhat agree, 6-agree, 7-strongly agree.
1) Ability to modify self-presentation
1. In social situations, I have the ability to alter my behavior if I feel that something else
is called for.
2.I have the ability to control the way I come across to people, depending on the
impression I wish to give them.
3.When I feel that the image I am portraying isn’t working, I can readily change it to
something that does.
4. I have trouble changing my behavior to suit different people and different situations.
5.I have found that I can adjust my behavior to meet the requirement of any situation I
find myself in.
6.Once I know what the situation calls for, it’s easy for me to regulate my actions
accordingly
2) Sensitivity to the expressive behavior of others
1. I am often able to read people’s true emotions correctly through their eyes.
2. In conversation, I am sensitive to even the slightest change in the facial expression of
the persons I’m conversing with.
3. My powers of intuition are quite good when it comes to understanding others’
emotions and motives.
142
4. I can usually tell when others consider a joke in bad taste, even though they may laugh
convincingly.
5. I can usually tell when I’ve said something inappropriate by reading the listener’s eyes.
6. If someone is lying to me, I usually know it at once from that person’s manner of
expression.
Excluded item
* Even when it might be to my advantage, I have difficulty hiding my true feelings.6
Roles
Please rate the extent to which your organization expects you to perform each role
activity by responding to the statements below. (Note: work roles are activities that are
not necessarily part of the job description but are expected by the organization).
Response scale: 1-definitely not expected as part of my work role, 2-only slightly
expected as part of my work role, 3-somewhat expected as part of my work role, 4-
moderately expected as part of my work role, 5-strongly expected as part my work role,
6- very strongly expected as part of my work role, 7-absolutely expected as part of my
work role.
1) Helping Role (adapted from Williams & Anderson, 1991).
1. Helping others who have been absent.
2. Helping others who have heavy workloads.
3. Assisting supervisor with your work (when not asked).
4. Taking time to listen to co-workers problems and worries. (Retained)
5. Going out of way to help new employees. (Retained)
6. Taking a personal interest in other employees. (Retained)
6 Item was excluded from the scale due to low factor loading.

143
7. Passing along information to co-workers.
2) Innovative Role (adapted from Morrison & Phelps, 1999; Scott & Bruce, 1994).
1. Generating creative ideas. (Retained)
2. Promoting and championing ideas to others. (Retained)
3. Being innovative. (Retained)
6. Adopting improved procedures for doing your job.
7. Changing the way that work is done in order to be more effective.
8. Instituting new work methods that are more effective for the company.
9. Bringing about improved methods and procedures for your/her work unit and
department.
10. Changing organizational rules and policies that are non-productive or
counterproductive.
11. Making constructive suggestions for improving how things operate within the
company.
12. Correcting faulty procedures and practices.
13. Eliminating redundant or unnecessary procedures.
14. Introducing new structures, technologies, or approaches to improve efficiency.
15. Suggesting or implementing solutions to pressuring organizational problems.
3) Achievement Role (new items)
1. Being aggressive and wanting to win at all costs.
2. Showing senior managers/executives that my ideas and work are better than that
of others in your organization.

144
3. Strongly advocating my points and perspectives in meetings and discussions.
(Retained)
4. Doing whatever it takes in order to achieve my performance goals and targets.
(Retained)
5. Doing whatever it takes to be successful.
6. Being an aggressive advocate for your/her interests and agendas. (Retained)
4) Compliant Role
1. Carefully following company rules and procedures.
2. Making sure that when I do m work I follow the informal rules for how “things
are done around here.
3. Doing my job in a way that emphasizes efficiency rather than creativity.
(Retained)
4. Going through the hierarchy of the organization searching for a solution rather
than using my own discretion.
5. Sticking with existing rules and procedures when doing my job rather than being
creative. (Retained)
6. Going about solving problems following existing procedures. (Retained)
7. Questioning existing rules and procedures, even if it means, “rocking the boat”.
8. Relying on the existing work processes and procedures when it comes to
completing my job responsibilities. (Retained)

145
Appendix B: Coworker Questionnaire
Please, provide the following information.
Background Information
The following information is being asked so that we can better understand the nature of
the survey responses in their entirety. This information is ONLY being used in an
aggregated form.
1. Do you currently work in the same organization as this person? (Circle one) No- (N)
(Y)-Yes
2. Do you currently work in the same department or unit as this person? (Circle one)
No- (N) (Y)-Yes
3. Do you currently work in the same work group or team as this person? (Circle one)
No- (N) (Y)-Yes
4. How long have you worked (did you work) with this person? 0 to 25, & >25 Years;
CQ4b_months- 0 to 12. Months
5. How well do you know this person’s work? 1-not at all; 2-not well; 3-somewhat; 4-
well; 5-very well.
6. Which statement best describes the nature of the reporting relationship that you have
with this person?
(Please circle one):
1) This person is a peer/coworker/colleague of mine.
2) This person is my primary/direct manager.
Role Behaviors

146
Please rate the extent to which your coworker engages in each of the following
behaviors:
This person is frequently:
1-8 (1= strongly disagree, 2=disagree, 3=somewhat disagree, 4=neither agree nor
disagree, 5=somewhat agree, 6=agree, 7=strongly agree; 8= don’t know/cannot
answer).
1. Helping others who have been absent.
2. Helping others who have heavy workloads.
3. Assisting his/her supervisor (even when not asked).
4. Taking time to listen to co-workers' problems and worries.
5. Going out of his/her way to help new employees.
6. Taking a personal interest in other employees.
7. Passing along information to co-workers.
8. Adopting improved procedures for doing his/her job.
9. Changing the way that work is done in order to be more effective.
10. Instituting new work methods that are more effective for the company.
11. Bringing about improved methods and procedures for my work unit and
department.
12. Changing organizational rules and policies that are non-productive or
counterproductive.
13. Making constructive suggestions for improving how things operate within the
company.
14. Correcting faulty procedures and practices.

147
15. Eliminating redundant or unnecessary procedures.
16. Suggesting or implementing solutions to pressuring organizational problems.
17. Introducing new structures, technologies, or approaches to improve efficiency.
18. Generating creative ideas.
19. Promoting and championing ideas to others.
20. Being innovative.
21. Being aggressive and showing that he/she wants to win at all costs.
22. Showing senior managers/executives that his/her ideas and work are better than
those being advocated by others.
23. Strongly advocating, championing and defending his/her points and perspectives in
meetings and discussions.
24. Doing whatever it takes in order to achieve his/her performance goals and targets.
25. Doing what it takes to be successful.
26. Being an aggressive advocate for his/her interests and agendas.
27. Carefully following company rules and procedures.
28. Making sure that he/she follows the informal rules for how “things are done around
here.”
29. Doing his/her job in way that emphasizes efficiency rather than creativity.
30. Going through the hierarchy of the organization searching for a solution rather than
using his own discretion.
31. Sticking with existing rules and procedures when doing his/her job rather than
being creative.
32. Going about solving problems following existing procedures.
148
33. Questioning existing rules and/or work procedures, even if it means “rocking the
boat.”
34. Relying on the existing work processes and procedures when it
comes to completing his/her job responsibilities.
Organizational Culture (adapted from Cameron & Quinn, 1999).
Rating format: (1= strongly disagree; 2= disagree; 3=somewhat disagree; 4= neither
agree nor disagree; 5=somewhat agree; 6=agree; 7=strongly agree).
Note: Throughout the survey you will see the term “organization.” When you see this
term, please think of the highest level (e.g., work unit, division, department, directorate)
within your overall organization that is most meaningful to you in terms of how you
experience your organization’s culture.
Please respond to the following statements in terms of the degree to which they
accurately reflect your organization’s culture, as it currently exists.
1. This organization is a very personal place. It is like an extended family. People seem
to feel comfortable sharing their personal situations with colleagues.
2. The management style in this organization is characterized by teamwork, consensus,
and participation.
3. The “glue” that holds this organization together is loyalty and mutual trust.
Commitment to this organization runs high.
4. This organization emphasizes personal and professional development. There is a
strong focus on developing skills and providing interesting work opportunities.

149
5. This organization defines success on the basis of the development of human resources,
teamwork, employee commitment, and concern for people.
6. This organization is a very dynamic and entrepreneurial place. People are willing to
stick their necks out and take risks.
7. The management style in this organization is characterized by individual risk-taking,
innovation, freedom, and uniqueness.
8. The “glue” that holds this organization together is commitment to innovation and
development. There is an emphasis on being on the cutting edge.
9. This organization emphasizes acquiring new resources and creating new challenges.
Trying new things and prospecting for opportunities are valued.
10. This organization defines success on the basis of having the most unique or newest
products. It is a product/service leader and innovator.
11. This organization is very results oriented. A major concern is with getting the job
done. People are very competitive and achievement oriented.
12. The management style in this organization is characterized by hard-driving
competitiveness, high demands, and achievement.
13. The “glue” that holds this organization together is the emphasis on achievement and
goal accomplishment. Aggressiveness and winning are common themes.
14. This organization emphasizes competitive actions and achievement. Hitting stretch
targets and winning in the marketplace are dominant.
15. This organization defines success on the basis of winning in the marketplace and
outpacing the competition. Competitive market leadership is key.
150
16. This organization is a very controlled and structured place. Formal procedures
generally govern what people do.
17. The management style in this organization is characterized by security of
employment, conformity, predictability, and stability in relationships.
18. The “glue” that holds this organization together is formal rules and policies.
Maintaining a smooth-running organization is important.
19. This organization emphasizes permanence and stability. Efficiency, control and
smooth operations are important.
20. This organization defines success on the basis of efficiency. Dependable delivery,
smooth scheduling, and low-cost production are critical.
21. What was the level in your organization that you were thinking about when you
responded to the above statements?
a. Entire organization (e.g., company, agency).
b. Work unit
c. Department
d. Division
e. Directorate
f. Physical location (e.g., plant, office)
g. Work group
h. Other (please specify) _____________
Strength of Your Organization’s Culture

151
On each of the following dimensions listed under a, b, c & d, please rate the strength of
your organization’s culture on that dimension. Strength is defined in terms of the degree
to which people in your organization collectively recognize and share a common set of
values and beliefs about what is important and valued that are reinforced by through
formal and informal rewards and work practices.
Rating format: 1- extremely weak; 2 very weak; 3- weak. 4-moderate; 5-strong; 6- very
strong; 7 extremely strong.
a. Innovation and adaptability – emphasis on risk taking and being on the cutting edge.
b. Competitiveness and growth – emphasis on beating the competition and being number
one in what our organization does
c. Cooperativeness, cohesion and developing a strong team spirit – emphasis on
teamwork and participation and building employee commitment to the organization.
d. Efficiency and stability – emphasis on maintaining and smooth and efficient
operations and decision making by following detailed procedures, work methods and
organizational hierarchy.

152
Appendix C: Supervisor Questionnaire
The following information is being asked so that we can better understand the nature of
the survey responses in their entirety. This information is ONLY being used in an
aggregated form.
1.Which statement best describes the nature of the reporting relationship that you have
with this person?
(Please circle one)
A- I am this person's primary direct supervisor/manager
B- I have more indirect supervisory/managerial responsibilities for this person
C- I share supervisory/managerial responsibilities for this person,
D- I have more of a peer/lateral reporting relationship with this person.
2. How long have you worked with this person in the capacity that you described in
above?
(Please indicate numerical value in the spaces provided): Years_____ Months ______
3. How familiar do you feel you are with this person's work behaviors as asked about in
this survey?
1-very unfamiliar, 2-unfamiliar, 3-somewhat familiar, 4-familiar, 5-very familiar
Role Behaviors
Please rate the extent to which your coworker engages in each of the following behaviors:
This person is frequently:
1-8 (1= strongly disagree, 2=disagree, 3=somewhat disagree, 4=neither agree nor
disagree, 5=somewhat agree, 6=agree, 7=strongly agree; 8= don’t know/cannot
answer).

153
1. Helping others who have been absent.
2. Helping others who have heavy workloads.
3. Assisting his/her supervisor (even when not asked).
4. Taking time to listen to co-workers' problems and worries.
5. Going out of his/her way to help new employees.
6. Taking a personal interest in other employees.
7. Passing along information to co-workers.
8. Adopting improved procedures for doing his/her job.
9. Changing the way that work is done in order to be more effective.
10. Instituting new work methods that are more effective for the company.
11. Bringing about improved methods and procedures for my work unit and
department.
12. Changing organizational rules and policies that are non-productive or
counterproductive.
13. Making constructive suggestions for improving how things operate within the
company.
14. Correcting faulty procedures and practices.
15. Eliminating redundant or unnecessary procedures.
16. Suggesting or implementing solutions to pressuring organizational problems.
17. Introducing new structures, technologies, or approaches to improve efficiency.
18. Generating creative ideas.
19. Promoting and championing ideas to others.
20. Being innovative.

154
21. Being aggressive and showing that he/she wants to win at all costs.
22. Showing senior managers/executives that his/her ideas and work are better than
those being advocated by others.
23. Strongly advocating, championing and defending his/her points and perspectives in
meetings and discussions.
24. Doing whatever it takes in order to achieve his/her performance goals and targets.
25. Doing what it takes to be successful.
26. Being an aggressive advocate for his/her interests and agendas.
27. Carefully following company rules and procedures.
28. Making sure that he/she follows the informal rules for how “things are done around
here.”
29. Doing his/her job in way that emphasizes efficiency rather than creativity.
30. Going through the hierarchy of the organization searching for a solution rather than
using his own discretion.
31. Sticking with existing rules and procedures when doing his/her job rather than
being creative.
32. Going about solving problems following existing procedures.
33. Questioning existing rules and/or work procedures, even if it means “rocking the
boat.”
34. Relying on the existing work processes and procedures when it comes to
completing his/her job responsibilities.

155
Bibliography
Abolafia, M. Y., & Kilduff, M. 1988. Enacting market crisis: The social construction of a
speculative bubble. Administrative Science Quarterly, 33: 177-193.
Aiken, L. S., & West, S. G. 1991. Multiple regression: Testing and interpreting
interactions. Thousand Oaks, CA: Sage.
Anderson, J. C. & Gerbing, D. W. 1988. Structural equation modeling in practice: A
review and recommended two-step approach. Psychological Bulletin, 103: 411-423.
Ashforth, B.E. 1985. Climate formation: Issues and extensions. Academy of Management
Review, 10: 837-847.
Ashforth, B.E. & Mael, F. 1989. Social identity theory and the organization. Academy of
Management Review, 14: 20-39.
Ball, G.A., Trevino, L.K., & Sims, H.P. 1994. Just and unjust punishment: Influences on
subordinate performance and citizenship. Academy of Management Journal, 37: 299-322.
Barnard, C. I. 1938. The Functions of the Executive. Harvard University Press:
Cambridge Massachusetts.
Bateman, T. S., & Organ, D. W. 1983. Job satisfaction and the good soldier: the
relationship between affect and “citizenship”. Academy of Management Journal, 26:
587-595.
Bentler, P.M. 1990. Comparative fit indexes in structural models. Psychological Bulletin,
107: 238-246.
Bentler, P.M., & Bonnett, D.G. 1980. Significance tests and goodness of fit in the
analysis of covariance structures. Psychological Bulletin, 88: 588-606.

156
Beyer, J.M. & Hannah, D.R. 2002. Building on the past: Enacting established personal
identities in a new work setting. Organization Science, 13: 636-652.
Biddle, B. 1979. Role theory: Expectations, identities, and behaviors. New York:
Academic Press.
Blau, P. 1964. Exchange and power in social life. New York: Wiley.
Bliese, P.D. 2000. Within-group agreement, non-independence, and reliability:
Implications for data aggregation and analysis. In K.J. Klein & S.W.J. Kozlowski (Eds.),
Multilevel theory research, and methods in organizations, pp. 349-381. San Francisco:
Jossey-Bass.
Borman, W.C., & Motowidlo, S.J. 1993. Expanding the criterion domain to include
elements of contextual performance. In N. Schmitt & W.Borman (Eds.), Personnel
selection in organizations: 71-98. New York: Jossey-Bass.
Bowen, D.E. & Ostroff, C. 2004. Understanding HRM-Firm performance linkages: The
role of “strength” of the HRM system. Academy of Management Review, 29: 203-221.
Byrne, B.M. (1994). Structural equation modeling with EQS and EQS/Windows.
Thousand Oaks, CA: Sage Publications
Byrne, J. A. 2002. At Enron, “The environment was ripe for abuse”. Accessed at
www.businessweek.com on 7/16/2002.
Cable, D.M., & Judge, T.A. 1996. Person-organization fit, job choice decisions, and
organizational entry. Organizational Behavior and Human Decision Processes, 67: 294-
311.
Cameron, K.S., & Quinn, R. E. 1999. Diagnosing and changing organizational culture.
Addison- Wesley: Massachusetts.

157
Cardy, R.L. & Dobbins, G.H. 1986. Affect and appraisal accuracy: Liking as an integral
dimension in evaluating performance. Journal of Applied Psychology, 71: 672-678.
Champoux, J. and Peters, W. 1987. Form, effect size, and power in moderated regression
analysis. Journal of Occupational Psychology, 60: 243-55.
Chaplin, W. F. 1991. The next generation of moderator research in personality
psychology. Journal of Personality, 59: 143-78.
Chatman, J. 1989. Improving interactional organizational research: A model of person-
organization fit. Academy of Management Review, 14: 333-349.
Chatman, J. 1991. Matching people and organizations: Selection and socialization in
public accounting firms. Administrative Science Quarterly, 36: 459-484.
Chatman, J.A., & Barsade, S.G. 1995. Personality, organizational culture, and
cooperation: Evidence from a business simulation. Administrative Science Quarterly, 40:
423-443.
Chatman, J.A., Polzer, J.T., Barsade, S.G., Neale, M.A. 1998. Being different yet feeling
similar: The influence of demographic composition and organizational culture on work
processes and outcomes. Administrative Science Quarterly, 43: 749-780.
Chan, D. 1998. Functional relations among constructs in the same content domain at
different levels of analysis: A typology of composition models. Journal of Applied
Psychology, 83: 234-246.
Chen, G. 2005. Newcomer adaptation in teams: Multilevel antecedents and outcomes.
Academy of Management Journal, 48: 101-116.

158
Chen, G., & Tjosvold, D. 2002. Cooperative goals and constructive controversy for
promoting innovation in student groups in China. Journal of Education for Business, 78:
46-50.
Coates, C.H., & Pellegrin, R.J. 1957. Executives and supervisors: Informal factors n
differential bureaucratic promotion. Administrative Science Quarterly, 2 : 200-215.
Coff, R.W. 1997. Human assets and management dilemmas: Coping with hazards on the
road to resource-based theory. Academy of Management Review, 22: 374-402.
Cohen, P., Cohen, J., West, S., & Aiken, L. 2002. Applied multiple regression/correlation
analysis for the behavioral sciences. Lawrence Erlbaum Associates Publishers
: Mahwah, NJ.
Cooke, R.A. & Lafferty, J.C. (1986). Level V: Organizational Culture Inventory-form III.
Plymouth, MI: Human Synergistics.
Cooke, R.A., & Rousseau, D.M. 1988. Behavioral norms and expectations: A
quantitative approach to the assessment of organizational culture. Group and
Organization Studies, 13: 245-273.
Cooke, R.A. & Szumal, J.L. 2000. Using the organizational culture inventory to
understand the operating cultures of organization. In N.M. Ashkanasy, C.P.M. Wilderom,
M. F. (Eds.), Handbook of Organizational Culture and Climate: 147-162. Peterson.
Thousand Oaks: Sage.
Dansereau, F. Jr., Graen, G., & Haga, W.J. 1975. A vertical dyad linkage approach to
leadership within formal organizations: A longitudinal investigation of the role-making
process. Organizational Behavior and Human Performance, 13: 46-78.
Deal, T.E. & Kennedy, A.A. 1988. Corporate culture. Harmondsworth: Penguin.

159
De Dreu, C. K. & Van Lange, P.A. 1995. The impact of social value orientations on
negotiator cognition and behavior. Personality and Social Psychology Bulletin, 21: 1178-
1188.
De Dreu, C.K., Weingart, L.R. & Kwon, S. 2000. Influence of social motives on
integrative negotiation: A meta-analytic review and test of two theories. Journal of
Personality and Social Psychology, 78: 889-905.
Denison, D. R. 1996. What is the difference between organizational culture and
organizational climate? A native’s point of view on a decade of paradigm wars. Academy
of Management Review, 21: 619-654.
Denison, D.R., & Mishra, A.K. 1995. Toward a theory of organizational culture and
effectiveness. Organization Science, 6: 204-223.
Deutsch, M. 1949. A theory of cooperation and competition. Human Relations, 2:129-
152.
Deutsch, M. 1973. The resolution of conflict: Constructive and destructive processes.
New Haven: Yale University Press.
Deutsch, M. 2001. Cooperation and conflict resolution: Implications for consulting
psychology. Consulting Psychology Journal: Practice and Research, 53: 76-81.
Earley, P.C. 1993. East meets west meets mideast: Further elaborations of collectivistic
and individualistic work groups. Academy of Management Journal, 36: 319-348.
Eisenberger, R., Armeli, S., Rexwinkel, B., Lynch, P.D., & Rhoades, L. 2001.
Reciprocation of perceived organizational support. Journal of Applied Psychology, 86:
42-51.

160
Eisenhardt, K.M. 1989. Agency theory: An assessment and review. Academy of
Management Review, 14: 57-74.
Ekehammar, B. 1974. Interactionism in personality from a historical perspective.
Psychological Bulletin, 81: 1026-1048.
Enz, C. 1988. The role of value congruity in intraorganizational power. Administrative
Science Quarterly, 33: 284-304.
Farh, J., Zhong, C., & Organ, D.W. 2004. Organizational citizenship behavior in the
people’s republic of China. Organization Science, 15: 241-253.
Feldman, J.M. 1981. Beyond attribution theory: Cognitive processes in performance
appraisal. Journal of Applied Psychology, 66: 127-148.
Festinger, L. 1954. A theory of social comparison processes. Human Relations, 7: 117-
140.
Fisher, C.D. 1986. Organizational socialization: An integrative review. In G.R. Ferris &
K.M. Rowland (Eds.), Research in personnel and human resources management, Vol. 4,
143-165. Greenwich, CT: JAI Press.
Fiske, S. & Taylor, E. 1991. Social cognition. New York: McGraw-Hill.
Flynn, F.J., Chatman, J.A., & Spataro, S.E. 2001. Getting to know you: The influence of
personality on impressions and performance of demographically different people in
organizations. Administrative Science Quarterly, 46: 414-442.
Ford, C.M. 1996. A theory of individual creative action in multiple social domains.
Academy of Management Review, 21: 1112-1142.
Freeman, L.C., Romney, A.K., Freeman, S.C. 1987. Cognitive structure and informant
accuracy. American Anthropologist, 89: 310-325.

161
Frese, M. & Fay, D. 2001. Personal initiative: An active performance concept for work in
the 21st century. Research in Organizational Behavior. Vol. 23: 133-187.
Frese, M. Kring, W., Soose, A., & Zempel, J. 1996. Personal initiative at work:
Differences between East and West Germany. Academy of Management Journal: 39: 37-
63.
Gangestad, S.W. & Snyder, M. 2000. Self-monitoring: Appraisal and reappraisal.
Psychological Bulletin, 126: 530-555.
Gavin, J.F. & Howe, J.G. 1975. Psychological climate: Some theoretical and empirical
considerations. Behavioral Science, 20: 228-240.
Geertz, C. 1973. The interpretation of cultures. New York: Basic Books.
Gelfand, M.J., Nishii, L.H., Holcombe, K.M., Dyer, N., Ohbuchi, K. & Fukuno, M. 2001.
Cultural influences on cognitive representations of conflict: Interpretations of conflict
episodes in the United States and Japan. Journal of Applied Psychology, 86: 1059-1074.
George, J.M. 1991. State or trait: Effects of positive mood on prosocial behaviors at
work. Journal of Applied Psychology, 76: 299-307.
George, J. M. & Brief, A. P. 1992. Feeling good, doing good: A conceptual analysis of
the mood at work-organizational spontaneity relationship. Psychological Bulletin, 112:
310-329.
Glick, W. H. 1985. Conceptualizing and measuring organizational and psychological
climate: Pitfalls in multilevel research. Academy of Management Review, 10: 601-616.
Gioia, D.A. & Sims, H.P., Jr. 1986. Introduction: Social cognition in organizations. In
H.P. Sims, Jr., D.A. Gioia, and Associates, The thinking organization: 1-19. San
Francisco: Jossey-Bass.

162
Gnyawali, D. & Madhavan, R. 2001. Cooperative networks and competitive dynamics: A
structural embeddedness perspective. Academy of Management Review, 26: 431-445.
Goleman, D. 1998. Working with Emotional Intelligence. New York: Bantam Books.
Gonzales-Roma, V., Peiro, J.M., & Tordera, N. 2002. An examination of the antecedents
and moderator influences of climate strength. Journal of Applied Psychology, 87 (3):
465-473.
Graen, G. 1976. Role-making processes within complex organizations. In M. D. Dunnette
(Ed.), Handbook of Industrial and Organizational Psychology: 1201-1245. Chicago:
Rand McNally College Publishing Company.
Gully, S.M., Inalcaterra, K.A., Joshi, A. & Beaubien, J.M. 2002. A meta-analysis of
team-efficacy, potency, and performance: Independence and level of analysis as
moderators of observed relationships. Journal of Applied Psychology, 87: 819-832.
Hackman, J.R. 1992. Group influences on individuals in organizations. In M.D. Dunnette
& L.M. Hough (Eds.), Handbook of industrial and organizational psychology, 2nd ed., pp.
199-267. Palo Alto, CA: Consulting Psychological Press.
Hambrick, D.C., Cho, T.S., Chen, M. 1996. The influence of top management team
heterogeneity on firms' competitive moves. Administrative Science Quarterly, 41: 659-
684.
Harris, M.M. & Schaubroeck, J. 1988. A meta-analysis of self-supervisor, self-peer, and
peer-supervisor ratings. Personnel Psychology, 41: 43-62.
Hatch, M.J. 1993. The dynamics of organizational culture. Academy of Management
Review, 18: 657-693.
163
Harrison, D.A. & Klein, K. J. 2005. What’s the difference: diversity constructs as
separation, variety, or disparity in organizations. Unpublished working paper.
Haveman, H.A. & Nonnemaker, L. 2000. Competition in multiple geographic markets:
The impact on growth and market entry. Administrative Science Quarterly, 45: 232-267.
Hofmann, D.A., Morgeson, F.P., & Gerras, S.J. 2003. Climate as a moderator of the
relationship between leader-member exchange and content specific citizenship: Safety
climate as an exemplar. Journal of Applied Psychology, 88(1): 170-178.
Ilgen & Hollenbeck, J. 1991. The structure of work: job design and roles. In M. Dunnette
& L. Hough (Eds.), Handbook of industrial and organizational psychology, Volume II,
pp. 165-207. Palo Alto, CA: Consulting Psychological Press.
Irving, P.G., Coleman, D.F., & Cooper, C.L. 1997. Further assessments of a three-
component model of occupational commitment: Generalizability and differences across
occupations. Journal of Applied Psychology, 82: 444-452.
James, L. R. 1982. Aggregation bias in estimates of perceptual agreement. Journal of
Applied Psychology, 67: 219-229.
James, L. R., Demaree, R. G., & Wolf, G. 1993. Rwg: An assessment of within-group
agreement. Journal of Applied Psychology, 78: 306-309.
James, L. R., Demaree, R. G., & Wolf, G. 1984. Estimating within-group interrater
reliability with and without response bias. Journal of Applied Psychology, 69: 85-98.
Janis, I.L. 1972. Victims of groupthink: A psychological study of foreign-policy decisions
and fiascoes. Boston: Houghton Mifflin.
Janis, I.L. (1982). Groupthink (2nd ed.). Boston: Houghton Mufflin.
Jaques, E. (1951). The changing culture of a factory. London: Tavistock.
164
Jawahar, I. M. 2001. Attitudes, self-monitoring, and appraisal behaviors. Journal of
Applied Psychology, 86: 875-883.
Johnson, J. 2001. The relative importance of task and contextual performance domains to
supervisor judgments of overall performance. Journal of Applied Psychology, 86: 984-
996.
Jones, A.P. & James, L. P. 1979. Psychological climate: Dimensions and relationships of
individual and aggregated work environment perceptions. Organizational Behavior and
Human Performance, 23: 201-250.
Judge, T. A. & Cable, D.M. 1997. Applicant personality, organizational culture, and
organization attraction. Personnel Psychology, 50: 359-394.
Katz, D. 1964. The motivational basis of organizational behavior. Behavioral Science,
9: 131-146.
Katz, D., & Kahn, R.L. 1978. The social psychology of organizations (2nd edition). New
York: John Wiley & Sons.
Kidder, D. L. & McLean Parks, J. 2001. The good soldier: who is s(he)? Journal of
Organizational Behavior, 22: 939-959.
Kiker, D.S. & Motowidlo, S.J. 1999. Main and interaction effects of task and contextual
performance on supervisory reward decisions. Journal of Applied Psychology, 84: 602-
609.
Klein, A.S., Masi, R.J., Weidner, C.K. 1995. Organization culture, distribution and
amount of control, and perceptions of quality: An empirical study of linkages. Group and
Organization Management, 20: 122-148.

165
Klein, K.J., Conn, A.B., Smith, D.B., & Sorra, J.S. 2001. Is everyone in agreement? An
exploration of within-group agreement in employee perceptions of the work environment.
Journal of Applied Psychology, 86: 3-16.
Konovsky, M.A. & Pugh, S.D. 1994. Citizenship behavior and social exchange. Academy
of Management Journal, 37: 656-669.
Kotter, J.P. & Heskett, J.L. 1992. Corporate culture and performance. New York: Free
Press.
Kozlowski, S.W. & Kirsch, M.P. 1987. The systematic distortion hypothesis, halo, and
accuracy: an individual level analysis. Journal of Applied Psychology, 72: 252-261.
Kristof, A. 1996. Person-organization fit: An integrative review of its conceptualizations,
measurement, and implications. Personnel Psychology, 49:1-49.
Kristof-Brown, A. L. & Stevens, C. K. 2001. Goal congruence in project teams: Does the
fit between members’ personal mastery and performance goals matter. Journal of Applied
Psychology, 86: 1083-1095.
Lam, S.S.K., Hui, C. & Law, K.S. 1999. Organizational citizenship behavior: Comparing
perspectives of supervisors and subordinates across four international samples. Journal of
Applied Psychology, 84: 594-601.
Lawler, E.E. 1992. The ultimate advantage: Creating the high involvement organization.
San Francisco, CA: Jossey-Bass.
Lawrence, P.R. & Lorsch, J.W. 1967. Organization and Environment. Boston: Harvard
Business School.
Leavitt, H.J. 2003. Why hierarchies thrive. Harvard Business Review, March: 96-102.

166
Lengnick-Hall, M.L. & Lengnick-Hall, C.A. 2003. HR’s role in building relationship
networks. Academy of Management Executive, 17: 53-63.
Lefkowitz, J. 2000. The role of interpersonal affective regard in supervisory performance
ratings: A literature review and proposed causal model. Journal of Occupational and
Organizational Psychology, 73: 67-85.
Lennox, R.D., & Wolfe, R.N. 1984. Revision of the self-monitoring scale. Journal of
Personality and Social Psychology, 46: 1349-1364.
LePine, J. A., A. Erez, & Johnson, D. E. 2002. The nature and dimensionality of
organizational citizenship behavior: A critical review and meta-analysis. Journal of
Applied Psychology, 87: 52-65.
Liden, R.C., Wayne, S.J. & Sparrowe, R.T. 2000. An examination of the mediating role
of psychological empowerement on the relations between the job, interpersonal
relationships, and work outcomes. Journal of Applied Psychology, 85: 407-416.
Longenecker, C.O. Sims, H.P. Jr., & Gioia, D.A. 1987. Behind the mask: The poliics of
employee appraisal. Academy of Management Executive, 1: 183-193.
Lord, R.G., & Foti, R.J. 1986. Schema theories, information processing, and
organizational behavior. In Sims, H.P., Gioia, D.A. and associates (Eds.), The thinking
organization. San Francisco: Jossey-Bass.
Louis, M.R. 1980. Surprise and sense Making: What newcomers experience in entering
unfamiliar organizational settings. Administrative Science Quarterly, 25: 226-251.
MacKenzie, S., Podsakoff, P., & Fetter, R. 1991. Organizational citizenship behavior and
objective productivity as determinants of managerial evaluations of salesperson’s
performance. Organizational Behavior and Human Decision Processes, 50: 123-150.

167
Markus, H.R. & Kitayama, S. 1991. Culture and the self: Implications for cognition,
emotion, and motivation. Psychological Review, 98: 224-253.
Martin, J. 1992. Cultures in organizations: Three perspectives. New York: Oxford
University Press.
Martin, J. & Siehl, C. (1983). Organizational culture and counterculture: An uneasy
symbiosis. Organizational Dynamics, 12 (Autumn): 52-64.
Masterson, S.S., Lewis, K., Goldman, B.M., & Taylor, M.S. 2000. Integrating justice and
social exchange: The differing effects of fair procedures and treatment on work
relationships. Academy of Management Journal, 43: 738-748.
McClintock, C. & Liebrand, W.B. 1988. Role of interdependence structure, individual
value orientation, and another’s strategy in decision-making: A transformational analysis.
Journal of Personality and Social Psychology, 55: 396-409.
Mehra, A., Kilduff, M., Brass, D.J. 2001. The social networks of high and low self-
monitors: Implications for workplace performance. Administrative Science Quarterly,
46:121-146.
Milkovich, G.M. & Boudreau, J.W. 1997. Human resource management (8th edition).
Chicago: Irwin.
Mischel, W. 1976. Towards a cognitive social model learning reconceptualization of
personality. In N.S. Endler & D. Magnusson (Eds.), Interactional Psychology and
Personality, pp. 166-207. New York: Wiley.
Morrison, E. 1994. Role definitions and organizational citizenship behavior: The
importance of the employee’s perspective. Academy of Management Journal, 37: 1543-
1557.

168
Morrison, E.W. & Phelps, C.C. 1999. Taking charge at work: Extrarole efforts to initiate
workplace change. Academy of Management Journal, 42: 403-419.
Motowidlo, S.J. & Van Scotter, J.R. 1994. Evidence that task performance should be
distinguished from contextual performance. Journal of Applied Psychology, 79: 475-480.
Murphy, K.R. & Balzer, W.K. 1986. Systematic distortions in memory-based behavior
ratings and performance evaluations. Journal of Applied Psychology, 71: 39-44.
Murphy, K.R. & Cleveland, J.N. 1990. Performance appraisal: An organizational
perspective. Allyn and Bacon: Boston, MA.
Niehoff, B.P. & Moorman, R.H. 1993. Justice as a mediator of the relationship between
methods of monitoring and organizational citizenship behavior. Academy of
Management Journal, 36: 527-556.
Oldham, G.R.& Cummings, E. 1996. Employee creativity: Personal and contextual
factors at work. Academy of Management Journal, 39: 607-634.
O’Reilly III, C.A., Chatman, J., & Caldwell, D. F. 1991. People and organizational
culture: a profile comparison approach to assessing person-organization fit. Academy of
Management Journal, 34: 487-516.
Organ, D. W. 1988. Organizational Citizenship Behavior: The good soldier syndrome.
Lexington, MA: Lexington Books.
Organ, D.W. 1997. Organizational citizenship behavior: It’s construct clean-up time.
Human Performance, 10: 85-97.
Organ, D.W., & Ryan, K. 1995. A meta-analytic review of attitudinal and dispositional
predictors of organizational citizenship behavior. Personnel Psychology, 48: 775- 802.

169
Ouchi, W.G. 1979. A conceptual framework for the design of organizational control
mechanisms. Management Science, 25: 833-848.
Ouchi, W.G. 1981. Theory Z. Reading, MA: Addison-Wesley.
Park. O.S., Sims, H.P. Jr., Motowidlo, S.J. 1986. Affect in organizations: How feelings
and emotions influence managerial judgement. In H.P. Sims, Jr., D.A. Gioia, and
Associates, The thinking organization: 215-237. San Francisco: Jossey-Bass.
Parker, M. 2001. Organizational culture and identity. Thousand Oaks, CA: Sage
Publications.
Parker, S. K. 1998. Enhancing role breadth self-efficacy: The roles of job enrichment and
other organizational interventions. Journal of Applied Psychology, 83: 835-852.
Parker, S. K. 2000. From passive to proactive motivation: The importance of flexible role
orientations and role breadth self-efficacy. Applied Psychology: An International Review,
49: 447-469.
Parker, C. P., Baltes, B. B., Young, S. A., Huff, J. W., Altmann, R. A., Lacost, H. A.,
Roberts, J. E. 2003. Relationships between psychological climate perceptions and work
outcomes: A meta-analytic review. Journal of Organizational Behavior, 24: 389-416.
Payne, R. L. 1996. The characteristics of organizations. In P.B. Warr (Ed.), Psychology at
Work (4th ed.). Harmondsworth: Penguin.
Peterson, M.F. & Smith, P.B. 2000. Sources of meaning, organizations, and culture:
Making sense of organizational events. In N.M. Ashkanasy, C.P.M. Wilderom, M. F.
Peterson (Eds.), Handbook of Organizational Culture and Climate: 101-115. Thousand
Oaks: Sage.

170
Podsakoff, P., Ahearne, M. & MacKenzie, S. 1997. Organizational citizenship behavior
and the quantity and quality of work group performance. Journal of Applied Psychology,
82: 262-270.
Podsakoff, P. & MacKenzie, S. 1997. Impact of Organizational citizenship behavior on
organizational performance: a review and suggestions for future research. Human
Performance, 10: 133-151.
Podsakoff, P.M., MacKenzie, S.B., Moorman, R.H. & Fetter, R. 1990. Transformational
leader behaviors and their effects on followers’ trust in their leader, satisfaction, and
organizational citizenship behaviors. Leadership Quarterly,1: 107-142.
Podsakoff, P.M., MacKenzie, S.B., Paine, J.B., & Bachrach, D.G. 2000. Organizational
citizenship behaviors: A critical review of the literature and suggestions for future
research. Journal of Management, 3: 513-563.
Pollack, D.J. & Pollack, L.J. 1996. Using 360-degree feedback in performance appraisal.
Public Personnel Management, 25: 507-528.
Quinn, R.E. & Rohrbaugh, J. 1983. A spatial model of effectiveness criteria: Towards a
competing values approach to organizational analysis. Management Science, 3: 363-377.
Rentsch, J.R. 1990. Climate and culture: Interaction and qualitative differences in
organizational meanings. Journal of Applied Psychology, 75: 668-681.
Rhoades, L., & Eisenberger, R. 2002. Perceived organizational support: A review of the
literature. Journal of Applied Psychology, 87: 698-714.
Rousseau, D. 1990. Quantitative assessment of organizational culture: the case for
multiple measures. In B. Schneider (Ed.), Frontiers in industrial and organizational
psychology, vol.3: 153-192. San Francisco: Jossey-Bass.

171
Saks, A. 1997. A longitudinal investigation of the relationships between job information
sources, applicant perceptions of fit, and work outcomes. Personnel Psychology, 50: 395-
425.
Salancik, G. & Pfeffer, J. 1978. A social information processing approach to job attitudes
and task design. Administrative Science Quarterly, 23: 224-253.
Schein, E. 1978. Career dynamics: Matching individual and organizational needs.
Readin, MA: Addison-Wesley.
Schein, E. 1984. Coming to a new awareness of organizational culture. Sloan
Management Review, Winter: 3-14.
Schein, E. 1985. Organizational culture and leadership: A dynamic perspective. San
Francisco: Jossey-Bass.
Schein, E. 1990. Organizational culture. American Psychologist, 45: 109-119.
Schneider, B., Salvaggio, A.N., & Subiratis, M. 2002. Climate strength: a new direction
for climate research. Journal of Applied Psychology, 87(2): 220-229.
Scott, S.G. & Bruce, R.A. 1994. Determinants of innovative behavior: A path model of
individual innovation in the workplace. Academy of Management Journal, 37: 580-607.
Settoon, R. P., Bennett, N., & Liden, R. C. 1996. Social exchange in organizations.
Journal of Applied Psychology, 81: 219-227.
Smith, C. A., Organ, D.W., & Near, J.P. 1983. Organizational citizenship behavior: Its
nature and antecedents. Journal of Applied Psychology, 68: 653-663.
Snyder, M. 1974. Self-monitoring of expressive behavior. Journal of Personality and
Social Psychology, 30, 526-537.

172
Snyder, M. 1986. On the nature of self-monitoring: matters of assessment, matters of
validity. Journal of Personality and Social Psychology, 51, 125-139.
Snyder, M. 1987. Public appearances, private realities. New York: W. H. Freeman.
Strauss, A.L., & Corbin, J. 1990. Basics of qualitative research: Grounded theory
procedures and techniques. Sage Publications: Newbury Park.
Stryker, S. 2002. Traditional symbolic interactionism, role theory, and structural
symbolic interactionism. In J.H. Turner (Ed.), Handbook of Sociological Theory: 211-
231. New York: Kluwer Academic/Plenum Publishers.
Swartz, M. & Jordon, D. 1980. Culture: An anthropological perspective. New York: John
Wiley.
Tepper, B.J., Lockhart, D., & Hoobler, J. 2001. Justice, citizenship, and role definition
effects. Journal of Applied Psychology, 86: 789-796.
Tesluk, P.E., Farr, J.L., Klein, S.R. 1997. Influences of organizational culture and climate
on individual creativity. Journal of Creative Behavior, 31: 27-41.
Tesluk, P., Hofmann, D. & Quigley, N. 2002. Integrating the linkages between
organizational culture and individual outcomes at work. In S. Sonnentag (Ed.)
Psychological Management of Individual Performance: 442-469. John Wiley & Sons.
Thompson, M. & Wildavsky, A. 1986. A cultural theory of information bias in
organizations. Journal of Management Studies, 23: 273-286.
Tierney, P. & Farmer, S. M. 2002. Creative self-efficacy: its potential antecedents and
relationship to creative performance. Academy of Management Journal, 45: 1137-1148.
Tornow, W.W. 1993. Perceptions or reality: Is multi-perspective measurement a means to
an end. Human Resource Management, 32: 221-229.

173
Trafimow, D., Triandis, H.C., & Goto, S.G. 1991. Some tests of the distinction between
the private self and the collective self. Journal of Personality and Social Psychology, 60:
649-655.
Triandis, H.C. 1989. The self and social behavior in differing cultural contexts.
Psychological Review, 96: 506-520.
Turner, J.C. 1981. The experimental social psychology of intergroup behavior. In J.C.
Turner & H. Giles (Eds.), Intergroup behavior: 66-101. Chicago: University of Chicago
Press.
Turner, R.H. 2002. Role theory. In J.H. Turner (Ed.), Handbook of Sociological Theory:
233-253. New York: Kluwer Academic/Plenum Publishers.
Turnley, W. & Bolino, M. 2001. Achieving desired images while avoiding undesired
images: exploring the role of self-monitoring in impression management. Journal of
Applied Psychology, 86: 351-360.
Van Dyne, L., Cummings, L. L., & Parks, J. M. 1995. Extra-role behaviors: In pursuit of
constructs and definitional clarity (a bridge over muddied waters). Research in
Organizational Behavior, Vol. 17: 215-185.
Van Dyne, L., Graham, J. W. & Dienesch, R. M. 1994. Organizational citizenship
behavior: construct redefinition, measurement, and validation. Academy of Management
Journal, 37: 765-802.
Van Dyne, L & LePine, J. (1998). Helping and extra-role behaviors: Evidence of
construct and predictive validity. Academy of Management Journal, 41: 108-119
Van Scotter, J. and Motowidlo, S. 1996. Interpersonal facilitation and job dedication as
separate facets of contextual performance. Journal of Applied Psychology, 81: 525-531.

174
Van Vianen, A.E.M. 2000. Person-organization fit: The match between newcomers’ and
recruiters’ preferences for organizational cultures. Personnel Psychology, 53: 113-149.
Visser, P.S., Krosnick, J.A., & Lavrakas, P.J. 2000. Survey research. In H.R. Reis &
C.M. Judd (Eds.), Handbook of research methods in social and personality psychology:
223-252. United Kingdom: Cambridge University Press.
Watkins, S. 2003. Former Enron vice president Sherron Watkins on the Enron collapse
Academy of Management Executive, 17: 119-125.
Wayne, S. J., Shore, L. M. & Liden, R. C. 1997. Perceived organizational support and
leader-member exchange: a social exchange perspective. Academy of Management
Journal, 40: 82-111.
Weick, K. 1981. Enactment and organizing. In O. Grusky & G. A. Miller (Eds.), The
sociology of organizations (2nd edition): 265-279. New York: The Free Press.
Weick, K.E. 1993. The collapse of sensemaking in organizations: The Mann Gulch
disaster. Administrative Science Quarterly, 38: 628-652.
Weick, K. 1995. Sensemaking in organizations. Sage Publications: Thousand Oaks.
West, S.G., Biesanz, J., & Pitts, S.C. 2000. Causal inference and generalization in field
settings: Experimental and quasi-experimental designs. In H.R. Reis & C.M. Judd (Eds.),
Handbook of research methods in social and personality psychology: 40-84. United
Kingdom: Cambridge University Press.
Welbourne, T.M., Johnson, D.E., and Erez, A. (1998). The role-based performance scale:
Validity analysis of a theory-based measure. Academy of Management Journal, 41: 540-
555.

175
Wiggins, J.S. 1991. Agency and communion as conceptual coordinates for the
understanding and measurement of interpersonal behavior. In W.M. Grove and D.
Cicchetti (Eds.), Thinking Clearly About Psychology: 89-113. Minneapolis: University of
Minnesota Press.
Williams, L.K. & Anderson, S.E. 1991. Job satisfaction and organizational commitment
as predictors of organizational citizenship and in-role behaviors. Journal of Management,
17: 601-617.
Woodman, R.W. Saywer, J. E. & Griffin, R. W. 1993. Toward a theory of organizational
creativity. Academy of Management Review, 18: 293-321.
Zammuto, R.E., Gifford, B., & Goodman, E.A. 2000. Managerial ideologies,
organization culture, and the outcomes of innovation: A competing values perspective. In
N.M. Ashkanasy, C.P.M. Wilderom, M. F. Peterson (Eds.), Handbook of Organizational
Culture and Climate: 261-278. Thousand Oaks: Sage.
Zellars, K.J. & Tepper, B.J. 2003. Beyond social exchange: New directions for
organizational citizenship behavior theory and research. Research in Personnel and
Human Resources Management, Vol. 22: 395-424.